
Association between Dietary and Supplemental Antioxidants Intake and Lung Cancer Risk: Evidence from a Cancer Screening Trial

Abstract
:1. Introduction
2. Materials and Methods
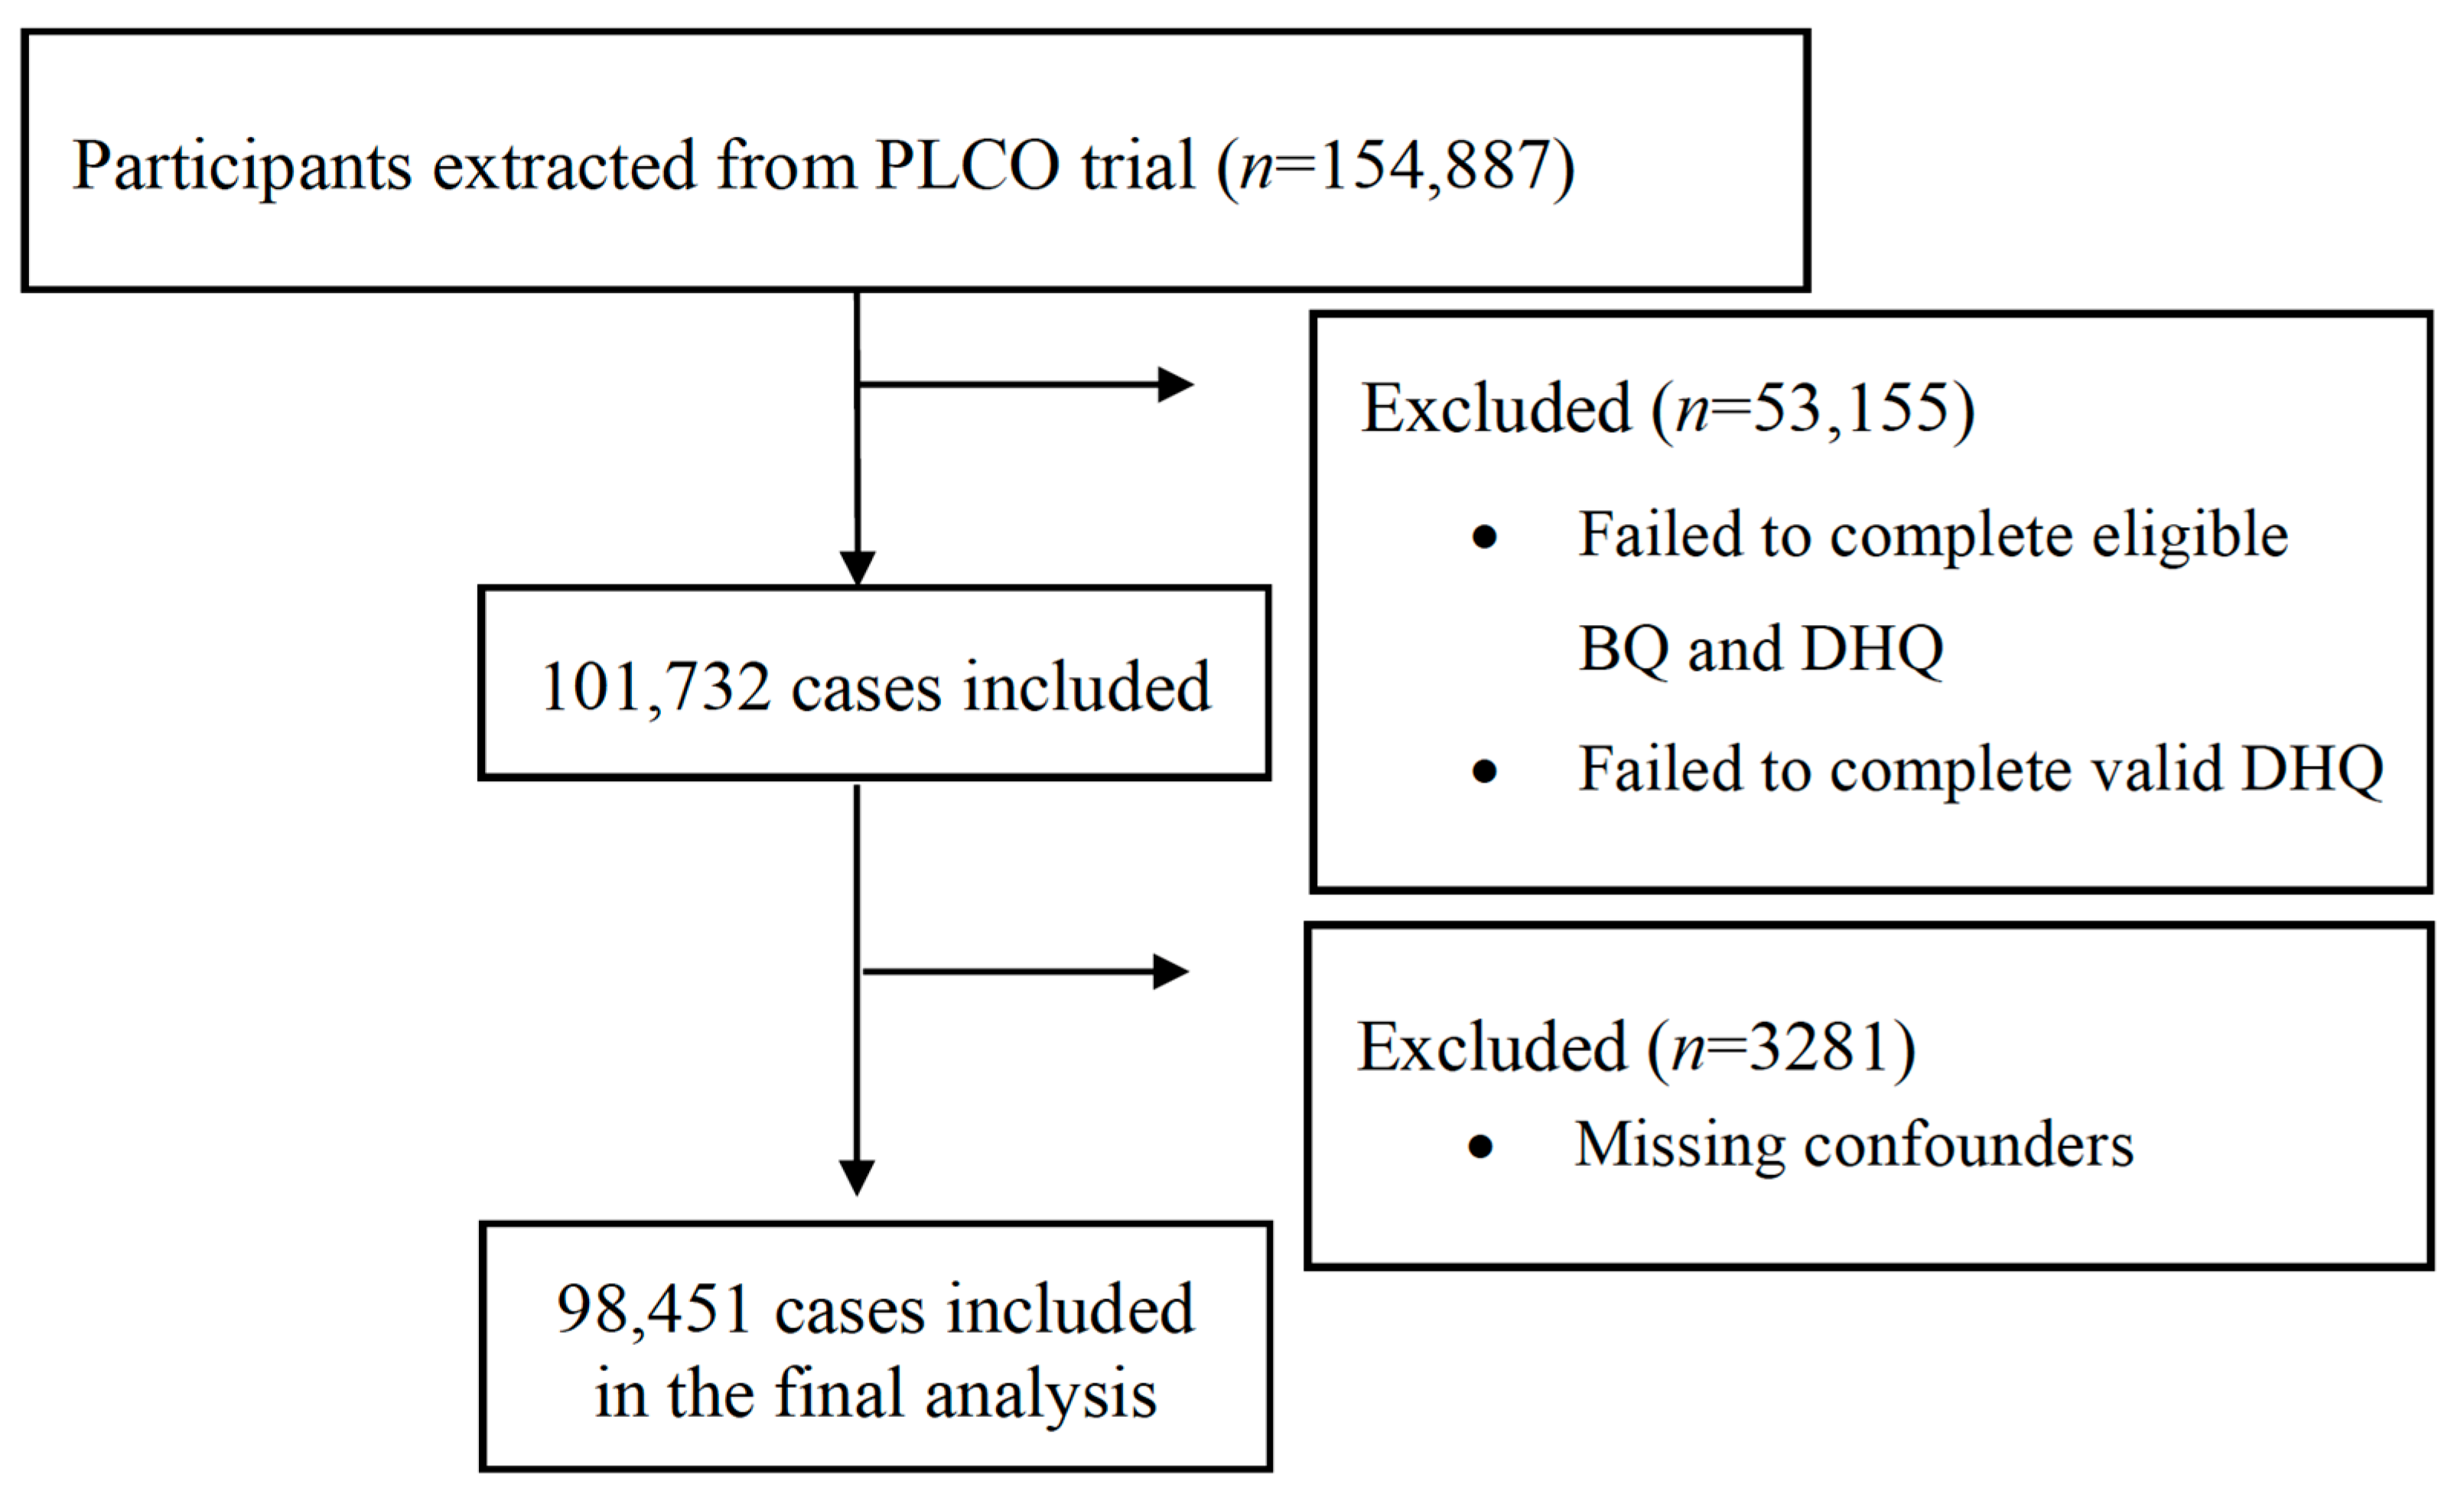
2.1. Study Population and Study Design
2.2. Data Collection
2.3. fCDAI Score Calculation
2.4. Ascertment of Lung Cancer Cases
2.5. Statistical Analysis
3. Results
3.1. Baseline Characteristics
3.2. Association between Individual Antioxidants and Risk of Lung Cancer
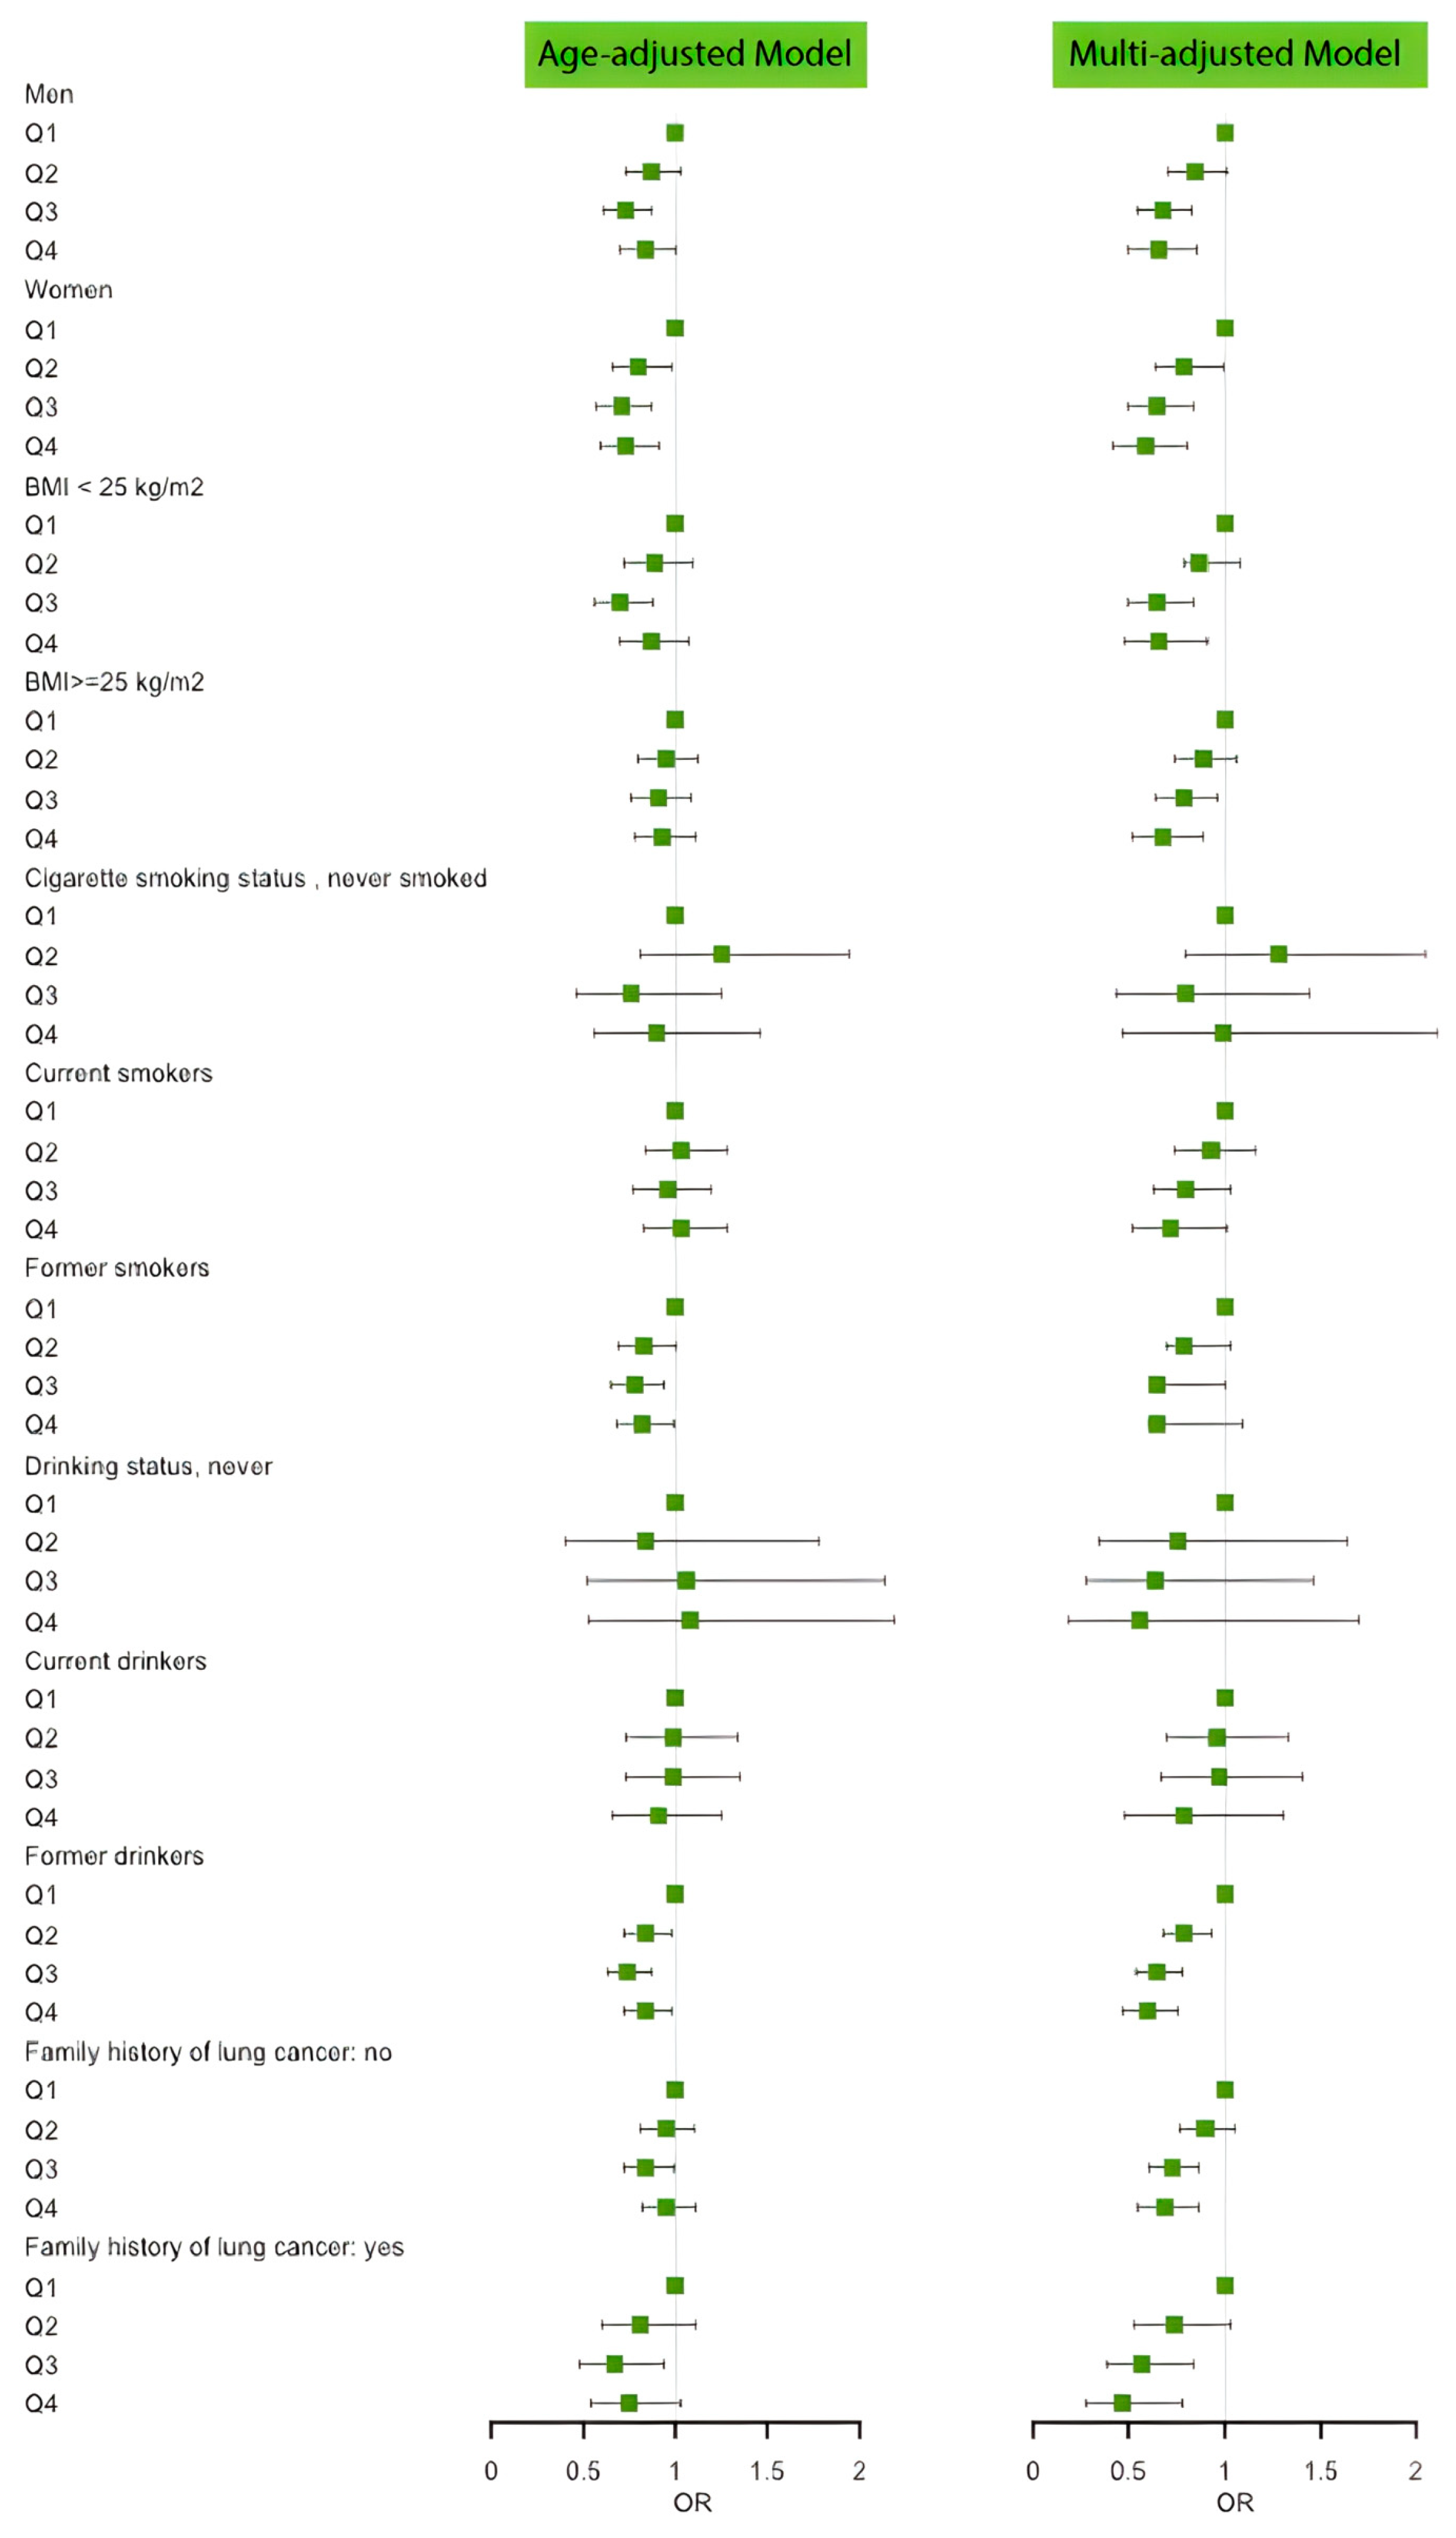
3.3. Association between fCADI Score and Risk of Lung Cancer
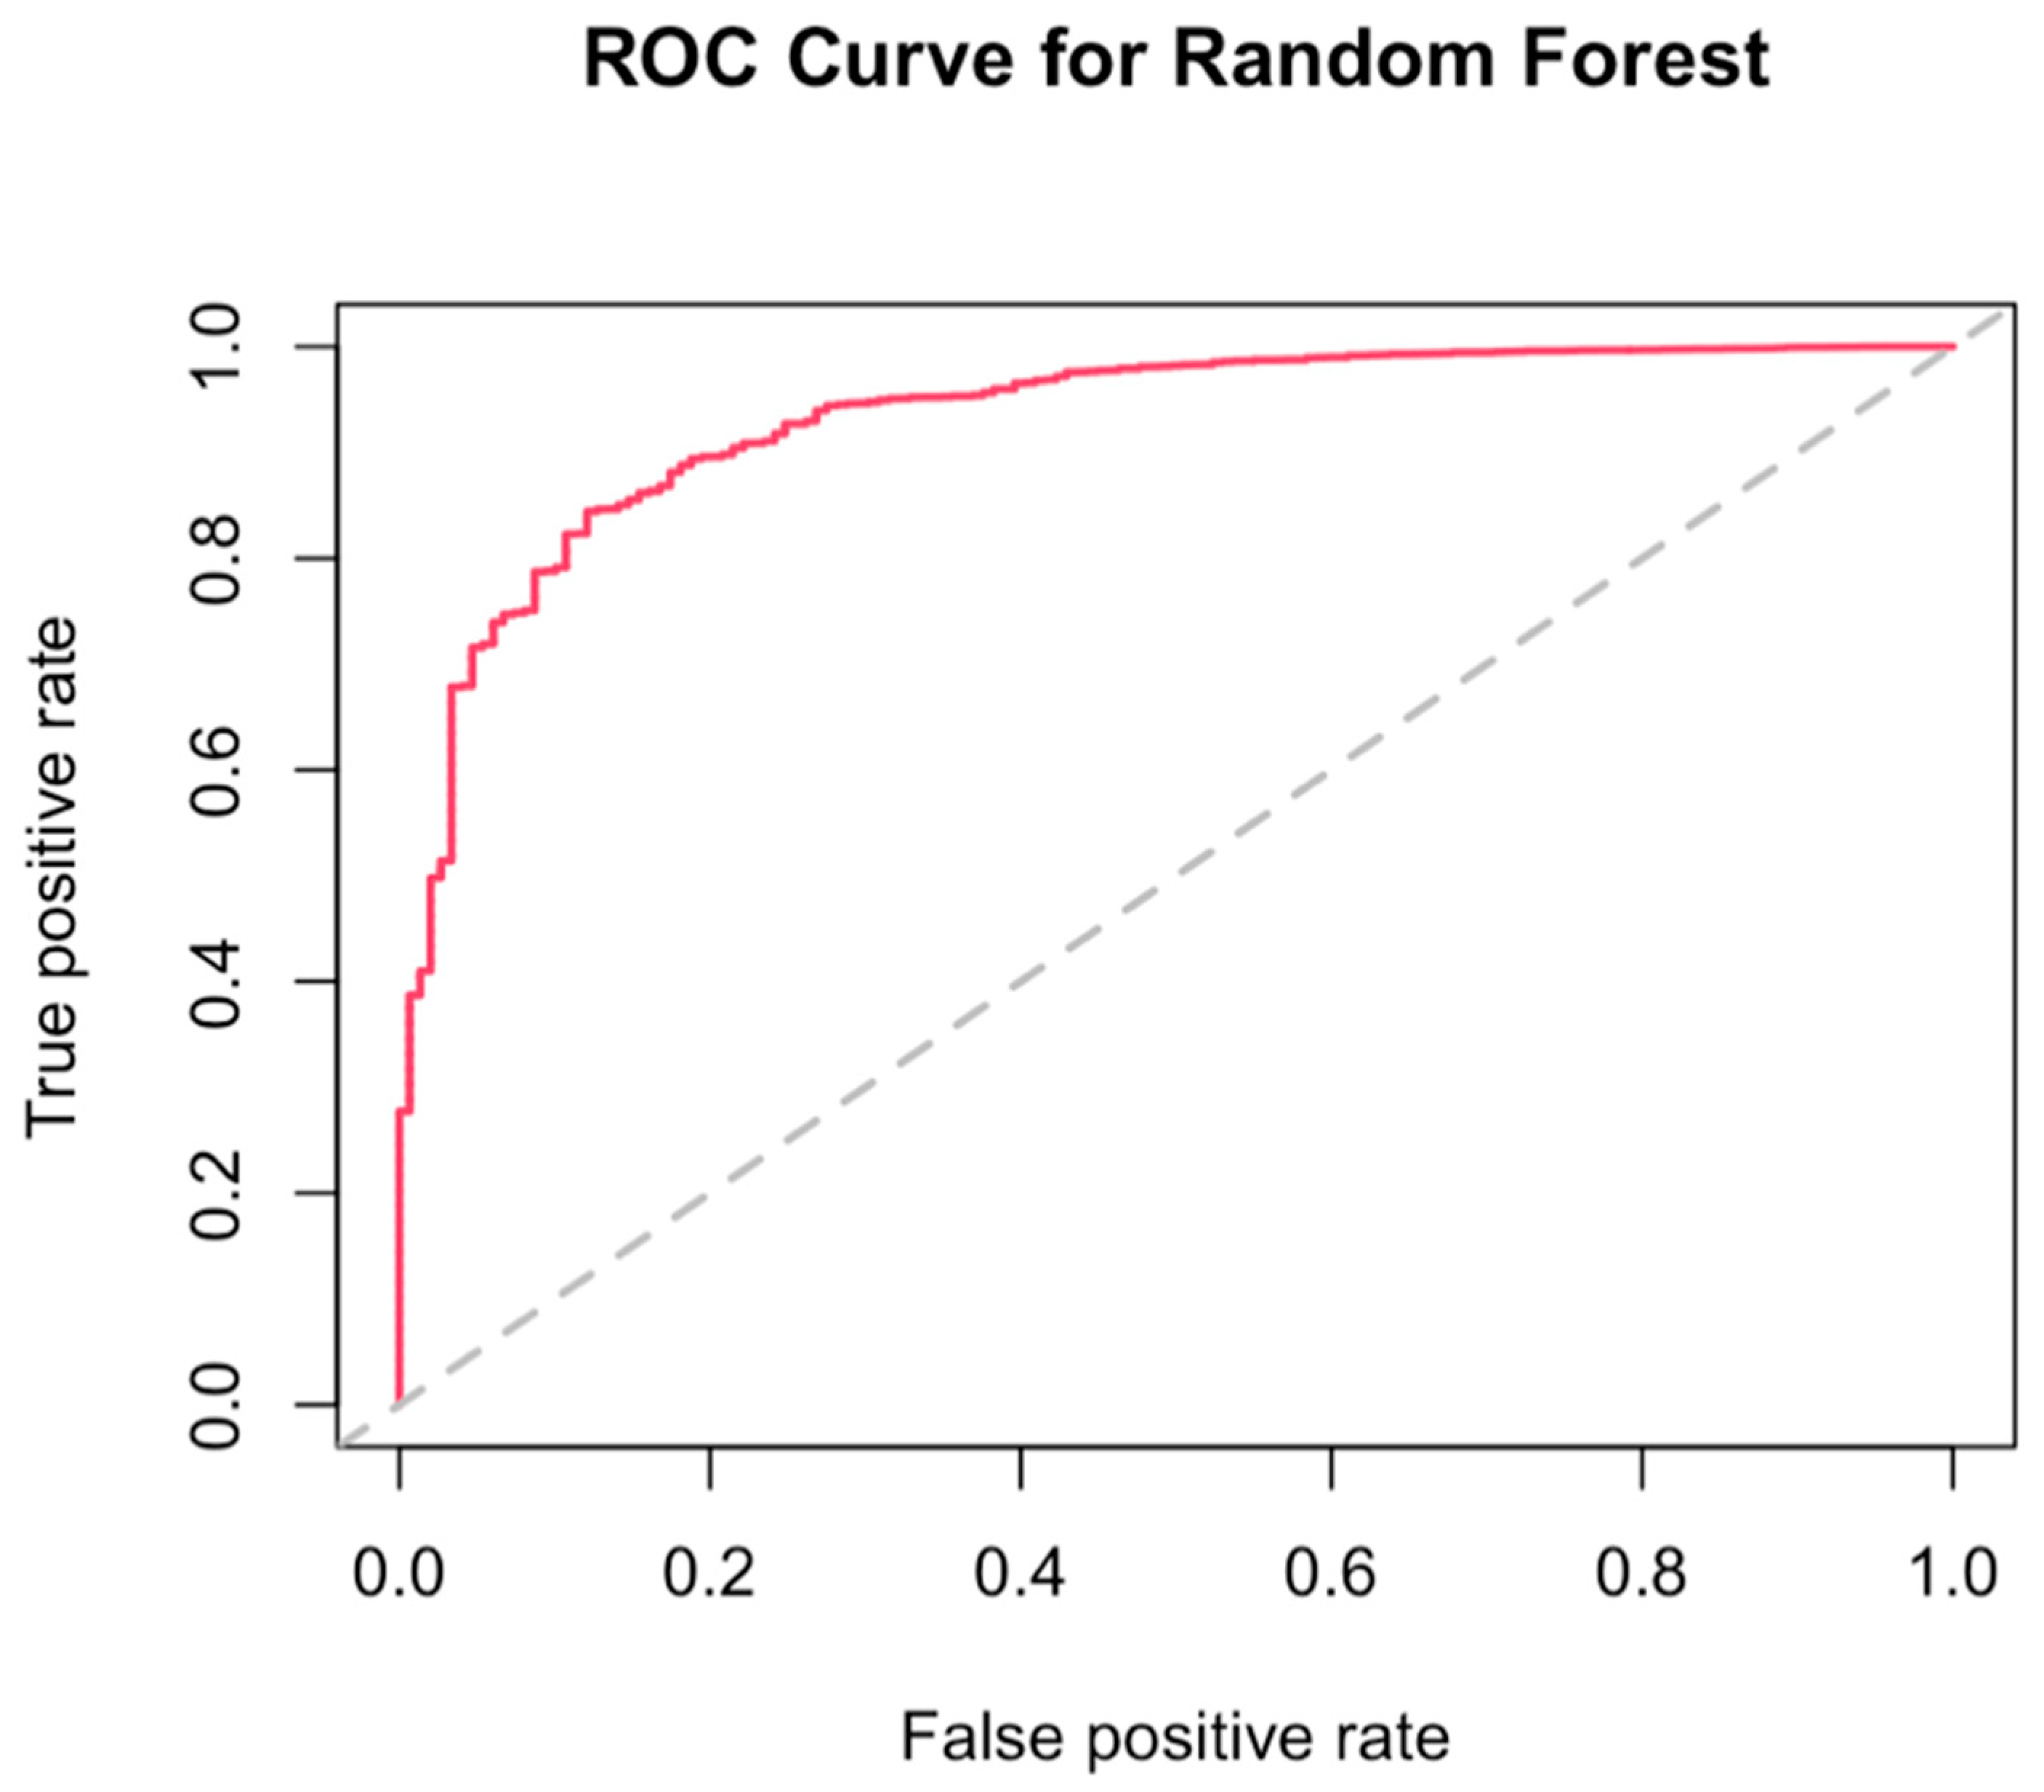
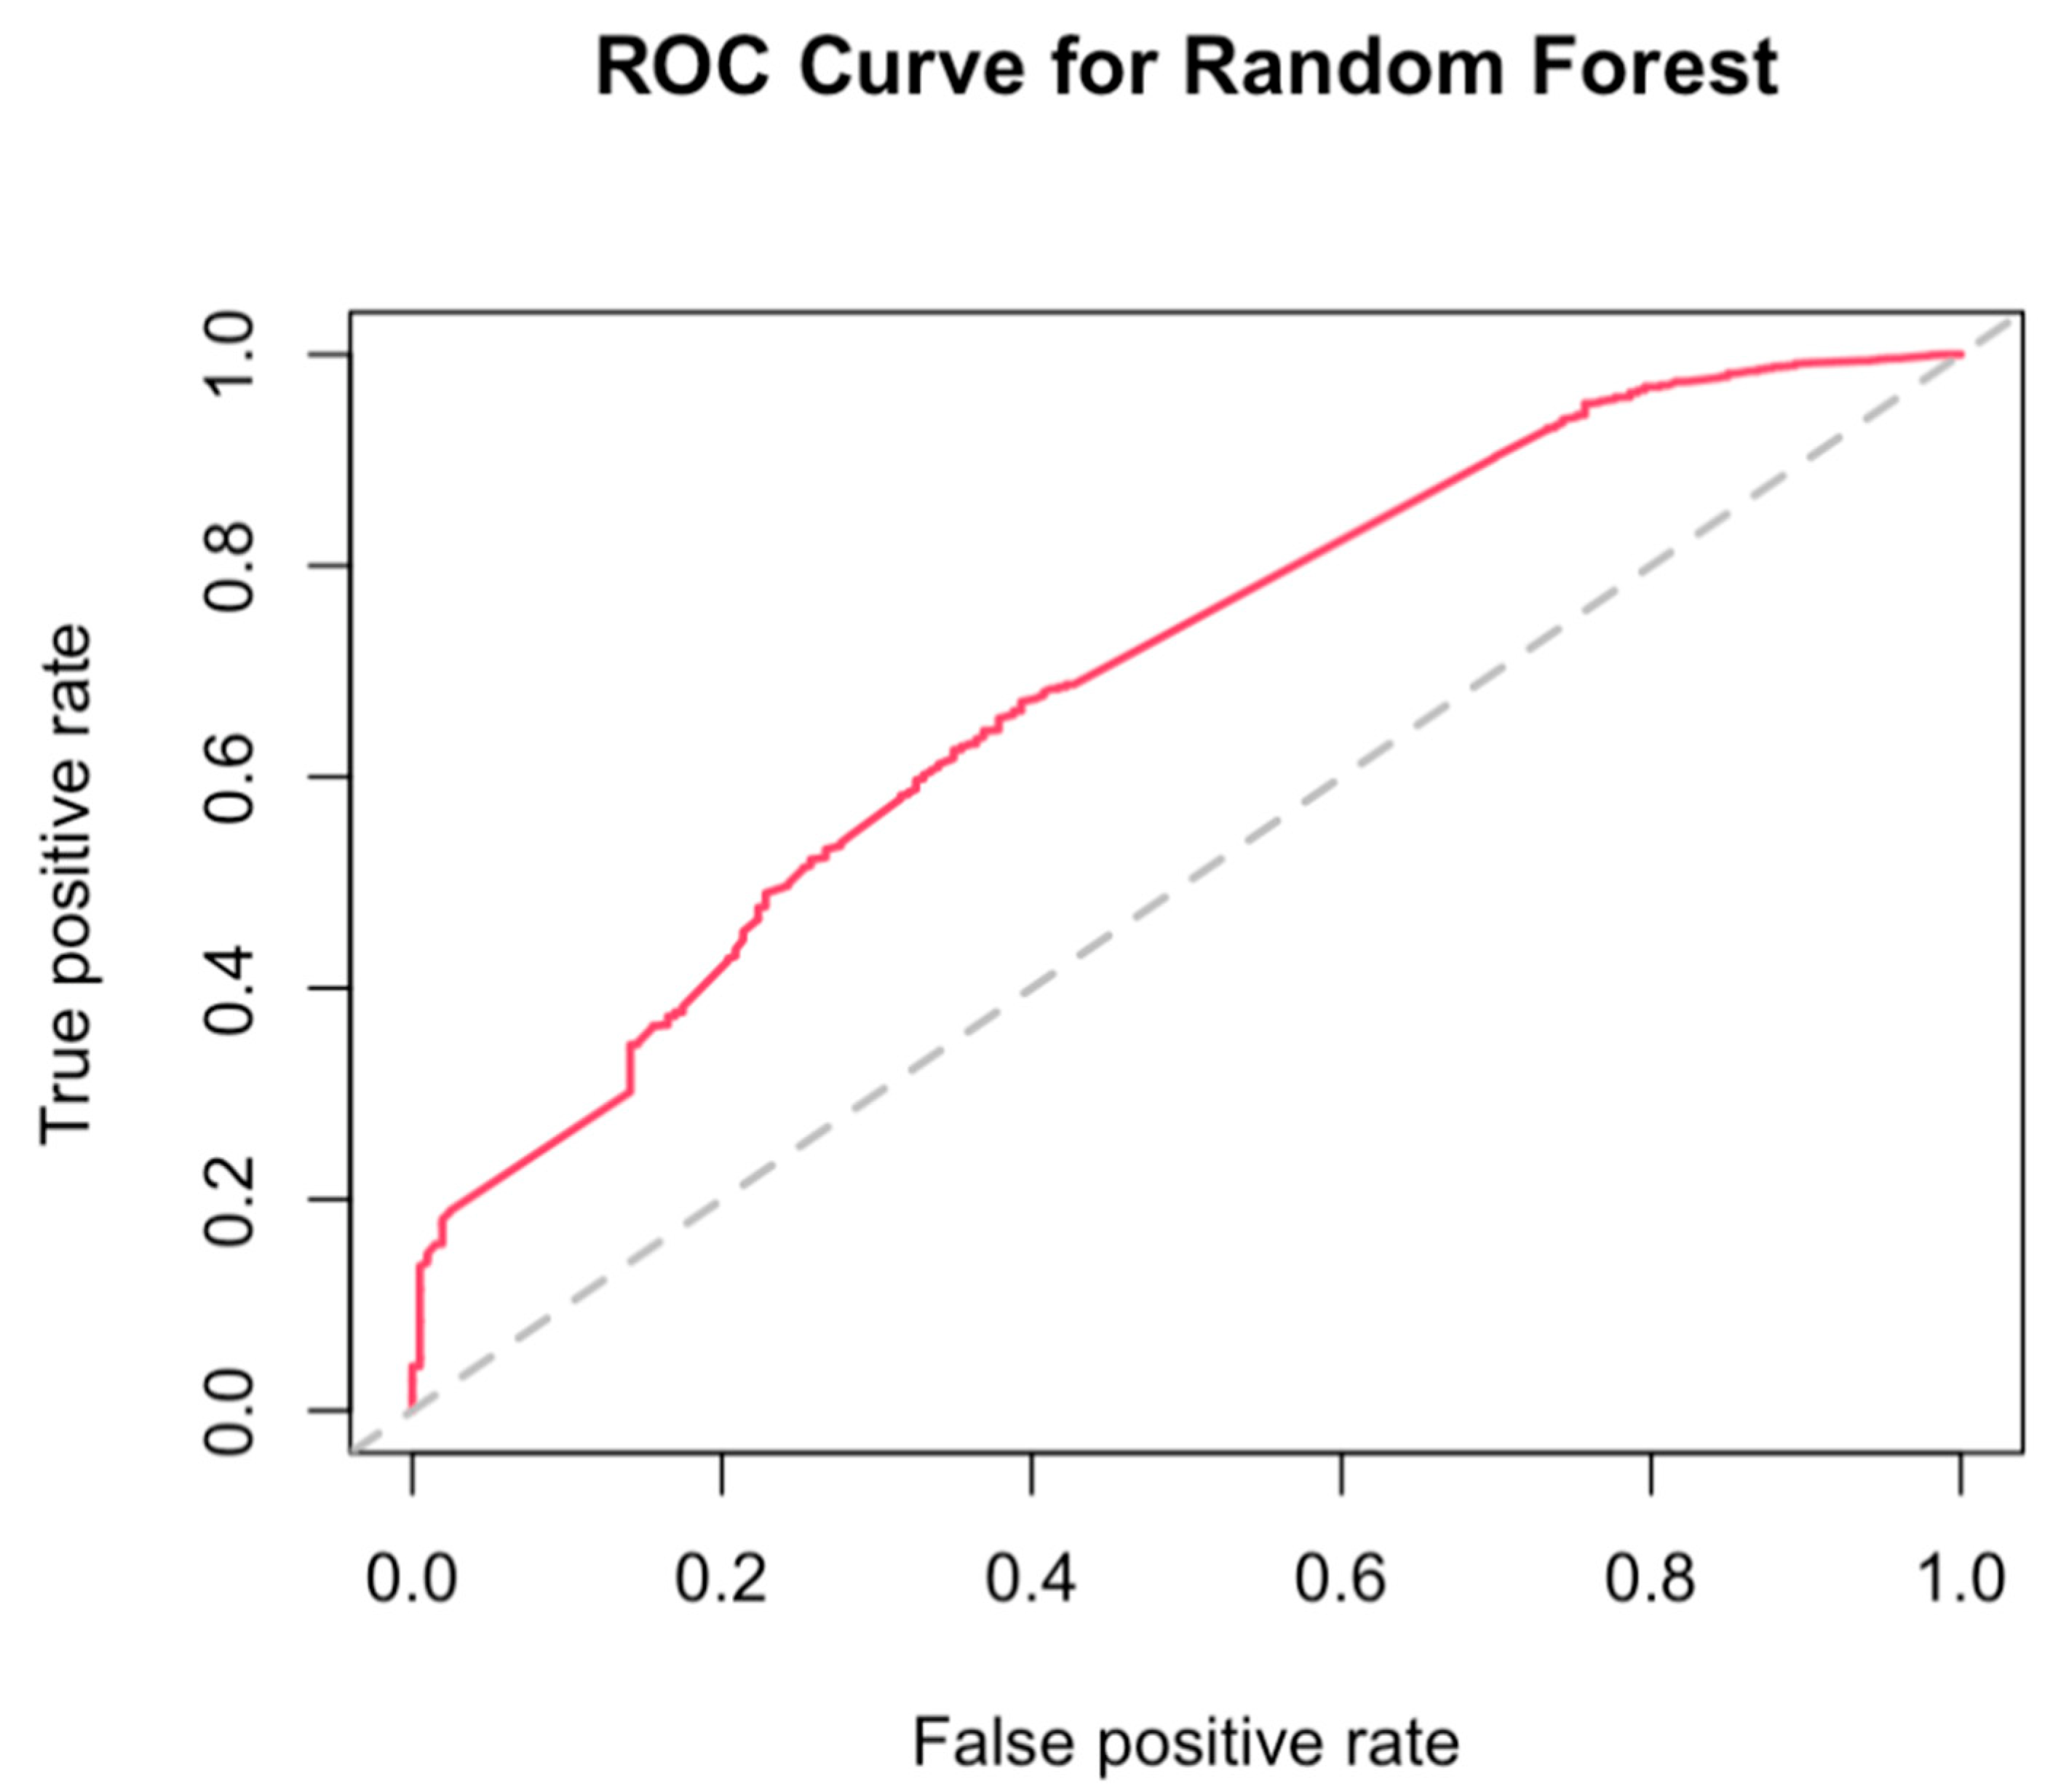
3.4. Best Combination of Antioxidants Model Selection and Random Forest
4. Discussion
5. Conclusions
Supplementary Materials
Author Contributions
Funding
Institutional Review Board Statement
Informed Consent Statement
Data Availability Statement
Acknowledgments
Conflicts of Interest
Appendix A

| fCADI in Quartile | Range | Cohort | Cases | Incidence Rate (95% CI) a | Age-Adjusted HR (95% CI), p-Value | Multi-Adjusted HR (95% CI), p-Value |
|---|---|---|---|---|---|---|
| Men | ||||||
| Q1 | <−2.5551 | 11,916 | 285 | 0.029 (0.025–0.032) | Reference group | Reference group |
| Q2 | ≥−2.5551 to <−0.1780 | 11,915 | 250 | 0.025 (0.022–0.028) | 0.87 (0.73–1.03), p = 0.1012 | 0.85 (0.71–1.01), p = 0.0672 |
| Q3 | ≥0.1780 to <3.6439 | 11,915 | 207 | 0.021 (0.018–0.024) | 0.73 (0.61- 0.87), p = 0.0007 | 0.68 (0.55–0.83), p = 0.0003 |
| Q4 | ≥3.6439 | 11,916 | 228 | 0.023 (0.020–0.026) | 0.84 (0.70–1.00), p = 0.0473 | 0.66 (0.50–0.86), p = 0.0024 |
| P for linear trend | P for trend = 0.0344 | P for trend = 0.00284 | ||||
| Women | ||||||
| Q1 | <−3.9276 | 12,697 | 208 | 0.021 (0.018–0.024) | Reference group | Reference group |
| Q2 | ≥−3.9276 to <−1.6222 | 12,697 | 168 | 0.017 (0.014–0.020) | 0.80 (0.66–0.98), p = 0.0350 | 0.79 (0.64–0.99), p = 0.0378 |
| Q3 | ≥1.6222 to <1.2269 | 12,698 | 147 | 0.015 (0.013–0.017) | 0.71 (0.57- 0.87), p = 0.0012 | 0.65 (0.50–0.84), p = 0.0009 |
| Q4 | ≥1.2269 | 12,697 | 149 | 0.015 (0.013–0.017) | 0.73 (0.59–0.91), p = 0.0039 | 0.59 (0.42–0.81), p = 0.0015 |
| P for linear trend | P for trend = 0.003 | P for trend < 0.001 | ||||
| BMI < 25 kg/m2 | ||||||
| Q1 | <−3.4911 | 8460 | 185 | 0.018 (0.016–0.021) | Reference group | Reference group |
| Q2 | ≥−3.4911 to <−1.0459 | 8460 | 165 | 0.017 (0.014–0.019) | 0.89 (0.72–1.09), p = 0.258 | 0.87 (0.79–1.08), p = 0.208 |
| Q3 | ≥−1.0459 to <2.0027 | 8461 | 132 | 0.013 (0.011–0.016) | 0.70 (0.56–0.88), p = 0.002 | 0.65 (0.50–0.84), p = 0.001 |
| Q4 | ≥2.0027 | 8460 | 160 | 0.016 (0.014–0.019) | 0.87 (0.70–1.07), p = 0.184 | 0.66 (0.48–0.91), p = 0.011 |
| P for linear trend | P for trend = 0.077 | P for trend = 0.002 | ||||
| BMI ≥ 25 kg/m2 | ||||||
| Q1 | <−3.2569 | 16,153 | 266 | 0.027 (0.024–0.030) | Reference group | Reference group |
| Q2 | ≥−3.2569 to <−0.6718 | 16,152 | 254 | 0.025 (0.022–0.029) | 0.95 (0.80–1.12), p = 0.531 | 0.89 (0.74–1.06), p = 0.185 |
| Q3 | ≥−0.6718 to <2.6493 | 16,152 | 240 | 0.024 (0.021–0.027) | 0.91 (0.76–1.08), p = 0.263 | 0.79 (0.64–0.96), p = 0.020 |
| Q4 | ≥2.6493 | 16,153 | 240 | 0.024 (0.021–0.027) | 0.93 (0.78–1.11), p = 0.431 | 0.68 (0.52–0.89), p = 0.005 |
| P for linear trend | P for trend = 0.389 | P for trend = 0.002 | ||||
| Cigarette smoking status: never smoked | ||||||
| Q1 | <−3.4377 | 11,884 | 36 | 0.004 (0.003–0.005) | Reference group | Reference group |
| Q2 | ≥−3.4377 to <−0.9573 | 11,884 | 45 | 0.004 (0.003–0.006) | 1.25 (0.81–1.94), p = 0.319 | 1.28 (0.80–2.05), p = 0.304 |
| Q3 | ≥0.9573 to <2.2189 | 11,885 | 27 | 0.003 (0.002–0.004) | 0.76 (0.46- 1.25), p = 0.285 | 0.80 (0.44–1.44), p = 0.448 |
| Q4 | ≥2.2189 | 11,884 | 31 | 0.003 (0.002–0.004) | 0.90 (0.56–1.46), p = 0.670 | 0.99 (0.47–2.11), p = 0.987 |
| P for linear trend | P for trend = 0.17 | P for trend = 0.306 | ||||
| Current smokers | ||||||
| Q1 | <−3.7053 | 2277 | 165 | 0.017 (0.014–0.019) | Reference group | Reference group |
| Q2 | ≥−3.7053 to <−1.0678 | 2276 | 175 | 0.018 (0.015–0.020) | 1.03 (0.84–1.28), p = 0.757 | 0.93 (0.74–1.16), p = 0.5094 |
| Q3 | ≥−1.0678 to <2.2474 | 2277 | 159 | 0.016 (0.014–0.019) | 0.96 (0.77–1.19), p = 0.681 | 0.80 (0.63–1.03), p = 0.0890 |
| Q4 | ≥2.2474 | 2277 | 165 | 0.016 (0.014–0.019) | 1.03 (0.83–1.28), p = 0.800 | 0.72 (0.52–1.01), p = 0.0554 |
| P for linear trend | P for trend = 0.901 | P for trend = 0.004 | ||||
| Former smokers | ||||||
| Q1 | <−3.1491 | 10,452 | 248 | 0.025 (0.022–0.028) | Reference group | Reference group |
| Q2 | ≥−3.1491 to <−0.5835 | 10,451 | 204 | 0.020 (0.018–0.023) | 0.83 (0.69–1.00), p = 0.0464 | 0.79 (0.70–1.03), p = 0.104 |
| Q3 | ≥−0.5835 to <2.6865 | 10,452 | 193 | 0.019 (0.017–0.022) | 0.78 (0.65–0.94), p = 0.0106 | 0.65 (0.64–1.00), p = 0.053 |
| Q4 | ≥2.6865 | 10,452 | 194 | 0.019 (0.017–0.022) | 0.82 (0.68–0.99), p = 0.0403 | 0.65 (0.61–1.09), p = 0.162 |
| P for linear trend | P for trend = 0.107 | P for trend = 0.133 | ||||
| Drinking status: Never drinkers | ||||||
| Q1 | <−3.8669 | 2485 | 15 | 0.002 (0.001–0.002) | Reference group | Reference group |
| Q2 | ≥−3.8669 to <−1.4275 | 2485 | 13 | 0.001 (0.001–0.002) | 0.84 (0.40–1.78), p = 0.6566 | 0.76 (0.35–1.64), p = 0.4765 |
| Q3 | ≥−1.4275 to <1.7642 | 2485 | 16 | 0.002 (0.001–0.003) | 1.06 (0.52–2.14), p = 0.8784 | 0.64 (0.28–1.46), p = 0.2877 |
| Q4 | ≥1.7642 | 2485 | 16 | 0.002 (0.001–0.003) | 1.08 (0.53–2.19), p = 0.8296 | 0.56 (0.19–1.70), p = 0.3056 |
| P for linear trend | P for trend = 0.433 | P for trend = 0.513 | ||||
| Former drinkers | ||||||
| Q1 | <−3.4802 | 3567 | 81 | 0.008 (0.007–0.010) | Reference group | Reference group |
| Q2 | ≥−3.4802 to <−0.8979 | 3567 | 81 | 0.008 (0.007–0.010) | 0.99 (0.73–1.34), p = 0.935 | 0.96 (0.70–1.33), p = 0.8097 |
| Q3 | ≥−0.8979 to <2.4313 | 3568 | 81 | 0.008 (0.007–0.010) | 0.99 (0.73–1.35), p = 0.971 | 0.97 (0.67–1.40), p = 0.8734 |
| Q4 | ≥2.4313 | 3567 | 72 | 0.007 (0.006–0.009) | 0.91 (0.66–1.25), p = 0.565 | 0.79 (0.48–1.30), p = 0.3625 |
| P for linear trend | P for trend = 0.488 | P for trend = 0.271 | ||||
| Current drinkers | ||||||
| Q1 | <−3.2122 | 17,868 | 359 | 0.036 (0.032–0.040) | Reference group | Reference group |
| Q2 | ≥−3.2122 to <−0.6797 | 17,867 | 303 | 0.030 (0.027–0.034) | 0.84 (0.72–0.98), p = 0.0224 | 0.79 (0.68–0.93), p = 0.0047 |
| Q3 | ≥−0.6797 to <2.5210 | 17,867 | 268 | 0.027 (0.024–0.030) | 0.74 (0.63–0.87), p = 0.0002 | 0.65 (0.54–0.78), p = 3.75 × 10⁻⁶ |
| Q4 | ≥2.5210 | 17,868 | 294 | 0.029 (0.026–0.033) | 0.84 (0.72–0.98), p = 0.0264 | 0.60 (0.47–0.76), p = 1.75 × 10⁻⁵ |
| P for linear trend | P for trend = 0.025 | P for trend < 0.001 | ||||
| Family history of lung cancer: No | ||||||
| Q1 | <−3.3261 | 21,448 | 347 | 0.009 (0.007–0.011) | Reference group | Reference group |
| Q2 | ≥−3.3261 to <−0.7930 | 21,447 | 331 | 0.007 (0.006–0.009) | 0.95 (0.81–1.10), p = 0.4799 | 0.90 (0.77–1.05), p = 0.1762 |
| Q3 | ≥−0.7930 to <2.4407 | 21,447 | 294 | 0.006 (0.005–0.008) | 0.84 (0.72–0.99), p = 0.0324 | 0.73 (0.61–0.87), p = 0.0006 |
| Q4 | ≥2.4407 | 21,448 | 321 | 0.006 (0.005–0.008) | 0.95 (0.82–1.11), p = 0.5181 | 0.69 (0.55–0.87), p = 0.0019 |
| P for linear trend | P for trend = 0.413 | P for trend < 0.001 | ||||
| Family history of lung cancer: Yes | ||||||
| Q1 | <−3.4296 | 2575 | 87 | 0.035 (0.031–0.039) | Reference group | Reference group |
| Q2 | ≥−3.4296 to <−0.9070 | 2574 | 72 | 0.033 (0.030–0.037) | 0.81 (0.60–1.11), p = 0.1981 | 0.74 (0.53–1.03), p = 0.0727 |
| Q3 | ≥0.9070 to <2.3121 | 2574 | 59 | 0.029 (0.026–0.033) | 0.67 (0.48–0.94), p = 0.0197 | 0.57 (0.39–0.84), p = 0.0047 |
| Q4 | ≥2.3121 | 2575 | 64 | 0.032 (0.029–0.036) | 0.75 (0.54–1.03), p = 0.0770 | 0.47 (0.28–0.78), p = 0.0036 |
| P for linear trend | P for trend = 0.061 | P for trend = 0.002 |


References
- Thai, A.A.; Solomon, B.J.; Sequist, L.V.; Gainor, J.F.; Heist, R.S. Lung cancer. Lancet 2021, 398, 535–554. [Google Scholar] [CrossRef] [PubMed]
- Huang, J.; Deng, Y.; Tin, M.S.; Lok, V.; Ngai, C.H.; Zhang, L.; Lucero-Prisno, D.E., III; Xu, W.; Zheng, Z.-J.; Elcarte, E. Distribution, risk factors, and temporal trends for lung cancer incidence and mortality: A global analysis. Chest 2022, 161, 1101–1111. [Google Scholar] [CrossRef] [PubMed]
- Uguen, M.; Dewitte, J.D.; Marcorelles, P.; Loddé, B.; Pougnet, R.; Saliou, P.; De Braekeleer, M.; Uguen, A. Asbestos-related lung cancers: A retrospective clinical and pathological study. Mol. Clin. Oncol. 2017, 7, 135–139. [Google Scholar] [CrossRef] [PubMed] [Green Version]
- Yu, N.; Su, X.; Wang, Z.; Dai, B.; Kang, J. Association of dietary vitamin A and β-carotene intake with the risk of lung cancer: A meta-analysis of 19 publications. Nutrients 2015, 7, 9309–9324. [Google Scholar] [CrossRef] [PubMed]
- Luo, J.; Shen, L.; Zheng, D. Association between vitamin C intake and lung cancer: A dose-response meta-analysis. Sci. Rep. 2014, 4, 6161. [Google Scholar] [CrossRef] [Green Version]
- Lobo, V.; Patil, A.; Phatak, A.; Chandra, N. Free radicals, antioxidants and functional foods: Impact on human health. Pharm. Rev. 2010, 4, 118–126. [Google Scholar] [CrossRef] [Green Version]
- Borek, C. Dietary antioxidants and human cancer. Integr. Cancer Ther. 2004, 3, 333–341. [Google Scholar] [CrossRef]
- Roswall, N.; Olsen, A.; Christensen, J.; Dragsted, L.O.; Overvad, K.; Tjønneland, A. Source-specific effects of micronutrients in lung cancer prevention. Lung Cancer 2010, 67, 275–281. [Google Scholar] [CrossRef]
- Clinton, S.K.; Giovannucci, E.L.; Hursting, S.D. The world cancer research fund/American institute for cancer research third expert report on diet, nutrition, physical activity, and cancer: Impact and future directions. J. Nutr. 2020, 150, 663–671. [Google Scholar] [CrossRef]
- Sun, Y.; Wu, J.; Yoon, H.-S.; Buchowski, M.S.; Cai, H.; Deppen, S.A.; Steinwandel, M.D.; Zheng, W.; Shu, X.-O.; Blot, W.J. Associations of Dietary Intakes of Carotenoids and Vitamin A with Lung Cancer Risk in a Low-Income Population in the Southeastern United States. Cancers 2022, 14, 5159. [Google Scholar] [CrossRef]
- Fritz, H.; Kennedy, D.; Fergusson, D.; Fernandes, R.; Cooley, K.; Seely, A.; Sagar, S.; Wong, R.; Seely, D. Selenium and lung cancer: A systematic review and meta analysis. PLoS ONE 2011, 6, e26259. [Google Scholar] [CrossRef] [PubMed] [Green Version]
- Cai, X.; Wang, C.; Yu, W.; Fan, W.; Wang, S.; Shen, N.; Wu, P.; Li, X.; Wang, F. Selenium Exposure and Cancer Risk: An Updated Meta-analysis and Meta-regression. Sci. Rep. 2016, 6, 19213. [Google Scholar] [CrossRef] [Green Version]
- Luu, H.N.; Wen, W.; Li, H.; Dai, Q.; Yang, G.; Cai, Q.; Xiang, Y.B.; Gao, Y.T.; Zheng, W.; Shu, X.O. Are dietary antioxidant intake indices correlated to oxidative stress and inflammatory marker levels? Antioxid. Redox Signal. 2015, 22, 951–959. [Google Scholar] [CrossRef] [PubMed] [Green Version]
- Wright, M.E.; Mayne, S.T.; Stolzenberg-Solomon, R.Z.; Li, Z.; Pietinen, P.; Taylor, P.R.; Virtamo, J.; Albanes, D. Development of a comprehensive dietary antioxidant index and application to lung cancer risk in a cohort of male smokers. Am. J. Epidemiol. 2004, 160, 68–76. [Google Scholar] [CrossRef] [Green Version]
- Yu, Y.C.; Paragomi, P.; Wang, R.; Jin, A.; Schoen, R.E.; Sheng, L.T.; Pan, A.; Koh, W.P.; Yuan, J.M.; Luu, H.N. Composite dietary antioxidant index and the risk of colorectal cancer: Findings from the Singapore Chinese Health Study. Int. J. Cancer 2022, 150, 1599–1608. [Google Scholar] [CrossRef]
- Egnell, M.; Fassier, P.; Lécuyer, L.; Gonzalez, R.; Zelek, L.; Vasson, M.P.; Hercberg, S.; Latino-Martel, P.; Galan, P.; Druesne-Pecollo, N.; et al. Antioxidant intake from diet and supplements and risk of digestive cancers in middle-aged adults: Results from the prospective NutriNet-Santé cohort. Br. J. Nutr. 2017, 118, 541–549. [Google Scholar] [CrossRef] [PubMed] [Green Version]
- Huang, J.; Weinstein, S.J.; Yu, K.; Männistö, S.; Albanes, D. A Prospective Study of Serum Vitamin E and 28-Year Risk of Lung Cancer. J. Natl. Cancer Instig. 2020, 112, 191–199. [Google Scholar] [CrossRef] [PubMed]
- Lin, P.-H.; Aronson, W.; Freedland, S.J. Nutrition, dietary interventions and prostate cancer: The latest evidence. BMC Med. 2015, 13, 3. [Google Scholar] [CrossRef] [Green Version]
- Muka, T.; Kraja, B.; Ruiter, R.; Lahousse, L.; de Keyser, C.E.; Hofman, A.; Franco, O.H.; Brusselle, G.; Stricker, B.H.; Kiefte-de Jong, J.C. Dietary mineral intake and lung cancer risk: The Rotterdam Study. Eur. J. Nutr. 2017, 56, 1637–1646. [Google Scholar] [CrossRef] [Green Version]
- Lin, J.; Cook, N.R.; Albert, C.; Zaharris, E.; Gaziano, J.M.; Van Denburgh, M.; Buring, J.E.; Manson, J.E. Vitamins C and E and beta carotene supplementation and cancer risk: A randomized controlled trial. J. Natl. Cancer Instig. 2009, 101, 14–23. [Google Scholar] [CrossRef]
- Cortés-Jofré, M.; Rueda, J.R.; Asenjo-Lobos, C.; Madrid, E.; Bonfill Cosp, X. Drugs for preventing lung cancer in healthy people. Cochrane Database Syst. Rev. 2020, 3, Cd002141. [Google Scholar] [CrossRef] [PubMed]
- Wiel, C.; Le Gal, K.; Ibrahim, M.X.; Jahangir, C.A.; Kashif, M.; Yao, H.; Ziegler, D.V.; Xu, X.; Ghosh, T.; Mondal, T.; et al. BACH1 Stabilization by Antioxidants Stimulates Lung Cancer Metastasis. Cell 2019, 178, 330–345.e322. [Google Scholar] [CrossRef]
- Lignitto, L.; LeBoeuf, S.E.; Homer, H.; Jiang, S.; Askenazi, M.; Karakousi, T.R.; Pass, H.I.; Bhutkar, A.J.; Tsirigos, A.; Ueberheide, B.; et al. Nrf2 Activation Promotes Lung Cancer Metastasis by Inhibiting the Degradation of Bach1. Cell 2019, 178, 316–329.e318. [Google Scholar] [CrossRef]
- Yang, J.; Zhang, Y.; Na, X.; Zhao, A. β-Carotene Supplementation and Risk of Cardiovascular Disease: A Systematic Review and Meta-Analysis of Randomized Controlled Trials. Nutrients 2022, 14, 1284. [Google Scholar] [PubMed]
- Middha, P.; Weinstein, S.J.; Männistö, S.; Albanes, D.; Mondul, A.M. β-carotene supplementation and lung cancer incidence in the alpha-tocopherol, beta-carotene cancer prevention study: The role of tar and nicotine. Nicotine Tob. Res. 2019, 21, 1045–1050. [Google Scholar] [CrossRef] [PubMed] [Green Version]
- Group, A.-T.B.C.C.P.S. The effect of vitamin E and beta carotene on the incidence of lung cancer and other cancers in male smokers. N. Engl. J. Med. 1994, 330, 1029–1035. [Google Scholar]
- Albanes, D.; Heinonen, O.P.; Huttunen, J.K.; Taylor, P.R.; Virtamo, J.; Edwards, B.; Haapakoski, J.; Rautalahti, M.; Hartman, A.; Palmgren, J. Effects of alpha-tocopherol and beta-carotene supplements on cancer incidence in the Alpha-Tocopherol Beta-Carotene Cancer Prevention Study. Am. J. Clin. Nutr. 1995, 62, 1427S–1430S. [Google Scholar] [CrossRef]
- Omenn, G.S.; Goodman, G.E.; Thornquist, M.D.; Balmes, J.; Cullen, M.R.; Glass, A.; Keogh, J.P.; Meyskens Jr, F.L.; Valanis, B.; Williams Jr, J.H. Risk factors for lung cancer and for intervention effects in CARET, the Beta-Carotene and Retinol Efficacy Trial. JNCI J. Natl. Cancer Instig. 1996, 88, 1550–1559. [Google Scholar] [CrossRef]
- Shareck, M.; Rousseau, M.C.; Koushik, A.; Siemiatycki, J.; Parent, M.E. Inverse Association between Dietary Intake of Selected Carotenoids and Vitamin C and Risk of Lung Cancer. Front. Oncol. 2017, 7, 23. [Google Scholar] [CrossRef] [Green Version]
- Michaud, D.S.; Feskanich, D.; Rimm, E.B.; Colditz, G.A.; Speizer, F.E.; Willett, W.C.; Giovannucci, E. Intake of specific carotenoids and risk of lung cancer in 2 prospective US cohorts. Am. J. Clin. Nutr. 2000, 72, 990–997. [Google Scholar] [CrossRef] [Green Version]
- Min, K.B.; Min, J.Y. Serum carotenoid levels and risk of lung cancer death in US adults. Cancer Sci. 2014, 105, 736–743. [Google Scholar] [CrossRef] [PubMed]


| Title 1 | 1 (n = 24,613) | 2 (n = 24,613) | 3 (n = 24,613) | 4 (n = 24,612) | Overall (n = 98,451) | p-Value |
|---|---|---|---|---|---|---|
| Age | ||||||
| Mean (SD) | 62.7 (5.34) | 62.5 (5.28) | 62.4 (5.27) | 62.0 (5.20) | 62.4 (5.28) | <0.001 |
| Median [Min, Max] | 62.0 [53.0, 75.0] | 62.0 [54.0, 74.0] | 62.0 [54.0, 78.0] | 61.0 [54.0, 75.0] | 62.0 [53.0, 78.0] | |
| Sex | ||||||
| Male | 8861 (36.0%) | 10,742 (43.6%) | 12,585 (51.1%) | 15,474 (62.9%) | 47,662 (48.4%) | <0.001 |
| Female | 15,752 (64.0%) | 13,871 (56.4%) | 12,028 (48.9%) | 9138 (37.1%) | 50,789 (51.6%) | |
| Race | ||||||
| White, Non-Hispanic | 21,868 (88.8%) | 22,605 (91.8%) | 22,806 (92.7%) | 22,299 (90.6%) | 89,578 (91.0%) | <0.001 |
| Black, Non-Hispanic | 992 (4.0%) | 730 (3.0%) | 645 (2.6%) | 844 (3.4%) | 3211 (3.3%) | |
| Hispanic | 394 (1.6%) | 316 (1.3%) | 344 (1.4%) | 386 (1.6%) | 1440 (1.5%) | |
| Asian | 1182 (4.8%) | 817 (3.3%) | 664 (2.7%) | 874 (3.6%) | 3537 (3.6%) | |
| Pacific Islander | 111 (0.5%) | 103 (0.4%) | 102 (0.4%) | 139 (0.6%) | 455 (0.5%) | |
| American Indian | 58 (0.2%) | 31 (0.1%) | 45 (0.2%) | 62 (0.3%) | 196 (0.2%) | |
| Missing | 8 (0.0%) | 11 (0.0%) | 7 (0.0%) | 8 (0.0%) | 34 (0.0%) | |
| Study arm | ||||||
| Intervention | 12,422 (50.5%) | 12,468 (50.7%) | 12,722 (51.7%) | 12,795 (52.0%) | 50,407 (51.2%) | 0.00229 |
| Control | 12,191 (49.5%) | 12,145 (49.3%) | 11,891 (48.3%) | 11,817 (48.0%) | 48,044 (48.8%) | |
| Education | ||||||
| Less Than 8 Years | 177 (0.7%) | 115 (0.5%) | 138 (0.6%) | 167 (0.7%) | 597 (0.6%) | <0.001 |
| 8–11 Years | 1539 (6.3%) | 1307 (5.3%) | 1203 (4.9%) | 1216 (4.9%) | 5265 (5.3%) | |
| 12 Years or Completed High School | 6938 (28.2%) | 5883 (23.9%) | 5284 (21.5%) | 4815 (19.6%) | 22,920 (23.3%) | |
| Post High School Training Other than College | 3251 (13.2%) | 3204 (13.0%) | 3238 (13.2%) | 3036 (12.3%) | 12,729 (12.9%) | |
| Some College | 5515 (22.4%) | 5218 (21.2%) | 5213 (21.2%) | 5210 (21.2%) | 21,156 (21.5%) | |
| College Graduate | 3686 (15.0%) | 4440 (18.0%) | 4605 (18.7%) | 4607 (18.7%) | 17,338 (17.6%) | |
| Postgraduate | 3507 (14.2%) | 4446 (18.1%) | 4932 (20.0%) | 5561 (22.6%) | 18,446 (18.7%) | |
| BMI | ||||||
| 0–18.5 | 186 (0.8%) | 186 (0.8%) | 156 (0.6%) | 136 (0.6%) | 664 (0.7%) | <0.001 |
| 18.5–25 | 8780 (35.7%) | 8610 (35.0%) | 8338 (33.9%) | 7449 (30.3%) | 33,177 (33.7%) | |
| 25–30 | 10,041 (40.8%) | 10,373 (42.1%) | 10,595 (43.0%) | 10,940 (44.4%) | 41,949 (42.6%) | |
| 30+ | 5606 (22.8%) | 5444 (22.1%) | 5524 (22.4%) | 6087 (24.7%) | 22,661 (23.0%) | |
| Marital status | ||||||
| Married Or Living As Married | 18,461 (75.0%) | 19,464 (79.1%) | 19,755 (80.3%) | 19,575 (79.5%) | 77,255 (78.5%) | <0.001 |
| Widowed | 2545 (10.3%) | 2024 (8.2%) | 1812 (7.4%) | 1571 (6.4%) | 7952 (8.1%) | |
| Divorced | 2647 (10.8%) | 2199 (8.9%) | 2150 (8.7%) | 2385 (9.7%) | 9381 (9.5%) | |
| Separated | 196 (0.8%) | 162 (0.7%) | 172 (0.7%) | 228 (0.9%) | 758 (0.8%) | |
| Never Married | 764 (3.1%) | 764 (3.1%) | 724 (2.9%) | 853 (3.5%) | 3105 (3.2%) | |
| Family history of any cancer | ||||||
| No | 10,701 (43.5%) | 10,811 (43.9%) | 10,854 (44.1%) | 11,075 (45.0%) | 43,441 (44.1%) | 0.0158 |
| Yes, Immediate Family Member | 2665 (10.8%) | 2573 (10.5%) | 2556 (10.4%) | 2504 (10.2%) | 10,298 (10.5%) | |
| Possibly Relative or Cancer Type Not Clear | 632 (2.6%) | 559 (2.3%) | 581 (2.4%) | 591 (2.4%) | 2363 (2.4%) | |
| Smoking status | ||||||
| Never Smoked Cigarettes | 12,318 (50.0%) | 12,152 (49.4%) | 11,757 (47.8%) | 11,310 (46.0%) | 47,537 (48.3%) | <0.001 |
| Current Cigarette Smoker | 2579 (10.5%) | 2204 (9.0%) | 2135 (8.7%) | 2189 (8.9%) | 9107 (9.3%) | |
| Former Cigarette Smoker | 9716 (39.5%) | 10,257 (41.7%) | 10,721 (43.6%) | 11,113 (45.2%) | 41,807 (42.5%) | |
| Alcohol drinking status | ||||||
| Never | 3008 (12.2%) | 2593 (10.5%) | 2236 (9.1%) | 2103 (8.5%) | 9940 (10.1%) | <0.001 |
| Former | 3759 (15.3%) | 3494 (14.2%) | 3446 (14.0%) | 3570 (14.5%) | 14,269 (14.5%) | |
| Current | 17,001 (69.1%) | 17,838 (72.5%) | 18,323 (74.4%) | 18,308 (74.4%) | 71,470 (72.6%) | |
| Unknown | 845 (3.4%) | 688 (2.8%) | 608 (2.5%) | 631 (2.6%) | 2772 (2.8%) | |
| Total energy | ||||||
| Mean (SD) | 1050 (300) | 1480 (325) | 1850 (411) | 2570 (740) | 1740 (735) | <0.001 |
| Median [Min, Max] | 1030 [466, 4970] | 1450 [550, 5390] | 1810 [622, 5540] | 2450 [644, 5620] | 1610 [466, 5620] | |
| fCADI | ||||||
| Mean (SD) | −5.07 (1.23) | −2.07 (0.727) | 0.682 (0.928) | 6.46 (3.93) | −0.0000000675 (4.76) | <0.001 |
| Median [Min, Max] | −4.85 [−10.1, −3.34] | −2.08 [−3.34, −0.805] | 0.618 [−0.805, 2.43] | 5.29 [2.43, 42.0] | −0.805 [−10.1, 42.0] |
| Nutrients | Range | Mean | Cohort | Cases | Incidence Rate (95% CI) a | Age-Adjusted HR (95% CI), p-Value | Multi-Adjusted HR (95% CI), p-Value | |
|---|---|---|---|---|---|---|---|---|
| Total β-carotene (mcg/day) | ||||||||
| Q1 | <2278.77 | 1556.37 | 24,614 | 516 | 0.052 (0.047–0.056) | Reference group | Reference group | |
| Q2 | ≥2278.77 to <3504.26 | 2864.17 | 24,616 | 455 | 0.045 (0.041–0.050) | 0.86 (0.76–0.97), p = 0.017 | 0.98 (0.86–1.11), p = 0.761 | |
| Q3 | ≥3504.26 to <5665.90 | 4422.85 | 24,609 | 374 | 0.037 (0.034–0.041) | 0.70 (0.61–0.80), p = 1.04 × 10⁻⁷ | 0.86 (0.75–0.99), p = 0.039 | |
| Q4 | ≥5665.90 | 9775.35 | 24,612 | 297 | 0.030 (0.027–0.033) | 0.55 (0.48–0.63), p < 2 × 10⁻¹⁶ | 0.69 (0.59–0.80), p = 1.36 × 10⁻⁶ | |
| P for linear trend | P for trend < 2 × 10⁻¹⁶ | P for trend = 1.75 × 10⁻⁷ | ||||||
| Dietary β-carotene | ||||||||
| Q1 | <1634.06 | 1137.74 | 24,613 | 547 | 0.055 (0.050–0.059) | Reference group | Reference group | |
| Q2 | ≥1634.06 to <2654.56 | 2119.15 | 24,613 | 426 | 0.043 (0.039–0.047) | 0.76 (0.67–0.86), p = 2.30 × 10⁻⁵ | 0.84 (0.74–0.95), p = 0.007 | |
| Q3 | ≥2654.56 to <4428.63 | 3423.88 | 24,612 | 379 | 0.038 (0.034–0.042) | 0.67 (0.58- 0.76), p = 1.17 × 10⁻⁹ | 0.79 (0.69–0.91), p = 0.001 | |
| Q4 | ≥4428.63 | 7527.37 | 24,613 | 290 | 0.029 (0.026–0.033) | 0.51 (0.44–0.59), p ≤ 2 × 10⁻¹⁶ | 0.62 (0.53–0.72), p = 1.03 × 10⁻⁹ | |
| P for linear trend | P for trend < 2 × 10⁻¹⁶ | P for trend = 3.79 × 10⁻⁹ | ||||||
| β-carotene supplements | ||||||||
| No | 0 | 0 | 37,113 | 651 | 0.065 (0.060–0.070) | Reference group | Reference group | |
| Yes | ≤2700 | 294.93 | 61,338 | 991 | 0.099 (0.093–0.105) | 0.93 (0.84–1.02), p = 0.125 | 1.04 (0.94–1.15), p = 0.453 | |
| Total vitamin A (IU/day) | ||||||||
| Q1 | <7422.5 | 4991.567 | 24,613 | 490 | 0.049 (0.045–0.054) | Reference group | Reference group | |
| Q2 | ≥7422.5 to <10,810.0 | 9139.481 | 24,616 | 475 | 0.048 (0.043–0.052) | 0.94 (0.83–1.07), p = 0.378 | 1.05 (0.92–1.19), p = 0.450 | |
| Q3 | ≥10,810.0 to <15,489.5 | 12,873.09 | 24,609 | 375 | 0.037 (0.034–0.041) | 0.73 (0.64–0.84), p = 4.58 × 10⁻⁶ | 0.86 (0.74–0.98), p = 0.029 | |
| Q4 | ≥15,489.5 | 22,986.43 | 24,613 | 302 | 0.030 (0.027–0.034) | 0.58 (0.51–0.67), p = 2.23 × 10⁻¹³ | 0.72 (0.61–0.84), p = 2.28 × 10⁻⁵ | |
| P for linear trend | P for trend = 9.16 × 10⁻¹⁶ | P for trend = 1.60 × 10⁻⁶ | ||||||
| Dietary vitamin A | ||||||||
| Q1 | <4993.5 | 3652.943 | 24,615 | 518 | 0.052 (0.048–0.056) | Reference group | Reference group | |
| Q2 | ≥4993.5 to <7513.7 | 6212.687 | 24,612 | 446 | 0.045 (0.041–0.049) | 0.83 (0.73–0.94), p = 0.004 | 0.85 (0.75–0.97), p = 0.0155 | |
| Q3 | ≥7513.7 to <11,610.5 | 9303.387 | 24,612 | 375 | 0.038 (0.034–0.041) | 0.68 (0.60–0.78), p = 2.21 × 10⁻⁸ | 0.75 (0.65–0.87), p = 0.0001 | |
| Q4 | ≥11,610.5 | 18,619.62 | 24,612 | 303 | 0.030 (0.027–0.034) | 0.55 (0.48–0.64), p < 2 × 10⁻¹⁶ | 0.63 (0.54–0.74), p = 1.73 × 10⁻⁸ | |
| P for linear trend | P for trend <2 × 10⁻¹⁶ | P for trend = 2.88 × 10⁻⁸ | ||||||
| Vitamin A supplements | ||||||||
| No | 0 | 0 | 37,183 | 653 | 0.065 (0.060–0.071) | Reference group | Reference group | |
| Yes | ≤30,000 | 4901.844 | 61,268 | 989 | 0.099 (0.093–0.105) | 0.93 (0.84–1.02), p = 0.124 | 1.03 (0.93–1.14), p = 0.578 | |
| Total vitamin C (mg/day) | ||||||||
| Q1 | <127.85 | 85.368 | 24,613 | 536 | 0.054 (0.049–0.058) | Reference group | Reference group | |
| Q2 | ≥127.85 to <210.22 | 165.918 | 24,615 | 364 | 0.036 (0.033–0.040) | 0.65 (0.57–0.74), p = 1.40 × 10⁻¹⁰ | 0.82 (0.71–0.93), p = 0.003 | |
| Q3 | ≥210.22 to <563.31 | 328.331 | 24,610 | 358 | 0.036 (0.032–0.040) | 0.64 (0.56–0.73), p = 3.44 × 10⁻¹¹ | 0.81 (0.70–0.93), p = 0.003 | |
| Q4 | ≥563.31 | 925.296 | 24,613 | 384 | 0.038 (0.035–0.042) | 0.67 (0.59–0.76), p = 2.03 × 10⁻⁹ | 0.82 (0.72–0.94), p = 0.005 | |
| P for linear trend | P for trend = 0.0001 | P for trend = 0.0625 | ||||||
| Dietary vitamin C | ||||||||
| Q1 | <80.03 | 56.195 | 24,616 | 558 | 0.056 (0.051–0.061) | Reference group | Reference group | |
| Q2 | ≥80.03 to <120.77 | 100.178 | 24,614 | 393 | 0.039 (0.036–0.043) | 0.67 (0.59–0.76), p = 8.22 × 10⁻¹⁰ | 0.81 (0.71–0.92), p = 0.001 | |
| Q3 | ≥120.77 to <171.92 | 144.357 | 24,614 | 342 | 0.034 (0.031–0.038) | 0.56 (0.49–0.64), p < 2 × 10⁻¹⁶ | 0.72 (0.62–0.82), p = 2.98 × 10⁻⁶ | |
| Q4 | ≥171.92 | 251.426 | 24,607 | 349 | 0.035 (0.031–0.039) | 0.58 (0.50–0.66), p = 6.34 × 10⁻¹⁶ | 0.73 (0.63–0.85), p = 4.43 × 10⁻⁵ | |
| P for linear trend | P for trend = 2.84 × 10⁻¹⁵ | P for trend = 4.04 × 10⁻⁵ | ||||||
| Vitamin C supplements | ||||||||
| No | 0 | 0 | 26,670 | 506 | 0.051 (0.046–0.055) | Reference group | Reference group | |
| Yes | ≤2102.86 | 326.698 | 71,781 | 1136 | 0.114 (0.107–0.120) | 0.83 (0.75–0.93), p = 0.0007 | 0.98 (0.88–1.09), p = 0.656 | |
| Total vitamin E (mg/day) | ||||||||
| Q1 | <13.23 | 7.452 | 24,614 | 465 | 0.046 (0.042–0.051) | Reference group | Reference group | |
| Q2 | ≥13.23 to <34.42 | 24.914 | 24,613 | 452 | 0.045 (0.041–0.050) | 0.97 (0.86–1.11), p = 0.685 | 1.07 (0.93–1.21), p = 0.348 | |
| Q3 | ≥34.42 to <291.94 | 189.001 | 24,612 | 342 | 0.034 (0.031–0.038) | 0.71 (0.62–0.81), p = 1.23 × 10⁻⁶ | 0.83 (0.72–0.96), p = 0.012 | |
| Q4 | ≥291.94 | 387.723 | 24,612 | 383 | 0.038 (0.035–0.042) | 0.79 (0.69–0.91), p = 0.0007 | 0.89 (0.78–1.02), p = 0.103 | |
| P for linear trend | P for trend = 5.81 × 10⁻⁷ | P for trend = 0.0016 | ||||||
| Dietary vitamin E | ||||||||
| Q1 | <4.971 | 3.768 | 24,644 | 477 | 0.048 (0.044–0.052) | Reference group | Reference group | |
| Q2 | ≥4.971 to <6.901 | 5.924 | 24,613 | 391 | 0.039 (0.035–0.043) | 0.83 (0.73–0.95), p = 0.007 | 0.82 (0.71–0.92), p = 0.006 | |
| Q3 | ≥6.901 to <9.591 | 8.119 | 24,582 | 399 | 0.040 (0.036–0.044) | 0.86 (0.75–0.98), p = 0.028 | 0.82 (0.62–0.82), p = 0.008 | |
| Q4 | ≥9.591 | 13.531 | 24,612 | 375 | 0.038 (0.034–0.041) | 0.84 (0.73–0.96), p = 0.009 | 0.72 (0.63–0.85), p = 0.0005 | |
| P for linear trend | P for trend = 0.031 | P for trend = 0.0017 | ||||||
| Vitamin E supplements | ||||||||
| No | 0 | 0 | 25,133 | 490 | 0.049 (0.045–0.054) | Reference group | Reference group | |
| Yes | ≤ 690.1 | 192.445 | 73,318 | 1152 | 0.115 (0.109–0.122) | 0.79 (0.71–0.88), p = 1.17 × 10⁻⁵ | 0.91 (0.82–1.02), p = 0.097 | |
| Total magnesium (mg/day) | ||||||||
| Q1 | <273.73 | 213.779 | 24,615 | 397 | 0.040 (0.036–0.044) | Reference group | Reference group | |
| Q2 | ≥273.73 to <354.16 | 314.646 | 24,612 | 392 | 0.039 (0.036–0.043) | 0.98 (0.86–1.13), p = 0.824 | 0.95 (0.82–1.10), p = 0.477 | |
| Q3 | ≥354.16 to <446.29 | 397.172 | 24,612 | 418 | 0.042 (0.038–0.046) | 1.04 (0.91–1.20), p = 0.547 | 0.97 (0.83–1.12), p = 0.657 | |
| Q4 | ≥446.29 | 554.459 | 24,612 | 435 | 0.044 (0.040–0.048) | 1.12 (0.97–1.28), p = 0.112 | 0.92 (0.77–1.10), p = 0.369 | |
| P for linear trend | P for trend = 0.0684 | P for trend = 0.4266 | ||||||
| Dietary magnesium | ||||||||
| Q1 | <233.03 | 183.725 | 24,616 | 389 | 0.039 (0.035–0.043) | Reference group | Reference group | |
| Q2 | ≥233.03 to <303.16 | 268.121 | 24,610 | 388 | 0.039 (0.035–0.043) | 0.98 (0.85–1.13), p = 0.822 | 0.94 (0.81–1.08), p = 0.371 | |
| Q3 | ≥303.16 to <389.11 | 342.821 | 24,613 | 404 | 0.040 (0.037–0.045) | 1.03 (0.89–1.18), p = 0.724 | 0.90 (0.77–1.05), p = 0.187 | |
| Q4 | ≥389.11 | 495.427 | 24,612 | 461 | 0.046 (0.042–0.051) | 1.21 (1.05–1.38), p = 0.007 | 0.94 (0.77–1.14), p = 0.546 | |
| P for linear trend | P for trend = 0.0025 | P for trend = 0.5619 | ||||||
| Magnesium supplements | ||||||||
| No | 0 | 0 | 45,192 | 806 | 0.081 (0.075–0.086) | Reference group | Reference group | |
| Yes | ≤100 | 87.787 | 53,259 | 836 | 0.084 (0.078–0.089) | 0.89 (0.81–0.98), p = 0.021 | 1.00 (0.90–1.10), p = 0.933 | |
| Total selenium (mcg/day) | ||||||||
| Q1 | <59.57 | 45.411 | 24,621 | 416 | 0.042 (0.038–0.046) | Reference group | Reference group | |
| Q2 | ≥59.57 to <81.65 | 70.528 | 24,612 | 383 | 0.038 (0.035–0.042) | 0.93 (0.81–1.07), p = 0.336 | 0.88 (0.76–1.02), p = 0.079 | |
| Q3 | ≥81.65 to <110.78 | 94.956 | 24,613 | 401 | 0.040 (0.036–0.044) | 1.00 (0.87–1.15), p = 0.972 | 0.86 (0.73–1.00), p = 0.054 | |
| Q4 | ≥110.78 | 147.879 | 24,605 | 442 | 0.044 (0.040–0.049) | 1.16 (1.01–1.33), p = 0.031 | 0.84 (0.68–1.03), p = 0.093 | |
| P for linear trend | P for trend = 0.0086 | P for trend = 0.1306 | ||||||
| Dietary selenium | ||||||||
| Q1 | <58.33 | 44.648 | 24,624 | 416 | 0.042 (0.038–0.046) | Reference group | Reference group | |
| Q2 | ≥58.33 to <79.27 | 68.767 | 24,611 | 379 | 0.038 (0.034–0.042) | 0.92 (0.80–1.06), p = 0.263 | 0.86 (0.74–0.99), p = 0.037 | |
| Q3 | ≥79.27 to <106.76 | 91.811 | 24,605 | 414 | 0.041 (0.038–0.046) | 1.04 (0.91–1.19), p = 0.588 | 0.88 (0.75–1.03), p = 0.105 | |
| Q4 | ≥106.76 | 142.739 | 24,611 | 433 | 0.043 (0.039–0.048) | 1.14 (1.00–1.30), p = 0.059 | 0.75 (0.61–0.93), p = 0.010 | |
| P for linear trend | P for trend = 0.0139 | P for trend = 0.0187 | ||||||
| Selenium supplements | ||||||||
| No | 0 | 0 | 92,249 | 1550 | 0.155 (0.147–0.163) | Reference group | Reference group | |
| Yes | ≤42.86 | 42.86 | 6202 | 92 | 0.009 (0.008–0.011) | 0.88 (0.71–1.08), p = 0.219 | 0.89 (0.72–1.09), p = 0.263 | |
| Total zinc (mg/day) | ||||||||
| Q1 | <9.95 | 7.012 | 24,616 | 446 | 0.045 (0.041–0.049) | Reference group | Reference group | |
| Q2 | ≥9.95 to <19.84 | 14.354 | 24,632 | 397 | 0.040 (0.036–0.044) | 0.93 (0.81–1.06), p = 0.265 | 0.89 (0.77–1.02), p = 0.098 | |
| Q3 | ≥19.84 to <25.77 | 22.811 | 24,602 | 395 | 0.040 (0.036–0.044) | 0.90 (0.78–1.03), p = 0.113 | 0.94 (0.82–1.08), p = 0.399 | |
| Q4 | ≥25.77 | 34.401 | 24,601 | 404 | 0.040 (0.037–0.045) | 0.92 (0.81–1.06), p = 0.243 | 0.86 (0.74–1.00), p = 0.053 | |
| P for linear trend | P for trend = 0.219 | P for trend = 0.1519 | ||||||
| Dietary zinc | ||||||||
| Q1 | <7.00 | 5.381 | 24,626 | 413 | 0.041 (0.038–0.045) | Reference group | Reference group | |
| Q2 | ≥7.00 to <9.48 | 8.234 | 24,688 | 398 | 0.040 (0.036–0.044) | 0.97 (0.84–1.11), p = 0.650 | 0.94 (0.81–1.08), p = 0.367 | |
| Q3 | ≥9.48 to <12.90 | 11.016 | 24,528 | 406 | 0.041 (0.037–0.045) | 1.02 (0.89–1.17), p = 0.812 | 0.93 (0.79–1.09), p = 0.351 | |
| Q4 | ≥12.90 | 17.816 | 24,609 | 425 | 0.042 (0.039–0.047) | 1.09 (0.95–1.25), p = 0.204 | 0.82 (0.67–0.99), p = 0.041 | |
| P for linear trend | P for trend = 0.119 | P for trend = 0.0430 | ||||||
| Zinc supplements | ||||||||
| No | 0 | 0 | 42,257 | 765 | 0.076 (0.071–0.082) | Reference group | Reference group | |
| Yes | ≤ 36.43 | 15.825 | 56,194 | 877 | 0.088 (0.082–0.094) | 0.87 (0.79–0.96), p = 0.004 | 0.96 (0.87–1.06), p = 0.460 | |
| Dietary lycopene (mg/day) | ||||||||
| Q1 | <3108.61 | 2170.982 | 24,613 | 469 | 0.047 (0.043–0.051) | Reference group | Reference group | |
| Q2 | ≥3108.61 to <4761.09 | 3908.915 | 24,613 | 390 | 0.039 (0.035–0.043) | 0.85 (0.75–0.98), p = 0.0220 | 0.87 (0.76–0.99), p = 0.0408 | |
| Q3 | ≥4761.09 to <7491.66 | 5948.377 | 24,612 | 373 | 0.037 (0.034–0.041) | 0.85 (0.74–0.97), p = 0.0175 | 0.84 (0.73–0.97), p = 0.0157 | |
| Q4 | ≥7491.66 | 13,823.78 | 24,613 | 410 | 0.041 (0.037–0.045) | 0.96 (0.84–1.10), p = 0.5347 | 0.83 (0.71–0.96), p = 0.0144 | |
| P for linear trend | P for trend = 0.977 | P for trend = 0.0437 | ||||||
| Dietary lutein and zeaxanthin (mg/day) | ||||||||
| Q1 | <1246.48 | 897.2885 | 24,613 | 511 | 0.051 (0.047–0.056) | Reference group | Reference group | |
| Q2 | ≥1246.48 to <1906.74 | 1563.793 | 24,613 | 428 | 0.043 (0.039–0.047) | 0.83 (0.73–0.94), p = 0.0042 | 0.95 (0.83–1.08), p = 0.4021 | |
| Q3 | ≥1906.74 to <3002.04 | 2379.873 | 24,612 | 364 | 0.036 (0.033–0.040) | 0.71 (0.62–0.81), p = 4.47 × 10⁻⁷ | 0.83 (0.72–0.96), p = 0.0112 | |
| Q4 | ≥3002.04 | 5674.224 | 24,613 | 339 | 0.034 (0.030–0.038) | 0.66 (0.57–0.76), p = 2.84 × 10⁻⁹ | 0.78 (0.67–0.91), p = 0.0015 | |
| P for linear trend | P for trend = 1.02 × 10⁻⁸ | P for trend = 0.0011 | ||||||
| Dietary α-carotene (mg/day) | ||||||||
| Q1 | <295.22 | 193.6037 | 24,615 | 532 | 0.053 (0.049–0.058) | Reference group | Reference group | |
| Q2 | ≥295.22 to <545.47 | 412.4326 | 24,612 | 460 | 0.046 (0.042–0.050) | 0.84 (0.74–0.95), p = 0.0059 | 0.91 (0.80–1.03), p = 0.1321 | |
| Q3 | ≥545.47 to <995.90 | 745.5172 | 24,611 | 365 | 0.037 (0.033–0.040) | 0.64 (0.56–0.74), p = 9.46 × 10⁻¹¹ | 0.76 (0.66–0.87), p = 9.23 × 10⁻⁵ | |
| Q4 | ≥995.90 | 2010.004 | 24,613 | 285 | 0.029 (0.025–0.032) | 0.50 (0.44–0.58), p < 2 × 10⁻¹⁶ | 0.64 (0.55–0.74), p = 1.12 × 10⁻⁸ | |
| P for linear trend | P for trend < 2 × 10⁻¹⁶ | P for trend = 4.55 × 10⁻⁹ | ||||||
| fCADI in Quartile | Range | Cohort | Cases | Incidence Rate (95% CI) a | Age-Adjusted HR (95%CI), p-Value | Multi-Adjusted HR (95% CI), p-Value |
|---|---|---|---|---|---|---|
| Overall | ||||||
| Q1 | <−3.3440 | 24,613 | 459 | 0.046 (0.042–0.050) | Reference group | Reference group |
| Q2 | ≥−3.3440 to <−0.8054 | 24,613 | 417 | 0.042 (0.038–0.046) | 0.90 (0.79–1.03), p = 0.127 | 0.85 (0.74–0.97), p = 0.019 |
| Q3 | ≥−0.8054 to <2.4260 | 24,613 | 369 | 0.037 (0.033–0.041) | 0.80 (0.70–0.92), p = 0.002 | 0.70 (0.60–0.82), p = 1.32 × 10⁻⁵ |
| Q4 | ≥2.4260 | 24,612 | 397 | 0.040 (0.036–0.044) | 0.89 (0.78–1.02), p = 0.084 | 0.64 (0.52–0.79), p = 2.78 × 10⁻⁵ |
| P for linear trend | P for trend = 0.062 | P for trend < 0.001 |
Disclaimer/Publisher’s Note: The statements, opinions and data contained in all publications are solely those of the individual author(s) and contributor(s) and not of MDPI and/or the editor(s). MDPI and/or the editor(s) disclaim responsibility for any injury to people or property resulting from any ideas, methods, instructions or products referred to in the content. |
© 2023 by the authors. Licensee MDPI, Basel, Switzerland. This article is an open access article distributed under the terms and conditions of the Creative Commons Attribution (CC BY) license (https://creativecommons.org/licenses/by/4.0/).
Share and Cite
Yang, J.; Qian, S.; Na, X.; Zhao, A. Association between Dietary and Supplemental Antioxidants Intake and Lung Cancer Risk: Evidence from a Cancer Screening Trial. Antioxidants 2023, 12, 338. https://doi.org/10.3390/antiox12020338
Yang J, Qian S, Na X, Zhao A. Association between Dietary and Supplemental Antioxidants Intake and Lung Cancer Risk: Evidence from a Cancer Screening Trial. Antioxidants. 2023; 12(2):338. https://doi.org/10.3390/antiox12020338
Chicago/Turabian StyleYang, Jiaqi, Sicheng Qian, Xiaona Na, and Ai Zhao. 2023. "Association between Dietary and Supplemental Antioxidants Intake and Lung Cancer Risk: Evidence from a Cancer Screening Trial" Antioxidants 12, no. 2: 338. https://doi.org/10.3390/antiox12020338