Article

Mitochondrial HSC70-1 Regulates Polar Auxin Transport through ROS Homeostasis in Arabidopsis Roots

1
Ministry of Education Key Laboratory of Molecular and Cellular Biology, Hebei Collaboration Innovation Center for Cell Signaling and Environmental Adaptation, Hebei Key Laboratory of Molecular and Cellular Biology, College of Life Sciences, Hebei Normal University, Shijiazhuang 050024, China
2
National Key Laboratory of Plant Molecular Genetics, CAS Center for Excellence in Molecular Plant Sciences, Shanghai Institute of Plant Physiology and Ecology, Chinese Academy of Sciences, Shanghai 200032, China
3
College of Life Sciences, Hengshui University, Hengshui 053000, China
*
Authors to whom correspondence should be addressed.
These authors contributed equally to this work.
Antioxidants 2022, 11(10), 2035; https://doi.org/10.3390/antiox11102035
Submission received: 13 September 2022 / Revised: 8 October 2022 / Accepted: 13 October 2022 / Published: 15 October 2022
(This article belongs to the Special Issue Redox Biology in Plant Growth, Defence and Metabolism)

Abstract

:
Arabidopsis mitochondrial-localized heat shock protein 70-1 (mtHSC70-1) modulates vegetative growth by assisting mitochondrial complex IV assembly and maintaining reactive oxygen species (ROS) homeostasis. In addition, mtHSC70-1 affects embryo development, and this effect is mediated by auxin. However, whether mtHSC70-1 regulates vegetative growth through auxin and knowledge of the link between ROS homeostasis and auxin distribution remain unclear. Here, we found that mtHSC70-1 knockout seedlings (mthsc70-1a) displayed shortened roots, decreased fresh root weight and lateral root number, increased root width and abnormal root morphology. The introduction of the mtHSC70-1 gene into mthsc70-1a restored the growth and development of roots to the level of the wild type. However, sugar and auxin supplementation could not help the mutant roots restore to normal. Moreover, mthsc70-1a seedlings showed a decrease in meristem length and activity, auxin transport carrier (PINs and AUX1) and auxin abundances in root tips. The application of exogenous reducing agents upregulated the levels of PINs in the mutant roots. The introduction of antioxidant enzyme genes (MSD1 or CAT1) into the mthsc70-1a mutant rescued the PIN and local auxin abundances and root growth and development. Taken together, our data suggest that mtHSC70-1 regulates polar auxin transport through ROS homeostasis in Arabidopsis roots.

1. Introduction

Reactive oxygen species (ROS), including superoxide anions (O2) and hydrogen peroxide (H2O2), have received increasing attention as novel signal molecules that are involved in growth, differentiation, cell death and response to environmental stresses [1,2,3]. At present, it is clearly realized that there must be coordinated functioning of the signaling networks that govern ROS responses [4]. Under a physiological state, ROS levels are in dynamic balance, and ROS homeostasis is achieved through its production and scavenging [3,5,6]. Plants possess many ROS-scavenging enzymes, such as ascorbate peroxidases (APXs), catalases (CATs), peroxidases (POXs), superoxide dismutases (SODs) and some small molecular antioxidants, such as ascorbate (ASC, vitamin C), tocopherol (vitamin E), beta-carotene and glutathione (GSH) [6]. However, persistently high ROS levels that exceed the antioxidant capacities of cells are toxic and can cause oxidative damage [5,7]. It is well established that supraphysiological concentrations of ROS react non-specifically with proteins, lipids, nucleic acids and carbohydrates and generate other reactive species with potentially toxic consequences [8,9]. Moreover, high levels of ROS inhibit cell elongation, likely by stiffening cell walls [10]. Another possibility is that high levels of ROS inhibit plant growth and development by downregulating the expression levels of auxin-related genes [11,12,13,14,15,16,17]. Analysis of auxin response gene expression indicates that the levels of several auxin receptors and Aux/IAA transcriptional repressors decrease with the increase of extracellular ROS [14].
The phytohormone auxin (indole-3-acetic acid, IAA) is considered a general coordinator of growth and development and is used throughout the life cycle of plants to mediate communication between cells and tissues [18]. Auxin is distributed in plant bodies by two different but interrelated transport systems: (1) a rapid, undirected stream in the phloem and (2) slow and directed intercellular polar auxin transport (PAT) [19]. The PAT system distributes auxin in a very accurate manner and is mediated by auxin influx and efflux carriers. AUXIN1/LIKE-AUX1 (AUX1/LAX) family members are capital auxin influx carriers. PINFORMED (PIN) family members are principal auxin efflux carriers [20,21]. There are eight PIN genes in the Arabidopsis thaliana genome, which can be divided into two subfamilies: ‘long’ PINs and ‘short’ PINs. The long PINs include PIN1-PIN4, PIN6 and PIN7, which are localized in the plasma membranes. The short PINs include AtPIN5 and AtPIN8, which are located in the endoplasmic reticulum [22]. The functions of most long PINs have been studied. They are located polarly on different sides of various types of cells [23]. Their polarity determines the direction of intercellular free IAA flow [22]. PAT is necessary for the establishment of embryonic apical-basal polarity, organogenesis, organ positioning, root patterning and hypocotyl elongation [24,25,26]. PIN mutants display defective developmental phenotypes. For example, pin1 mutants can have fused cotyledons, three cotyledons, pin-like inflorescence and abnormal flowers [27], pin2 mutants show non-gravitropic root growth [28], triple-mutant pin1,3,4 seedlings display fused, cup-shaped cotyledons and multiple mutant pin1,3,4,7 embryos display a no apical-basal patterning [29,30]. Carrier-mediated PAT can be regulated at multiple levels, such as mRNA transcription, subcellular distribution, transport activity and protein degradation [22].
All organisms respond to high temperature stress by producing heat-shock proteins (HSPs). HSP70s are the most abundant type of HSP, which form pivotal links in the molecular chaperone network that regulates every aspect of cellular protein homeostasis, such as nascent protein folding, protein translocation and assembly, refolding of stress-denatured proteins and degradation of toxic protein aggregates [31,32,33]. A. thaliana contains 14 HSP70 genes, which are highly conserved and localized in distinct subcellular compartments, including the cytosol, mitochondria, plastids, endoplasmic reticulum (ER) and nucleus [34,35,36]. They participate in regulating numerous biological processes as molecular chaperons [37,38,39,40,41,42,43,44]. The molecular and physiological functions of mitochondrial HSP70s (mtHSC70s) have been reported in yeast, animals and plants. In plants, the overexpression of mtHSC70 inhibits heat stress and H2O2 stress-induced programmed cell death in Oryza sativa protoplasts [45]. A. thaliana mtHSC70-1 has weak ATPase activity, which is stimulated by mitochondrial J-domain protein AtDjB1 [46]. Wei et al. [47] and Zhai et al. [48] reported that A. thaliana mtHSC70-1 knockout leads to severe growth inhibition and an increase in mitochondrial ROS levels during the vegetative growth of plants and that mtHSC70-1 is directly involved in respiratory chain complex IV/cytochrome c oxidase (COX) assembly and the establishment of COX-dependent respiration. Li et al. [49] reported that A. thaliana mtHSC70-1 knockout impairs embryo development, and this effect is mediated by auxin. Moreover, the loss of function of mtHSC70-1 induces mitochondrial retrograde signaling, which reduces the expression levels of auxin biosynthesis and PAT genes, resulting in abnormal auxin gradients in the embryo and defective embryo development [49]. However, the role of mtHSC70-1 in regulating PAT during the vegetative growth of plants remains unclear. Here, we investigated the effects of mtHSC70-1 knockout on PAT in A. thaliana roots and the role of ROS homeostasis in the maintenance of PAT.

2. Materials and Methods

2.1. Plant Materials and Growth Conditions

Arabidopsis thaliana (ecotype Columbia-0) seeds were sterilized with 75% ethanol and sown in 0.5 × Murashige–Skoog (MS) medium [50] including 1.0% (w/v) sucrose and 0.8% (w/v) agar. The sterilized seeds were kept at 4 °C for 3 d and then cultured in a growth chamber at 22 °C with a 16 h/8 h photoperiod and a light intensity of approximately 100 μmol m−2 s−1. After two weeks of growth on MS medium, the seedlings were transplanted into the soil for cultivation in a greenhouse under the same conditions. The cultivated plants were watered once a week.
Col/PIN:PIN-GFP (the PIN represents PIN1, PIN2, PIN3 or PIN7), Col/AUX1:AUX1-YFP, Col/DR5:GFP and Col/DR5:GUS seeds were gifts from Prof. Zhenbiao Yang. The seeds of two putative T-DNA insertional mutant lines for mtHSC70-1 (At4g37910), mthsc70-1a (SALK_081383) and mthsc70-1b (SALK_081385) were obtained from the Arabidopsis Biological Resource Center (ABRC, Columbus, OH, USA). The homozygous mthsc70-1a and mthsc70-1b mutants and transgenic plants mthsc70-1a/PIN:PIN-GFP (the PIN represents PIN1, PIN2, PIN3 or PIN7), mthsc70-1a/AUX1:AUX1-YFP, mthsc70-1a/DR5:GFP, mthsc70-1a/DR5:GUS, R2/3 (two mthsc70-1a/mtHSC70-1:mtHSC70-1 lines), MSD1-R2/3 (two mthsc70-1a/mtHSC70-1:MSD1 lines) and CAT1-R2/3 (two mthsc70-1a/mtHSC70-1:CAT1 lines) were generated in our previous study [47].

2.2. Hybridization of Plants with Different Genotypes

The emasculated flowers from Col plants harboring PIN:PIN-GFP (the PIN represents PIN1, PIN2, PIN3 or PIN7), AUX1:AUX1-YFP or DR5:GFP construct were crossed with pollen from mthsc70-1a plants, which generated mthsc70-1a/PIN1-GFP, mthsc70-1a/PIN2-GFP, mthsc70-1a/PIN3-GFP, mthsc70-1a/PIN7-GFP, mthsc70-1a/AUX1-YFP and mthsc70-1a/DR5:GFP plants. Identification of the homozygous mthsc70-1a background was performed by PCR using insertional site-specific primers for mthsc70-1a and a T-DNA left border primer, LBb1.3 (Table S1). Identification of the GFP or YFP background was performed by observing the GFP or YFP fluorescence; those lines in which all seedlings showed fluorescence were used for the experiments. GFP or YFP fluorescence was observed using a fluorescence microscope (ECLIPSE 80i, Nikon, Japan).
To generate mthsc70-1a/PIN:PIN-GFP (the PIN represents PIN1, PIN2, PIN3 or PIN7) or mthsc70-1a/DR5:GFP plants harboring the mtHSC70-1, MSD1 or CAT1 gene, the emasculated flowers from R2 plants (a mthsc70-1a/mtHSC70-1:mtHSC70-1 line), MSD1-R2 plants (a mthsc70-1a/mtHSC70-1:MSD1 line) or CAT1-R2 plants (a mthsc70-1a/mtHSC70-1:CAT1 line) were crossed with pollen from mthsc70-1a/PIN:PIN-GFP plants or mthsc70-1a/DR5:GFP plants. Identification of the homozygous mtHSC70-1, MSD1 or CAT1 background was performed by a hygromycin resistance screen. Identification of the PIN-GFP (or DR5:GFP) background was performed by observing the GFP fluorescence; those lines in which all seedlings showed fluorescence were used for the experiments. GFP fluorescence was observed using a fluorescence microscope (ECLIPSE 80i, Nikon, Japan).
Genotypes of the transgenic lines used in this study are indicated in Table S2.

2.3. Methods of EdU Staining, FM4-64 Staining and GUS Staining

Ethynyl-29-deoxyuridine (EdU) staining was conducted as described by Xiong et al. [51] using an EdU detection cocktail (Life Technologies, Carlsbad, CA, USA). In brief, the roots of 4 days old seedlings grown at 22 °C were incubated in 1 μM EdU for 30 min and then fixed in phosphate-buffered saline (PBS, pH 7.2) including 4 % (w/v) formaldehyde and 0.1% Triton X-100 for 30 min, which was followed by 3 washes with PBS. The fixer was incubated in an EdU detection cocktail for 30 min in the dark and then washed 3 times with PBS.
FM4-64 staining was conducted as described by Gao et al. [52]. In brief, the roots of 4 days old seedlings were incubated in a staining solution containing 5 μM of the plasma membrane marker FM4-64 (Life Technologies, Carlsbad, CA, USA) for 15 min in the dark, which was followed by washing with PBS (pH 7.2).
Analysis for β-glucuronidase (GUS) activity was performed as described by Wei et al. [47]. In brief, seedlings were incubated in GUS histochemical dye liquor [2 mM X-Gluc (Sigma, St Louis, MO, USA) in 50 mM Na2HPO4/NaH2PO4 at pH 7.2, 2 mM K3Fe(CN)6, 2 mM K4Fe(CN)6, 10 mM EDTA and 0.2% (v/v) Triton X-100] at 22 °C for 4 h, which was followed by a wash with 70% ethanol.

2.4. Observation or Quantification of the Fluorescence Intensity or Distribution in the Stained or Transgenic Roots

The stained or transgenic samples were observed using a laser scanning confocal microscopy (LSCM) (FV3000, Olympus, Tokyo, Japan) with excitation/emission wavelengths of 561/572 nm for FM4-64, 488/510 nm for GFP and EdU and 510/527 nm for YFP, and photographed in their largest z planes. The same parameter settings were used for all genotypic samples in the same experiment. For GUS activity, the stained samples were observed using a stereomicroscope (SZX2-ILLT, Olympus, Tokyo, Japan). Fluorescence in the area of the root shown in the figure was visualized with ImageJ 1.42q software (National Institutes of Health, Bethesda, MD, USA).

2.5. Real-Time Quantitative RT–PCR

Ten days old A. thaliana seedlings grown at 22 °C and TriPure Reagent (Aidlab Biotechnologies Co., Ltd., Beijing, China) were used for the isolation of total RNA. Real-time quantitative RT–PCR (Q–PCR) was conducted following the method of Zhang et al. [53]. Primer Express software (Applied Biosystems, Carlsbad, CA, USA) was used to design Q-PCR primers (Table S1). PCR was conducted using an ABI Prism 7000 Sequence Detection System (Applied Biosystems, Carlsbad, CA, USA). The expression levels of genes tested in the WT or control plants were set to 1. ACTIN1 gene was used as the internal control.

2.6. Statistical Analysis

STATISTICA 6.0 software (StatSoft, Inc., Tulsa, OK, USA) was used for statistical analyses. Difference significance was tested at p < 0.05 by ANOVA with Tukey’s HSD test or Student’s t-test.

2.7. Accession Numbers

mtHSC70-1, At4G37910; MSD1, At3G10920; CAT1, At1G20630; PIN1, At1G73590; PIN2, At5G57090; PIN3, At1G70940; PIN7, At1G23080; AUX1, At2G38120; mthsc70-1a, SALK_081383; mthsc70-1b, SALK_081385.

3. Results

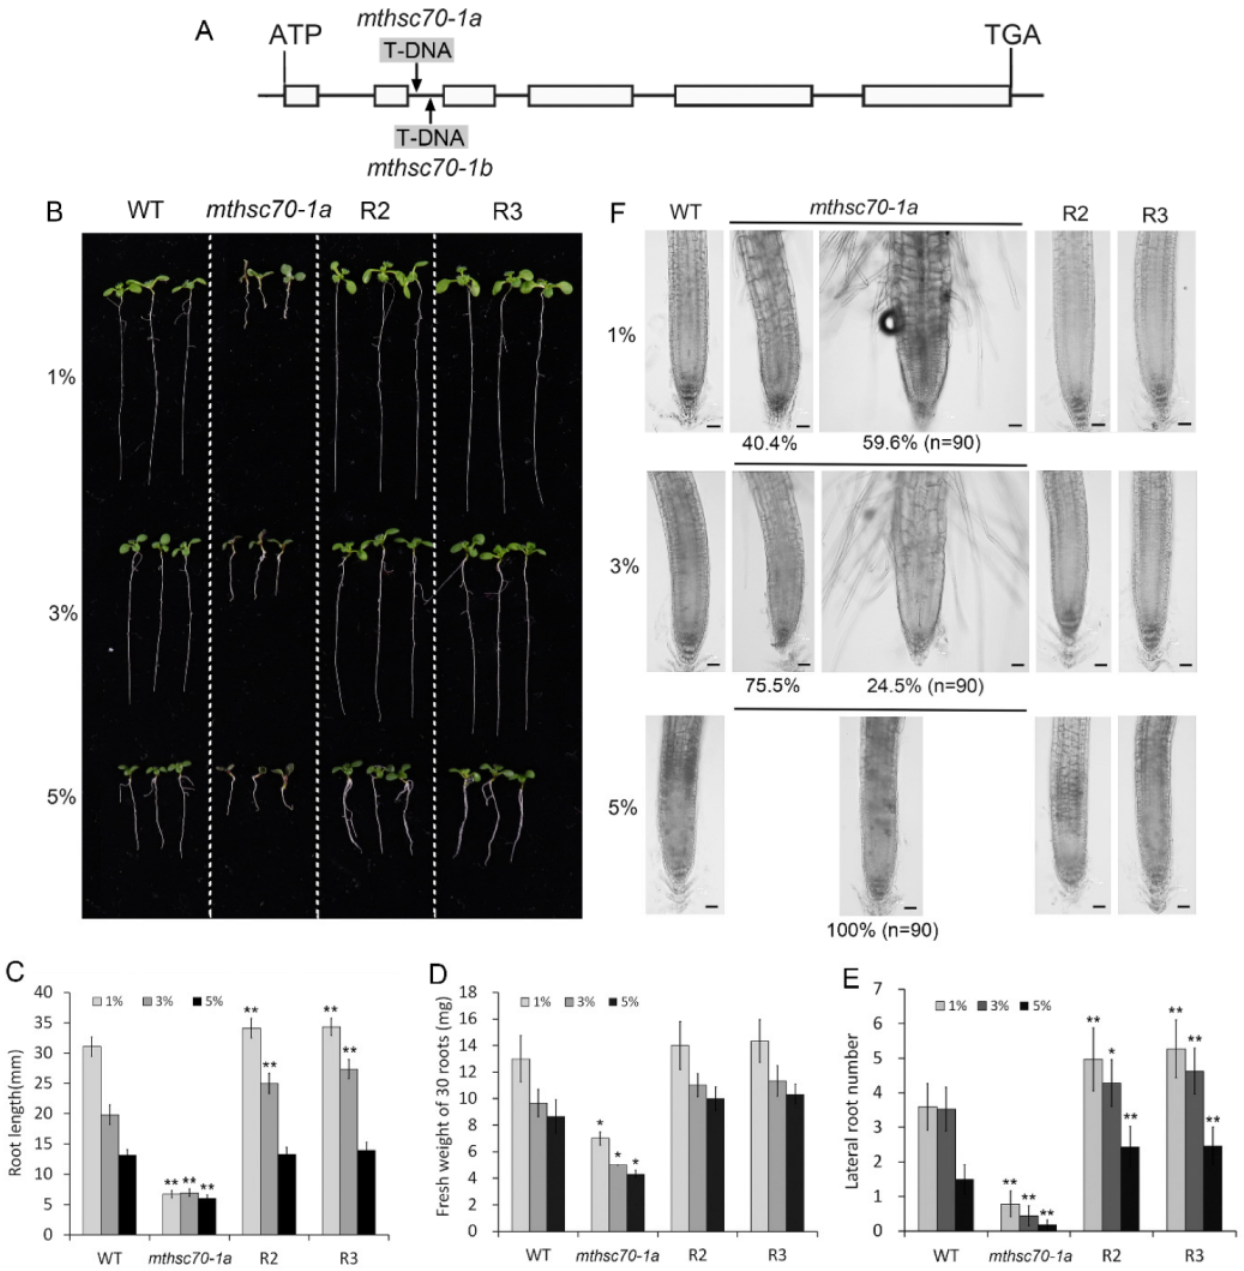
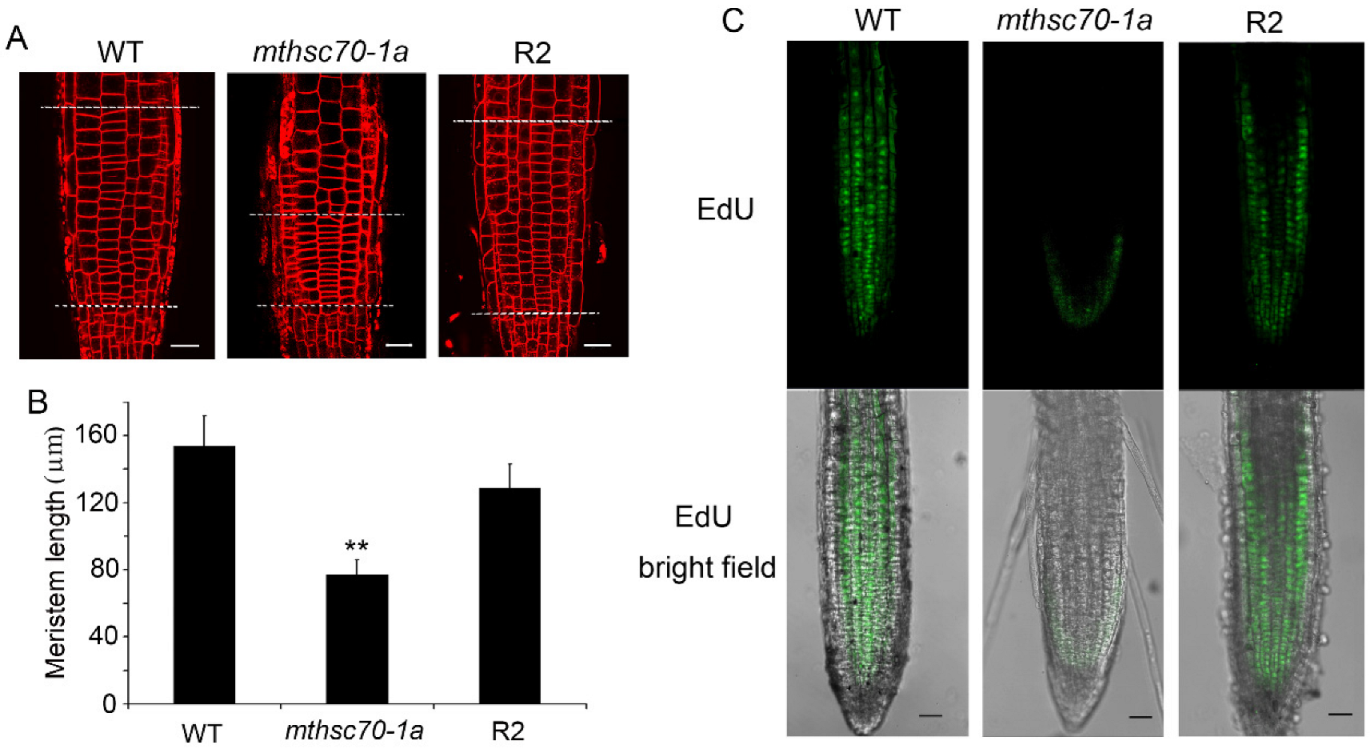
3.1. Role of Glucose in Improving the Growth and Development of mtHSC70-1 Mutant Roots

A. thaliana mtHSC70-1 mutants exhibit higher total respiration, AOX respiratory pathway and ATP level, lower COX-dependent respiratory pathway and shorter roots compared to wild-type plants [47]. Glucose is the original substrate of the glycolysis pathway related to mitochondrial respiration and energy metabolism, so it can promote respiration and energy production. To confirm that the defects of mtHSC70-1 mutant roots are not due to energy deficiency, we needed to know whether sugar supplementation may rescue the growth and development of the mutant roots. To clarify this topic, we compared the phenotypes of roots of WT, mtHSC70-1 mutant (mthsc70-1a, Figure 1A) and two complementary mthsc70-1a lines (R2 and R3) grown on 0.5 × MS medium supplemented with different concentrations of glucose. In MS medium containing 1% glucose, the primary root of mthsc70-1a was 78.5% shorter than that of wild-type seedlings, with a 46% reduction in fresh weight and fewer lateral roots (Figure 1B–E). Moreover, 59.6% of mthsc70-1a roots showed abnormal morphology, such as longer root hairs near the root tips, increased root width (>140 µm), shorter meristem length and larger and disordered cell arrangement in the elongation zone (Figure 1F; Figure S1). Two complementary mthsc70-1a lines showed phenotypes similar to those of wild-type roots (Figure 1B–F), indicating the roles of mtHSC70-1 in regulating root growth and development. Compared with 1% glucose, 3% and 5% glucose reduced primary root length, fresh root weight and lateral root number to some extent in all analyzed genotypic seedlings; however, they did not recover the root length, fresh weight and lateral root number of mthsc70-1a to WT level (Figure 1B–E). In contrast, 3% glucose reduced the percentage of roots with abnormal morphology (24.5%); 5% glucose completely inhibited the emergence of roots with abnormal morphology (Figure 1F). These results indicate that sugar supplementation could improve the morphogenesis of the mutant roots but had no positive effect on the root growth of the mutants.

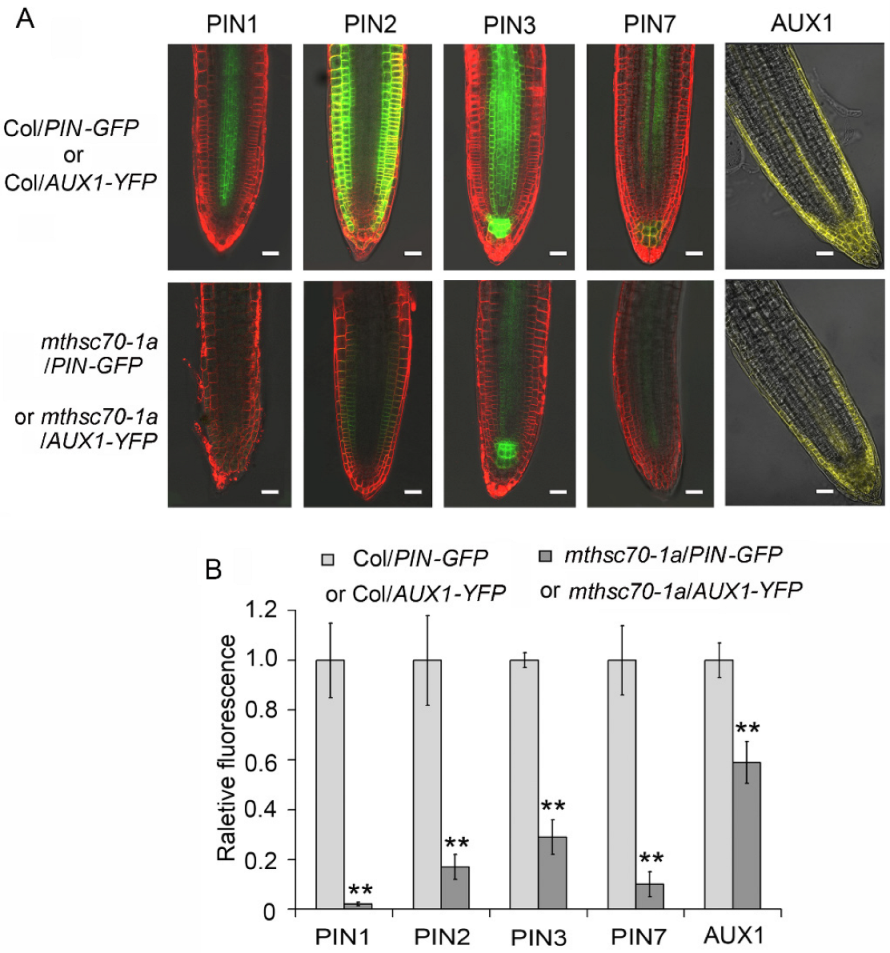
3.2. Knockout of the mtHSC70-1 Gene Interferes with Polar Auxin Transport in Roots

Auxin is a major regulator of root system architecture and is known to regulate meristematic activities [11,12]. To clarify whether mtHSC70-1 affects root architecture by the auxin pathway, we compared the differences in meristem zone lengths and mitosis activities among WT, mthsc70-1a and R2 seedlings. Using FM4-64 (a plasma membrane marker dye) staining to highlight the cell boundaries, we found a pronounced decrease in the length of the meristem zone in the mthsc70-1a roots compared to the WT and R2 roots (Figure 2A,B; Figure S1). Using the thymidine analogue EdU for in situ detection of cell cycle S-phase entry, we demonstrated that mtHSC70-1 knockout greatly reduced root meristem activity (Figure 2C). These results suggest lower cell division rates in the meristems of mthsc70-1a roots and imply that the auxin abundances in mthsc70-1a root tips might be lower than those of WT and R2 root tips. To confirm this, we crossed the mthsc70-1a plants with Col-0 plants harboring DR5:GFP or DR5:GUS (the synthetic auxin reporter) [24] and obtained homozygous mthsc70-1a/DR5:GFP plants or mthsc70-1a/DR5:GUS plants. The intensity of GFP fluorescence or GUS coloration was used to indicate the local auxin abundances in roots. Five days old Col/DR5:GUS seedlings exhibited a strong blue coloration in the quiescent center cells, columella cells and stele cells of the root tips (Figure 3A,B). However, in 5 days old mthsc70-1a/DR5:GUS seedlings, the blue coloration was restricted to the root/hypocotyl transition zone, and no blue coloration was observed in the root tips (Figure 3C–E). Five days old Col/DR5:GFP seedlings showed bright GFP fluorescence in the quiescent center cells, columella cells and stele cells (Figure 3F). However, the GFP fluorescence was markedly weaker in the quiescent center cells and columella cells of mthsc70-1a/DR5:GFP roots (Figure 3G,H). The results indicate that mtHSC70-1 knockout leads to decreased auxin abundance in root tips.
We wanted to know whether the defects of mtHSC70-1 mutant roots are due to the reduction of auxin synthesis or the blockage of PAT. To clarify this topic, we needed to investigate the effects of auxin supplementation or PAT inhibitor treatment on root growth and auxin distribution. Firstly, we compared the root length of WT and mthsc70-1a grown on 0.5 × MS medium, supplemented with different concentrations of 1-naphthlacetic acid (NAA), a synthetic auxin. The results showed that the treatment with exogenous NAA did not rescue the growth of the mutant roots (Figure S2), implying that the root growth defects of mthsc70-1a may not be caused by the reduction of auxin synthesis. Subsequently, the effects of auxin transport inhibitor N-1-naphthylphthalamic acid (NPA) on root growth and auxin distribution were investigated. The WT, mthsc70-1a, R2 and R3 seeds were germinated and cultured on 0.5 × MS medium supplemented with or without 4 μM NPA. After 10 d of treatment, the root length and lateral root number of WT, R2 and R3 seedlings were significantly decreased compared with those of untreated seedlings, mimicking those of mthsc70-1a seedlings (Figure 4A–C), implying that the defects of mthsc70-1a in root elongation and lateral root emergence may be due to the blockage of PAT. However, treatment with NPA had no significant effect on fresh root weight in all detected genotypic seedlings (Figure 4D), implying a weaker role of PAT in substance accumulation. Further, the effect of NPA on auxin response was investigated using transgenic plants expressing DR5:GFP. After 5 d of NPA treatment, the distribution of GFP fluorescence in root tips was significantly different from those of untreated seedlings for Col/DR5:GFP, mthsc70-1a/DR5:GFP and R2/DR5:GFP plants. After NPA treatment, GFP fluorescence was accumulated in the quiescent center zone and reduced markedly in columella cells and stele cells (Figure 4E), indicating that the auxin output from the quiescent center is affected. In addition, we noticed that NPA treatment only caused the change of GFP fluorescence distribution in root tips, and did not obviously reduce the fluorescence intensity. However, the knockout of mtHSC70-1 not only changed the GFP fluorescence distribution in root tips, but also significantly reduced the fluorescence intensity. The above results suggest that mtHSC70-1 knockout is likely to interfere with PAT in the roots.
To confirm the role of mtHSC70-1 in regulating PAT, the abundances of several genes responsible for PAT in root tips were detected, including four PIN genes and an AUX1 gene. The Col and mthsc70-1a plants expressing PIN1:PIN1-GFP, PIN2:PIN2-GFP, PIN3:PIN3-GFP, PIN7:PIN7-GFP or AUX1:AUX1-YFP (Col/PIN1-, 2-, 3- or 7-GFP, Col/AUX1-YFP, mthsc70-1a/PIN1-, 2-, 3- or 7-GFP, mthsc70-1a/AUX1-YFP) were subjected to visualization of the PIN or AUX1 protein levels (as indicated by GFP or YFP fluorescence). The four mthsc70-1a/PIN-GFP plants and mthsc70-1a/AUX1-YFP plants grown at 22 °C for 5 d showed pronounced decreases in fluorescence intensity compared to the corresponding Col/PIN-GFP (or Col/AUX1-YFP) plants (Figure 5). These results suggest that mtHSC70-1 plays a positive role in regulating the protein levels of PIN1, PIN2, PIN3, PIN7 or AUX1 in root tips and that mtHSC70-1 probably affects root development by regulating PAT.

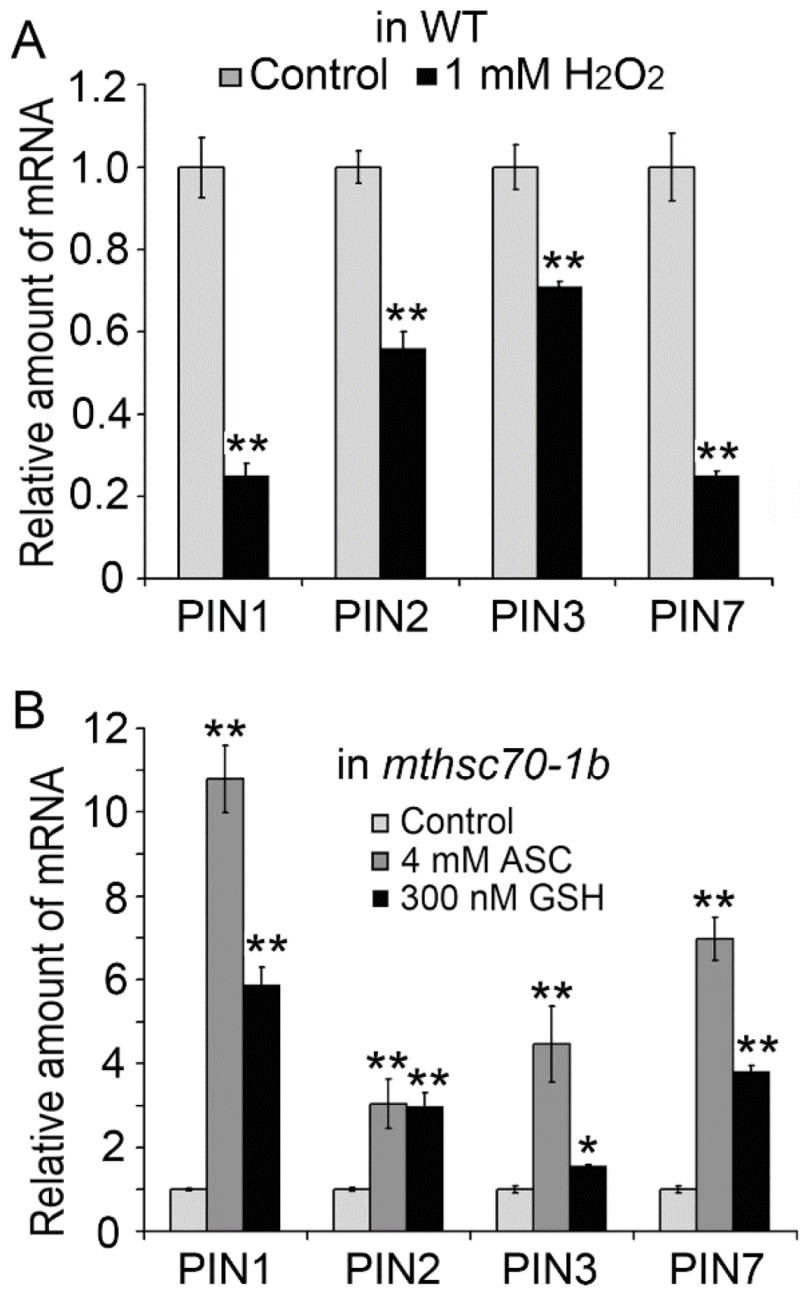
3.3. Role of Exogenous Antioxidants in Restoring Polar Auxin Transport in mtHSC70-1 Mutant Roots

Mitochondria is a major site for redox reactions. To understand the contribution of the cellular redox state on the defected PAT in the mtHSC70-1 mutant, we investigated the effects of exogenous redox reagents on the PIN and auxin levels in WT and mtHSC70-1 mutants. H2O2 and ASC/GSH were used to increase or decrease the ROS levels in cells. After treatment with 1 mM H2O2, the WT seedlings displayed a strong downregulation in the expressions of the PIN1, PIN2, PIN3 and PIN7 genes (Figure 6A); however, the mtHSC70-1 mutant seedlings did not show an obvious difference in PIN expression levels from the untreated seedlings (Figure S3A). After treatment with 4 mM ASC or 300 nM GSH, the mtHSC70-1 mutant seedlings showed a marked upregulation in the expressions of the PIN1, PIN2, PIN3 and PIN7 genes (Figure 6B); however, the WT seedlings did not show marked difference in PIN expression levels from the untreated seedlings (Figure S3B). Data obtained from the root tips of Col (or mthsc70-1a) plants harboring PIN:PIN-GFP confirmed the above results. After treatment with 1 mM H2O2, the Col/PIN1-, 2-, 3- or 7-GFP seedlings exhibited a marked decrease in PIN protein abundance in the root tips compared to the untreated seedlings (Figure 7A,B); however, mthsc70-1a/PIN1-, 2-, 3- or 7-GFP seedlings did not show an obvious difference in PIN protein abundance in the root tips from the untreated seedlings (Figure S4A,B). After treatment with 4 mM ASC or 300 nM GSH, the mthsc70-1a/PIN1-, 2-, 3- or 7-GFP seedlings showed an increase in PIN protein abundance in the root tips compared to the untreated seedlings (Figure 7C,D); however, the Col/PIN1-, 2-, 3- or 7-GFP seedlings did not show marked difference in PIN protein abundance in the root tips from the untreated seedlings (Figure S4C,D). The above results indicated that an imbalance towards a redox state might inhibit the expression of PIN genes and decrease the levels of PIN proteins in seedlings. Then, H2O2 or GSH were applied to Col or mthsc70-1a seedlings harboring DR5:GFP to clarify their effects on auxin response. After the Col/DR5:GFP seedlings were treated with 1 mM H2O2, the GFP fluorescence intensities in the root tips were not an obvious difference from those before treatment (Figure S5). After the mthsc70-1a/DR5:GFP seedlings were treated with 300 nM GSH, the GFP fluorescence intensities in the root tips were also not obvious difference from those before treatment (Figure S5), which indicated that exogenous redox reagents had no evident effect on local auxin abundances in root tips.

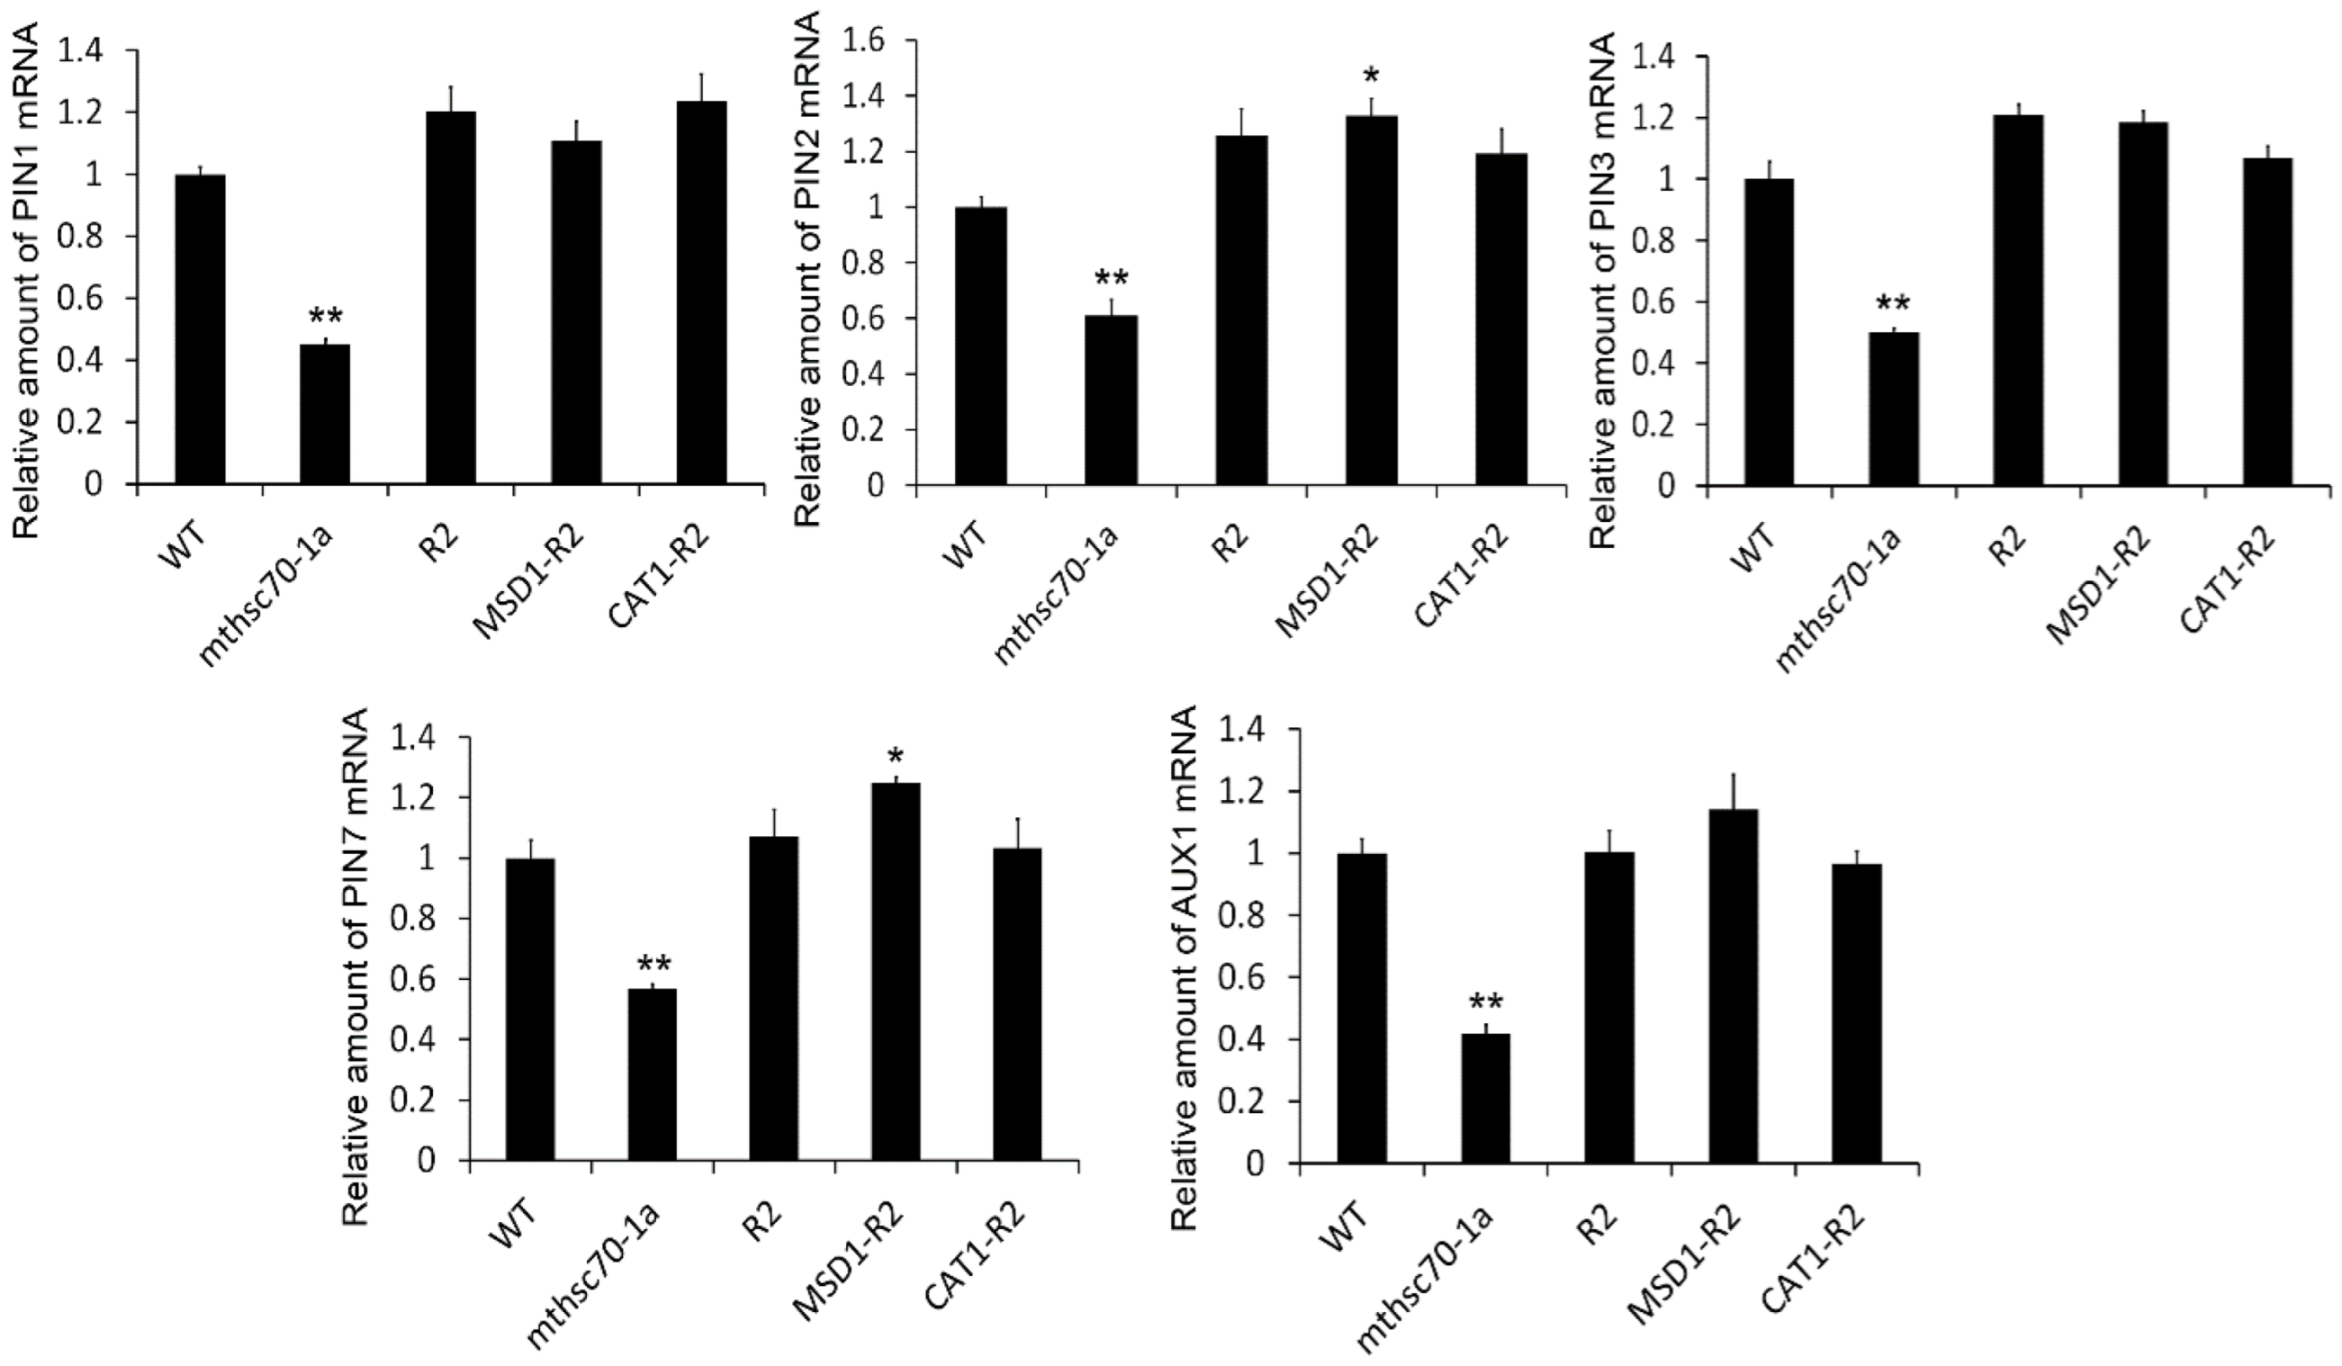
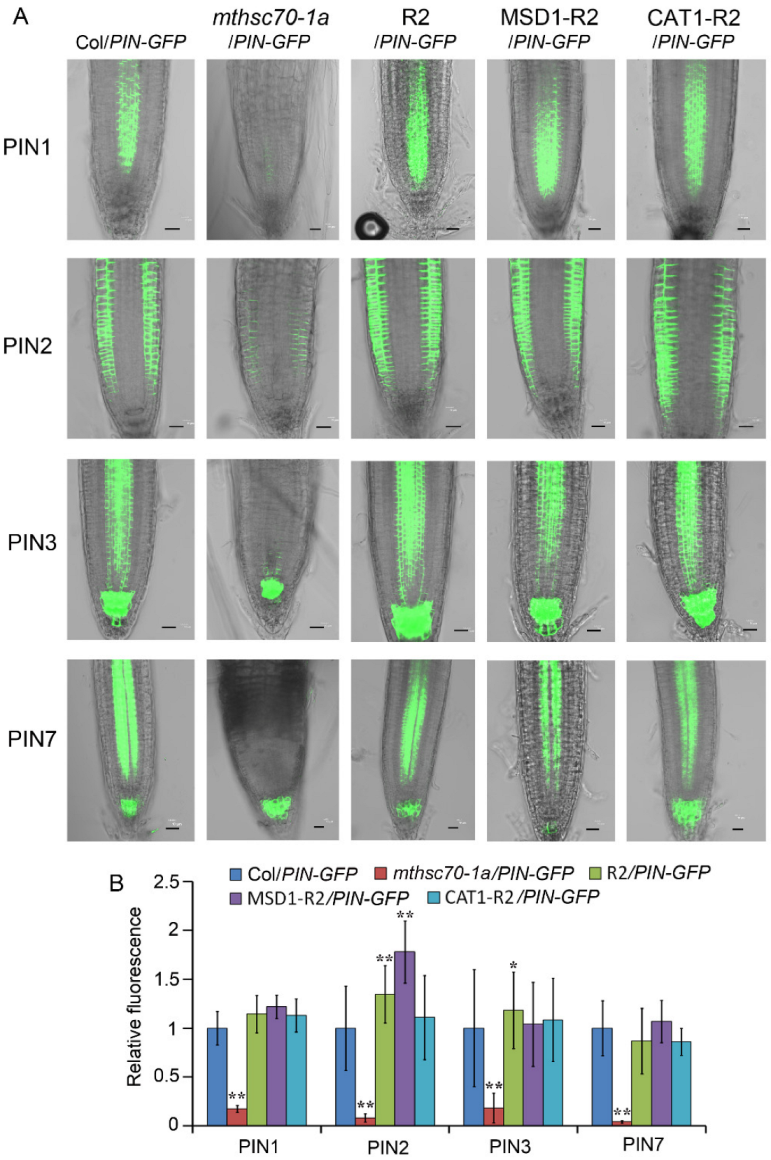
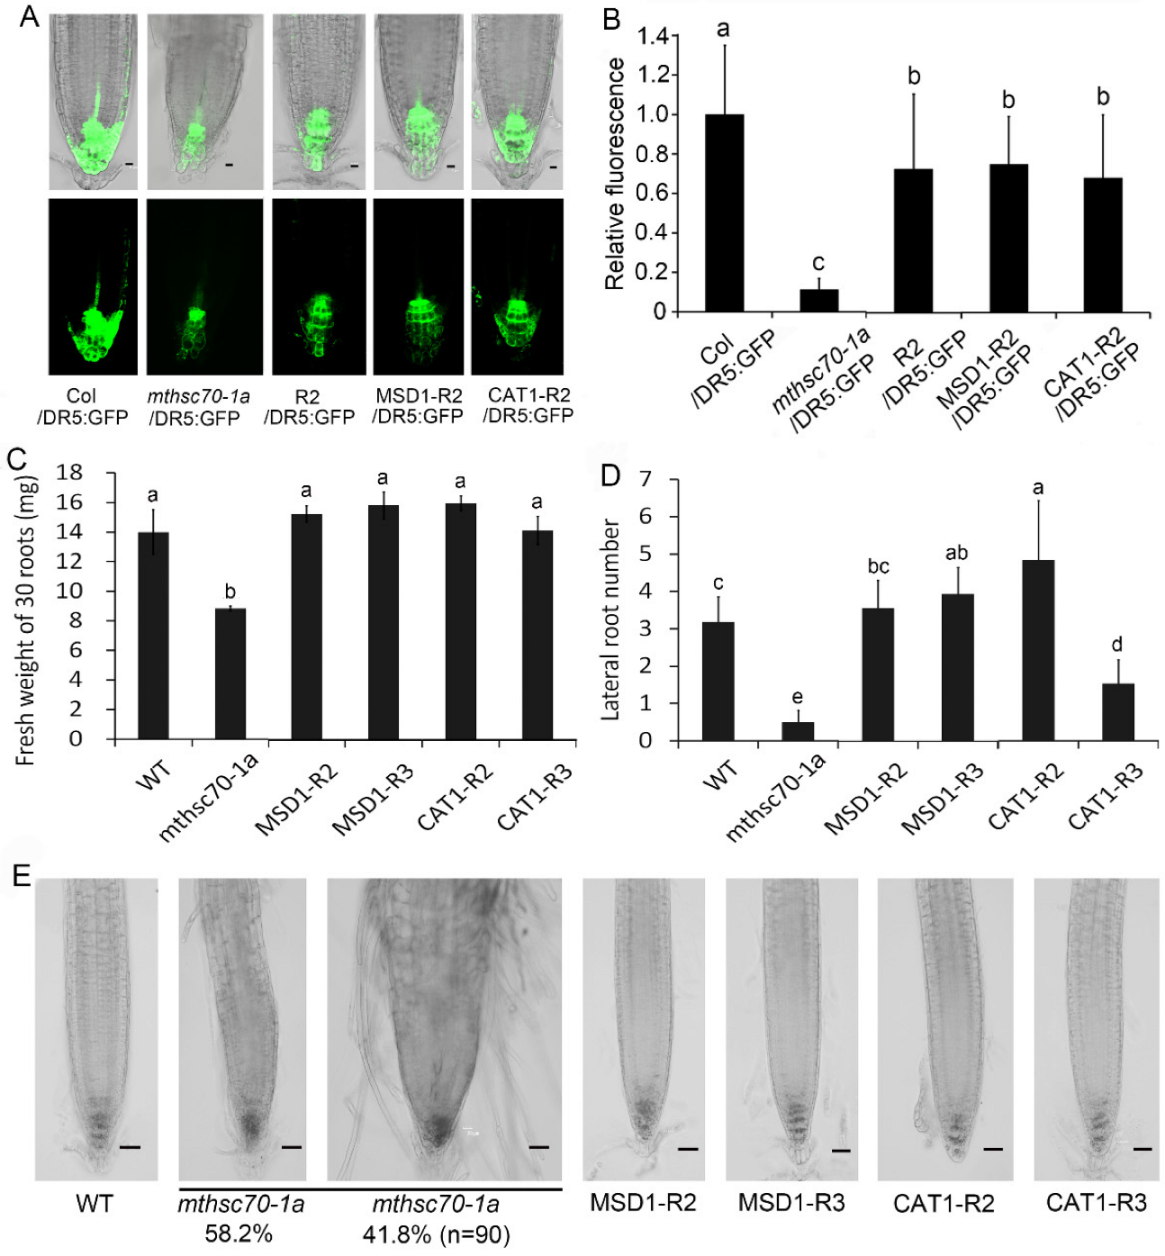
3.4. Introduction of ROS Scavenging Enzymes Rescues Polar Auxin Transport in mtHSC70-1 Mutant Roots

mtHSC70-1 knockout plants display increased levels of ROS in root tips [47]. To understand the effect of ROS accumulations caused by mtHSC70-1 knockout on PAT, several complementary mthsc70-1a lines with mtHSC70-1:mtHSC70-1 (R2 line), mtHSC70-1:Mn-SOD1 (MSD1-R2 and MSD1-R3 lines) or mtHSC70-1:CAT1 (CAT1-R2 and CAT1-R3 lines) were used to analyze the expressions of PIN genes, auxin distributions and root growth. It was demonstrated that introducing MSD1 or CAT1 genes into mthsc70-1a plants decreases the level of superoxide and H2O2 in roots [47]. The results obtained by Q-PCR showed that mtHSC70-1 knockout markedly downregulated the expression of the PIN1, PIN2, PIN3, PIN7 and AUX1 genes in roots, and the introduction of mtHSC70-1, MSD1 or CAT1 into mthsc70-1a rescued the expression levels of these genes (Figure 8). Furthermore, we obtained R2/PIN1-, 2-, 3- or 7-GFP, MSD1-R2/PIN1-, 2-, 3- or 7-GFP and CAT1-R2/PIN1-, 2-, 3- or 7-GFP lines through the crossing method and compared the PIN protein levels among different genotypic plants. The PIN levels in mthsc70-1a/PIN1-, 2-, 3- or 7-GFP root tips were substantially lower than those in Col/PIN1-,2-,3- or 7-GFP root tips; the PIN levels in R2/PIN1-, 2-, 3- or 7-GFP, MSD1-R2/PIN1-, 2-, 3- or 7-GFP and CAT1-R2/PIN1-, 2-, 3- or 7-GFP root tips reached levels equivalent to those in Col/PIN1-, 2-, 3- or 7-GFP root tips or were higher than those in Col/PIN1-, 2-, 3- or 7-GFP root tips (Figure 9). In addition, we obtained R2/DR5:GFP, MSD1-R2/DR5:GFP and CAT1-R2/DR5:GFP lines through the crossing method and compared the GFP fluorescence intensities among Col/DR5:GFP, mthsc70-1a/DR5:GFP, R2/DR5:GFP, MSD1-R2/DR5:GFP and CAT1-R2/DR5:GFP lines. The GFP fluorescence intensity in mthsc70-1a/DR5:GFP root tips was markedly weaker than that in Col/DR5:GFP; however, the GFP fluorescence intensities in the R2/DR5:GFP, MSD1-R2/DR5:GFP and CAT1-R2/DR5:GFP root tips were obviously stronger than those in mthsc70-1a/DR5:GFP and were slightly weaker than that in Col/DR5:GFP (Figure 10A,B). These data indicated that the decreases in PIN and local auxin abundance caused by mtHSC70-1 mutation were likely due to a high oxidation status, suggesting that mitochondrial ROS homeostasis is very important for maintaining PAT in the cytosol. Finally, the phenotypic analysis showed that the introduction of the MSD1 or CAT1 gene into mthsc70-1a plants rescued root growth and development, which was reflected in fresh root weight, lateral root number, root width, cell arrangement and root hair formation (Figure 10C–E), suggesting that the defects of the mtHSC70-1 mutant roots may be attributed to an imbalance towards an oxidative redox state.

4. Discussion

Mitochondria are the major sites of energy production and link redox metabolism to ATP synthesis through the respiratory electron transport chain, which rely on the oxidation of glycolysis product. Glucose plays an important role in energy metabolism as a substrate of glycolysis reaction. Data presented here indicate that mtHSC70-1 mutation leads to root growth and development defects, and glucose supplementation restores some phenotypes of the mtHSC70-1 mutant, such as root width, root cell arrangement and root hairs, but has no effect on root length, fresh weight and lateral root number, suggesting the role of glucose in organ architecture. In previous studies, we unexpectedly found an increase in the O2 consumption rate and ATP level in the mtHSC70-1 mutant [47]. Analysis of respiratory pathways in the mutant indicates an inhibition of the cytochrome c oxidase (COX) pathway and the activation of the alternative respiratory (AOX) pathway [47]. The higher O2 consumption rate caused by the increased AOX pathway in the mtHSC70-1 mutant can compensate for the lower efficiency of ATP generation when electrons are channels through AOX [47]. Thus, the root growth defects in the mtHSC70-1 mutant may not be explained by the lack of energy, which might be the reason for the observed weak restoring effect of glucose on root growth phenotypes.
Mitochondria are also major sites of ROS production. In the process of electron transfer in the respiratory chain, a small number of electrons do not complete the whole transfer chain but leak and directly transfer to O2, generating ROS [54]. Complex I, Complex II and complex III are generally regarded as the main and direct sources of ROS [54,55,56,57,58,59]. It is reported that complex IV-deficient mutants can create electron leakage at the site of over-reduced complex III [60]. Yeast cells lacking Rcf1 (a structural subunit of yeast COX) and Arabidopsis mitochondria-localized CYTOCHROME C OXIDASE DEFICIENT1 (COD1) mutants display decreased COX/complex IV activity and increased ROS production [60,61]. Our previous study indicates that mtHSC70-1 mutants exhibit reduced COX/complex IV activity and the accumulation of mitochondrial ROS, which might be responsible for shortened stems and roots and decreased rosette sizes [47]. Data presented here indicate that the introduction of ROS scavenging enzymes into mtHSC70-1 mutant rescues the growth and development of the roots, suggesting an inhibition role of high levels of ROS in plant growth and development.
It is reported that mtHSC70-1 regulates embryo development by auxin pathway in A. thaliana [49], and mtHSC70-1 knockout inhibits the growth of A. thaliana seedlings [47]. Whether mtHSC70-1 regulates vegetative growth through auxin is unclear. Data presented here demonstrate that mtHSC70-1 facilitates root growth and development through regulating PAT. Li et al. [49] reported that the loss of mtHSC70-1 function induces mitochondrial retrograde signaling, which results in abnormal auxin gradients and defective embryo development. However, the mitochondrial retrograde regulatory factor is still unknown. Our previous work demonstrated that the loss of mtHSC70-1 function leads to the accumulation of mitochondrial ROS [47]. Data presented here demonstrate that the removal of excess mitochondrial ROS in the mutant could rescue defective PAT. How mitochondrial ROS affect auxin transport and distribution in the cytosol and whether they play a role as the main mitochondrial retrograde regulator remain to be studied. It is reported that isolated mitochondria can release H2O2 from the matrix to the extra-mitochondrial space [8]. However, the rate at which this occurs physiologically in intact cells remains unclear.
It is reported that the expression of CAT1 and MSD1 is rapidly induced after treatment with H2O2, and catalase and SOD activity increase obviously after treatments with oxidative stressors in Arabidopsis [62,63,64]. Ślesak et al. [65] reported that three PAD downregulated transgenic lines display an increased H2O2 level and higher activities of MSD1 and CAT in the leaves and shoots compared to the wild-type plants. Previously, we found that the expression levels of MSD1 and CAT1 genes in the mthsc70-1a seedlings are obviously high than those in WT, and ROS levels are also markedly high in the mutant [47], indicating that endogenous MSD1 and CAT1 are induced by the ROS, and endogenous MSD1 and CAT1 are not enough to eliminate the excess ROS in the mutant. Further, treatments with antioxidants ASC and GSH do not restore the growth of mthsc70-1a and mthsc70-1b roots [47]. Data presented here indicate that the application of exogenous antioxidants has no obvious effect on the local auxin abundances in root tips. This may be because the applications of exogenous antioxidants lack spatiotemporal specificity. Then, we investigated the effects of introducing ROS scavenging enzymes into the mthsc70-1a mutant on the PIN and auxin abundances and root growth. There are three catalase genes (CAT1, CAT2 and CAT3) and one manganese superoxide dismutase gene (MnSOD or MSD1) in the Arabidopsis genome [66,67]. Subcellular localization studies have suggested that MSD1 is localized in mitochondria [68,69]. Bioinformatics analysis shows that CAT1 is mainly localized in the peroxisome, mitochondria and cytosol (http://bar.utoronto.ca/cell_efp/cgi-bin/cell_efp.cgi?primaryGene=At1g20630) (accessed on 3 December 2017). To ensure the effective removal of excess ROS produced by mtHSC70-1 deficiency, we introduced the mitochondria-targeted MSD1 or CAT1 gene, which are driven by the mtHSC70-1 promoter, into the mthsc70-1a mutant. The introduced MSD1 or CAT1 gene is expressed to some extent in several representative transgenic lines, and total MSD1 or CAT1 levels in the transgenic lines recover to a level similar to that in WT [47], which implies that ROS levels in these transgenic lines are decreased by the introduced MSD1 or CAT1. Data presented here show that the introduction of MSD1 or CAT1 into mtHSC70-1 mutants rescued the defects in PIN expression, auxin distribution and root growth and development. These results indicate that spatially and temporally distributions of ROS are essential for PAT and provide direct evidence for the role of ROS homeostasis in maintaining PAT.

5. Conclusions

Our previous results [47,48] and the data presented here support a working model in which mtHSC70-1 acts to assist respiratory chain complex IV assembly/activity and regulate ROS homeostasis, which maintains normal PAT and regulates plant growth and development (Figure 11).

Supplementary Materials

The following supporting information can be downloaded at: https://www.mdpi.com/article/10.3390/antiox11102035/s1. Figure S1. Comparison of root tip structure among wild type, mthsc70-1a and a complementary mthsc70-1a line. Figure S2. The effects of NAA treatment on primary root elongation in WT and mtHSC70-1 mutant seedlings. Figure S3. Effects of exogenous redox reagents on the expression of PIN genes in mtHSC70-1 mutant and WT seedlings by Q-PCR. Figure S4. Effects of exogenous redox reagents on PIN protein levels in mthsc70-1a/PIN-GFP and Col/PIN-GFP root tips. Figure S5. Effects of exogenous redox reagents on the auxin response. Table S1. List of primers used in this study. Table S2. Genotypes of the transgenic lines used in this study.

Author Contributions

Conceptualization, B.L. and J.B.; investigation, T.S., N.J., S.W., W.X. and T.L.; writing, B.L. and J.B.; project administration, B.L.; funding acquisition, B.L. and J.B. All authors have read and agreed to the published version of the manuscript.

Funding

This research was funded by “the National Natural Science Foundation of China, grant number 31870222” and the “Science and Technology Project of Hebei Education Department, China, grant number QN2021084”.

Data Availability Statement

Data is contained within the article and Supplementary Material.

Acknowledgments

We thank Zhen-Biao Yang (University of California, Riverside, USA) for providing transgenic materials. We thank the ABRC for providing T-DNA insertional mutant seeds.

Conflicts of Interest

The authors declare no conflict of interest.

References

  1. Gapper, C.; Dolan, L. Control of plant development by reactive oxygen species. Plant Physiol. 2006, 141, 341–345. [Google Scholar] [CrossRef] [PubMed] [Green Version]
  2. Ślesak, I.; Libik, M.; Karpinska, B.; Karpinski, S.; Miszalski, Z. The role of hydrogen peroxide in regulation of plant metabolism and cellular signaling in response to environmental stresses. Acta Biochim. Pol. 2007, 54, 39–50. [Google Scholar] [CrossRef] [PubMed]
  3. Zhang, J.X.; Wang, X.L.; Vikash, V.; Ye, Q.; Wu, D.D.; Liu, Y.L.; Dong, W.G. ROS and ROS-mediated cellular signaling. Oxid. Med. Cell. Longev. 2016. [Google Scholar] [CrossRef] [Green Version]
  4. Waszczak, C.; Carmody, M.; Kangasjarvi, J. Reactive Oxygen Species in Plant Signaling. Annu. Rev. Plant Biol. 2018, 69, 209–236. [Google Scholar] [CrossRef] [Green Version]
  5. Mittler, R.; Vanderauwera, S.; Gollery, M.; Van Breusegem, F. Reactive oxygen gene network of plants. Trends Plant Sci. 2004, 9, 490–498. [Google Scholar] [CrossRef] [PubMed]
  6. Nadarajah, K.K. ROS Homeostasis in Abiotic Stress Tolerance in Plants. Int. J. Mol. Sci. 2020, 21, 5208. [Google Scholar] [CrossRef] [PubMed]
  7. Niforou, K.; Cheimonidou, C.; Trougakos, L.P. Molecular chaperones and proteostasis regulation during redox imbalance. Redox Biol. 2014, 2, 323–332. [Google Scholar] [CrossRef] [PubMed] [Green Version]
  8. Sies, H.; Belousov, V.V.; Chandel, N.S.; Davies, M.J.; Jones, D.P.; Mann, G.E.; Murphy, M.P.; Yamamoto, M.; Winterbourn, C. Defining roles of specific reactive oxygen species (ROS) in cell biology and physiology. Nat. Rev. Mol. Cell Biol. 2022, 23, 499–515. [Google Scholar] [CrossRef]
  9. Murphy, M.P.; Bayir, H.; Belousov, V.; Chang, C.J.; Davies, K.J.; Davies, M.J.; Dick, T.P.; Finkel, T.; Forman, H.J.; Janssen-Heininger, Y.; et al. Guidelines for measuring reactive oxygen species and oxidative damage in cells and in vivo. Nat. Metab. 2022, 4, 651–662. [Google Scholar] [CrossRef]
  10. Scorza, L.C.T.; Nakayama, N. Right place right time: Heterogeneity-driven organ geometry. Dev. Cell 2016, 38, 5–7. [Google Scholar] [CrossRef]
  11. Woodward, A.W.; Bartel, B. Auxin: Regulation, action, and interaction. Ann. Bot. 2005, 95, 707–735. [Google Scholar] [CrossRef] [PubMed] [Green Version]
  12. Bashandy, T.; Guilleminot, J.; Vernoux, T.; Caparros-Ruiz, D.; Ljung, K.; Meyer, Y.; Reichheld, J.P. Interplay between the NADP-linked thioredoxin and glutathione systems in Arabidopsis auxin signaling. Plant Cell 2010, 22, 376–391. [Google Scholar] [CrossRef] [PubMed] [Green Version]
  13. Pasternak, T.; Potters, G.; Caubergs, R.; Jansen, M.A. Complementary interactions between oxidative stress and auxins control plant growth responses at plant, organ, and cellular level. J. Exp. Bot. 2005, 56, 1991–2001. [Google Scholar] [CrossRef] [Green Version]
  14. Blomster, T.; Salojarvi, J.; Sipari, N.; Brosche, M.; Ahlfors, R.; Keinanen, M.; Overmyer, K.; Kangasjarvi, J. Apoplastic reactive oxygen species transiently decrease auxin signaling and cause stress-induced morphogenic response in Arabidopsis. Plant Physiol. 2011, 157, 1866–1883. [Google Scholar] [CrossRef] [PubMed] [Green Version]
  15. Tognetti, V.B.; Mühlenbock, P.; Breusegem, F.V. Stress homeostasis—The redox and auxin perspectivepce. Plant Cell Environ. 2012, 35, 321–333. [Google Scholar] [CrossRef] [PubMed]
  16. Zhang, S.C.; Wu, J.L.; Yuan, D.K.; Zhang, D.W.; Huang, Z.G.; Xiao, L.T.; Yang, C.W. Perturbation of auxin homeostasis caused by mitochondrial FtSH4 gene-mediated peroxidase accumulation regulates Arabidopsis architecture. Mol. Plant 2014, 7, 856–873. [Google Scholar] [CrossRef] [Green Version]
  17. Jia, N.; Lv, T.T.; Li, M.X.; Wei, S.S.; Li, Y.Y.; Zhao, C.L.; Li, B. The J-protein AtDjB1 is required for mitochondrial complex I activity and regulates growth and development through ROS-mediated auxin signalling. J. Exp. Bot. 2016, 67, 3481–3496. [Google Scholar] [CrossRef] [Green Version]
  18. Leyser, O. Auxin Signaling. Plant Physiol. 2018, 176, 465–479. [Google Scholar] [CrossRef] [Green Version]
  19. Adamowski, M.; Friml, J. PIN-Dependent Auxin Transport: Action, Regulation, and Evolution. Plant Cell 2015, 27, 20–32. [Google Scholar] [CrossRef] [Green Version]
  20. Swarup, R.; Bhosale, R. Developmental Roles of AUX1/LAX Auxin Influx Carriers in Plants. Front. Plant Sci. 2019, 10, 1306. [Google Scholar] [CrossRef]
  21. Sauer, M.; Kleine-Vehn, J. PIN-FORMED and PIN-LIKES auxin transport facilitators. Development 2019, 146, dev168088. [Google Scholar] [CrossRef] [PubMed] [Green Version]
  22. Křeček, P.; Skůpa, P.; Libus, J.; Naramoto, S.; Tejos, R.; Friml, J.; Zažímalová, E. The PIN-FORMED (PIN) protein family of auxin transporters. Genome Biol. 2009, 10, 249. [Google Scholar] [CrossRef] [PubMed] [Green Version]
  23. Vieten, A.; Sauer, M.; Brewer, P.B.; Friml, J. Molecular and cellular aspects of auxin-transport-mediated development. Trends Plant Sci. 2007, 12, 160–168. [Google Scholar] [CrossRef] [PubMed]
  24. Friml, J.; Vieten, A.; Sauer, M.; Weijers, D.; Schwarz, H.; Hamann, T.; Offringa, R.; Jürgens, G. Efflux-dependent auxin gradients establish the apical-basal axis of Arabidopsis. Nature 2003, 426, 147–153. [Google Scholar] [CrossRef]
  25. Blilou, I.; Xu, J.; Wildwater, M.; Willemsen, V.; Paponov, I.; Friml, J.; Heidstra, R.; Aida, M.; Palme, K.; Scheres, B. The PIN auxin efflux facilitator network controls growth and patterning in Arabidopsis roots. Nature 2005, 433, 39–44. [Google Scholar] [CrossRef] [PubMed] [Green Version]
  26. Hu, T.W.; Yin, S.P.; Sun, J.B.; Linghu, Y.; Ma, J.Q.; Pan, J.W.; Wang, C. Clathrin light chains regulate hypocotyl elongation by affecting the polarization of the auxin transporter PIN3 in Arabidopsis. J. Integr. Plant Biol. 2021, 63, 1922–1936. [Google Scholar] [CrossRef] [PubMed]
  27. Gälweiler, L.; Guan, C.; Müller, A.; Wisman, E.; Mendgen, K.; Yephremov, A.; Palme, K. Regulation of polar auxin transport by AtPIN1 in Arabidopsis vascular tissue. Science 1998, 282, 2226–2230. [Google Scholar] [CrossRef] [Green Version]
  28. Müller, A.; Guan, C.; Gälweiler, L.; Tänzler, P.; Huijser, P.; Marchant, A.; Parry, G.; Bennett, M.; Wisman, E.; Palme, K. AtPIN2 defines a locus of Arabidopsis for root gravitropism control. EMBO J. 1998, 17, 6903–6911. [Google Scholar] [CrossRef]
  29. Friml, J.; Benková, E.; Blilou, I.; Wisniewska, J.; Hamann, T.; Ljung, K.; Woody, S.; Sandberg, G.; Scheres, B.; Jürgens, G.; et al. AtPIN4 mediates sink-driven auxin gradients and root patterning in Arabidopsis. Cell 2002, 108, 661–673. [Google Scholar] [CrossRef] [Green Version]
  30. Friml, J.; Wiśniewska, J.; Benková, E.; Mendgen, K.; Palme, K. Lateral relocation of auxin efflux regulator PIN3 mediates tropism in Arabidopsis. Nature 2002, 415, 806–809. [Google Scholar] [CrossRef]
  31. Finka, A.; Mattoo, R.U.; Goloubinoff, P. Experimental milestones in the discovery of molecular chaperones as polypeptide unfolding enzymes. Annu. Rev. Biochem. 2016, 85, 715–742. [Google Scholar] [CrossRef] [PubMed] [Green Version]
  32. Goloubinoff, P. Editorial: The HSP70 molecular chaperone machines. Front. Mol. Biosci. 2017, 4, 1–4. [Google Scholar] [CrossRef] [PubMed] [Green Version]
  33. Rosenzweig, R.; Nillegoda, N.B.; Mayer, M.P.; Bukau, B. The Hsp70 chaperone network. Nat. Rev. Mol. Cell Biol. 2019, 20, 665–680. [Google Scholar] [CrossRef] [PubMed]
  34. Sung, D.Y.; Vierling, E.; Guy, C.L. Comprehensive expression profile analysis of the Arabidopsis Hsp70 gene family. Plant Physiol. 2001, 126, 789–800. [Google Scholar] [CrossRef] [PubMed] [Green Version]
  35. Mayer, M.P.; Bukau, B. Hsp70 chaperones: Cellular functions and molecular mechanism. Cell. Mol. Life Sci. 2005, 62, 670–684. [Google Scholar] [CrossRef] [Green Version]
  36. Lin, B.L.; Wang, J.S.; Liu, H.C.; Chen, R.W.; Meyer, Y.; Barakat, A.; Delseny, M. Genomic analysis of the HSP70 superfamily in Arabidopsis thaliana. Cell Stress Chaperones 2001, 6, 201–208. [Google Scholar] [CrossRef]
  37. Su, P.H.; Li, H.M. Arabidopsis stromal 70-kD heat shock proteins are essential for plant development and important for thermotolerance of germinating seeds. Plant Physiol. 2008, 146, 1231–1241. [Google Scholar] [CrossRef] [Green Version]
  38. Cho, E.K.; Choi, Y.J. A nuclear-localized HSP70 confers thermoprotective activity and drought-stress tolerance on plants. Biotechnol. Lett. 2009, 31, 597–606. [Google Scholar] [CrossRef]
  39. Lee, S.; Lee, D.W.; Lee, Y.; Mayer, U.; Stierhof, Y.D.; Lee, S.; Jürgens, G.; Hwang, I. Heat shock protein cognate 70-4 and an E3 ubiquitin ligase, CHIP, mediate plastid-destined precursor degradation through the ubiquitin-26S proteasome system in Arabidopsis. Plant Cell 2009, 21, 3984–4001. [Google Scholar] [CrossRef] [Green Version]
  40. Maruyama, D.; Endo, T.; Nishikawa, S.I. BiP-mediated polar nuclei fusion is essential for the regulation of endosperm nuclei proliferation in Arabidopsis thaliana. Proc. Natl. Acad. Sci. USA 2010, 107, 1684–1689. [Google Scholar] [CrossRef]
  41. Srivastava, R.; Deng, Y.; Shah, S.; Rao, A.G.; Howell, S.H. BINDING PROTEIN is a master regulator of the endoplasmic reticulum stress sensor/transducer bZIP28 in Arabidopsis. Plant Cell 2013, 25, 1416–1429. [Google Scholar] [CrossRef] [PubMed] [Green Version]
  42. Maruyama, D.; Sugiyama, T.; Endo, T.; Nishikawa, S. Multiple BiP genes of Arabidopsis thaliana are required for male gametogenesis and pollen competitiveness. Plant Cell Physiol. 2014, 55, 801–810. [Google Scholar] [CrossRef] [Green Version]
  43. Maruyama, D.; Endo, T.; Nishikawa, S. BiP3 supports the early stages of female gametogenesis in the absence of BiP1 and BiP2 in Arabidopsis thaliana. Plant Signal. Behav. 2015, 10, e1035853. [Google Scholar] [CrossRef] [PubMed] [Green Version]
  44. Leng, L.; Liang, Q.; Jiang, J.; Zhang, C.; Hao, Y.; Wang, X.; Su, W. A subclass of HSP70s regulate development and abiotic stress responses in Arabidopsis thaliana. J. Plant Res. 2017, 130, 349–363. [Google Scholar] [CrossRef] [PubMed]
  45. Qi, Y.C.; Wang, H.J.; Zou, Y.; Liu, C.; Liu, Y.Q.; Wang, Y.; Zhang, W. Over-expression of mitochondrial heat shock protein 70 suppresses programmed cell death in rice. FEBS Lett. 2011, 585, 231–239. [Google Scholar] [CrossRef] [Green Version]
  46. Zhou, W.; Zhou, T.; Li, M.X.; Zhao, C.L.; Jia, N.; Wang, X.X.; Sun, Y.Z.; Li, G.L.; Xu, M.; Zhou, R.G.; et al. The Arabidopsis J-protein AtDjB1 facilitates thermotolerance by protecting cells against heat-induced oxidative damage. New Phytol. 2012, 194, 364–378. [Google Scholar] [CrossRef]
  47. Wei, S.S.; Niu, W.T.; Zhai, X.T.; Liang, W.Q.; Xu, M.; Fan, X.; Lv, T.T.; Xu, W.Y.; Bai, J.T.; Jia, N.; et al. Arabidopsis mtHSC70-1 plays important roles in the establishment of COX-dependent respiration and redox homeostasis. J. Exp. Bot. 2019, 70, 5575–5590. [Google Scholar] [CrossRef]
  48. Zhai, X.T.; Wei, S.S.; Liang, W.Q.; Bai, J.T.; Jia, N.; Li, B. Arabidopsis mtHSC70-1 physically interacts with the Cox2 subunit of cytochrome c oxidase. Plant Signal. Behav. 2020, 15, 1714189. [Google Scholar] [CrossRef]
  49. Li, G.C.; Li, Z.T.; Yang, Z.Y.; Leshem, Y.; Shen, Y.Q.; Men, S.Z. Mitochondrial heat-shock cognate protein 70 contributes to auxin-mediated embryo development. Plant Physiol. 2021, 186, 1101–1121. [Google Scholar] [CrossRef]
  50. Murashige, T.; Skoog, F. A revised medium for rapid growth and bio-assays with tobacco tissue cultures. Physiol. Plant. 1962, 15, 473–497. [Google Scholar] [CrossRef]
  51. Xiong, Y.; McCormack, M.; Li, L.; Hall, Q.; Xiang, C.; Sheen, J. Glucose–TOR signalling reprograms the transcriptome and activates meristems. Nature 2013, 496, 181–187. [Google Scholar] [CrossRef] [Green Version]
  52. Gao, F.; Han, X.W.; Wu, J.H.; Zheng, S.Z.; Shang, Z.L.; Sun, D.Y.; Zhou, R.G.; Li, B. A heat-activated calcium-permeable—Arabidopsis cyclic nucleotide-gated ion channel 6—Is involved in heat shock responses. Plant J. 2012, 70, 1056–1069. [Google Scholar] [CrossRef] [PubMed]
  53. Zhang, W.; Zhou, R.G.; Gao, Y.J.; Zheng, S.Z.; Xu, P.; Zhang, S.Q.; Sun, D.Y. Molecular and Genetic Evidence for the Key Role of AtCaM3 in Heat-Shock Signal Transduction in Arabidopsis. Plant Physiol. 2009, 149, 1773–1784. [Google Scholar] [CrossRef] [PubMed] [Green Version]
  54. Murphy, M.P. How mitochondria produce reactive oxygen species. Biochem. J. 2009, 417, 1–13. [Google Scholar] [CrossRef] [PubMed] [Green Version]
  55. Møller, I.M. Plant mitochondria and oxidative stress: Electron transport, NADPH turnover, and metabolism of reactive oxygen species. Annu. Rev. Plant Physiol. Plant Mol. Biol. 2001, 52, 561–591. [Google Scholar] [CrossRef] [Green Version]
  56. Kowaltowski, A.J.; Souza-Pinto, N.C.; Castilho, R.F.; Vercesi, A.E. Mitochondria and reactive oxygen species. Free Radic. Biol. Med. 2009, 47, 333–343. [Google Scholar] [CrossRef]
  57. Gleason, C.; Huang, S.; Thatcher, L.F.; Foley, R.C.; Anderson, C.R.; Carroll, A.J.; Millar, A.H.; Singh, K.B. Mitochondrial complex II has a key role in mitochondrial-derived reactive oxygen species influence on plant stress gene regulation and defense. Proc. Natl. Acad. Sci. USA 2011, 108, 10768–10773. [Google Scholar] [CrossRef] [Green Version]
  58. Quinlan, C.L.; Orr, A.L.; Perevoshchikova, I.V.; Treberg, J.R.; Ackrell, B.A.; Brand, M.D. Mitochondrial complex II can generate reactive oxygen species at high rates in both the forward and reverse reactions. J. Biol. Chem. 2012, 287, 27255–27264. [Google Scholar] [CrossRef] [Green Version]
  59. Jardim-Messeder, D.; Caverzan, A.; Rauber, R.; Ferreira, E.; Margis-Pinheiro, M.; Galina, A. Succinate dehydrogenase (mitochondrial complex II) is a source of reactive oxygen species in plants and regulates development and stress responses. New Phytol. 2015, 208, 776–789. [Google Scholar] [CrossRef]
  60. Dahan, J.; Tcherkez, G.; Macherel, D.; Benamar, A.; Belcram, K.; Quadrado, M.; Arnal, N.; Mireau, H. Disruption of the CYTOCHROME C OXIDASE DEFICIENT1 gene leads to cytochrome c oxidase depletion and reorchestrated respiratory metabolism in Arabidopsis. Plant Physiol. 2014, 166, 1788–1802. [Google Scholar] [CrossRef]
  61. Vukotic, M.; Oeljeklaus, S.; Wiese, S.; Vögtle, F.N.; Meisinger, C.; Meyer, H.E.; Zieseniss, A.; Katschinski, D.M.; Jans, D.C.; Jakobs, S.; et al. Rcf1 mediates cytochrome oxidase assembly and respirasome formation, revealing heterogeneity of the enzyme complex. Cell Metab. 2012, 15, 336–347. [Google Scholar] [CrossRef] [PubMed] [Green Version]
  62. Du, Y.Y.; Wang, P.C.; Chen, J.; Song, C.P. Comprehensive Functional Analysis of the Catalase Gene Family in Arabidopsis thaliana. J. Integr. Plant Biol. 2008, 50, 1318–1326. [Google Scholar] [CrossRef] [PubMed]
  63. Xing, Y.; Jia, W.; Zhang, J. AtMEK1 mediates stress-induced gene expression of CAT1 catalase by triggering H2O2 production in Arabidopsis. J. Exp. Bot. 2007, 58, 2969–2981. [Google Scholar] [CrossRef]
  64. Hu, S.H.; Jinn, T.L. Impacts of Mn, Fe, and Oxidative Stressors on MnSOD Activation by AtMTM1 and AtMTM2 in Arabidopsis. Plants 2022, 11, 619. [Google Scholar] [CrossRef] [PubMed]
  65. Ślesak, I.; Szechyńska-Hebda, M.; Fedak, H.; Sidoruk, N.; Dąbrowska-Bronk, J.; Witoń, D.; Rusaczonek, A.; Antczak, A.; Drożdżek, M.; Karpińska, B.; et al. PHYTOALEXIN DEFICIENT 4 affects reactive oxygen species metabolism, cell wall and wood properties in hybrid aspen. Plant Cell Environ. 2015, 38, 1275–1284. [Google Scholar] [CrossRef] [PubMed]
  66. Su, T.; Wang, P.; Li, H.; Zhao, Y.; Lu, Y.; Dai, P.; Ren, T.; Wang, X.; Li, X.; Shao, Q.; et al. The Arabidopsis catalase triple mutant reveals important roles of catalases and peroxisome-derived signaling in plant development. J. Integr. Plant Biol. 2018, 60, 591–607. [Google Scholar] [CrossRef]
  67. Kliebenstein, D.J.; Monde, R.A.; Last, R.L. Superoxide dismutase in Arabidopsis: An eclectic enzyme family with disparate regulation and protein localization. Plant Physiol. 1998, 118, 637–650. [Google Scholar] [CrossRef] [Green Version]
  68. Bowler, C.; Van Camp, W.; Van Montagu, M.; Inzé, D. Superoxide dismutase in plants. Crit. Rev. Plant Sci. 1994, 13, 199–218. [Google Scholar] [CrossRef]
  69. Martin, M.V.; Fiol, D.F.; Sundaresan, V.; Zabaleta, E.J.; Pagnussat, G.C. Oiwa, a female gametophytic mutant impaired in a mitochondrial manganese-superoxide dismutase, reveals crucial roles for reactive oxygen species during embryo sac development and fertilization in Arabidopsis. Plant Cell 2013, 25, 1573–1591. [Google Scholar] [CrossRef]
Figure 1. The effects of glucose on root growth and development in wild type, mthsc70-1a, and two complementary mthsc70-1a lines. (A) Intron/exon organization of the mtHSC70-1 CDS and T-DNA insertion locations. Boxes, exons; lines, introns; arrows, T-DNA insertion positions. (B) Representative seedlings after 10 days of growth in 0.5 × MS medium supplemented with 1%, 3% or 5% glucose. (CE) Comparison of root length (C), fresh weight (D) and lateral root number (E) among WT, mthsc70-1a, R2 and R3 seedlings. The asterisks indicate significant differences from WT of the same treatment (t-test, *, p < 0.05; **, p < 0.01). (F) The roots of 10 days old seedlings grown in 0.5 × MS medium supplemented with 1%, 3% or 5% glucose were observed using a laser scanning confocal microscopy (LSCM). Representative images are shown. Scale bar = 40 µm. The roots of the mtHSC70-1 mutants were divided into two types according to their width (≤140 µm or >140 µm) in the transition position of the meristem zone and elongation zone. The percentages below the images represent the ratio of two types of roots. n, the total number of roots analyzed. WT, wild type; mthsc70-1a/b, two mtHSC70-1 T-DNA insertion mutant lines; R2 and R3, two complementary mthsc70-1a lines (mthsc70-1a/mtHSC70-1:mtHSC70-1).
Antioxidants 11 02035 g001
Figure 2. mtHSC70-1 knockout decreased the meristem length and mitosis activity in root tips. (A) The cell files of primary root tips by FM4-64 staining. The roots of 5 days old seedlings were observed using a LSCM. Representative images are shown. The cells without obvious elongation in the stele area were used as the standard of meristem cells in this experiment. The zones between two white dotted lines were measured. (B) Meristem lengths of the primary root tips. The data are the means ± SD of 30 roots. The experiments were repeated three times with similar results. The asterisks indicate significant differences from WT (t-test, **, p < 0.01). (C) Results of S-phase entry of primary root tips by EdU staining. The roots of 6 days old seedlings were observed using a LSCM. Representative images are shown. Top row, EdU staining; bottom row, merge of EdU fluorescence and bright field. WT, wild-type; mthsc70-1a, a mtHSC70-1 mutant line; R2, a complementary mthsc70-1a line. Scale bar = 20 µm.
Antioxidants 11 02035 g002
Figure 3. mtHSC70-1 knockout decreased the auxin response in primary root tips. (AE) Detection of GUS activity. Roots of 5 days old Col/DR5:GUS (A,B) or mthsc70-1a/DR5:GUS (C,D) seedlings were incubated in GUS dye liquor and observed using a stereomicroscope. Representative images are shown. Figure (B,D) are enlarged views of the rectangular frames in Figure (A,C), respectively. Scale bar = 40 µm. The staining intensities in root tips were visualized with ImageJ 1.42q software (National Institutes of Health, Bethesda, MD, USA) (E). Thirty seedlings from each genotype were analyzed. The asterisk indicates a significant difference from Col/DR5:GUS (t-test; **, p < 0.01). (FH) Detection of GFP fluorescence. Roots of 5 days old Col/DR5:GFP (F) or mthsc70-1a/DR5:GFP (G) seedlings were observed using a LSCM. Representative images are shown. Scale bar = 20 µm. The fluorescence intensities in root tips were visualized with ImageJ 1.42q software (H). Thirty seedlings from each genotype were analyzed. The asterisk indicates significant difference from Col/DR5:GFP (t-test; **, p < 0.01). Arrowheads point to the locations of the GUS or GFP. Col/DR5:GUS, Col plants harboring DR5:GUS; mthsc70-1a/DR5:GUS, mthsc70-1a plants harboring DR5:GUS; Col/DR5:GFP, Col plants harboring DR5:GFP; mthsc70-1a/DR5:GFP, mthsc70-1a plants harboring DR5:GFP.
Antioxidants 11 02035 g003
Figure 4. The effects of NPA treatment on root growth and auxin distribution. (AD) The effect of NPA treatment on root growth in WT, mthsc70-1a, R2 and R3 seedlings. Representative seedlings after 10 days of growth in 0.5 × MS medium with or without 4 µM NPA and shown (A). Comparison of root length (B), lateral root number (C) and fresh weight (D) among WT, mthsc70-1a, R2 and R3 seedlings. The asterisks indicate significant differences from control group with the same genotype (t-test; *, p < 0.05; **, p < 0.01). n.s., no significant differences from the control group. (E) The effect of NPA treatment on auxin distribution in root tips. Roots of 5 days old Col/DR5:GFP, mthsc70-1a/DR5:GFP and R2/DR5:GFP seedlings grown in 0.5 × MS medium with or without 4 µM NPA were observed using a LSCM. Representative images are shown. Scale bar = 20 µm. WT, wild type; mthsc70-1a, a mtHSC70-1 mutant line; R2 and R3, two complementary mthsc70-1a lines; Col/DR5:GFP, Col plants harboring DR5:GFP; mthsc70-1a/DR5:GFP, mthsc70-1a plants harboring DR5:GFP; R2/DR5:GFP, R2 plants harboring DR5:GFP.
Antioxidants 11 02035 g004
Figure 5. mtHSC70-1 knockout decreased the abundance of auxin transport carriers in root tips. (A) The roots of 5 days old transgenic seedlings harboring PIN-GFP were incubated in 5 μM FM4-64 dye. The fluorescence of the transgenic roots harboring PIN-GFP or AUX1-YFP was observed using a LSCM. Representative images are shown. Scale bar = 20 µm. (B) The fluorescence intensities were visualized with ImageJ 1.42q software (National Institutes of Health, Bethesda, MD, USA). The asterisks indicate significant differences from Col/PIN-GFP or Col/AUX1-YFP (t-test; **, p < 0.01). Col/PIN-GFP, Col/PIN1-, 2-, 3- or 7-GFP plants; mthsc70-1a/PIN-GFP, mthsc70-1a/PIN1-, 2-, 3- or 7-GFP plants; Col/AUX1-YFP, Col/AUX1-YFP plants; mthsc70-1a/AUX1-YFP, mthsc70-1a/AUX1-YFP plants.
Antioxidants 11 02035 g005
Figure 6. Effects of exogenous redox reagents on the expression of PIN genes in WT and mtHSC70-1 mutant seedlings by Q-PCR. (A) The WT seedlings were grown on 0.5 × MS medium with or without 1 mM H2O2 for 10 d. (B) The mthsc70-1b seedlings were grown on 0.5 × MS medium with or without 300 nM GSH for 10 d. For the ASC treatment, 10 days old mthsc70-1b seedlings were transferred to liquid 0.5 × MS medium with or without 4 mM ASC for 90 min and then developed for 120 min. The data are the means ± SD of three biological replicates. The asterisks indicate significant differences from the control group (t-test, *, p < 0.05; **, p < 0.01). WT, wild-type; mthsc70-1b, a mtHSC70-1 mutant line.
Antioxidants 11 02035 g006
Figure 7. Effects of exogenous redox reagents on PIN protein levels in Col/PIN-GFP and mthsc70-1a/PIN-GFP root tips. (A,B) Root tips of five days old Col/PIN-GFP seedlings grown on 0.5 × MS medium with or without 1 mM H2O2 were observed using a LSCM (A); the GFP fluorescence intensities were visualized with ImageJ 1.42q software (National Institutes of Health, Bethesda, MD, USA) (B). (C,D) Root tips of five days old mthsc70-1a/PIN-GFP seedlings grown on 0.5 × MS medium with or without 300 nM GSH (or 4 mM ASC) were observed using a LSCM (C); the GFP fluorescence intensities were visualized with ImageJ 1.42q software (D). Thirty seedlings from each genotype and treatment were analyzed; representative images are shown. Scale bar = 20 µm. The asterisks indicate significant differences from the control group (t-test, *, p < 0.05; **, p < 0.01). Col/PIN-GFP, Col/PIN1-, 2-, 3- or 7-GFP plants; mthsc70-1a/PIN-GFP, mthsc70-1a/PIN1-, 2-, 3- or 7-GFP plants.
Antioxidants 11 02035 g007
Figure 8. Introduction of the mtHSC70-1, MSD1 or CAT1 gene into mthsc70-1a rescued the expressions of auxin transport carrier genes in roots. Transcripts of PIN1, PIN2, PIN3, PIN7 and AUX1 genes in roots of 10 days old WT, mthsc70-1a, R2, MSD1-R2 and CAT1-R2 seedlings were analyzed by Q-PCR using gene-specific primers (Table S1). The data are shown as the means ± SD of three biological replicates. The asterisks indicate significant differences from the WT (t-test, *, p < 0.05; **, p < 0.01). WT, wild-type; mthsc70-1a, a mtHSC70-1 mutant line; R2, a mthsc70-1a/mtHSC70-1:mtHSC70-1 line; MSD1-R2, a mthsc70-1a/mtHSC70-1:MSD1 line; CAT1-R2, a mthsc70-1a/mtHSC70-1:CAT1 line.
Antioxidants 11 02035 g008
Figure 9. Introduction of the mtHSC70-1, MSD1 or CAT1 gene into mthsc70-1a/PIN-GFP plants rescued the levels of PIN proteins in root tips. (A) The roots of 5 days old seedlings with different genotypes were observed using a LSCM; representative images are shown. Scale bar = 20 µm. (B) The GFP fluorescence intensities were visualized with ImageJ 1.42q software (National Institutes of Health, Bethesda, MD, USA). The asterisks indicate significant differences from the Col/PIN-GFP plants (t-test, *, p < 0.05; **, p < 0.01). Col/PIN-GFP, Col/PIN1-, 2-, 3- or 7-GFP plants; mthsc70-1a/PIN-GFP, mthsc70-1a/PIN1-, 2-, 3- or 7-GFP plants; R2/PIN-GFP, R2/PIN1-, 2-, 3- or 7-GFP plants; MSD1-R2/PIN-GFP, MSD1-R2/PIN1-, 2-, 3- or 7-GFP plants; CAT1-R2/PIN-GFP, CAT1-R2/PIN1-, 2-, 3- or 7-GFP plants.
Antioxidants 11 02035 g009
Figure 10. Introduction of the mtHSC70-1, MSD1 or CAT1 gene rescued the auxin response and root growth and development. (A) Root tips of 5 days old transgenic seedlings harboring DR5:GFP were observed using a LSCM; representative images are shown. Scale bar = 10 µm. (B) The GFP fluorescence intensities were visualized with ImageJ 1.42q software (National Institutes of Health, Bethesda, MD, USA). Thirty seedlings from each genotype were analyzed. The different letters indicate significant differences (ANOVA, Tukey’s HSD test, alpha = 0.05). (C,D) Comparison of fresh root weight (C) and lateral root number (D) among WT, mthsc70-1a, MSD1-R2, MSD1-R3, CAT1-R2 and CAT1-R3 seedlings. The different letters indicate significant differences (ANOVA, Tukey’s HSD test, alpha = 0.05). (E) Representative images of root tips of 10 days old seedlings with different genotypes. Scale bar = 40 µm. The roots of the mtHSC70-1 mutants were divided into two types according to their width (≤140 µm or >140 µm) in the transition position of the meristem zone and elongation zone. The percentages below the images represent the ratio of two types of roots. n, the total number of roots analyzed. Col/DR5:GFP, Col plants harboring DR5:GFP; mthsc70-1a/DR5:GFP, mthsc70-1a plants harboring DR5:GFP; R2/DR5:GFP, R2 plants harboring DR5:GFP; MSD1-R2/DR5:GFP, MSD1-R2 plants harboring DR5:GFP; CAT1-R2/DR5:GFP, CAT1-R2 plants harboring DR5:GFP; WT, wild-type; mthsc70-1a, a mtHSC70-1 mutant line; MSD1-R2 and MSD1-R3, two mthsc70-1a/mtHSC70-1:MSD1 lines; CAT1-R2 and CAT1-R3, two mthsc70-1a/mtHSC70-1:CAT1 lines.
Antioxidants 11 02035 g010
Figure 11. A working model for the function of mtHSC70-1 in the regulation of Arabidopsis growth and development. mtHSC70-1, as a molecular chaperone, assists in complex IV/cytochrome c oxidase (COX) assembly. The loss of mtHSC70-1 function inhibits the assembly/activity of COX, which results in the malfunction of the cytochrome respiratory pathway, which leads to the excessive production of ROS at the site of over-reduced complex III, and the activation of the alternative respiratory pathway. The high levels of ROS in mtHSC70-1 mutants interfere with polar auxin transport, subsequently impacting the growth and development of plants. Inhibited and increased pathways are indicated with black lines and red lines, respectively. The bars show blockage effects. Black dashed line indicates an unproven route. Complex IV and electron transfer disruption is shown with red crosses. CI, CIII and CIV, respiratory chain complexes I, III and IV; AOX, alternative oxidase; UQ, ubiquinone; Cyt c, cytochrome c; SOD, superoxide dismutase; CAT, catalases.
Antioxidants 11 02035 g011
Publisher’s Note: MDPI stays neutral with regard to jurisdictional claims in published maps and institutional affiliations.

