
Discriminating Paradoxical and Psychophysiological Insomnia Based on Structural and Functional Brain Images: A Preliminary Machine Learning Study
 and
and
Abstract
:1. Introduction
2. Materials and Methods
2.1. Subjects
2.2. Clinical Examination of ID Subtypes
2.3. MRI and Resting-State fMRI Image Acquisition
2.4. Preprocessing and Feature Extraction
2.5. Statistical Analyses
2.6. Classification
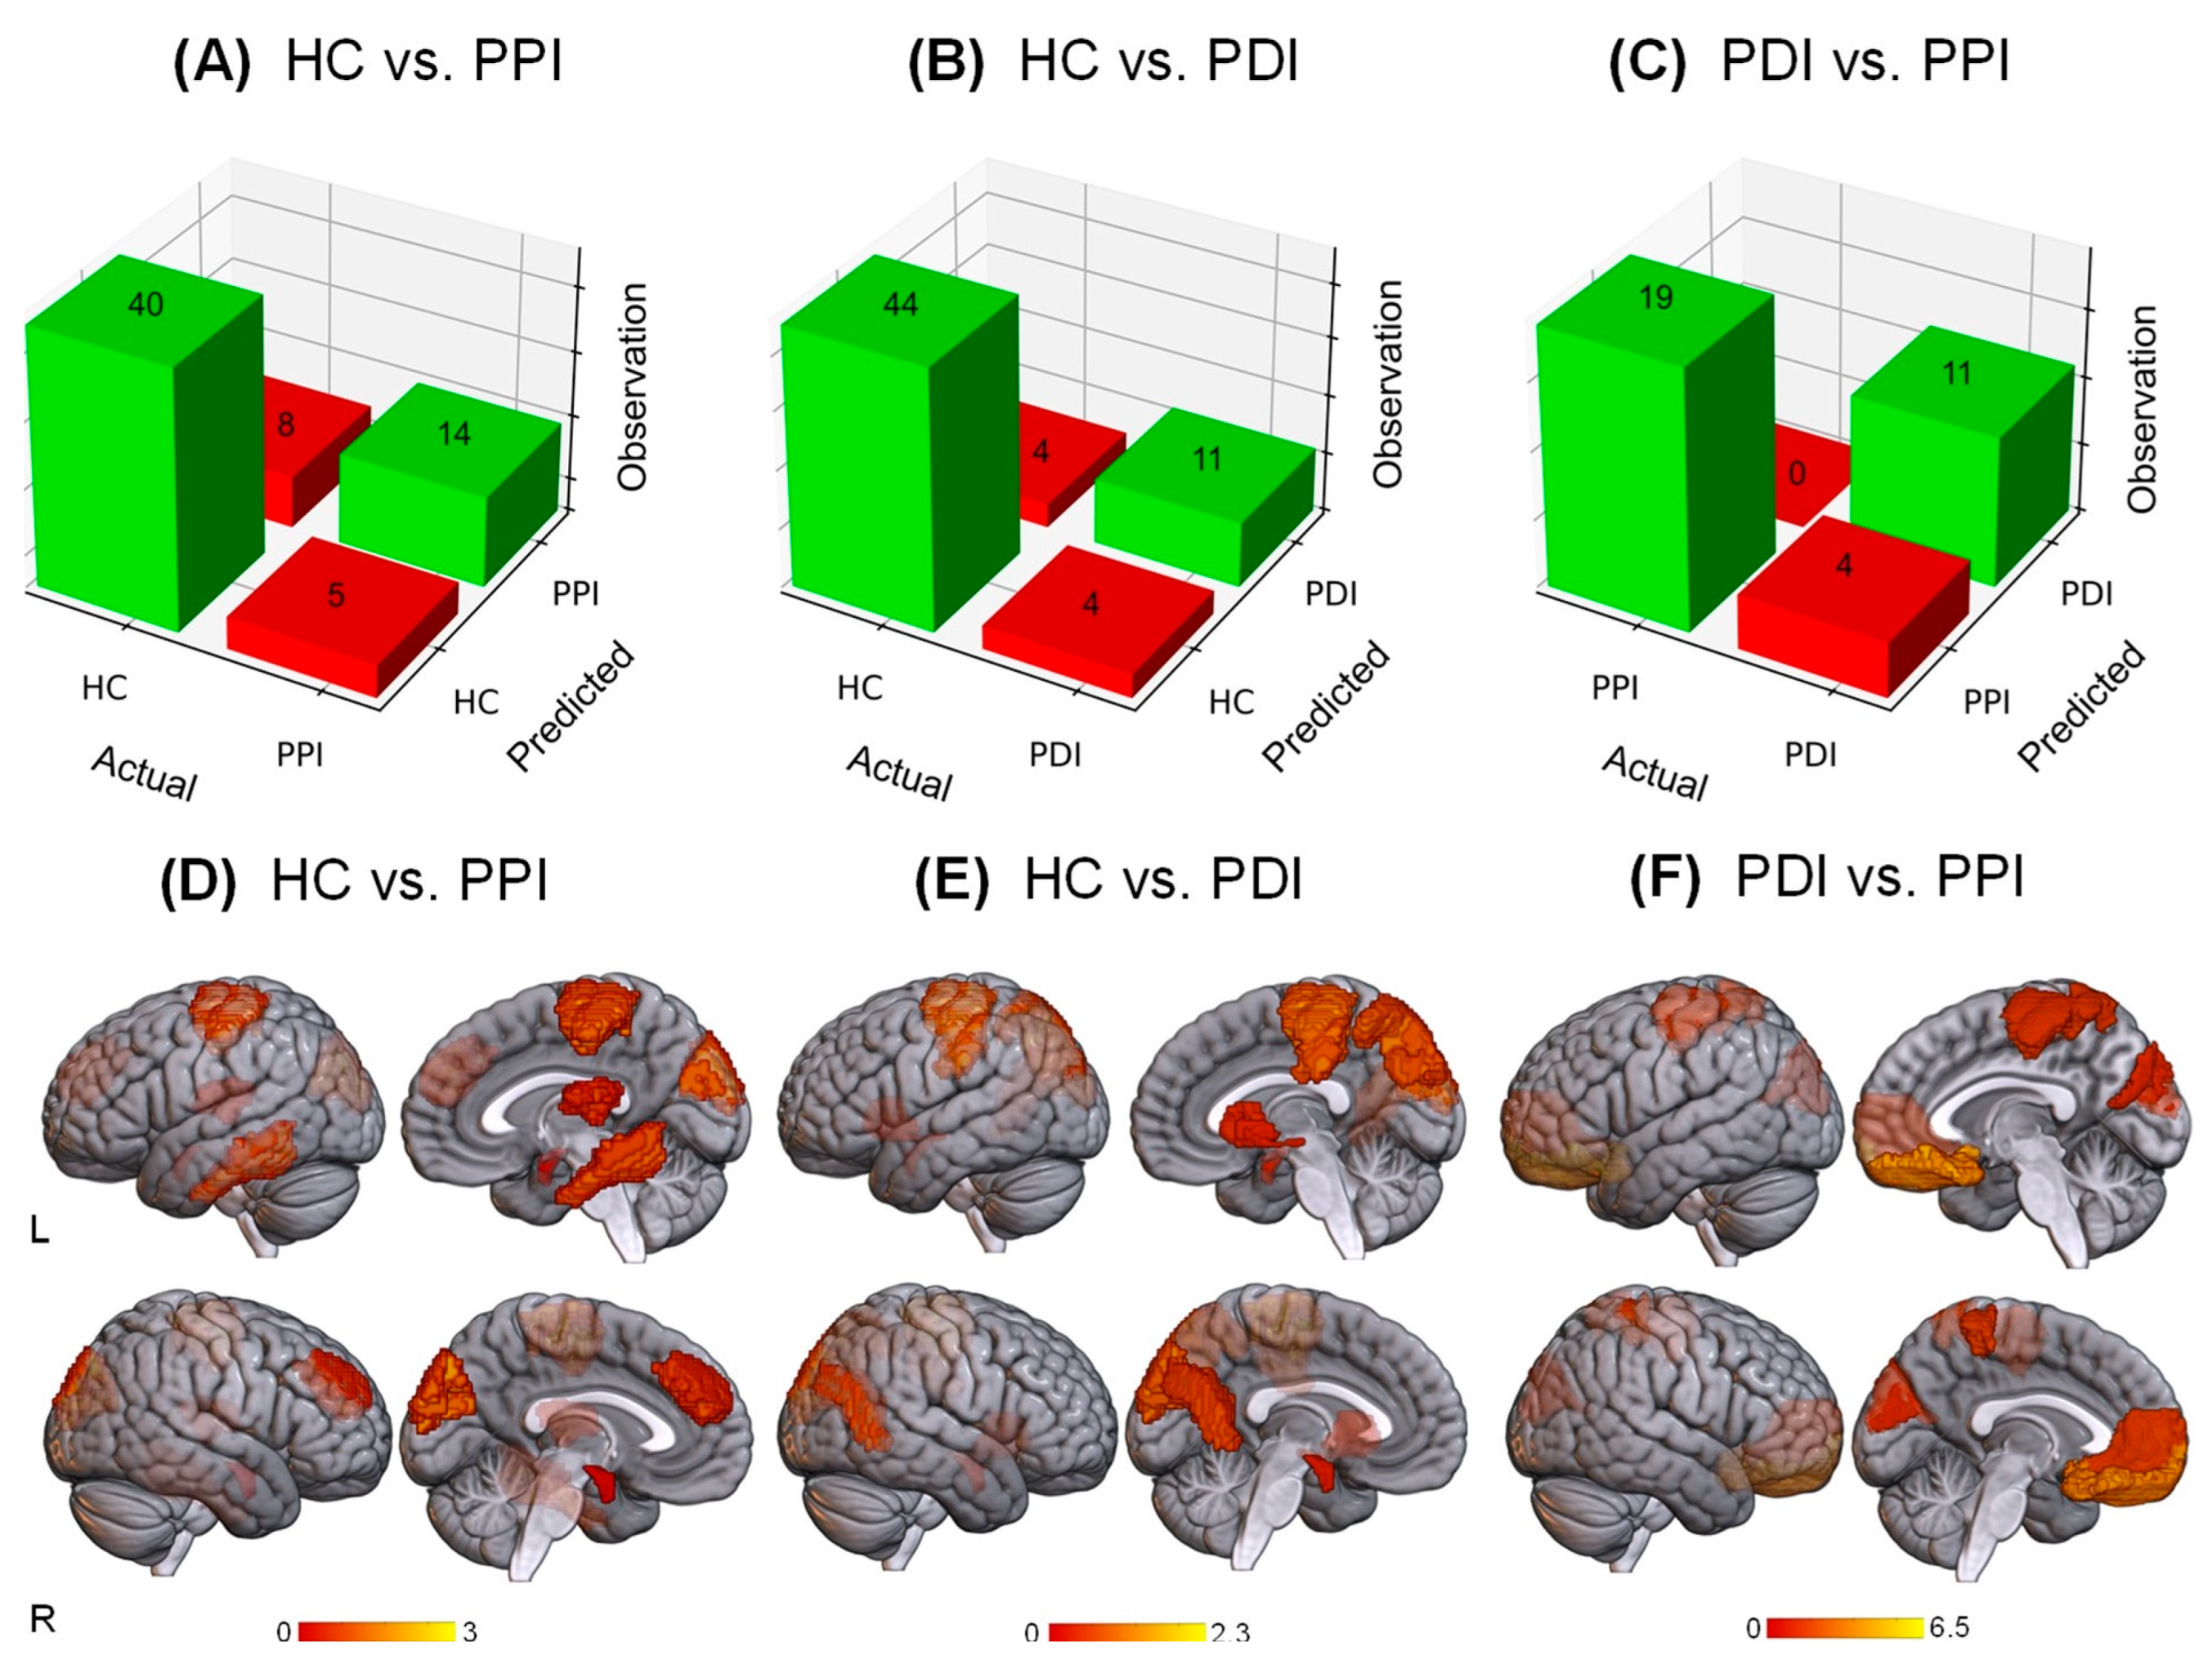
3. Results
4. Discussion
5. Conclusions
Supplementary Materials
Author Contributions
Funding
Institutional Review Board Statement
Informed Consent Statement
Data Availability Statement
Acknowledgments
Conflicts of Interest
References
- Sateia, M.J. International classification of sleep disorders-third edition: Highlights and modifications. Chest 2014, 146, 1387–1394. [Google Scholar] [CrossRef] [PubMed]
- Van Someren, E.J.W. Brain mechanisms of insomnia: New perspectives on causes and consequences. Physiol. Rev. 2021, 101, 995–1046. [Google Scholar] [CrossRef] [PubMed]
- Rezaie, L.; Fobian, A.D.; McCall, W.V.; Khazaie, H. Paradoxical insomnia and subjective–objective sleep discrepancy: A review. Sleep Med. Rev. 2018, 40, 196–202. [Google Scholar] [CrossRef]
- Gong, L.; Xu, R.; Yang, D.; Wang, J.; Ding, X.; Zhang, B.; Zhang, X.; Hu, Z.; Xi, C. Orbitofrontal Cortex Functional Connectivity-Based Classification for Chronic Insomnia Disorder Patients with Depression Symptoms. Front. Psychiatry 2022, 13, 907978. [Google Scholar] [CrossRef] [PubMed]
- Emamian, F.; Mahdipour, M.; Noori, K.; Rostampour, M.; Mousavi, S.B.; Khazaie, H.; Khodaie-Ardakani, M.; Tahmasian, M.; Zarei, M. Alterations of Subcortical Brain Structures in Paradoxical and Psychophysiological Insomnia Disorder. Front. Psychiatry 2021, 12, 661286. [Google Scholar] [CrossRef] [PubMed]
- Li, C.; Mai, Y.; Dong, M.; Yin, Y.; Hua, K.; Fu, S.; Wu, Y.; Jiang, G. Multivariate Pattern Classification of Primary Insomnia Using Three Types of Functional Connectivity Features. Front. Neurol. 2019, 10, 1037. [Google Scholar] [CrossRef]
- Blanken, T.F.; Benjamins, J.S.; Borsboom, D.; Vermunt, J.K.; Paquola, C.; Ramautar, J.; Dekker, K.; Stoffers, D.; Wassing, R.; Wei, Y.; et al. Insomnia disorder subtypes derived from life history and traits of affect and personality. Lancet Psychiatry 2019, 6, 151–163. [Google Scholar] [CrossRef]
- Tahmasian, M.; Noori, K.; Samea, F.; Zarei, M.; Spiegelhalder, K.; Eickhoff, S.B.; Van Someren, E.; Khazaie, H.; Eickhoff, C.R. A lack of consistent brain alterations in insomnia disorder: An activation likelihood estimation meta-analysis. Sleep Med. Rev. 2018, 42, 111–118. [Google Scholar] [CrossRef]
- ScSchiel, J.E.; Holub, F.; Petri, R.; Leerssen, J.; Tamm, S.; Tahmasian, M.; Riemann, D.; Spiegelhalder, K. Affect and Arousal in Insomnia: Through a Lens of Neuroimaging Studies. Curr. Psychiatry Rep. 2020, 22, 44. [Google Scholar] [CrossRef]
- Weihs, A.; Bi, H.; Buelow, R.; Eickhoff, S.B.; Ewert, R.; Frenzel, S.; Grabe, H.J.; Hoffstaedter, F.; Jahanshad, N.; Khazaie, H.; et al. Lack of structural brain alterations associated with insomnia: Findings from the ENIGMA-Sleep Working Group. J. Sleep Res. 2023, 100, e13884. [Google Scholar] [CrossRef]
- BeBenjamins, J.S.; Migliorati, F.; Dekker, K.; Wassing, R.; Moens, S.; Blanken, T.F.; Lindert, B.H.T.; Mook, J.S.; Van Someren, E.J. Insomnia heterogeneity: Characteristics to consider for data-driven multivariate subtyping. Sleep Med. Rev. 2017, 36, 71–81. [Google Scholar] [CrossRef] [PubMed]
- Williams, L.M. Defining biotypes for depression and anxiety based on large-scale circuit dysfunction: A theoretical review of the evidence and future directions for clinical translation. Depress Anxiety 2017, 34, 9–24. [Google Scholar] [CrossRef] [PubMed]
- Goldstein-Piekarski, A.N.; Holt-Gosselin, B.; O’hora, K.; Williams, L.M. Integrating sleep, neuroimaging, and computational approaches for precision psychiatry. Neuropsychopharmacology 2020, 45, 192–204. [Google Scholar] [CrossRef] [PubMed]
- Tahmasian, M.; Knight, D.C.; Manoliu, A.; Schwerthöffer, D.; Scherr, M.; Meng, C.; Shao, J.; Peters, H.; Doll, A.; Khazaie, H.; et al. Aberrant intrinsic connectivity of hippocampus and amygdala overlap in the fronto-insular and dorsomedial-prefrontal cortex in major depressive disorder. Front. Hum. Neurosci. 2013, 7, 639. [Google Scholar] [CrossRef] [PubMed]
- Rashid, B.; Calhoun, V. Towards a brain-based predictome of mental illness. Hum. Brain Mapp. 2020, 41, 3468–3535. [Google Scholar] [CrossRef]
- Zhou, F.; Huang, S.; Zhuang, Y.; Gao, L.; Gong, H. Frequency-dependent changes in local intrinsic oscillations in chronic primary insomnia: A study of the amplitude of low-frequency fluctuations in the resting state. NeuroImage Clin. 2017, 15, 458–465. [Google Scholar] [CrossRef]
- Wang, T.; Li, S.; Jiang, G.; Lin, C.; Li, M.; Ma, X.; Zhan, W.; Fang, J.; Li, L.; Li, C.; et al. Regional homogeneity changes in patients with primary insomnia. Eur. Radiol. 2015, 26, 1292–1300. [Google Scholar] [CrossRef]
- Keenan, S.A. Chapter 3 An overview of polysomnography. In Handbook of Clinical Neurophysiology; Guilleminault, C., Ed.; Elsevier: Amsterdam, The Netherlands, 2005; pp. 33–50. [Google Scholar]
- Khazaie, H.; Mohammadi, H.; Rezaei, M.; Faghihi, F. Hypothalamic–pituitary–gonadal activity in paradoxical and psychophysiological insomnia. J. Med. Signals Sens. 2019, 9, 59–67. [Google Scholar] [CrossRef]
- Lee, M.H.; Kim, N.; Yoo, J.; Kim, H.-K.; Son, Y.-D.; Kim, Y.-B.; Oh, S.M.; Kim, S.; Lee, H.; Jeon, J.E.; et al. Multitask fMRI and machine learning approach improve prediction of differential brain activity pattern in patients with insomnia disorder. Sci. Rep. 2021, 11, 9402. [Google Scholar] [CrossRef]
- Tahmasian, M.; Shao, J.; Meng, C.; Grimmer, T.; Diehl-Schmid, J.; Yousefi, B.H.; Förster, S.; Riedl, V.; Drzezga, A.; Sorg, C. Based on the Network Degeneration Hypothesis: Separating Individual Patients with Different Neurodegenerative Syndromes in a Preliminary Hybrid PET/MR Study. J. Nucl. Med. 2016, 57, 410–415. [Google Scholar] [CrossRef]
- Schaefer, A.; Kong, R.; Gordon, E.M.; Laumann, T.O.; Zuo, X.-N.; Holmes, A.J.; Eickhoff, S.B.; Yeo, B.T.T. Local-Global Parcellation of the Human Cerebral Cortex from Intrinsic Functional Connectivity MRI. Cereb. Cortex 2018, 28, 3095–3114. [Google Scholar] [CrossRef] [PubMed]
- Fan, L.; Li, H.; Zhuo, J.; Zhang, Y.; Wang, J.; Chen, L.; Yang, Z.; Chu, C.; Xie, S.; Laird, A.R.; et al. The Human Brainnetome Atlas: A New Brain Atlas Based on Connectional Architecture. Cereb. Cortex 2016, 26, 3508–3526. [Google Scholar] [CrossRef] [PubMed]
- Yan, C.; Zang, Y. DPARSF: A MATLAB Toolbox for “Pipeline” Data Analysis of Resting-State fMRI. Front Syst Neurosci 2010, 4, 13. [Google Scholar] [CrossRef] [PubMed]
- Uddin, L.; Menon, V. Introduction to Special Topic—Resting-State Brain Activity: Implications for Systems Neuroscience. Front. Syst. Neurosci. 2010, 4, 37. [Google Scholar] [CrossRef]
- Sun, F.; Liu, Z.; Yang, J.; Fan, Z.; Xi, C.; Cheng, P.; He, Z.; Yang, J. Shared and distinct patterns of dynamical degree centrality in bipolar disorder across different mood states. Front. Psychiatry 2022, 13, 941073. [Google Scholar] [CrossRef]
- Li, J.; Gong, H.; Xu, H.; Ding, Q.; He, N.; Huang, Y.; Jin, Y.; Zhang, C.; Voon, V.; Sun, B.; et al. Abnormal Voxel-Wise Degree Centrality in Patients With Late-Life Depression: A Resting-State Functional Magnetic Resonance Imaging Study. Front. Psychiatry 2020, 10, 1024. [Google Scholar] [CrossRef]
- Gewers, F.L.; Ferreira, G.R.; Arruda, H.F.; Silva, F.N.; Comin, C.H.; Amancio, D.R.; Costa, L.D. Principal Component Analysis: A Natural Approach to Data Exploration. ACM Comput. Surv. 2021, 54, 70. [Google Scholar]
- Cervantes, J.; Garcia-Lamont, F.; Rodríguez-Mazahua, L.; Lopez, A. A comprehensive survey on support vector machine classification: Applications, challenges and trends. Neurocomputing 2020, 408, 189–215. [Google Scholar] [CrossRef]
- Schölkopf, B.; Smola, A.J.; Williamson, R.C.; Bartlett, P.L. New Support Vector Algorithms. Neural Comput. 2000, 12, 1207–1245. [Google Scholar] [CrossRef]
- Ojala, M.; Garriga, G.C. Permutation Tests for Studying Classifier Performance. In Proceedings of the 2009 Ninth IEEE International Conference on Data Mining, Miami, FL, USA, 6–9 December 2009. [Google Scholar]
- Andrillon, T.; Solelhac, G.; Bouchequet, P.; Romano, F.; Le Brun, M.-P.; Brigham, M.; Chennaoui, M.; Léger, D. Revisiting the value of polysomnographic data in insomnia: More than meets the eye. Sleep Med. 2019, 66, 184–200. [Google Scholar]
- Tahmasian, M.; Aleman, A.; Andreassen, O.A.; Arab, Z.; Baillet, M.; Benedetti, F.; Bresser, T.; Bright, J.; Chee, M.W.; Chylinski, D.; et al. ENIGMA-Sleep: Challenges, opportunities, and the road map. J. Sleep Res. 2021, 30, e13347. [Google Scholar] [CrossRef] [PubMed]


| Measures | Validation | HC vs. PPI | HC vs. PDI | PDI vs. PPI |
|---|---|---|---|---|
| Multimodal | Accuracy % | 81 | 87 | 88 |
| ROC score % | 79 | 82 | 87 | |
| Sensitivity % | 89 | 92 | 82 | |
| Specificity % | 64 | 73 | 100 | |
| p-value | <0.001 | <0.001 | <0.001 | |
| Cortical Thickness | Accuracy % | 78 | 67 | 79 |
| ROC score % | 72 | 74 | 81 | |
| Sensitivity % | 84 | 93 | 93 | |
| Specificity % | 61 | 59 | 70 | |
| p-value | <0.001 | 0.125 | 0.01 | |
| Whole Brain GMV | Accuracy % | 78 | 87 | 85 |
| ROC score % | 75 | 82 | 85 | |
| Sensitivity % | 87 | 92 | 85 | |
| Specificity % | 59 | 73 | 86 | |
| p-value | 0.003 | <0.001 | <0.001 | |
| Whole Brain ALFF | Accuracy % | 85 | 79 | 71 |
| ROC score % | 82 | 66 | 70 | |
| Sensitivity % | 94 | 83 | 74 | |
| Specificity % | 74 | 60 | 67 | |
| p-value | <0.001 | 0.004 | 0.014 | |
| Whole Brain DC | Accuracy % | 72 | 70 | 82 |
| ROC score % | 67 | 69 | 82 | |
| Sensitivity % | 82 | 87 | 84 | |
| Specificity % | 50 | 42 | 80 | |
| p-value | 0.004 | 0.012 | <0.001 | |
| Whole Brain ReHo | Accuracy % | 70 | 83 | 76 |
| ROC score % | 78 | 84 | 76 | |
| Sensitivity % | 83 | 95 | 79 | |
| Specificity % | 63 | 59 | 73 | |
| p-value | 0.006 | 0.016 | 0.005 |
Disclaimer/Publisher’s Note: The statements, opinions and data contained in all publications are solely those of the individual author(s) and contributor(s) and not of MDPI and/or the editor(s). MDPI and/or the editor(s) disclaim responsibility for any injury to people or property resulting from any ideas, methods, instructions or products referred to in the content. |
© 2023 by the authors. Licensee MDPI, Basel, Switzerland. This article is an open access article distributed under the terms and conditions of the Creative Commons Attribution (CC BY) license (https://creativecommons.org/licenses/by/4.0/).
Share and Cite
Afshani, M.; Mahmoudi-Aznaveh, A.; Noori, K.; Rostampour, M.; Zarei, M.; Spiegelhalder, K.; Khazaie, H.; Tahmasian, M. Discriminating Paradoxical and Psychophysiological Insomnia Based on Structural and Functional Brain Images: A Preliminary Machine Learning Study. Brain Sci. 2023, 13, 672. https://doi.org/10.3390/brainsci13040672
Afshani M, Mahmoudi-Aznaveh A, Noori K, Rostampour M, Zarei M, Spiegelhalder K, Khazaie H, Tahmasian M. Discriminating Paradoxical and Psychophysiological Insomnia Based on Structural and Functional Brain Images: A Preliminary Machine Learning Study. Brain Sciences. 2023; 13(4):672. https://doi.org/10.3390/brainsci13040672
Chicago/Turabian StyleAfshani, Mortaza, Ahmad Mahmoudi-Aznaveh, Khadijeh Noori, Masoumeh Rostampour, Mojtaba Zarei, Kai Spiegelhalder, Habibolah Khazaie, and Masoud Tahmasian. 2023. "Discriminating Paradoxical and Psychophysiological Insomnia Based on Structural and Functional Brain Images: A Preliminary Machine Learning Study" Brain Sciences 13, no. 4: 672. https://doi.org/10.3390/brainsci13040672