
Selective Stimulus Intensity during Hotspot Search Ensures Faster and More Accurate Preoperative Motor Mapping with nTMS
 , , , , , , and
Abstract
:1. Introduction
2. Materials and Methods
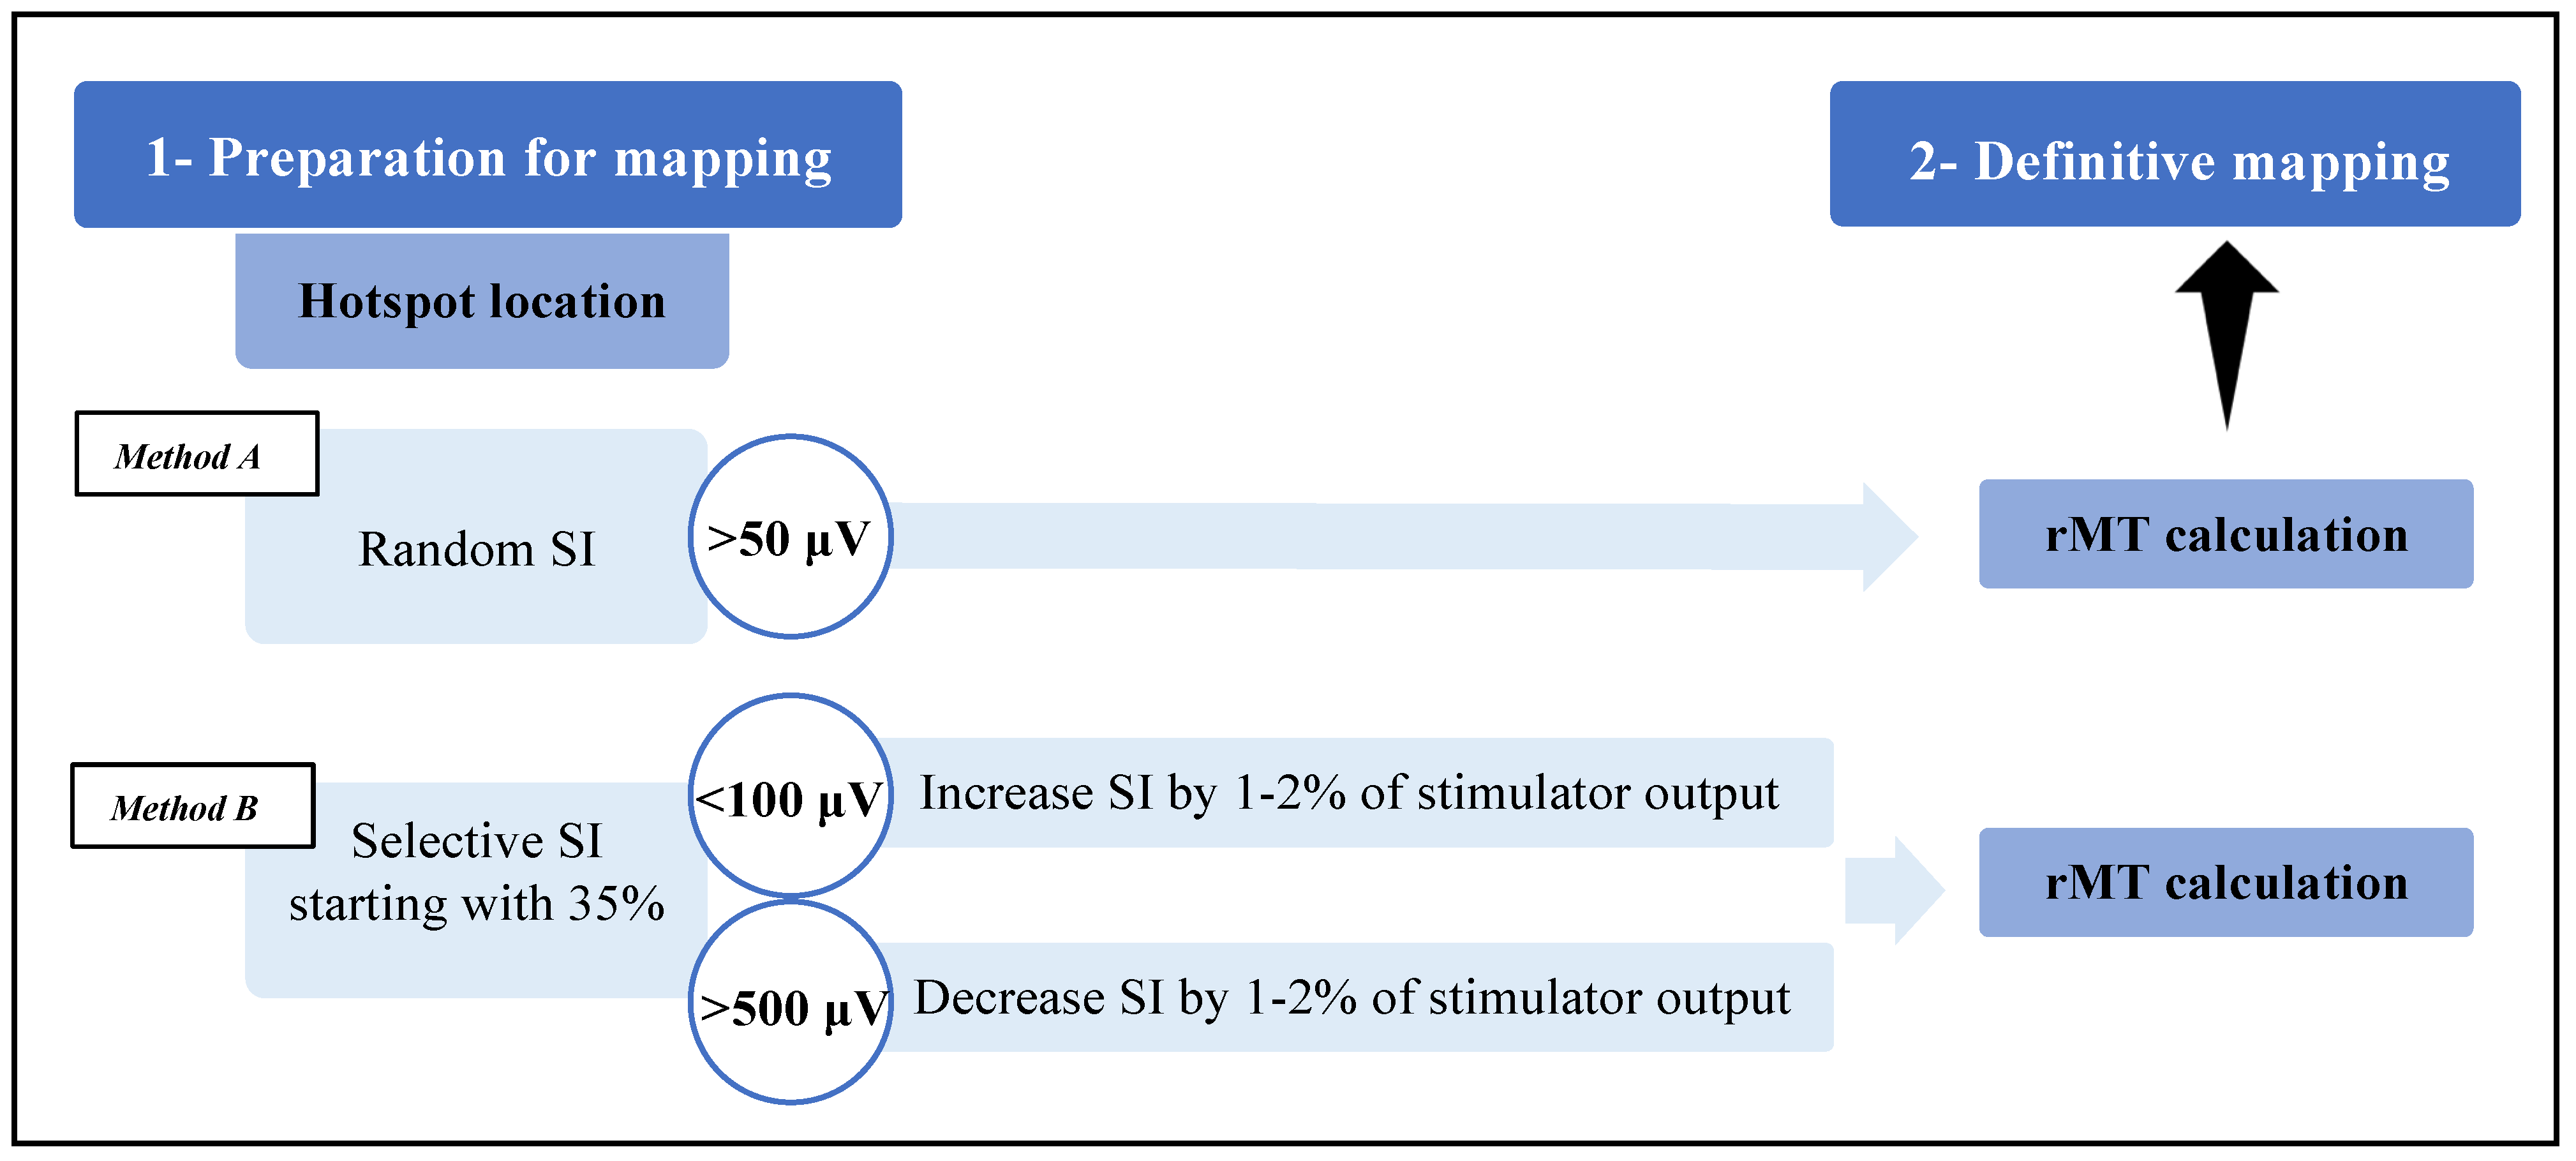
2.1. Methodological Differences
- (1)
- If their amplitude was >500 μV, the stimulation intensity was decreased by 1–2% of the stimulator power up to the range of 100–500 μV;
- (2)
- If their amplitude was <100 μV, the stimulation intensity was increased by 1–2% of the stimulator power up to the range of 100–500 μV.
2.2. Population Characteristics
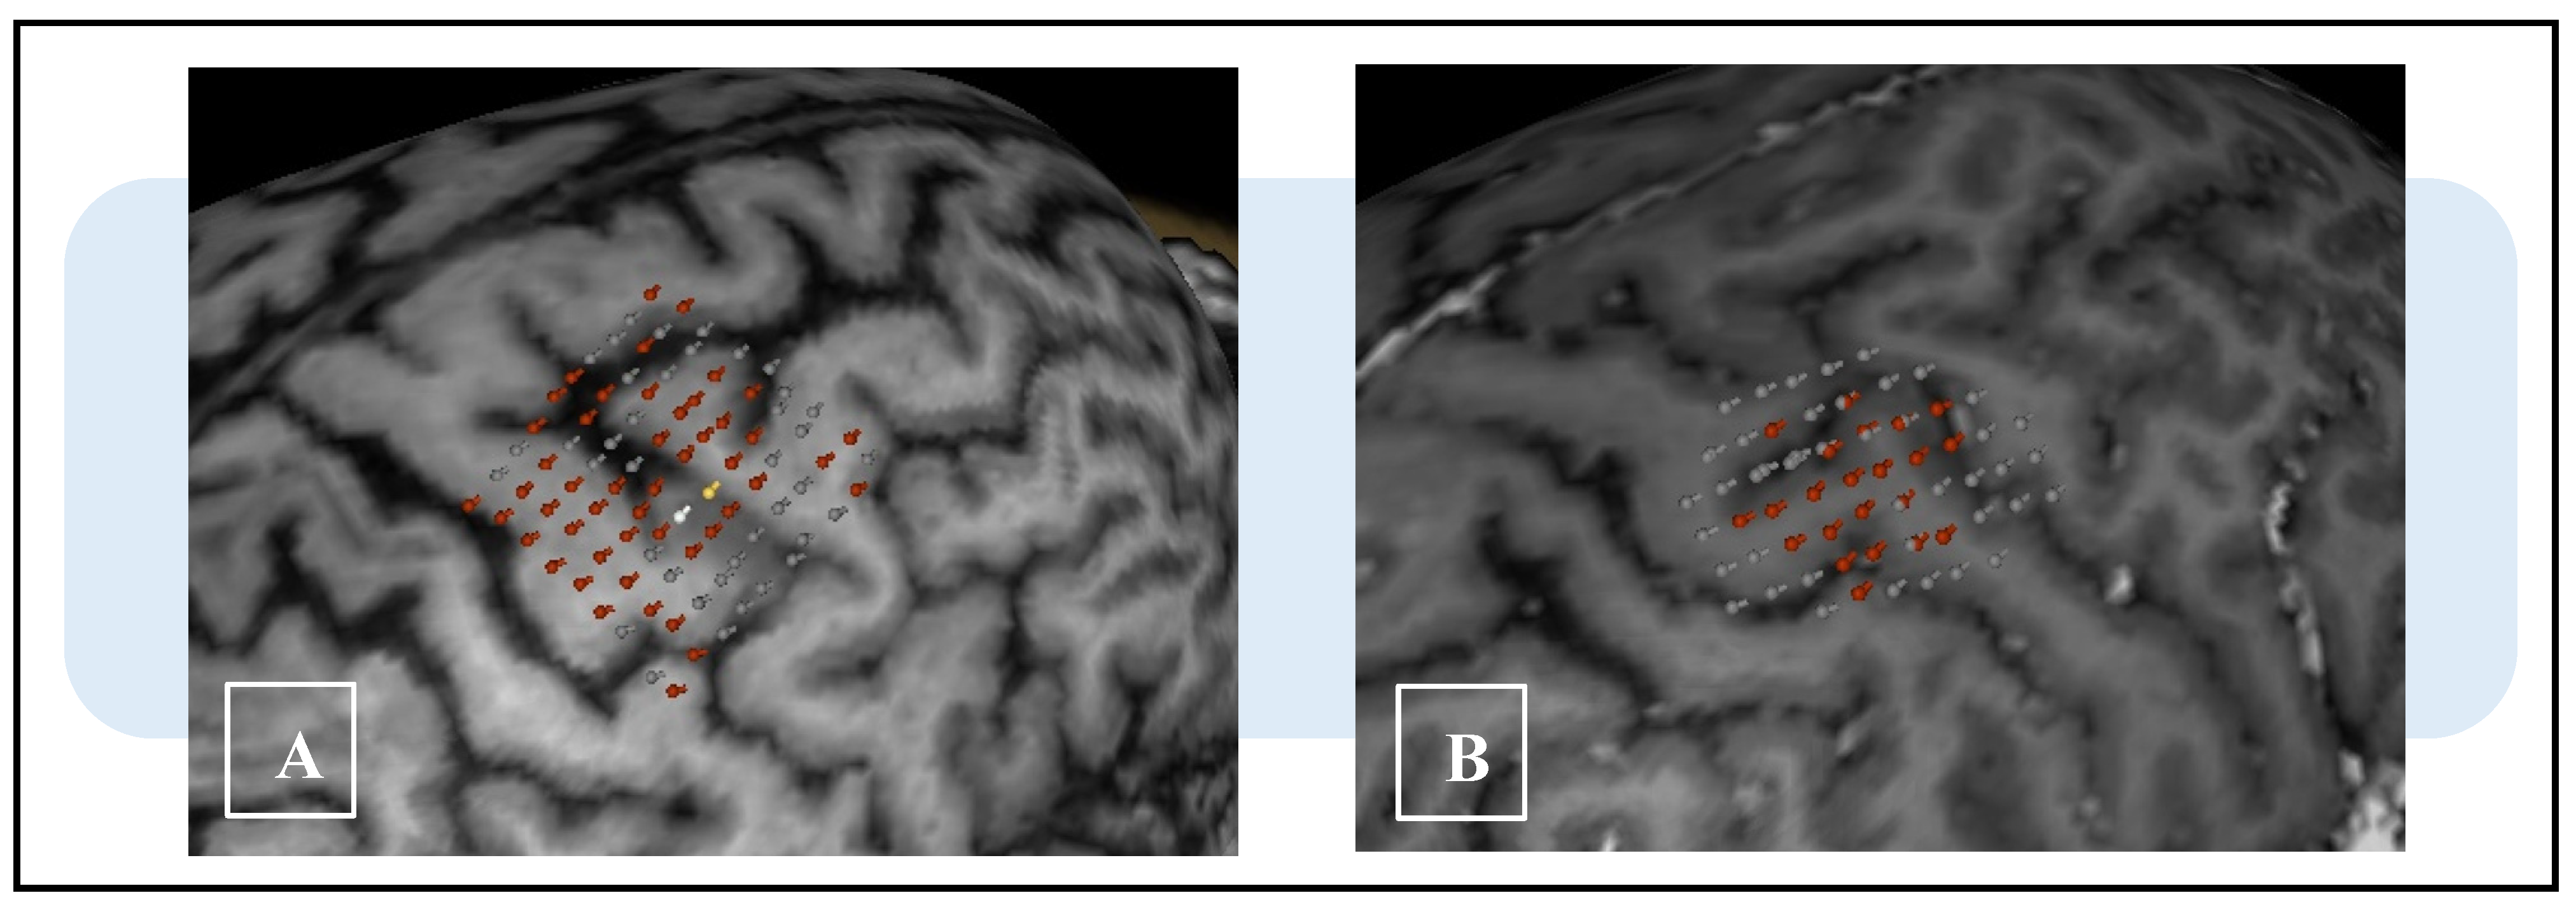
2.3. Mapping Characteristics
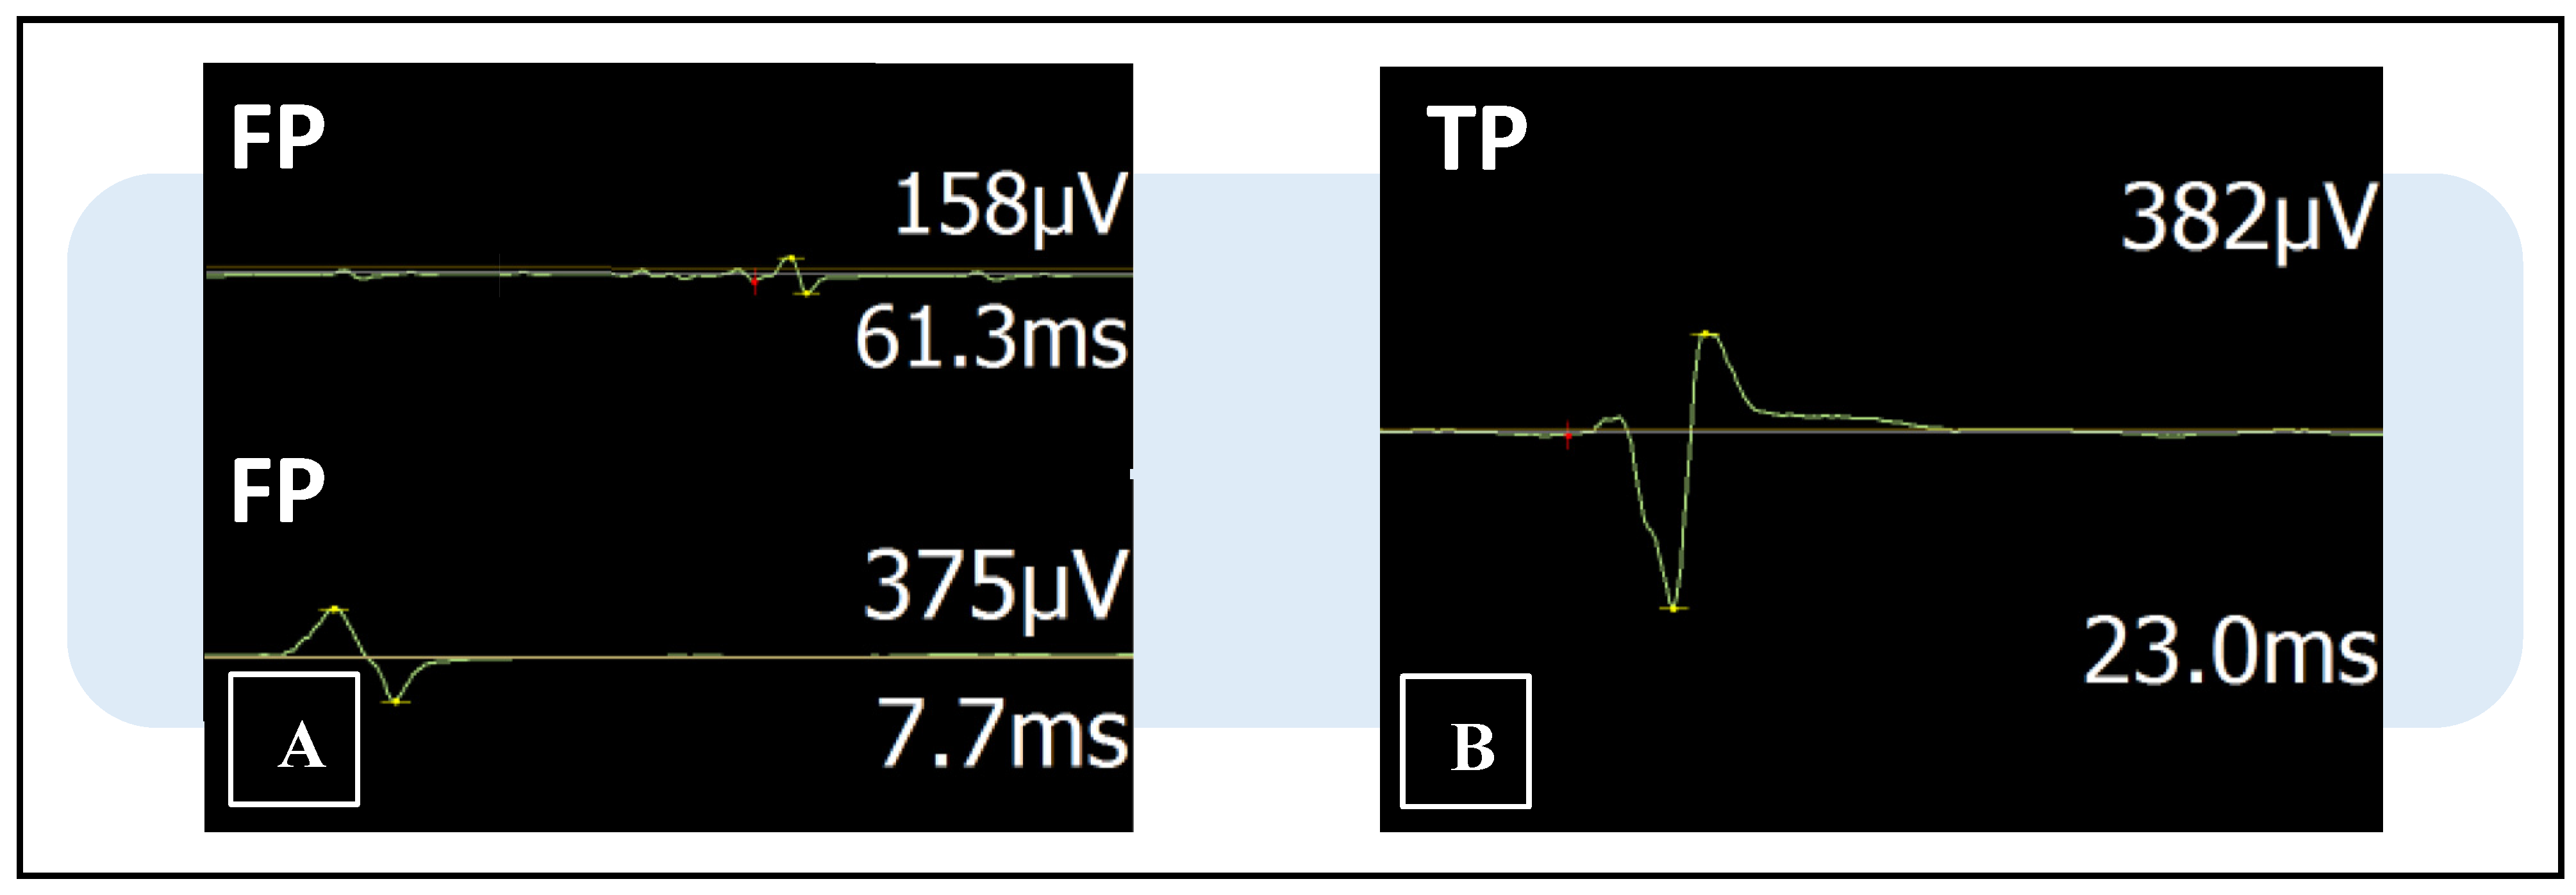
2.4. MEP Discrimination Process
2.5. Statistical Analysis
2.6. Patient Informed Consent and Ethical Approval
3. Results
3.1. Full-Sample Analysis
3.2. Subgroup Analysis
3.2.1. Upper-Limb Sample
3.2.2. Lower-Limb Sample
3.2.3. Brain-Lesion Sample
3.2.4. Medullary-Lesion Sample
4. Discussion
5. Conclusions
Author Contributions
Funding
Institutional Review Board Statement
Informed Consent Statement
Data Availability Statement
Conflicts of Interest
Abbreviations
| nTMS | Navigated transcranial magnetic stimulation |
| rMT | Resting motor threshold |
| MEP | Motor evoked potential |
| SI | Stimulation intensity |
| TP | True positive |
| FP | False positive |
| DCS | Direct cortical stimulation |
| tDCS | Transcranial direct cortical stimulation |
| WHO | World Health Organization |
| FDI | First dorsal interosseus |
| TA | Tibialis anterior |
References
- Krings, T.; Chiappa, K.H.; Foltys, H.; Reinges, M.H.T.; Cosgrove, R.G.; Thron, A.K. Introducing navigated transcranial magnetic stimulation as a refined brain mapping methodology. Neurosurg. Rev. 2001, 24, 171–179. [Google Scholar] [CrossRef] [PubMed]
- Picht, T.; Mularski, S.; Kuehn, B.; Vajkoczy, P.; Kombos, T.; Suess, O. Navigated transcranial magnetic stimulation for preoperative functional diagnostics in brain tumor surgery. Neurosurgery 2009, 65 (Suppl. 6), 93–98; discussion 98–99. [Google Scholar] [CrossRef]
- Picht, T.; Schmidt, S.; Brandt, S.; Frey, D.; Hannula, H.; Neuvonen, T.; Karhu, J.; Vajkoczy, P.; Suess, O. Preoperative Functional Mapping for Rolandic Brain Tumor Surgery: Comparison of Navigated Transcranial Magnetic Stimulation to Direct Cortical Stimulation. Neurosurgery 2011, 69, 581–589. [Google Scholar] [CrossRef] [PubMed]
- Takahashi, S.; Vajkoczy, P.; Picht, T. Navigated transcranial magnetic stimulation for mapping the motor cortex in patients with rolandic brain tumors. Neurosurg. Focus 2013, 34, E3. [Google Scholar] [CrossRef] [PubMed]
- Lefaucheur, J.-P.; Picht, T. The value of preoperative functional cortical mapping using navigated TMS. Neurophysiol. Clin. 2016, 46, 125–133. [Google Scholar] [CrossRef]
- Sollmann, N.; Krieg, S.; Säisänen, L.; Julkunen, P. Mapping of Motor Function with Neuronavigated Transcranial Magnetic Stimulation: A Review on Clinical Application in Brain Tumors and Methods for Ensuring Feasible Accuracy. Brain Sci. 2021, 11, 897. [Google Scholar] [CrossRef]
- Tarapore, P.E.; Tate, M.C.; Findlay, A.M.; Honma, S.M.; Mizuiri, D.; Berger, M.S.; Nagarajan, S.S. Preoperative multimodal motor mapping: A comparison of magnetoencephalography imaging, navigated transcranial magnetic stimulation, and direct cortical stimulation. J. Neurosurg. 2012, 117, 354–362. [Google Scholar] [CrossRef]
- Krieg, S.M.; Shiban, E.; Buchmann, N.; Gempt, J.; Foerschler, A.; Meyer, B.; Ringel, F. Utility of presurgical navigated transcranial magnetic brain stimulation for the resection of tumors in eloquent motor areas: Clinical article. J. Neurosurg. 2012, 116, 994–1001. [Google Scholar] [CrossRef]
- Frey, D.; Strack, V.; Wiener, E.; Jussen, D.; Vajkoczy, P.; Picht, T. A new approach for corticospinal tract reconstruction based on navigated transcranial stimulation and standardized fractional anisotropy values. Neuroimage 2012, 62, 1600–1609. [Google Scholar] [CrossRef]
- Frey, D.; Schilt, S.; Strack, V.; Zdunczyk, A.; Rösler, J.; Niraula, B.; Vajkoczy, P.; Picht, T. Navigated transcranial magnetic stimulation improves the treatment outcome in patients with brain tumors in motor eloquent locations. Neuro-Oncol. 2014, 16, 1365–1372. [Google Scholar] [CrossRef] [Green Version]
- Picht, T.; Schulz, J.; Hanna, M.; Schmidt, S.; Suess, O.; Vajkoczy, P. Assessment of the Influence of Navigated Transcranial Magnetic Stimulation on Surgical Planning for Tumors in or Near the Motor Cortex. Neurosurgery 2012, 70, 1248–1256. [Google Scholar] [CrossRef]
- Rosenstock, T.; Tuncer, M.S.; Münch, M.R.; Vajkoczy, P.; Picht, T.; Faust, K. Preoperative nTMS and Intraoperative Neurophysiology—A Comparative Analysis in Patients With Motor-Eloquent Glioma. Front. Oncol. 2021, 11, 676626. [Google Scholar] [CrossRef]
- Sollmann, N.; Tanigawa, N.; Bulubas, L.; Sabih, J.; Zimmer, C.; Ringel, F.; Meyer, B.; Krieg, S.M. Clinical Factors Underlying the Inter-individual Variability of the Resting Motor Threshold in Navigated Transcranial Magnetic Stimulation Motor Mapping. Brain Topogr. 2016, 30, 98–121. [Google Scholar] [CrossRef]
- Sollmann, N.; Bulubas, L.; Tanigawa, N.; Zimmer, C.; Meyer, B.; Krieg, S.M. The variability of motor evoked potential latencies in neurosurgical motor mapping by preoperative navigated transcranial magnetic stimulation. BMC Neurosci. 2017, 18, 1–15. [Google Scholar] [CrossRef]
- Sinitsyn, D.O.; Chernyavskiy, A.Y.; Poydasheva, A.G.; Bakulin, I.S.; Suponeva, N.A.; Piradov, M.A. Optimization of the Navigated TMS Mapping Algorithm for Accurate Estimation of Cortical Muscle Representation Characteristics. Brain Sci. 2019, 9, 88. [Google Scholar] [CrossRef]
- Kindred, J.; Cash, J.; Ergle, J.; Charalambous, C.; Wonsetler, E.; Bowden, M. Comparing cortico-motor hotspot identification methods in the lower extremities post-stroke: MEP amplitude vs. latency. Neurosci. Lett. 2021, 754, 135884. [Google Scholar] [CrossRef]
- Lynch, C.; Roumengous, T.; Mittal, N.; Peterson, C.L. Effects of stimulus waveform on transcranial magnetic stimulation metrics in proximal and distal arm muscles. Neurophysiol. Clin. 2022, 52, 366–374. [Google Scholar] [CrossRef]
- Sollmann, N.; Hauck, T.; Obermüller, T.; Hapfelmeier, A.; Meyer, B.; Ringel, F.; Krieg, S.M. Inter- and intraobserver variability in motor mapping of the hotspot for the abductor policis brevis muscle. BMC Neurosci. 2013, 14, 94. [Google Scholar] [CrossRef]
- Karhu, J.; Hannula, H.; Laine, J.; Ruohonen, J. Navigated Transcranial Magnetic Stimulation: Principles and Protocol for Mapping the Motor Cortex. In Transcranial Magnetic Stimulation. Neuromethods; Rotenberg, A., Horvath, J., Pascual-Leone, A., Eds.; Humana Press: New York, NY, USA, 2014; Volume 89. [Google Scholar] [CrossRef]
- Krieg, S.M.; Lioumis, P.; Mäkelä, J.P.; Wilenius, J.; Karhu, J.; Hannula, H.; Savolainen, P.; Lucas, C.W.; Seidel, K.; Laakso, A.; et al. Protocol for motor and language mapping by navigated TMS in patients and healthy volunteers; workshop report. Acta Neurochir. 2017, 159, 1187–1195. [Google Scholar] [CrossRef] [Green Version]
- Baro, V.; Caliri, S.; Sartori, L.; Facchini, S.; Guarrera, B.; Zangrossi, P.; Anglani, M.; Denaro, L.; D’Avella, D.; Ferreri, F.; et al. Preoperative Repetitive Navigated TMS and Functional White Matter Tractography in a Bilingual Patient with a Brain Tumor in Wernike Area. Brain Sci. 2021, 11, 557. [Google Scholar] [CrossRef]
- Säisänen, L.; Julkunen, P.; Niskanen, E.; Danner, N.; Hukkanen, T.; Lohioja, T.; Nurkkala, J.; Mervaala, E.; Karhu, J.; Könönen, M. Motor Potentials Evoked by Navigated Transcranial Magnetic Stimulation in Healthy Subjects. J. Clin. Neurophysiol. 2008, 25, 367–372. [Google Scholar] [CrossRef] [PubMed]
- Livingston, S.C.; Goodkin, H.P.; Ingersoll, C.D. The influence of gender, hand dominance, and upper extremity length on motor evoked potentials. J. Clin. Monit. Comput. 2010, 24, 427–436. [Google Scholar] [CrossRef] [PubMed]
- Livingston, S.C.; Friedlander, D.L.; Gibson, B.C.; Melvin, J.R. Motor evoked potential response latencies demonstrate moderate correlations with height and limb length in healthy young adults. Neurodiagn. J. 2013, 53, 63–78. [Google Scholar] [PubMed]
- Zdunczyk, A.; Schwarzer, V.; Mikhailov, M.; Bagley, B.; Rosenstock, T.; Picht, T.; Vajkoczy, P. The Corticospinal Reserve Capacity: Reorganization of Motor Area and Excitability As a Novel Pathophysiological Concept in Cervical Myelopathy. Neurosurgery 2018, 83, 810–818. [Google Scholar] [CrossRef]
- Schmidt, S.; Bathe-Peters, R.; Fleischmann, R.; Rönnefarth, M.; Scholz, M.; Brandt, S.A. Nonphysiological factors in navigated TMS studies; Confounding covariates and valid intracortical estimates. Hum. Brain Mapp. 2014, 36, 40–49. [Google Scholar] [CrossRef]
- de Goede, A.A.; Ter Braack, E.M.; van Putten, M.J.A.M. Accurate Coil Positioning is Important for Single and Paired Pulse TMS on the Subject Level. Brain Topogr. 2018, 31, 917–930. [Google Scholar] [CrossRef]
- Mirbagheri, A.; Schneider, H.; Zdunczyk, A.; Vajkoczy, P.; Picht, T. NTMS mapping of non-primary motor areas in brain tumour patients and healthy volunteers. Acta Neurochir. 2019, 162, 407–416. [Google Scholar] [CrossRef]
- Haddad, A.F.; Young, J.S.; Berger, M.S.; Tarapore, P.E. Preoperative Applications of Navigated Transcranial Magnetic Stimulation. Front. Neurol. 2021, 11, 628903. [Google Scholar] [CrossRef]
- Picht, T.; Frey, D.; Thieme, S.; Kliesch, S.; Vajkoczy, P. Presurgical navigated TMS motor cortex mapping improves outcome in glioblastoma surgery: A controlled observational study. J. Neuro-Oncol. 2015, 126, 535–543. [Google Scholar] [CrossRef]
- Raffa, G.; Scibilia, A.; Conti, A.; Ricciardo, G.; Rizzo, V.; Morelli, A.; Angileri, F.F.; Cardali, S.M.; Germanò, A. The role of navigated transcranial magnetic stimulation for surgery of motor-eloquent brain tumors: A systematic review and meta-analysis. Clin. Neurol. Neurosurg. 2019, 180, 7–17. [Google Scholar] [CrossRef]
- Thordstein, M.; Saar, K.; Pegenius, G.; Elam, M. Individual effects of varying stimulation intensity and response criteria on area of activation for different muscles in humans. A study using navigated transcranial magnetic stimulation. Brain Stimul. 2013, 6, 49–53. [Google Scholar] [CrossRef]
- Sollmann, N.; Goblirsch-Kolb, M.F.; Ille, S.; Butenschoen, V.M.; Boeckh-Behrens, T.; Meyer, B.; Ringel, F.; Krieg, S.M. Comparison between electric-field-navigated and line-navigated TMS for cortical motor mapping in patients with brain tumors. Acta Neurochir. 2016, 158, 2277–2289. [Google Scholar] [CrossRef]
- Lam, S.; Lucente, G.; Schneider, H.; Picht, T. TMS motor mapping in brain tumor patients: More robust maps with an increased resting motor threshold. Acta Neurochir. 2019, 161, 995–1002. [Google Scholar] [CrossRef]
- Rossini, P.; Barker, A.; Berardelli, A.; Caramia, M.; Caruso, G.; Cracco, R.; Dimitrijević, M.; Hallett, M.; Katayama, Y.; Lücking, C.; et al. Non-invasive electrical and magnetic stimulation of the brain, spinal cord and roots: Basic principles and procedures for routine clinical application. Report of an IFCN committee. Electroencephalogr. Clin. Neurophysiol. 1994, 91, 79–92. [Google Scholar] [CrossRef]
- Kallioniemi, E.; Julkunen, P. Alternative Stimulation Intensities for Mapping Cortical Motor Area with Navigated TMS. Brain Topogr. 2016, 29, 395–404. [Google Scholar] [CrossRef]
- van de Ruit, M.; Grey, M.J. The TMS Map Scales with Increased Stimulation Intensity and Muscle Activation. Brain Topogr. 2016, 29, 56–66. [Google Scholar] [CrossRef]
- Engelhardt, M.; Schneider, H.; Gast, T.; Picht, T. Estimation of the resting motor threshold (RMT) in transcranial magnetic stimulation using relative-frequency and threshold-hunting methods in brain tumor patients. Acta Neurochir. 2019, 161, 1845–1851. [Google Scholar] [CrossRef]
- Di Lazzaro, V.; Oliviero, A.; Pilato, F.; Saturno, E.; Insola, A.; Mazzone, P.; Tonali, P.A.; Rothwell, J.C. Descending volleys evoked by transcranial magnetic stimulation of the brain in conscious humans: Effects of coil shape. Clin. Neurophysiol. 2002, 113, 114–119. [Google Scholar] [CrossRef]
- Ahdab, R.; Ayache, S.S.; Brugières, P.; Goujon, C.; Lefaucheur, J.P. Comparison of “standard” and “navigated” procedures of TMS coil positioning over motor, premotor and prefrontal targets in patients with chronic pain and depression. Neurophysiol. Clin. 2010, 40, 27–36. [Google Scholar] [CrossRef]
- Kantelhardt, S.R.; Fadini, T.; Finke, M.; Kallenberg, K.; Siemerkus, J.; Bockermann, V.; Matthaeus, L.; Paulus, W.; Schweikard, A.; Rohde, V.; et al. Robot-assisted image-guided transcranial magnetic stimulation for somatotopic mapping of the motor cortex: A clinical pilot study. Acta Neurochir. 2010, 152, 333–343. [Google Scholar] [CrossRef]
- Niskanen, E.; Julkunen, P.; Säisänen, L.; Vanninen, R.; Karjalainen, P.; Könönen, M. Group-level variations in motor representation areas of thenar and anterior tibial muscles: Navigated Transcranial Magnetic Stimulation Study. Hum. Brain Mapp. 2010, 31, 1272–1280. [Google Scholar] [CrossRef] [PubMed]
- Julkunen, P.; Ruohonen, J.; Sääskilahti, S.; Säisänen, L.; Karhu, J. Threshold curves for transcranial magnetic stimulation to improve reliability of motor pathway status assessment. Clin. Neurophysiol. 2011, 122, 975–983. [Google Scholar] [CrossRef] [PubMed]
- Diekhoff, S.; Uludağ, K.; Sparing, R.; Tittgemeyer, M.; Cavuşoğlu, M.; von Cramon, D.Y.; Grefkes, C. Functional localization in the human brain: Gradient-Echo, Spin-Echo, and arterial spin-labeling fMRI compared with neuronavigated TMS. Hum. Brain Mapp. 2011, 32, 341–357. [Google Scholar] [CrossRef] [PubMed]
- Reijonen, J.; Pitkänen, M.; Kallioniemi, E.; Mohammadi, A.; Ilmoniemi, R.J.; Julkunen, P. Spatial extent of cortical motor hotspot in navigated transcranial magnetic stimulation. J. Neurosci. Methods 2020, 346, 108893. [Google Scholar] [CrossRef]
- Ahdab, R.; Ayache, S.S.; Brugières, P.; Farhat, W.H.; Lefaucheur, J.-P. The Hand Motor Hotspot is not Always Located in the Hand Knob: A Neuronavigated Transcranial Magnetic Stimulation Study. Brain Topogr. 2016, 29, 590–597. [Google Scholar] [CrossRef]
- Teitti, S.; Määttä, S.; Säisänen, L.; Könönen, M.; Vanninen, R.; Hannula, H.; Mervaala, E.; Karhu, J. Non-primary motor areas in the human frontal lobe are connected directly to hand muscles. NeuroImage 2008, 40, 1243–1250. [Google Scholar] [CrossRef]
- Denslow, S.; Bohning, D.E.; Bohning, P.A.; Lomarev, M.P.; George, M.S. An Increased Precision Comparison of TMS-Induced Motor Cortex BOLD fMRI Response for Image-Guided Versus Function-Guided Coil Placement. Cogn. Behav. Neurol. 2005, 18, 119–126. [Google Scholar] [CrossRef]
- Gugino, L.D.; Romero, J.R.; Aglio, L.; Titone, D.; Ramirez, M.; Pascual-Leone, A.; Grimson, E.; Weisenfeld, N.; Kikinis, R.; Shenton, M.E. Transcranial magnetic stimulation coregistered with MRI: A comparison of a guided versus blind stimulation technique and its effect on evoked compound muscle action potentials. Clin. Neurophysiol. 2001, 112, 1781–1792. [Google Scholar] [CrossRef]
- Julkunen, P.; Säisänen, L.; Danner, N.; Niskanen, E.; Hukkanen, T.; Mervaala, E.; Könönen, M. Comparison of navigated and non-navigated transcranial magnetic stimulation for motor cortex mapping, motor threshold and motor evoked potentials. Neuroimage 2009, 44, 790–795. [Google Scholar] [CrossRef]
- Meincke, J.; Hewitt, M.; Batsikadze, G.; Liebetanz, D. Automated TMS hotspot-hunting using a closed loop threshold-based algorithm. Neuroimage 2016, 124, 509–517. [Google Scholar] [CrossRef]
- Nitsche, M.A.; Paulus, W. Excitability changes induced in the human motor cortex by weak transcranial direct current stimulation. J. Physiol. 2000, 527, 633–639. [Google Scholar] [CrossRef]
- Nitsche, M.A.; Paulus, W. Sustained excitability elevations induced by transcranial DC motor cortex stimulation in humans. Neurology 2001, 57, 1899–1901. [Google Scholar] [CrossRef] [PubMed]
- Lauro, L.J.; Rosanova, M.; Mattavelli, G.; Convento, S.; Pisoni, A.; Opitz, A.; Bolognini, N.; Vallar, G. TDCS increases cortical excitability: Direct evidence from TMS–EEG. Cortex 2014, 58, 99–111. [Google Scholar] [CrossRef]
- Thickbroom, G.; Sammut, R.; Mastaglia, F. Magnetic stimulation mapping of motor cortex: Factors contributing to map area. Electroencephalogr. Clin. Neurophysiol. Mot. Control. 1998, 109, 79–84. [Google Scholar] [CrossRef]
- Yuasa, A.; Uehara, S.; Sawada, Y.; Otaka, Y. Systematic determination of muscle groups and optimal stimulation intensity for simultaneous TMS mapping of multiple muscles in the upper limb. Physiol. Rep. 2022, 10, e15527. [Google Scholar] [CrossRef]
- Pitkänen, M.; Kallioniemi, E.; Julkunen, P.; Nazarova, M.; Nieminen, J.O.; Ilmoniemi, R.J. Minimum-Norm Estimation of Motor Representations in Navigated TMS Mappings. Brain Topogr. 2017, 30, 711–722. [Google Scholar] [CrossRef]
- Weise, K.; Numssen, O.; Thielscher, A.; Hartwigsen, G.; Knösche, T.R. A novel approach to localize cortical TMS effects. Neuroimage 2019, 209, 116486. [Google Scholar] [CrossRef]
- Kallioniemi, E.; Awiszus, F.; Pitkänen, M.; Julkunen, P. Fast acquisition of resting motor threshold with a stimulus-response curve—Possibility or hazard for transcranial magnetic stimulation applications? Clin. Neurophysiol. Pract. 2022, 7, 7–15. [Google Scholar] [CrossRef]
- Julkunen, P. Methods for estimating cortical motor representation size and location in navigated transcranial magnetic stimulation. J. Neurosci. Methods 2014, 232, 125–133. [Google Scholar] [CrossRef]
- Littmann, A.E.; McHenry, C.L.; Shields, R.K. Variability of motor cortical excitability using a novel mapping procedure. J. Neurosci. Methods 2013, 214, 137–143. [Google Scholar] [CrossRef]
- Kraus, D.; Gharabaghi, A. Projecting Navigated TMS Sites on the Gyral Anatomy Decreases Inter-subject Variability of Cortical Motor Maps. Brain Stimul. 2015, 8, 831–837. [Google Scholar] [CrossRef] [PubMed]
- Takakura, T.; Muragaki, Y.; Tamura, M.; Maruyama, T.; Nitta, M.; Niki, C.; Kawamata, T. Navigated transcranial magnetic stimulation for glioma removal: Prognostic value in motor function recovery from postsurgical neurological deficits. J. Neurosurg. 2017, 127, 877–891. [Google Scholar] [CrossRef] [PubMed]
- Rosenstock, T.; Grittner, U.; Acker, G.; Schwarzer, V.; Kulchytska, N.; Vajkoczy, P.; Picht, T. Risk stratification in motor area–related glioma surgery based on navigated transcranial magnetic stimulation data. J. Neurosurg. 2017, 126, 1227–1237. [Google Scholar] [CrossRef]
- Sollmann, N.; Zhang, H.; Fratini, A.; Wildschuetz, N.; Ille, S.; Schröder, A.; Zimmer, C.; Meyer, B.; Krieg, S.M. Risk Assessment by Presurgical Tractography Using Navigated TMS Maps in Patients with Highly Motor- or Language-Eloquent Brain Tumors. Cancers 2020, 12, 1264. [Google Scholar] [CrossRef]
- Rosenstock, T.; Häni, L.; Grittner, U.; Schlinkmann, N.; Ivren, M.; Schneider, H.; Raabe, A.; Vajkoczy, P.; Seidel, K.; Picht, T. Bicentric validation of the navigated transcranial magnetic stimulation motor risk stratification model. J. Neurosurg. 2022, 136, 1194–1206. [Google Scholar] [CrossRef]
- Weiss, C.; Nettekoven, C.; Rehme, A.K.; Neuschmelting, V.; Eisenbeis, A.; Goldbrunner, R.; Grefkes, C. Mapping the hand, foot and face representations in the primary motor cortex—Retest reliability of neuronavigated TMS versus functional MRI. Neuroimage 2013, 66, 531–542. [Google Scholar] [CrossRef]
- Zhang, H.; Julkunen, P.; Schröder, A.; Kelm, A.; Ille, S.; Zimmer, C.; Pitkänen, M.; Meyer, B.; Krieg, S.; Sollmann, N. Short-Interval Intracortical Facilitation Improves Efficacy in nTMS Motor Mapping of Lower Extremity Muscle Representations in Patients with Supra-Tentorial Brain Tumors. Cancers 2020, 12, 3233. [Google Scholar] [CrossRef]
- Eibl, T.; Schrey, M.; Weigel, J.; Liebert, A.; Lange, R.; Städt, M.; Eff, F.; Holtmannspötter, M.; Steiner, H.-H. Assessing the feasibility of mapping the tibialis anterior muscle with navigated transcranial magnetic stimulation in neuro-oncologic patients. Sci. Rep. 2022, 12, 18719. [Google Scholar] [CrossRef]


| Population Characteristic | Total (n = 31) |
|---|---|
| Mean age, years (min–max) | 46.30 (11–79) |
| Gender, n (%) Female Male | 14 (45.2) 17 (54.8) |
| Pathology, n (%) Brain Telencephalic Diencephalic Medullary Intrinsic lesion Degenerative cervical myelopathy | 23 (74.2) 20 (86.9) 3 (13.1) 8 (25.8) 3 (37.5) 5 (62.5) |
| Oncological grading, n (%) Glioma I–II III–IV Metastases Meningioma Others | 17 (65.4) 8 (47.1) 9 (52.9) 3 (11.5) 2 (7.7) 4 (15.4) |
| Map Characteristic | Total (n = 63) | Group A (n = 31) | Group B (n = 32) | p Value |
|---|---|---|---|---|
| Mean age, years (min–max) | 46.30 (11–79) | 48.10 | 44.56 | - |
| Gender, n (%) Female Male | 24 (38.1) 39 (61.9) | 12 (38.7) 19 (61.3) | 12 (37.5) 20 (62.5) | 0.921 |
| Hemisphere, n (%) Right Left | 31 (49.2) 32 (50.8) | 17 (54.8) 14 (45.2) | 14 (43.8) 18 (56.3) | 0.379 |
| Limb, n (%) Upper Lower | 39 (61.9) 24 (38.1) | 20 (64.5) 11 (35.5) | 19 (59.4) 13 (40.6) | 0.674 |
| Lesion site, n (%) Brain Medullary | 37 (58.7) 26 (41.3) | 21 (67.7) 10 (32.3) | 16 (50) 16 (50) | 0.153 |
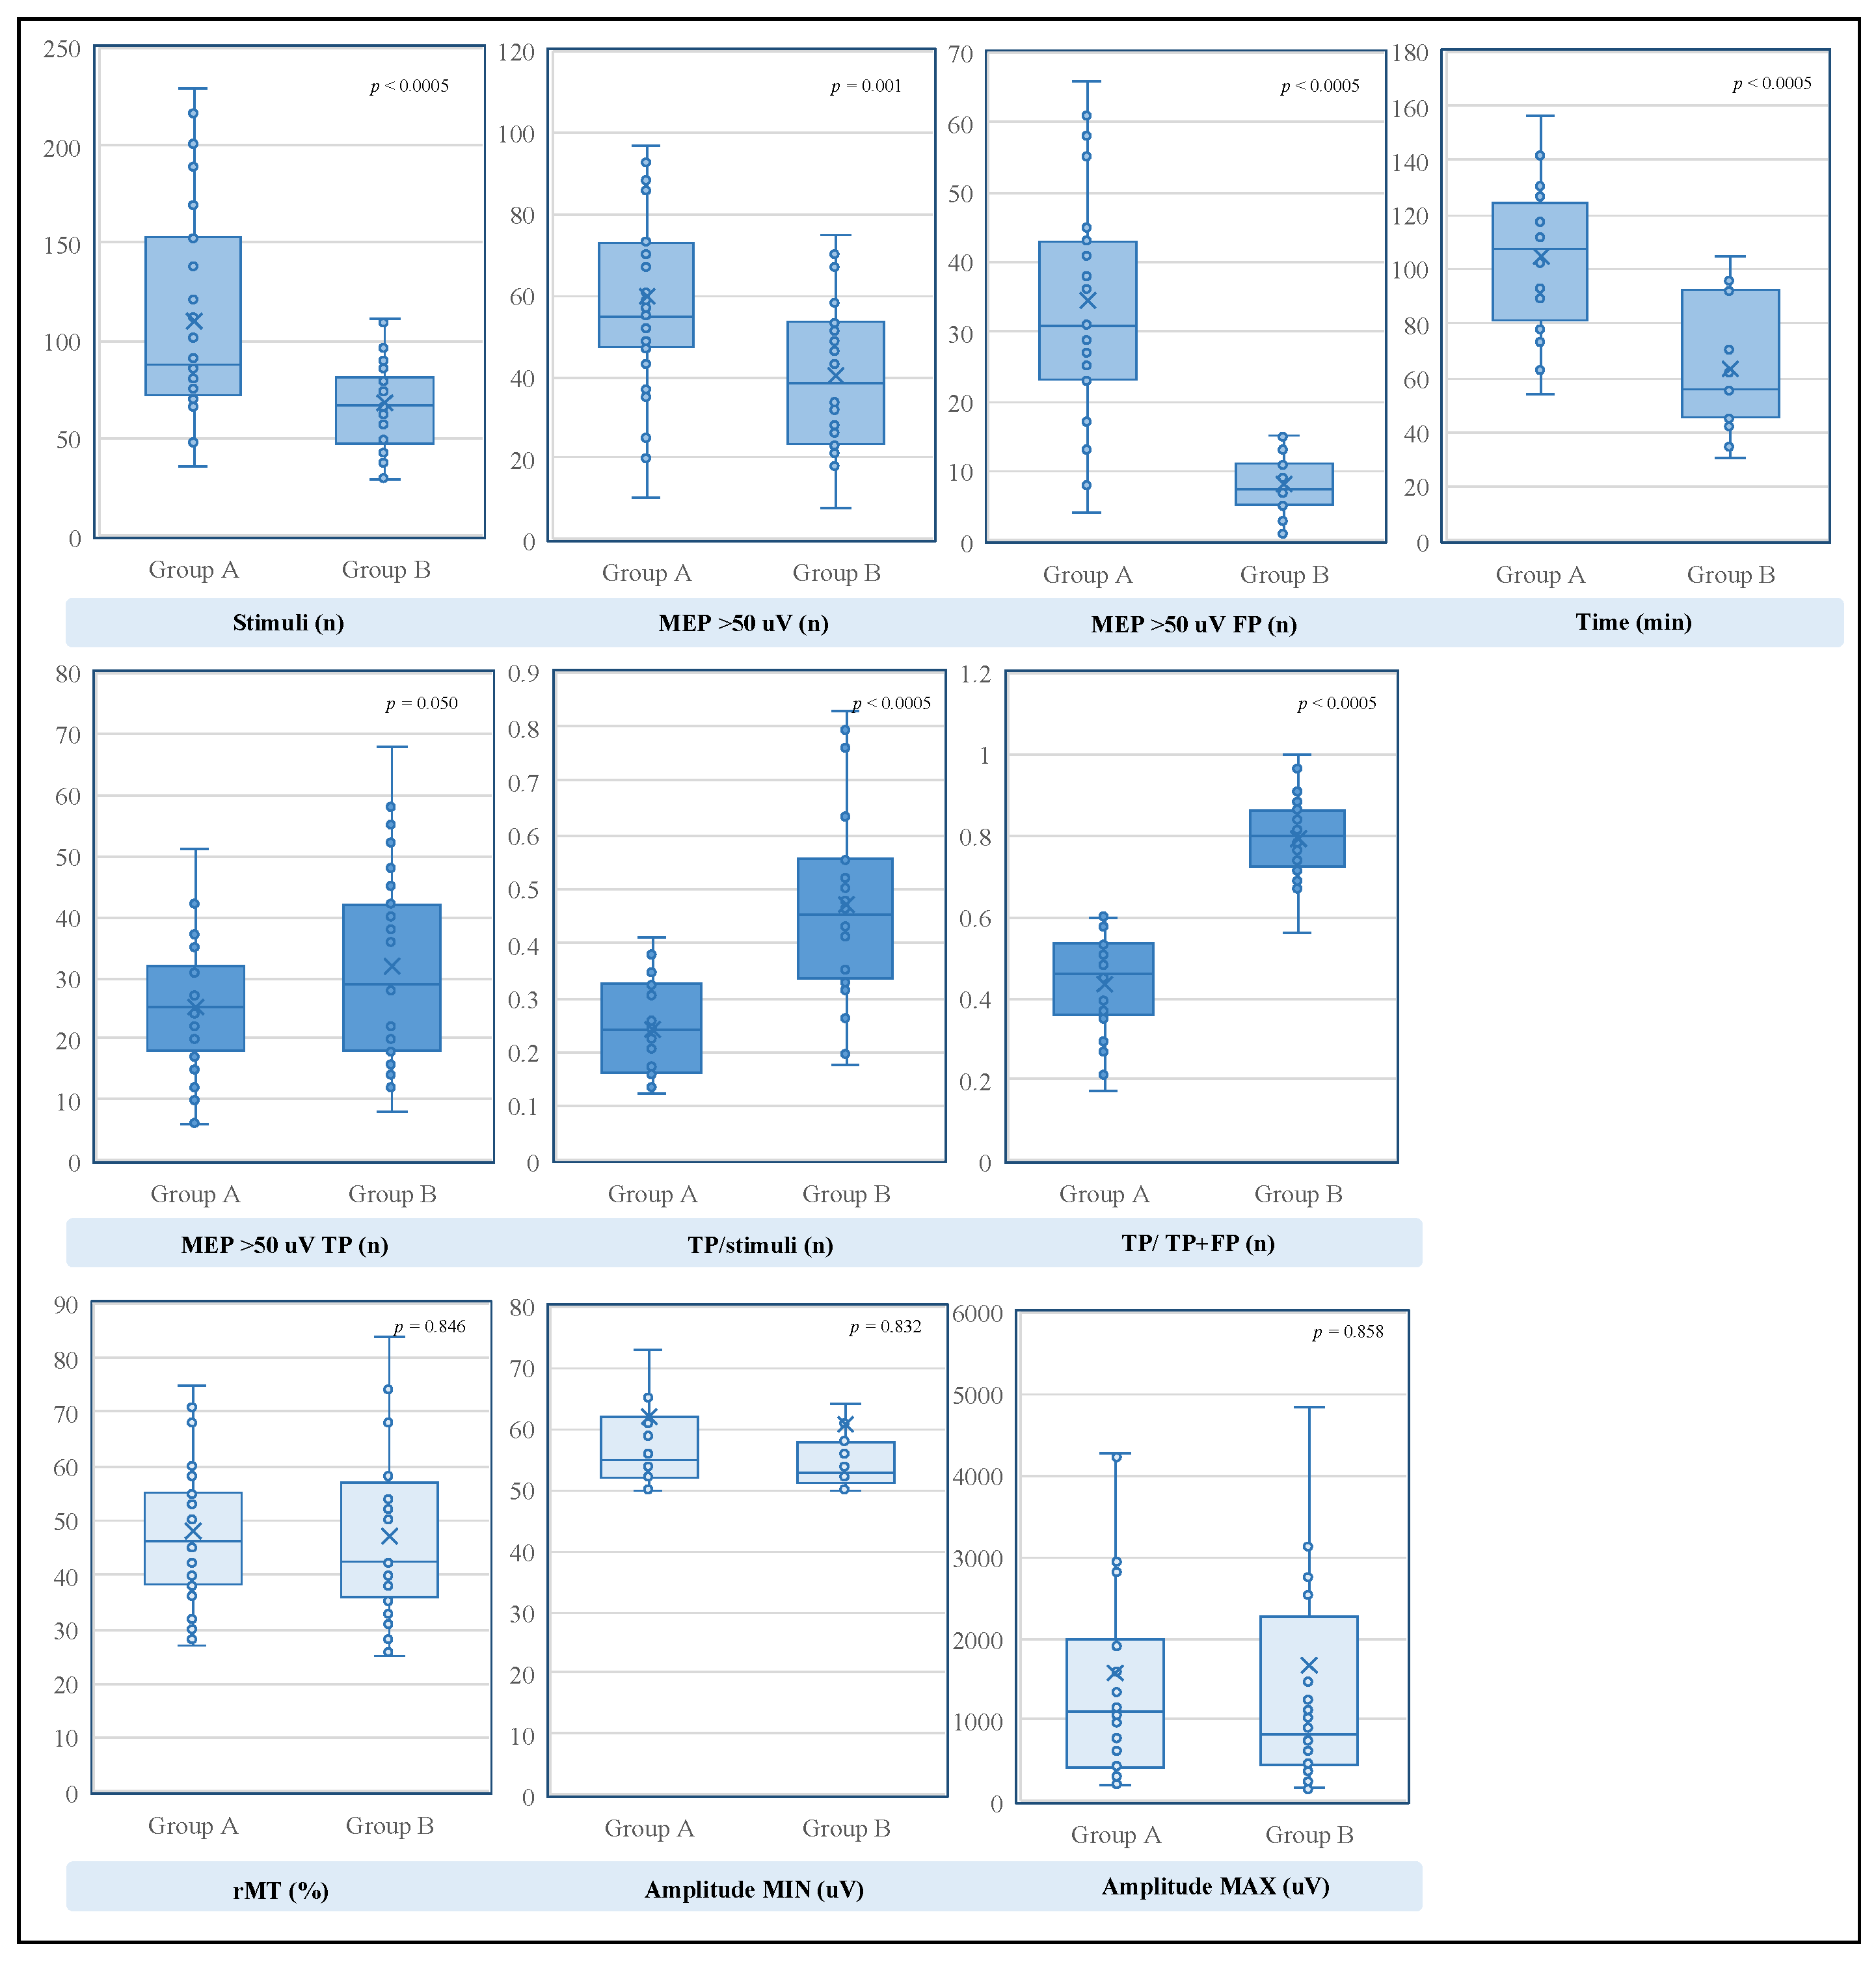
| Mapping Characteristic. Full Sample | Total (n = 63) | Group A (n = 31) | Group B (n = 32) | p Value |
| rMT, value (min–max) | 47.52% (25–92%) | 47.90% | 47.16% | 0.846 |
| Stimuli, n (min–max) | 88.73 (29–229) | 110.16 | 67.97 | <0.0005 |
| MEPs >50 uV (min–max) >50 uV TP (min–max) >50 uV FP (min–max) | 49.86 (8–119) 28.73 (6–68) 21.13 (0–87) | 59.61 25.26 34.35 | 40.41 32.09 8.31 | 0.001 0.050 <0.0005 |
| TP/stimuli, % (min–max) | 35.87 (12.5–93.33) | 24.19 | 47.18 | <0.0005 |
| TP/TP+FP, % (min–max) | 61.79 (17.14–100) | 43.73 | 79.27 | <0.0005 |
| Amplitude, uV (min–max) min max | 61.27 (50–176) 1626.81 (163–8465) | 61.84 1585.55 | 60.72 1666.78 | 0.832 0.858 |
| Time, min (min–max) | 84.39 (30–156) | 104.50 | 62.93 | <0.0005 |
| Mapping characteristic Upper Limb | Total (n = 39) | Group A (n = 20) | Group B (n = 19) | p value |
| rMT, value (min–max) | 38.46% (25–55%) | 40.25% | 36.58% | 0.148 |
| Stimuli, n (min–max) | 103.26 (30–229) | 128.15 | 77.05 | 0.001 |
| MEPs >50 uV (min–max) >50 uV TP (min–max) >50 uV FP (min–max) | 58.03 (8–119) 34.56 (8–68) 23.46 (0–87) | 67.40 30.50 36.90 | 48.16 38.84 9.32 | 0.010 0.051 <0.0005 |
| TP/stimuli, % (min–max) | 38.39 (13.97–93.33) | 26.51 | 50.91 | <0.0005 |
| TP/TP+FP, % (min–max) | 64.1 (26.89–100) | 47.80 | 81.25 | <0.0005 |
| Amplitude, uV (min–max) min max | 60.33 (50–176) 2042.13 (163–8465) | 59.95 1964.70 | 60.74 2123.63 | 0.912 0.815 |
| Mapping characteristic Lower Limb | Total (n = 24) | Group A (n = 11) | Group B (n = 13) | pvalue |
| rMT, value (min–max) | 62.25% (42–92%) | 61.82% | 62.62% | 0.875 |
| Stimuli, n (min–max) | 65.13 (29–113) | 77.45 | 54.69 | 0.009 |
| MEPs >50 uV (min–max) >50 uV TP (min–max) >50 uV FP (min–max) | 36.58 (10–70) 19.25 (6–38) 17.33 (3–43) | 45.45 15.73 29.73 | 29.08 22.23 6.85 | 0.010 0.055 <0.0005 |
| TP/stimuli, % (min–max) | 31.76 (12.5–79.31) | 19.98 | 41.73 | <0.0005 |
| TP/TP+FP, % (min–max) | 58.04 (17.14–88.46) | 36.35 | 76.39 | <0.0005 |
| Amplitude, uV (min–max) min max | 62.79 (50–119) 951.92 (163–2955) | 65.27 896.18 | 60.69 999.08 | 0.567 0.763 |
| Mapping characteristic Brain lesion | Total (n = 37) | Group A (n = 21) | Group B (n = 16) | p value |
| rMT, value (min–max) | 44.76% (25–92%) | 46.43% | 42.56% | 0.454 |
| Stimuli, n (min–max) | 92.57 (29–229) | 107.90 | 72.44 | 0.015 |
| MEPs >50 uV (min–max) >50 uV TP (min–max) >50 uV FP (min–max) | 53.70 (21–119) 27.89 (6–58) 25.81 (1–87) | 61.43 23.86 37.57 | 43.56 33.19 10.38 | 0.017 0.022 <0.0005 |
| TP/stimuli, % (min–max) | 354.07 (12.5–93.33) | 23.37 | 48.12 | <0.0005 |
| TP/TP+FP, % (min–max) | 55.36 (17.14–96.55) | 39.82 | 75.75 | <0.0005 |
| Amplitude, uV (min–max) min max | 62.03 (50–176) 1818.81 (192–6639) | 62.10 1827.81 | 61.94 1807.00 | 0.985 0.972 |
| Mapping characteristic Medullary lesion | Total (n = 26) | Group A (n = 10) | Group B (n = 16) | p value |
| rMT, value (min–max) | 51.46% (28–84%) | 51% | 51.75% | 0.898 |
| Stimuli, n (min–max) | 83.27 (35–201) | 114.90 | 63.50 | 0.003 |
| MEPs >50 uV (min–max) >50 uV TP (min–max) >50 uV FP (min–max) | 44.38 (8–94) 29.92 (6–68) 14.46 (0–45) | 55.8 28.2 27.6 | 37.25 31 6.25 | 0.053 0.671 <0.0005 |
| TP/stimuli, % (min–max) | 35.87 (12.5–93.33) | 25.92 | 46.24 | 0.002 |
| TP/TP+FP, % (min–max) | 61.79 (17.14–100) | 51.96 | 82.80 | <0.0005 |
| Amplitude, uV (min–max) min max | 61.27 (50–176) 1626.81 (163–8465) | 61.3 1076.8 | 59.5 1526.56 | 0.772 0.547 |
Disclaimer/Publisher’s Note: The statements, opinions and data contained in all publications are solely those of the individual author(s) and contributor(s) and not of MDPI and/or the editor(s). MDPI and/or the editor(s) disclaim responsibility for any injury to people or property resulting from any ideas, methods, instructions or products referred to in the content. |
© 2023 by the authors. Licensee MDPI, Basel, Switzerland. This article is an open access article distributed under the terms and conditions of the Creative Commons Attribution (CC BY) license (https://creativecommons.org/licenses/by/4.0/).
Share and Cite
Sartori, L.; Caliri, S.L.; Baro, V.; Colasanti, R.; Furlanis, G.M.; D’Amico, A.; De Nardi, G.; Ferreri, F.; Corbetta, M.; d’Avella, D.; et al. Selective Stimulus Intensity during Hotspot Search Ensures Faster and More Accurate Preoperative Motor Mapping with nTMS. Brain Sci. 2023, 13, 285. https://doi.org/10.3390/brainsci13020285
Sartori L, Caliri SL, Baro V, Colasanti R, Furlanis GM, D’Amico A, De Nardi G, Ferreri F, Corbetta M, d’Avella D, et al. Selective Stimulus Intensity during Hotspot Search Ensures Faster and More Accurate Preoperative Motor Mapping with nTMS. Brain Sciences. 2023; 13(2):285. https://doi.org/10.3390/brainsci13020285
Chicago/Turabian StyleSartori, Luca, Samuel Luciano Caliri, Valentina Baro, Roberto Colasanti, Giulia Melinda Furlanis, Alberto D’Amico, Gianluigi De Nardi, Florinda Ferreri, Maurizio Corbetta, Domenico d’Avella, and et al. 2023. "Selective Stimulus Intensity during Hotspot Search Ensures Faster and More Accurate Preoperative Motor Mapping with nTMS" Brain Sciences 13, no. 2: 285. https://doi.org/10.3390/brainsci13020285