
Prediction of Cognitive Degeneration in Parkinson’s Disease Patients Using a Machine Learning Method


Abstract
:1. Introduction
2. Methods
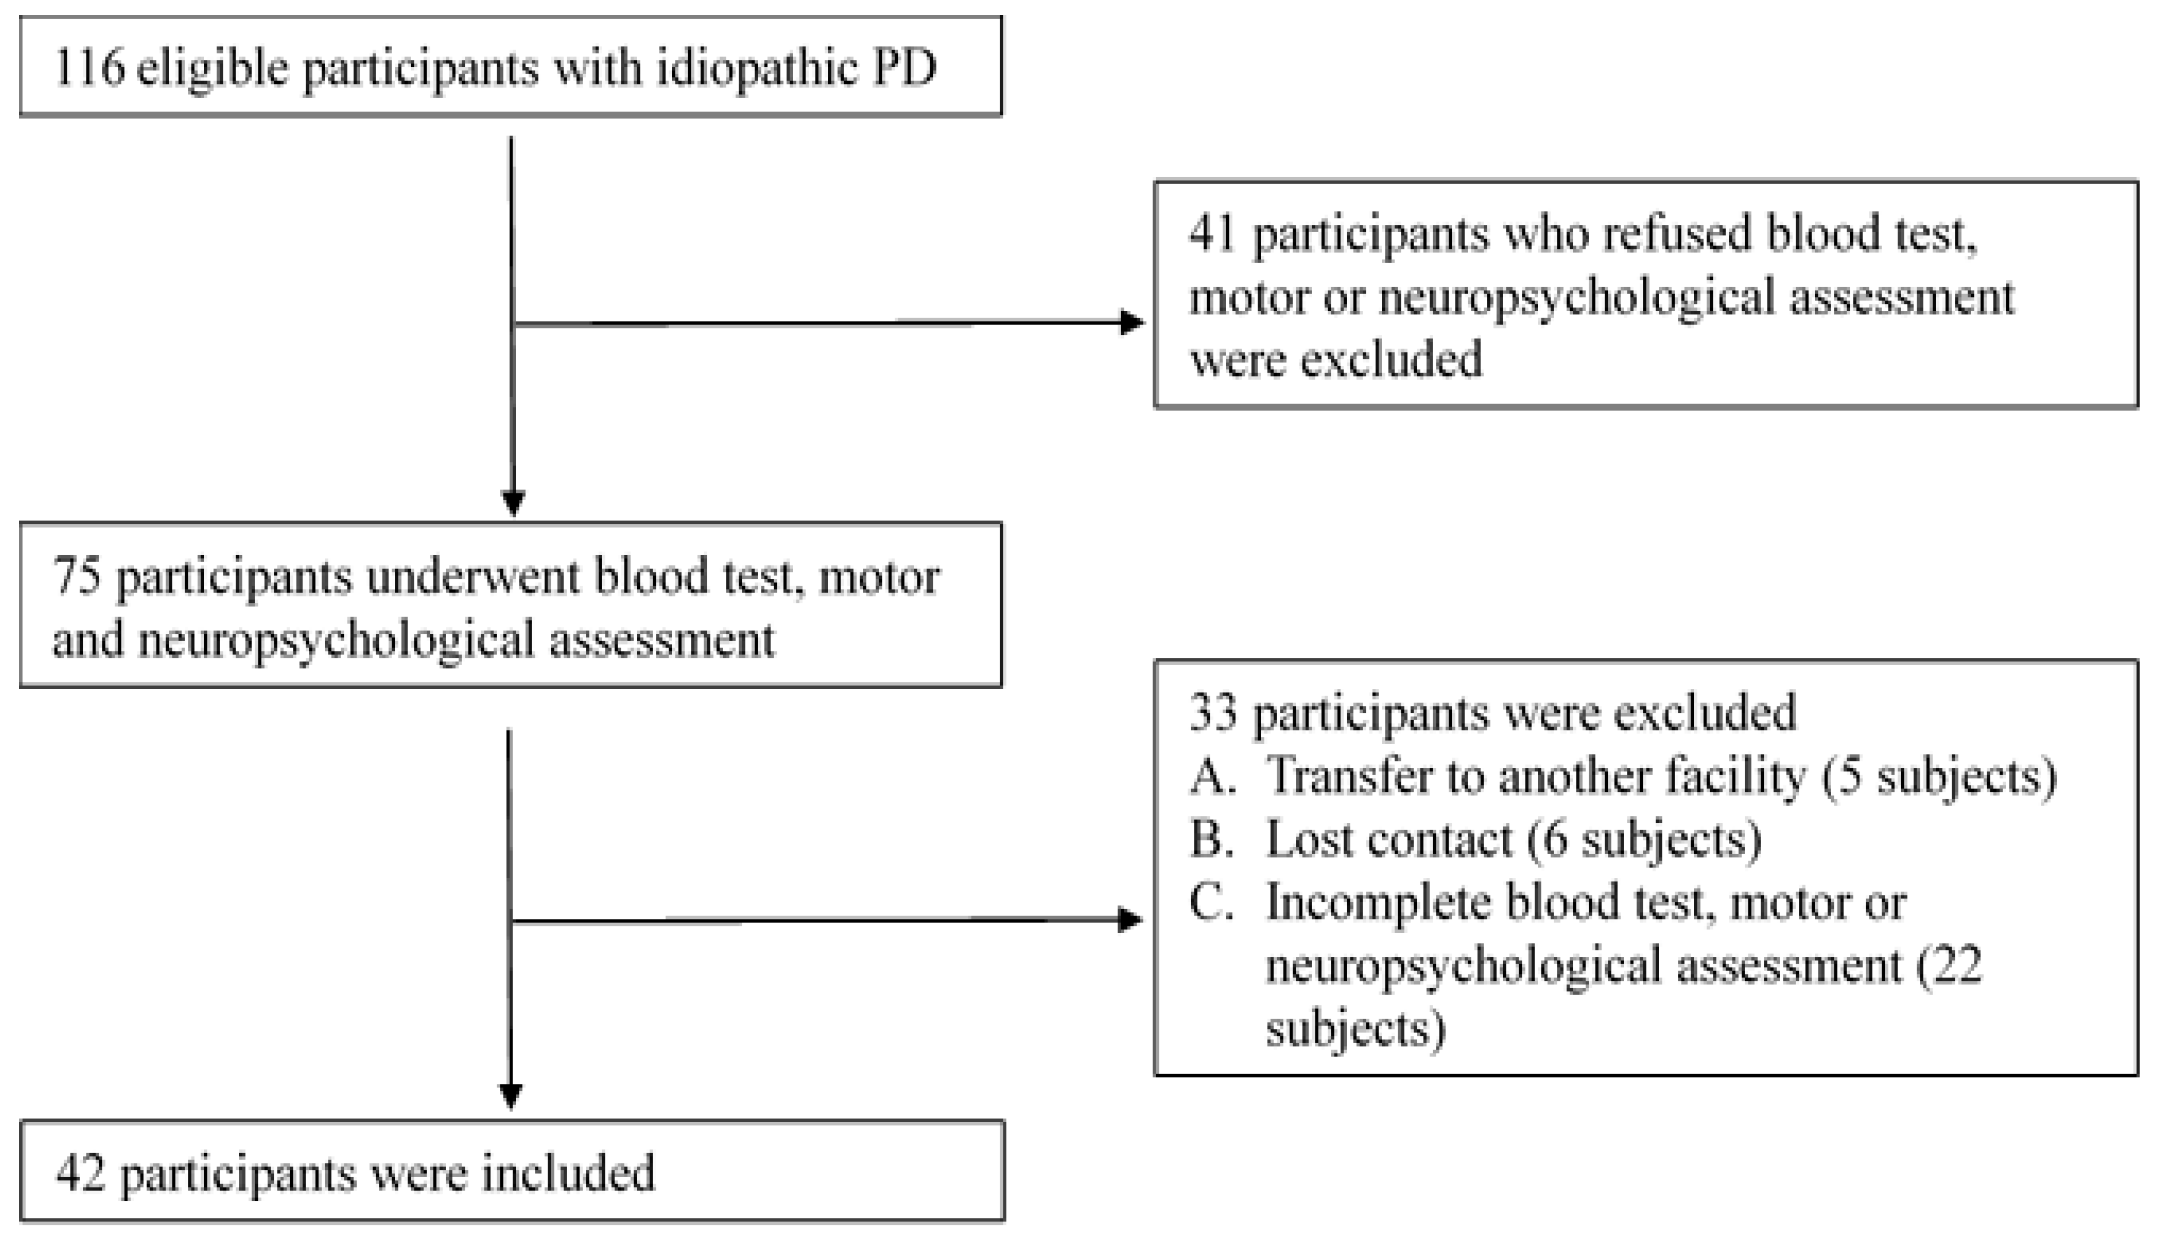
2.1. Participants
2.2. Clinical Data
2.3. Neurobiological Indicator
2.4. Data Analysis
2.5. Data Normalization
2.6. SVM
2.7. PCA
2.8. Area under the Receiver Operating Curve
3. Results
4. Discussion
Author Contributions
Funding
Institutional Review Board Statement
Informed Consent Statement
Data Availability Statement
Acknowledgments
Conflicts of Interest
References
- Poewe, W. Non-motor symptoms in Parkinson’s disease. Eur. J. Neurol. 2008, 15, 14–20. [Google Scholar] [CrossRef] [PubMed]
- Dubois, B.; Pillon, B. Cognitive deficits in Parkinson’s disease. J. Neurol. 1997, 244, 2–8. [Google Scholar] [CrossRef] [PubMed]
- Caballol, N.; Marti, M.J.; Tolosa, E. Cognitive dysfunction and dementia in Parkinson disease. Mov. Disord. 2007, 22 (Suppl. 17), S358–S366. [Google Scholar] [CrossRef] [PubMed]
- Saredakis, D.; Collins-Praino, L.E.; Gutteridge, D.S.; Stephan, B.C.M.; Keage, H.A.D. Conversion to MCI and dementia in Parkinson’s disease: A systematic review and meta-analysis. Parkinsonism Relat. Disord. 2019, 65, 20–31. [Google Scholar] [CrossRef] [PubMed]
- Kalia, L.V. Biomarkers for cognitive dysfunction in Parkinson’s disease. Parkinsonism Relat. Disord. 2018, 46, S19–S23. [Google Scholar] [CrossRef] [PubMed]
- Vitale, A.; Villa, R.; Ugga, L.; Romeo, V.; Stanzione, A.; Cuocolo, R. Artificial intelligence applied to neuroimaging data in Parkinsonian syndromes: Actuality and expectations. Math. Biosci. Eng. 2021, 18, 1753–1773. [Google Scholar] [CrossRef]
- Jones, J.D.; Kuhna, T.P.; Szymkowiczb, S.M. Reverters from PD-MCI to cognitively intact are at risk for future cognitive impairment: Analysis of the PPMI cohort. Parkinsonism Relat. Disord. 2018, 47, 3–7. [Google Scholar] [CrossRef]
- Morales, D.A.; Vives-Gilabert, Y.; Gómez-Ansón, B.; Bengoetxea, E.; Larrañaga, P.; Bielza, C.; Pagonabarraga, J.; Kulisevsky, J.; Corcuera-Solano, I.; Delfino, M. Predicting dementia development in Parkinson’s disease using Bayesian network classifiers. Psychiatry Res. 2013, 213, 92–98. [Google Scholar] [CrossRef]
- Berlyand, Y.; Weintraub, D.; Xie, S.X.; Mellis, I.A.; Doshi, J.; Rick, J.; McBride, J.; Davatzikos, C.; Shaw, L.M.; Hurtig, H.; et al. An Alzheimer’s disease-derived biomarker signature identifies Parkinson’s disease patients with dementia. PLoS ONE 2016, 11, e0147319. [Google Scholar] [CrossRef] [Green Version]
- Chang, C.W.; Yang, S.Y.; Yang, C.C.; Chang, C.W.; Wu, Y.R. Plasma and serum alpha-synuclein as a biomarker of diagnosis in patients with Parkinson’s disease. Front. Neurol. 2019, 10, 1388. [Google Scholar] [CrossRef] [Green Version]
- Chen, C.H.; Lee, B.C.; Lin, C.H. Integrated plasma and neuroimaging biomarkers associated with motor and cognition severity in Parkinson’s disease. J. Parkinsons Dis. 2020, 10, 77–88. [Google Scholar] [CrossRef] [PubMed]
- Lin, W.T.; Shaw, J.S.; Cheng, F.Y.; Chen, P.H. Plasma total tau predicts executive dysfunction in Parkinson’s disease. Acta Neurol. Scand. 2022, 145, 30–37. [Google Scholar] [CrossRef] [PubMed]
- Postuma, R.B.; Berg, D.; Stern, M.; Poewe, W.; Olanow, C.W.; Oertel, W.; Obeso, J.; Marek, K.; Litvan, I.; Lang, A.E.; et al. MDS clinical diagnostic criteria for Parkinson’s disease. Mov. Disord. 2015, 30, 1591–1601. [Google Scholar] [CrossRef] [PubMed]
- Hughes, A.J.; Daniel, S.E.; Kilford, L.; Lees, A.J. Accuracy of clinical diagnosis of idiopathic Parkinson’s disease: A clinico-pathological study of 100 cases. J. Neurol. Neurosurg. Psychiatry 1992, 55, 181–184. [Google Scholar] [CrossRef] [Green Version]
- Kahn, L.; Mathkour, M.; Lee, S.X.; Gouveia, E.E.; Hanna, J.A.; Garces, J.; Scullen, T.; McCormack, E.; Riffle, J.; Glynn, R.; et al. Long-term outcomes of deep brain stimulation in severe Parkinson’s disease utilizing UPDRS III and modified Hoehn and Yahr as a severity scale. Clin. Neurol. Neurosurg. 2019, 179, 67–73. [Google Scholar] [CrossRef]
- Siciliano, M.; Micco, R.D.; Trojano, L.; Stefano, M.D.; Baiano, C.; Passaniti, C.; Mase, A.D.; Russo, A.; Tedeschi, G.; Tessitore, A. Cognitive impairment is associated with Hoehn and Yahr stages in early, de novo Parkinson disease patients. Parkinsonism Relat. Disord. 2017, 41, 86–91. [Google Scholar] [CrossRef]
- Winser, S.J.; Kannan, P.; Bello, U.M.; Whitney, S. Measures of balance and falls risk prediction in people with Parkinson’s disease: A systematic review of psychometric properties. Clin. Rehabil. 2019, 33, 1949–1962. [Google Scholar] [CrossRef]
- Sangarapillai, K.; Norman, B.M.; Almeida, Q.J. Boxing vs sensory exercise for Parkinson’s disease: A double-blinded randomized controlled trial. Neurorehabil. Neural. Repair. 2021, 35, 769–777. [Google Scholar] [CrossRef]
- Polo-Morales, A.; Alcocer-Salas, Á.; Rodríguez-Violante, M.; Pinto-Solís, D.; Solís-Vivanco, R.; Cervantes-Arriaga, A. Association between somatization and nonmotor symptoms severity in people with Parkinson disease. J. Geriatr. Psychiatry Neurol. 2021, 34, 60–65. [Google Scholar] [CrossRef]
- Folstein, M.F.; Folstein, S.E.; McHugh, P.R. “Mini-mental state”: A practical method for grading the cognitive state of patients for the clinician. J. Psychiatr. Res. 1975, 12, 189–198. [Google Scholar] [CrossRef]
- Lynch, C.A.; Walsh, C.; Blanco, A.; Moran, M.; Coen, R.F.; Walsh, J.B.; Lawlor, B.A. The Clinical Dementia Rating Sum of Box Score in mild dementia. Dement. Geriatr. Cogn. Disord. 2006, 21, 40–43. [Google Scholar] [CrossRef] [PubMed]
- Dennis, N.; Michael, P.A.P.; Jane, H. Learning nonwords: The Hebb repetition effect as a model of word learning. Memory 2018, 26, 852–857. [Google Scholar]
- Woods, S.P.; Delis, D.C.; Scott, J.C.; Kramer, J.H.; Holdnack, J.A. The California Verbal Learning Test—Second edition: Test-retest reliability, practice effects, and reliable change indices for the standard and alternate forms. Arch. Clin. Neuropsychol. 2006, 21, 413–420. [Google Scholar] [CrossRef] [PubMed] [Green Version]
- Nevado, A.; Río, D.D.; Martín-Aragoneses, M.T.; Prados, J.A.; López-Higes, R. Preserved semantic categorical organization in mild cognitive impairment: A network analysis of verbal fluency. Neuropsychologia 2021, 157, 107875-1–107875-8. [Google Scholar] [CrossRef] [PubMed]
- Tallberg, I.M. The Boston Naming Test in Swedish: Normative data. Brain Lang. 2005, 94, 19–31. [Google Scholar] [CrossRef]
- Nascimento Silva, R.D.; Afonso, S.V.; Felipe, L.R.; Oliveira, R.A.; Martins, L.J.P.; Souza, L.A.P.S.D. Dual-task intervention based on trail making test: Effects on Parkinson’s disease. J. Bodyw. Mov. 2021, 27, 628–633. [Google Scholar] [CrossRef]
- Qualls, C.E.; Bliwise, N.G.; Stringer, A.Y. Short forms of The Benton Judgment of Line Orientation Test: Development and psychometric properties. Arch. Clin. Neuropsychol. 2000, 1, 159–163. [Google Scholar]
- Chen, P.H.; Lien, C.W.; Wu, W.C.; Lee, L.S.; Shaw, J.S. Gait-based machine learning for classifying patients with different types of mild cognitive impairment. J. Med. Syst. 2020, 44, 1–6. [Google Scholar] [CrossRef]
- Jain, S.; Shukla, S.; Wadhvani, R. Dynamic selection of normalization techniques using data complexity measures. Expert Syst. Appl. 2018, 106, 252–262. [Google Scholar] [CrossRef]
- Singh, D.; Singh, B. Investigating the impact of data normalization on classification performance. Appl. Soft Comput. 2020, 97, 105524-1–105524-23. [Google Scholar] [CrossRef]
- Liu, Z.; Xu, H. Kernel parameter selection for support vector machine classification. J. Algorithm Comput. Technol. 2014, 8, 163–177. [Google Scholar] [CrossRef]
- Gu, X.; Chen, C.; Yang, Y.; Miao, X.; Yao, B. Reliability prediction of further transit service based on support vector machine. Meas Control. 2020, 54, 845–855. [Google Scholar] [CrossRef]
- Yu, Y.; Shao, M.; Jiang, L.; Ke, Y.; Wei, D.; Zhang, D.; Jiang, M.; Yang, Y. Quantitative analysis of multiple components based on support vector machine (SVM). Optik 2021, 237, 166759-1–166759-6. [Google Scholar] [CrossRef]
- Ali, A.K.; Erçelebi, E. Automatic modulation classification using different neural network and PCA combinations. Expert Syst. Appl. 2021, 178, 114931-1–114931-17. [Google Scholar] [CrossRef]
- Qaraei, M.; Abbaasi, S.; Ghiasi-Shirazi, K. Randomized nonlinear PCA networks. Inf. Sci. 2021, 545, 241–253. [Google Scholar] [CrossRef]
- Zhang, J.; Zhou, D.; Chen, M. Monitoring multimode processes: A modified PCA algorithm with continual learning ability. J. Process. Control. 2021, 103, 76–86. [Google Scholar] [CrossRef]
- Mandrekar, J.N. Receiver operating characteristic curve in diagnostic test assessment. J. Thorac. Oncol. 2010, 5, 1315–1316. [Google Scholar] [CrossRef] [Green Version]
- Williams, M.M.; Storandt, M.; Roe, C.M.; Morris, J.C. Progression of Alzheimer’s disease as measured by Clinical Dementing Rating Sum of Boxes scores. Alzheimers Dement. 2013, 9, S39–S44. [Google Scholar] [CrossRef] [Green Version]
- Samtani, M.N.; Raghavan, N.; Novak, G.; Nandy, P.; Narayan, V.A. Disease progression model for Clinical Dementia Rating-Sum of Boxes in mild cognitive impairment and Alzheimer’s subjects from the Alzheimer’s Disease Neuroimaging Initiative. Neuropsychiatr. Dis. Treat. 2014, 10, 929–952. [Google Scholar] [CrossRef] [Green Version]
- Wyman-Chick, K.A.; Scott, B.J. Development of clinical dementia rating scale cut-off scores for patients with parkinson’s disease. Mov. Disord. Clin. Pract. 2015, 2, 243–248. [Google Scholar] [CrossRef] [Green Version]
- Levy, G.; Jacobs, D.M.; Tang, M.X.; Côté, L.J.; Louis, E.D.; Alfaro, B.; Mejia, H.; Stern, Y.; Marder, K. Memory and executive function impairment predict dementia in Parkinson’s disease. Mov. Disord. 2002, 17, 1221–1226. [Google Scholar] [CrossRef] [PubMed]
- Kudlicka, A.; Clare, L.; Hindle, J.V. Executive functions in Parkinson’s disease: Systematic review and meta-analysis. Mov. Disord. 2011, 26, 2305–2315. [Google Scholar] [CrossRef] [PubMed]
- Lange, F.; Brückner, C.; Knebel, A.; Seer, C.; Kopp, B. Executive dysfunction in Parkinson’s disease: A meta-analysis on the Wisconsin Card Sorting Test literature. Neurosci. Biobehav. Rev. 2018, 93, 38–56. [Google Scholar] [CrossRef] [PubMed]
- Liu, C.; Cholerton, B.; Shi, M.; Ginghina, C.; Cain, K.C.; Auinger, P.; Parkinson Study Group DATATOP Investigators; Zhang, J. CSF tau and tau/Aβ42 predict cognitive decline in Parkinson’s disease. Parkinsonism Relat. Disord. 2015, 21, 271–276. [Google Scholar] [CrossRef] [PubMed] [Green Version]
- Alster, P.; Madetko, N.; Koziorowski, D.; Frieman, A. Progressive Supranuclear Palsy—Parkinsonism Predominant (PSP-P)—A clinical challenge at the boundaries of PSP and Parkinson’s Disease (PD). Front. Neurol. 2020, 11, 180. [Google Scholar] [CrossRef] [PubMed]


| Hoehn–Yahr Stage | UPDRS I | UPDRS II | UPDRS III |
|---|---|---|---|
| LED (mg/day) | Gender | Age of visits | Age of onset |
| Disease duration | Education (years) | Barthel Index | MMSE |
| IADL | JLO | PSQI | EQ-5D index |
| EQ-5D VAS | GDS−15 | GAD−7 | TMT-A |
| TMT-B | Verbal fluency | Digits Forwards | Digits Backwards |
| CVLT-SF total recall | CVLT-SF Immediate | CVLT-SF delay | CVLT-SF recognition |
| BNT | α-syn (pg/mL) | Aβ42 (pg/mL) | t-tau (pg/mL) |
| N = 42 | Without Cognitive Impairment (N = 16) | Moderate and Severe Cognitive Impairment (N = 26) | p Value |
|---|---|---|---|
| Hoehn–Yahr stage | 1.78 (0.73) | 2.37 (0.61) | 0.291 |
| UPDRS I | 2.38 (1.147) | 4.15 (1.78) | 0.078 |
| UPDRS II | 5.63 (2.391) | 11.23 (5.88) | 0.002 |
| UPDRS III | 12.63 (5.35) | 20.65 (10.35) | 0.013 |
| LED (mg/day) | 428.56 (229.13) | 440.77 (241.8) | 0.617 |
| Gender | Male 8/50% | Male 10/38.46% | 0.463 |
| Age of visits | 68.38 (8.57) | 76.65 (7.27) | 0.417 |
| Age of onset | 65.81 (8.72) | 71.92 (8.19) | 0.753 |
| Disease duration | 2.56 (2.39) | 4.73 (3.52) | 0.022 |
| Education (years) | 7.69 (3.22) | 7.04 (4.96) | 0.114 |
| Barthel Index | 156.25 (225) | 88.27 (16.31) | 0.019 |
| MMSE | 26.94 (2.24) | 22.96 (3.96) | 0.015 |
| IADL | 23.38 (1.26) | 17.38 (6.76) | 0.000 |
| JLO | 14.5 (4) | 12.23 (4.86) | 0.366 |
| PSQI | 5.38 (2.39) | 7 (2.79) | 0.71 |
| EQ-5D index | 0.77 (0.17) | 0.75 (0.21) | 0.78 |
| EQ-5D VAS | 68.88 (10.78) | 66.54 (16.54) | 0.335 |
| GDS−15 | 2.5 (3.16) | 3.54 (4.71) | 0.067 |
| GAD−7 | 1 (1.86) | 2.08 (3.5) | 0.068 |
| TMT-A | 27.19 (10.88) | 36.62 (12.74) | 0.494 |
| TMT-B | 72.06 (28.19) | 87.96 (33.74) | 0.15 |
| Verbal fluency | 11.56 (4.56) | 9.27 (3.76) | 0.426 |
| Digits Forwards | 7.38 (1.31) | 6.12 (1.58) | 0.21 |
| Digits Backwards | 5.19 (1.56) | 3.58 (1.53) | 0.897 |
| CVLT-SF total recall | 19.94 (5.89) | 17.54 (4.42) | 0.440 |
| CVLT-SF immediate | 6 (1.75) | 4.96 (1.8) | 0.784 |
| CVLT-SF delay | 4.69 (2.06) | 3.81 (1.96) | 0.696 |
| CVLT-SF recognition | 5.69 (2.44) | 4.65 (2.45) | 0.461 |
| BNT | 23.88 (2.99) | 19.08 (6.46) | 0.006 |
| α-syn (pg/mL) | 0.1 (0.05) | 0.12 (0.05) | 0.793 |
| Aβ42 (pg/mL) | 16.66 (0.45) | 16.7 (0.59) | 0.669 |
| t-tau (pg/mL) | 22.75 (2.63) | 23.62 (3.63) | 0.162 |
| Classifier | Kernel | Feature Number | Accuracy | AUC |
|---|---|---|---|---|
| SVM | Linear | 32 | 0.846 | 0.929 |
| RBF | 0.769 | 0.857 | ||
| Poly | 0.615 | 0.762 | ||
| PCA-SVM | Linear | 6 | 0.923 | 0.929 |
| RBF | 0.769 | 0.857 | ||
| Poly | 0.615 | 0.833 |
| Hoehn–Yahr Stage | IADL | Barthel Index |
|---|---|---|
| UPDRS I | UPDRS II | UPDRS III |
| Verbal fluency | Digits Forwards | Digits Backwards |
| TMT-B | α-syn | Aβ42 |
| t-tau |
| Classifier | Kernel | Feature Number | Accuracy | AUC |
|---|---|---|---|---|
| SVM | Linear | 13 | 0.846 | 1 |
| RBF | 0.538 | 0.738 | ||
| Poly | 0.846 | 0.976 | ||
| PCA-SVM | Linear | 3 | 1 | 1 |
| RBF | 0.923 | 0.976 | ||
| Poly | 0.692 | 0.905 |
Publisher’s Note: MDPI stays neutral with regard to jurisdictional claims in published maps and institutional affiliations. |
© 2022 by the authors. Licensee MDPI, Basel, Switzerland. This article is an open access article distributed under the terms and conditions of the Creative Commons Attribution (CC BY) license (https://creativecommons.org/licenses/by/4.0/).
Share and Cite
Chen, P.-H.; Hou, T.-Y.; Cheng, F.-Y.; Shaw, J.-S. Prediction of Cognitive Degeneration in Parkinson’s Disease Patients Using a Machine Learning Method. Brain Sci. 2022, 12, 1048. https://doi.org/10.3390/brainsci12081048
Chen P-H, Hou T-Y, Cheng F-Y, Shaw J-S. Prediction of Cognitive Degeneration in Parkinson’s Disease Patients Using a Machine Learning Method. Brain Sciences. 2022; 12(8):1048. https://doi.org/10.3390/brainsci12081048
Chicago/Turabian StyleChen, Pei-Hao, Ting-Yi Hou, Fang-Yu Cheng, and Jin-Siang Shaw. 2022. "Prediction of Cognitive Degeneration in Parkinson’s Disease Patients Using a Machine Learning Method" Brain Sciences 12, no. 8: 1048. https://doi.org/10.3390/brainsci12081048