
Prediction of Higher Ki-67 Index in Pituitary Adenomas by Pre- and Intra-Operative Clinical Characteristics

Abstract
:1. Introduction
2. Materials and Methods
2.1. Patient Population
2.2. Data Collection
2.3. Statistical Analyses
3. Results
3.1. Patients
3.2. Prediction of Risk Factors Associated with KI-67 Index
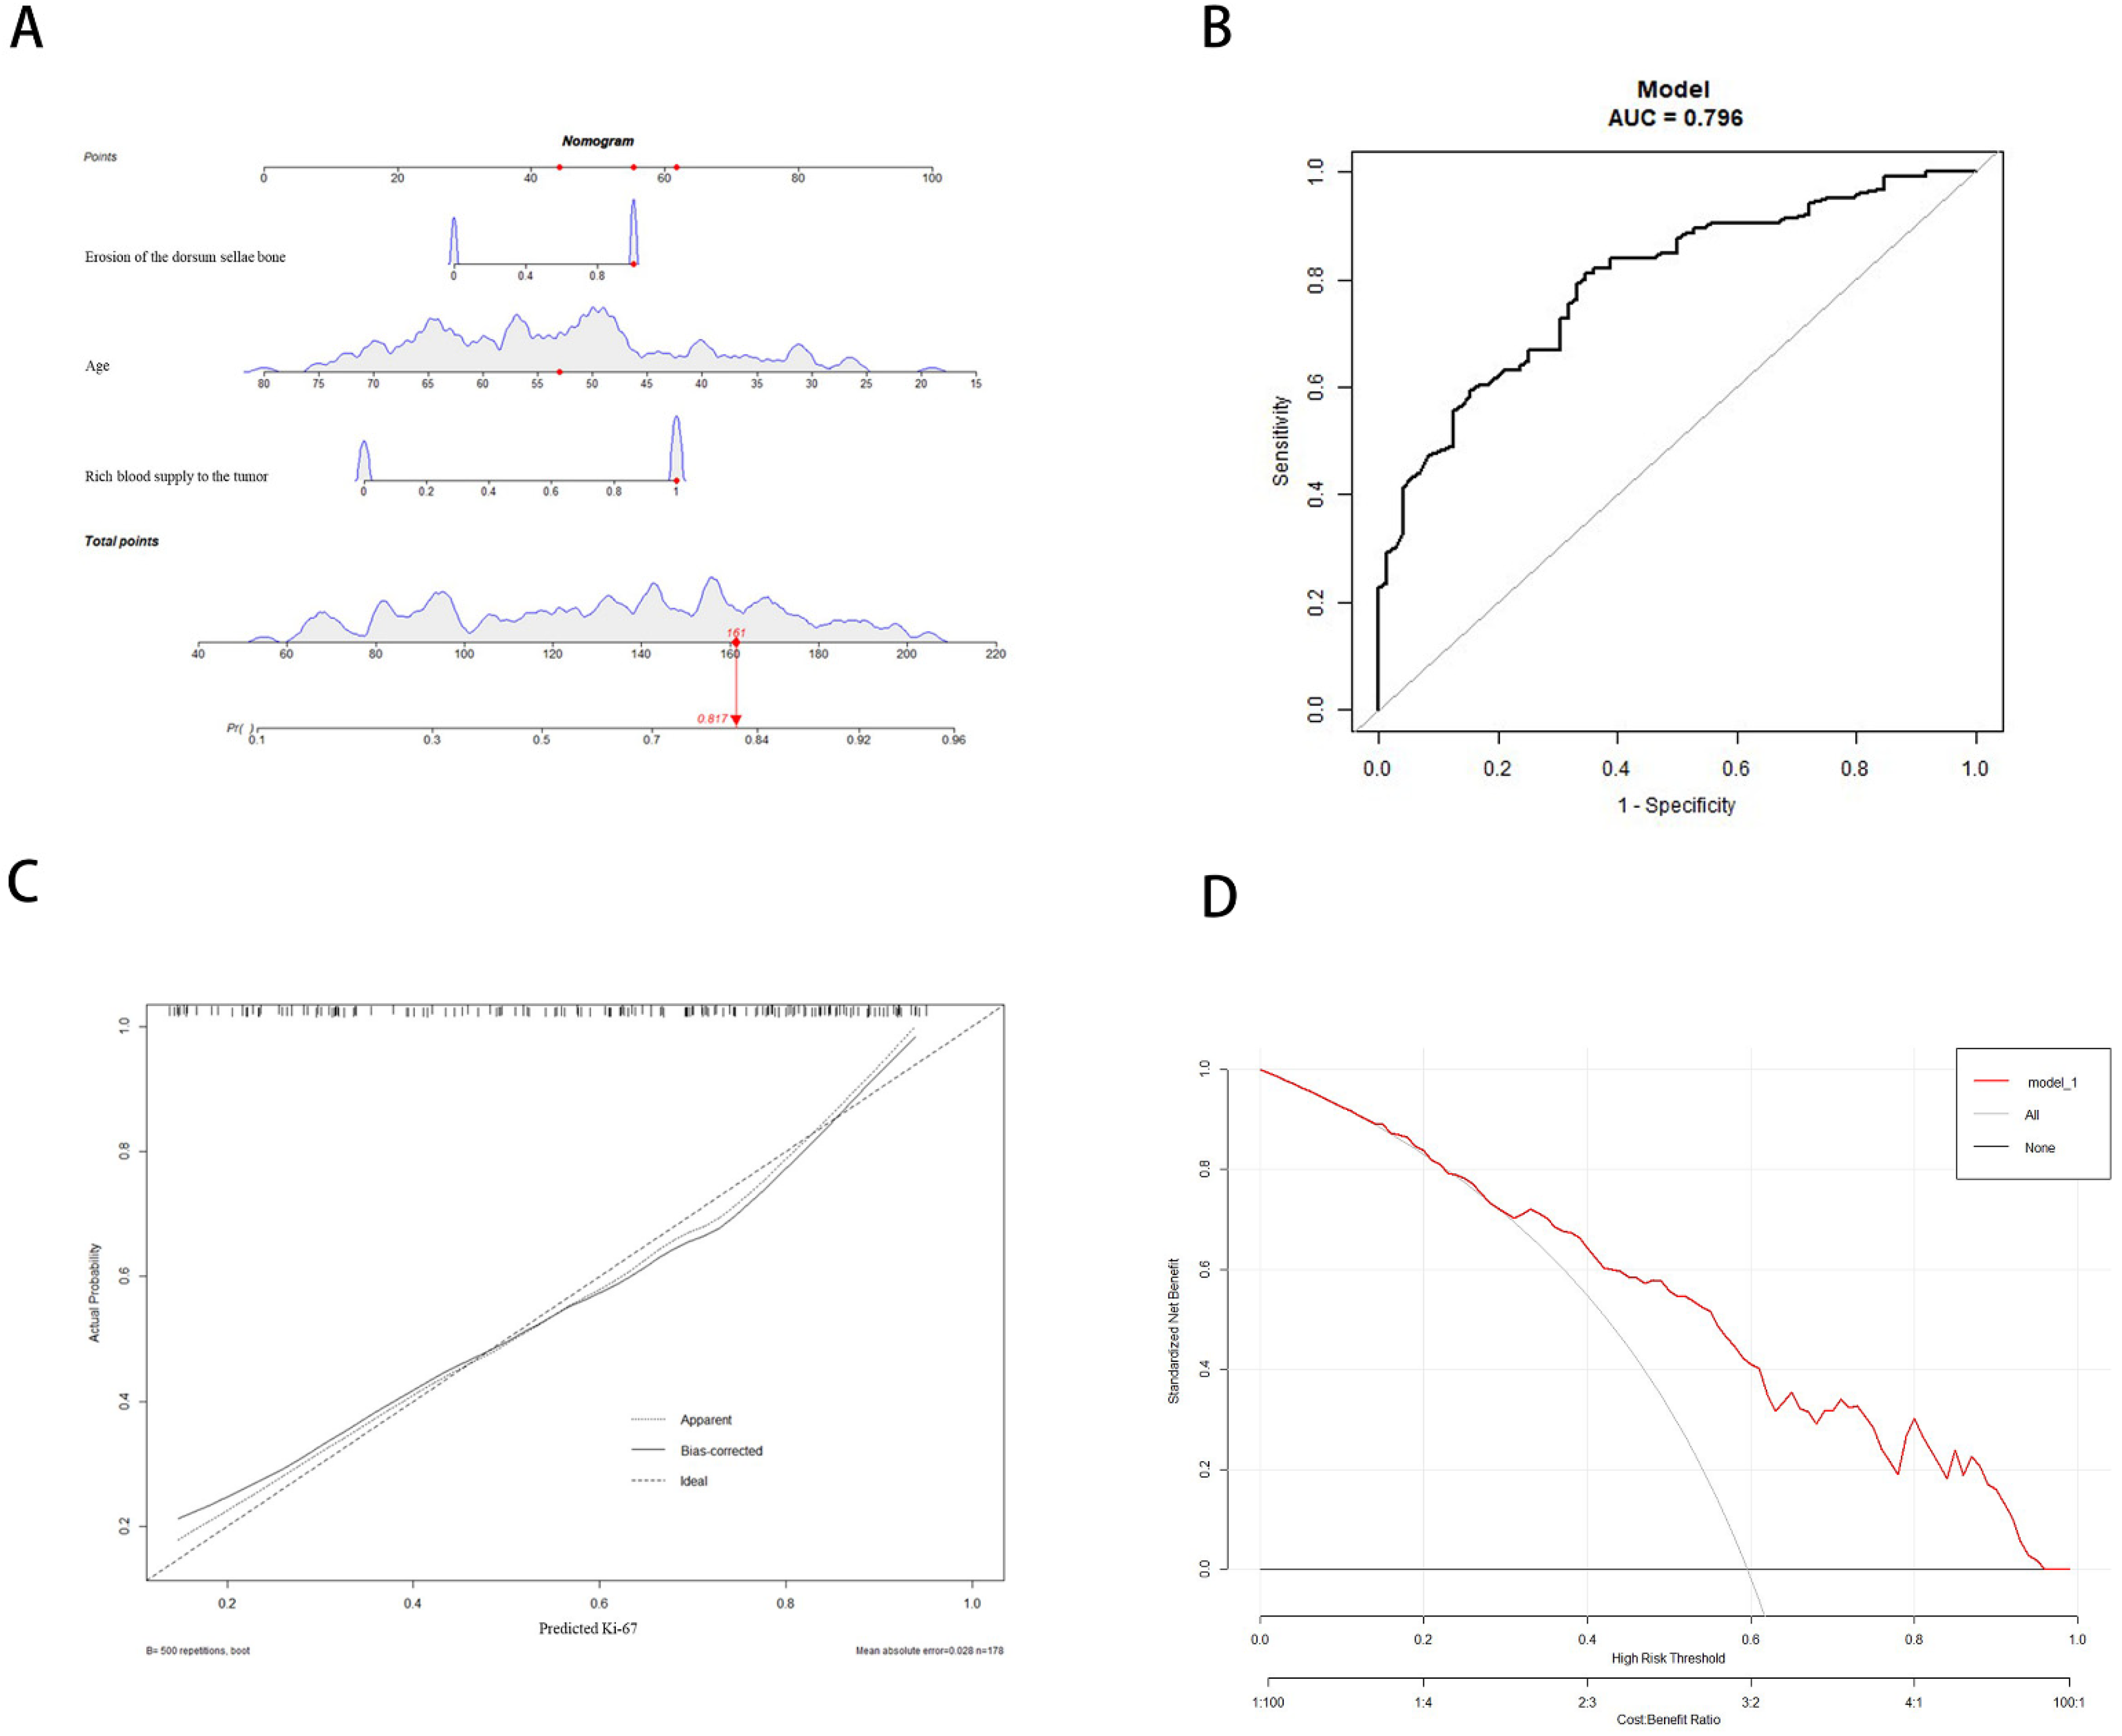
3.3. Development and Validation of the Nomogram
4. Discussion
5. Conclusions
Author Contributions
Funding
Institutional Review Board Statement
Informed Consent Statement
Data Availability Statement
Conflicts of Interest
References
- Aflorei, E.D.; Korbonits, M. Epidemiology and etiopathogenesis of pituitary adenomas. J. Neurooncol. 2014, 117, 379–394. [Google Scholar] [CrossRef] [PubMed]
- Asa, S.L.; Casar-Borota, O.; Chanson, P.; Delgrange, E.; Earls, P.; Ezzat, S.; Grossman, A.; Ikeda, H.; Inoshita, N.; Karavitaki, N.; et al. From pituitary adenoma to pituitary neuroendocrine tumor (PitNET): An International Pituitary Pathology Club proposal. Endocr. Relat. Cancer 2017, 24, C5–C8. [Google Scholar] [CrossRef] [PubMed]
- Lopes, M.B.S. World Health Ozganization 2017 Classification of Pituitary Tumors. Endocrinol. Metab. Clin. N. Am. 2020, 49, 375–386. [Google Scholar] [CrossRef]
- Dai, C.; Liu, X.; Ma, W.; Wang, R. The Treatment of Refractory Pituitary Adenomas. Front. Endocrinol. 2019, 10, 334. [Google Scholar] [CrossRef] [PubMed] [Green Version]
- Gerges, M.M.; Rumalla, K.; Godil, S.S.; Younus, I.; Elshamy, W.; Dobri, G.A.; Kacker, A.; Tabaee, A.; Anand, V.K.; Schwartz, T.H. Long-term outcomes after endoscopic endonasal surgery for nonfunctioning pituitary macroadenomas. J. Neurosurg. 2020, 31, 535–546. [Google Scholar] [CrossRef] [PubMed]
- Sadeghipour, A.; Mahouzi, L.; Salem, M.M.; Ebrahimnejad, S.; Asadi-Lari, M.; Radfar, A.; Filip, I.; Babaheidarian, P. Ki67 Labeling Correlated with Invasion but Not with Recurrence. Appl. Immunohistochem. Mol. Morphol. 2017, 25, 341–345. [Google Scholar] [CrossRef]
- Šteňo, A.; Bocko, J.; Rychlý, B.; Chorvath, M.; Celec, P.; Fabián, M.; Belan, V.; Šteňo, J. Nonfunctioning pituitary adenomas: Association of Ki-67 and HMGA-1 labeling indices with residual tumor growth. Acta Neurochir. 2014, 156, 451–461; discussion 461. [Google Scholar] [CrossRef]
- Ugga, L.; Cuocolo, R.; Solari, D.; Guadagno, E.; D’Amico, A.; Somma, T.; Cappabianca, P.; del Basso de Caro, M.L.D.; Cavallo, L.M.; Brunetti, A. Prediction of high proliferative index in pituitary macroadenomas using MRI-based radiomics and machine learning. Neuroradiology 2019, 61, 1365–1373. [Google Scholar] [CrossRef]
- Conficoni, A.; Feraco, P.; Mazzatenta, D.; Zoli, M.; Asioli, S.; Zenesini, C.; Fabbri, V.P.; Cellerini, M.; Bacci, A. Biomarkers of pituitary macroadenomas aggressive behaviour: A conventional MRI and DWI 3T study. Br. J. Radiol. 2020, 93, 20200321. [Google Scholar] [CrossRef]
- Melmed, S. Pituitary-Tumor Endocrinopathies. N. Engl. J. Med. 2020, 382, 937–950. [Google Scholar] [CrossRef]
- Mercado, M.; Melgar, V.; Salame, L.; Cuenca, D. Clinically non-functioning pituitary adenomas: Pathogenic, diagnostic and therapeutic aspects. Endocrinol. Diabetes Nutr. 2017, 64, 384–395. [Google Scholar] [CrossRef] [PubMed]
- Das, C.; Mondal, P.; Mukhopadhyay, M.; Mukhopadhyay, S.; Ghosh, I.; Handral, A. Evaluation of prognostic utility of Ki-67, P53, and O-6-methylguanine-DNA methyltransferase expression in pituitary tumors. J. Lab. Physicians 2019, 11, 323–329. [Google Scholar] [CrossRef] [PubMed] [Green Version]
- Glebauskiene, B.; Liutkeviciene, R.; Vilkeviciute, A.; Gudinaviciene, I.; Rocyte, A.; Simonaviciute, D.; Mazetyte, R.; Kriauciuniene, L.; Zaliuniene, D. Association of Ki-67 Labelling Index and IL-17A with Pituitary Adenoma. Biomed. Res. Int. 2018, 31, 7490585. [Google Scholar] [CrossRef]
- Trouillas, J.; Jaffrain-Rea, M.L.; Vasiljevic, A.; Raverot, G.; Roncaroli, F.; Villa, C. How to Classify the Pituitary Neuroendocrine Tumors (PitNET)s in 2020. Cancers 2020, 12, 514. [Google Scholar] [CrossRef] [Green Version]
- Raverot, G.; Vasiljevic, A.; Jouanneau, E.; Trouillas, J. A prognostic clinicopathologic classification of pituitary endocrine tumors. Endocrinol. Metab. Clin. N. Am. 2015, 44, 11–18. [Google Scholar] [CrossRef]
- Trott, G.; Ongaratti, B.R.; de Oliveira Silva, C.B.; Abech, G.D.; Haag, T.; Rech, C.G.S.L.; Ferreira, N.P.; Oliveira, M.D.C.; Pereira-Lima, J.F.S. PTTG overexpression in non-functioning pituitary adenomas: Correlation with invasiveness, female gender and younger age. Ann. Diagn. Pathol. 2019, 41, 83–89. [Google Scholar] [CrossRef] [PubMed]
- Tanaka, Y.; Hongo, K.; Tada, T.; Sakai, K.; Kakizawa, Y.; Kobayashi, S. Growth pattern and rate in residual nonfunctioning pituitary adenomas: Correlations among tumor volume doubling time, patient age, and MIB-1 index. J. Neurosurg. 2003, 98, 359–365. [Google Scholar] [CrossRef]
- Lyu, W.; Fei, X.; Chen, C.; Tang, Y. Nomogram predictive model of post-operative recurrence in non-functioning pituitary adenoma. Gland. Surg. 2021, 10, 807–815. [Google Scholar] [CrossRef]
- Mohseni, S.; Aboeerad, M.; Sharifi, F.; Tavangar, S.M.; Mohajeri-Tehrani, M. Associations of Ki-67 Labeling Index with Clinical and Paraclinical Features of Growth Hormone-Secreting Pituitary Adenomas: A Single Center Report from Iran. Int. J. Endocrinol. Metab. 2019, 17, e81983. [Google Scholar] [CrossRef] [Green Version]
- Cai, X.; Zhu, J.; Yang, J.; Tang, C.; Yuan, F.; Cong, Z.; Ma, C. A Nomogram for Preoperatively Predicting the Ki-67 Index of a Pituitary Tumor: A Retrospective Cohort Study. Front. Oncol. 2021, 11, 687333. [Google Scholar] [CrossRef]
- Khasraw, M.; Ameratunga, M.S.; Grant, R.; Wheeler, H.; Pavlakis, N. Antiangiogenic therapy for high-grade glioma. Cochrane Database Syst. Rev. 2014, 22, CD008218. [Google Scholar] [CrossRef] [PubMed]
- Li, H.; Wu, Z.; Tian, J.; Pan, R. Ki-67 labeling index and Knosp classification of pituitary adenomas. Br. J. Neurosurg. 2021, 27, 1–5. [Google Scholar] [CrossRef]
- Ito, M.; Kuge, A.; Matsuda, K.I.; Sato, S.; Kayama, T.; Sonoda, Y. The Likelihood of Remnant Nonfunctioning Pituitary Adenomas Shrinking Is Associated with the Lesion’s Blood Supply Pattern. World Neurosurg. 2017, 107, 137–141. [Google Scholar] [CrossRef] [PubMed]
- Matano, F.; Yoshida, D.; Ishii, Y.; Tahara, S.; Teramoto, A.; Morita, A. Endocan, a new invasion and angiogenesis marker of pituitary adenomas. J. Neurooncol. 2014, 117, 485–491. [Google Scholar] [CrossRef] [PubMed]
- Matsumoto, S.; Hayase, M.; Imamura, H.; Oda, Y.; Kikuchi, H.; Katayama, M.; Ishihara, T. A case of intrasellar meningioma mimicking pituitary adenoma. No Shinkei Geka 2001, 29, 551–557. [Google Scholar] [PubMed]
- Takasugi, N.; Doi, A. Pituitary hemorrhage extending into the third ventricle. Neurol. Med. Chir. 1989, 29, 908–911. [Google Scholar] [CrossRef] [Green Version]


| Variables | Ki-67 < 3% (n = 72) | Ki-67 ≥ 3% (n = 106) | t/χ2 | p-Value |
|---|---|---|---|---|
| Age (year) | 56.94 ± 9.80 | 50.46 ± 12.99 | 3.594 | 0.0004 |
| Sex | ||||
| Male | 37 (51.39%) | 49 (46.23%) | 0.458 | 0.499 |
| Female | 35 (48.61%) | 57 (53.77%) | ||
| FSH | ||||
| Yes | 34 (47.22%) | 35 (33.02%) | 3.644 | 0.056 |
| No | 38 (52.78%) | 71 (66.98%) | ||
| LH | ||||
| Yes | 13 (18.06%) | 35 (33.02%) | 0.034 | 0.853 |
| No | 59 (81.94%) | 88 (83.02%) | ||
| PRL | ||||
| Yes | 19 (26.39%) | 35 (33.02%) | 0.892 | 0.345 |
| No | 53 (73.61%) | 71 (66.98%) | ||
| GH | ||||
| Yes | 14 (19.44%) | 23 (21.70%) | 0.132 | 0.716 |
| No | 58 (80.56%) | 83 (78.30%) | ||
| TSH | ||||
| Yes | 5 (6.94%) | 4 (3.77%) | 0.898 | 0.343 |
| No | 67 (93.06%) | 102 (96.23%) | ||
| ATCH | ||||
| Yes | 6 (8.33%) | 12 (11.32%) | 0.421 | 0.516 |
| No | 66 (91.67%) | 94 (88.68%) | ||
| Knosp grade | ||||
| <3 | 53 (73.61%) | 81 (76.42%) | 0.181 | 0.670 |
| ≥3 | 19 (26.39%) | 25 (23.58%) | ||
| Tumor breaking through sellar floor | ||||
| Yes | 6 (8.33%) | 14 (13.21%) | 1.021 | 0.312 |
| No | 66 (91.67%) | 92 (86.79%) | ||
| Rich blood supply to the tumor | ||||
| Yes | 27 (37.50%) | 84 (79.25%) | 31.830 | <0.0001 |
| No | 45 (62.50%) | 22 (20.75%) | ||
| Tumor located inside the sella | ||||
| Yes | 26 (36.11%) | 33 (31.13%) | 0.480 | 0.489 |
| No | 46 (63.89%) | 73 (68.87%) | ||
| Erosion of the dorsum sellae bone | ||||
| Yes | 30 (41.67%) | 82 (77.36%) | 23.41 | <0.0001 |
| No | 42 (58.33%) | 24 (22.64%) | ||
| Positive of transcription factor | ||||
| Yes | 56 (77.78%) | 88 (83.02%) | 0.762 | 0.383 |
| No | 16 (22.22%) | 18 (16.98%) |
| Factors | OR | 95% CI | p-Value |
|---|---|---|---|
| Age | 0.294 | 0.078–1.612 | 0.228 |
| Rich blood supply to the tumor | 0.124 | 0.044–0.355 | 0.000 |
| Erosion of the dorsum sellae bone | 0.162 | 0.057–0.469 | 0.001 |
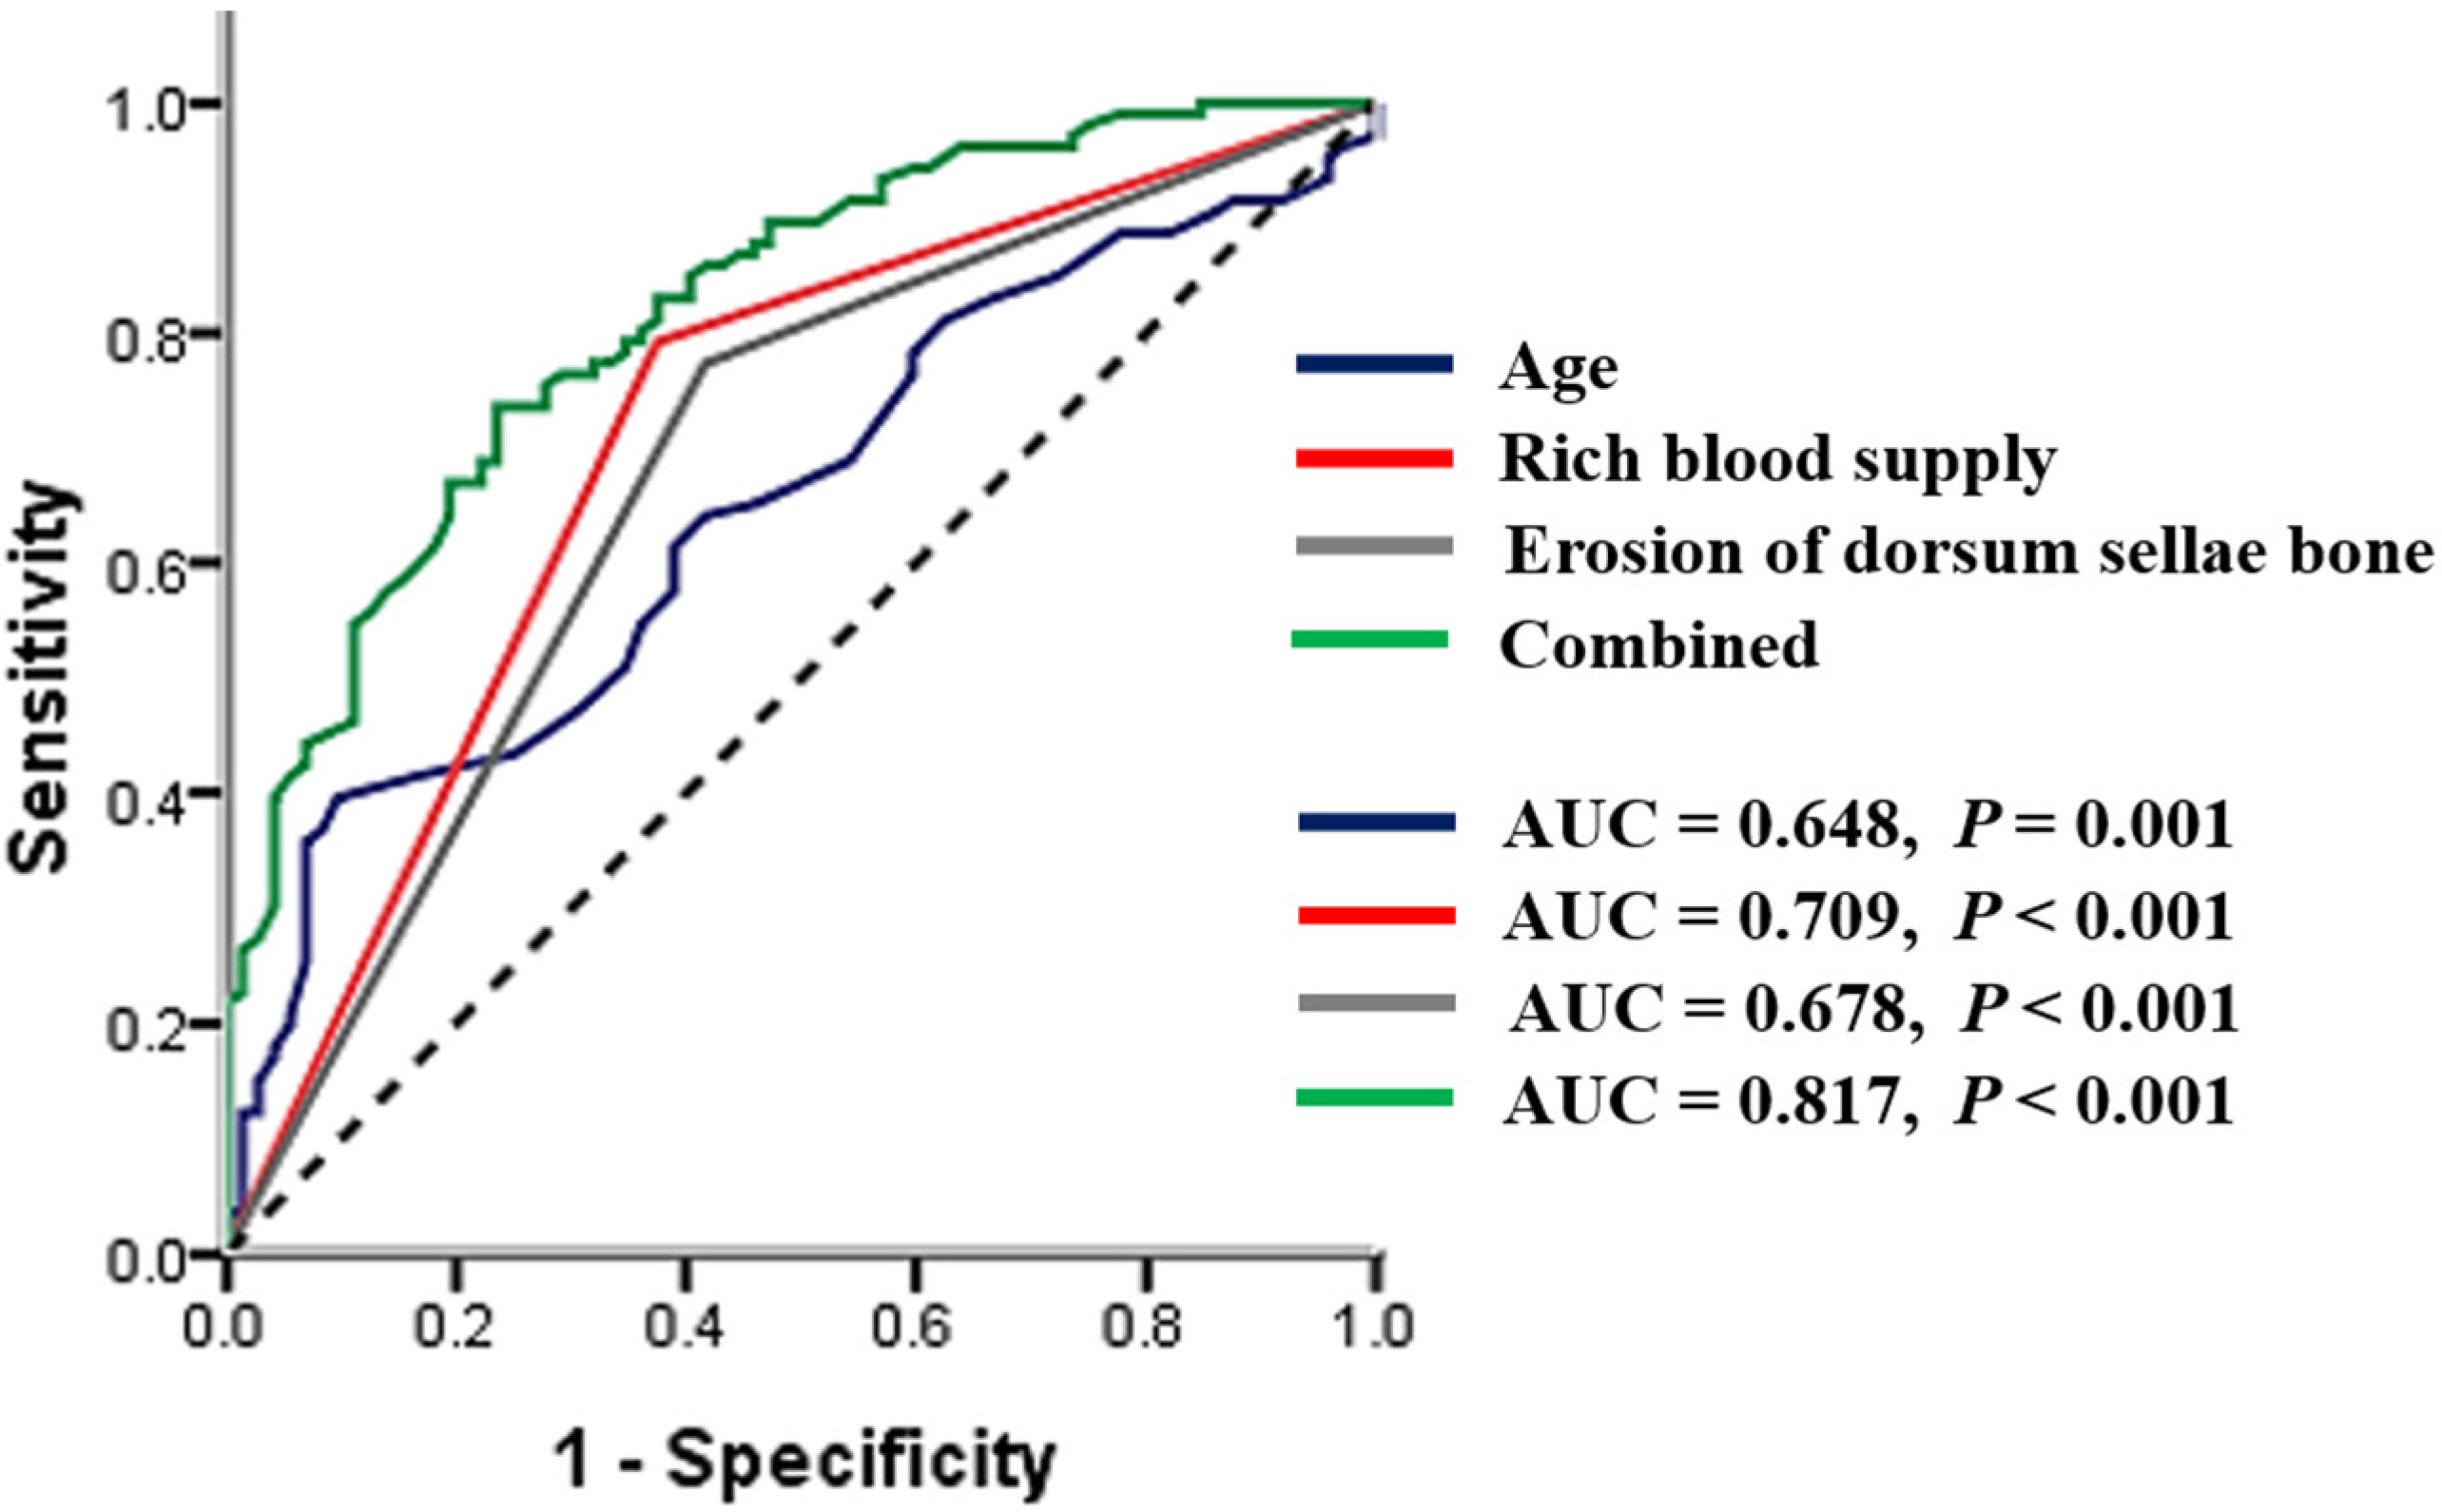
| Factors | AUC | SE | 95% CI |
|---|---|---|---|
| Age | 0.648 | 0.041 | 0.568–0.728 |
| Rich blood supply to the tumor | 0.709 | 0.041 | 0.629–0.789 |
| Erosion of the dorsum sellae bone | 0.678 | 0.042 | 0.596–0.761 |
| Combined | 0.817 | 0.031 | 0.756–0.879 |
Publisher’s Note: MDPI stays neutral with regard to jurisdictional claims in published maps and institutional affiliations. |
© 2022 by the authors. Licensee MDPI, Basel, Switzerland. This article is an open access article distributed under the terms and conditions of the Creative Commons Attribution (CC BY) license (https://creativecommons.org/licenses/by/4.0/).
Share and Cite
Wang, X.; Li, M.; Jiang, X.; Wang, F.; Ling, S.; Niu, C. Prediction of Higher Ki-67 Index in Pituitary Adenomas by Pre- and Intra-Operative Clinical Characteristics. Brain Sci. 2022, 12, 1002. https://doi.org/10.3390/brainsci12081002
Wang X, Li M, Jiang X, Wang F, Ling S, Niu C. Prediction of Higher Ki-67 Index in Pituitary Adenomas by Pre- and Intra-Operative Clinical Characteristics. Brain Sciences. 2022; 12(8):1002. https://doi.org/10.3390/brainsci12081002
Chicago/Turabian StyleWang, Xuanzhi, Mingwu Li, Xiaofeng Jiang, Fei Wang, Shiying Ling, and Chaoshi Niu. 2022. "Prediction of Higher Ki-67 Index in Pituitary Adenomas by Pre- and Intra-Operative Clinical Characteristics" Brain Sciences 12, no. 8: 1002. https://doi.org/10.3390/brainsci12081002