
A Novel Improved Thromboembolism-Based Rat Stroke Model That Meets the Latest Standards in Preclinical Studies
 , , , , ,
Abstract
:1. Introduction
2. Materials and Methods
2.1. Animals
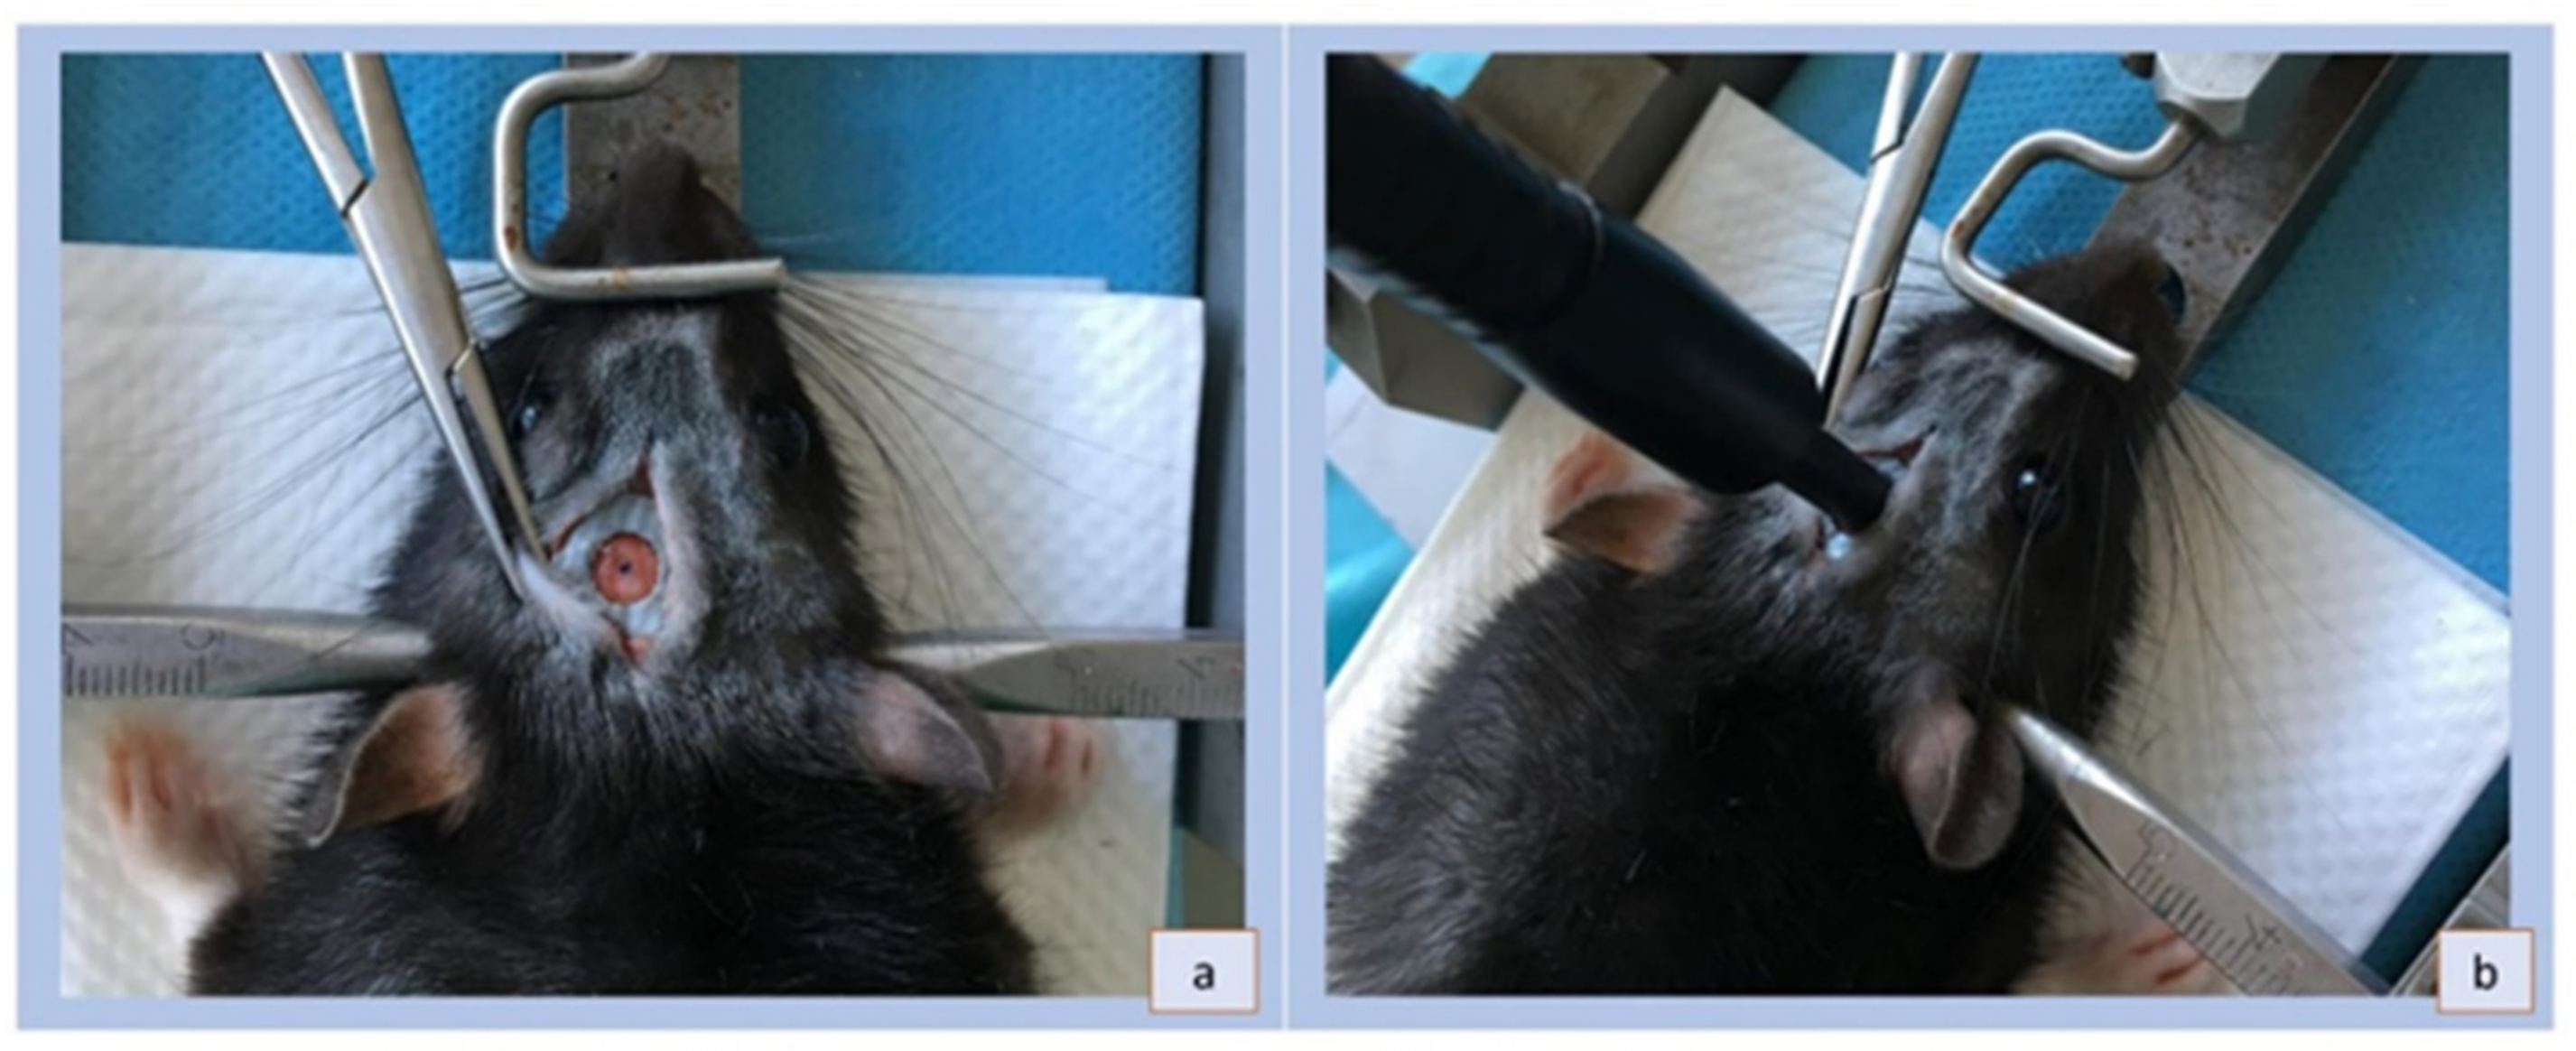
2.2. Animal Model
2.3. Horizontal Runway Elevated Test
2.4. Sample Preparation and Nissl Staining
2.5. Statistical Analysis
3. Results
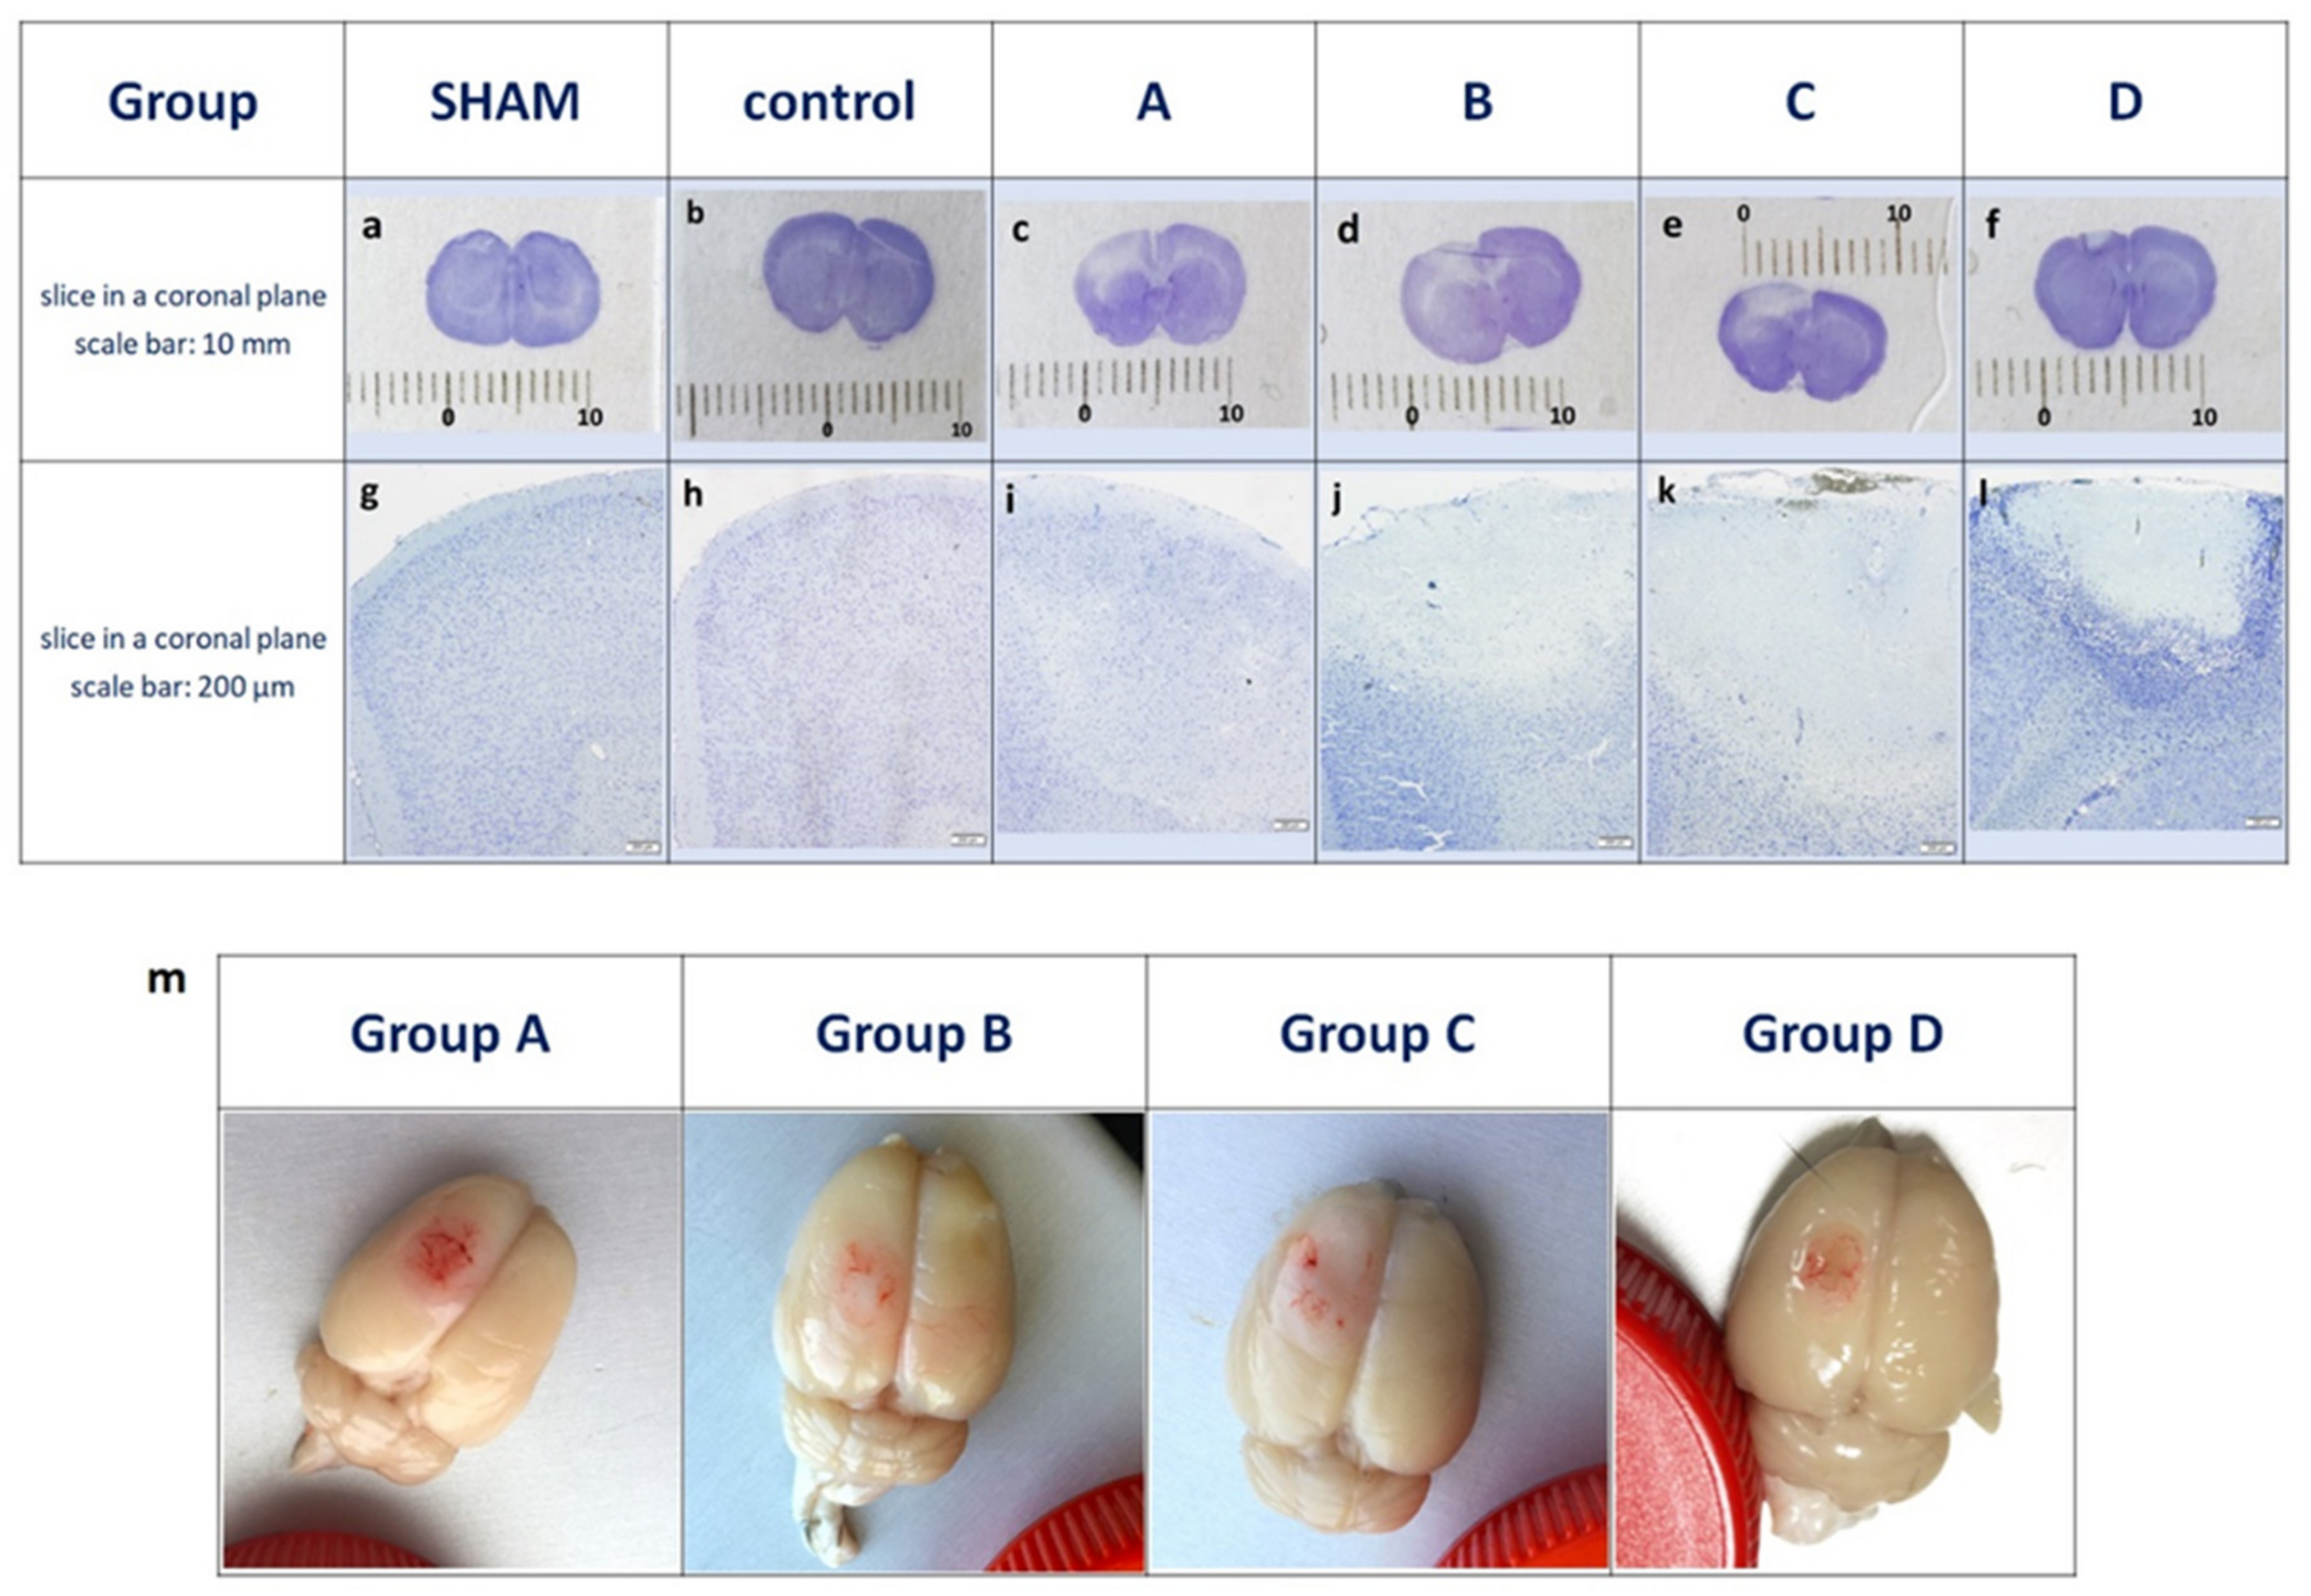
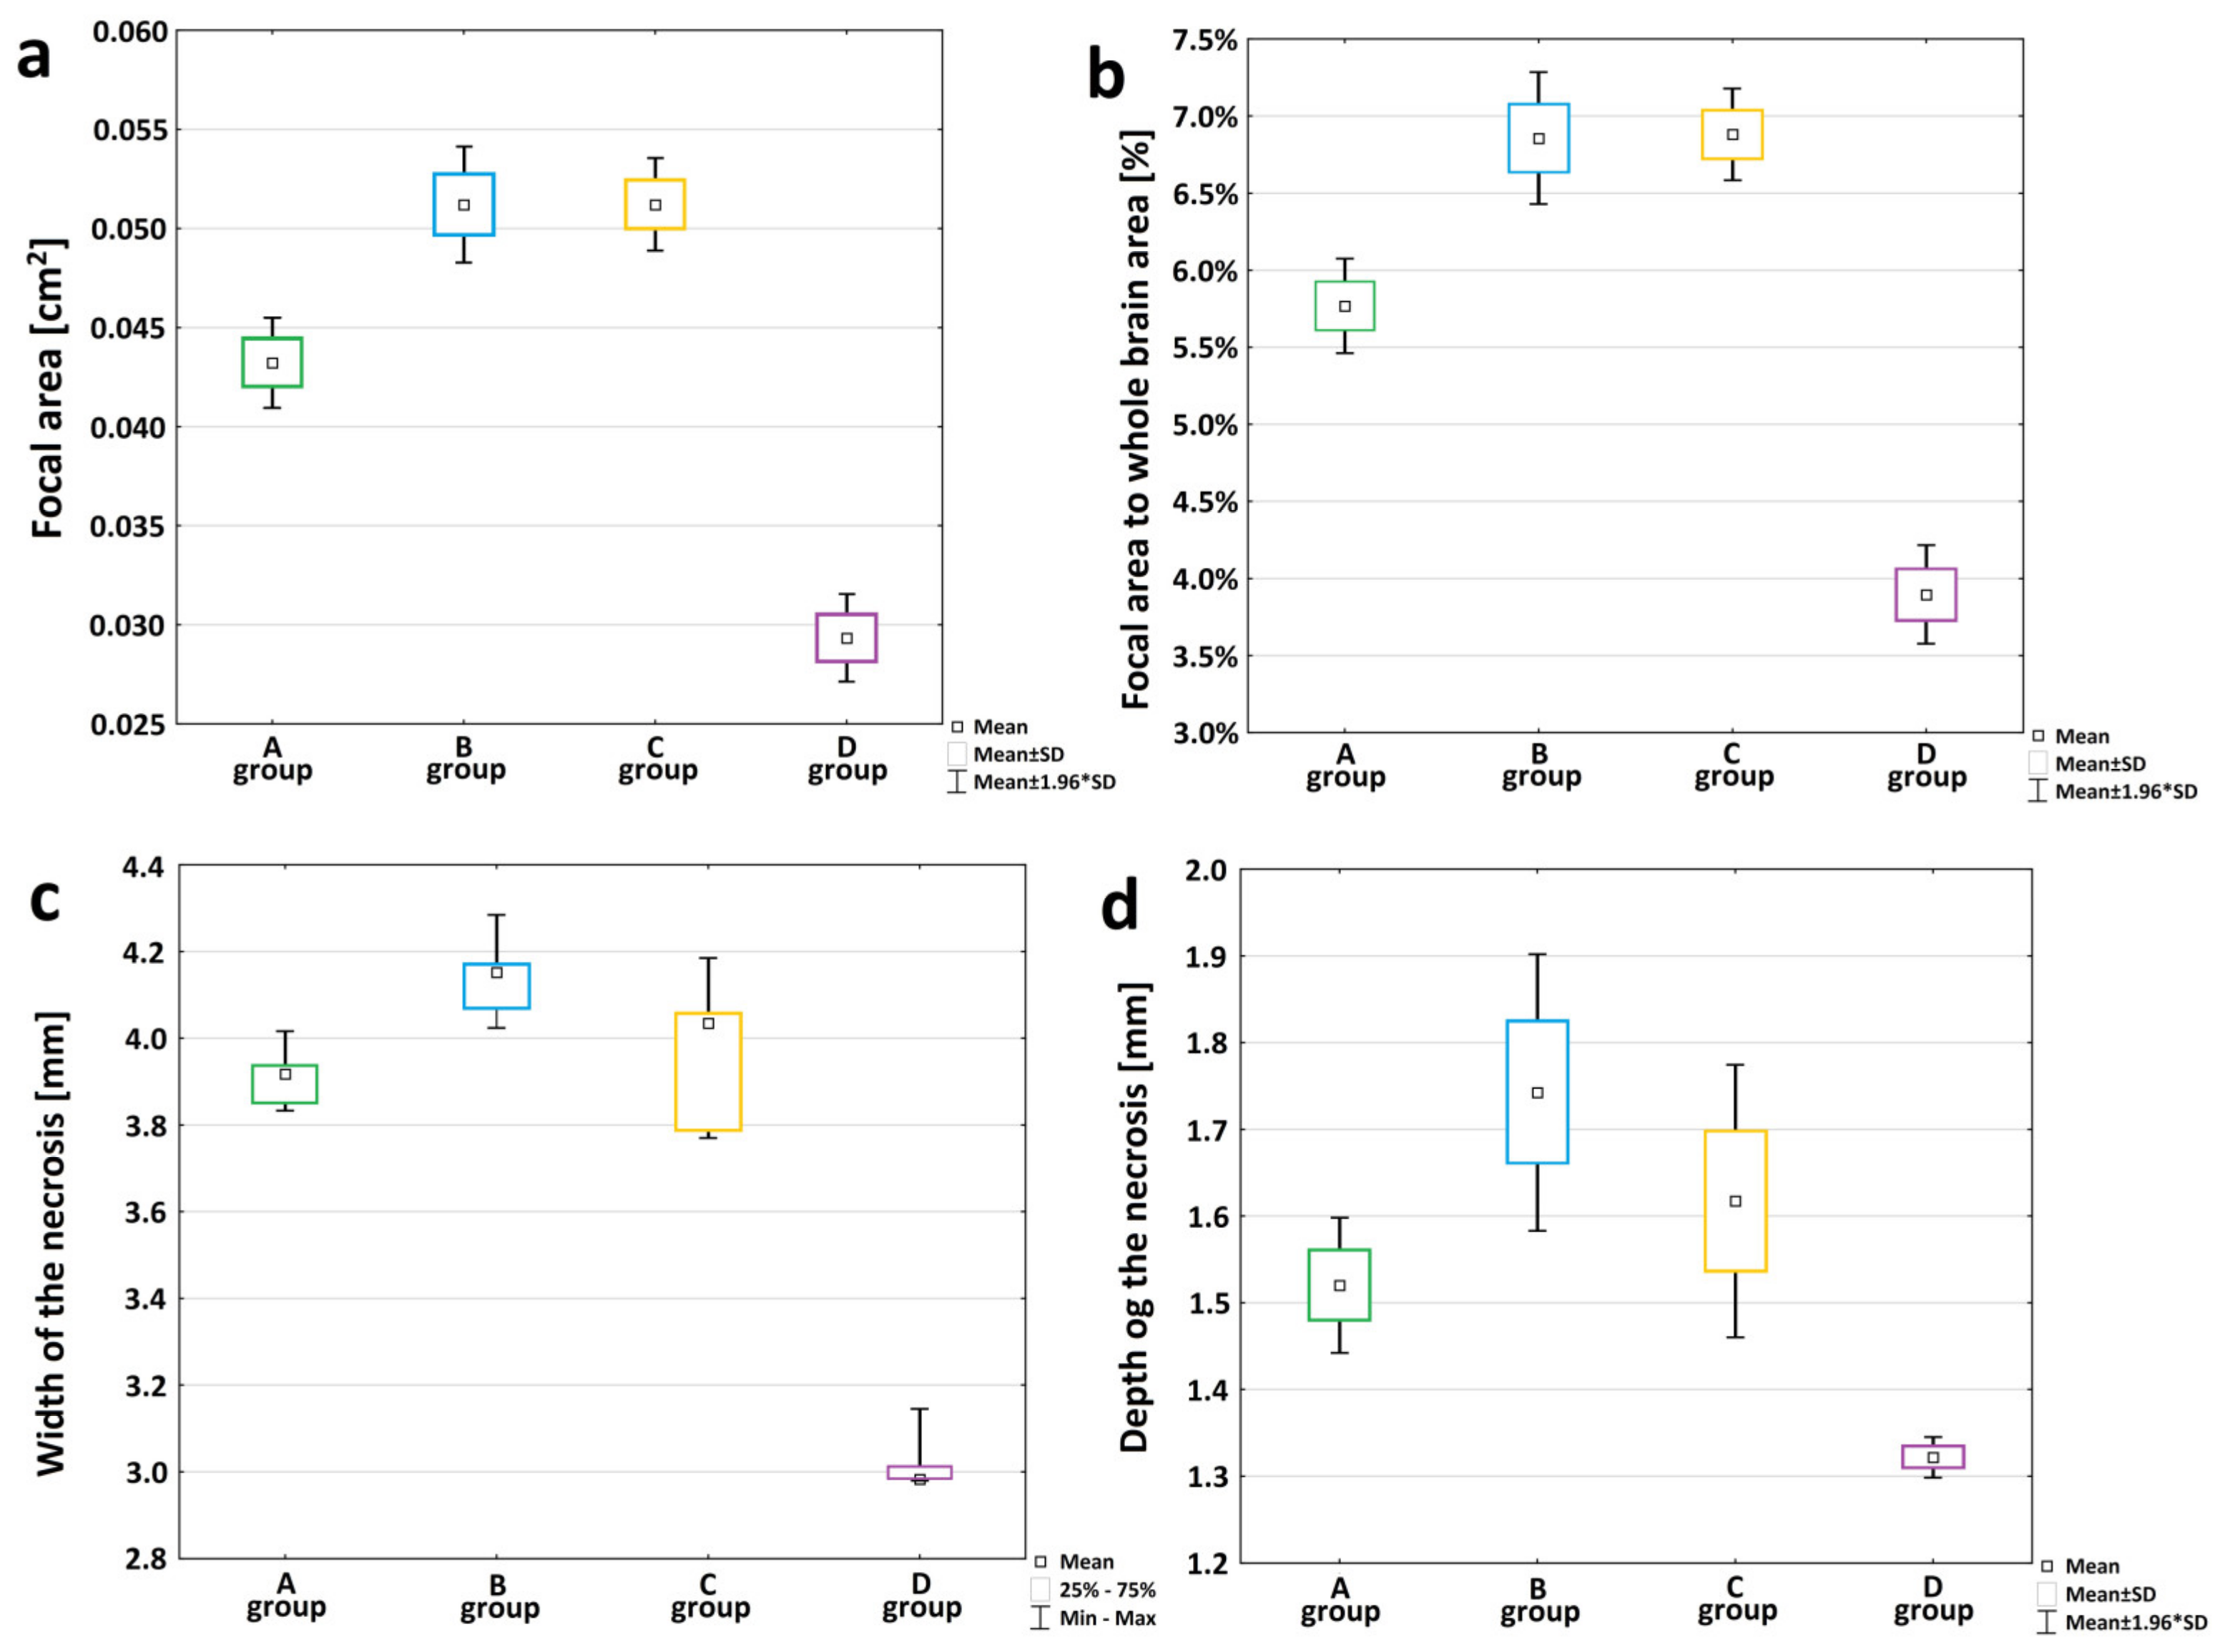
3.1. Characterization of The Peri-Infarct Area following Ischemic Stroke
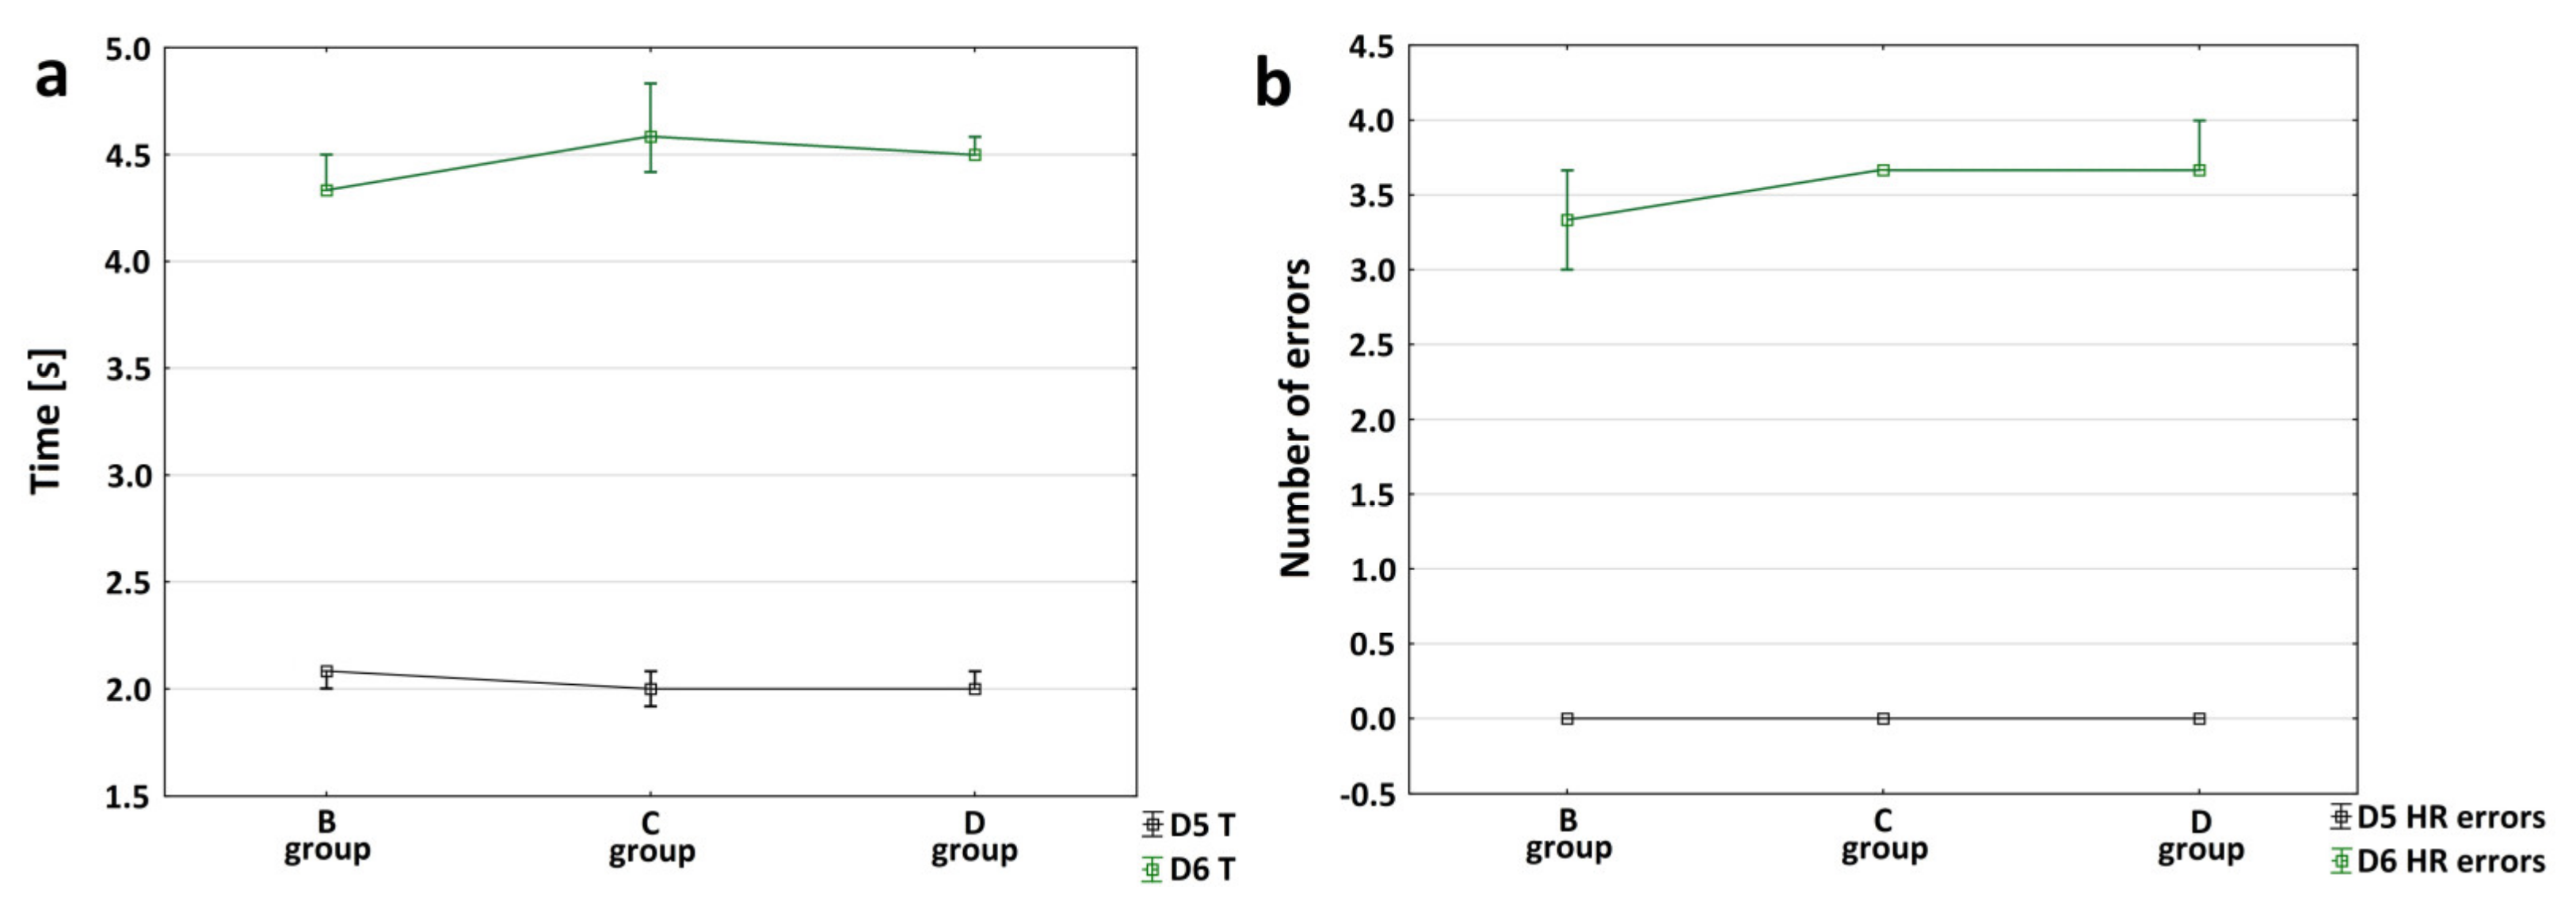
3.2. Characteristics of Motor Changes following Ischemic Stroke
4. Discussion
5. Conclusions
Supplementary Materials
Author Contributions
Funding
Institutional Review Board Statement
Data Availability Statement
Acknowledgments
Conflicts of Interest
References
- Katan, M.; Luft, A. Global Burden of Stroke. Semin. Neurol. 2018, 38, 208–211. [Google Scholar] [CrossRef] [PubMed] [Green Version]
- Tsao, C.W.; Aday, A.W.; Almarzooq, Z.I.; Alonso, A.; Beaton, A.Z.; Bittencourt, M.S.; Boehme, A.K.; Buxton, A.E.; Carson, A.P.; Commodore-Mensah, Y.; et al. Heart Disease and Stroke Statistics-2022 Update: A Report from the American Heart Association. Circulation 2022, 145, e153–e639. [Google Scholar] [CrossRef] [PubMed]
- Feigin, V.L.; Stark, B.A.; Johnson, C.O.; Roth, G.A.; Bisignano, C.; Abady, G.G.; Abbasifard, M.; Abbasi-Kangevari, M.; Abd-Allah, F.; Abedi, V.; et al. Global, Regional, and National Burden of Stroke and Its Risk Factors, 1990–2019: A Systematic Analysis for the Global Burden of Disease Study 2019. Lancet Neurol. 2021, 20, 795–820. [Google Scholar] [CrossRef] [PubMed]
- Donkor, E. Epidemiology and Quality of Life. J. Reprod. Med. Obstet. Gynecol. 2018, 51, 227–233. [Google Scholar]
- Dirnagl, U.; Iadecola, C.; Moskowitz, M.A. Pathobiology of Ischaemic Stroke: An Integrated View. Trends Neurosci. 1999, 22, 391–397. [Google Scholar] [CrossRef]
- Kurniawan, N.A.; Grimbergen, J.; Koopman, J.; Koenderink, G.H. Factor XIII Stiffens Fibrin Clots by Causing Fiber Compaction. J. Thromb. Haemost. 2014, 12, 1687–1696. [Google Scholar] [CrossRef]
- Kaur, J.; Zhao, Z.; Klein, G.M.; Lo, E.H.; Buchan, A.M. The Neurotoxicity of Tissue Plasminogen Activator? J. Cereb. Blood Flow Metab. 2004, 24, 945–963. [Google Scholar] [CrossRef]
- O’Collins, V.E.; Macleod, M.R.; Donnan, G.A.; Horky, L.L.; Van Der Worp, B.H.; Howells, D.W. 1026 Experimental Treatments in Acute Stroke. Ann. Neurol. 2006, 59, 467–477. [Google Scholar] [CrossRef]
- Traystman, R.J. Animal Models of Focal and Global Cerebral Ischemia. ILAR J. 2003, 44, 85–95. [Google Scholar] [CrossRef] [Green Version]
- Uzdensky, A.B. Photothrombotic Stroke as a Model of Ischemic Stroke. Transl. Stroke Res. 2018, 9, 437–451. [Google Scholar] [CrossRef]
- Watson, B.D.; Dietrich, W.D.; Busto, R.; Wachtel, M.S.; Ginsberg, M.D. Induction of Reproducible Brain Infarction by Photochemically Initiated Thrombosis. Ann. Neurol. 1985, 17, 497–504. [Google Scholar] [CrossRef]
- Schmidt, A.; Hoppen, M.; Strecker, J.K.; Diederich, K.; Schäbitz, W.R.; Schilling, M.; Minnerup, J. Photochemically Induced Ischemic Stroke in Rats. Exp. Transl. Stroke Med. 2012, 4, 4–7. [Google Scholar] [CrossRef] [Green Version]
- Matsuno, H.; Uematsu, T.; Umemura, K.; Takiguchi, Y.; Asai, Y.; Muranaka, Y.; Nakashima, M. A Simple and Reproducible Cerebral Thrombosis Model in Rats Induced by a Photochemical Reaction and the Effect of a Plasminogen-Plasminogen Activator Chimera in This Model. J. Pharmacol. Toxicol. Methods 1993, 29, 165–173. [Google Scholar] [CrossRef]
- Hossmann, K.A. Cerebral Ischemia: Models, Methods and Outcomes. Neuropharmacology 2008, 55, 257–270. [Google Scholar] [CrossRef]
- De Boo, J.; Hendriksen, C. Reduction Strategies in Animal Research: A Review of Scientific Approaches at the Intra-Experimental, Supra-Experimental and Extra-Experimental Levels. ATLA Altern. Lab. Anim. 2005, 33, 369–377. [Google Scholar] [CrossRef]
- Metz, G.A.; Whishaw, I.Q. Cortical and Subcortical Lesions Impair Skilled Walking in the Ladder Rung Walking Test: A New Task to Evaluate Fore- and Hindlimb Stepping, Placing, and Co-Ordination. J. Neurosci. Methods 2002, 115, 169–179. [Google Scholar] [CrossRef]
- Metz, G.A.; Whishaw, I.Q. The Ladder Rung Walking Task: A Scoring System and Its Practical Application. J. Vis. Exp. 2009, 28, 2–5. [Google Scholar] [CrossRef] [Green Version]
- Alaverdashvili, M.; Moon, S.K.; Beckman, C.D.; Virag, A.; Whishaw, I.Q. Acute but Not Chronic Differences in Skilled Reaching for Food Following Motor Cortex Devascularization vs. Photothrombotic Stroke in the Rat. Neuroscience 2008, 157, 297–308. [Google Scholar] [CrossRef]
- De Prisco, N.; Chemiakine, A.; Lee, W.; Botta, S.; Gennarino, V.A. Protocol to Assess the Effect of Disease-Driving Variants on Mouse Brain Morphology and Primary Hippocampal Neurons. STAR Protoc. 2022, 3, 101244. [Google Scholar] [CrossRef]
- Schroeder, A.B.; Dobson, E.T.A.; Rueden, C.T.; Tomancak, P.; Jug, F.; Eliceiri, K.W. The ImageJ Ecosystem: Open-Source Software for Image Visualization, Processing, and Analysis. Protein Sci. 2021, 30, 234–249. [Google Scholar] [CrossRef]
- Zhang, H.; Lin, S.; Chen, X.; Gu, L.; Zhu, X.; Zhang, Y.; Reyes, K.; Wang, B.; Jin, K. The Effect of Age, Sex and Strains on the Performance and Outcome in Animal Models of Stroke. Neurochem. Int. 2019, 127, 2–11. [Google Scholar] [CrossRef] [PubMed]
- Herson, P.S.; Traystman, R.J. Animal Models of Stroke: Translational Potential at Present and in 2050. Future Neurol. 2014, 9, 541–551. [Google Scholar] [CrossRef] [PubMed] [Green Version]
- Li, Y.; Zhang, J. Animal Models of Stroke. Anim. Model. Exp. Med. 2021, 4, 204–219. [Google Scholar] [CrossRef] [PubMed]
- Dietrich, W.D.; Busto, R.; Watson, B.D.; Scheinberg, P.; Ginsberg, M.D. Photochemically Induced Cerebral Infarction—II. Edema and Blood-Brain Barrier Disruption. Acta Neuropathol. 1987, 72, 326–334. [Google Scholar] [CrossRef] [PubMed]
- Yew, W.P.; Djukic, N.D.; Jayaseelan, J.S.P.; Walker, F.R.; Roos, K.A.A.; Chataway, T.K.; Muyderman, H.; Sims, N.R. Early Treatment with Minocycline Following Stroke in Rats Improves Functional Recovery and Differentially Modifies Responses of Peri-Infarct Microglia and Astrocytes. J. Neuroinflammation 2019, 16, 6. [Google Scholar] [CrossRef]
- Hunter, A.J.; Hatcher, J.; Virley, D.; Nelson, P.; Irving, E.; Hadingham, S.J.; Parsons, A.A. Functional Assessments in Mice and Rats after Focal Stroke. Neuropharmacology 2000, 39, 806–816. [Google Scholar] [CrossRef]
- Minnerup, J.; Kim, J.B.; Schmidt, A.; Diederich, K.; Bauer, H.; Schilling, M.; Strecker, J.K.; Ringelstein, E.B.; Sommer, C.; Schöler, H.R.; et al. Effects of Neural Progenitor Cells on Sensorimotor Recovery and Endogenous Repair Mechanisms after Photothrombotic Stroke. Stroke 2011, 42, 1757–1763. [Google Scholar] [CrossRef]
- Kuroiwa, T.; Xi, G.; Hua, Y.; Nagaraja, T.N.; Fenstermacher, J.D.; Keep, R.F. Development of a Rat Model of Photothrombotic Ischemia and Infarction within the Caudoputamen. Stroke 2009, 40, 248–253. [Google Scholar] [CrossRef] [Green Version]
- Frauenknecht, K.; Diederich, K.; Leukel, P.; Bauer, H.; Schäbitz, W.R.; Sommer, C.J.; Minnerup, J. Functional Improvement after Photothrombotic Stroke in Rats Is Associated with Different Patterns of Dendritic Plasticity after G-CSF Treatment and G-CSF Treatment Combined with Concomitant or Sequential Constraint-Induced Movement Therapy. PLoS ONE 2016, 11, e0146679. [Google Scholar] [CrossRef] [Green Version]
- Liu, N.W.; Ke, C.C.; Zhao, Y.; Chen, Y.A.; Chan, K.C.; Tan, D.T.W.; Lee, J.S.; Chen, Y.Y.; Hsu, T.W.; Hsieh, Y.J.; et al. Evolutional Characterization of Photochemically Induced Stroke in Rats: A Multimodality Imaging and Molecular Biological Study. Transl. Stroke Res. 2017, 8, 244–256. [Google Scholar] [CrossRef] [Green Version]
- Sommer, C.J. Ischemic Stroke: Experimental Models and Reality. Acta Neuropathol. 2017, 133, 245–261. [Google Scholar] [CrossRef]
- Spratt, N.J.; Fernandez, J.; Chen, M.; Rewell, S.; Cox, S.; Van Raay, L.; Hogan, L.; Howells, D.W. Modification of the Method of Thread Manufacture Improves Stroke Induction Rate and Reduces Mortality after Thread-Occlusion of the Middle Cerebral Artery in Young or Aged Rats. J. Neurosci. Methods 2006, 155, 285–290. [Google Scholar] [CrossRef]
- Yang, B.; Strong, R.; Sharma, S.; Brenneman, M.; Mallikarjunarao, K.; Xi, X.; Grotta, J.C.; Aronowski, J.; Savitz, S.I. Therapeutic Time Window and Dose Response of Autologous Bone Marrow Mononuclear Cells for Ischemic Stroke. J. Neurosci. Res. 2011, 89, 833–839. [Google Scholar] [CrossRef] [Green Version]
- Svoboda, J.; Litvinec, A.; Kala, D.; Pošusta, A.; Vávrová, L.; Jiruška, P.; Otáhal, J. Strain Differences in Intraluminal Thread Model of Middle Cerebral Artery Occlusion in Rats. Physiol. Res. 2019, 68, 37–48. [Google Scholar] [CrossRef]
- Lewis, M.K.; Jamison, J.T.; Dunbar, J.C.; DeGracia, D.J. MRNA Redistribution during Permanent Focal Cerebral Ischemia. Transl. Stroke Res. 2013, 4, 604–617. [Google Scholar] [CrossRef] [Green Version]
- Syeda, W.; Ermine, C.M.; Khilf, M.S.; Wright, D.; Brait, V.H.; Nithianantharajah, J.; Kolbe, S.; Johnston, L.A.; Thompson, L.H.; Brodtmann, A. Long-Term Structural Brain Changes in Adult Rats after Mild Ischaemic Stroke. Brain Commun. 2022, 4, fcac185. [Google Scholar] [CrossRef]
- Abbasi, A.; Danielsen, N.P.; Leung, J.; Muhammad, A.K.M.G.; Patel, S.; Gulati, T. Epidural Cerebellar Stimulation Drives Widespread Neural Synchrony in the Intact and Stroke Perilesional Cortex. J. Neuroeng. Rehabil. 2021, 18, 89. [Google Scholar] [CrossRef]
- Cui, J.; Holmes, E.H.; Greene, T.G.; Liu, P.K. Oxidative DNA Damage Precedes DNA Fragmentation after Experimental Stroke in Rat Brain. FASEB J. 2000, 14, 955–967. [Google Scholar] [CrossRef]
- Shin, T.H.; Lee, D.Y.; Basith, S.; Manavalan, B.; Paik, M.J.; Rybinnik, I.; Mouradian, M.M.; Ahn, J.H.; Lee, G. Metabolome Changes in Cerebral Ischemia. Cells 2020, 9, 1630. [Google Scholar] [CrossRef]
- Chen, S.T.; Hsu, C.Y.; Hogan, E.L.; Maricq, H.; Balentine, J.D. A Model of Focal Ischemic Stroke in the Rat: Reproducible Extensive Cortical Infarction. Stroke 1986, 17, 738–743. [Google Scholar] [CrossRef] [Green Version]
- Strbian, D.; Karjalainen-Lindsberg, M.L.; Tatlisumak, T.; Lindsberg, P.J. Cerebral Mast Cells Regulate Early Ischemic Brain Swelling and Neutrophil Accumulation. J. Cereb. Blood Flow Metab. 2006, 26, 605–612. [Google Scholar] [CrossRef] [PubMed]
- Strbian, D.; Karjalainen-Lindsberg, M.L.; Kovanen, P.T.; Tatlisumak, T.; Lindsberg, P.J. Mast Cell Stabilization Reduces Hemorrhage Formation and Mortality after Administration of Thrombolytics in Experimental Ischemic Stroke. Circulation 2007, 116, 411–418. [Google Scholar] [CrossRef] [PubMed] [Green Version]
- Wester, P.; Watson, B.D.; Prado, R.; Dietrich, W.D. A Photothrombotic ‘ring’ Model of Rat Stroke-in-Evolution Displaying Putative Penumbral Inversion. Stroke 1995, 26, 444–450. [Google Scholar] [CrossRef] [PubMed]
- Early, I.; Dietrich, W.D.; Watson, B.D.; Busto, R.; Ginsberg, M.D.; Bethea, J.R. Acta Neuropatholog: Ca Original Works Photochemically Induced Cerebral Infarction. Acta Neuropathol. 1987, 72, 315–325. [Google Scholar]
- Schroeter, M.; Jander, S.; Stoll, G. Non-Invasive Induction of Focal Cerebral Ischemia in Mice by Photothrombosis of Cortical Microvessels: Characterization of Inflammatory Responses. J. Neurosci. Methods 2002, 117, 43–49. [Google Scholar] [CrossRef]
- Persson, L.; Hårdemark, H.G.; Bolander, H.G.; Hillered, L.; Olsson, Y. Neurologic and Neuropathologic Outcome after Middle Cerebral Artery Occlusion in Rats. Stroke 1989, 20, 641–645. [Google Scholar] [CrossRef] [Green Version]
- Schallert, T. Behavioral Tests for Preclinical Intervention Assessment. NeuroRx 2006, 3, 497–504. [Google Scholar] [CrossRef]
- Garcia, J.H.; Liu, K.F.; Ho, K.L. Neuronal Necrosis after Middle Cerebral Artery Occlusion in Wistar Rats Progresses at Different Time Intervals in the Caudoputamen and the Cortex. Stroke 1995, 26, 636–642. [Google Scholar] [CrossRef]
- Roda, J.M.; Carceller, F.; Diez-Tejedor, E.; Avendano, C. Reduction of Infarct Size by Intra-Arterial Nimodipine Administered at Reperfusion in a Rat Model of Partially Reversible Brain Focal Ischemia. Stroke 1995, 26, 1888–1892. [Google Scholar] [CrossRef]
- Ostrova, I.V.; Kalabushev, S.N.; Ryzhkov, I.A.; Tsokolaeva, Z.I. A Novel Thromboplastin-Based Rat Model of Ischemic Stroke. Brain Sci. 2021, 11, 1475. [Google Scholar] [CrossRef]
- Bärmann, J.; Walter, H.L.; Pikhovych, A.; Endepols, H.; Fink, G.R.; Rueger, M.A.; Schroeter, M. An Analysis of the CatWalk XT and a Composite Score to Assess Neurofunctional Deficits after Photothrombosis in Mice. Neurosci. Lett. 2021, 751, 135811. [Google Scholar] [CrossRef]
- Corte, G.M.; Humpenöder, M.; Pfützner, M.; Merle, R.; Wiegard, M.; Hohlbaum, K.; Richardson, K.; Thöne-Reineke, C.; Plendl, J. Anatomical Evaluation of Rat and Mouse Simulators for Laboratory Animal Science Courses. Animals 2021, 11, 3432. [Google Scholar] [CrossRef]
- The Principles of Humane Experimental Technique. Med. J. Aust. 1960, 1, 500. [CrossRef]
- Ritskes-Hoitinga, M.; Van Luijk, J. How Can Systematic Reviews Teach Us More about the Implementation of the 3Rs and Animal Welfare? Animals 2019, 9, 1163. [Google Scholar] [CrossRef] [Green Version]
- Shakova, F.M.; Kirova, Y.I.; Silachev, D.N.; Romanova, G.A.; Morozov, S.G. Protective Effects of Pgc-1α Activators on Ischemic Stroke in a Rat Model of Photochemically Induced Thrombosis. Brain Sci. 2021, 11, 325. [Google Scholar] [CrossRef]
- Leussis, M.P.; Bolivar, V.J. Habituation in Rodents: A Review of Behavior, Neurobiology, and Genetics. Neurosci. Biobehav. Rev. 2006, 30, 1045–1064. [Google Scholar] [CrossRef]
- Dissegna, A.; Turatto, M.; Chiandetti, C. Context-Specific Habituation: A Review. Animals 2021, 11, 1767. [Google Scholar] [CrossRef]
- Parsons, M.H.; Sarno, R.J.; Deutsch, M.A. A Detailed Protocol to Enable Safe-Handling, Preemptive Detection, and Systematic Surveillance of Rat-Vectored Pathogens in the Urban Environment. Front. Public Heal. 2016, 4, 132. [Google Scholar] [CrossRef] [Green Version]
- Lydén, F. Handling Methods of Laboratory Mice and Rats Hanteringsmetoder Av Försöksmöss Och Råttor Uppsala 2016 Ethology and Animal Welfare-Bachelor’s Programme; Helmersson. 2016. Available online: https://stud.epsilon.slu.se/9461/1/Lyden_F_160708.pdf (accessed on 12 November 2022).
- Cloutier, S.; LaFollette, M.R.; Gaskill, B.N.; Panksepp, J.; Newberry, R.C. Tickling, a Technique for Inducing Positive Affect When Handling Rats. J. Vis. Exp. 2018, 2018, 57190. [Google Scholar] [CrossRef] [Green Version]


Publisher’s Note: MDPI stays neutral with regard to jurisdictional claims in published maps and institutional affiliations. |
© 2022 by the authors. Licensee MDPI, Basel, Switzerland. This article is an open access article distributed under the terms and conditions of the Creative Commons Attribution (CC BY) license (https://creativecommons.org/licenses/by/4.0/).
Share and Cite
Pawletko, K.; Jędrzejowska-Szypułka, H.; Bogus, K.; Pascale, A.; Fahmideh, F.; Marchesi, N.; Grajoszek, A.; Olakowska, E.; Barski, J.J. A Novel Improved Thromboembolism-Based Rat Stroke Model That Meets the Latest Standards in Preclinical Studies. Brain Sci. 2022, 12, 1671. https://doi.org/10.3390/brainsci12121671
Pawletko K, Jędrzejowska-Szypułka H, Bogus K, Pascale A, Fahmideh F, Marchesi N, Grajoszek A, Olakowska E, Barski JJ. A Novel Improved Thromboembolism-Based Rat Stroke Model That Meets the Latest Standards in Preclinical Studies. Brain Sciences. 2022; 12(12):1671. https://doi.org/10.3390/brainsci12121671
Chicago/Turabian StylePawletko, Katarzyna, Halina Jędrzejowska-Szypułka, Katarzyna Bogus, Alessia Pascale, Foroogh Fahmideh, Nicoletta Marchesi, Aniela Grajoszek, Edyta Olakowska, and Jarosław Jerzy Barski. 2022. "A Novel Improved Thromboembolism-Based Rat Stroke Model That Meets the Latest Standards in Preclinical Studies" Brain Sciences 12, no. 12: 1671. https://doi.org/10.3390/brainsci12121671