1. Introduction
Hydrocephalus is caused by an imbalance of production and absorption of cerebrospinal fluid (CSF) or obstruction of its pathways, resulting in ventricular dilatation and increased intracranial pressure. Imaging finding plays a crucial role in the diagnosis. The sign of hydrocephalus is ventricular enlargement with some typical radiographic features, including dilated temporal horns, dilated third ventricle, rounded poster horns, thinned corpus callosum, and CSF extravasation [
1,
2]. However, ventricles of the human brain also enlarged with aging, neurodegenerative diseases, intrinsic and extrinsic pathologies [
3,
4]. The classical hydrocephalus diagnostic indicators have been widely used for a long time. However, the value and weight of each diagnostic indicator has not been studied.
The morphometric examination of neuroimages is a practical approach to assess structural changes of hydrocephalus [
5,
6,
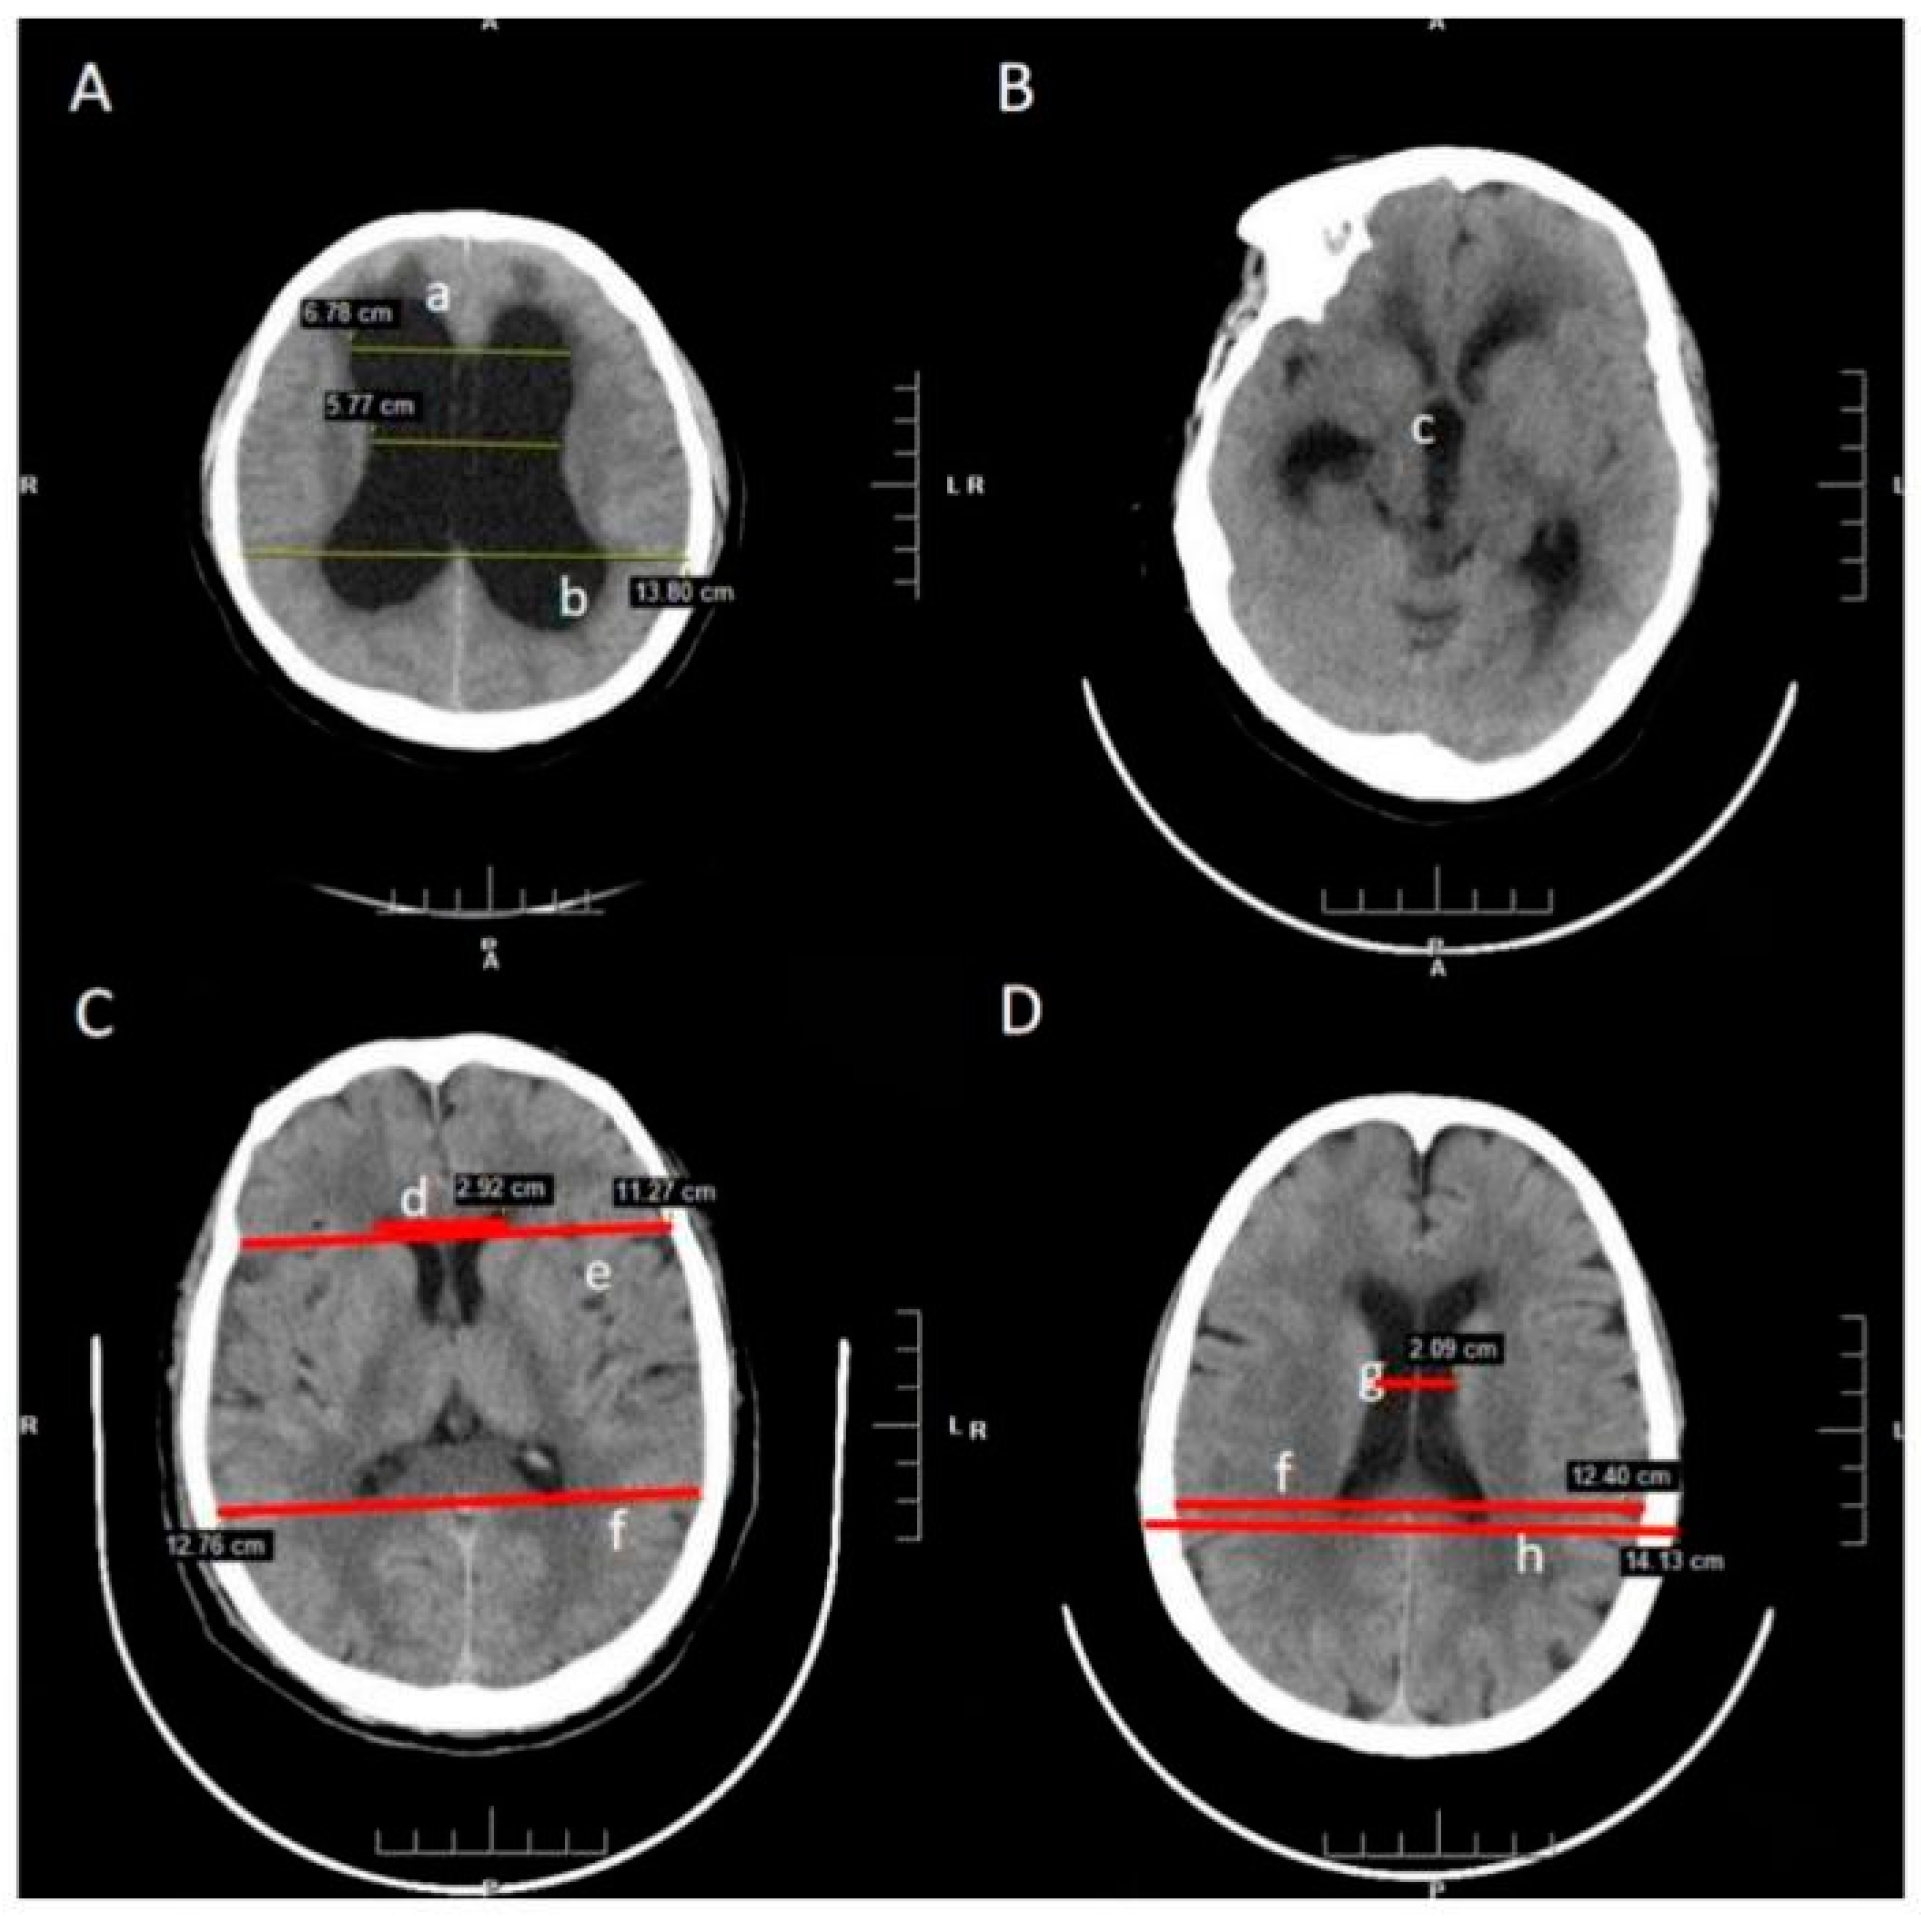
7]. In this study, the commonly used morphological parameters, including frontal horns’ length (FHL), maximum lateral length (MLL), biparietal diameter (BPD), Evans’ ratio (ER), cella media ratio (CMR), and frontal horns’ ratio (FHR), were collected and compared. The classic radiographic features were also analyzed, including dilated temporal horns, dilated third ventricle, rounded posterior horns, and disproportionately enlarged subarachnoid space hydrocephalus. Multiple machine learning approaches have been used to predict hydrocephalus and measure the weight of each diagnosis index. We believe that better prediction can significantly improve the diagnosis and treatment of these patients.
3. Results
A total of 298 patients were included in the study. The baseline statistics of the hydrocephalus group, symptomatic group, and normal control group are presented in
Table 2. The hydrocephalus group and symptomatic group were compared, and the ROC curves of the four derived models are plotted in
Figure 3. The ANN model (0.96 ± 0.05) and RF (0.96 ± 0.06) achieved the highest area under the ROC curve, followed by the SVM (0.94 ± 0.05) model and xgBoost (0.94 ± 0.07). In the observation of the precision, recall, and F1 value, the SVM model performs relatively well, especially the F1 value reached 0.96 in the test set (
Table 3).In terms of the weight of diagnostic features, the top three are DESH (28.11%), ER (24.79%), and FHR (10.64%).
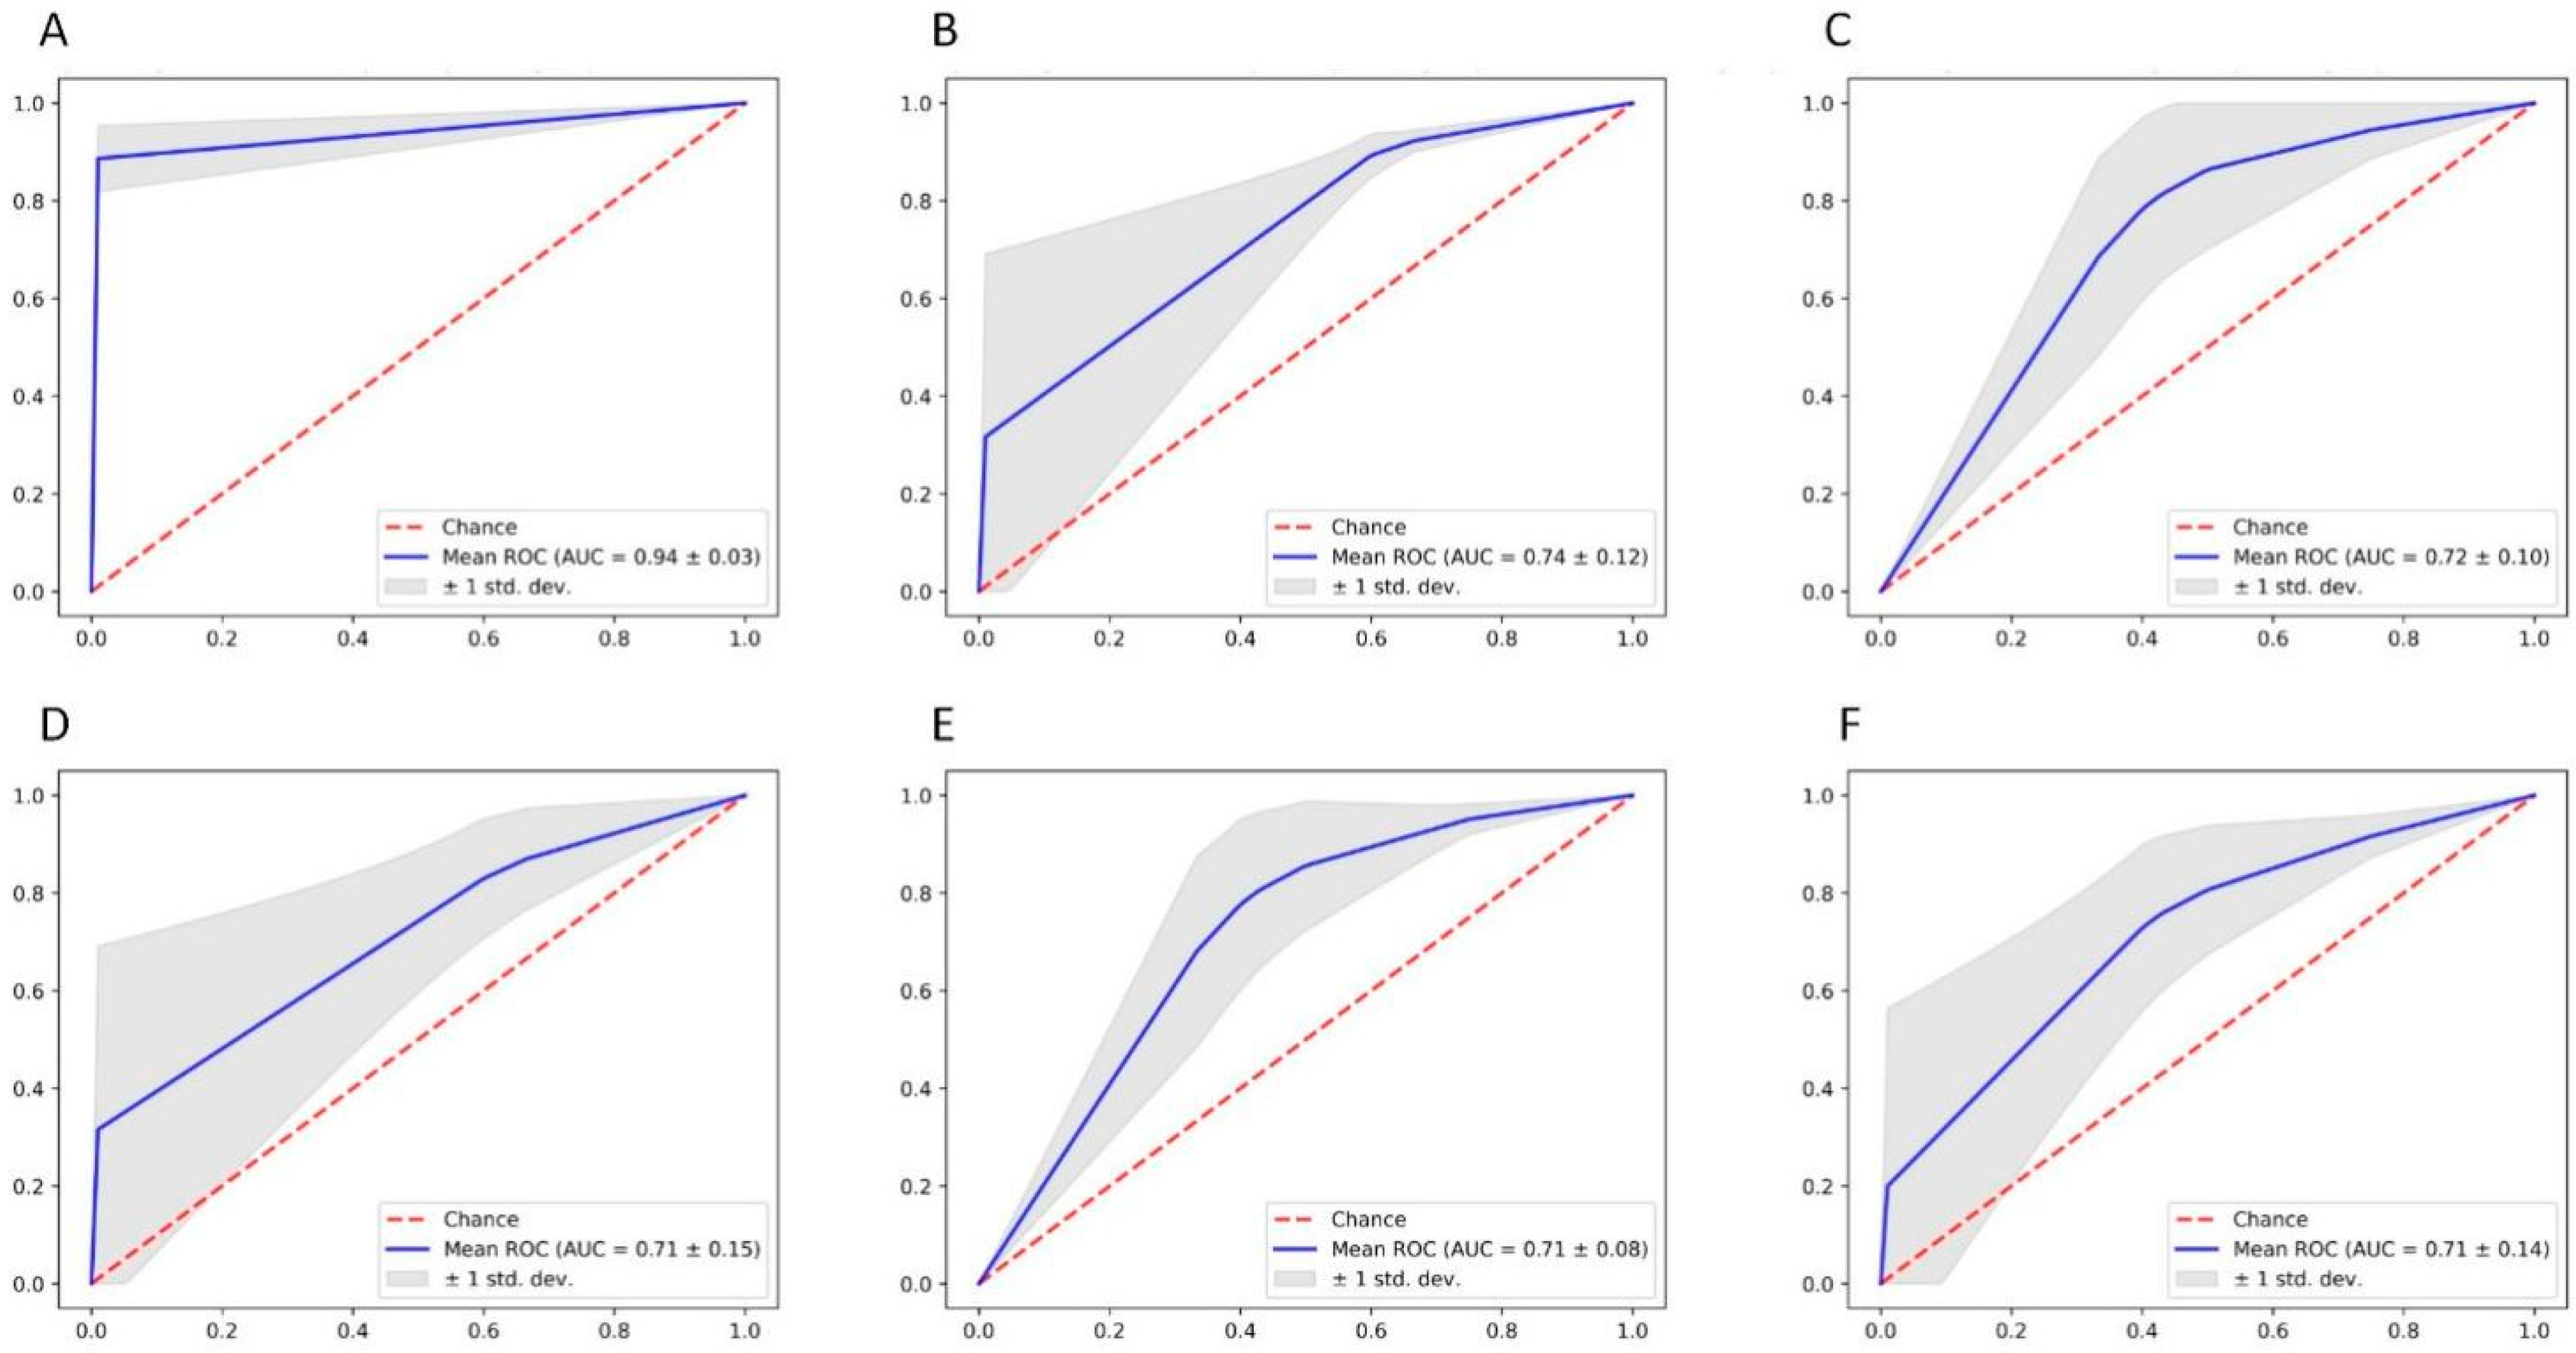
Although the results were consistent with our clinical experience, the most important index requires clinician supervisor judgment. To further clarify the value of objective indicators, we removed radiological features, and the analysis was redone. In terms of morphometric parameters features, the ROC curve was not as superior as before but can still be valuable in the diagnosis of hydrocephalus. At this time, the SVM model achieved the highest area under the ROC curve of 0.74 ± 0.15, followed by the RF (0.73 ± 0.17) model, ANN (0.71 ± 0.16) model, and xgBoost (0.70 ± 0.18).
Then we attained radiographic features and confusion matrix of morphometric parameters for analysis. From the results, it is seen that the combined four radiographic features, including dilated temporal horns, dilated third ventricle, rounded posterior horns, and DESH, is leading in decision making, even without measuring parameters indicators (AUC = 0.94 ± 0.03) (
Figure 4). In terms of morphometric parameters, ER, FHR and CMR showed similar diagnostic values (
Table 4).
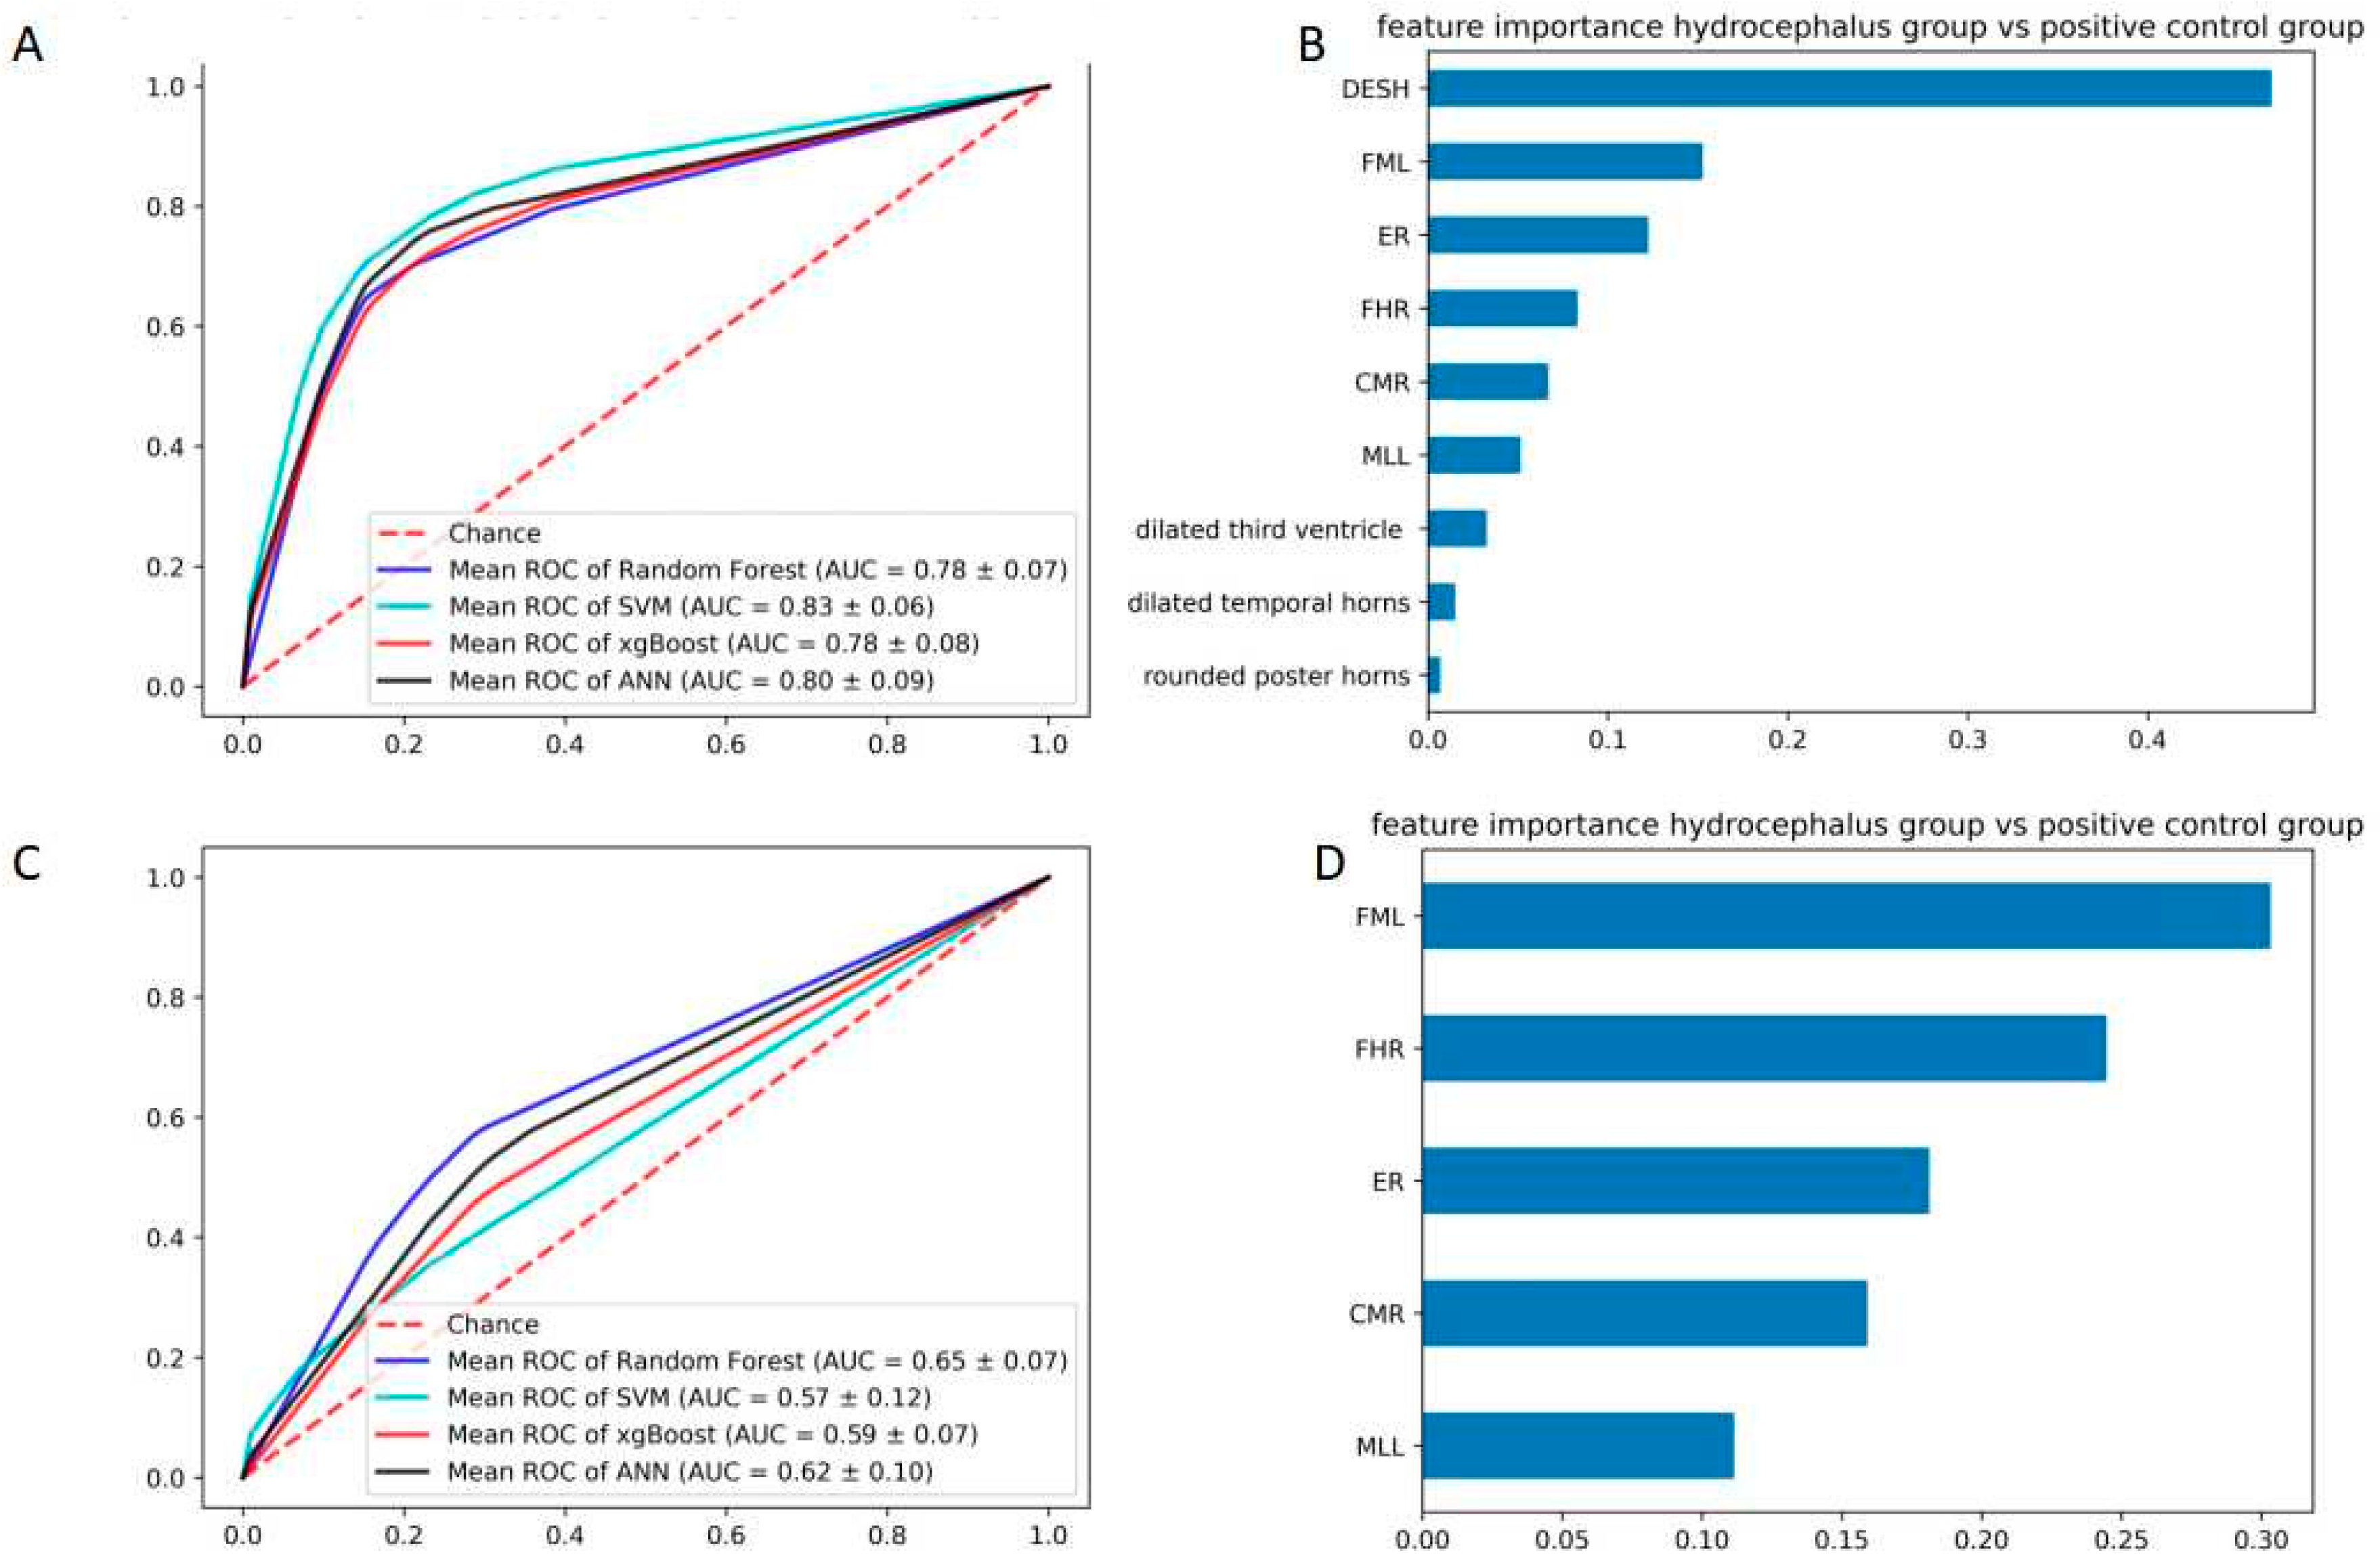
The following is the key part of this study. We analyze the patient with hydrocephalus symptoms. The ROC curves showed a visible decline compared to the previous comparison. The SVM (0.83 ± 0.06) model achieved the highest area, followed by the RF (0.78 ± 0.07) model, ANN (0.80 ± 0.09) model, and xgBoost (0.83 ± 0.06). The importance of features were DESH (46.88%), FML (15.27%), ER (12.25%), FHR (8.31%) and CMR (6.68%).The AUC and F1 were also inferior in terms of morphometric parameters features (
Table 5). In terms of morphometric parameters, the AUC also declined (
Figure 5). It is worth noting that the weight of ER decreased from 52.26% to 18.13%, while the weight of FHL (30.34%) and FHR (24.47%) were increased.
To further clarify the diagnostic value of these indicators, we performed regression analysis. The results show that ER, CMR, FHR, and DESH are significant (
p < 0.05) in this diagnosis. Other diagnostic indicators showed no statistical significance. Then, we noticed that the patient in the symptomatic group (49.87 ± 15.53), who had symptoms but without hydrocephalus diagnosis, were relatively older than the hydrocephalus group (70.37 ± 11.42). Thus, we extract the patients aged more than 60 years and conduct another analysis (
Table 6). Univariate analysis showed that there were statistically significant differences in ER, CMR, FHR, dilated third ventricle and DESH (
p < 0.05). The dilated temporal horns and rounded posterior horns were not significant (
p > 0.05). Meanwhile, aging may tend to be a negative diagnostic index of hydrocephalus (
p = 0.002, OR = 1.14, 95% CI: 1.031~1.271).
4. Discussion
Hydrocephalus is a common symptom that can have a number of causes [
1,
23]. Hydrocephalus on its own can be life-threatening and very difficult to manage with many complications [
7,
24,
25]. If the symptom is not treated, it can develop into an independent disease that requires ongoing treatment even after the causes are relieved. Even so, some of the patients may not be easy to be diagnosed and treated in time.
The diagnosis of hydrocephalus depends on clinical manifestations, imaging findings, and lumbar puncture results. Imaging plays a central role in confirming the diagnosis, identifying the cause, and planning treatment. As an invasive operation, lumbar puncture cannot be applied to the symptomatic patients as a general diagnostic method, so many patients would be undiagnosed and lose the best opportunity for treatment. Especially for a special form of hydrocephalus is known as “idiopathic normal pressure hydrocephalus,” imaging finding is irreplaceable [
26,
27,
28,
29].
A very sensitive sign of this is the dilatation of the temporal horns and posterior horns. A diameter of >2 mm in adults is considered pathological, but there are no strict criteria in the literature because of different head circumferences [
2]. Moreover, the width of the third ventricle increases so that it is no longer slit-shaped but rather ballooned or laterally bowed. Compared to the dilated ventricular system, the external CSF spaces are disproportionately thin [
30]. Because the imaging sign relies on clinical experience, many objective measures still play an important role in the diagnosis of hydrocephalus. The Evans’ Index is most widely used in the clinical routine to quantify dilatation of the ventricles. The ratio of the maximum width of the frontal horns of the lateral ventricles And the greatest internal diameter of the skull. It was described by Evans [
31] in 1942 as a method of measurement of ventricular size in pediatric patients. A value of >0.3 is considered pathological [
12,
32]. Cella Media Ratio and Frontal Horns’ Ratio are also well-used indexes. Cella Media Ratio is the ratio of the minimum distance between lateral walls of lateral ventricles in cella media region, a, and maximum transverse (external) diameter. It is expected to be smaller than 0.25 in normal cases [
33]. Frontal Horns’ Ratio is the ratio of the maximum width of the frontal horns of the lateral ventricles and inner diameter of the skull in the same line, and the Mean FHR was found to be 0.302 [
34,
35].Callosal Angle is also a recent imaging factor that has been suggested to be associated with hydrocephalus. But it is still need evidence of clinical application [
13].
From a measurement point of view, we investigated the diagnostic effectiveness of the combined nine radiological features and morphometric parameters. Usually, a radiologist can identify hydrocephalus patients based on their imaging features without taking measurements, and our result confirms it (AUC = 0.94 ± 0.03). ER as classic diagnostic criteria also showed some advantages, in particular with identifying patients from normal patients.
In dealing with patients who have symptoms and some radiographic changes, the value of ER decreased. In contrast, the measurement of FHL and FHR become more significant. The dilation in ventricular morphology also lost significant diagnostic value. Many patients with idiopathic ventricular system enlargement have been observed in the clinic without clinical symptoms and do not require treatment. DESH, which relies on doctors’ judgment, is a powerful diagnostic tool throughout.
In clinical practice, senior patients may have complicated symptoms, some of which may miss the diagnosis of hydrocephalus. Particularly for the iNPH, which is the only reversible type of dementia. The ventricular morphology was not always reliable.
We should observe the morphology and pay more attention to recognizing DESH. For the patient with complex symptoms, the diagnostic value of FHR should be taken into consideration rather than ER value [
36,
37,
38].
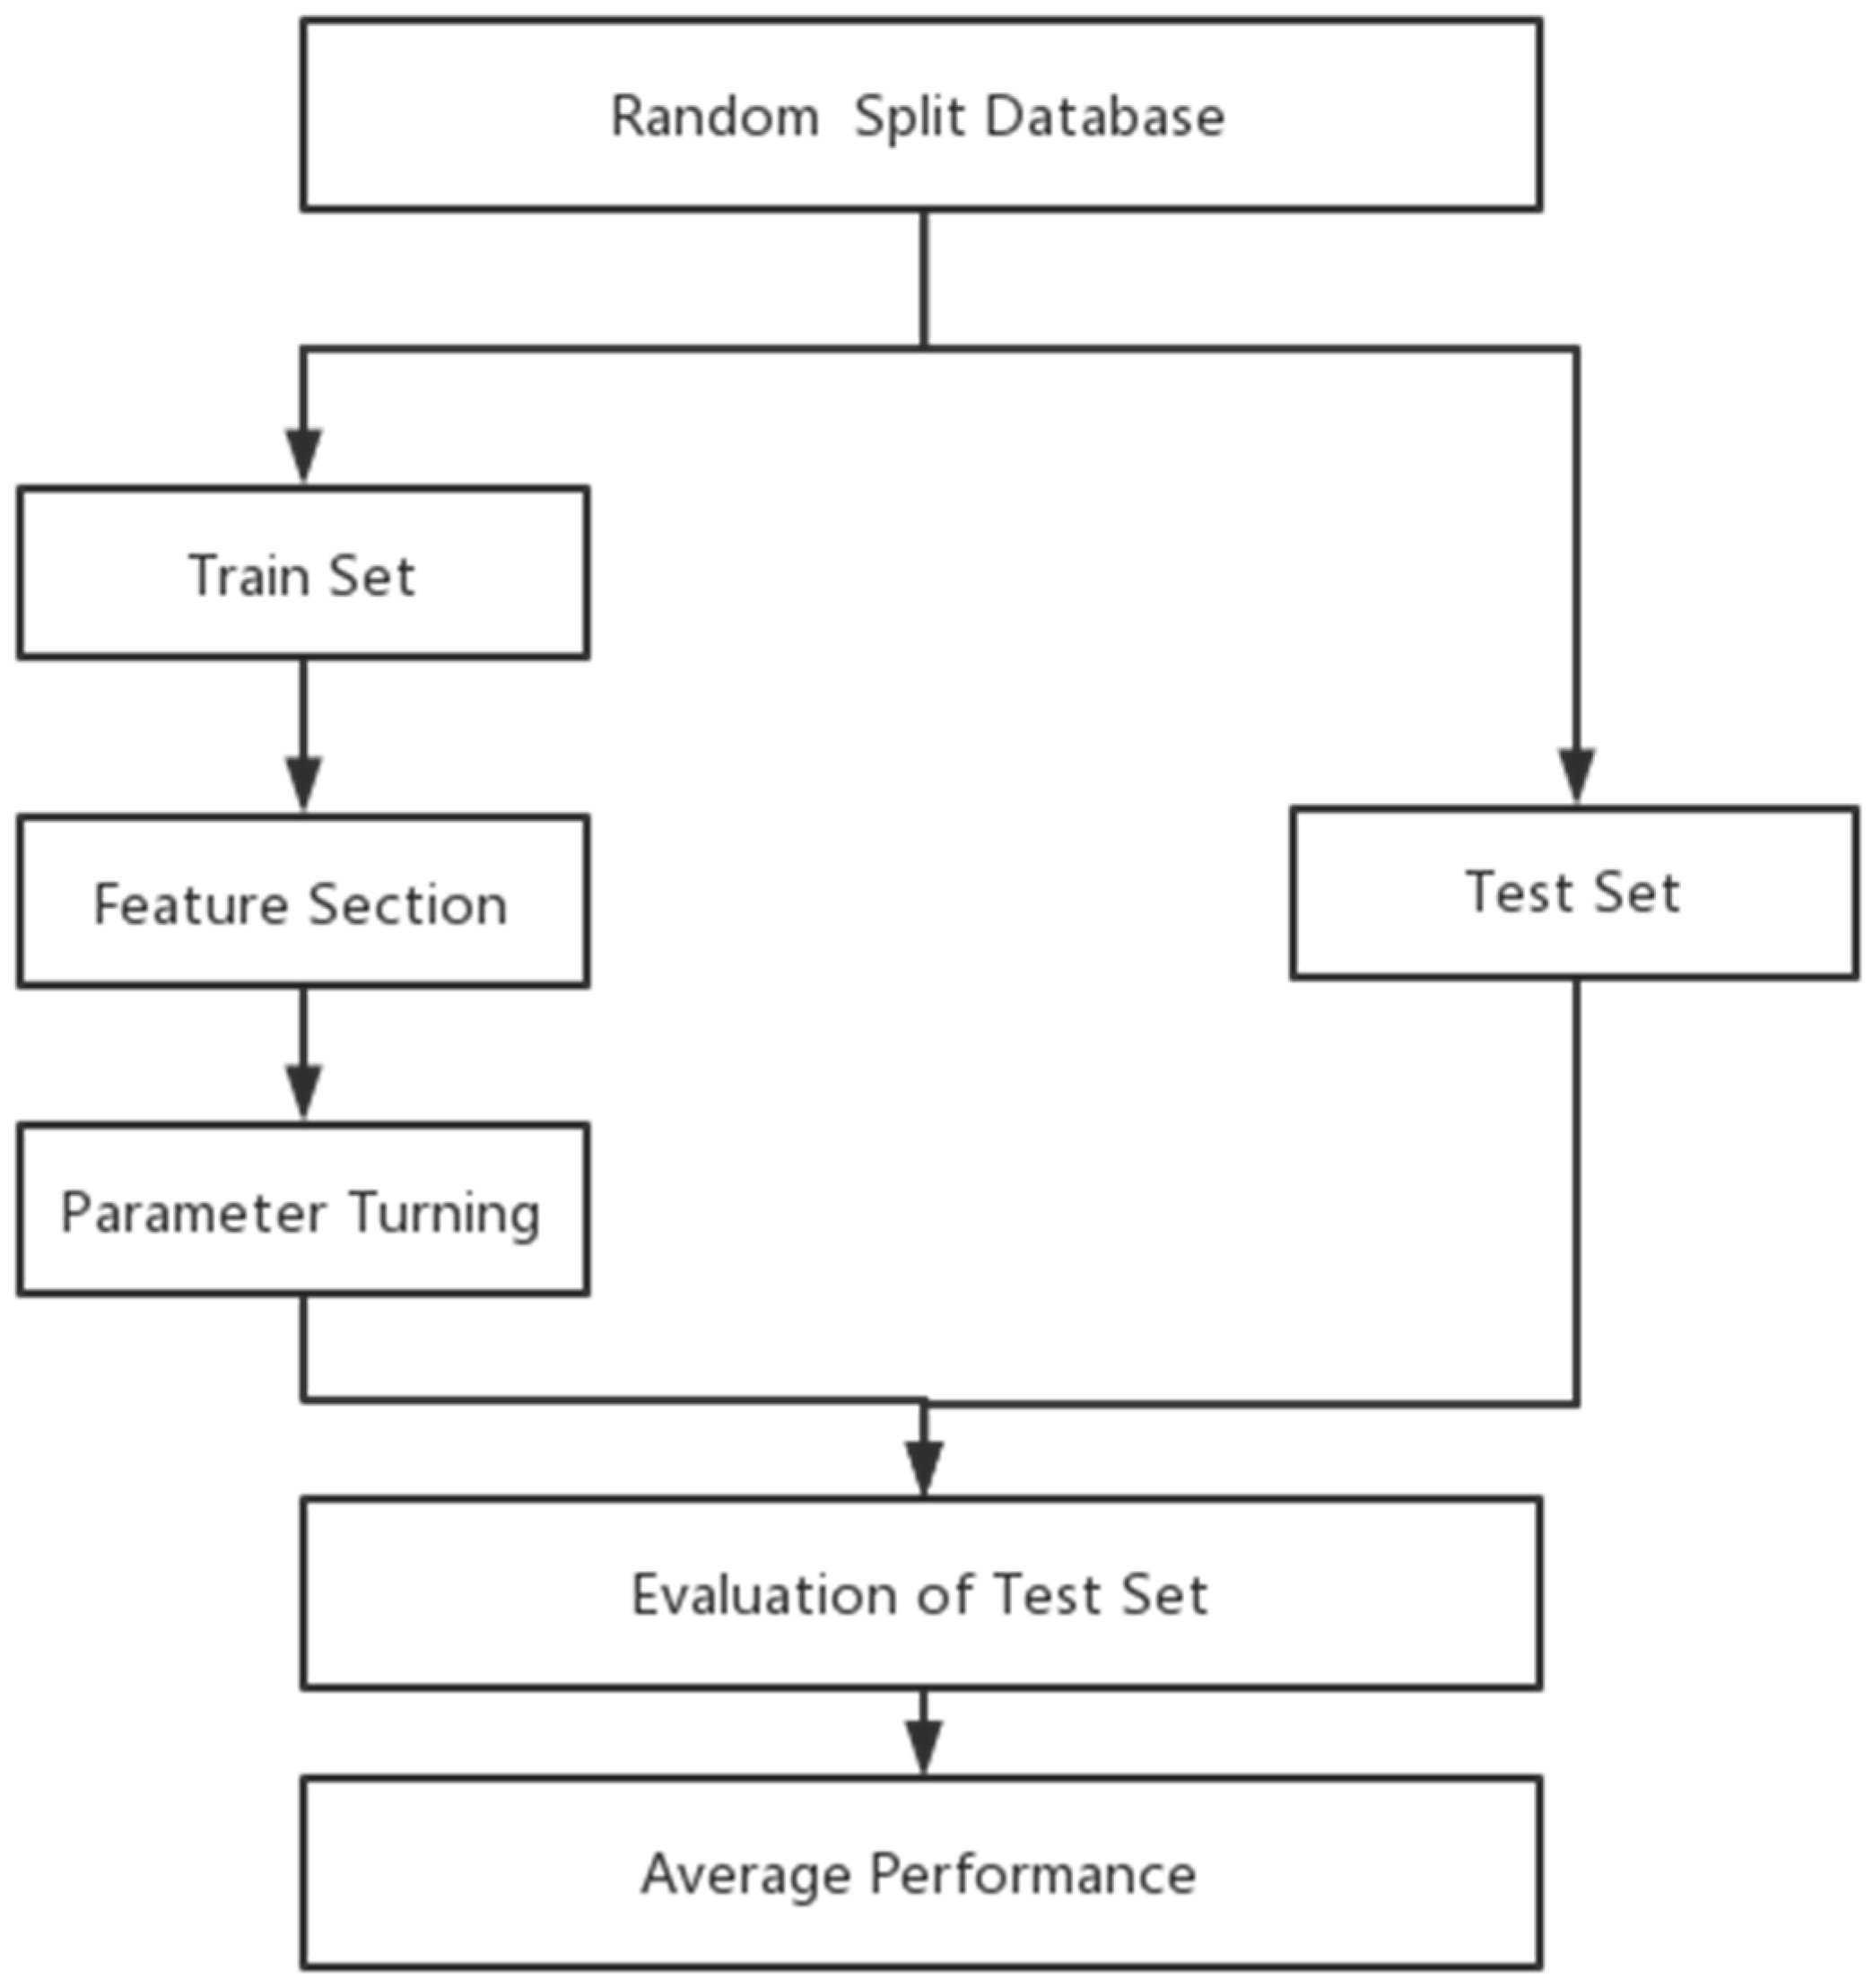
Since hydrocephalus has typical imaging manifestations, meanwhile the patient could relieve significantly after shunt surgery. To optimize the diagnosis is of great value. Although the diagnostic criteria have been widely used for many years, it is also necessary to define and optimize the weight of each indicator. Machine learning is an excellent method to provide information, especially when some diagnostic indicators become more meaningful and others become less valuable in different situations. This research method can be applied to the optimization of the diagnosis of other diseases in the future, and it can be expected to put forward the reference weight of diagnostic criteria in different situations to achieve the role of updating clinical diagnostic criteria.
This study had several limitations. First, the diagnosis of hydrocephalus relied on the attending physicians’ evaluation. At the same time, our study was a retrospective analysis, and the number of specimens was relatively low. Fortunately, we have adopted a variety of machine learning models to analyze and process the data to minimize the omission of important indicators. Multi-center prospective study with long-term follow-up will be needed to validate the model further.


