
Intermittent Theta Burst Stimulation to the Primary Motor Cortex Reduces Cortical Inhibition: A TMS-EEG Study


Abstract
:1. Introduction
2. Methods
2.1. Participants
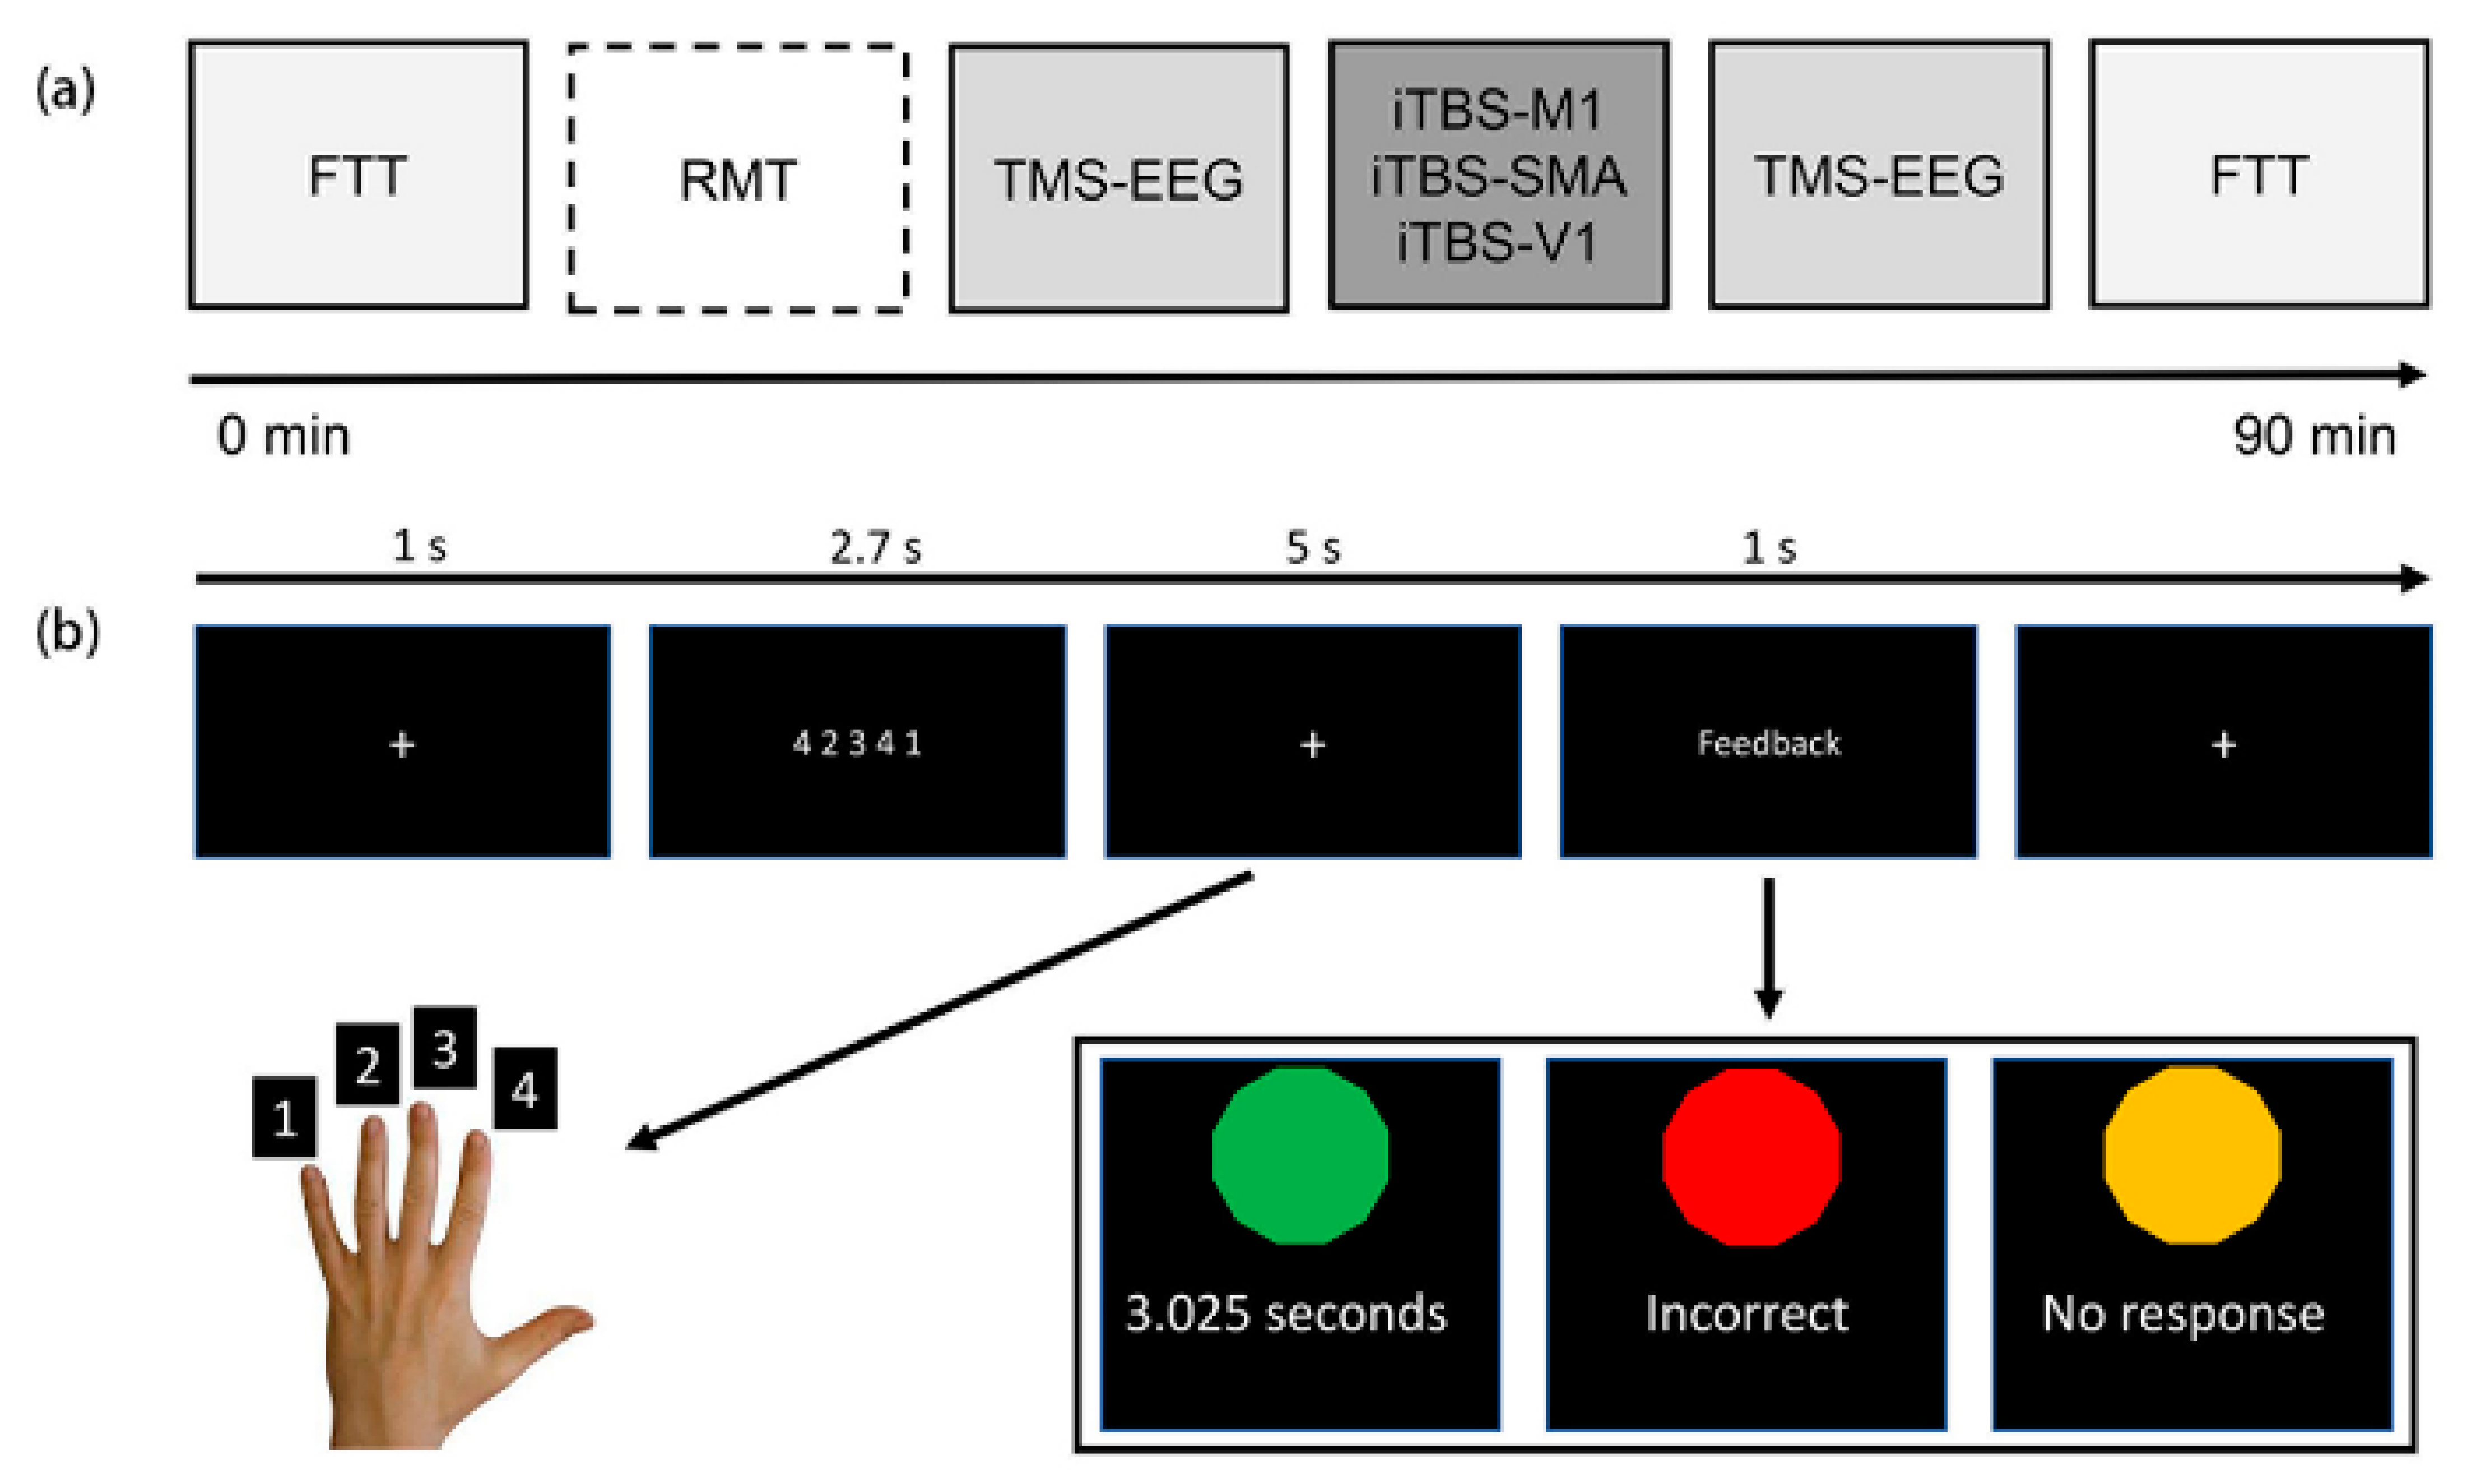
2.2. Procedures
2.3. Finger Tapping Task
2.4. Transcranial Magnetic Stimulation
2.5. TMS-EEG Recording
2.6. Data Processing
2.7. Statistical Analysis
3. Results
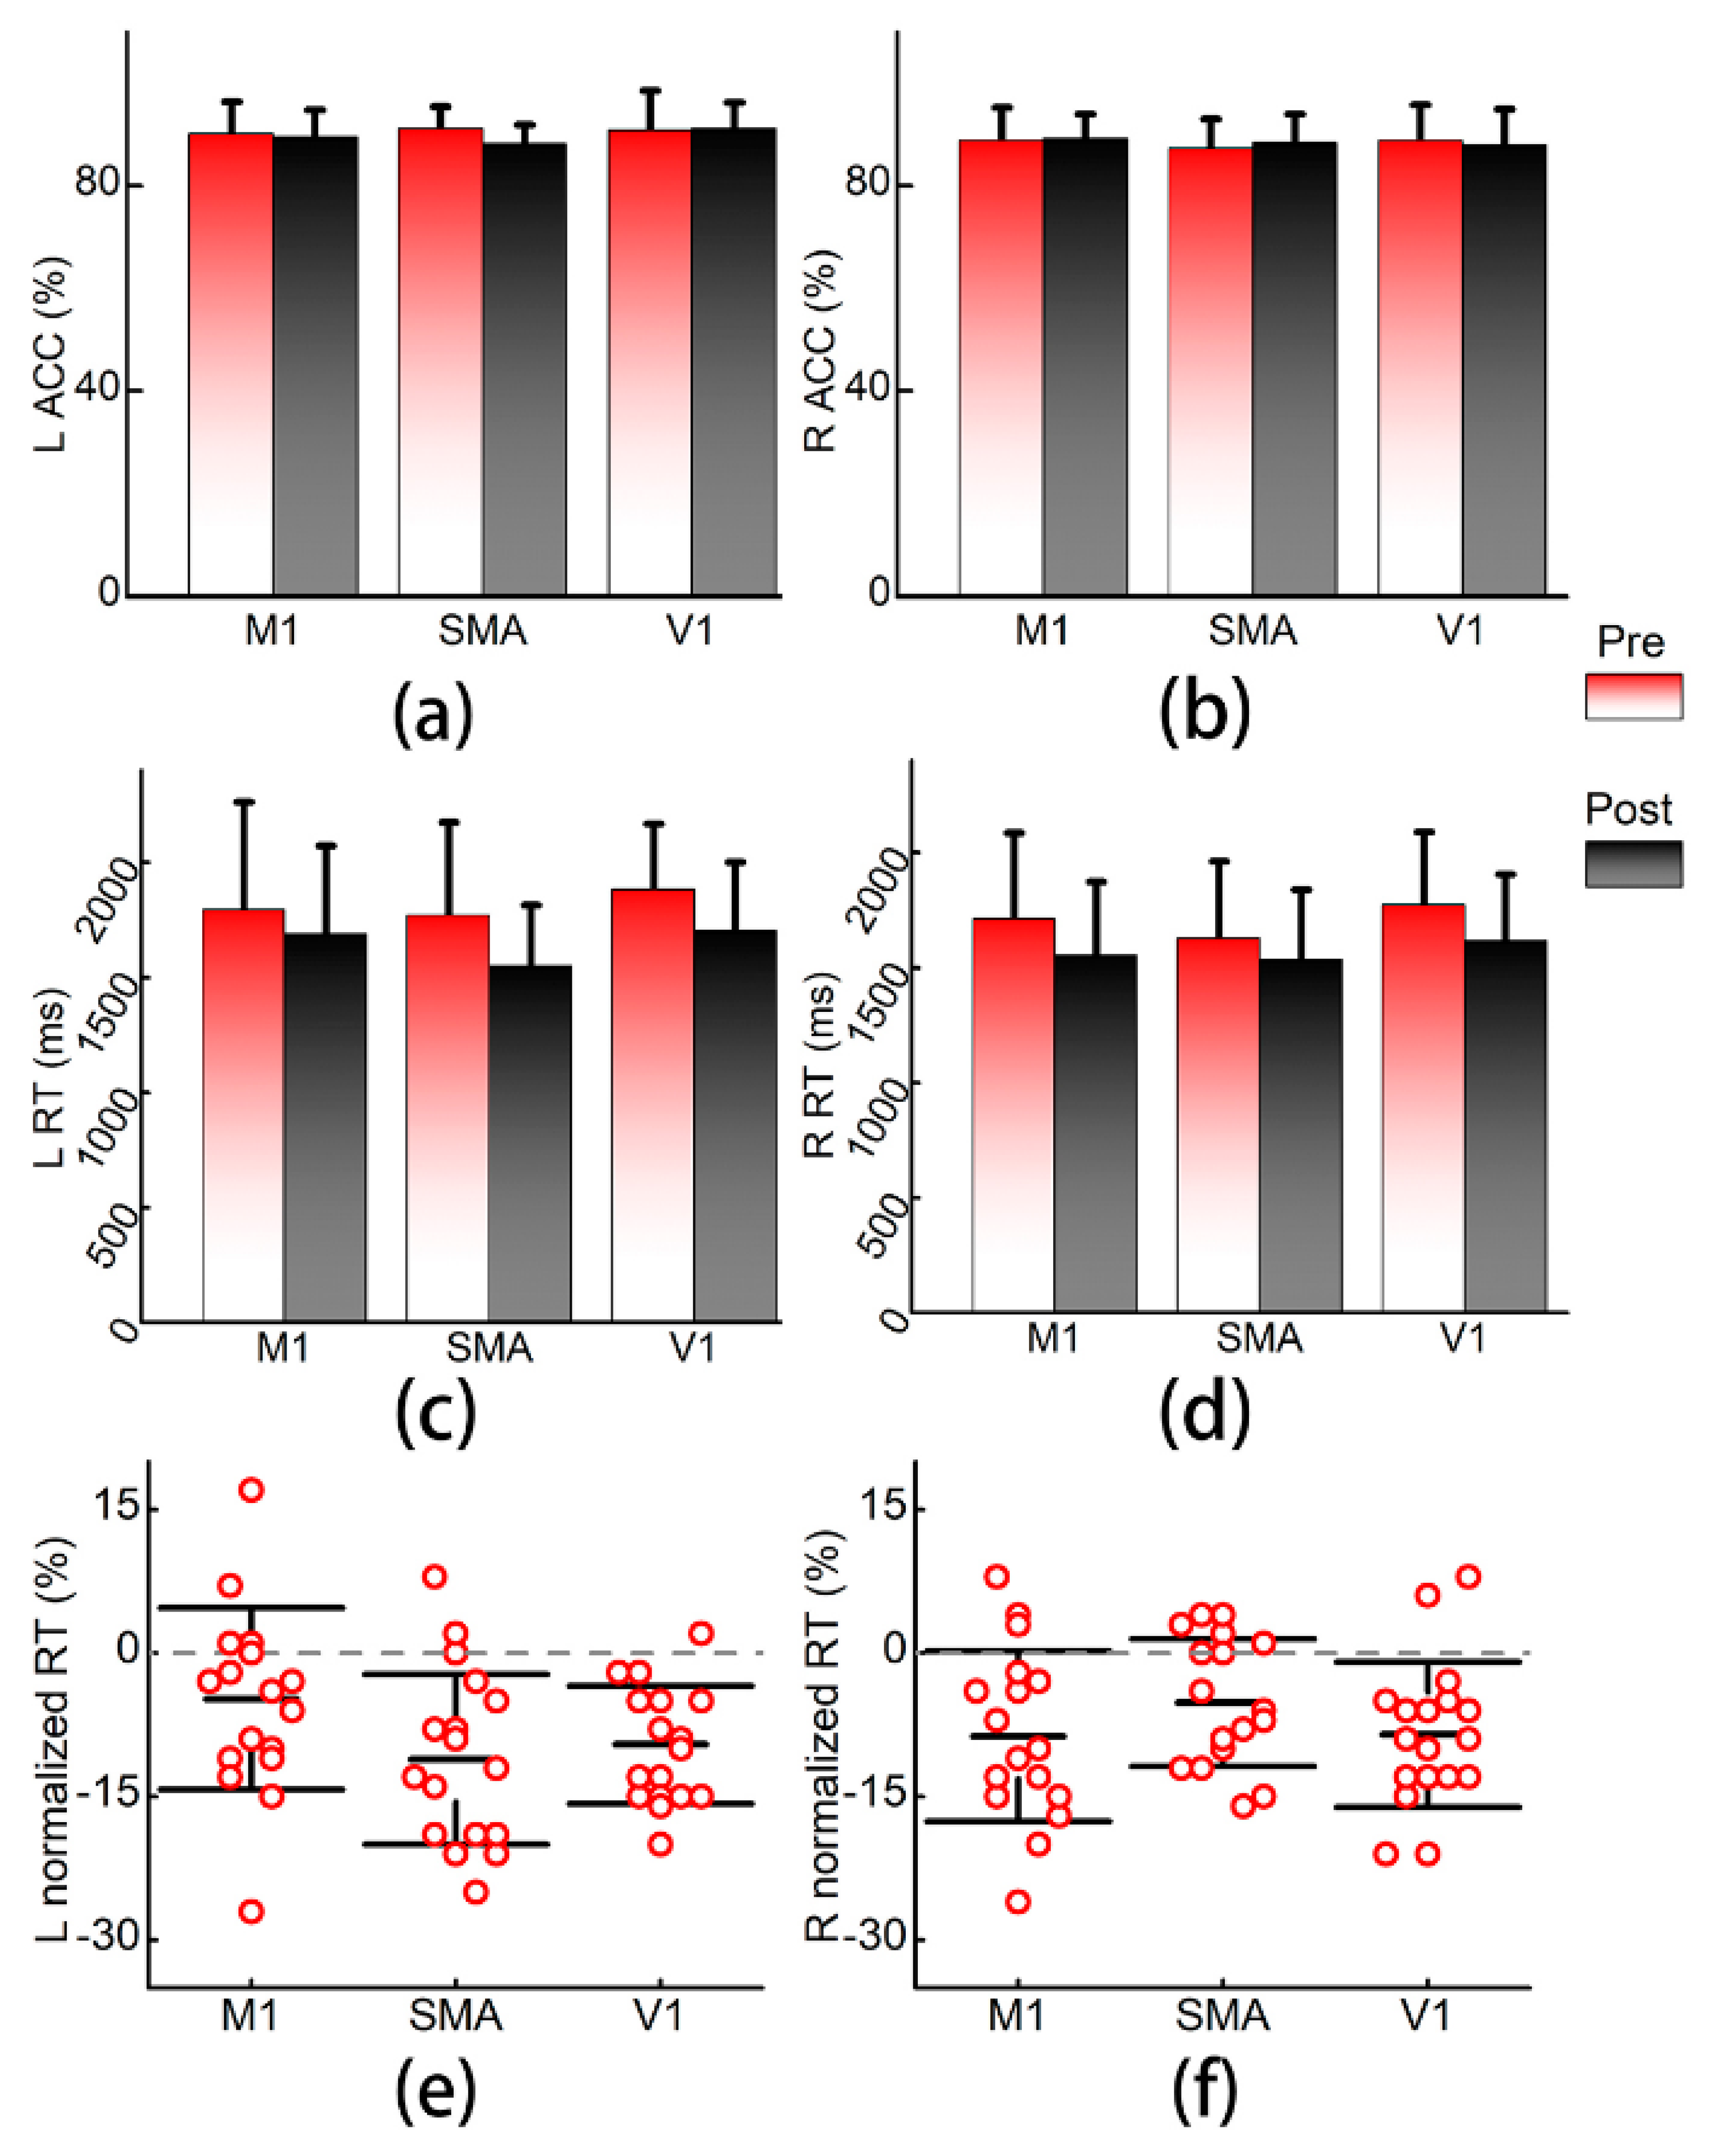
3.1. Finger Tapping Task
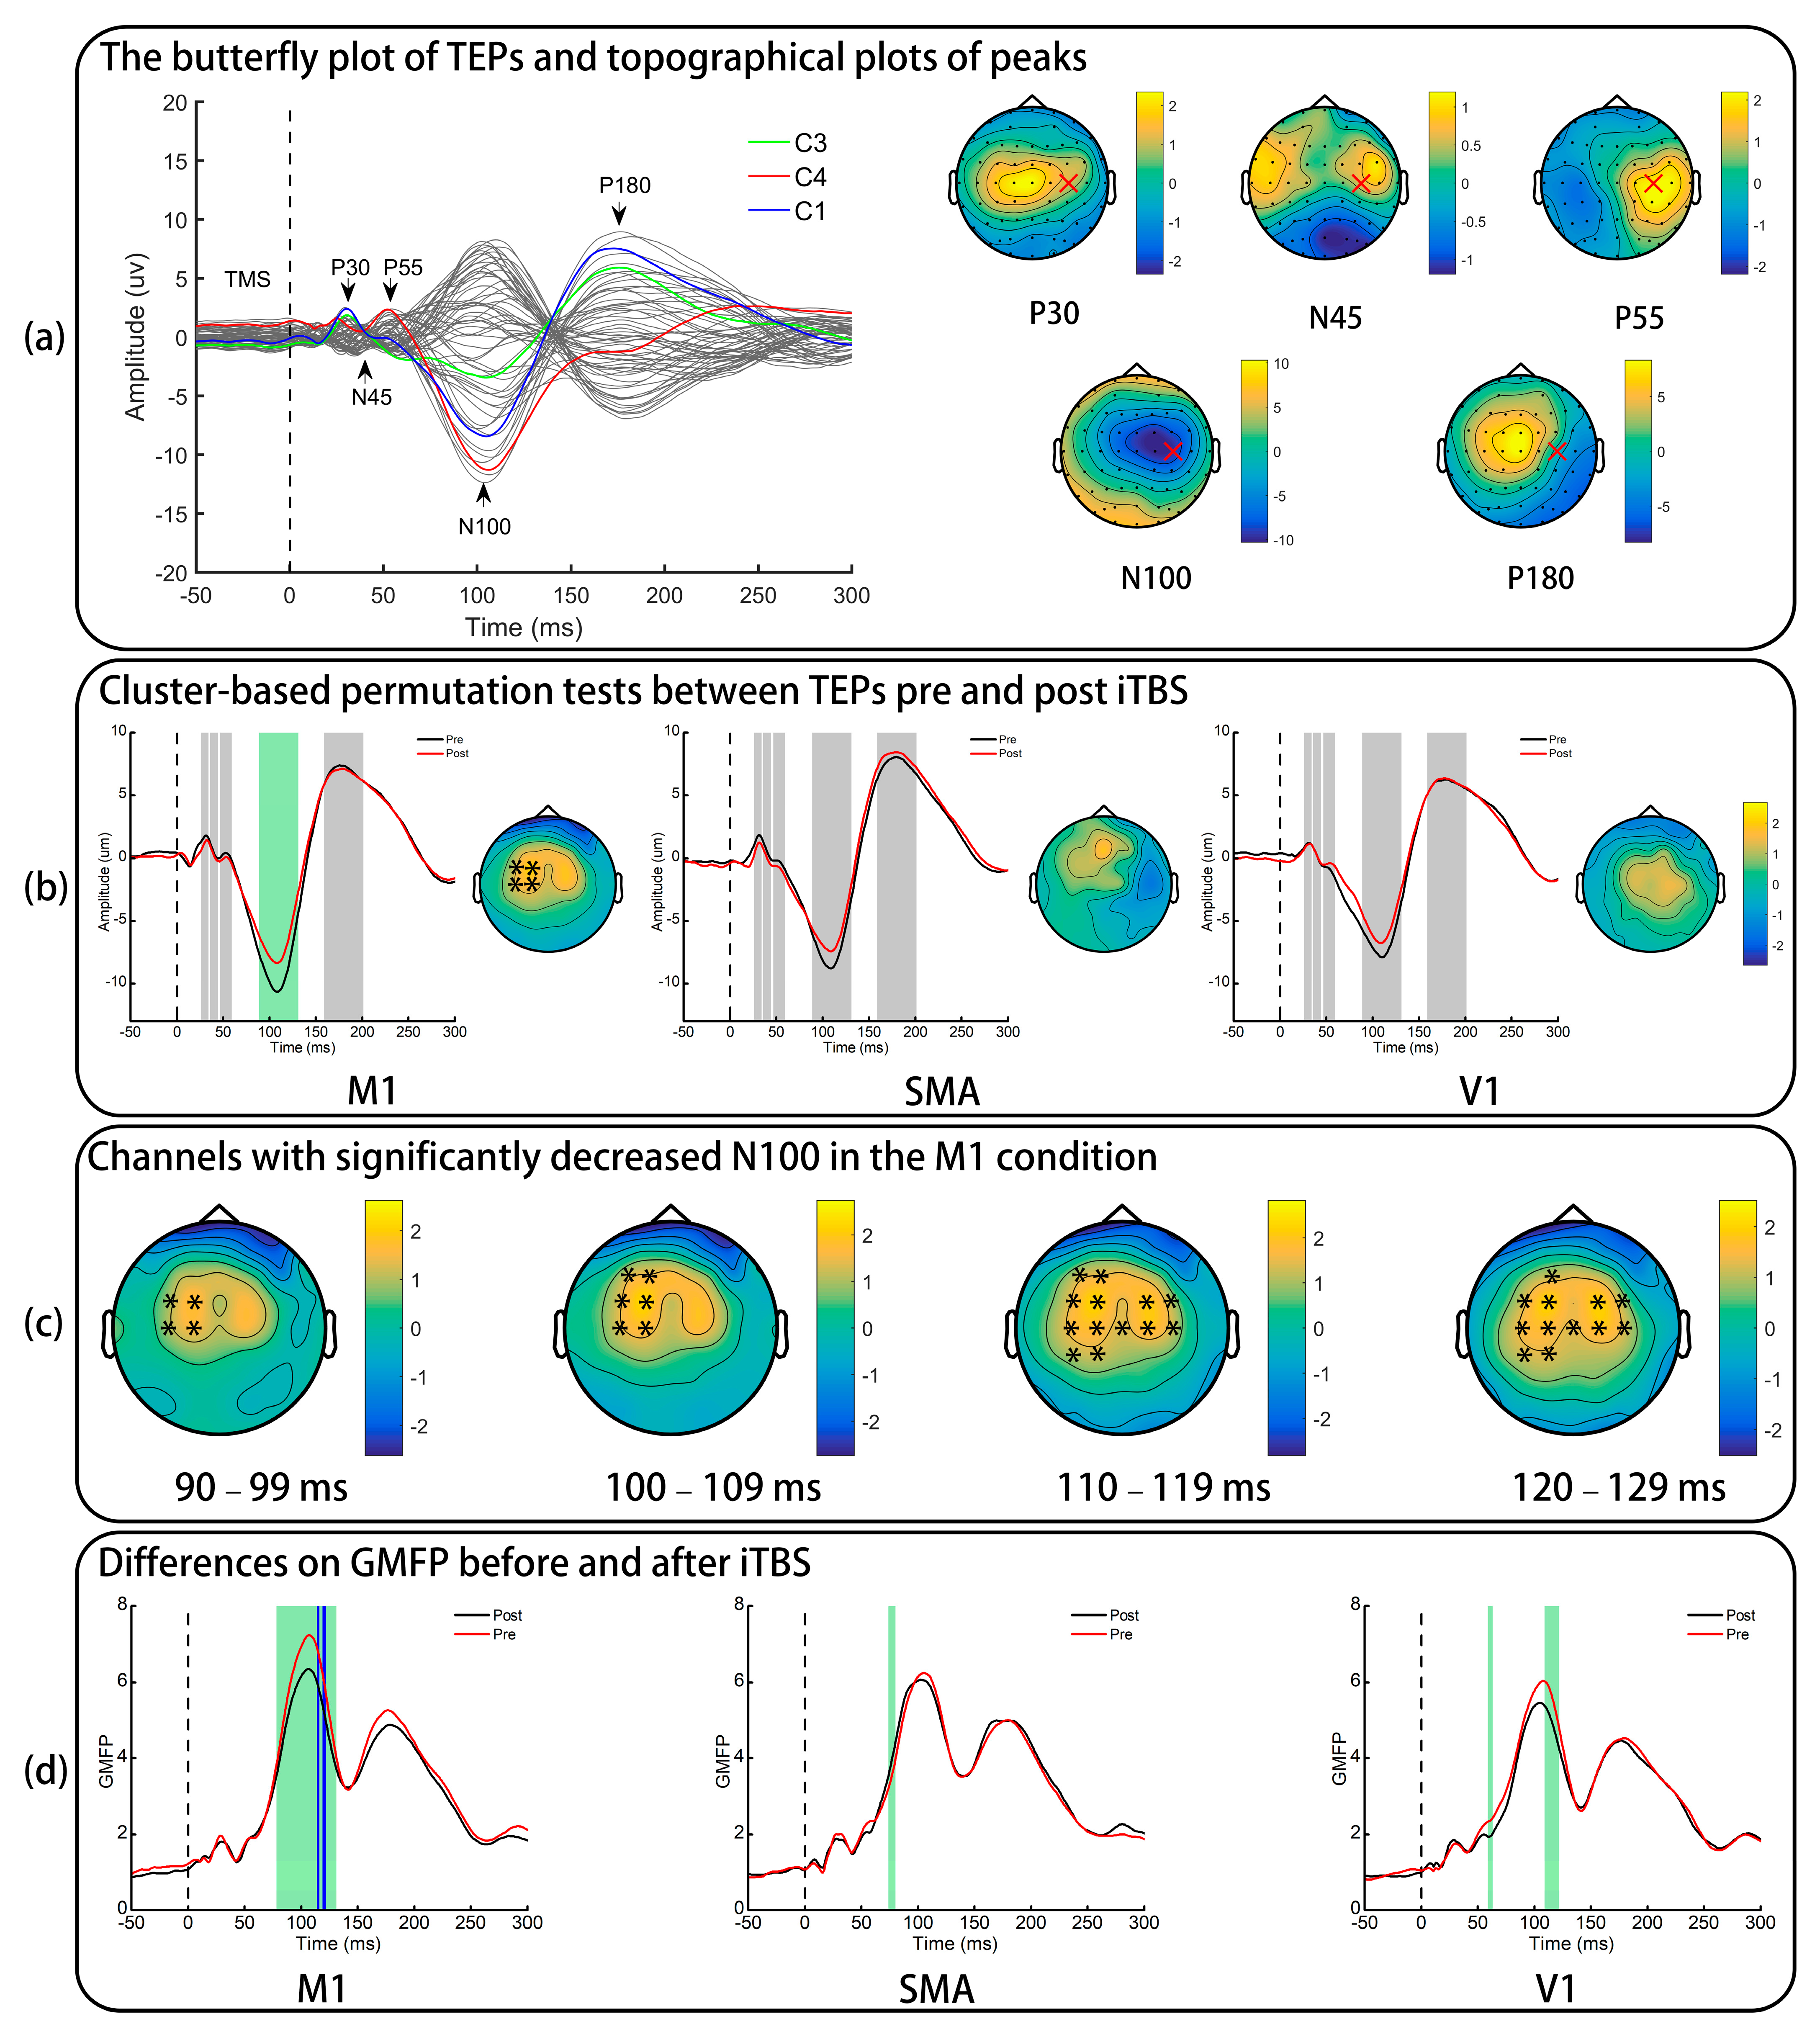
3.2. TMS-Evoked Potentials
3.3. Global Mean Field Power
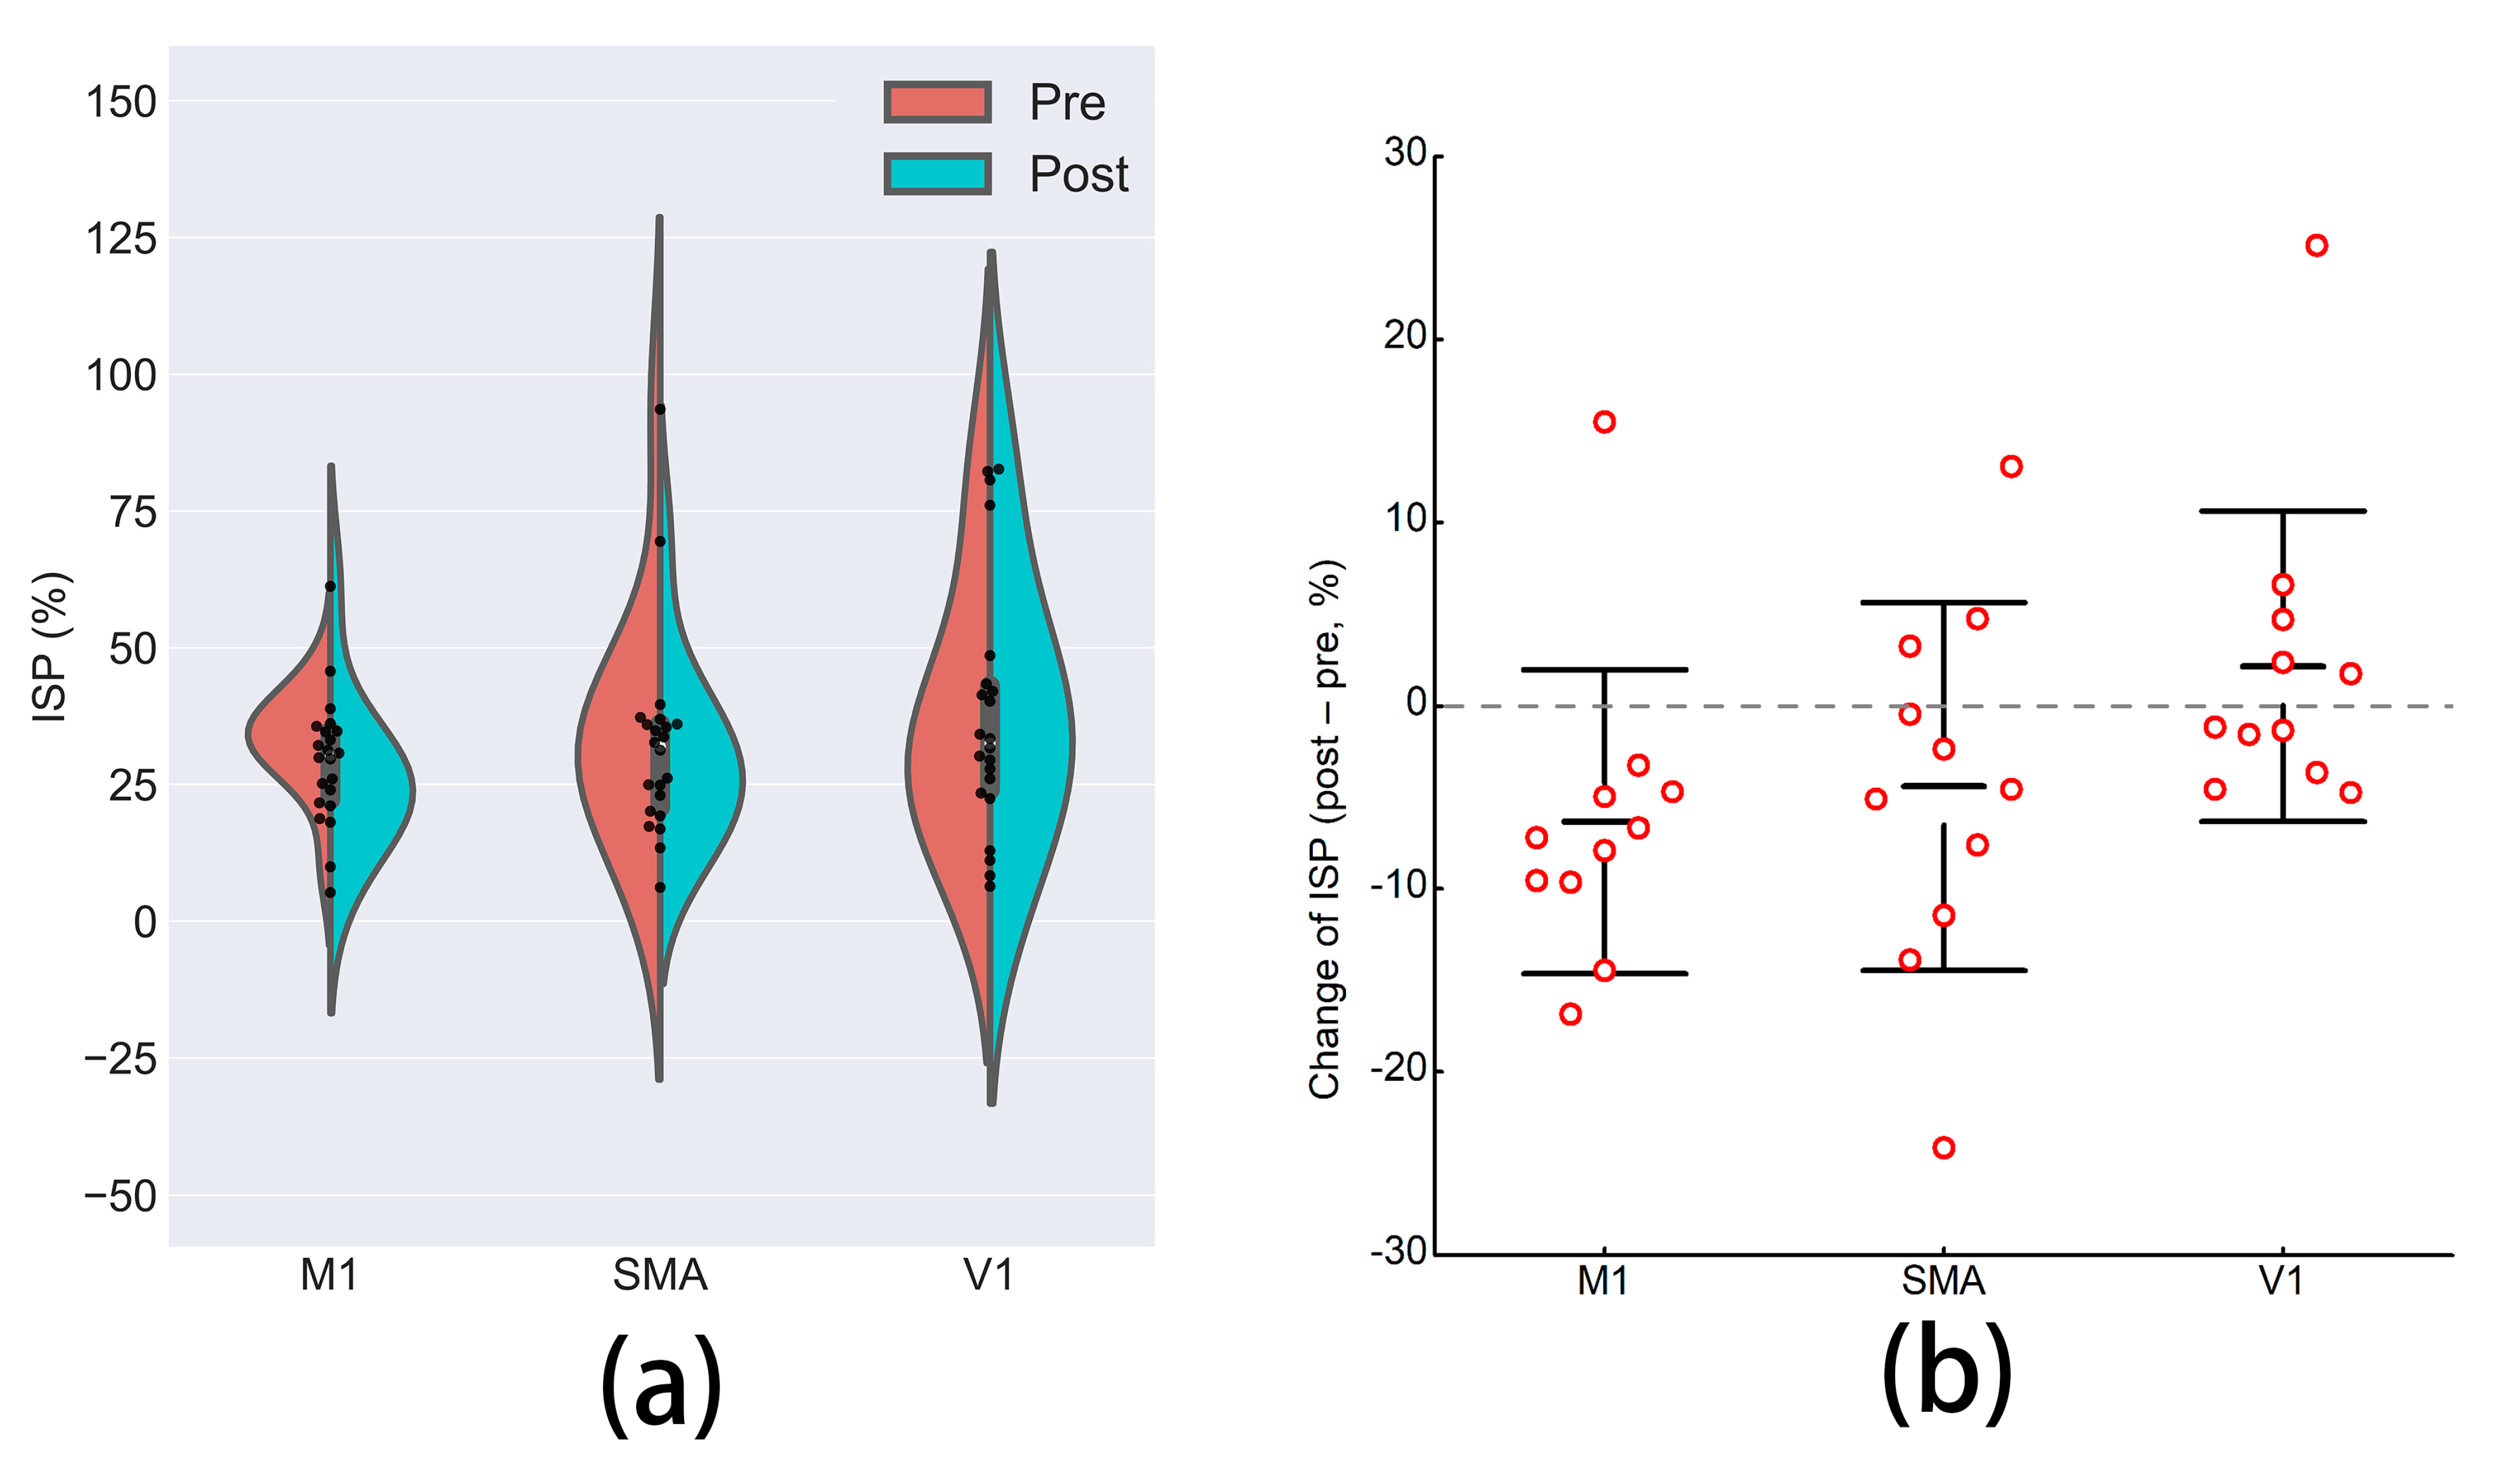
3.4. Interhemispheric Signal Propagation
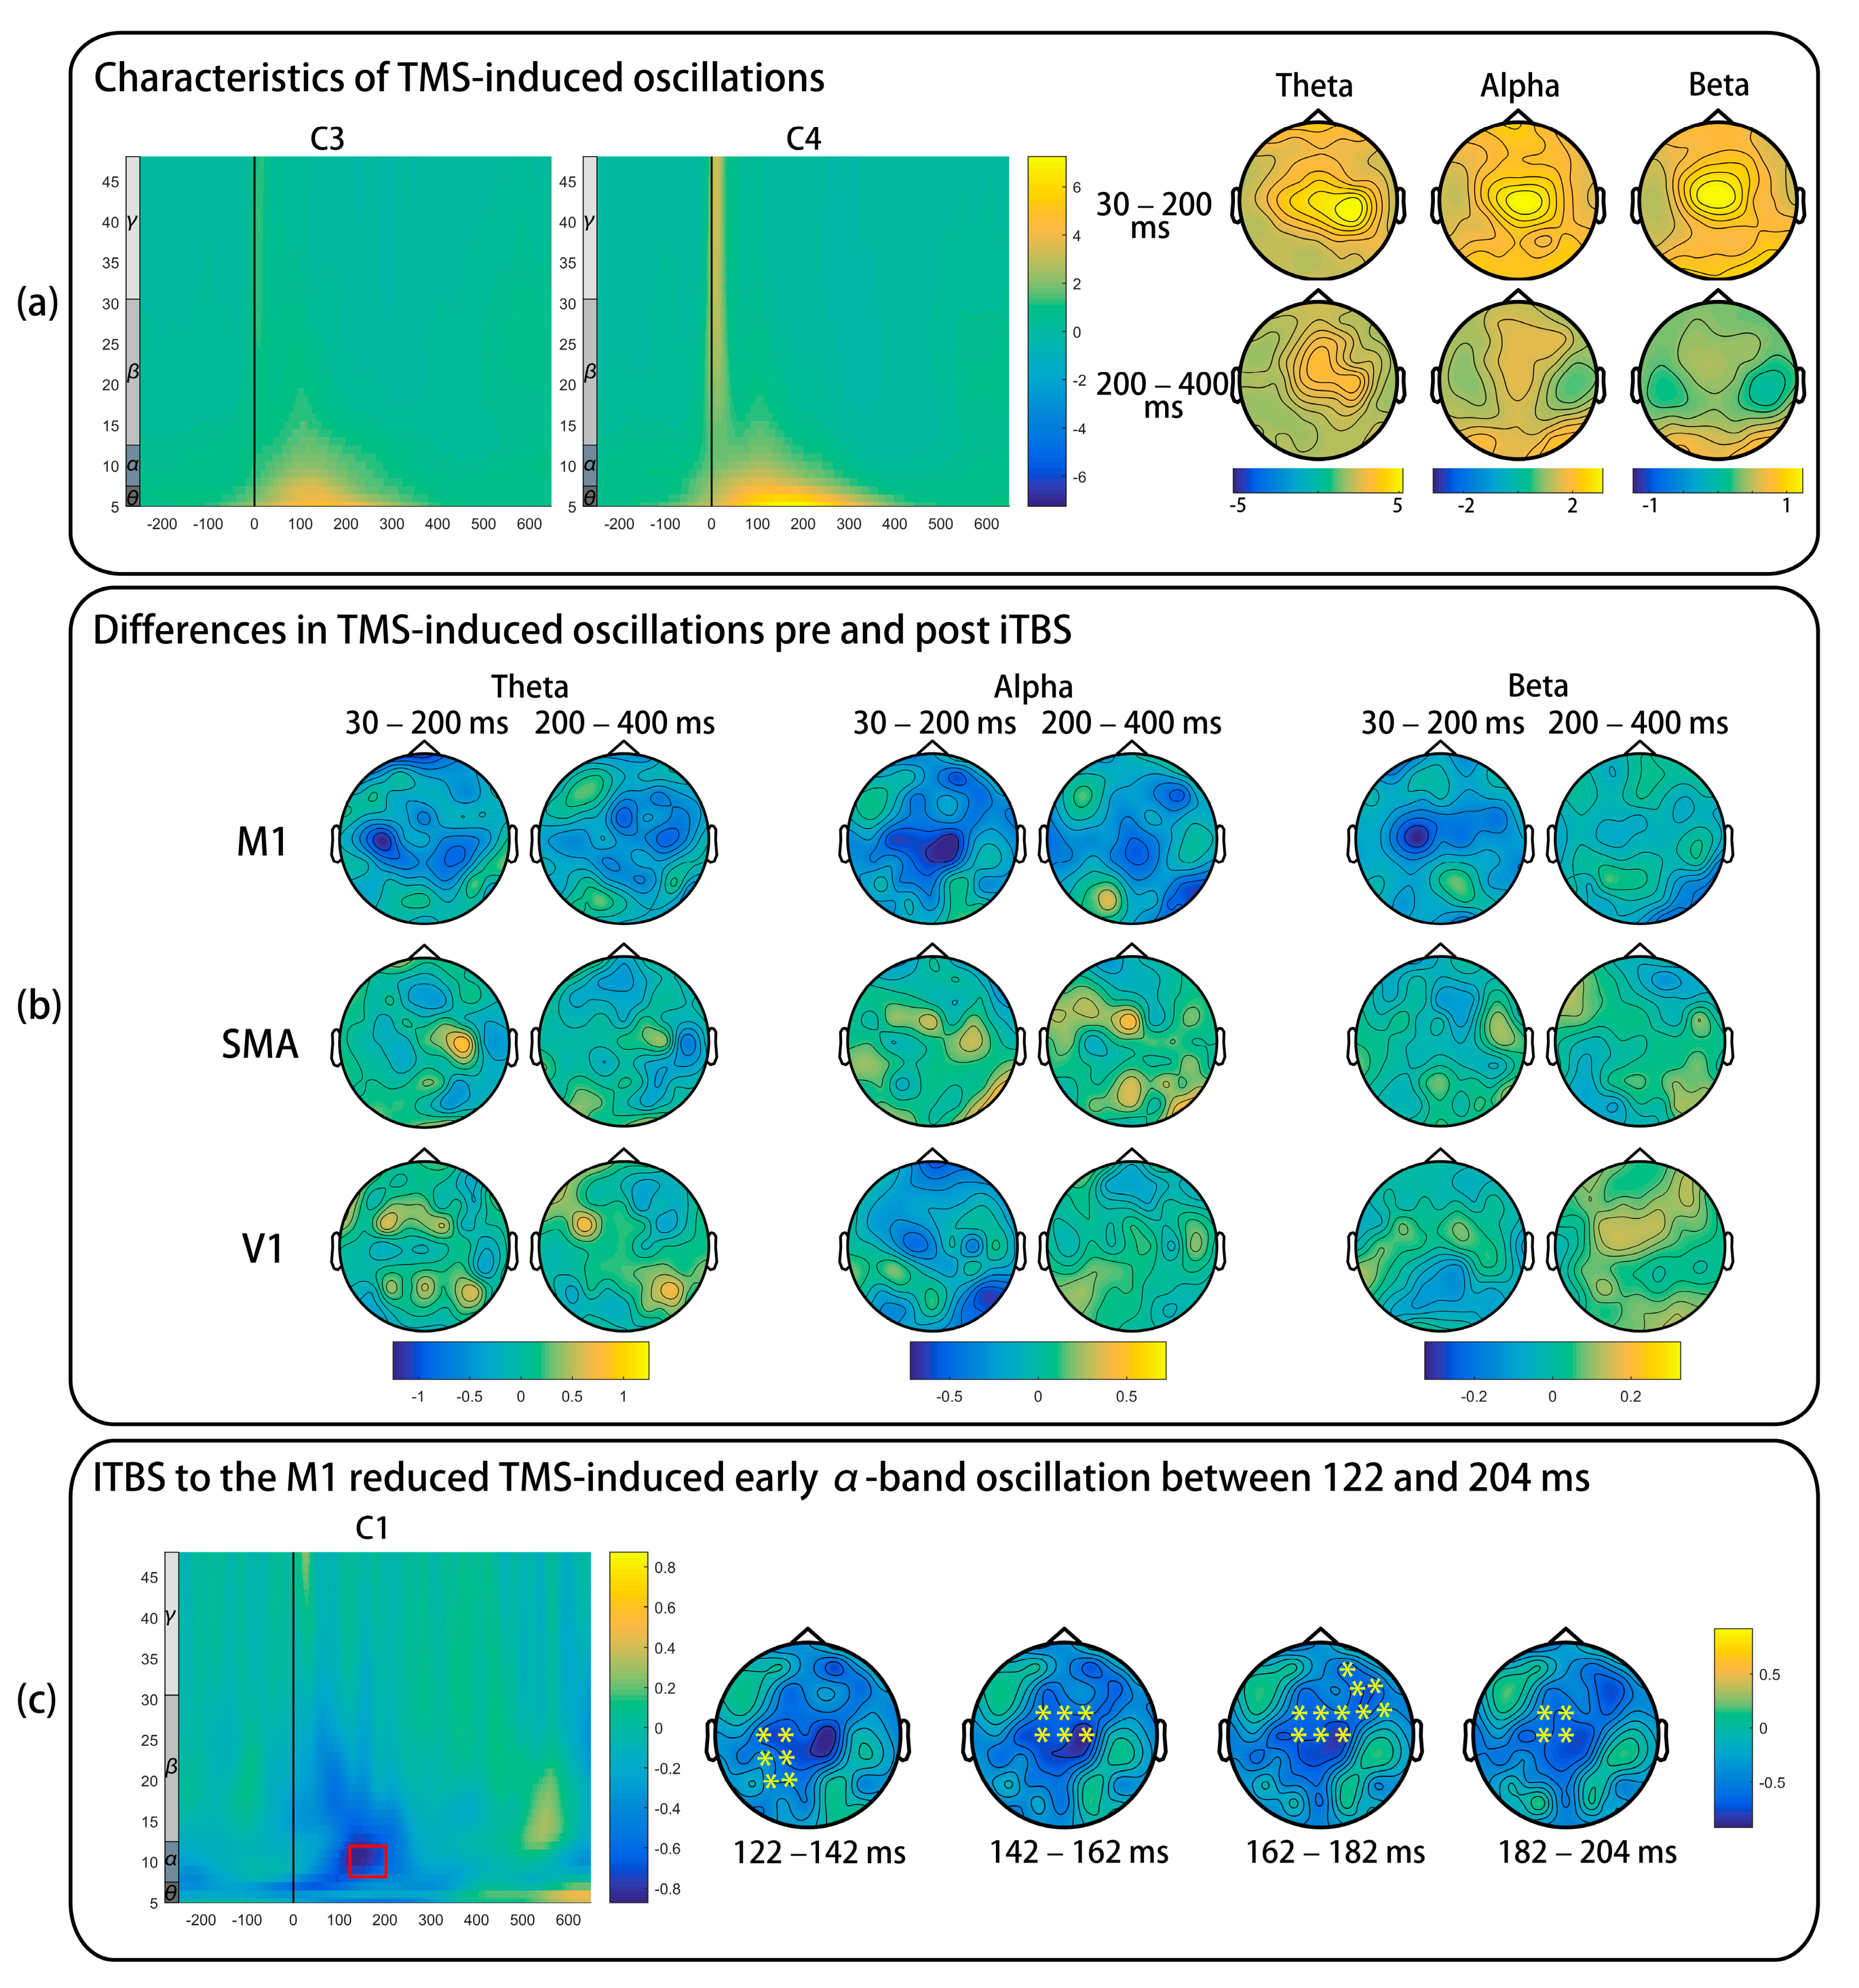
3.5. TMS-Induced Oscillations
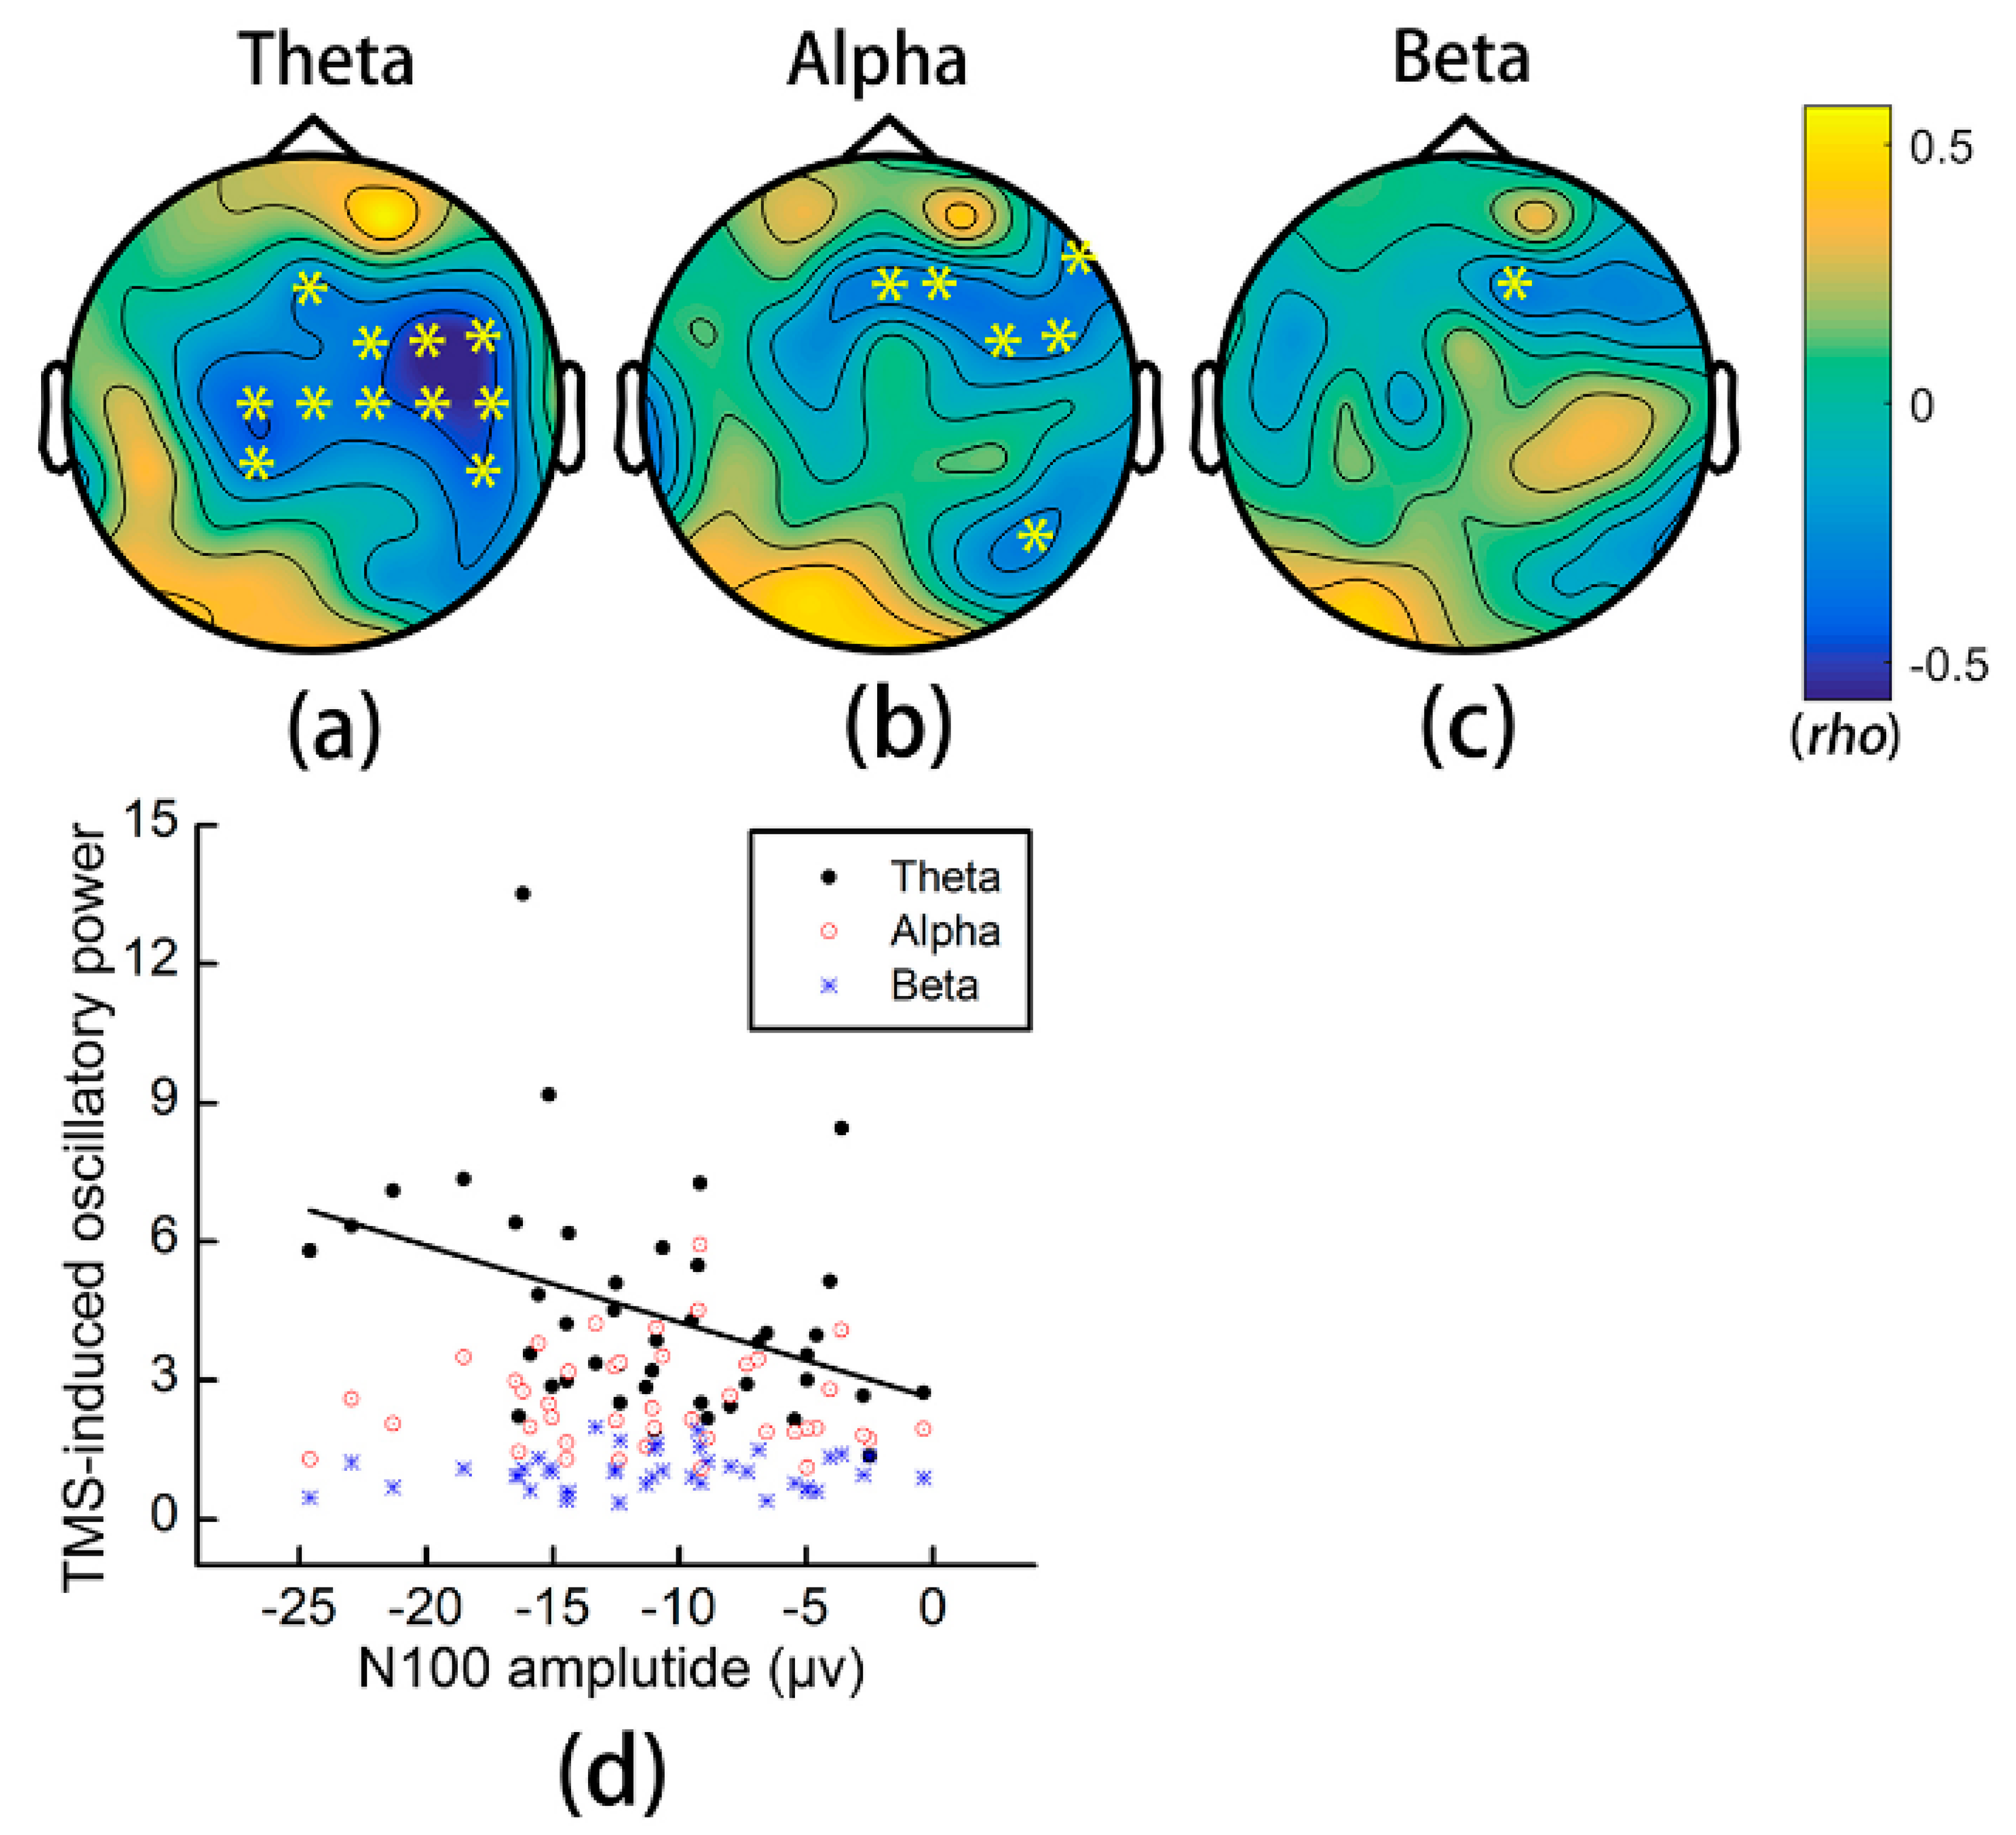
3.6. Relationship between TMS-Induced Oscillations and the N100 Amplitude
4. Discussion
4.1. Effects of iTBS on TMS-Evoked Potentials
4.2. Effects of iTBS on TMS-Induced Oscillations
5. Conclusions
Author Contributions
Funding
Institutional Review Board Statement
Informed Consent Statement
Data Availability Statement
Conflicts of Interest
References
- Terao, Y.; Ugawa, Y. Basic mechanisms of TMS. J. Clin. Neurophysiol. 2002, 19, 322–343. [Google Scholar] [CrossRef]
- Huang, Y.-Z.; Edwards, M.J.; Rounis, E.; Bhatia, K.P.; Rothwell, J.C. Theta burst stimulation of the human motor cortex. Neuron 2005, 45, 201–206. [Google Scholar] [CrossRef] [Green Version]
- Huang, Y.-Z.; Rothwell, J.C.; Chen, R.-S.; Lu, C.-S.; Chuang, W.-L. The theoretical model of theta burst form of repetitive transcranial magnetic stimulation. Clin. Neurophysiol. 2011, 122, 1011–1018. [Google Scholar] [CrossRef] [Green Version]
- Li, C.-T.; Huang, Y.-Z.; Bai, Y.-M.; Tsai, S.-J.; Su, T.-P.; Cheng, C.-M. Critical role of glutamatergic and GABAergic neurotransmission in the central mechanisms of theta-burst stimulation. Hum. Brain Mapp. 2019, 40, 2001–2009. [Google Scholar] [CrossRef] [Green Version]
- Carson, R.G.; Ruddy, K.L.; McNickle, E. What do TMS-evoked motor potentials tell us about motor learning? Adv. Exp. Med. Biol. 2016, 957, 143–157. [Google Scholar]
- Matsunaga, K.; Maruyama, A.; Fujiwara, T.; Nakanishi, R.; Tsuji, S.; Rothwell, J.C. Increased corticospinal excitability after 5 Hz rTMS over the human supplementary motor area. J. Physiol. 2005, 562, 295–306. [Google Scholar] [CrossRef] [Green Version]
- Lu, M.-K.; Arai, N.; Tsai, C.-H.; Ziemann, U. Movement related cortical potentials of cued versus self-initiated movements: Double dissociated modulation by dorsal premotor cortex versus supplementary motor area rTMS. Hum. Brain Mapp. 2012, 33, 824–839. [Google Scholar] [CrossRef] [PubMed]
- Cassidy, J.M.; Chu, H.; Chen, M.; Kimberley, T.J.; Carey, J.R. Interhemispheric inhibition measurement reliability in stroke: A pilot study. Neuromodulation 2016, 19, 838–847. [Google Scholar] [CrossRef] [PubMed] [Green Version]
- Tremblay, S.; Rogasch, N.C.; Premoli, I.; Blumberger, D.M.; Casarotto, S.; Chen, R.; Di Lazzaro, V.; Farzan, F.; Ferrarelli, F.; Fitzgerald, P.B.; et al. Clinical utility and prospective of TMS-EEG. Clin. Neurophysiol. 2019, 130, 802–844. [Google Scholar] [CrossRef]
- Rossini, P.M.; Burke, D.; Chen, R.; Cohen, L.G.; Daskalakis, Z.; Di Iorio, R.; Di Lazzaro, V.; Ferreri, F.; Fitzgerald, P.B.; George, M.S.; et al. Non-invasive electrical and magnetic stimulation of the brain, spinal cord, roots and peripheral nerves: Basic principles and procedures for routine clinical and research application. An updated report from an I.F.C.N. Committee. Clin. Neurophysiol. 2015, 126, 1071–1107. [Google Scholar] [CrossRef] [PubMed]
- Rogasch, N.C.; Thomson, R.H.; Farzan, F.; Fitzgibbon, B.M.; Bailey, N.W.; Hernandez-Pavon, J.C.; Daskalakis, Z.J.; Fitzgerald, P.B. Removing artefacts from TMS-EEG recordings using independent component analysis: Importance for assessing prefrontal and motor cortex network properties. NeuroImage 2014, 101, 425–439. [Google Scholar] [CrossRef] [PubMed]
- Darmani, G.; Ziemann, U. Pharmacophysiology of TMS-evoked EEG potentials: A mini-review. Brain Stimul. 2019, 12, 829–831. [Google Scholar] [CrossRef] [PubMed]
- Premoli, I.; Castellanos, N.; Rivolta, D.; Belardinelli, P.; Bajo, R.; Zipser, C.; Espenhahn, S.; Heidegger, T.; Müller-Dahlhaus, F.; Ziemann, U. TMS-EEG signatures of GABAergic neurotransmission in the human cortex. J. Neurosci. 2014, 34, 5603–5612. [Google Scholar] [CrossRef] [PubMed] [Green Version]
- Darmani, G.; Zipser, C.M.; Böhmer, G.M.; Deschet, K.; Muller-Dahlhaus, F.; Belardinelli, P.; Schwab, M.; Ziemann, U. Effects of the selective alpha5-GABAAR antagonist S44819 on excitability in the human brain: A TMS-EMG and TMS-EEG phase I study. J. Neurosci. 2016, 36, 12312–12320. [Google Scholar] [CrossRef] [Green Version]
- Hui, J.; Zomorrodi, R.; Lioumis, P.; Salavati, B.; Rajji, T.K.; Chen, R.; Blumberger, D.M.; Daskalakis, Z.J. Pharmacological mechanisms of interhemispheric signal propagation: A TMS-EEG study. Neuropsychopharmacology 2019, 45, 932–939. [Google Scholar] [CrossRef]
- Esser, S.K.; Huber, R.; Massimini, M.; Peterson, M.J.; Ferrarelli, F.; Tononi, G. A direct demonstration of cortical LTP in humans: A combined TMS/EEG study. Brain Res. Bull. 2006, 69, 86–94. [Google Scholar] [CrossRef]
- Casula, E.P.; Tarantino, V.; Basso, D.; Arcara, G.; Marino, G.; Toffolo, G.M.; Rothwell, J.C.; Bisiacchi, P.S. Low-frequency rTMS inhibitory effects in the primary motor cortex: Insights from TMS-evoked potentials. NeuroImage 2014, 98, 225–232. [Google Scholar] [CrossRef] [PubMed]
- Chung, S.W.; Rogasch, N.C.; Hoy, K.E.; Sullivan, C.M.; Cash, R.F.H.; Fitzgerald, P.B. Impact of different intensities of intermittent theta burst stimulation on the cortical properties during TMS-EEG and working memory performance. Hum. Brain Mapp. 2018, 39, 783–802. [Google Scholar] [CrossRef] [Green Version]
- Harrington, A.; Hammond-Tooke, G.D. Theta burst stimulation of the cerebellum modifies the TMS-evoked N100 potential, a marker of GABA inhibition. PLoS ONE 2015, 10, e0141284. [Google Scholar]
- Gedankien, T.; Fried, P.J.; Pascual-Leone, A.; Shafi, M.M. Intermittent theta-burst stimulation induces correlated changes in cortical and corticospinal excitability in healthy older subjects. Clin. Neurophysiol. 2017, 128, 2419–2427. [Google Scholar] [CrossRef]
- Chung, S.W.; Hill, A.T.; Rogasch, N.C.; Hoy, K.E.; Fitzgerald, P.B. Use of theta-burst stimulation in changing excitability of motor cortex: A systematic review and meta-analysis. Neurosci. Biobehav. Rev. 2016, 63, 43–64. [Google Scholar] [CrossRef]
- Veale, J.F. Edinburgh handedness inventory-short form: A revised version based on confirmatory factor analysis. Laterality 2014, 19, 164–177. [Google Scholar] [CrossRef]
- Rossi, S.; Hallett, M.; Rossini, P.M.; Pascual-Leone, A. Screening questionnaire before TMS: An update. Clin. Neurophysiol. 2011, 122, 1686. [Google Scholar] [CrossRef]
- Cárdenas-Morales, L.; Volz, L.J.; Michely, J.; Rehme, A.K.; Pool, E.-M.; Nettekoven, C.; Eickhoff, S.B.; Fink, G.R.; Grefkes, C. Network connectivity and individual responses to brain stimulation in the human Motor system. Cereb. Cortex 2013, 24, 1697–1707. [Google Scholar] [CrossRef] [PubMed]
- Boggio, P.S.; Castro, L.O.; Savagim, E.A.; Braite, R.; Cruz, V.C.; Rocha, R.R.; Rigonatti, S.P.; Silva, M.T.A.; Fregni, F. Enhancement of non-dominant hand motor function by anodal transcranial direct current stimulation. Neurosci. Lett. 2006, 404, 232–236. [Google Scholar] [CrossRef] [PubMed]
- Solopchuk, O.; Alamia, A.; Dricot, L.; Duque, J.; Zénon, A. cTBS disruption of the supplementary motor area perturbs cortical sequence representation but not behavioural performance. NeuroImage 2017, 163, 34–40. [Google Scholar] [CrossRef] [PubMed]
- Kim, Y.K.; Shin, S.H. Comparison of effects of transcranial magnetic stimulation on primary motor cortex and supplementary motor area in motor skill learning (randomized, cross over study). Front. Hum. Neurosci. 2014, 8, 937. [Google Scholar] [CrossRef] [Green Version]
- Conforto, A.B.; Z’Graggen, W.J.; Kohl, A.S.; Rösler, K.M.; Kaelin-Lang, A. Impact of coil position and electrophysiological monitoring on determination of motor thresholds to transcranial magnetic stimulation. Clin. Neurophysiol. 2004, 115, 812–819. [Google Scholar] [CrossRef]
- Di Lazzaro, V.; Ziemann, U.; Lemon, R.N. State of the art: Physiology of transcranial motor cortex stimulation. Brain Stimul. 2008, 1, 345–362. [Google Scholar] [CrossRef]
- Cona, G.; Marino, G.; Semenza, C. TMS of supplementary motor area (SMA) facilitates mental rotation performance: Evidence for sequence processing in SMA. NeuroImage 2017, 146, 770–777. [Google Scholar] [CrossRef]
- Mayka, M.A.; Corcos, D.M.; Leurgans, S.E.; Vaillancourt, D.E. Three-dimensional locations and boundaries of motor and premotor cortices as defined by functional brain imaging: A meta-analysis. NeuroImage 2006, 31, 1453–1474. [Google Scholar] [CrossRef] [Green Version]
- Rocchi, L.; Di Santo, A.; Brown, K.; Ibáñez, J.; Casula, E.; Rawji, V.; Di Lazzaro, V.; Koch, G.; Rothwell, J. Disentangling EEG responses to TMS due to cortical and peripheral activations. Brain Stimul. 2021, 14, 4–18. [Google Scholar] [CrossRef] [PubMed]
- Delorme, A.; Makeig, S. EEGLAB: An open source toolbox for analysis of single-trial EEG dynamics including independent component analysis. J. Neurosci. Methods 2004, 134, 9–21. [Google Scholar] [CrossRef] [Green Version]
- Rogasch, N.C.; Sullivan, C.; Thomson, R.H.; Rose, N.S.; Bailey, N.W.; Fitzgerald, P.B.; Farzan, F.; Hernandez-Pavo, J.C. Analysing concurrent transcranial magnetic stimulation and electroencephalographic data: A review and introduction to the open-source TESA software. NeuroImage 2017, 147, 934–951. [Google Scholar] [CrossRef]
- Oostenveld, R.; Fries, P.; Maris, E.; Schoffelen, J.-M. FieldTrip: Open source software for advanced analysis of MEG, EEG, and invasive electrophysiological data. Comput. Intell. Neurosci. 2011, 2011, 156869. [Google Scholar] [CrossRef] [PubMed]
- Lehmann, D.; Skrandies, W. Reference-free identification of components of checkerboard-evoked multichannel potential fields. Electroencephalogr. Clin. Neurophysiol. 1980, 48, 609–621. [Google Scholar] [CrossRef]
- Casula, E.P.; Maiella, M.; Pellicciari, M.C.; Porrazzini, F.; D’Acunto, A.; Rocchi, L.; Koch, G. Novel TMS-EEG indexes to investigate interhemispheric dynamics in humans. Clin. Neurophysiol. 2020, 131, 70–77. [Google Scholar] [CrossRef]
- Meyer, B.U.; Röricht, S.; von Einsiedel, H.G.; Kruggel, F.; Weindl, A. Inhibitory and excitatory interhemispheric transfers between motor cortical areas in normal humans and patients with abnormalities of the corpus callosum. Brain 1995, 118, 429–440. [Google Scholar] [CrossRef]
- Premoli, I.; Bergmann, T.O.; Fecchio, M.; Rosanova, M.; Biondi, A.; Belardinelli, P.; Ziemann, U. The impact of GABAergic drugs on TMS-induced brain oscillations in human motor cortex. NeuroImage 2017, 163, 1–12. [Google Scholar] [CrossRef] [PubMed] [Green Version]
- Pfurtscheller, G. Event-related synchronization (ERS): An electrophysiological correlate of cortical areas at rest. Electroencephalogr. Clin. Neurophysiol. 1992, 83, 62–69. [Google Scholar] [CrossRef]
- Maris, E.; Oostenveld, R. Nonparametric statistical testing of EEG- and MEG-data. J. Neurosci. Methods 2007, 164, 177–190. [Google Scholar] [CrossRef]
- Salo, K.S.-T.; Vaalto, S.M.I.; Mutanen, T.P.; Stenroos, M.; Ilmoniemi, R.J. Individual activation patterns after the stimulation of different motor areas: A transcranial magnetic stimulation–electroencephalography study. Brain Connect. 2018, 8, 420–428. [Google Scholar] [CrossRef] [PubMed]
- Hill, A.T.; Rogasch, N.C.; Fitzgerald, P.B.; Hoy, K.E. TMS-EEG: A window into the neurophysiological effects of transcranial electrical stimulation in non-motor brain regions. Neurosci. Biobehav. Rev. 2016, 64, 175–184. [Google Scholar] [CrossRef] [PubMed]
- Chung, S.W.; Lewis, B.P.; Rogasch, N.C.; Saeki, T.; Thomson, R.H.; Hoy, K.E.; Bailey, N.W.; Fitzgerald, P.B. Demonstration of short-term plasticity in the dorsolateral prefrontal cortex with theta burst stimulation: A TMS-EEG study. Clin. Neurophysiol. 2017, 128, 1117–1126. [Google Scholar] [CrossRef] [PubMed]
- Casula, E.P.; Pellicciari, M.C.; Ponzo, V.; Bassi, M.S.; Veniero, D.; Caltagirone, C.; Koch, G. Cerebellar theta burst stimulation modulates the neural activity of interconnected parietal and motor areas. Sci. Rep. 2016, 6, 36191. [Google Scholar] [CrossRef] [PubMed] [Green Version]
- Rogasch, N.C.; Zipser, C.; Darmani, G.; Mutanen, T.P.; Biabani, M.; Zrenner, C.; Desideri, D.; Belardinelli, P.; Müller-Dahlhaus, F.; Ziemann, U. The effects of NMDA receptor blockade on TMS-evoked EEG potentials from prefrontal and parietal cortex. Sci. Rep. 2020, 10, 3168. [Google Scholar] [CrossRef] [Green Version]
- Darmani, G.; Bergmann, T.O.; Zipser, C.; Baur, D.; Müller-Dahlhaus, F.; Ziemann, U. Effects of antiepileptic drugs on cortical excitability in humans: A TMS-EMG and TMS-EEG study. Hum. Brain Mapp. 2019, 40, 1276–1289. [Google Scholar] [CrossRef] [Green Version]
- Di Lazzaro, V.; Pilato, F.; Dileone, M.; Profice, P.; Oliviero, A.; Mazzone, P.; Insola, A.; Ranieri, F.; Meglio, M.; Tonali, P.A.; et al. The physiological basis of the effects of intermittent theta burst stimulation of the human motor cortex. J. Physiol. 2008, 586, 3871–3879. [Google Scholar]
- Iwabuchi, S.J.; Raschke, F.; Auer, D.P.; Liddle, P.F.; Lankappa, S.T.; Palaniyappan, L. Targeted transcranial theta-burst stimulation alters fronto-insular network and prefrontal GABA. NeuroImage 2017, 146, 395–403. [Google Scholar] [CrossRef]
- Stagg, C.J.; Wylezinska, M.; Matthews, P.M.; Johansen-Berg, H.; Jezzard, P.; Rothwell, J.C.; Bestmann, S. Neurochemical effects of theta burst stimulation as assessed by magnetic resonance spectroscopy. J. Neurophysiol. 2009, 101, 2872–2877. [Google Scholar] [CrossRef] [PubMed] [Green Version]
- Vernet, M.; Bashir, S.; Yoo, W.-K.; Perez, J.M.; Najib, U.; Pascual-Leone, A. Insights on the neural basis of motor plasticity induced by theta burst stimulation from TMS–EEG. Eur. J. Neurosci. 2013, 37, 598–606. [Google Scholar] [CrossRef] [Green Version]
- Daskalakis, Z.J.; Farzan, F.; Barr, M.S.; Maller, J.J.; Chen, R.; Fitzgerald, P.B. Long-interval cortical inhibition from the dorsolateral prefrontal cortex: A TMS-EEG study. Neuropsychopharmacology 2008, 33, 2860–2869. [Google Scholar] [CrossRef] [Green Version]
- Farzan, F.; Barr, M.S.; Hoppenbrouwers, S.S.; Fitzgerald, P.B.; Chen, R.; Pascual-Leone, A.; Daskalakis, Z.J. The EEG correlates of the TMS-induced EMG silent period in humans. NeuroImage 2013, 83, 120–134. [Google Scholar] [CrossRef] [Green Version]
- Suppa, A.; Ortu, E.; Zafar, N.; Deriu, F.; Paulus, W.; Berardelli, A.; Rothwell, J.C. Theta burst stimulation induces after-effects on contralateral primary motor cortex excitability in humans. J. Physiol. 2008, 586, 4489–4500. [Google Scholar] [CrossRef] [PubMed]
- Di Lazzaro, V.; Dileone, M.; Pilato, F.; Capone, F.; Musumeci, G.; Ranieri, F.; Ricci, V.; Bria, P.; Di Iorio, R.; de Waure, C.; et al. Modulation of motor cortex neuronal networks by rTMS: Comparison of local and remote effects of six different protocols of stimulation. J. Neurophysiol. 2011, 105, 2150–2156. [Google Scholar] [CrossRef]
- Hammond, G.R.; Garvey, C.-A. Asymmetries of long-latency intracortical inhibition in motor cortex and handedness. Exp. Brain Res. 2006, 172, 449–453. [Google Scholar] [CrossRef]
- Vallence, A.-M.; Schneider, L.A.; Pitcher, J.B.; Ridding, M.C. Long-interval facilitation and inhibition are differentially affected by conditioning stimulus intensity over different time courses. Neurosci. Lett. 2014, 570, 114–118. [Google Scholar] [CrossRef] [PubMed] [Green Version]
- Palmer, L.M.; Schulz, J.M.; Murphy, S.C.; Ledergerber, D.; Murayama, M.; Larkum, M.E. The cellular basis of GABA(B)-mediated interhemispheric inhibition. Science 2012, 335, 989–993. [Google Scholar] [CrossRef] [PubMed]
- Lin, T.; Jiang, L.; Dou, Z.; Wu, C.; Liu, F.; Xu, G.; Lan, Y. Effects of theta burst stimulation on suprahyoid motor cortex excitability in healthy subjects. Brain Stimul. 2017, 10, 91–98. [Google Scholar] [CrossRef] [Green Version]
- Oliveri, M.; Babiloni, C.; Filippi, M.M.; Caltagirone, C.; Babiloni, F.; Cicinelli, P.; Traversa, R.; Palmieri, M.G.; Rossini, P.M. Influence of the supplementary motor area on primary motor cortex excitability during movements triggered by neutral or emotionally unpleasant visual cues. Exp. Brain Res. 2003, 149, 214–221. [Google Scholar] [CrossRef]
- Arai, N.; Lu, M.-K.; Ugawa, Y.; Ziemann, U. Effective connectivity between human supplementary motor area and primary motor cortex: A paired-coil TMS study. Exp. Brain Res. 2012, 220, 79–87. [Google Scholar] [CrossRef] [PubMed]
- Pellicciari, M.C.; Veniero, D.; Miniussi, C. Characterizing the cortical oscillatory response to TMS pulse. Front. Cell Neurosci. 2017, 11, 38. [Google Scholar] [CrossRef] [PubMed]


Publisher’s Note: MDPI stays neutral with regard to jurisdictional claims in published maps and institutional affiliations. |
© 2021 by the authors. Licensee MDPI, Basel, Switzerland. This article is an open access article distributed under the terms and conditions of the Creative Commons Attribution (CC BY) license (https://creativecommons.org/licenses/by/4.0/).
Share and Cite
Bai, Z.; Zhang, J.; Fong, K.N.K. Intermittent Theta Burst Stimulation to the Primary Motor Cortex Reduces Cortical Inhibition: A TMS-EEG Study. Brain Sci. 2021, 11, 1114. https://doi.org/10.3390/brainsci11091114
Bai Z, Zhang J, Fong KNK. Intermittent Theta Burst Stimulation to the Primary Motor Cortex Reduces Cortical Inhibition: A TMS-EEG Study. Brain Sciences. 2021; 11(9):1114. https://doi.org/10.3390/brainsci11091114
Chicago/Turabian StyleBai, Zhongfei, Jiaqi Zhang, and Kenneth N. K. Fong. 2021. "Intermittent Theta Burst Stimulation to the Primary Motor Cortex Reduces Cortical Inhibition: A TMS-EEG Study" Brain Sciences 11, no. 9: 1114. https://doi.org/10.3390/brainsci11091114