
Prenatal Alcohol Exposure and the Facial Phenotype in Adolescents: A Study Based on Meconium Ethyl Glucuronide

 , , , , and
Abstract
:1. Introduction
2. Materials and Methods
2.1. Study Design
2.2. Sample Characteristics
2.3. Instruments and Measures
2.4. Confounders
2.5. Statistical Analysis
3. Results
4. Discussion
5. Conclusions
Author Contributions
Funding
Institutional Review Board Statement
Informed Consent Statement
Data Availability Statement
Acknowledgments
Conflicts of Interest
References
- Muggli, E.; O’Leary, C.; Forster, D.; Anderson, P.; Lewis, S.; Nagle, C.; Craig, J.M.; Donath, S.; Elliott, E.; Halliday, J. Study protocol: Asking QUestions about Alcohol in pregnancy (AQUA): A longitudinal cohort study of fetal effects of low to moderate alcohol exposure. BMC Pregnancy Childbirth 2014, 14, 302. [Google Scholar] [CrossRef] [PubMed] [Green Version]
- Muggli, E.; Matthews, H.; Penington, A.; Claes, P.; O’Leary, C.; Forster, D.; Donath, S.; Anderson, P.J.; Lewis, S.; Nagle, C.; et al. Association Between Prenatal Alcohol Exposure and Craniofacial Shape of Children at 12 Months of Age. JAMA Pediatr. 2017. [Google Scholar] [CrossRef] [PubMed] [Green Version]
- Hoyme, H.E.; Kalberg, W.O.; Elliott, A.J.; Blankenship, J.; Buckley, D.; Marais, A.S.; Manning, M.A.; Robinson, L.K.; Adam, M.P.; Abdul-Rahman, O.; et al. Updated Clinical Guidelines for Diagnosing Fetal Alcohol Spectrum Disorders. Pediatrics 2016, 138. [Google Scholar] [CrossRef] [PubMed] [Green Version]
- Popova, S.; Lange, S.; Probst, C.; Gmel, G.; Rehm, J. Estimation of national, regional, and global prevalence of alcohol use during pregnancy and fetal alcohol syndrome: A systematic review and meta-analysis. Lancet Glob. Health 2017, 5, e290–e299. [Google Scholar] [CrossRef] [Green Version]
- Lanting, C.I.; van Dommelen, P.; van der Pal-de Bruin, K.M.; Bennebroek Gravenhorst, J.; van Wouwe, J.P. Prevalence and pattern of alcohol consumption during pregnancy in the Netherlands. BMC Public Health 2015, 15, 723. [Google Scholar] [CrossRef] [Green Version]
- Melchior, M.; Hersi, R.; van der Waerden, J.; Larroque, B.; Saurel-Cubizolles, M.J.; Chollet, A.; Galera, C. Maternal tobacco smoking in pregnancy and children’s socio-emotional development at age 5: The EDEN mother-child birth cohort study. Eur. Psychiatry 2015. [Google Scholar] [CrossRef]
- Lange, S.; Probst, C.; Gmel, G.; Rehm, J.; Burd, L.; Popova, S. Global Prevalence of Fetal Alcohol Spectrum Disorder among Children and Youth: A Systematic Review and Meta-analysis. JAMA Pediatr. 2017, 171, 948–956. [Google Scholar] [CrossRef]
- De Gruyter, S. (Ed.) Teratogenität des Alkohols; Walter de Gruyter GmbH: Berlin, Germany, 2013; p. 112. [Google Scholar] [CrossRef]
- Petermann, F. Wechsler Intelligence Scale for Children, 5th ed.; Deutschsprachige Adaptation der WISC-V; von David, W., Frankfurt, A.M., Eds.; Pearson Assessment: Frankfurt, Germany, 2017. [Google Scholar]
- Feldmann, R. Psychopathologie bei Kindern und Jugendlichen mit Fetalem Alkohol-Syndrom; Urban & Vogel: München, Germany, 2006. [Google Scholar]
- Burden, M.J.; Jacobson, J.L.; Westerlund, A.; Lundahl, L.H.; Morrison, A.; Dodge, N.C.; Klorman, R.; Nelson, C.A.; Avison, M.J.; Jacobson, S.W. An event-related potential study of response inhibition in ADHD with and without prenatal alcohol exposure. Alcohol. Clin. Exp. Res. 2010, 34, 617–627. [Google Scholar] [CrossRef]
- Coles, C.D. Discriminating the effects of prenatal alcohol exposure from other behavioral and learning disorders. Alcohol Res. Health 2011, 34, 42–50. [Google Scholar]
- Dörrie, N.; Föcker, M.; Freunscht, I.; Hebebrand, J. Fetal alcohol spectrum disorders. Eur. Child Adolesc. Psychiatry 2014, 23, 863–875. [Google Scholar] [CrossRef] [Green Version]
- Landgraf, M.N.; Albers, L.; Rahmsdorf, B.; Vill, K.; Gerstl, L.; Lippert, M.; Heinen, F. Fetal alcohol spectrum disorders (FASD)—What we know and what we should know—The knowledge of German health professionals and parents. Eur. J. Paediatr. Neurol. 2018. [Google Scholar] [CrossRef]
- Römer, P.; Mathes, B.; Reinelt, T.; Stoyanova, P.; Petermann, F.; Zierul, C. Systematic review showed that low and moderate prenatal alcohol and nicotine exposure affected early child development. Acta Paediatr. 2020. [Google Scholar] [CrossRef] [PubMed]
- Eichler, A.; Hudler, L.; Grunitz, J.; Grimm, J.; Raabe, E.; Goecke, T.W.; Fasching, P.A.; Beckmann, M.W.; Kratz, O.; Moll, G.H.; et al. Effects of prenatal alcohol consumption on cognitive development and ADHD-related behaviour in primary-school age: A multilevel study based on meconium ethyl glucuronide. J. Child Psychol. Psychiatry Allied Discip. 2018, 59, 110–118. [Google Scholar] [CrossRef] [PubMed]
- Min, M.O.; Singer, L.T.; Minnes, S.; Wu, M.; Bearer, C.F. Association of fatty acid ethyl esters in meconium and cognitive development during childhood and adolescence. J. Pediatr. 2015, 166, 1042–1047. [Google Scholar] [CrossRef] [PubMed] [Green Version]
- Peterson, J.; Kirchner, H.L.; Xue, W.; Minnes, S.; Singer, L.T.; Bearer, C.F. Fatty acid ethyl esters in meconium are associated with poorer neurodevelopmental outcomes to two years of age. J. Pediatr. 2008, 152, 788–792. [Google Scholar] [CrossRef] [PubMed] [Green Version]
- Popova, S.; Lange, S.; Temple, V.; Poznyak, V.; Chudley, A.E.; Burd, L.; Murray, M.; Rehm, J. Profile of Mothers of Children with Fetal Alcohol Spectrum Disorder: A Population-Based Study in Canada. Int. J. Environ. Res. Public Health 2020, 17. [Google Scholar] [CrossRef] [PubMed]
- Eichler, A.; Grunitz, J.; Grimm, J.; Walz, L.; Raabe, E.; Goecke, T.W.; Beckmann, M.W.; Kratz, O.; Heinrich, H.; Moll, G.H.; et al. Did you drink alcohol during pregnancy? Inaccuracy and discontinuity of women’s self-reports: On the way to establish meconium ethyl glucuronide (EtG) as a biomarker for alcohol consumption during pregnancy. Alcohol 2016, 54, 39–44. [Google Scholar] [CrossRef]
- Lamy, S.; Hennart, B.; Houivet, E.; Dulaurent, S.; Delavenne, H.; Benichou, J.; Allorge, D.; Marret, S.; Thibaut, F. Assessment of tobacco, alcohol and cannabinoid metabolites in 645meconium samples of newborns compared to maternal self-reports. J. Psychiatr. Res. 2017, 90, 86–93. [Google Scholar] [CrossRef]
- Grimm, J.; Stemmler, M.; Golub, Y.; Schwenke, E.; Goecke, T.W.; Fasching, P.A.; Beckmann, M.W.; Kratz, O.; Moll, G.H.; Kornhuber, J.; et al. The association between prenatal alcohol consumption and preschool child stress system disturbance. Dev. Psychobiol. 2020. [Google Scholar] [CrossRef]
- Tan, D.W.; Foo, Y.Z.; Downs, J.; Finlay-Jones, A.; Leonard, H.; Licari, M.K.; Mullan, N.; Symons, M.; Varcin, K.J.; Whitehouse, A.J.O.; et al. A preliminary investigation of the effects of prenatal alcohol exposure on facial morphology in children with Autism Spectrum Disorder. Alcohol 2020, 86, 75–80. [Google Scholar] [CrossRef]
- Bandoli, G.; Jones, K.; Wertelecki, W.; Yevtushok, L.; Zymak-Zakutnya, N.; Granovska, I.; Plotka, L.; Chambers, C. Patterns of Prenatal Alcohol Exposure and Alcohol-Related Dysmorphic Features. Alcohol. Clin. Exp. Res. 2020. [Google Scholar] [CrossRef] [PubMed]
- Suttie, M.; Foroud, T.; Wetherill, L.; Jacobson, J.L.; Molteno, C.D.; Meintjes, E.M.; Hoyme, H.E.; Khaole, N.; Robinson, L.K.; Riley, E.P.; et al. Facial dysmorphism across the fetal alcohol spectrum. Pediatrics 2013, 131, e779–e788. [Google Scholar] [CrossRef] [PubMed] [Green Version]
- Howe, L.J.; Sharp, G.C.; Hemani, G.; Zuccolo, L.; Richmond, S.; Lewis, S.J. Prenatal alcohol exposure and facial morphology in a UK cohort. Drug Alcohol Depend. 2019, 197, 42–47. [Google Scholar] [CrossRef] [PubMed] [Green Version]
- Lipinski, R.J.; Hammond, P.; O’Leary-Moore, S.K.; Ament, J.J.; Pecevich, S.J.; Jiang, Y.; Budin, F.; Parnell, S.E.; Suttie, M.; Godin, E.A.; et al. Ethanol-induced face-brain dysmorphology patterns are correlative and exposure-stage dependent. PLoS ONE 2012, 7, e43067. [Google Scholar] [CrossRef] [PubMed] [Green Version]
- Theiler, K. The House Mouse Atlas of Embryonic Development; Springer: Berlin/Heidelberg, Germany, 1989. [Google Scholar]
- Astley, S.J.; Clarren, S.K. A fetal alcohol syndrome screening tool. Alcohol. Clin. Exp. Res. 1995, 19, 1565–1571. [Google Scholar] [CrossRef] [PubMed]
- Astley, S.J.; Clarren, S.K. Measuring the facial phenotype of individuals with prenatal alcohol exposure: Correlations with brain dysfunction. Alcohol Alcohol. 2001, 36, 147–159. [Google Scholar] [CrossRef] [PubMed] [Green Version]
- Astley, S.J.; Clarren, S.K. A case definition and photographic screening tool for the facial phenotype of fetal alcohol syndrome. J. Pediatr. 1996, 129, 33–41. [Google Scholar] [CrossRef]
- Astley, S.J.; Clarren, S.K. FAS Diagnostic & Prevention Network. Available online: https://depts.washington.edu/fasdpn/ (accessed on 1 July 2020).
- Goecke, T.W.; Burger, P.; Fasching, P.A.; Bakdash, A.; Engel, A.; Haberle, L.; Voigt, F.; Faschingbauer, F.; Raabe, E.; Maass, N.; et al. Meconium Indicators of Maternal Alcohol Abuse during Pregnancy and Association with Patient Characteristics. BioMed Res. Int. 2014, 2014, 702848. [Google Scholar] [CrossRef] [PubMed]
- Reulbach, U.; Bleich, S.; Knorr, J.; Burger, P.; Fasching, P.A.; Kornhuber, J.; Beckmann, M.W.; Goecke, T.W. Prä-, peri- und postpartale Depressivität. Erste Erkenntnisse ausFRAMES (Franconian Maternal Health Evaluation Study). Fortschr. Neurol. Psychiatr. 2009, 77, 708–713. [Google Scholar] [CrossRef]
- Fertig, M.; Kluve, J. The Effect of Age at School Entry on Educational Attainment in Germany. RWI Leibniz-Institut für Wirtschaftsforschung. IZA Discussion Paper No. 1507. 2005. Available online: https://papers.ssrn.com/sol3/papers.cfm?abstract_id=678905 (accessed on 1 February 2020).
- Comasco, E.; Rangmar, J.; Eriksson, U.J.; Oreland, L. Neurological and Neuropsychological Effects of Low and Moderate Prenatal Alcohol Exposure. Acta Physiol. 2017. [Google Scholar] [CrossRef]
- Bakdash, A.; Burger, P.; Goecke, T.W.; Fasching, P.A.; Reulbach, U.; Bleich, S.; Hastedt, M.; Rothe, M.; Beckmann, M.W.; Pragst, F.; et al. Quantification of fatty acid ethyl esters (FAEE) and ethyl glucuronide (EtG) in meconium from newborns for detection of alcohol abuse in a maternal health evaluation study. Anal. Bioanal. Chem. 2010, 396, 2469–2477. [Google Scholar] [CrossRef] [PubMed]
- Himes, S.K.; Dukes, K.A.; Tripp, T.; Petersen, J.; Raffo, C.; Burd, L.; Odendaal, H.; Elliott, A.J.; Hereld, D.; Signore, C.; et al. Clinical Sensitivity and Specificity of Meconium Fatty Acid Ethyl Ester, Ethyl Glucuronide, and Ethyl Sulfate for Detecting Maternal Drinking During Pregnancy. Clin. Chem. 2015. [Google Scholar] [CrossRef] [PubMed]
- Flak, A.L.; Su, S.; Bertrand, J.; Denny, C.H.; Kesmodel, U.S.; Cogswell, M.E. The association of mild, moderate, and binge prenatal alcohol exposure and child neuropsychological outcomes: A meta-analysis. Alcohol. Clin. Exp. Res. 2014, 38, 214–226. [Google Scholar] [CrossRef] [PubMed]
- Farkas, L.G.; Katic, M.J.; Forrest, C.R. Anthropometric proportion indices in the craniofacial regions of 73 patients with forms of isolated coronal synostosis. Ann. Plast. Surg. 2005, 55, 495–499. [Google Scholar] [CrossRef]
- Astley, S.J. Canadian palpebral fissure length growth charts reflect a good fit for two school and FASD clinic-based U. S. populations. J. Popul. Ther. Clin. Pharmacol. 2011, 18, e231–e241. [Google Scholar]
- Astley, S. FAS Facial Photographic Anaysis Software. Available online: https://depts.washington.edu/fasdpn/htmls/face-software.htm (accessed on 1 February 2020).
- Astley, S.J. Palpebral fissure length measurement: Accuracy of the FAS facial photographic analysis software and inaccuracy of the ruler. J. Popul. Ther. Clin. Pharmacol. 2015, 22, e9–e26. [Google Scholar]
- Hall, J.G.; Froster-Iskenius, U.G.; Allanson, J.E. Handbook of Normal Physical Measurements; Oxford University Press: New York, NY, USA, 1989. [Google Scholar]
- Astley, S.J.; Stachowiak, J.; Clarren, S.K.; Clausen, C. Application of the fetal alcohol syndrome facial photographic screening tool in a foster care population. J. Pediatr. 2002, 141, 712–717. [Google Scholar] [CrossRef] [Green Version]
- Todorow, M.; Moore, T.E.; Koren, G. Investigating the effects of low to moderate levels of prenatal alcohol exposure on child behaviour: A critical review. J. Popul. Ther. Clin. Pharmacol. 2010, 17, e323–e330. [Google Scholar]
- Lange, S.; Shield, K.; Koren, G.; Rehm, J.; Popova, S. A comparison of the prevalence of prenatal alcohol exposure obtained via maternal self-reports versus meconium testing: A systematic literature review and meta-analysis. BMC Pregnancy Childbirth 2014, 14, 127. [Google Scholar] [CrossRef] [Green Version]
- Smith, S.M.; Garic, A.; Flentke, G.R.; Berres, M.E. Neural crest development in fetal alcohol syndrome. Birth Defects Res. Part C Embryo Today Rev. 2014, 102, 210–220. [Google Scholar] [CrossRef] [Green Version]
- Hill, M. Carnegie Stage Comparison. Available online: https://jeltsch.org/carnegie_stage_comparison (accessed on 16 December 2020).
- Halliday, J.L.; Muggli, E.; Lewis, S.; Elliott, E.J.; Amor, D.J.; O’Leary, C.; Donath, S.; Forster, D.; Nagle, C.; Craig, J.M.; et al. Alcohol consumption in a general antenatal population and child neurodevelopment at 2 years. J. Epidemiol. Community Health 2017. [Google Scholar] [CrossRef] [PubMed]
- Petrelli, B.; Bendelac, L.; Hicks, G.G.; Fainsod, A. Insights into retinoic acid deficiency and the induction of craniofacial malformations and microcephaly in fetal alcohol spectrum disorder. Genesis 2019, 57, e23278. [Google Scholar] [CrossRef] [PubMed] [Green Version]
- Koren, G.; Ornoy, A. Searching for the Fetal Alcohol Behavioral Phenotype. Glob. Pediatr. Health 2020, 7. [Google Scholar] [CrossRef]
- Abernethy, C.; McCall, K.E.; Cooper, G.; Favretto, D.; Vaiano, F.; Bertol, E.; Mactier, H. Determining the pattern and prevalence of alcohol consumption in pregnancy by measuring biomarkers in meconium. Arch. Dis. Child. Fetal Neonatal Ed. 2017. [Google Scholar] [CrossRef]
- Joya, X.; Friguls, B.; Ortigosa, S.; Papaseit, E.; Martínez, S.E.; Manich, A.; Garcia-Algar, O.; Pacifici, R.; Vall, O.; Pichini, S. Determination of maternal-fetal biomarkers of prenatal exposure to ethanol: A review. J. Pharm. Biomed. Anal. 2012, 69, 209–222. [Google Scholar] [CrossRef]
- Chen, W.J.; Maier, S.E.; Parnell, S.E.; West, J.R. Alcohol and the developing brain: Neuroanatomical studies. Alcohol Res. Health 2003, 27, 174–180. [Google Scholar]
- May, P.A.; Blankenship, J.; Marais, A.S.; Gossage, J.P.; Kalberg, W.O.; Joubert, B.; Cloete, M.; Barnard, R.; De Vries, M.; Hasken, J.; et al. Maternal alcohol consumption producing fetal alcohol spectrum disorders (FASD): Quantity, frequency, and timing of drinking. Drug Alcohol Depend. 2013, 133, 502–512. [Google Scholar] [CrossRef] [Green Version]
- Bingol, N.; Schuster, C.; Fuchs, M.; Iosub, S.; Turner, G.; Stone, R.K.; Gromisch, D.S. The influence of socioeconomic factors on the occurrence of fetal alcohol syndrome. Adv. Alcohol Subst. Abus. 1987, 6, 105–118. [Google Scholar] [CrossRef]
- McCormack, C.; Monk, C. Considering Prenatal Alcohol Exposure in a Developmental Origins of Health and Disease Framework. Am. J. Psychiatry 2020, 177, 1025–1028. [Google Scholar] [CrossRef]
- Bearer, C.F.; Jacobson, J.L.; Jacobson, S.W.; Barr, D.; Croxford, J.; Molteno, C.D.; Viljoen, D.L.; Marais, A.S.; Chiodo, L.M.; Cwik, A.S. Validation of a new biomarker of fetal exposure to alcohol. J. Pediatr. 2003, 143, 463–469. [Google Scholar] [CrossRef] [Green Version]
- Derauf, C.; Katz, A.R.; Easa, D. Agreement between maternal self-reported ethanol intake and tobacco use during pregnancy and meconium assays for fatty acid ethyl esters and cotinine. Am. J. Epidemiol. 2003, 158, 705–709. [Google Scholar] [CrossRef] [Green Version]
- Muggli, E.; O’Leary, C.; Donath, S.; Orsini, F.; Forster, D.; Anderson, P.J.; Lewis, S.; Nagle, C.; Craig, J.M.; Elliott, E.; et al. “Did you ever drink more?” A detailed description of pregnant women’s drinking patterns. BMC Public Health 2016, 16, 683. [Google Scholar] [CrossRef] [Green Version]
- Dukes, K.; Tripp, T.; Willinger, M.; Odendaal, H.; Elliott, A.J.; Kinney, H.C.; Robinson, F.; Petersen, J.M.; Raffo, C.; Hereld, D.; et al. Drinking and smoking patterns during pregnancy: Development of group-based trajectories in the Safe Passage Study. Alcohol 2017, 62, 49–60. [Google Scholar] [CrossRef] [PubMed]
- Popova, S.; Dozet, D.; Burd, L. Fetal Alcohol Spectrum Disorder: Can We Change the Future? Alcohol. Clin. Exp. Res. 2020, 44, 815–819. [Google Scholar] [CrossRef] [PubMed]
- Caputo, C.; Wood, E.; Jabbour, L. Impact of fetal alcohol exposure on body systems: A systematic review. Birth Defects Res. Part C Embryo Today Rev. 2016, 108, 174–180. [Google Scholar] [CrossRef] [PubMed]
- Aragón, A.S.; Coriale, G.; Fiorentino, D.; Kalberg, W.O.; Buckley, D.; Gossage, J.P.; Ceccanti, M.; Mitchell, E.R.; May, P.A. Neuropsychological characteristics of Italian children with fetal alcohol spectrum disorders. Alcohol. Clin. Exp. Res. 2008, 32, 1909–1919. [Google Scholar] [CrossRef] [Green Version]
- Adnams, C.M.; Kodituwakku, P.W.; Hay, A.; Molteno, C.D.; Viljoen, D.; May, P.A. Patterns of cognitive-motor development in children with fetal alcohol syndrome from a community in South Africa. Alcohol. Clin. Exp. Res. 2001, 25, 557–562. [Google Scholar] [CrossRef]
- Foster, P.J.; Broadway, D.C.; Hayat, S.; Luben, R.; Dalzell, N.; Bingham, S.; Wareham, N.J.; Khaw, K.T. Refractive error, axial length and anterior chamber depth of the eye in British adults: The EPIC-Norfolk Eye Study. Br. J. Ophthalmol. 2010, 94, 827–830. [Google Scholar] [CrossRef]
- Song, H.T.; Kim, Y.J.; Lee, S.J.; Moon, Y.S. Relations between age, weight, refractive error and eye shape by computerized tomography in children. Korean J. Ophthalmol. 2007, 21, 163–168. [Google Scholar] [CrossRef] [Green Version]


| Total | EtG10− | EtG10+ | Statistics | EtG112− | EtG112+ | Statistics | Self− | Self+ | Statistics | |||||||
|---|---|---|---|---|---|---|---|---|---|---|---|---|---|---|---|---|
| n: | 129 | 97 | 32 | t(df) a,c | p | d | 109 | 20 | t(df) a,c | p | d | 97 | 32 | t(df) a,c | p | d |
| Prenatal: | ||||||||||||||||
| EtG (ng/g) | 82.7 (301.2) | -- | 333.4 (537.0) | -- | -- | -- | 5.28 (17.4) | 504.7 (622.7) | −19.0 (127) | 0.000 ** | 1.13 | 92.5 (342.6) | 52.9 (99.4) | −1.44 (127) | 0.153 | 0.16 |
| sex (m/f) a | 66/63 | 51/46 | 15/17 | 0.31 | 0.576 | 0.49 | 57/52 | 9/11 | 0.36 | 0.549 | 0.53 | 46/51 | 20/12 | 2.19 | 0.139 | 0.13 |
| birth weight (grams) | 3439 (450.9) | 3382 (411.8) | 3613 (522.2) | −2.28 (44.4) | 0.027 * | 0.49 | 3408 (441.7) | 3612 (473.0) | −1.88 (127) | 0.062 + | 0.45 | 3393 (451.8) | 3579 (424.9) | −2.05 (127) | 0.042 * | 0.42 |
| maternal age at delivery (years) | 32.7 (4.53) | 32.5 (4.73) | 33.1 (3.92) | −0.63 (127) | 0.533 | 0.14 | 32.7 (4.63) | 32.6 (4.06) | 0.15 (127) | 0.881 | 0.02 | 32.1 (4.61) | 34.5 (3.79) | −2.67 (127) | 0.009 ** | 0.57 |
| maternal smoking pregnancy d | 0.65 (2.31) | 0.60 (2.21) | 0.81 (2.63) | −0.45 (127) | 0.651 | 0.19 | 0.53 (2.09) | 1.30 (3.26) | −1.37 (127) | 0.173 | 0.28 | 0.60 (2.21) | 0.81 (2.63) | −0.45 (127) | 0.651 | 0.09 |
| Today: | ||||||||||||||||
| age (years) | 13.30 (0.32) | 13.2 (0.27) | 13.4 (0.39) | −2.47 (41.3) | 0.018 * | 0.60 | 13.20 (0.29) | 13.41 (0.42) | −1.91 (22.3) | 0.068 + | 0.58 | 13.31 (0.31) | 13.29 (0.34) | −0.77 (127) | 0.44 | 0.06 |
| weight (kg) | 50.9 (10.2) | 49.94 (9.61) | 53.64 (11.38) | −1.81 (127) | 0.073 + | 0.35 | 50.2 (9.95) | 54.7 (10.7) | −1.84 (127) | 0.068 + | 0.44 | 50.8 (10.3) | 51.1 (9.95) | −0.13 (127) | 0.896 | 0.03 |
| height (cm) | 161.4 (7.83) | 161.1 (7.70) | 162.24 (8.32) | −0.70 (127) | 0.487 | 0.14 | 161.0 (7.57) | 163.4 (9.12) | −1.22 (127) | 0.226 | 0.29 | 161.6 (7.63) | 160.7 (8.49) | 0.56 (127) | 0.575 | 0.11 |
| head (cm) | 55.0 (1.68) | 54.87 (1.77) | 55.23 (1.37) | −1.07 (127) | 0.285 | 0.23 | 54.9 (1.72) | 55.3 (1.47) | −0.87 (127) | 0.387 | 0.25 | 54.84 (1.64) | 55.32 (1.77) | −1.40 (127) | 0.162 | 0.28 |
| family status b | 11.5 (2.14) | 11.39 (2.26) | 11.8 (1.74) | −0.89 (127) | 0.374 | 0.20 | 11.47 (2.19) | 11.6 (1.90) | −0.25 (127) | 0.801 | 0.09 | 11.4 (2.17) | 11.9 (2.02) | −1.27 (127) | 0.204 | 0.24 |
| fluid reasoning | 108.2 (14.8) | 110.4 (11.7) | 101.7 (20.3) | 2.23 (37.0) | 0.032 * | 0.61 | 110.2 (11.3) | 97.0 (24.0) | 2.37 (19.5) | 0.028 * | 0.70 | 108.4 (15.3) | 107.5 (12.8) | 0.27 (120) | 0.786 | 0.06 |
| working memory | 110.7 (12.8) | 111.2 (12.3) | 109.1 (14.8) | 0.70 (112) | 0.484 | 0.15 | 111.3 (12.1) | 107.2 (17.2) | 0.88 (16.1) | 0.392 | 0.28 | 111.2 (12.2) | 109.3 (14.8) | 0.66 (112) | 0.512 | 0.14 |
| PFL Len (mm) | 27.4 (1.29) | 27.5 (1.28) | 27.2 (1.32) | 1.12 (127) | 0.264 | 0.23 | 27.45 (1.24) | 27.16 (1.57) | 0.94 (127) | 0.351 | 0.20 | 27.45 (1.37) | 27.28 (1.02) | 0.74 (70.6) | 0.464 | 0.14 |
| Z | −1.93 (1.00) | −1.86 (0.98) | −2.14 (1.03) | 1.38 (127) | 0.172 | 0.28 | −1.88 (0.95) | −2.17 (1.23) | 1.19 (127) | 0.237 | 0.26 | −1.90 (1.06) | −2.03 (0.80) | 0.80 (68.8) | 0.429 | 0.14 |
| ICD Len (mm) | 31.9 (2.47) | 31.76 (2.57) | 32.2 (2.16) | −0.90 (127) | 0.371 | 0.19 | 31.8 (2.52) | 32.4 (2.17) | −0.98 (127) | 0.321 | 0.26 | 31.6 (2.35) | 32.7 (2.68) | −2.20 (127) | 0.029 * | 0.44 |
| Z | 0.40 (1.03) | 0.35 (1.07) | 0.55 (1.00) | −0.93 (127) | 0.354 | 0.19 | 0.34 (1.05) | 0.62 (0.88) | −1.05 (127) | 0.297 | 0.29 | 0.29 (0.98) | 0.74 (1.11) | −2.18 (127) | −0.451 | 0.43 |
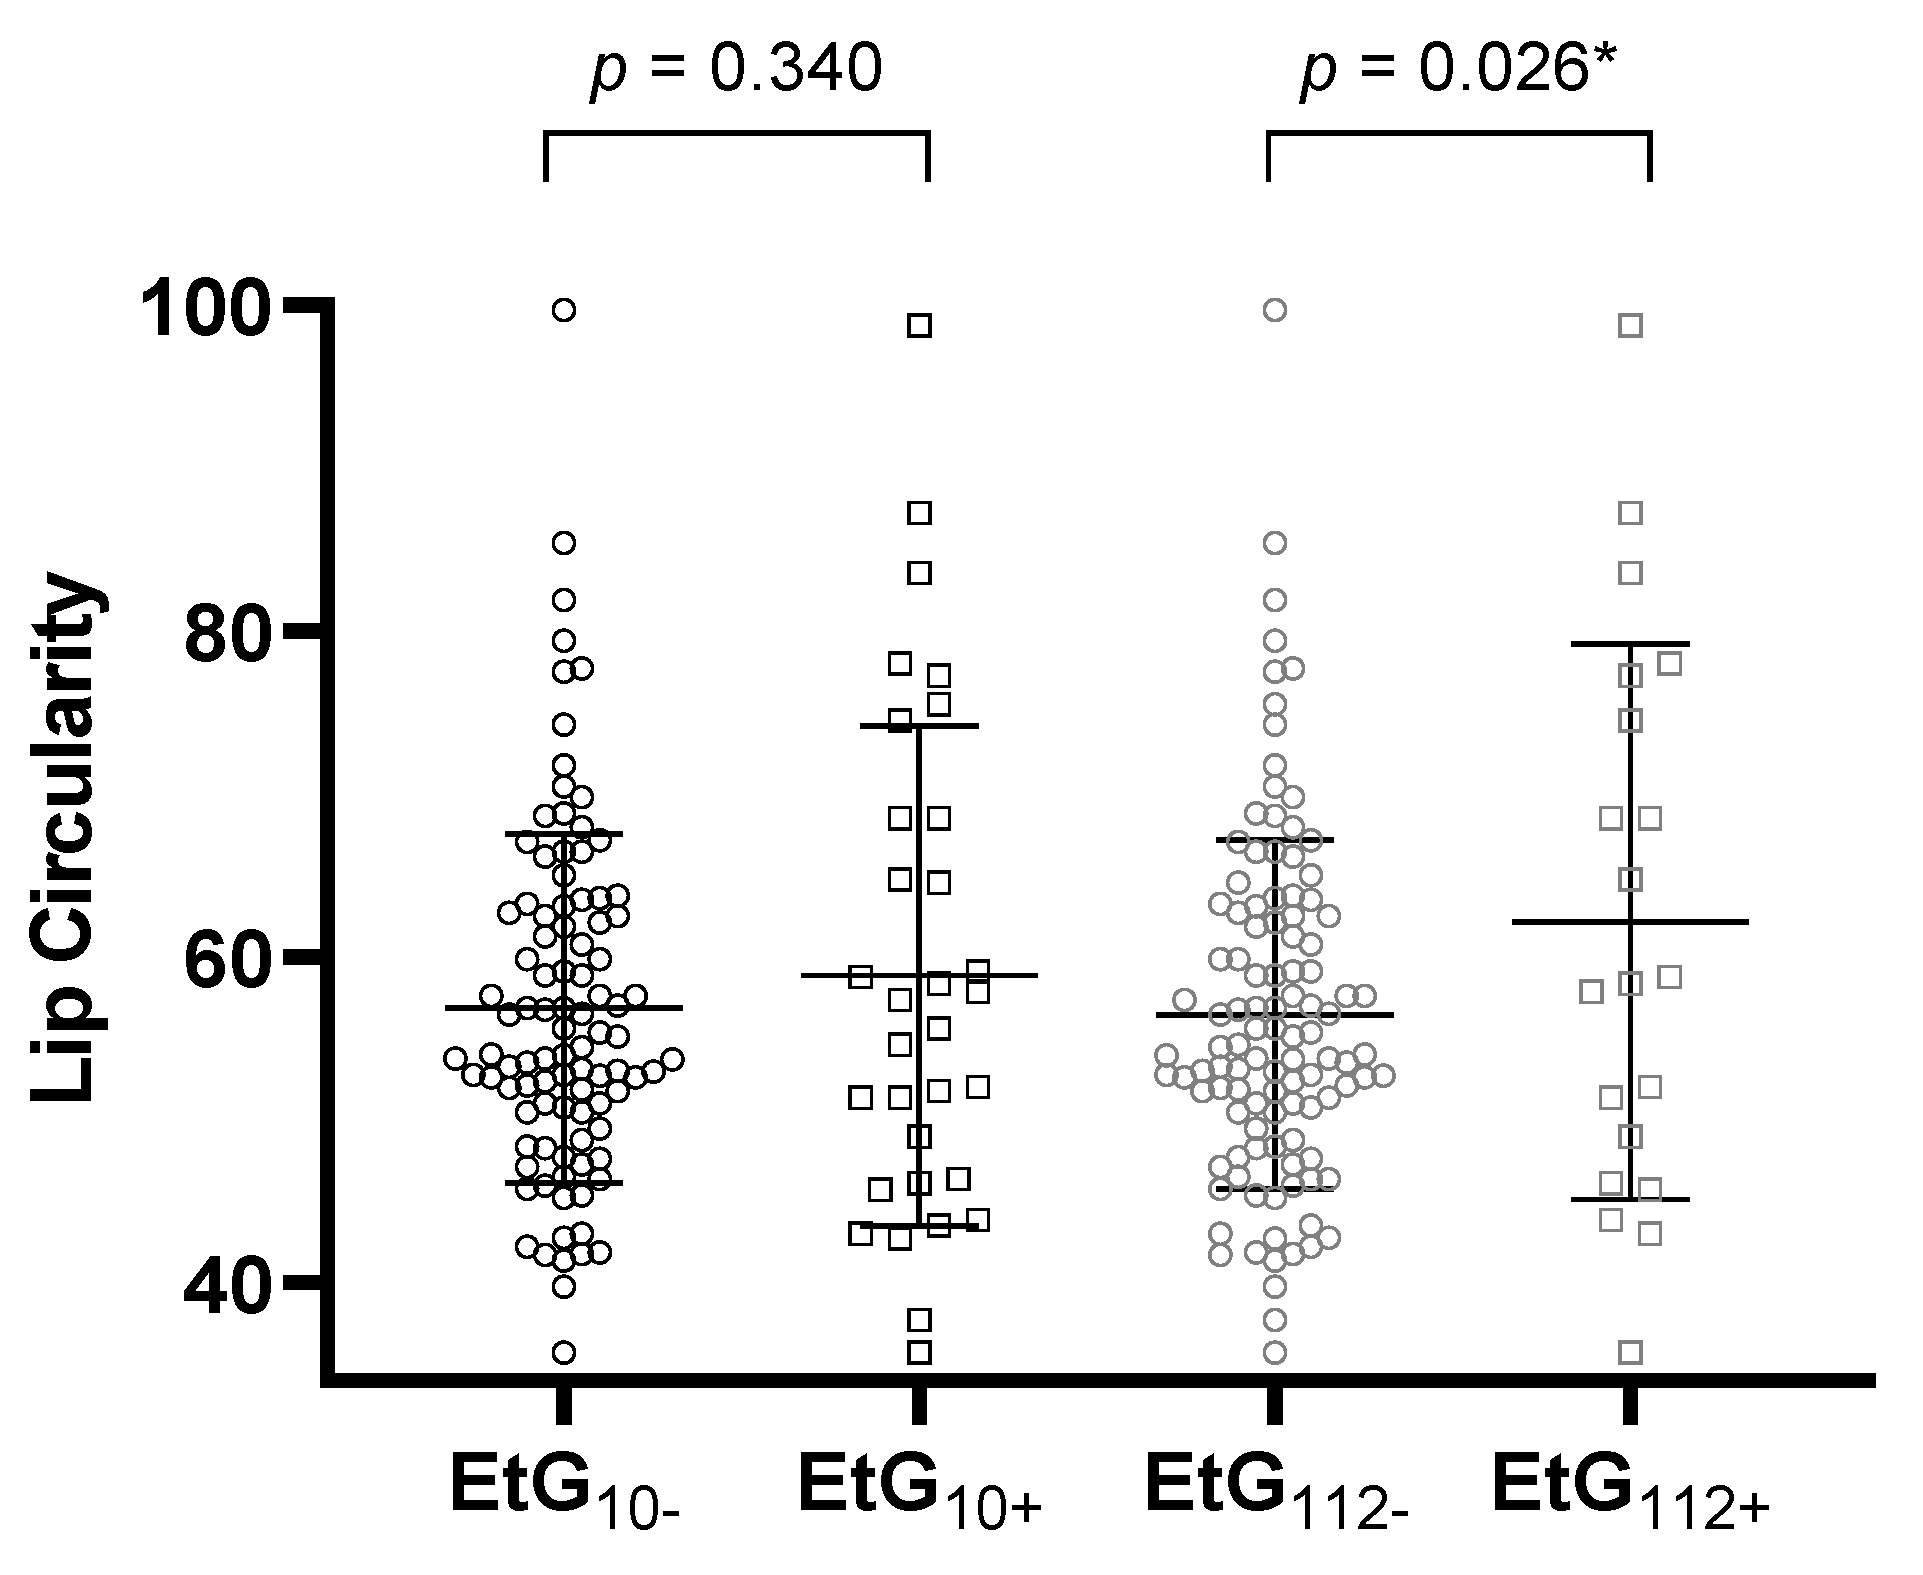
| lip circularity | 57.4 (12.0) | 56.9 (10.7) | 58.9 (15.3) | −0.69 (41.5) | 0.416 | 0.15 | 56.5 (10.7) | 62.2 (17.0) | −1.44 (21.8) | 0.164 | 0.40 | 58.0 (11.7) | 55.3 (12.9) | 1.12 (127) | 0.263 | 0.22 |
| Rater 1 | |||||||
|---|---|---|---|---|---|---|---|
| PFL | ICD | Circularity | |||||
| Length | z-score | Length | z-score | ||||
| Rater 2 | PFL a | Length | 0.884 ** | 0.887 ** | 0.127 | 0.128 | −0.090 |
| z-score | 0.869 ** | 0.876 ** | 0.097 | 0.098 | −0.079 | ||
| ICD | Length | 0.047 | 0.039 | 0.970 ** | 0.970 ** | −0.132 | |
| z-score | 0.037 | 0.029 | 0.964 ** | 0.965 ** | −0.120 | ||
| Circularity | −0.195 * | −0.186 * | −0.036 | −0.037 | 0.727 ** | ||
| PFL | ICD | Circularity a | |||
|---|---|---|---|---|---|
| Len | Z | Len | Z | ||
| EtG a | −0.060 (0.500) | −0.083 (0.350) | 0.086 (0.335) | 0.089 (0.313) | 0.085 (0.337) |
| sex (male/female) | 3.09 (0.002) ** | 3.00 (0.002) ** | 2.60 (0.011) * | 2.51 (0.013) * | −1.55 (0.124) |
| age (years) | 0.113 (0.200) | 0.038 0(.669) | 0.091 (0.305) | 0.080 (0.365) | −0.169 (0.055) + |
| birth weight (grams) | 0.308 (0.000) ** | 0.293 (0.001) ** | 0.253 (0.004) ** | 0.247 (0.005) ** | −0.054 (.544) |
| weight (grams) | 0.256 (0.003) ** | 0.223 (0.011) * | 0.204 (0.020) * | 0.202 (0.022) * | −0.162 (0.066) + |
| height (cm) | 0.382 (0.000) ** | 0.349 (0.000) ** | 0.203 (0.021) * | 0.198 (0.025) * | −0.239 (0.006) ** |
| head (cm) | 0.300 (0.001) ** | 0.284 (0.001) ** | 0.348 (0.000) ** | 0.338 (0.000) ** | −0.008 (0.925) |
| family status | −0.056 (0.531) | −0.052 (0.556) | −0.154 (0.081) + | −0.162 (0.066) + | −0.059 (0.503) |
| maternal age at delivery | −0.067 (0.450) | −0.075 (0.396) | 0.069 (0.439) | 0.070 (0.431) | 0.088 (0.320) |
| maternal smoking pregnancy | 0.021 (0.816) | 0.022 (0.802) | 0.005 (0.959) | 0.004 (0.965) | 0.032 (0.721) |
| EtG10 | EtG112 | Self-Report | |||||||
|---|---|---|---|---|---|---|---|---|---|
| F | p | ηp2 | F | p | ηp2 | F | p | ηp2 | |
| PFL Length | 6.72 | 0.000 ** | 0.280 | 6.53 | 0.000 ** | 0.274 | 6.18 | 0.000 ** | 0.263 |
| EtG/Self | 4.79 | 0.031 * | 0.038 | 3.76 | 0.055 + | 0.030 | 1.96 | 0.164 | 0.016 |
| sex | 3.94 | 0.049 * | 0.032 | 4.09 | 0.045* | 0.033 | 5.16 | 0.025 * | 0.041 |
| age | 0.06 | 0.806 | 0.001 | 0.01 | 0.916 | 0.000 | 0.02 | 0.888 | 0.000 |
| birth weight | 9.15 | 0.003 ** | 0.070 | 8.30 | 0.005 ** | 0.064 | 7.58 | 0.007 ** | 0.059 |
| height | 8.59 | 0.004 ** | 0.066 | 9.55 | 0.002 ** | 0.073 | 8.49 | 0.004 ** | 0.066 |
| weight | 0.07 | 0.799 | 0.001 | 0.32 | 0.895 | 0.000 | 0.00 | 0.960 | 0.000 |
| head circumference | 0.14 | 0.711 | 0.001 | 0.12 | 0.733 | 0.001 | 0.25 | 0.619 | 0.002 |
| PFL z-score | 5.99 | 0.000 ** | 0.257 | 5.83 | 0.000 ** | 0.252 | 5.46 | 0.000 ** | 0.240 |
| EtG/Self | 4.76 | 0.031 * | 0.038 | 3.88 | 0.051 + | 0.031 | 1.89 | 0.172 | 0.015 |
| sex | 3.51 | 0.063 + | 0.028 | 3.65 | 0.058 + | 0.029 | 4.66 | 0.033 * | 0.037 |
| age | 0.35 | 0.558 | 0.003 | 0.53 | 0.469 | 0.004 | 0.97 | 0.327 | 0.008 |
| birth weight | 8.56 | 0.004 ** | 0.066 | 7.77 | 0.006 ** | 0.060 | 7.03 | 0.009 ** | 0.055 |
| height | 7.80 | 0.006 ** | 0.061 | 8.72 | 0.004 ** | 0.067 | 7.73 | 0.006 ** | 0.060 |
| weight | 0.02 | 0.887 | 0.000 | 0.01 | 0.935 | 0.000 | 0.00 | 0.961 | 0.000 |
| head circumference | 0.23 | 0.663 | 0.002 | 0.20 | 0.656 | 0.002 | 0.36 | 0.549 | 0.003 |
| ICD Len | 3.35 | 0.003 ** | 0.162 | 3.38 | 0.002 ** | 0.164 | 3.75 | 0.001 ** | 0.178 |
| EtG/Self | 0.08 | 0.777 | 0.001 | 0.27 | 0.607 | 0.002 | 2.43 | 0.122 | 0.020 |
| sex | 2.06 | 0.154 | 0.017 | 2.11 | 0.149 | 0.017 | 1.70 | 0.195 | 0.014 |
| age | 0.01 | 0.904 | 0.000 | 0.02 | 0.883 | 0.000 | 0.02 | 0.881 | 0.000 |
| birth weight | 2.25 | 0.136 | 0.018 | 2.24 | 0.137 | 0.018 | 1.95 | 0.165 | 0.016 |
| height | 0.16 | 0.686 | 0.001 | 0.15 | 0.697 | 0.001 | 0.32 | 0.575 | 0.003 |
| weight | 0.23 | 0.633 | 0.002 | 0.22 | 0.641 | 0.002 | 0.22 | 0.638 | 0.002 |
| head circumference | 4.47 | 0.037 * | 0.036 | 4.52 | 0.036 * | 0.036 | 4.02 | 0.047 * | 0.032 |
| ICD z-score | 3.17 | 0.004 ** | 0.155 | 3.21 | 0.004 ** | 0.157 | 3.56 | 0.002 ** | 0.171 |
| EtG/Self | 0.12 | 0.726 | 0.001 | 0.35 | 0.554 | 0.003 | 2.41 | 0.123 | 0.020 |
| sex | 1.84 | 0.166 | 0.016 | 1.99 | 0.161 | 0.016 | 1.58 | 0.212 | 0.013 |
| age | 0.06 | 0.808 | 0.000 | 0.07 | 0.788 | 0.001 | 0.07 | 0.793 | 0.001 |
| birth weight | 2.16 | 0.145 | 0.018 | 2.16 | 0.145 | 0.018 | 1.90 | 0.171 | 0.015 |
| height | 0.15 | 0.701 | 0.001 | 0.13 | 0.716 | 0.001 | 0.28 | 0.594 | 0.002 |
| weight | 0.27 | 0.605 | 0.002 | 0.26 | 0.612 | 0.002 | 0.27 | 0.604 | 0.002 |
| head circumference | 4.14 | 0.044 * | 0.033 | 4.20 | 0.043 * | 0.034 | 3.71 | 0.056 * | 0.030 |
| Circularity | 2.31 | 0.031 * | 0.118 | 2.98 | 0.006 ** | 0.147 | 2.49 | 0.020 * | 0.126 |
| EtG/Self | 0.92 | 0.340 | 0.008 | 5.09 | 0.026 * | 0.040 | 2.04 | 0.156 | 0.017 |
| sex | 3.12 | 0.080 + | 0.025 | 2.92 | 0.090 + | 0.024 | 3.08 | 0.082 + | 0.025 |
| age | 2.25 | 0.136 | 0.018 | 2.92 | 0.090 + | 0.024 | 1.56 | 0.214 | 0.13 |
| birth weight | 0.26 | 0.661 | 0.002 | 0.44 | 0.506 | 0.004 | 0.02 | 0.896 | 0.000 |
| height | 3.83 | 0.053 + | 0.031 | 4.20 | 0.043 * | 0.034 | 4.86 | 0.029 * | 0.039 |
| weight | 0.37 | 0.543 | 0.003 | 0.50 | 0.479 | 0.004 | 0.22 | 0.644 | 0.002 |
| head circumference | 3.77 | 0.055 + | 0.003 | 4.10 | 0.045 * | 0.033 | 4.17 | 0.043 * | 0.033 |
| n | Fluid Reasoning Index | Working Memory Index | |
|---|---|---|---|
| EtG10+ | 32 (df = 16) | ||
| PFL len | 0.113 (0.654) | 0.058 (0.818) | |
| PFL z-score | 0.117 (0.644) | 0.044 (0.861) | |
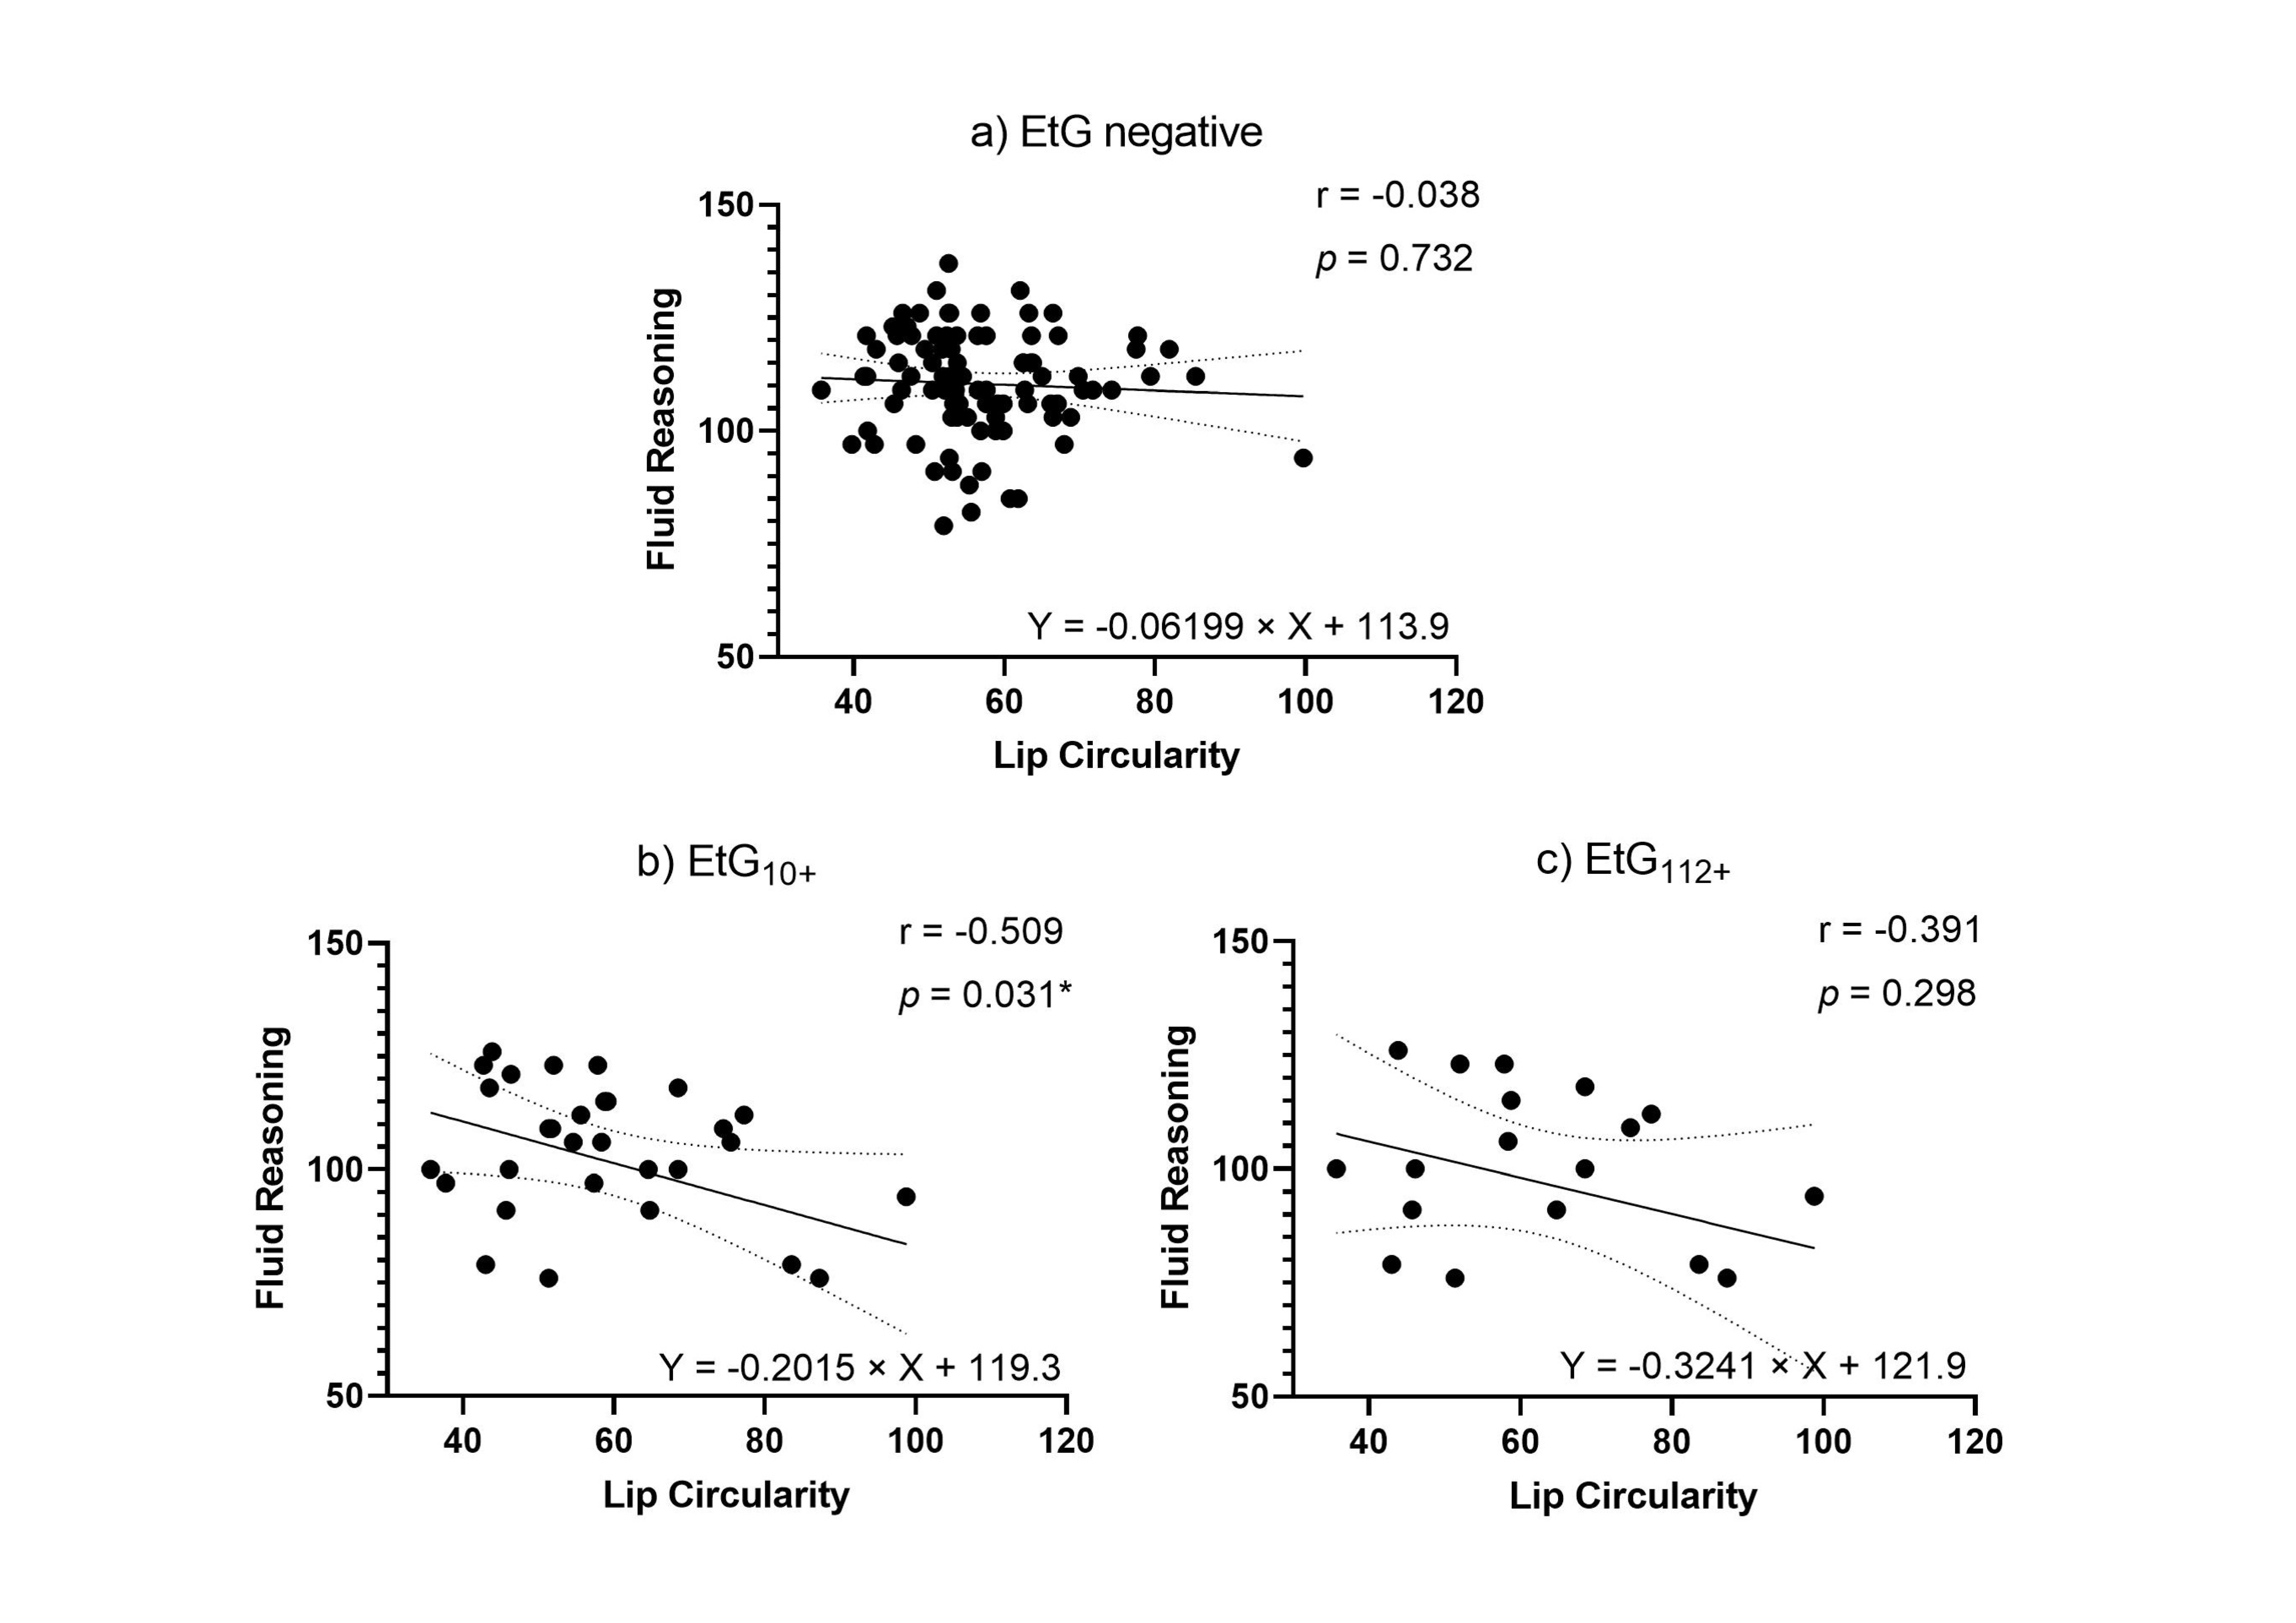
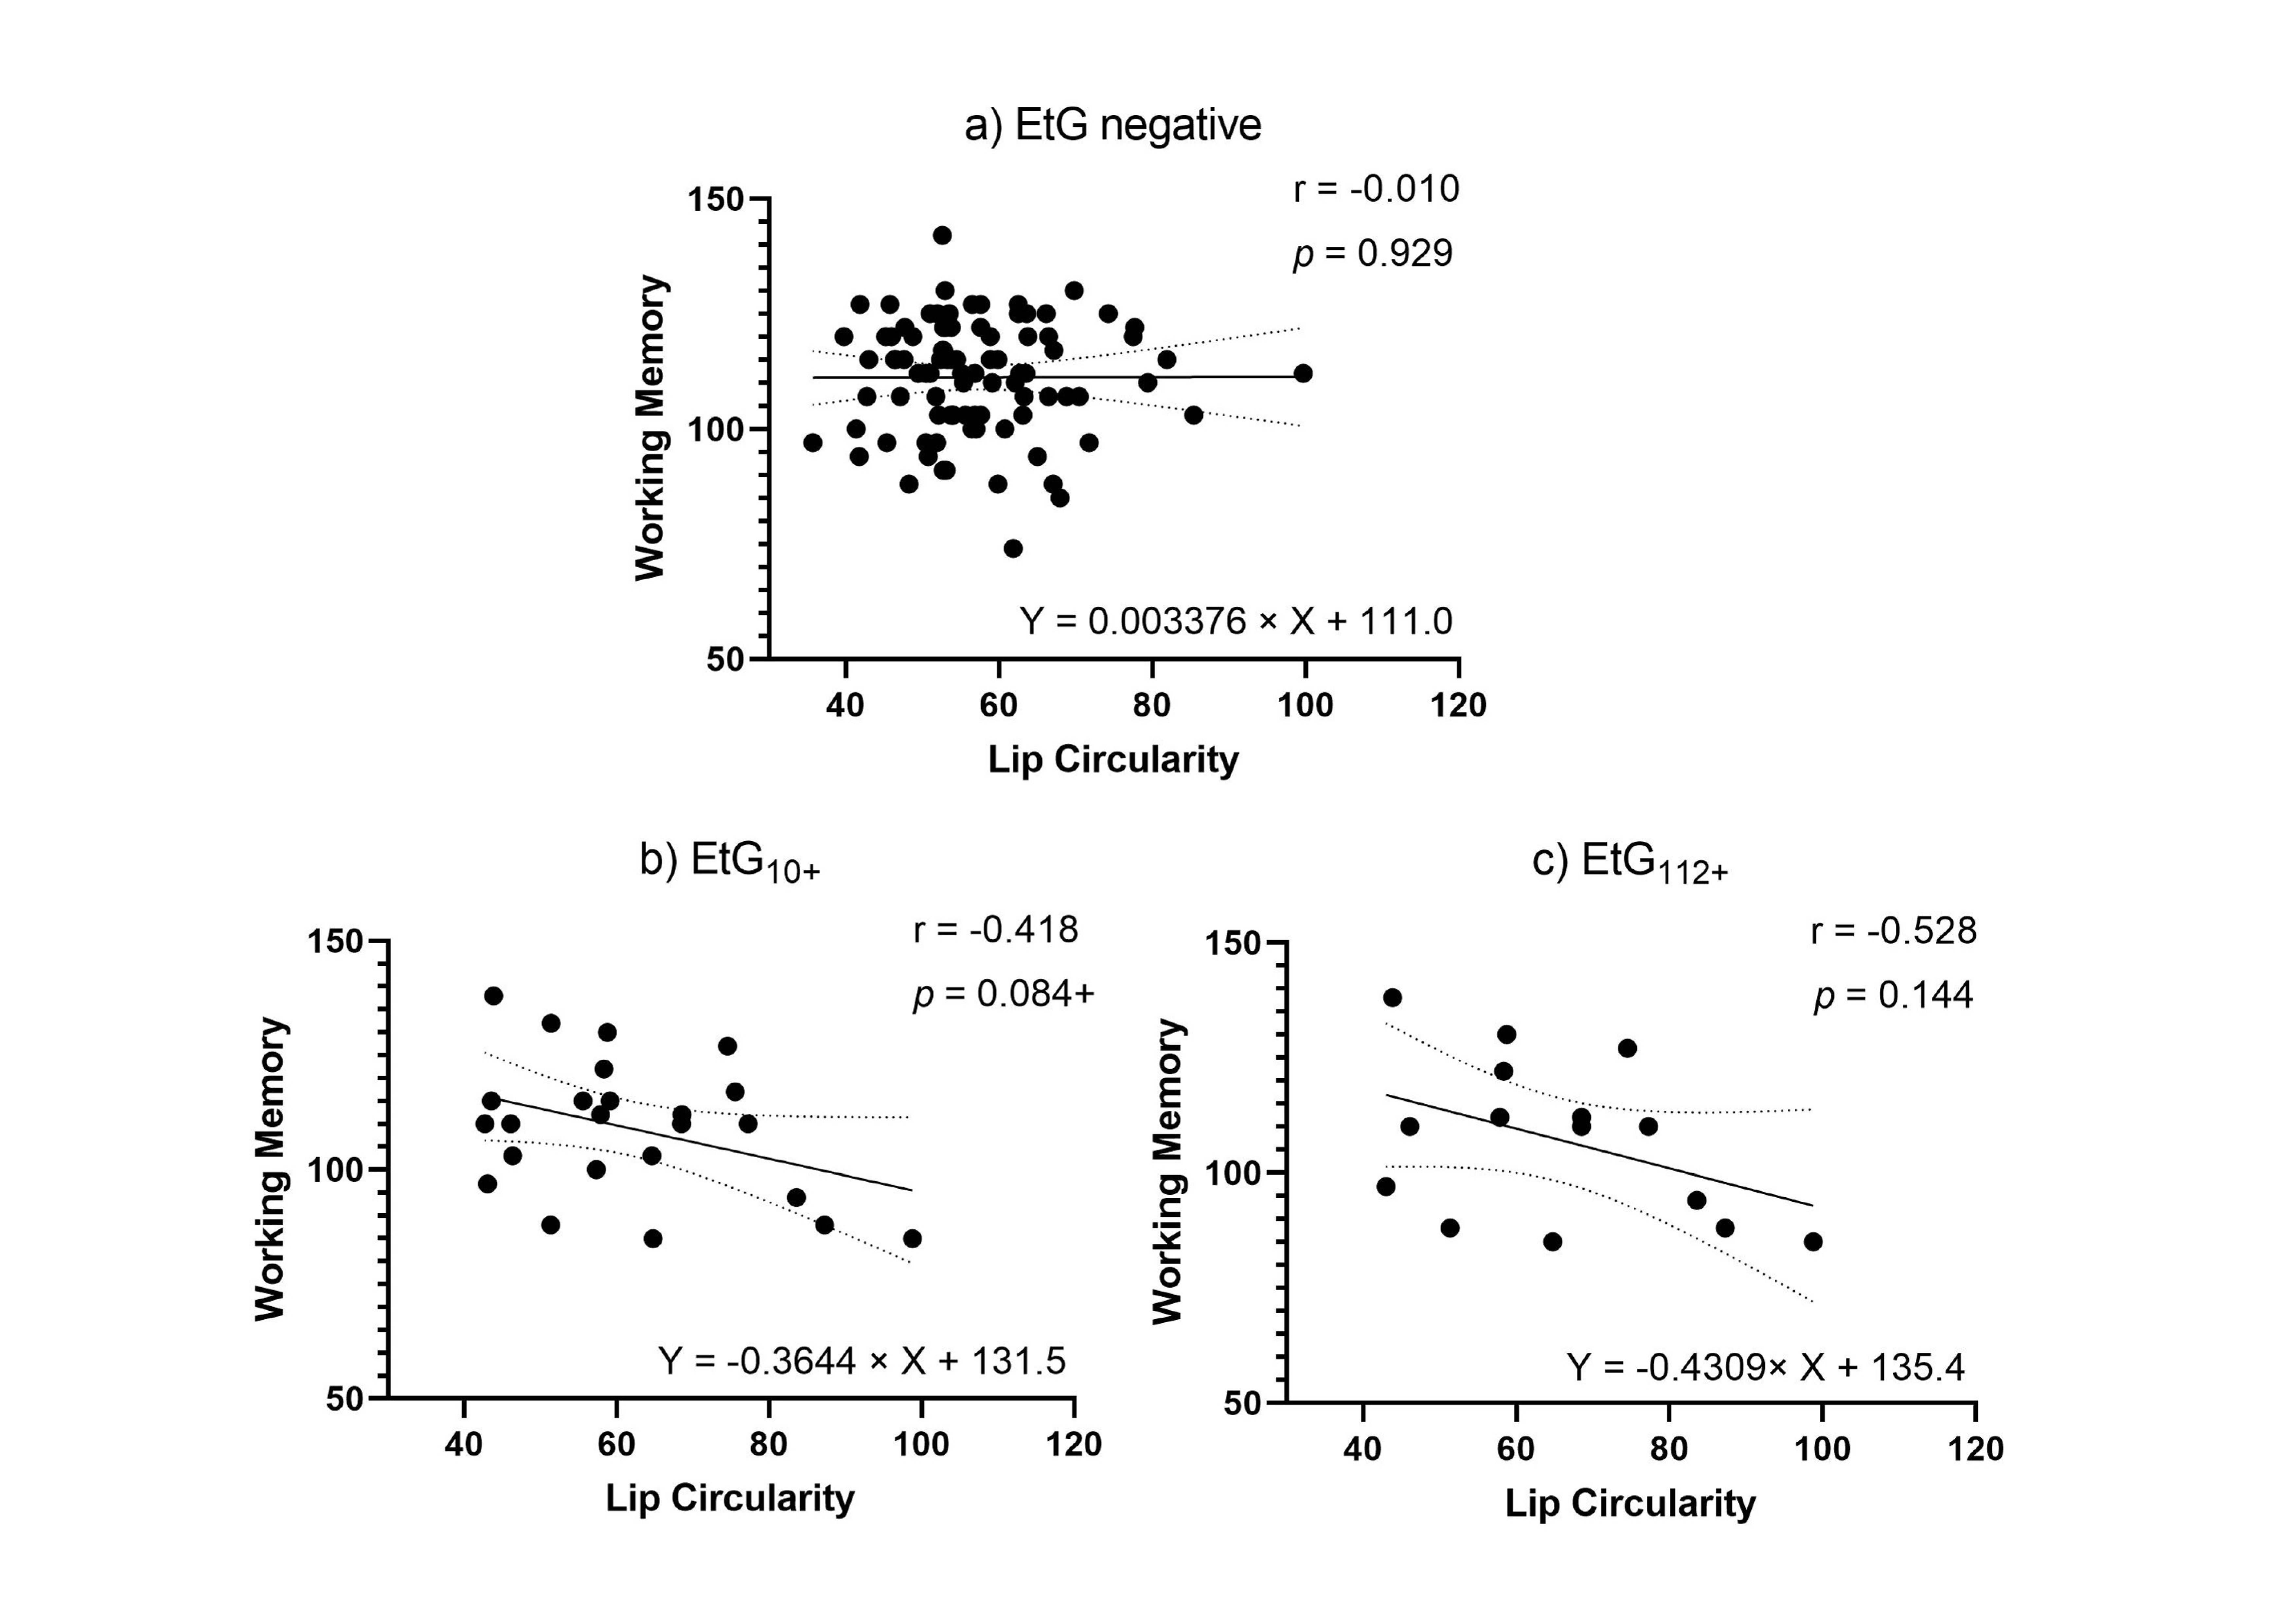
| Circularity | −0.509 (0.031 *) | −0.418 (0.084 +) | |
| EtG112+ | 20 (df = 7) | ||
| PFL len | −0.010 (0.980) | −0.129 (0.741) | |
| PFL z-score | 0.007 (0.986) | −0.129 (0.741) | |
| Circularity | −0.391 (0.298) | −0.528 (0.144) |
Publisher’s Note: MDPI stays neutral with regard to jurisdictional claims in published maps and institutional affiliations. |
© 2021 by the authors. Licensee MDPI, Basel, Switzerland. This article is an open access article distributed under the terms and conditions of the Creative Commons Attribution (CC BY) license (http://creativecommons.org/licenses/by/4.0/).
Share and Cite
Maschke, J.; Roetner, J.; Goecke, T.W.; Fasching, P.A.; Beckmann, M.W.; Kratz, O.; Moll, G.H.; Lenz, B.; Kornhuber, J.; Eichler, A.; et al. Prenatal Alcohol Exposure and the Facial Phenotype in Adolescents: A Study Based on Meconium Ethyl Glucuronide. Brain Sci. 2021, 11, 154. https://doi.org/10.3390/brainsci11020154
Maschke J, Roetner J, Goecke TW, Fasching PA, Beckmann MW, Kratz O, Moll GH, Lenz B, Kornhuber J, Eichler A, et al. Prenatal Alcohol Exposure and the Facial Phenotype in Adolescents: A Study Based on Meconium Ethyl Glucuronide. Brain Sciences. 2021; 11(2):154. https://doi.org/10.3390/brainsci11020154
Chicago/Turabian StyleMaschke, Janina, Jakob Roetner, Tamme W. Goecke, Peter A. Fasching, Matthias W. Beckmann, Oliver Kratz, Gunther H. Moll, Bernd Lenz, Johannes Kornhuber, Anna Eichler, and et al. 2021. "Prenatal Alcohol Exposure and the Facial Phenotype in Adolescents: A Study Based on Meconium Ethyl Glucuronide" Brain Sciences 11, no. 2: 154. https://doi.org/10.3390/brainsci11020154