Article

Damaging Effects of Pulsed Electric Field Process Parameters on Rhizoctonia solani Cells Using Response Surface Methodology

1
College of Engineering, Nanjing Agricultural University, Nanjing 210031, China
2
Jiangsu Province Engineering Lab for Modern Intelligent Facilities of Agriculture Technology & Equipment, Nanjing 210031, China
*
Author to whom correspondence should be addressed.
Appl. Sci. 2019, 9(21), 4706; https://doi.org/10.3390/app9214706
Submission received: 17 September 2019 / Revised: 27 October 2019 / Accepted: 31 October 2019 / Published: 4 November 2019
(This article belongs to the Special Issue State-of-Art of Microbial Concerns in Food Safety)

Abstract

:

Featured Application

Rhizoctonia solani is very destructive to rice and there is no effective method for killing it in agricultural application. Combined with the use of pulsed electric field, the amount of pesticide can be greatly reduced and, at the same time, it can significantly improve the damage effects on Rhizoctonia solani. Or we can explore ways to improve the damage effects of pulsed electric field in the follow-up experiments, so as to completely use pulsed electric field to kill Rhizoctonia solani.

Abstract

This work aimed to analyse the damaging effects of pulsed electric fields on Rhizoctonia solani. Design Expert software was used to design an orthogonal experiment. The cell membrane damage and cell wall damage were observed by scanning electron microscopy and quantitatively determined while using a conductivity metre and an ultraviolet spectrophotometer. The results showed that the cell membrane damage rate was correlated with the voltage amplitude and processing time (p < 0.01), while the effect of pulse duration was not significant (p > 0.05). Besides, the cell wall damage was related to electric field strength (voltage amplitude) (p < 0.01), while the pulse duration and processing time had no significant effect on that (p > 0.05). The optimal process parameters for this method were 25 kV/cm, 5 min., and a pulse duration of 60 µs. The optimised conditions were tested based on these results. When compared with Control Check (CK), the cell membrane damage rate was 48.72%, which was significantly higher than CK (p < 0.01).

1. Introduction

Rice is not only one of the most important food crops worldwide, but also, together with maize and wheat [1], the staple food of more than half of the world’s population, and it is of great value to the supply of human food [2]. Moreover, its high and stable yield is of great significance for ensuring food security [3]. It is well known that rice sheath blight, caused by R. solani infection, is one of the most destructive rice diseases in the world [4]. It primarily occurs under high temperature and humidity conditions, and it has a wide host range and high competitive saprophytic ability, and its control is of great significance to national food security [5].
At present, the primary treatment method for rice sheath blight is the application of chemical fungicides, such as jinggangmycin and thiophanate-methyl. Although chemical control is effective, it also causes environmental pollution, and long-term and wide-ranging application will result in drug resistance and other negative effects on environmental ecology. In response to these challenges, researchers have endeavoured to use transgenic technology for biological control. However, this method poses other problems, such as the difficulty in screening antagonistic microorganisms, unstable control effects, and the danger of genetically modified food. Furthermore, no immune or high-resistance varieties have been found or developed thus far [6].
Pulsed electric field (PEF) technology, which is an emerging non-polluting sterilisation technology, is widely regarded and highly valued by domestic and foreign food technology experts and microbiologists. A PEF inactivates microorganisms through the use of a short-term electric field, which damages the structure and function of cells, thus enhancing the permeability of cell membranes [7]. This causes the selective permeability of the cell to be changed or lost, thus allowing for a large number of substances to infiltrate the cells, which results in cell apoptosis. Researchers worldwide have conducted considerable research on the lethal effects of a PEF on different microorganisms, focusing mainly on the effects of different PEF parameters (electric field strength, pulse duration, pulse number, etc.) on microbial lethal effects. For example, Sharma [8] treated Gram-negative bacteria (Pseudomonas aeruginosa) and Gram-positive bacteria (Staphylococcus aureus and Listeria innocua) in whole milk with PEF, and found that Gram-negative bacteria were less tolerant of PEF treatment than Gram-positive bacteria. Donsi [9] studied the effect of PEF on the inactivation rate of Saccharomyces cerevisiae cells in juice, and found that the inactivation effect depends on the combination of electric field parameters used, especially the pulse holding time and the number of pulses. Coustets [10] found that sub-millisecond pulse trains are more cost effective than longer ones in the use for bacterial inactivation in the flow process. In addition, Wang [11] found that, after the application of a pulse voltage of 3 kV with a pulse duration of 15 μs, the lethal rate reached 92.6% for Aspergillus niger at 200 pulses, and all of the moulds were killed after 1000 pulses. Therefore, PEF has certain antibacterial effects on a variety of microorganisms, including Gram-positive bacteria, Gram-negative bacteria, yeasts, and moulds. Different strains have been reported to vary in their resistance to PEF; for example, Mazurek [12] presented an investigation of the survival ratios of Gram-negative (Escherichia coli, Yersinia enterocolitica) and Gram-positive (S. aureus, Listeria monocytogenes) bacteria and yeast-like fungi (Candida albicans) following HV pulses with peak voltages that range from U = 0 to 100 kV, and rise time that ranges from t = 0.5 to 1.2 μs. Mortality rates from high to low were as follows: Gram-negative bacteria > S. aureus > yeast-like fungi > L. monocytogenes. In addition, Zu [13] conducted a comparative experiment of PEF examining its lethal effects on different microorganisms. This research showed that the mortality rate of biological organism increases with increases in electric field strength, pulse duration, and number of pulses. Treating Gram-positive bacteria (Bacillus subtilis), Gram-negative bacteria (E. coli), yeast, and mould (Penicillium) under the same high-voltage PEF (pulse duration τ = 9 μs, electric field strength E = 7 kV/cm and pulse number n = 3000), the lethal rate from high to low is as follows: yeast > Gram-negative bacteria > Gram-positive bacteria > mould. The reason for the inconsistency between the two results might be that the lethal effect of PEF on microorganisms is affected by many factors. In addition to the electric field treatment parameters, the intrinsic properties of microorganisms themselves are also important factors in determining the bactericidal effect of PEF, such as the different types of microorganisms, different radius sizes of cell, and different cell wall and cell membrane composition, which causes the effect of PEF sterilisation to also vary [14].
As a filamentous fungal microorganism, R. solani has a complex structure and biochemical properties similar to other moulds. For example, Penicillium has cysts, rinds, spore coats, and outer cell walls, and its composition has a small specific gravity, thereby forming a complex structure having a wall within the wall, and a membrane within the membrane. In past experimental studies, the resistance of mould to PEF was greater than that of bacteria and yeast-like fungi. Therefore, we infer that the resistance of R. solani to PEF is stronger than that of bacteria and yeast-like fungi, though the effect of PEF treatment on R. solani has not yet been reported.
The aim of the present study was to examine the cell damaging effects of PEF treatment on R. solani in a model system while using response surface methodology, which has been effectively used to optimise the treatment parameters using statistical design tools [15]. In this experiment, the quadratic polynomial and the regression model were obtained from the response amplitude surface of the voltage amplitude, the pulse duration, and the processing time, which were extracted to analyse the influence of the cell damaging effects and obtain the optimal solution for the cell damaging effects test while using PEF. In addition, we provide experimental data references for subsequent studies on the biological effects of PEF.

2. Materials and Methods

2.1. Biological Samples and Instruments

Table 1 shows the biological samples and instruments used in the present study:
Our laboratory designed the PEF treatment experimental system, and it consists of a pulse source, a treatment vessel, a high-voltage probe, and an oscilloscope. The high-voltage probe and oscilloscope can read the power supply voltage, waveform, and frequency signals in real time, so the pulse duration, frequency, and pulse number can be properly controlled. Among these, the pulse voltage output amplitude range is 3–30 kV, the pulse duration is 100 ns–100 µs, and the output frequency range is 1–10 Hz adjustable continuously. The electrode length is 45 mm, the duration is 10 mm, and the gap is 50 mm. Tetrafluoroethylene is the insulating material.

2.2. Experimental Methods

2.2.1. Preparation of Mycelium Suspension

One hundred millilitres of potato dextrose culture medium (potato dextrose medium was made by laboratory) was inoculated with a 5-mm R. solani cake (the thickness is 4 mm), and was shaken at 28 °C for 72 h at 170 revolutions/min. Then, the cultured R. solani solution was diluted to a conductivity of 400 µS/cm with sterile distilled water and stored for later use at 28 °C.

2.2.2. Pulsed Electric Field Treatment Experiment

First, a sterile pipette was used to draw 15 mL of mycelial suspension at 400 us/cm into the treatment dish to select the high-voltage PEF treatment parameters: a frequency of 2 Hz; pulse durations of 30, 45, or 60 µs; voltages amplitude of 15, 20, or 25 kV; and, a treatment time of 1, 3, or 5 min. Through previous experiments, the temperature rise is controlled within 5 °C to avoid the damage that is caused by the thermal effect, and this determines the field conditions of the experiment.

2.2.3. Box-Behnken Test

The Design-Expert software completed this experiment. This software is developed by the Stat-Ease company in the United States. It can be used for the statistical analysis of experimental data fitted curve; it can also be used to provide the 3D graphics to observe the response surface and further optimization for test. Now the software has been widely used in all kinds of multifactor experimental design and analysis. Kumar, R et al. also used design-expert software in the experiment of treating yeast and mold in mango with pulsed electric field [16], which provided a reference for the design of this experiment.
At a voltage amplitude of 20 kV, a processing time of 3 min., and a pulse duration of 45 μs as the centre point, the Box-Behnken test was designed and analysed while using Design Expert software. Box-Behnken test scheme provided by design-expert 8.0.6 system was adopted in the experiment. The independent variables were voltage amplitude, the pulse duration, and the processing time.
Response surface analysis (RSM) is a mathematical statistical method for finding the best conditions in multi-factor system. The experiment can be comprehensively studied in the most economical way with a small number of experiments and time, and the optimal combination of various factors and the optimal response value can be determined in the whole investigation area due to the reasonable experimental design. Response surface experiments of 17 test points (five center points, 12 factorial points) with three factors and three levels were designed. At the same time, the CK control group was set, and the CK group did not undergo electric field treatment. Table 2 shows the factor level data table. The RSREG (response surface regression) program of the Design-Expert 8.0.6 software was used to fit the Response values of 17 test points, generate the quadratic model, and plot the Response surface diagram.

2.2.4. Observation by Scanning Electron Microscope (SEM)

One and one-half millilitres of the mycelial suspension was placed in a 2-mL centrifuge tube; a 2% paraformaldehyde−2.5% glutaraldehyde mixed fixative pre-cooled to 4 °C was added, and the sample was fixed at 4 °C for 2 h. Subsequently, the fixative was aspirated and washed three times with 0.2 mol/L phosphate-buffered saline buffer (pH = 7.2) for 15 min. The sample was dehydrated with a 30%, 50%, 60%, 70%, 80%, 90%, 95%, and 100% ethanol solution in sequence, and the 100% ethanol solution was dehydrated twice, each time for 10–15 min. (each step required centrifugation at 4000 r/min. for 10 min.). After centrifugation, the supernatant was discarded and the precipitate was placed in a desiccator to dry overnight. The dried bacterial powder was coated with gold while using a conductive adhesive for 3 min., collected and imaged, and the untreated dry sample was used as a control.

2.2.5. Determination of the Overflow of Cell Contents Using an 510 nm Wavelength Absorption Method

A 15-mL mycelial suspension was collected for PEF treatment using a sterile pipette. After PEF treatment, the sample was centrifuged at 4000 r/min. for 10 min. The supernatant was aspirated and the fluorescence value at 510 nm was measured while using an UV-VIS spectrometer. The mycelial suspension that was not PEF-treated was used as a blank control, and each treatment was measured in parallel three times and the results were averaged.

2.2.6. Calculating the Cell Membrane Damage Rate

The prepared sample was centrifuged at 4000 r/min. for 10 min., and the resulting supernatant was measured for conductivity while using a DDS-307A conductivity meter. The temperature compensation was 24 °C and the recorded data were averaged. The cell membrane damage rate was calculated in comparison with the conductivity of the boiled sample. The cell membrane damage rate was calculated, as shown in Formula (1):
Cell   membrane   damage   rate = S 1 S 0 S 2 S 0
where S1 stands for conductivity of treated mycelial suspension, S0 is the initial conductivity of mycelial suspension, and S2 represents the conductivity of the boiled sample.

3. Results

3.1. SEM Analysis of R. solani Before and after PEF Treatment

Figure 1a shows a SEM image of R. solani without PEF treatment. It is clear that the mycelia of R. solani have a regular shape, smooth surface, and uniform distribution. The cells are intact and full, and the cell wall is not damaged. Figure 1b shows a SEM image of R. solani after PEF treatment. The structure and morphology of R. solani have completely changed; the surface of the mycelium is uneven and rough, and there are many depressions. In addition, cell breakage is clearly visible, a large amount of adherents appear around the cells and a large number of bud marks are generated. Therefore, the cell membrane and cell wall breakage can be confirmed.

3.2. The Effect of PEF on R. solani Cell Damage via an Orthogonal Test

There were 13 groups in the orthogonal test, and four groups of them were repeated at the central value point. Table 3 shows the test results.
The cell membrane damage rate and the absorbance value at 510 nm of PEF-treated R. solani were significantly higher than those of the control group. All of the indexes were significantly different from CK when the treatment conditions were as follows: a voltage of 15 kV, a processing time of 3 min., and a pulse duration of 30 µs; a voltage of 20 kV, a processing time of 3 min., and a pulse duration of 45 µs; a voltage of 15 kV, a processing time of 5 min., and a pulse duration of 45 µs; a voltage of 25 kV, a processing time of 5 min. and a pulse duration of 45 µs; or a voltage of 25 kV, a processing time of 3 min., and a pulse duration of 30 µs. The most significant difference was observed in the experimental group with a treatment voltage of 25 kV, a processing time of 5 min., and a pulse duration of 45 µs.

3.3. Analysis and Impact of Interactions on the R. solani Cell Damage Rate

During the data treatment process, the regression equation of the experimental results was established using Design Expert software, and the quadratic multivariate regression models were established between the R. solani cell membrane damage rate, the absorbance value at 510 nm, and the voltage, pulse duration and processing time of PEF processing. Table 4 shows the results of the variance analysis.
In Table 3, the cell damage rate of PEF-treated R. solani is significantly higher than that of CK, and there are significant differences in each experimental group (p < 0.05), most of which have extremely significant differences (p < 0.01). Analysis of Variance (ANOVA) of Design-Expert was performed to obtain the coefficients of the final equation for better accuracy and carry out variance analysis of various models, and it concluded quadratic model as the best model. The quadratic multiple regression model between the cell damage rate and the R. solani influencing factors was established, as shown in formula (2). Based on Table 4, it can be seen that in this case, the significance test p < 0.05 indicates that the model is statistically significant. For formula (2), it can be known from Table 4 that its independent variables the once term A and B and the quadratic term A2 and B2 are significant (p < 0.05), and the other terms are not significant. If the insignificant terms are eliminated, formula 2 can be simplified as follows:
PR = 0.22 + 0.064 * A + 0.080 * B + 0.10 * A 2 0.083 * B 2
PR is the cell damage rate of PEF-treated R. solani used to detect the degree of cell membrane damage; A is the pulse voltage amplitude, in kV; B is the processing time, in min.
From Table 4, it can be concluded that the F value of the cell damage rate is 5.39 and the p value is 0.0186. Therefore, the relationship between the established cell damage rate and experimental factors is significant (p < 0.05), and the R2 is 0.8739, which shows that the model fitting is good and the reliability of the experimental model is high. From the data in Table 3, we can see that the influence of the quadratic term of the voltage on the cell damage rate is extremely significant, and the influence of the quadratic term of the pulse duration on the cell damage rate is not obvious.

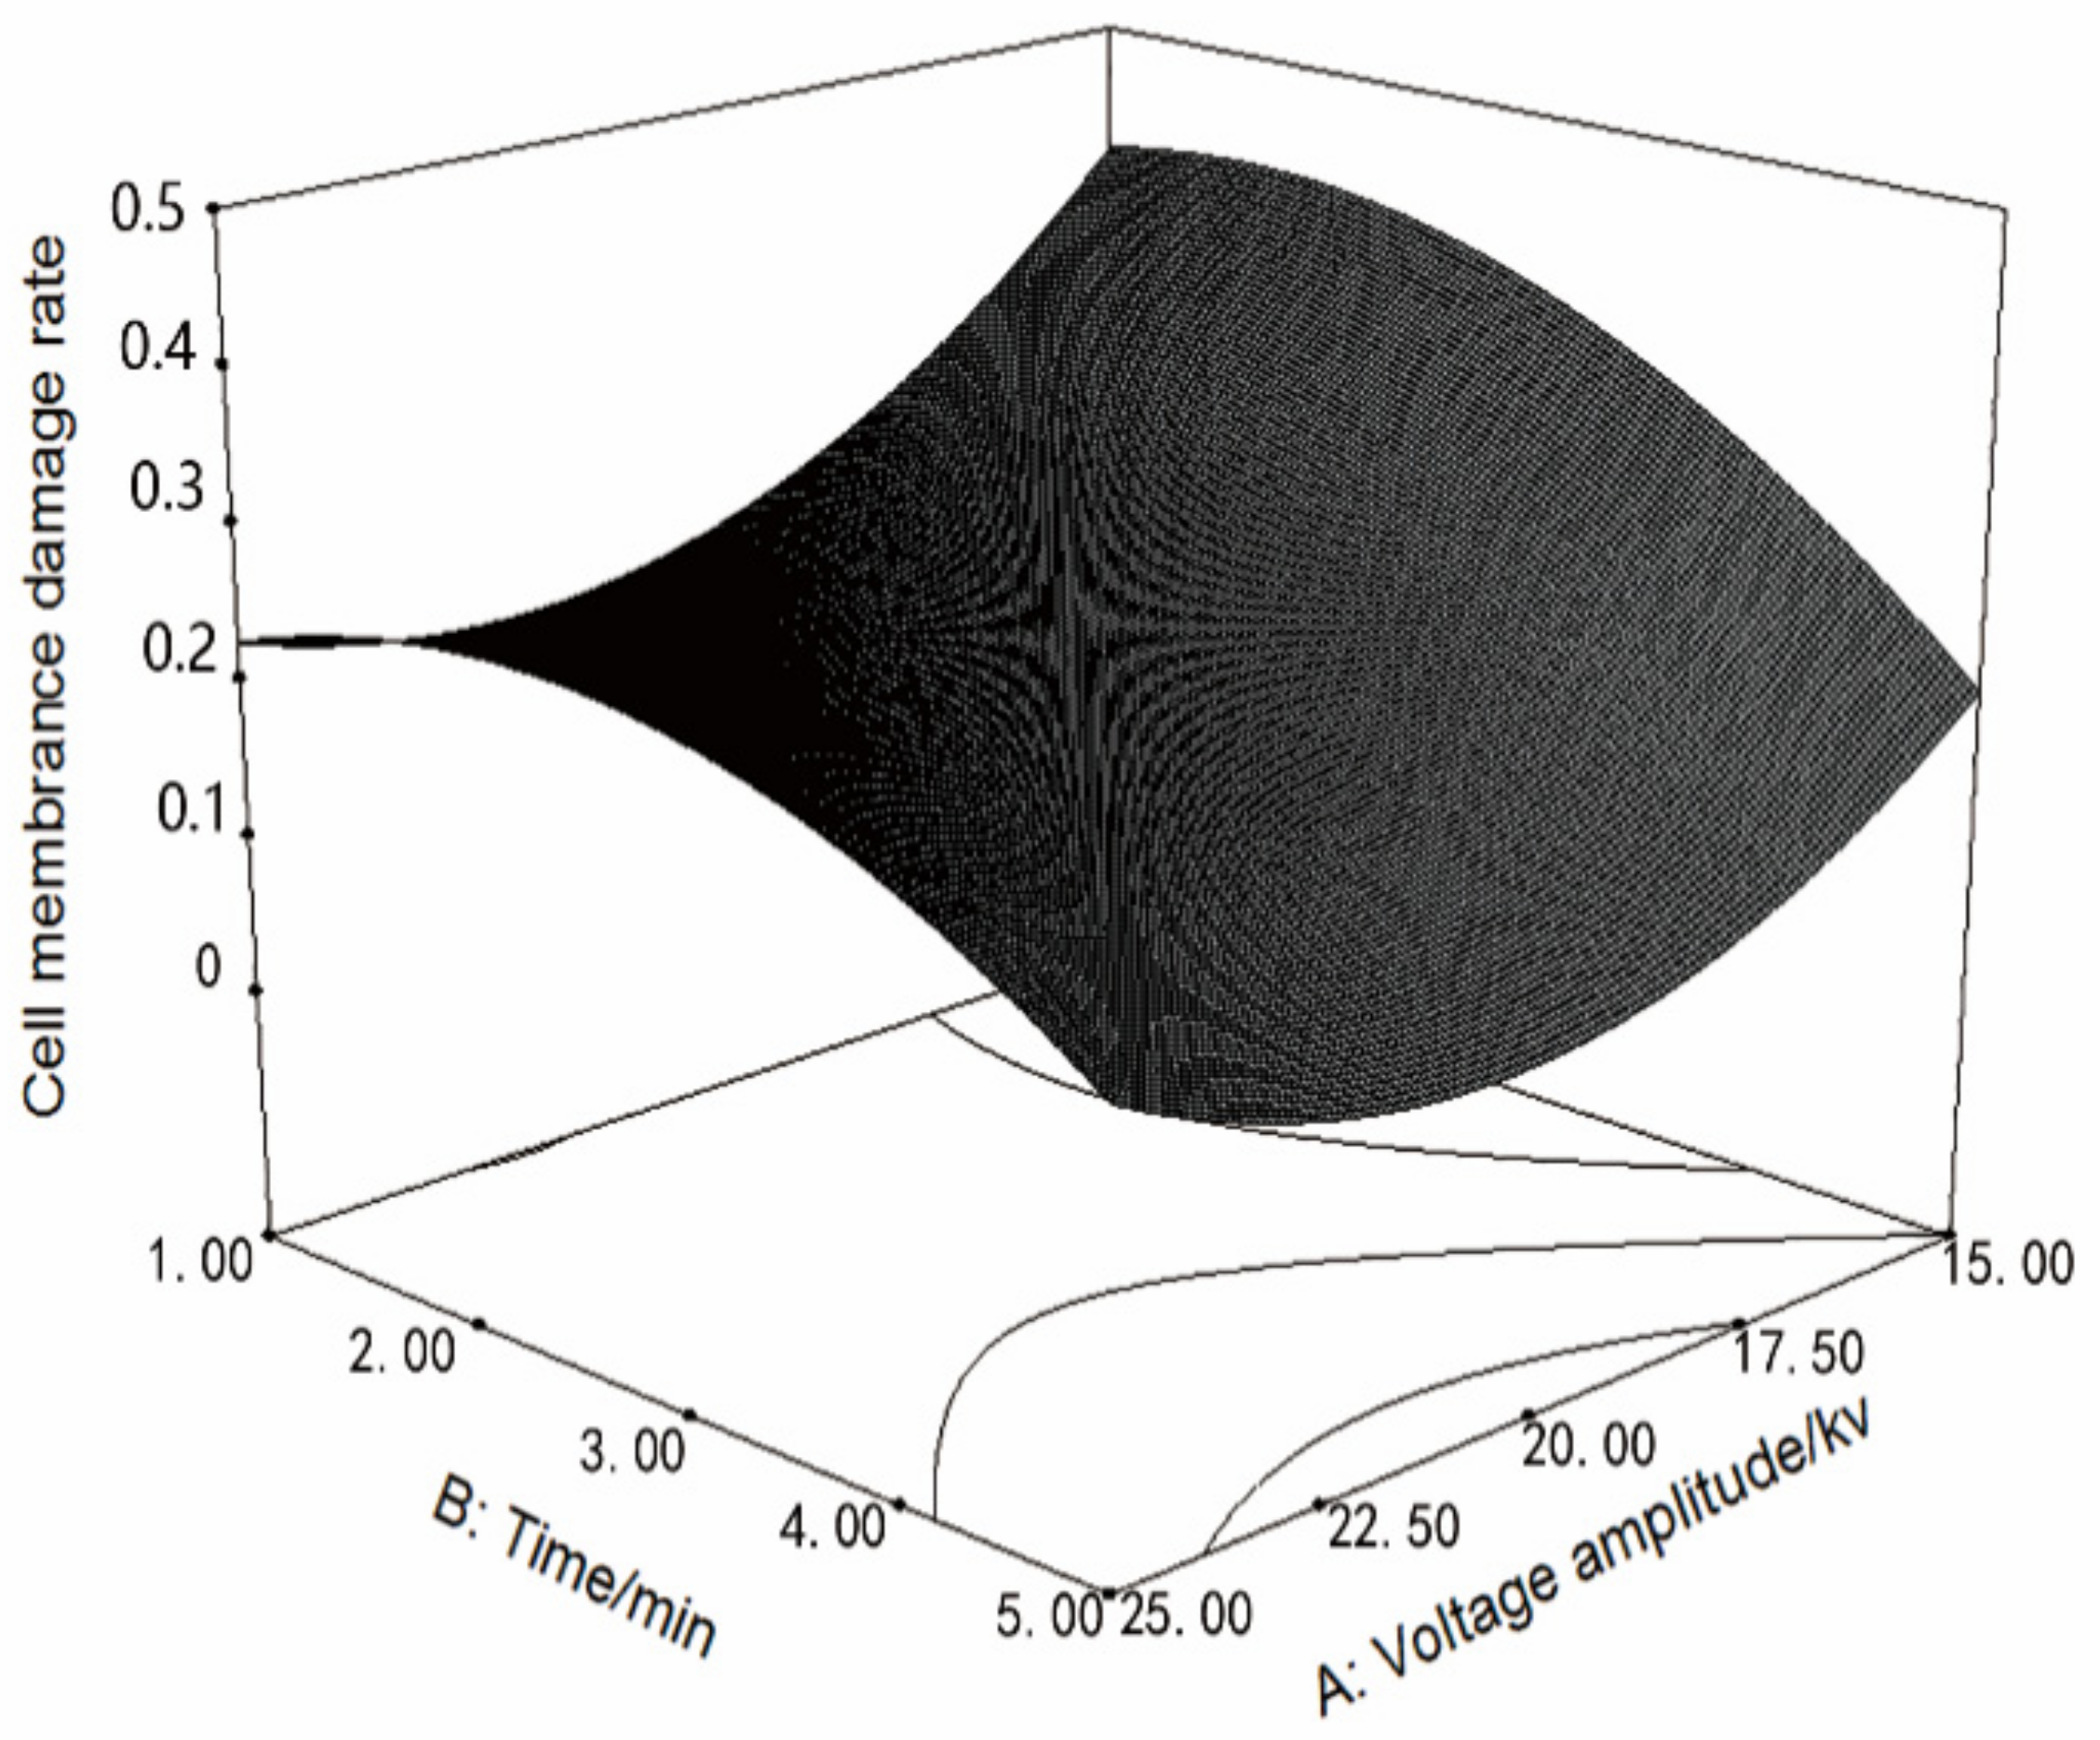
3.3.1. Analysis of the Interaction between Voltage Amplitude and Processing Time, and Its Effect on the R. solani Cell Membrane Damage Rate

Figure 2 shows the response surface of the voltage amplitude and processing time vs. the R. solani cell membrane damage rate at a pulse duration of 45 μs. When the pulse duration is at an intermediate level, the effect of increasing the voltage amplitude on the R. solani cell membrane damage rate is similar for different processing times, and the cell membrane damage rate first decreased slightly from 12.7% to 5.8%, and then increased continuously with the voltage amplitude. Under different voltage amplitudes, the effect of cell membrane damage that is caused by increasing the processing time is similar, and the rate of cell injury first increased from 22.84% to 26.53% and then decreased slightly with the processing time.
It can be seen from Table 4 that the change in the quadratic term of the voltage amplitude has a significant effect on the R. solani cell membrane damage rate (p < 0.01). When the voltage amplitude is 25 kV and the processing time is 3.83 min., the interaction between voltage amplitude and processing time is the most obvious. At this time, the cell membrane damage rate reaches 41.54%.

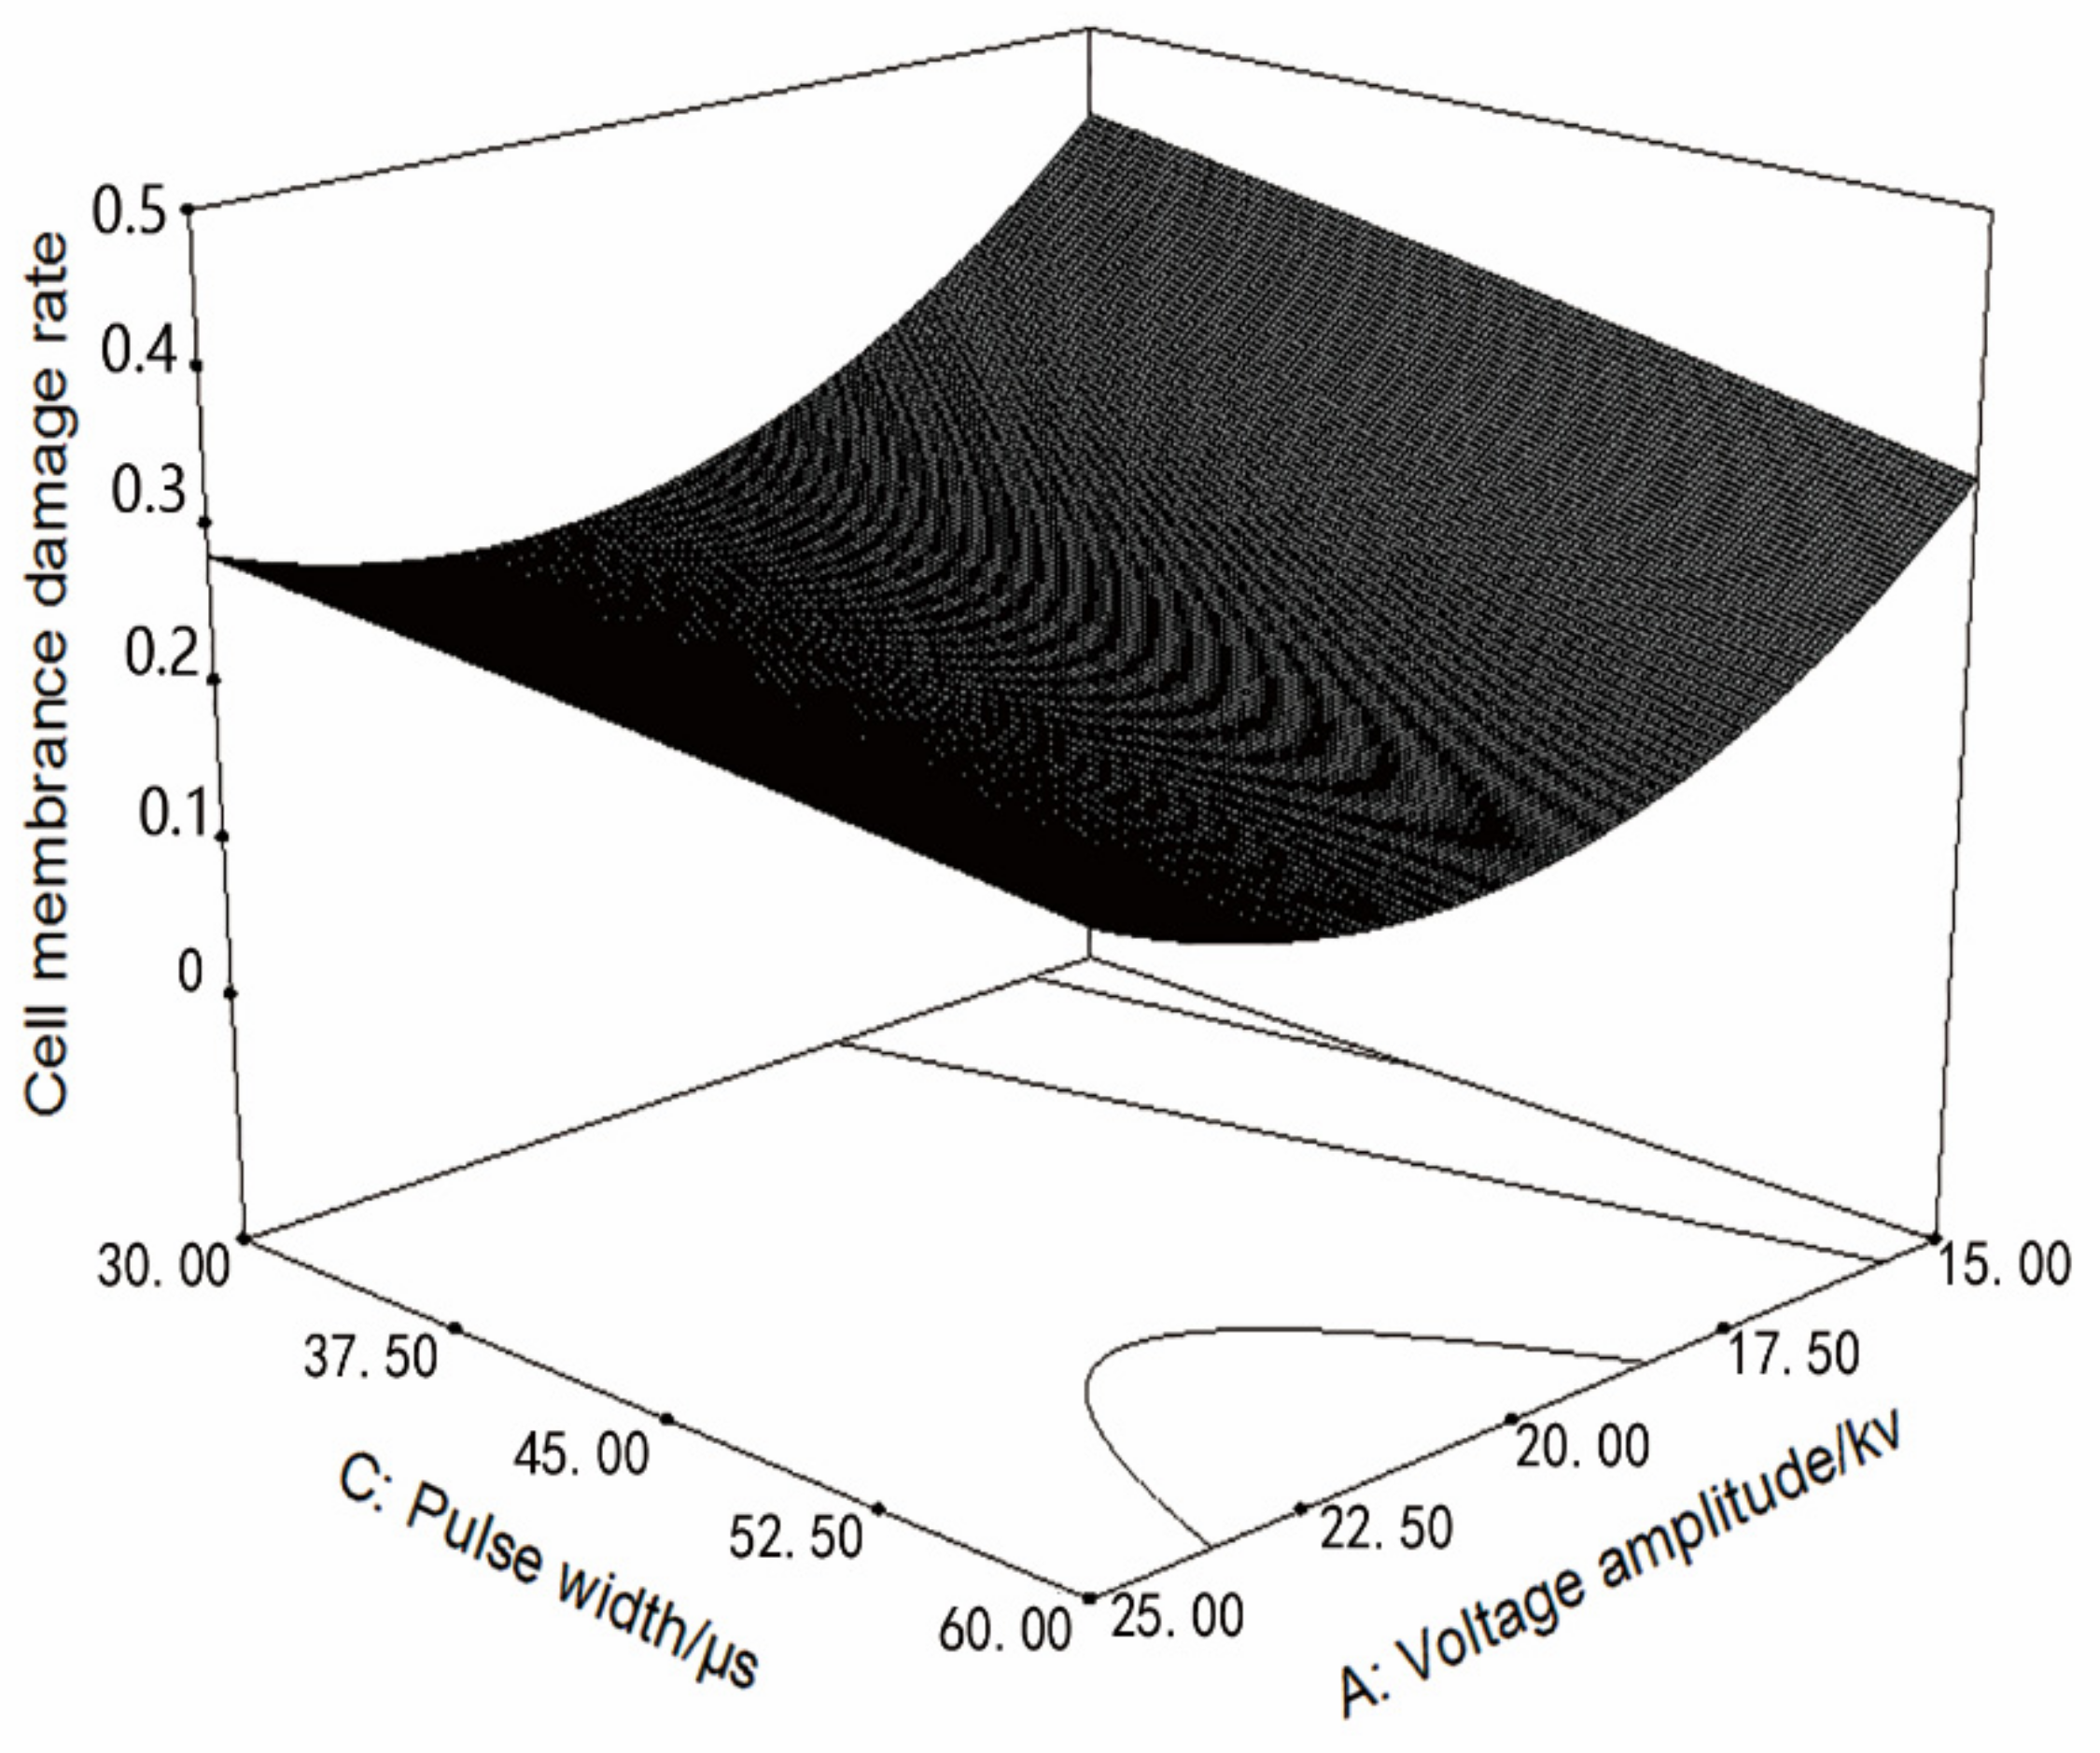
3.3.2. Analysis of the Interaction between Voltage Amplitude and Pulse Duration, and Its Effect on the R. solani Cell Membrane Damage Rate

Figure 3 shows the response surface of the voltage amplitude and pulse duration vs. the R. solani cell membrane damage rate at a processing time of 3 min. When the processing time is at an intermediate level, under different pulse durations, the effect of increasing the voltage amplitude on the R. solani cell membrane damage rate was similar for different pulse durations, and the cell membrane damage rate first decreased from 23.26% to 17.49% and then increased with the voltage amplitude.
At the same voltage amplitude, the effect of increasing the pulse duration on the R. solani cell membrane damage rate was similar, and it slowly increased with the pulse duration, but the overall effect is not obvious. It can be seen from Table 4 that the change in the quadratic term of voltage amplitude has a significant effect on the R. solani cell membrane damage rate (p < 0.01). When the voltage amplitude is 25 kV and the pulse duration is 60 µs, the interaction between the voltage amplitude and pulse duration is most obvious. At this time, the cell membrane damage rate reaches 43.48%.

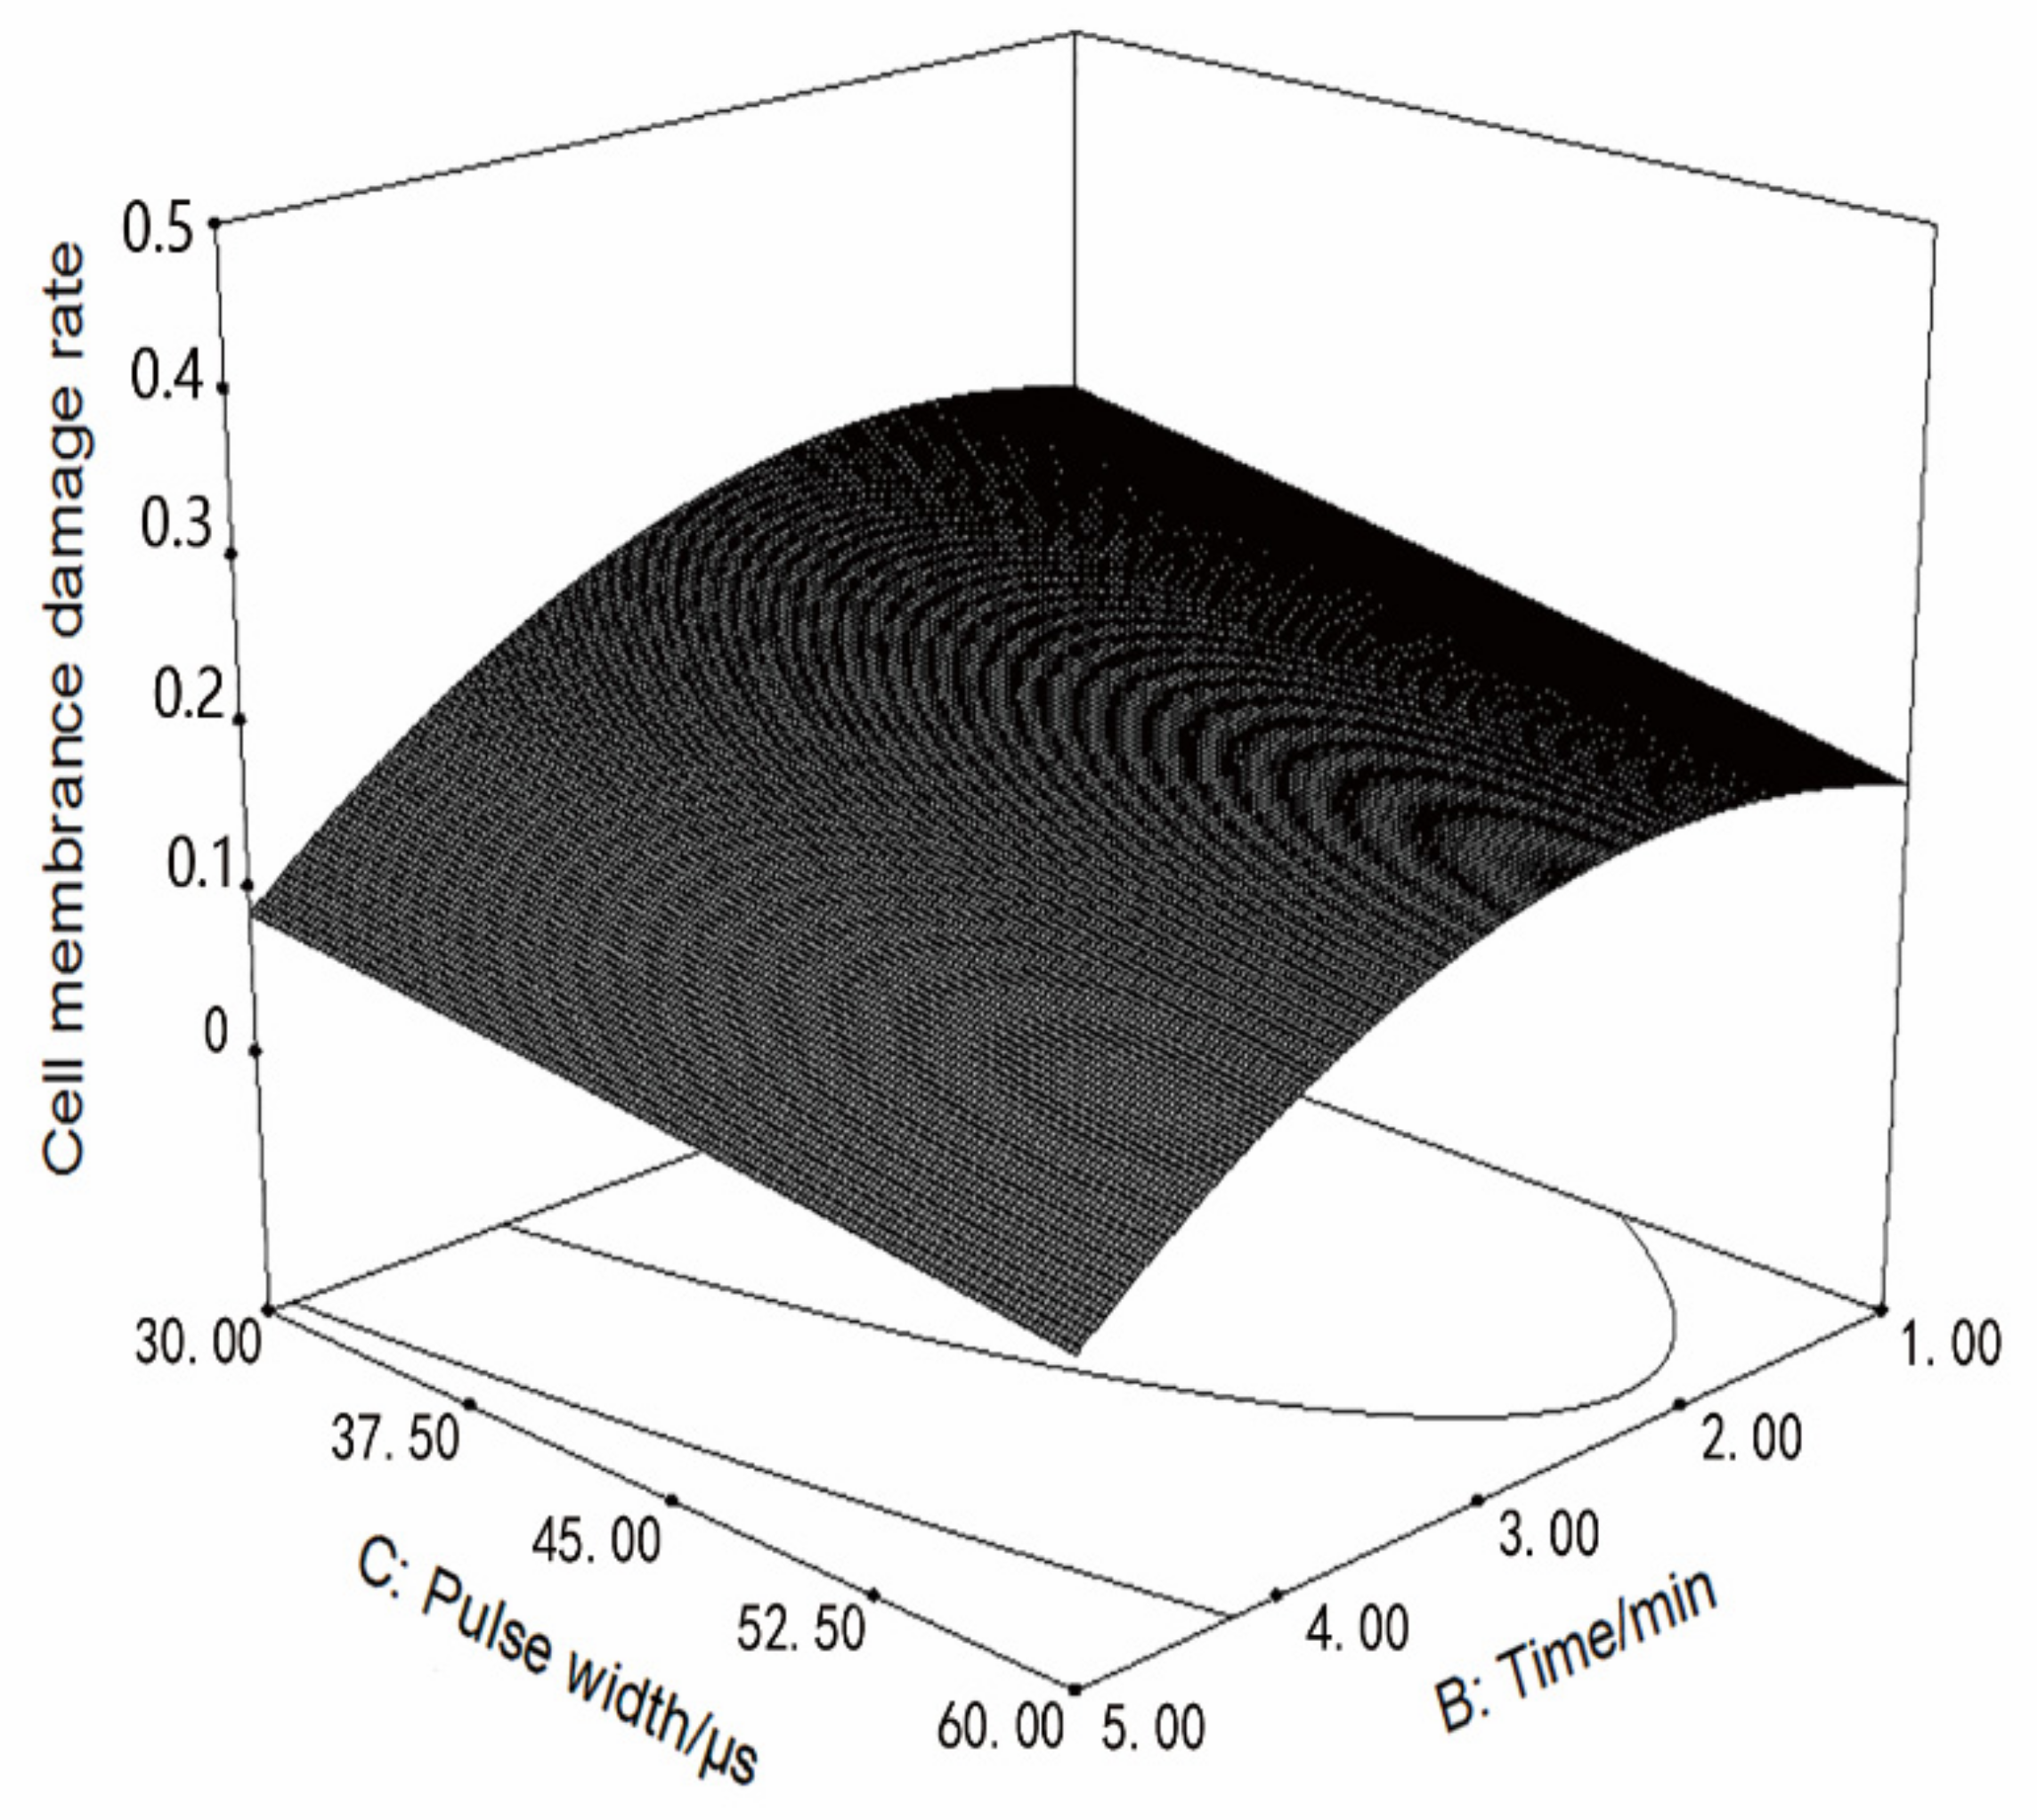
3.3.3. Analysis of the Interaction between Processing Time and Pulse Duration, and Its Effect on the R. solani Cell Membrane Damage Rate

Figure 4 shows the response surface of the processing time and pulse duration vs. the damage rate of R. solani cells under the condition of voltage amplitude of 20 kV. It shows that, when the voltage amplitude is at the intermediate level, the effect of increasing the processing time on the cell membrane damage rate of R. solani is similar under different pulse durations; and, it first increased from 26.64% to 28.1% and then slightly decreased with the processing time. Under different processing times, the effect of increasing pulse duration on the cell membrane damage rate of R. solani was similar.
As the pulse duration slowly increased, the effect was not obvious, and it can be seen from Table 4 that the change in the secondary term of processing time has a significant effect on the R. solani cell membrane damage rate (p < 0.05). When the processing time is 4.9 min., the pulse duration is 60 µs. The interaction between the voltage amplitude and pulse duration is the most obvious. At this time, the cell membrane damage rate reaches 26.35%.

3.4. Response Surface Analysis of the Effect of PEF on the Absorbance Value at 510 nm of the R. solani Mycelium Suspension

It can be seen from Table 1 that, after PEF treatment, most of the experimental samples of R. solani have significant (p < 0.05) or extremely significant (p < 0.01) differences in their absorbance values at 510 nm. The quadratic multiple regression model that was established by response surface analysis is shown in formula (3). For formula (3), it can be known from Figure 2 that its independent variable, the primary term A and the secondary term A2 are significant (p < 0.05), and the other terms are not significant. If the insignificant terms are eliminated, formula 3 can be simplified as follows:
A 510 = 4.518 × 10 3 4.542 × 10 3 * A + 7.523 × 10 3 * A 2  
Among these, A510 is the absorbance value at 510 nm after PEF treatment, measuring the amount of extracellular alkaline phosphatase that was selected under different treatment conditions to evaluate the degree of damage to the cell wall.
It can be seen from Table 4 that the F value of the model describing the absorbance value at 510 nm is 4.05, and the p value is 0.0392, which indicates that the expression between the established absorbance value at 510 nm and the experimental control condition is significant (p < 0.05) and the R value is 0.8391, indicating that the model has good fitting and high credibility. It can be seen from the data in Table 2 that the influence of the voltage and its quadratic term on the absorbance at 510 nm is extremely significant, while the influence of the quadratic term of time on the absorbance at 510 nm is not significant.

3.4.1. Analysis of the Interaction between Voltage Amplitude and Processing Time, and Its Effect on the Absorbance Value at 510 nm

Figure 5 shows the response surface of the voltage amplitude and processing time vs. the absorbance value at 510 nm of the R. solani mycelium suspension at a pulse duration of 45 μs. When the pulse duration is at an intermediate level, the effect of increasing the voltage amplitude on the suspension absorbance at 510 nm is similar for different processing times; the absorbance first decreases from 1.43% to 0.37%, and then slightly increases with the voltage amplitude.
At different voltage amplitudes, the effect of increasing processing time on the suspension absorbance value at 510 nm is similar, with the processing time increasing slowly. It can be seen from Table 4 that the change in the quadratic term of the voltage amplitude has a significant effect on the absorbance value at 510 nm of R. solani (p < 0.01). The interaction between the voltage amplitude and processing time is the most obvious when the voltage amplitude is 15 kV and the processing time is 5 min. At this point, the absorbance value reaches 0.0199.

3.4.2. Analysis of the Interaction between Voltage Amplitude and Pulse Duration, and Its Effect on the Absorbance Value at 510 nm of R. solani Mycelium Suspension

Figure 6 shows the response of the voltage amplitude and pulse duration vs. the absorbance value at 510 nm of R. solani mycelium suspension at a processing time of 3 min. The effect of increasing voltage amplitude on the suspension absorbance value at 510 nm is similar under different pulse durations when the processing time is at an intermediate level. The absorbance first decreases from 1.34% to 0.45%, and then increases with the voltage amplitude; under different voltage amplitudes, the effect of increasing the pulse duration on the suspension absorbance value at 510 nm is similar. As the pulse duration slightly increases, it decreases slowly, and the overall effect is not obvious. Additionally, it can be seen from Table 4 that the change in the quadratic term of the voltage amplitude has a significant effect on the suspension absorbance value at 510 nm (p < 0.05). When the voltage amplitude is 15 kV and the pulse duration is 38.72 μs, the interaction between the voltage amplitude and pulse duration is the most obvious. At this time, the absorbance value reaches 0.018.

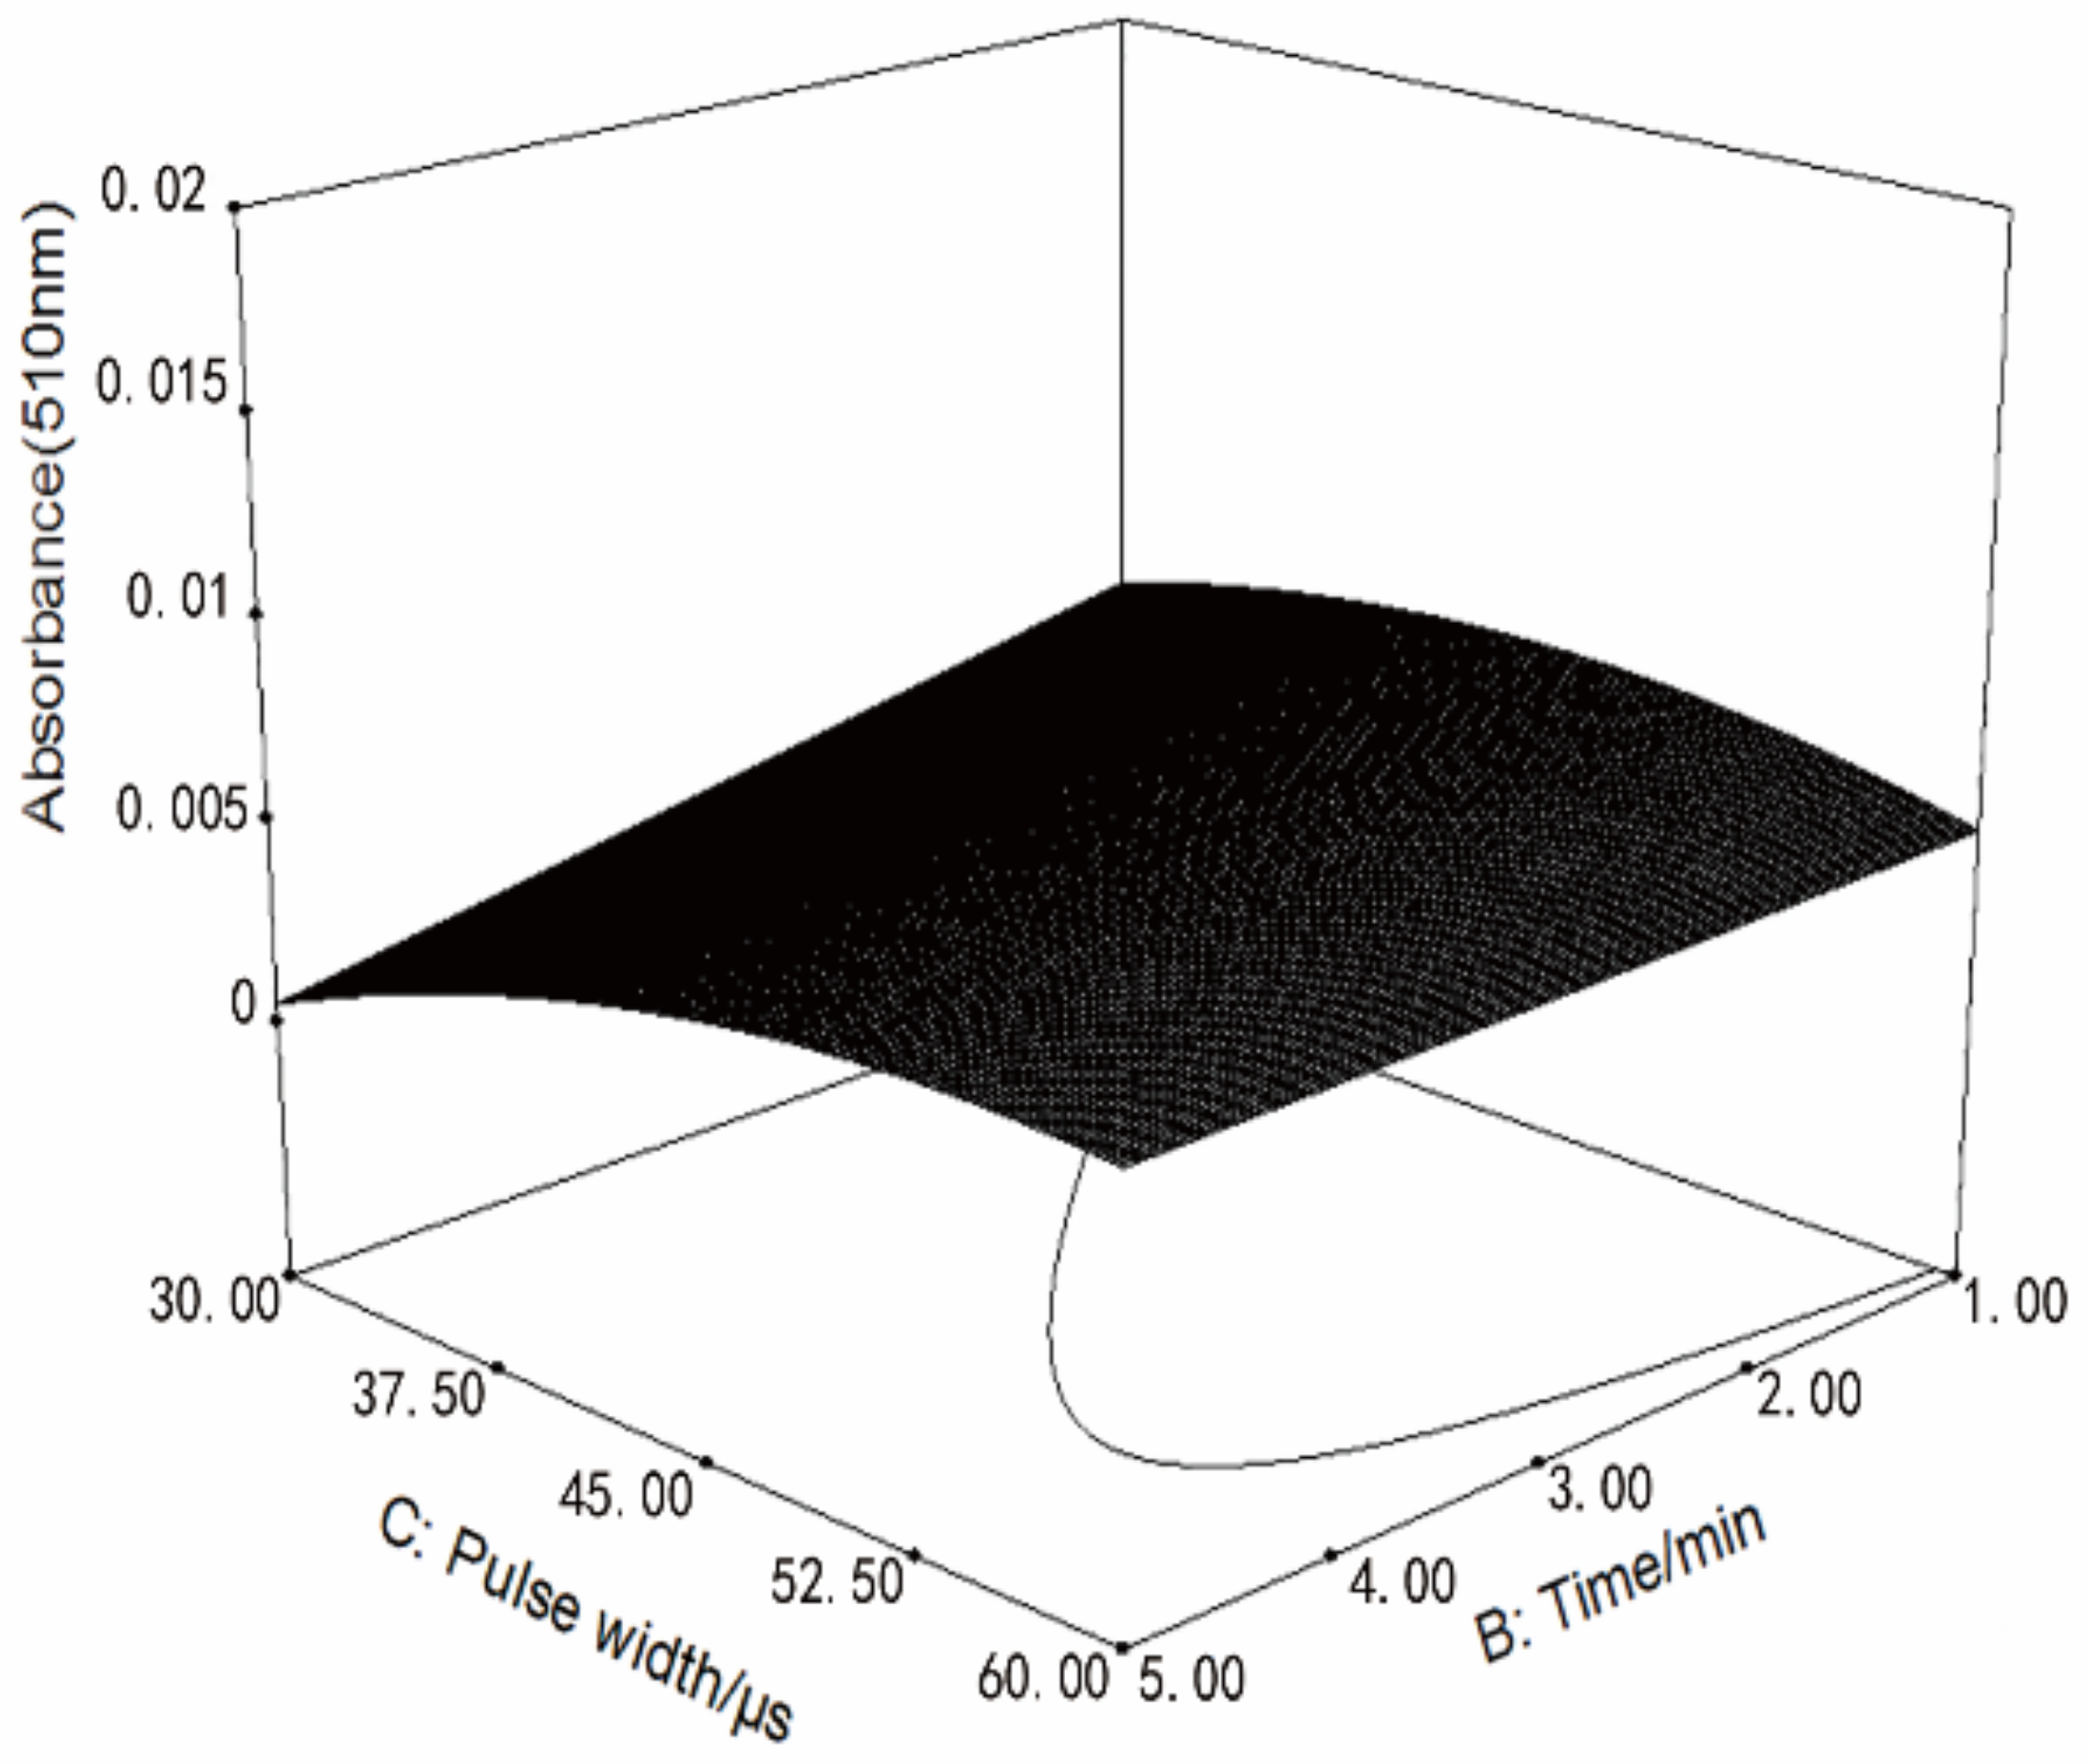
3.4.3. Analysis of the Interaction between Processing Time and Pulse Duration, and Its Effect on the Absorbance Value at 510 nm of R. solani Mycelium Suspension

Figure 7 shows the response of the processing time and pulse duration vs. the absorbance value at 510 nm of R. solani mycelium suspension at a voltage amplitude of 20 kV. The response surface image tends to be a plane under the action of pulse duration and processing time, and the amplitude of the absorbance does not change significantly. When the voltage amplitude is at an intermediate level, the effect of different pulse durations and processing times on the suspension absorbance value at 510 nm is not significant.
The absorbance increases slightly with the processing time, while it increases slightly from 0.49% to 0.62% and then decreases with increasing pulse duration (p > 0.05). The interaction between the processing time and pulse duration is obvious when the processing time is 5 min. and the pulse duration is 42.8 μs. At this time, the cell wall damage rate reaches 0.0064.

3.5. Numerical Optimisation and Verification Experiment

In the experiment using PEF to treat R. solani, the cell membrane damage rate and the change in the absorbance value at 510 nm of the mycelium suspension were used as comprehensive reference indicators, so the cell membrane damage rate and the absorbance at 510 nm of the mycelium suspension reached their maximum values to achieve the highest sterilisation rate, wherein the cell membrane damage rate and the absorbance value weight are 5:1. Using the response surface method to mathematically optimise the two-term regression mathematical model (1)–(3), the optimal PEF conditions to treat R. solani are voltage amplitude of 25 kV, a processing time of 4.62 min., and a pulse duration of 60 μs. Under these conditions, the cell damage rate of R. solani was 48.48%, and the absorbance value at 510 nm was 0.0074, which was significantly higher than that of CK (p < 0.01).
According to the results of parameter optimisation, the PEF treatment of R. solani was carried out at a pulse voltage of 25 kV, a processing time of 4.62 min., and a pulse duration of 60 μs. Under these optimal conditions, the cell damage rate of R. solani was 48.72%, which only had 0.24% error with the optimized value, and the absorbance value at 510 nm was 0.0067 in accordance with the parameter optimisation results.

4. Discussion

Nature is an electrostatically complex system, and organisms grow and propagate under the action of an electrostatic field at all times. There are certain rules of charge distribution and movement in the interior of the system, and changes in the environmental electric field, especially when an additional electric field is added, will certainly have some influence on the internal electric field of the organism, which leads to further changes in the physical structure and biochemical composition of the organism. Zimmermann [17] and Tsong [18] (Tsong 1991) showed that, when cells were exposed to external high-voltage electric fields of short duration, the potential across the cell membrane was charged by the charge movement, and the corresponding transmembrane potential was then induced inside and outside the cell membrane. When the potential difference across the cell membrane reached 1 V via the action of the electric field force, the cell damage phenomenon occurred and the cell contents overflowed. According to Figure 1, it can be observed that, after PEF treatment, a large number of adherents emerged from the cell contents, which makes the surface rough. Gulsun et al. [19], in the process of PEF treatment for the conidial germination and fungi of morphology of P.expansum, under SEM the morphological damage of expanded conidia after PEF treatment also resulted in rough surface, which was consistent with the observation in this experiment.
The factors affecting sterilisation via PEF include microbial characteristics (cell type, shape and growth stage), medium characteristics (dielectric composition, conductivity, pH value, and water activity), and PEF parameters (electric field strength, pulse frequency, pulse duration, processing temperature, and processing time) [20]. The target organism in the present study was R. solani, a non-sporophyll fungus of the Rhizoctonia genus that has strong vitality. The experiment was carried out under medium conditions in which the mycelium suspension was at a natural pH, and the conductivity value was 400 μs/cm.
There are three main arguments in favour of PEF. First, electric field strength, pulse duration, and processing time, which are three important electric field process parameters, have significant impact on the experimental results. Simonis [15] exposed yeast cells to PEF with a field strength (E) of up to 220 kV/cm, and analysed the effects of square pulses with different pulse durations (τ = 10−90 ns) and different pulse numbers (pn = 1−5). Studies have shown that PEF can induce cell death, depending on the PEF parameters, and this cell death increases with increasing E, τ, and pn. It can be seen that electric field strength, processing time, and pulse duration play important roles in the R. solani cell damage effect. The data gathered in the present study suggest that, under the model of a voltage quadratic term, the p value of cell membrane damage rate is 0.0092 (p < 0.01), which is extremely significant (that is, the electric field strength significantly affects the cell membrane damage rate of R. solani). Zakhem’s [21] argument in favour of this paper runs, as follows: the experiment was carried out under PEF conditions of pulse duration t = 10−5 s, pulse repetition time Δt = 10−2 s, pulse number n = 20, and a temperature of 25 °C. When the electric field strength is increased from 3 to 7.5 kV/cm, the conductivity of the yeast suspension increased with the electric field strength, and finally stabilised. Zhang [22] combined dual fluorescence staining and flow cytometry to characterise the effect of PEF electric field strength on the Chlorella cell breakage rate. It was found that electric field strength is the key factor affecting the effect of PEF. However, pulse duration, pulse repetition frequency, etc. have little effect on the treatment of Chlorella. When the electric field strength was increased from 2.5 to 5.0 mV/m, the cell disruption rate of Chlorella sp. under 20 mS/m conductivity increased from 17.21% to 83.29%. Therefore, the degree of cell membrane damage increases with the increase in electric field strength, and electric field strength is an important factor that significantly affects the rate of microbial cell membrane damage.
In addition, the processing time also affects the R. solani cell membrane damage rate. From the experimental results, the p value of the cell membrane damage rate was 0.0068 (p < 0.01), and the effect was extremely significant. Our results are consistent with the findings of Suchanek [23], who found that in the samples receiving 1, 5, and 25 pulses, 5 and 25 pulses were more effective, which demonstrated that the more the number of pulses are applied to the sample, the greater the damage to the cell. That is, increasing the processing time can affect the damage degree of the sample cells (Processing time = Pulse number x Pulse duration; processing time is linear with the number of pulses), which is consistent with our experimental results. Furthermore, the effect of pulse duration on microbes is relatively complicated. The p value of the cell membrane damage rate in this experimental pulse duration model is 0.0996 (p > 0.05). Thus, the effect of pulse duration on the cell membrane damage rate of R. solani is not significant, which was consistent Zhang’s findings. However, some studies have shown an inverse relationship. Vito [24] studied the electric field strength E between 100 and 400 V/cm, the pulse duration (i, was 10, 100, and 1000 μs, and the inter pulse duration (Δt) was 100 μs. The samples with the same PEF processing time showed significantly higher damage efficiency at larger pulse durations, and the pulse duration had a notable effect on the microorganisms. We speculate that the reason for the influence of pulse duration might be because the pulse duration has a specific threshold; when the pulse duration increases to a certain extent (that is, exceeds the threshold value), the effect of the experiment is significant, while the increase in the pulse duration of this experiment is small, so the impact is not significant.
In the present study, on applying a PEF, the substances in the cells (especially the electrolytes) were expelled, and the conductivity of the mycelium suspension changed accordingly. The degree of damage of the plasma membrane was reflected by the changes in conductivity. In addition, the absorbance value of mycelium suspension at 510 nm was determined by measuring the amount of extracellular alkaline phosphatase eluted under different treatment conditions, so as to determine the degree of cell wall damage. The results showed that the absorbance of the R. solani suspension was mainly related to the change in electric field strength (voltage amplitude) (p < 0.01), while the pulse duration and processing time had little effect on the absorbance (p > 0.05). The increase in the absorbance indicates that the PEF treatment causes ‘cell damage effects’ on the cell membrane of R. solani, which in turn causes cell death. It is well known that the electric field strength and total processing time are the main factors determining microbial inactivation following PEF treatment [25]. In the present study, the conductivity method detected the effect of the electric field strength and PEF processing time on R. solani cell damage. However, only the effects of electric field strength were detected by the absorbance method, which influenced the R. solani cell damage. The conductivity method more accurately revealed the cell damaging effects of the PEF process parameters on the mycelium suspension. As the absorbance method is used to determine the initial concentration of the mycelium suspension, when the absorbance cannot exceed a certain threshold, the measured data have a good linear relationship, and the absorbance value accurately reflects cell loss, while there is no such restriction for determining cell damage by detecting conductivity values. In addition, when the cell volume of R. solani is too large, such that it easily sinks in liquid medium, there is a large error in measuring the biomass of the microorganism by the absorbance method. Thus, through the above experimental study, we found that the electrical conductivity of R. solani treated by PEF was more effective than the absorbance value in reflecting the cell damaging effects of PEF.
According to the results, electroporation that is induced by the PEF was not perfect; however, it could be optimised. The pulse parameters can be appropriately changed, such as increasing the voltage amplitude, prolonging the processing time, increasing the pulse duration, etc., to achieve a better sterilisation effect. Antibiotic and fungicidal chemicals and PEF treatments may also be used together to achieve optimal sterilisation results. For example, Vadlamani [26] combines tobramycin at concentrations greater than 0.2 μg/mL with a aureus 20 kV/cm pulse sequence with a tobramycin concentration of 0.2 μg/mL, while a concentration of 2 μg/mL resulted in a 1.5 log synergistic effect. For the 30 and 40 kV/cm pulse sequences, all 2 and 20 μg/mL doses of tobramycin sympathetically increased with increasing concentrations, which demonstrated that Gram-positive bacteria (S. aureus) and Gram-negative bacteria (E. coli) can be synergistically inactivated in the presence of chemicals and PEF. The combination of chemicals and PEF assisted systems have good disease prevention performance, which can greatly reduce the amount of chemicals and meet the requirements of food health. It also serves as a theoretical basis and research direction for the next step to study high-efficiency sterilizing agricultural facilities. With the development and in-depth study of the R. solani killing technology with PEF and plant protection machinery, PEF sterilization technology will become an efficient and reliable sterilizing method, and it has broad market prospects and value in the field of rice plant protection.

5. Conclusions

  • It can be seen from the SEM image that the PEF with the voltage amplitude of 25 kV, the processing time of 4.62 min., and the pulse duration of 60 μs acts on Rhizoctonia solani, destroyed the morphological structure and accompanied the overflow of cell contents, which indicates that PEF can effectively destroy the structure of cell membrane and cell wall.
  • The cell membrane damage was detected by measuring the conductivity value of the mycelium suspension. It was found that the cell membrane damage rate of Rhizoctonia solani was mainly related to the voltage amplitude and processing time (p < 0.01), while the current pulse duration of 30–60 μs was not significant (p > 0.05).
  • The cell wall damage was detected by measuring the change of absorbance at 510 nm, and it was found that the absorbance value at 510 nm of Rhizoctonia solani was mainly related to the change of electric field strength (voltage amplitude) (p < 0.01), while the current pulse duration of 30–60 μs and the current processing time of 1–5 min. was not obvious (p > 0.05).
  • The optimal treatment conditions for PEF is as following: voltage amplitude 25 kV, processing time 4.62 min., and pulse duration 60 μs. the cell damage rate of was 48.72%, and the absorbance value at 510 nm was significantly higher than that of CK (p < 0.01). When compared with CK, the cell damage rate of Rhizoctonia solani was 47.91%, and the absorbance value at 510 nm was 0.0067, which were significantly higher than CK (p < 0.01).

Author Contributions

Conceptualization, X.F. and H.L.; methodology, X.F.; software, Q.J. and M.Z.; validation, X.F., W.Y. and J.J.; formal analysis, Q.J.; investigation, H.L..; resources, J.J.; data curation, Q.J.; writing—original draft preparation, Q.J and J.J..; writing—review and editing, X.F. and M.Z.; funding acquisition, X.F. and H.L.

Funding

This research was funded by National Natural Science Foundation of China (Grant No. 51507081), the Fundamental Research Funds for the Central Universities (KJQN201623), the National Key Research and Development Program of China (2017YFD0701300).

Conflicts of Interest

The authors declare no conflict of interest.

References

  1. Joana, B.D.A.; Michelangelo, S.; Marcello, Z.; Wang, W.; Jiang, D.; Li, S.; Jin, M.; McDonald, B.A.; Ceresini, P.C. Genetic structure of populations of the rice-infecting pathogen Rhizoctonia solani AG-1 IA from China. Phytopathology 2009, 99, 1090–1099. [Google Scholar]
  2. Buggenhout, J. Impact of Brown Rice Parboiling on Milling Breakage Susceptibility. Ph.D. Thesis, Catholic University of Leuven, Leuven, Belgium, 2013. [Google Scholar]
  3. Cheng, S.; Hu, P. Development Strategy of Rice Science and Technology in China. Agric. Prod. Process. 2009, 22, 223–226. [Google Scholar]
  4. Savary, S.; Teng, P.S.; Willocquet, L.; Nutter, F.W.J. Quantification and modeling of crop losses: A review of purposes. Ann. Rev. Phytopathol. 2006, 44, 89–112. [Google Scholar] [CrossRef]
  5. Laha, G.S.; Venkataraman, S. Bio-inoculants to control rice sheath blight disease. J. Mycol. Plant Pathol. 2001, 31, 124–125. [Google Scholar]
  6. Liu, W.; Yang, C.; Zou, J.; Song, J. Advance in biological control of rice sheath blight. J. South. Agric. 2009, 40, 512–516. [Google Scholar]
  7. Kayalvizhi, V.; Pushpa, A.J.S.; Sangeetha, G.; Antony, U. Effect of pulsed electric field (PEF) treatment on sugarcane juice. J. Food Sci. Technol. 2016, 53, 1–9. [Google Scholar] [CrossRef]
  8. Sharma, P.; Bremer, P.; Oey, D.W.E. Bacterial inactivation in whole milk using pulsed electric field processing. Int. Dairy J. 2014, 35, 49–56. [Google Scholar] [CrossRef]
  9. Donsiì, G.; Ferrari, G.; Maresca, P. Pulsed high pressure treatment for the inactivation of Saccharomyces cerevisiae: The effect of process parameters. J. Food Eng. 2007, 78, 984–990. [Google Scholar] [CrossRef]
  10. Coustets, M.; Ganeva, V.; Galutzov, B. Millisecond duration pulses for flow-through electro-induced protein extraction from E. coli and associated eradication. Bioelectrochemistry 2015, 103, 82–91. [Google Scholar] [CrossRef]
  11. Wang, R.; Liao, M.; Kong, F.; Fang, T.; Zou, J. Research on Sterilization of Pulsed Generator in HPEF Fixed Chamber. High Volt. Eng. 2007, 33, 82–85. [Google Scholar]
  12. Mazurek, B.; Lubicki, P.; Staroniewicz, Z. Effect of short HV pulses on bacteria and fungi. IEEE Trans. Dielectr. Electr. Insul. 1995, 2, 418–425. [Google Scholar] [CrossRef]
  13. Zu, G.; Kong, F.; Liu, Y.; Ji, Y.; Dan, G.; Zou, J. Inactivation Effects of High Power Pulsed Field on th Microorganisms. High Volt. Eng. 2004, 30, 47–49. [Google Scholar]
  14. Sennikov, P.G. Kinetics of sterilization of Lactobacillus brevis cells by the application of high voltage pulses. Biotechnol. Bioeng. 2010, 40, 1412–1420. [Google Scholar]
  15. Simonis, P.; Kersulis, S.; Stankevich, V.; Kaseta, V.; Lastauskienead, E.; Stirkead, A. Caspase dependent apoptosis induced in yeast cells by nanosecond pulsed electric fields. Bioelectrochemistry 2017, 115, 19–25. [Google Scholar] [CrossRef]
  16. Kumar, R.; Bawa, A.S.; Kathiravan, T.; Nadanasabapathi, S. Optimization of pulsed electric field parameters for mango nectar processing using response surface methodology. Int. Food Res. J. 2015, 22, 1353–1360. [Google Scholar]
  17. Zimmermann, U. Electrical breakdown, electropermeabilization and electrofusion. Rev. Physiol. Biochem. Pharmacol. 1986, 105, 176–256. [Google Scholar]
  18. Tsong, T.Y. Electroporation of cell membranes. Biophys. J. 1991, 60, 297–306. [Google Scholar] [CrossRef] [Green Version]
  19. Gulsun Akdemir, E.; Tok, F.M.; Soylu, E.M.; Soylu, S. Inactivation of Penicillum expansum in sour cherry juice, peach and apricot nectars by pulsed electric fields. Food Microbiol. 2008, 25, 662–667. [Google Scholar]
  20. Wang, M.S.; Wang, L.H.; Bekhit, A.E.A.; Yang, J.; Hou, Z.P.; Wang, Y.Z.; Dai, Q.Z.; Zeng, X.A. A review of sublethal effects of pulsed electric field on cells in food processing. J. Food Eng. 2017, 223, 32–41. [Google Scholar] [CrossRef]
  21. Zakhem, H.E.; Lanoisellé, J.L.; Lebovka, N.I.; Nonus, M.; Vorobieva, E. The early stages of Saccharomyces cerevisiae yeast suspensions damage in moderate pulsed electric fields. Colloids Surf. B Biointerfaces 2006, 47, 189. [Google Scholar] [CrossRef]
  22. Zhang, R.; Fu, X.; Wan, M.R. Influence of High Voltage Pulsed Electric Fields on Disrupture of Chlorella. High Volt. Eng. 2016, 42, 152–155. [Google Scholar]
  23. Suchanek, M.; Olejniczak, Z. Low field MRI study of the potato cell membrane electroporation by pulsed electric field. J. Food Eng. 2018, 231, 54–60. [Google Scholar] [CrossRef]
  24. Vito, F.D.; Ferrari, G.; Lebovka, I.N.; Shynkaryk, N.V.; Vorobiev, E. Pulse Duration and Efficiency of Soft Cellular Tissue Disintegration by Pulsed Electric Fields. Food Bioprocess Technol. 2008, 1, 307–313. [Google Scholar] [CrossRef]
  25. Unal, R.; Yousef, A.E.; Dunne, C.P. Spectrofluorimetric assessment of bacterial cell membrane damage by pulsed electric field. Innov. Food Sci. Emerg. Technol. 2002, 3, 247–254. [Google Scholar] [CrossRef]
  26. Vadlamani, A.; Detwiler, D.A.; Allen, L. Garner Synergistic bacterial inactivation by combining antibiotics with nanosecond electric pulses. Appl. Microbiol. Biotechnol. 2018, 22, 1–8. [Google Scholar]
Figure 1. Scanning Electron Microscope (SEM) images of R. solani (A) without PEF treatment and (B) after PEF treatment (the experimental condition is at 20 kV, 3 min., 45 μs).
Applsci 09 04706 g001
Figure 2. Response surface analysis of voltage amplitude and processing time.
Applsci 09 04706 g002
Figure 3. Response surface analysis of voltage amplitude and pulse duration.
Applsci 09 04706 g003
Figure 4. Response surface analysis of processing time and pulse duration.
Applsci 09 04706 g004
Figure 5. Response surface analysis of voltage amplitude and processing time.
Applsci 09 04706 g005
Figure 6. Response surface analysis of voltage amplitude and pulse duration.
Applsci 09 04706 g006
Figure 7. Response surface analysis of processing time and pulse duration.
Applsci 09 04706 g007
Table 1. Biological samples and instruments.
Biological Samples and InstumentModelProducer
R. solaniAG-1-IAFood College at Nanjing Agricultural University
a high-pressure sterilising potDY04-13-43-00 (LS-30)Shanghai Boxun Industry & Commerce Co., Ltd. (Shanghai, China).
a oscillating incubatorBSD-250Shanghai Boxun Instrument Co., Ltd. (Shanghai, China)
a conductivity metreDDS-307Shanghai INESA Scientific Instrument Co., Ltd._Instrument and meter (Shanghai, China)
an UV-VIS spectrometer752 NShanghai Youke Instrument Co., Ltd. (Shanghai, China)
a desktop ultra-clean working tableJJ-CJ-1F/1FDSuzhou Jinjing Purification Equipment Technology Co., Ltd. (Suzhou, Jiangsu Province, China)
a low-speed centrifugeTD5A-WSXiangying Centrifuge Co., Ltd. (Changsha, Hunan Province, China)
an electronic balanceBSMShanghai Zhuojing Electronic Technology Co., Ltd. (Shanghai, China)
a scanning electron microscopeSU8020Hitachi manufacturing Co. Ltd. (Shanghai, China)
Table 2. Pulsed electric field (PEF) orthogonal test factor level table.
Factor
LevelVoltage Amplitude/kvTime/min.Pulse Duration/μs
−115130
020345
125560
Table 3. PEF treatment orthogonal experiment results.
Experiment NumberVoltage Amplitude/kVTime/min.Pulse Duration/μsCell Membrane Damage Rate510 nm Absorbance
CK00000
1153300.213 **0.017 **
2205300.132 *0.003
3203450.269 **0.00567 **
4201300.0863 *0.003
5201600.122 *0.00233
6203450.234 *0.00733 **
7205600.20 8*0.00633
8151450.09140.0173 *
9253600.462 *0.00767 *
10251450.143 **0.00567 *
11203450.168 **0.00467
12155450.284 **0.0227 **
13255450.457 **0.00567 **
14153600.289*0.00933
15203450.213 **0.00367
16253300.330 **0.011 **
17203450.233 *0.00467
Note: ‘*’ in the table represents significance as p < 0.05; ‘**’ in the table represents extremely significance as p < 0.01.
Table 4. Response surface variance analysis results.
SourceCell Membrane Damage Rate510 nm Absorbance
F-Valuep-ValueF-Valuep-Value
Model5.390.0186 *4.050.0392 *
A-amplitude9.250.0188 *13.370.0081 **
B-time14.400.0068 **0.880.3788
C-pulse duration3.600.09960.700.4293
AB1.040.34070.580.4726
AC0.220.65360.380.5569
BC0.120.74330.320.5870
A212.680.0092 **19.750.0030 **
B28.190.0243 *0.00021250.9888
C20.0120.91610.830.3929
Lack of Fit4.680.085113.650.0144
R20.87390.8391
Note: ‘*’ in the table represents significance as p < 0.05; ‘**’ in the table represents extremely significance as p < 0.01; V is pulsed voltage, kV; t is time, min; PW is pulse duration, μs.

