
Geophysical Monitoring of Leachate Injection in Pretreated Waste Landfill


1
Department of Environment, Land and Infrastructure Engineering, Politecnico di Torino, Corso Duca degli Abruzzi 24, 10129 Torino, Italy
2
Department of Applied Science and Technology, Politecnico di Torino, Corso Duca degli Abruzzi 24, 10129 Torino, Italy
*
Author to whom correspondence should be addressed.
Appl. Sci. 2023, 13(9), 5661; https://doi.org/10.3390/app13095661
Submission received: 23 March 2023
/
Revised: 25 April 2023
/
Accepted: 30 April 2023
/
Published: 4 May 2023
(This article belongs to the Special Issue Advanced Methods and Practices for the Management of Biogas, Leachate, and Post-closure of Landfills)
Abstract
:Landfill leachate recirculation is applied to manage the landfill as a bioreactor to enhance biogas production, limiting the impact due to greenhouse gas emissions and optimizing the energy recovery from biogas. This study deals with the geophysical monitoring of the leachate recirculation within the waste of a pretreated waste landfill. For this aim, electrical resistivity tomography (ERT) was adopted, detecting the main distribution of moisture within the waste both through the surface and through several boreholes. The electrical resistivity of waste mainly depends on water content, leachate salinity and temperature. The method is sensitive to the transient phenomena associated with leachate flow within the waste; moreover, the ERT long-term monitoring data suffer from anomalous and unexpected polarization phenomena induced by the measurements themselves. Results demonstrated the reliability of this approach to qualitatively detect the landfill volume affected by the leachate circulation. The effects of moisture changes by leachate infiltration on biogas production are still challenging, notwithstanding a positive effect on methane concentration in biogas itself is evident.
1. Introduction
A landfill bioreactor is a waste treatment concept consisting of speeding up the biodegradation of landfilled waste by optimizing its moisture content through leachate recirculation [1,2,3,4,5].
The objective is to control the pre-treated biodegradable waste moisture using efficient and monitored water injection to achieve the same overall biogas quantity in a shorter time than in a conventional landfill. In other words, leachate recirculation is useful to exploit the biodegradable matter to its maximum extent and give the best yield of biogas. Compared to conventional landfill management, the following benefits of bioreactor landfills can be considered: (1) a quicker stabilization of biodegradable content can be achieved (10 to 15 years compared to 30 to 100 years with classical landfilling management), shortening the environmental impact due to biogas emission and collection; (2) the biogas production period can be shortened and the biogas production concentrated, thus providing a significant improvement of energy recovery; (3) when the leachate recirculation is adopted, the environmental hazard is reduced because the volume of leachate sent to treatment is reduced, thanks to the liquid retention by the waste itself.
The benefits (1) and (2) have an evident relevance to reducing diffused emissions of greenhouse gases, such as carbon dioxide and methane.
To optimize biodegradation, the waste must be maintained at a nearly constant water content suitable for biological processes. However, pre-treated waste is usually too dry (moisture around 10–15% by weight) to guarantee optimal biodegradation. The fluid required to obtain optimal conditions can be supplied either by leachate recirculation or rainwater infiltration. Moreover, the leachate recirculation can make the spatial distribution of the indigenous microflora involved in the biogas generation process uniform.
Especially in hot and dry climate areas, biodegradation of municipal solid waste in landfills is limited by moisture. Therefore, supplying adequate water quantity is crucial to enhancing bacterial activity and biogas production. Most of the conventional landfills reach moisture contents of 20–30% by weight, which is below the optimal range for waste biodegradation, around 40–70% by weight [6]. To achieve optimum moisture level in bioreactor landfills, typically described as moisture content at or above field capacity (40–70% by weight), water addition is required; that is to say, waste hydration must be carried out.
The choice of the proper recirculation technique (vertical wells or horizontal pipeline network) is based on the assessment of its performance, which can be roughly determined by measuring the water content inside the influence zone of the injection system [7,8].
The optimal performance and regulation of the frequency of leachate injection is based on the moisture content. The monitoring of the distribution of moisture content could be addressed by geophysical methods; most of them are based on the measurements and interpretation of electrical and electromagnetic parameters, such as electrical conductivity and polarizability, or electrical permittivity [9,10]. Methods such as neutron probes or time domain reflectometry (TDR) sensors provide punctual measurements of the fluid content and cannot be representative of the heterogeneous waste material [9,11,12].
The most adopted method is electrical resistivity tomography (ERT), which allows one to detect the distribution of the electrical conductivity on a 2D section or to map it on a 3D iso-volume [13,14,15,16,17,18,19]. The non-intrusive, non-destructive and 3-dimensional response of the ERT method thus appears to be suitable for the study of the propagation of the leachate through the waste landfill.
This study aimed to investigate the feasibility to monitor the leachate recirculation in a portion of a real-scale landfill for pretreated wastes by ERT and time-lapse inversion. At the same time, the biogas production and leachate properties were monitored, comparing the data with and without leachate recirculation.
2. Materials and Methods
The experimental study was performed in a landfill in northwest Italy. The landfill is composed of two hydraulically independent cells filled with pre-treated wastes: each cell has its independent systems for biogas and leachate extraction.
The work was organized into the following parts:
- preliminary geophysical characterization of the waste material in the uppermost part of the landfill;
- application of electrical resistivity tomography in time-lapse modality to estimate the hydraulic properties of the waste;
- long-term monitoring of the leachate recirculation.
ERT is a non-destructive method where the measurements are performed on the surface of the media through several electrodes. An electrical current is injected into the media through two electrodes, and a set of electrodes measures the resulting electrical potential. Several electrical arrays can be adopted based on the different ways to mutually arrange the current and voltage electrodes; the array also differs according to a different sensitivity of the measurements to the observed volume.
The Wenner and Schlumberger array is more sensitive to vertical variations of the electrical potential, while the dipole–dipole array is better suggested to detect lateral changes in the observed parameters. This issue has been previously demonstrated according to a theoretical point of view and experimental approach in near-surface geophysical applications [20,21]. The measurements are then converted into apparent electrical resistivity values. The subsequent tomographic data processing involves the interpretation of all the data set to convert the observed data (apparent resistivity values) into a distribution of true electrical resistivity (or the inverse, the electrical conductivity). The main factors that control the electrical conductivity in the porous material are the fluid content, its salinity and temperature. In landfill investigation, the electrical conductivity could be related to the distribution of leachate within the waste body. Typical values of electrical resistivity of the leachate of municipal waste landfills are around 1 Ω·m, which makes the volume partially saturated by leachate highly conductive volumes.
Electrical tomography was applied for the detection of the flow path of the leachate through municipal solid waste (MSW), both for increasing the knowledge of MSW behaviour and for using the results to improve the design of the leachate injection systems [18,19,20,22]. More generally, the approach is widely adopted to study the infiltration process in porous media [18,23,24]. During the injection of water into porous media, ERT time-lapse monitoring (TLERT) is adopted, and the changes in the electrical resistivity can be considered sensitive to the changes in fluid content if the temperature and the porosity are constant during the infiltration.
The TLERT method is based on the analysis of a dataset; in our case, on 2D resistivity images collected at different time intervals; the inversion procedure of the TLERT dataset could be performed according to several approaches [25]. The simpler approach is based on the analysis of the differences between the resistivity images independently inverted (independent approach). This approach could provide for amplification of the ghost and artefacts of every single inversion. The method of difference inversion of the ERT data is based on the inversion of the differences between the reference resistivity dataset images and the resistivity datasets collected at different times. Finally, the ratio inversion adopts the ratio between two successive ERT measurements multiplied with a resistivity value representing a homogenous subsurface model. In the present work, we adopt the difference inversion approach to invert the datasets of resistivity data collected during the infiltration test. The time-lapse monitoring approach means that the same measurements are repeated several times using the same array configuration in the same location, namely before, during and after the injection of the leachate.
2.1. Geophysical Characterization
The preliminary geophysical characterization of the landfill was carried out using ERT surveys for estimating the distribution of electrical resistivity on 2D vertical sections of the landfill. The survey focused on mapping the inner heterogeneity of the landfill to a depth of about 15 m within the waste.
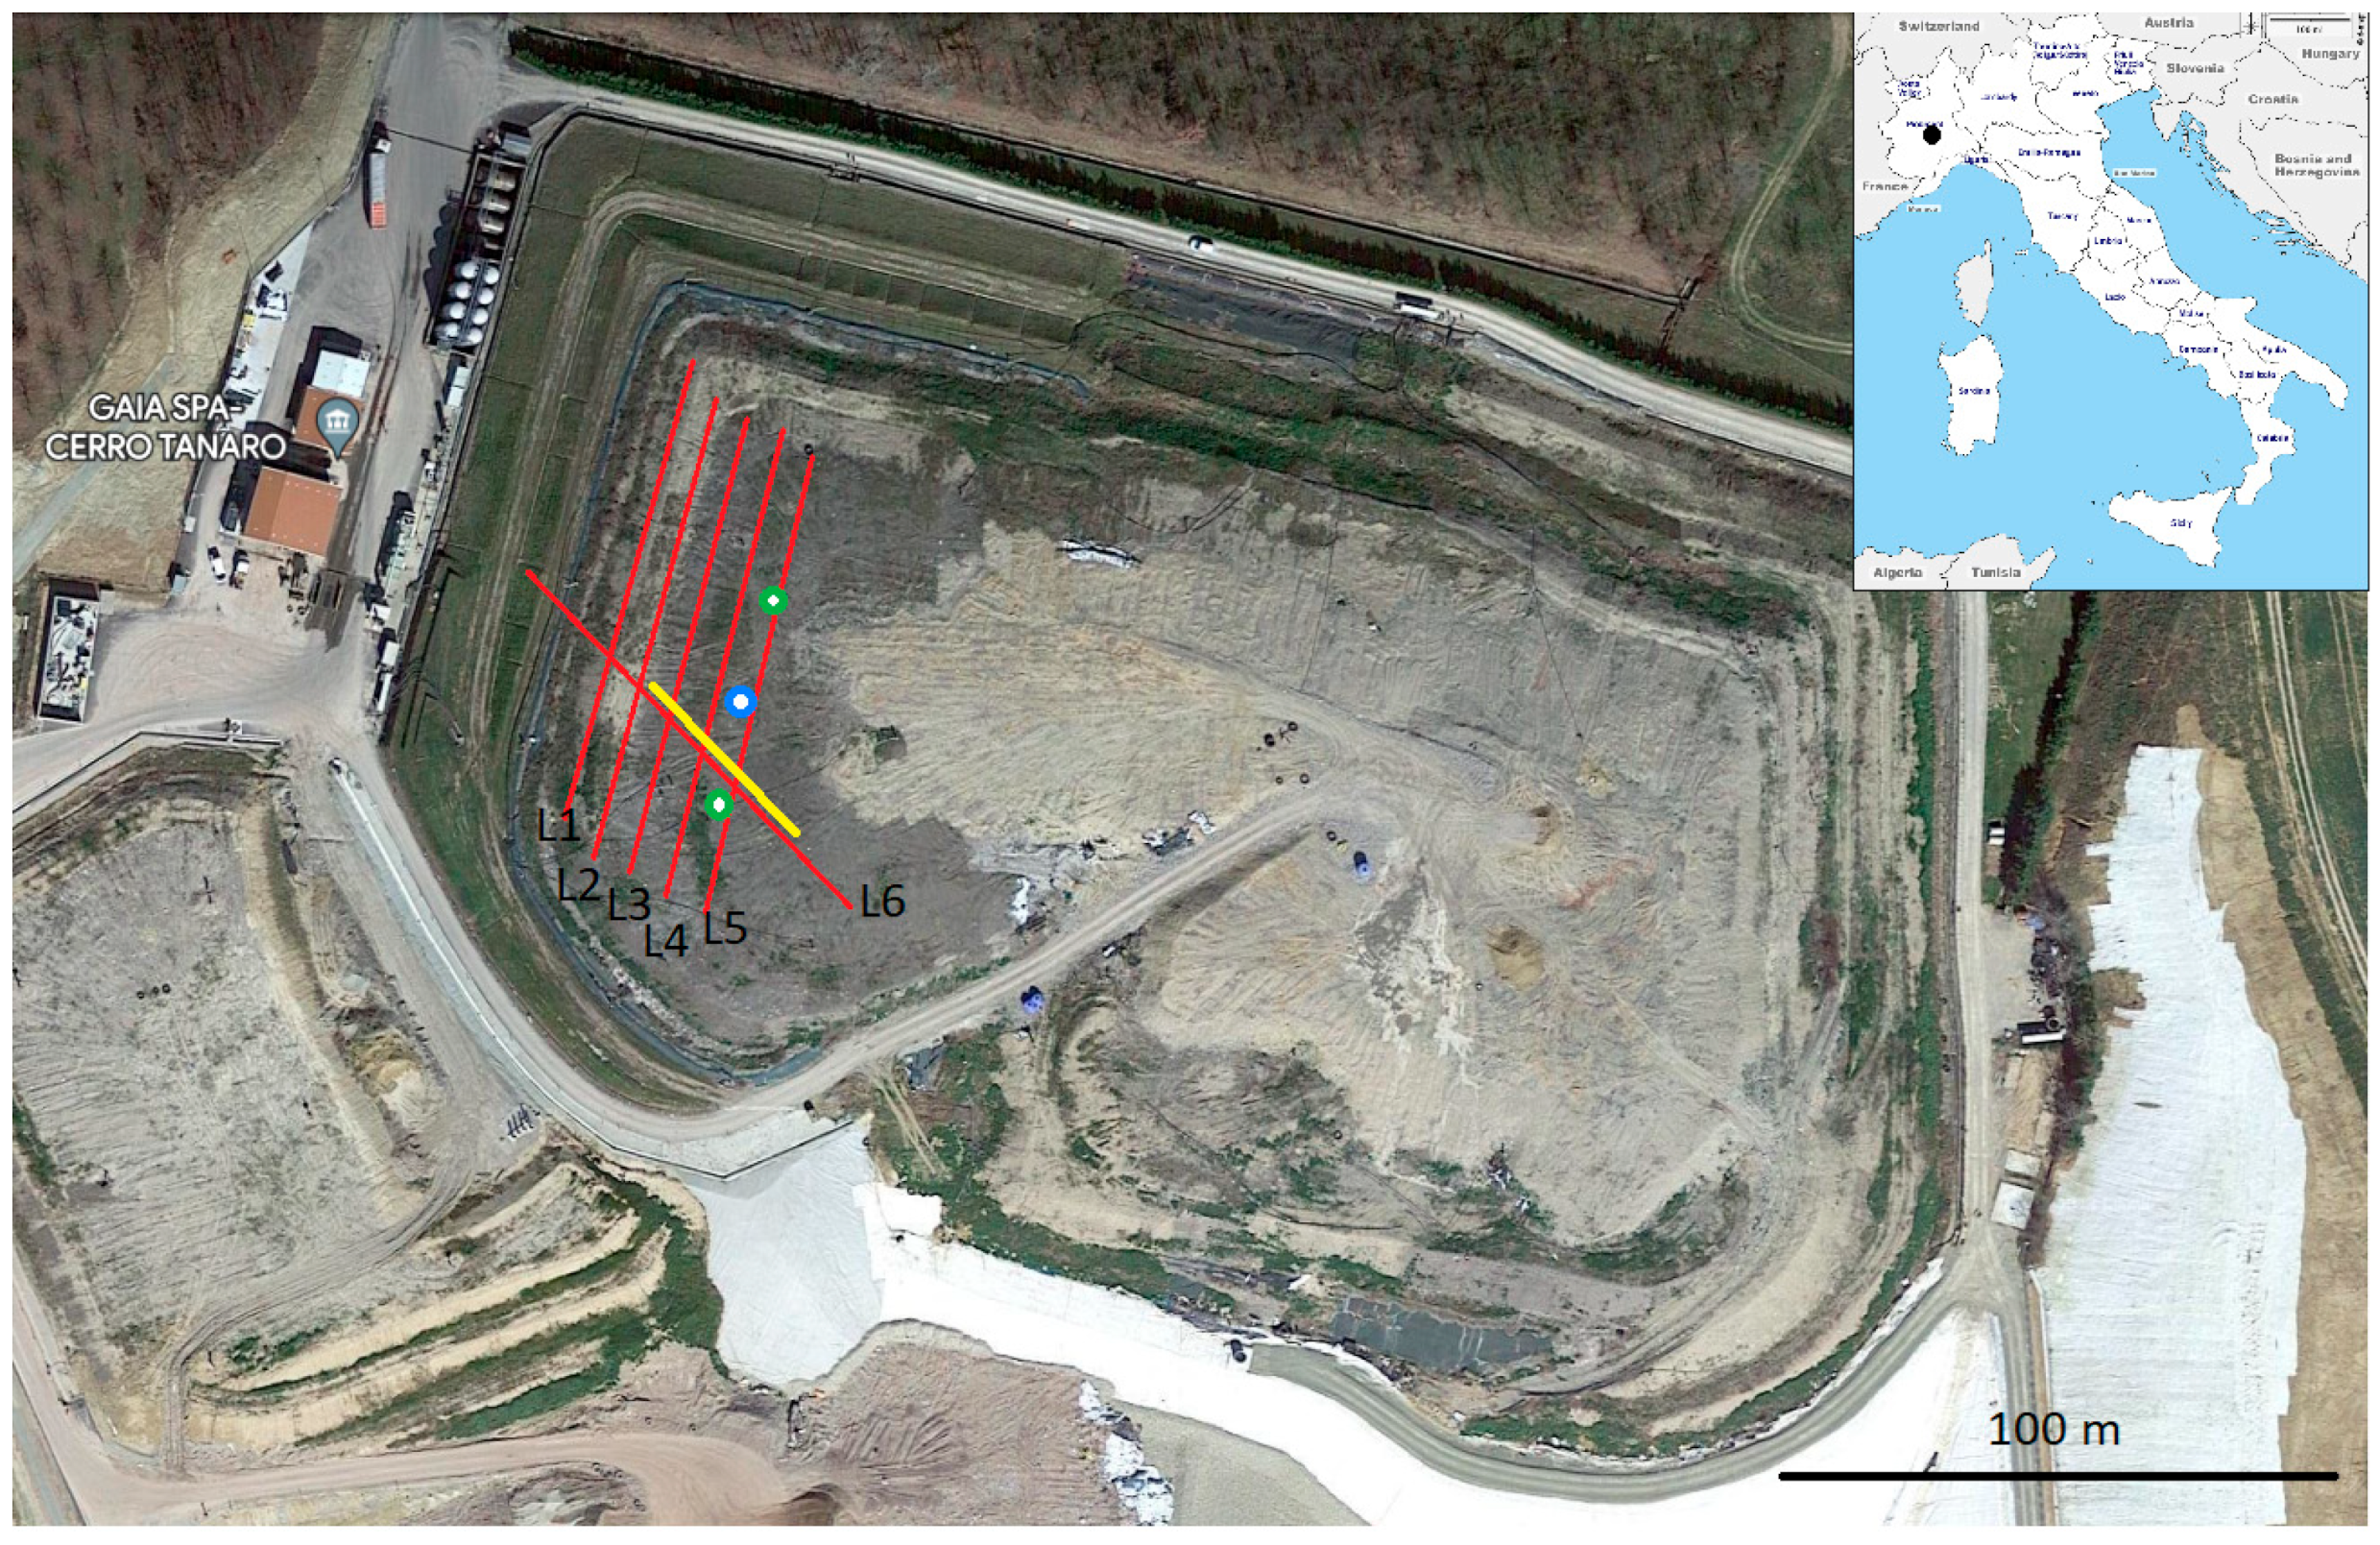
The data acquisition was carried out by 6 ERTs, with 48 electrodes for each profile, using a Wenner–Schlumberger array. The horizontal spacing between the electrodes was 2 m, and the distance among the parallel lines was about 10 m (Figure 1). Lines 1–5 are located over the flat area of the landfill and did not present any relevant morphological aspect of the topography. Line 6 crossed Lines 1–5 along the direction from south-east towards north-west; this latter line showed a severe elevation change of about 8–9 m toward the end of the profile. This is due to the local morphology of the landfill that is partially created as an embankment; the final part of Line 6 ended along the side slope of the embankment at a lower quote than Lines 1–5.
2.2. Infiltration Test
Tests were performed to estimate the infiltration rate in the uppermost part of the landfill before the final covering of the landfill itself. The pore networks and the anisotropic variability of hydraulic properties in landfilled waste are highly complex. To check the waste permeability in the upper part of the landfill, an infiltration test was performed.
For this aim, a controlled volume of water was infiltrated on the surface and the infiltration was monitored in time-lapse electrical resistivity tomography (yellow line in Figure 1). The infiltration system was designed to irrigate a surface with an area of about 6 m × 3 m. The water was distributed through 5 sprinklers fed by a discharge pipe with a 2.5-inches diameter to homogenize the irrigation over the infiltration area. The irrigation was carried out at a flow rate of about 50 L/min lasting for two hours; the total amount of water that infiltrated was 6 m3.
The test was performed at the beginning of Spring (April), starting at 11 am and ending at 10 am the day after. The daily temperature ranged from 14 °C to 22 °C (sunny day); the minimum temperature during the night was 9 °C (with a clear sky). The relativity humidity ranged from 50 to 60%.
The electrical conductivity of the injected water was measured just before the beginning of the test: the value was about 650 μS/cm, corresponding to the electrical resistivity of about 16 Ω·m. During irrigation, a puddle having a 5 cm thickness formed; after 25 min of water supply, no further modifications occurred, and the infiltration process proceeded in steady-state condition until the pumping was stopped.
Time-lapse monitoring of the subsurface processes was carried out by ERT to detect the hydraulic properties and estimate the influence volume of the infiltration. The background dataset was collected before the infiltration (at time t0 = 0). Then, five other datasets were collected at the following times: t1 = 0.25 h, t2 = 1 h, t3 = 2 h, t4 = 4 h and t5 = 23 h.
The position of the ERT line for infiltration test monitoring is highlighted in Figure 1, with yellow colour. Data acquisitions were carried out using a Wenner–Schlumberger array with 48 electrodes; in such a case, the adopted electrode spacing was 1 m. The survey line crossed the irrigation area at a distance between 28 and 31 m along the profile.
Time-lapse data were inverted to monitor the infiltration process using the time-lapse difference inversion algorithm [28] that was implemented in the software R2 [27]. The spatial domain considered in the inversion procedure took into account the potential impact of the geomembrane on the reliability of the results, as previously indicated by Audebert et al. [29]. Particularly, we have checked through the forward modelling procedure that the geomembrane, located at an average depth of about 20 m from the top of the landfill, does not affect the reliability of the resistivity values achieved by the inversion procedure. Some negative impact is only expected on the border end of Line 6 (see the characterization phase), where the depth of the geomembrane is very shallow.
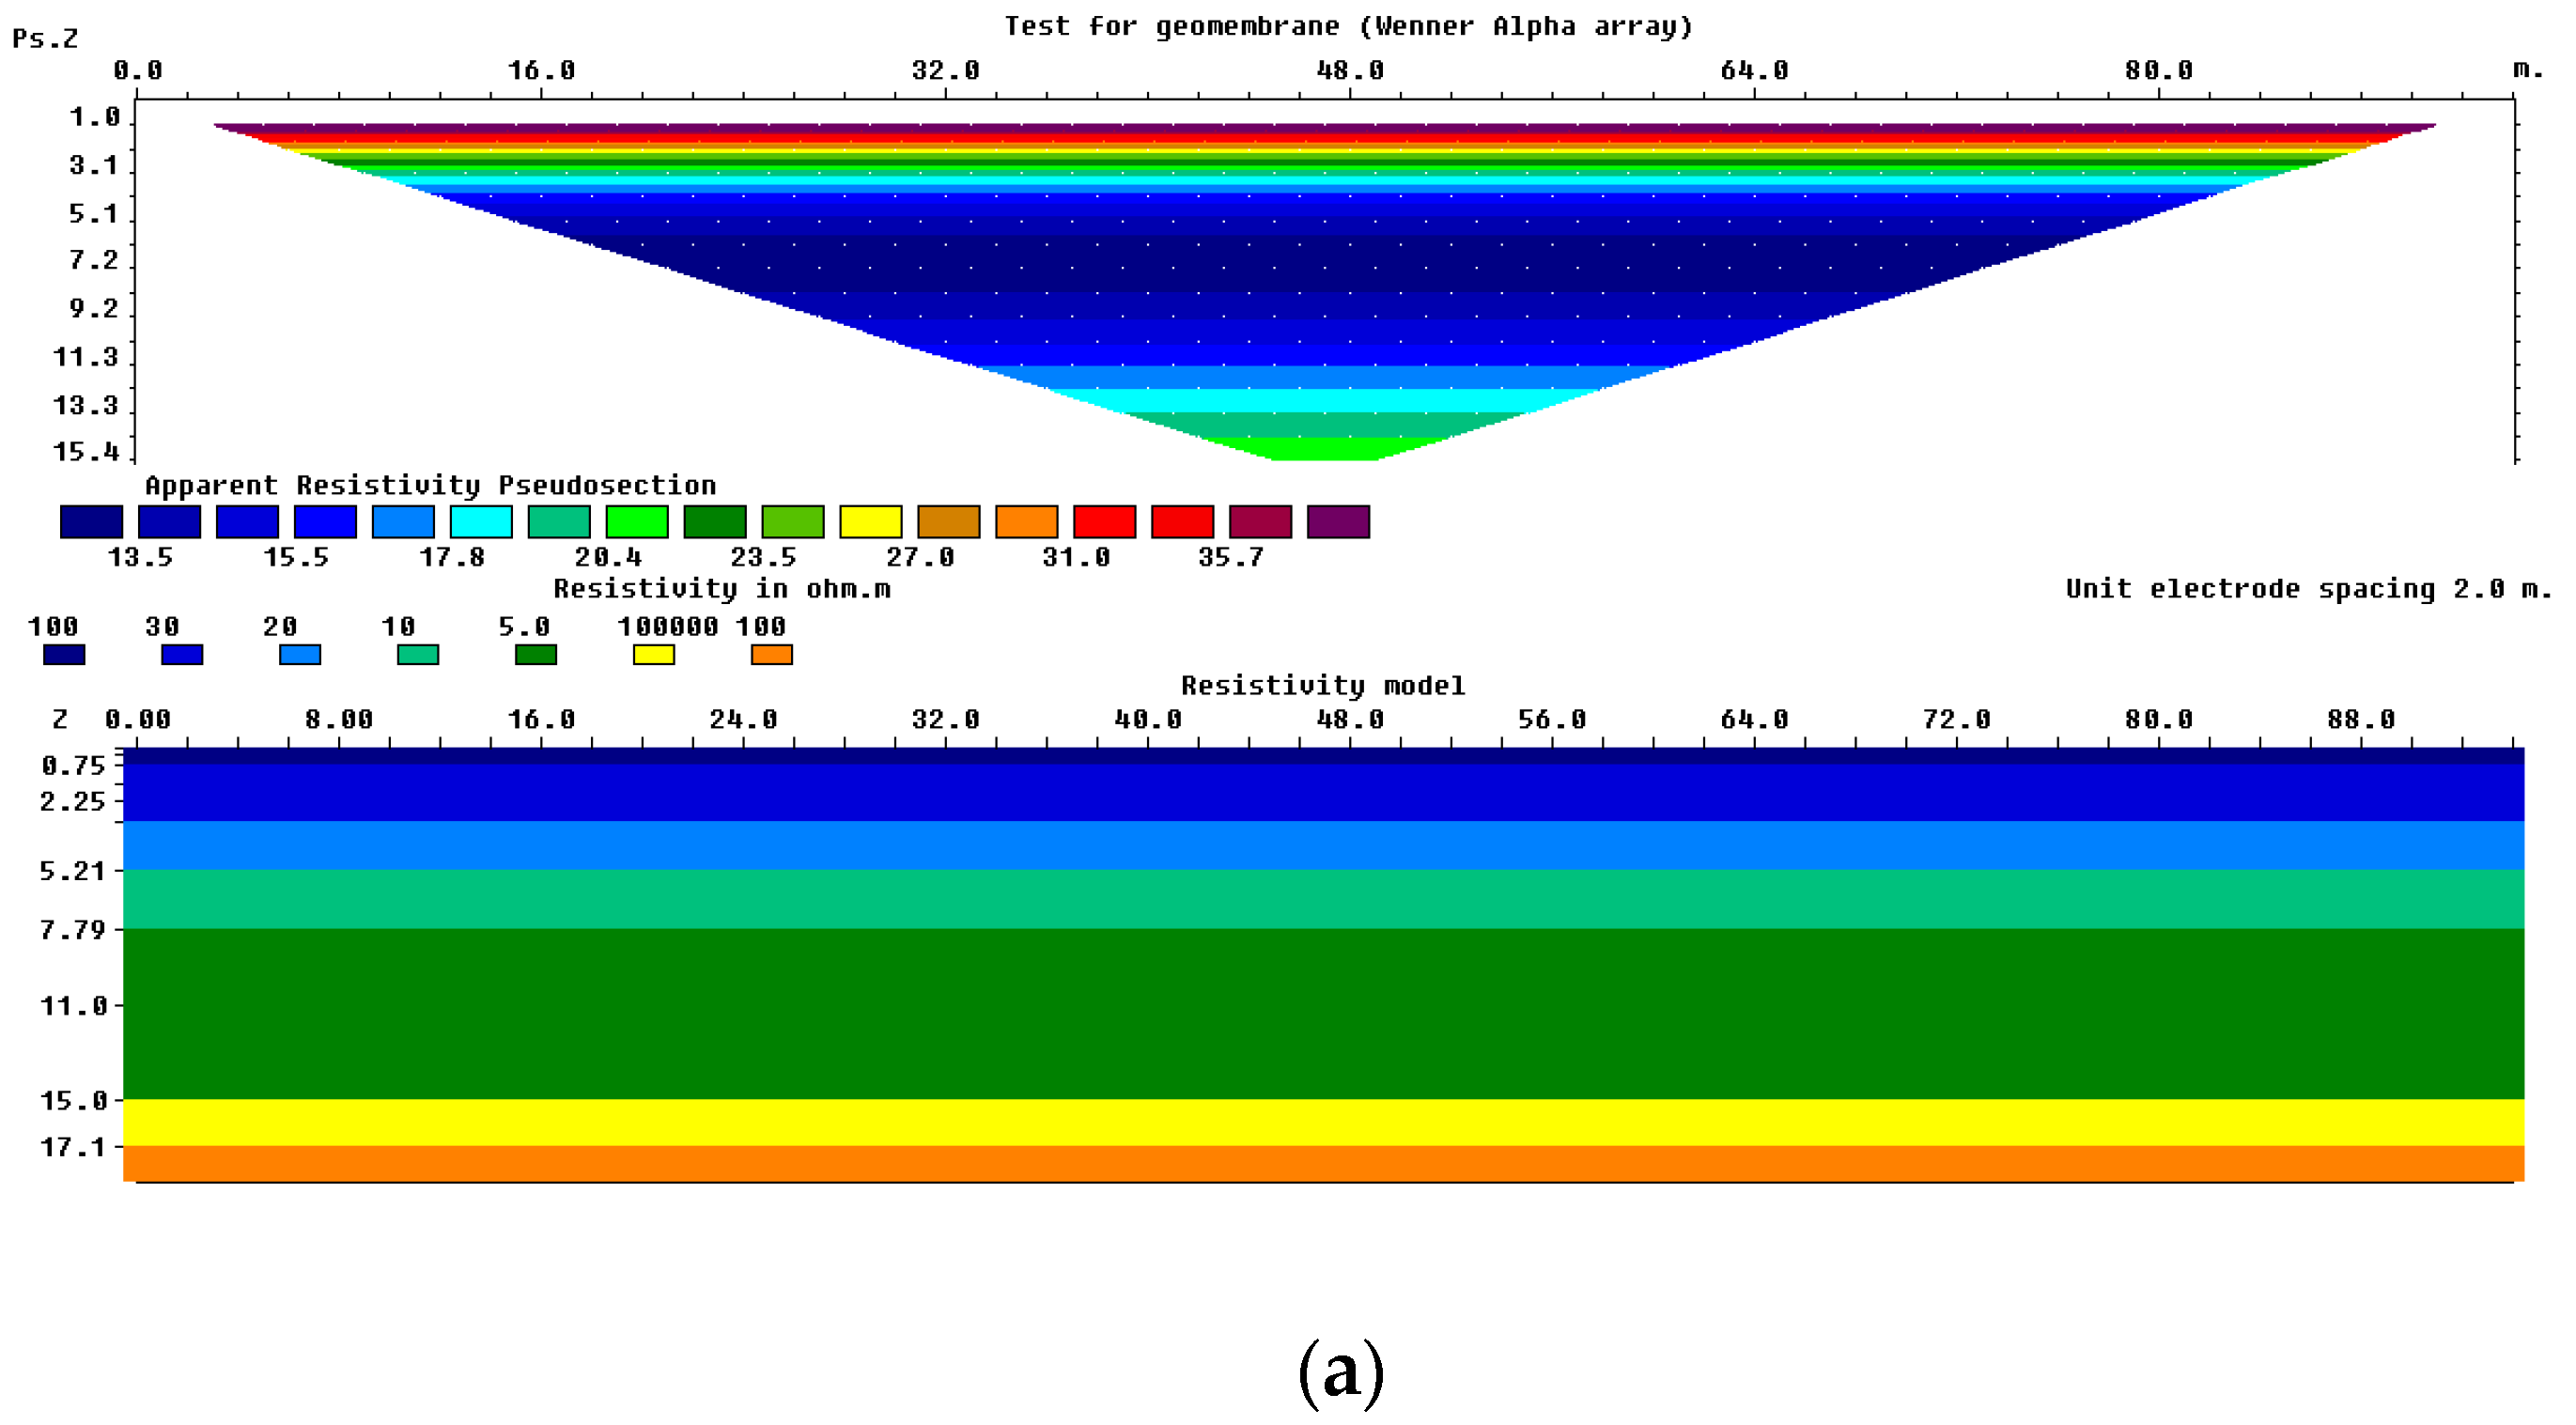
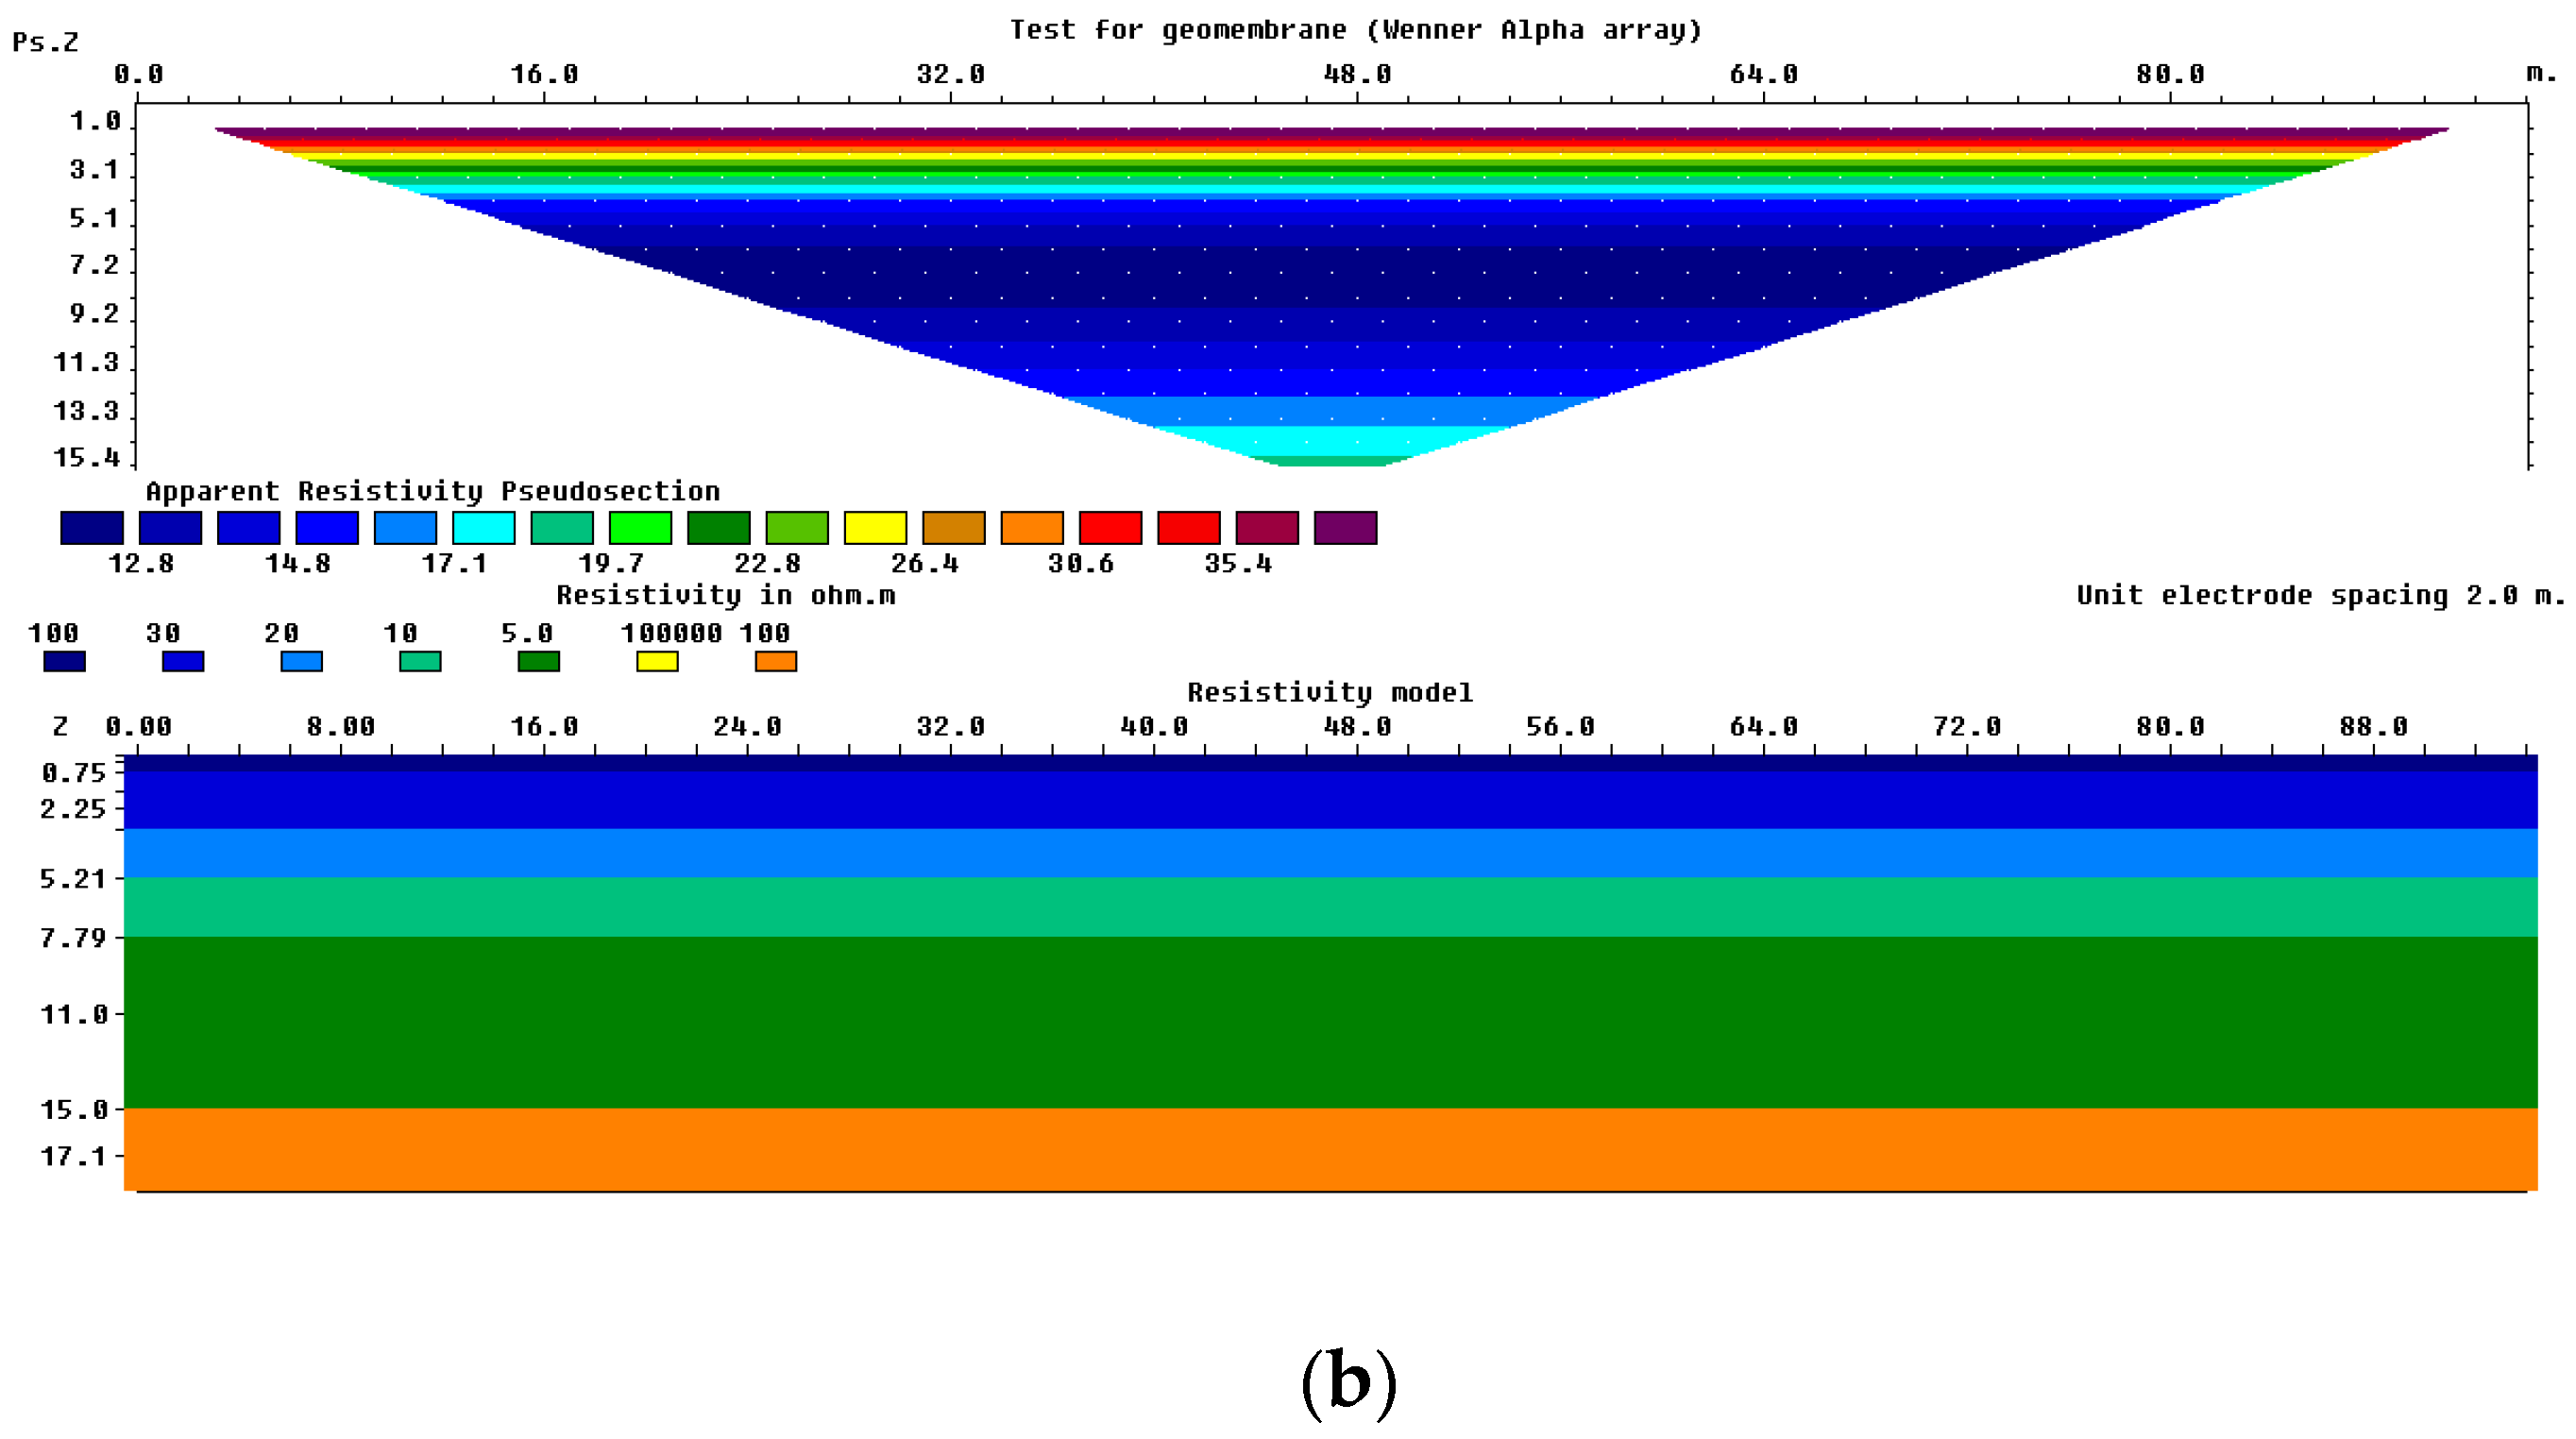
The forward modelling was performed using the code Res2dmod [30], and by assuming the Wenner array configuration with an electrode spacing of 2 m and 48 electrodes. The resistivity model of the inner waste body was simulated with several layers with decreasing resistivity values from the top to the bottom of the landfill. Values ranged from 100 Ω·m to 5 Ω·m. The bottom liner of the landfill was simulated with a high-resistive material (100,000 Ω·m) located at a depth of about 15 m from the ground surface. The results of the modelling of the impact of the liner are reported in Figure 2: the apparent resistivity distribution referring to the model with high resistivity material located at the bottom is plotted in Figure 2a; meanwhile, a second section without the bottom resistivity layer is depicted in Figure 2b. It can be noticed that the high resistivity of the bottom layer only slightly impacts the apparent resistivity distribution of the section.
2.3. Leachate Recirculation Monitoring
The landfill was equipped with a leachate recirculation system consisting of 8 sub-irrigation rings of 20 m diameter located at the top of 8 biogas extraction wells and below the final waste capping. Moreover, to get a homogeneous leachate distribution, horizontal 10 m length pipes were placed in the zones not reached by the influence areas of the rings, at 0.5 m depth. In Figure 1, only two of the eight addressed boreholes are shown; particularly, we indicate the position of the two boreholes used for the leachate recirculation monitoring herein discussed.
For the ERT monitoring, seven boreholes were drilled in the landfill. Each of them was equipped with graphite electrodes (24 in each borehole, 0.6 m spaced, at a depth between 1.5 and 15 m below the landfill capping) to perform down-hole and cross-hole ERT monitoring of the leachate infiltration displacement during the recirculation. A series of 48 surface electrodes was also installed on the landfill surface (2 m spaced electrodes).
During leachate recirculation tests, daily geo-electrical monitoring was conducted by 2D surface ERT surveys (Wenner–Schlumberger and dipole–dipole arrays) along the 48-electrode profile and cross-hole ERT (dipole-dipole array) between the boreholes. Data were inverted with R2 code using the difference inversion algorithm for the time-lapse data.
2.4. Monitoring of Biogas and Leachate
After the landfill’s definitive covering, the biogas extraction and leachate collection plants started to operate. At the same time, biogas and leachate monitoring started.
The landfill was equipped with a system for online monitoring of the extracted biogas (temperature; flow rate; composition by methane, carbon dioxide, oxygen and hydrogen sulphide). Concerning leachate, the following parameters were analyzed weekly on samples: temperature, pH, chemical oxygen demand (COD) and ammonium and chloride concentration.
The zone managed as a bioreactor was equipped with a system to monitor the leachate recirculation and collect data about temperature and electrical resistivity. The measurement of these parameters at different landfill depths can be good indicators of spatial and temporal changes in the liquid contained within the bioreactor as a result of the infiltration process.
To study the effect of leachate recirculation on biogas flow rate and composition, the tests were carried out for more than two years.
Two biogas wells were monitored with and without leachate recirculation in their influence zone (green circle in Figure 1). The recirculation tests were done with the same flow rate as the infiltration tests, about 3 m3/h for a daily cumulative volume equal to 35–38 m3, in different seasonal periods to study the influence on biogas generation.
At last, a long-term test (4 months) was carried out in which the leachate flow rate was split around the two tested wells.
3. Results
3.1. Geophysical Characterization
The measurements revealed a highly conductive medium, with an electrical current in the range of 1000–2000 mA and very low voltage values, down to a few mV depending on the geometric arrangement of the single measurement. Data quality was estimated by the data standard deviation, achieving values in the range of 0.1–5%. The quality analysis of the data set was performed to exterminate from the data set values with a standard deviation higher than 5%. Only a few data were discharged for each section.
The inversion procedure was interrupted after less than five iterations for each transect, as the RMS lowered the 5%, which agrees with the uncertainties of data.
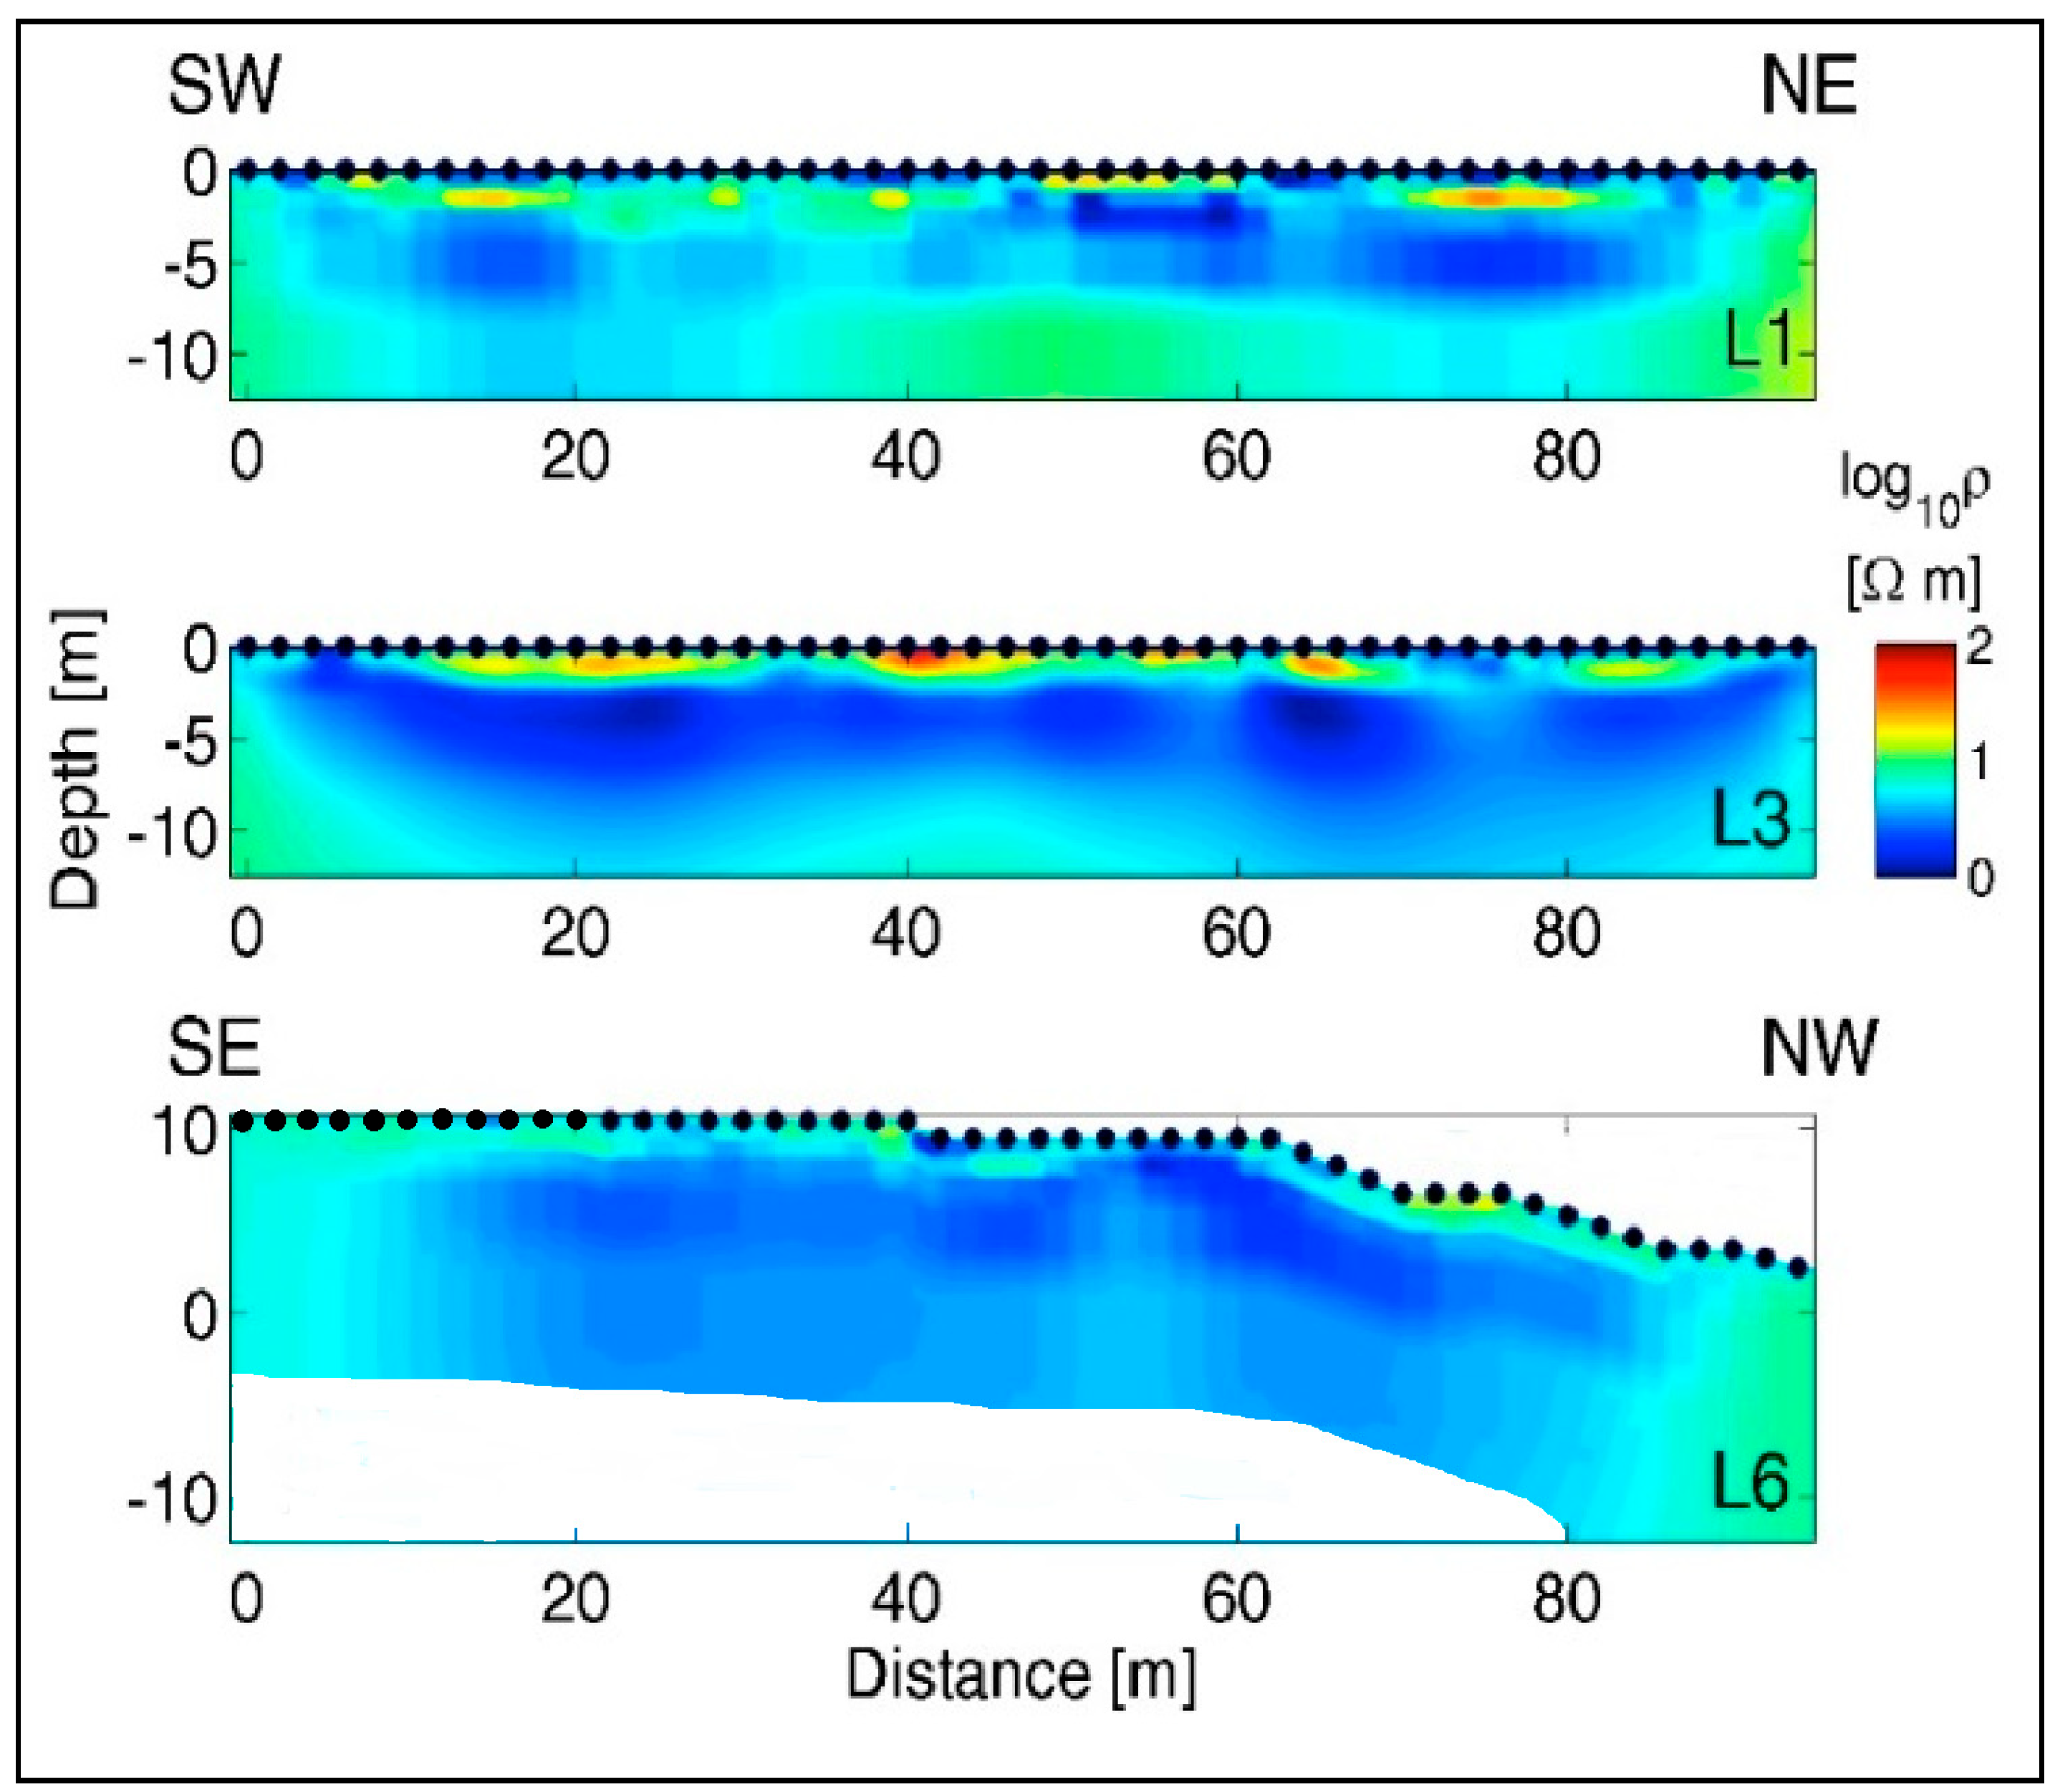
The results of the preliminary characterization are reported in Figure 3. For the sake of simplicity, the example of L1, L3 and L6 is herein reported, the distribution of the other sections being very similar to the presented ones.
Particularly, the sections pointed out that the electrical response of waste appears quite homogeneous, with resistivity values lower than 10 Ω·m. This is well depicted in the resistivity image of L3 and L6.
The resistivity distribution of the section of Line 1 depicts higher resistivity values in the uppermost part of the image; particularly, lenses of high-resistive waste material in the range from 20–50 Ω·m are reported, up to a depth of 2 m from the ground. The lower part of the section is characterized by a resistivity ranging between 1 Ω·m and 5 Ω·m. The bottom part of the image shows a slight increase in the resistivity values, up to 10 Ω·m.
The uppermost layer is slightly more resistive, with local heterogeneities that exhibit local electrical resistivity values in a range higher than 20 Ω·m. This is visible in the vertical section of line L3, where the resistivity contrast between the upper part and the lower one is enhanced. In such a case, the resistivity of the waste in the depth range of 2–6 m is lower than 5 Ω·m, according to the increase of waste moisture in such zone. This agrees with the resistivity distribution of the section of line L6 where a spot of low resistivity is pointed out at the coordinates 55–70 m, that is, the coordinate where line L3 crosses the L6 one (see Figure 1).
3.2. Infiltration Test Monitoring
The results of the time-lapse data inversion on data from the infiltration test are shown in Figure 4. The plot reports the electrical resistivity distribution at time t0, and the difference with these values at times t1, t2, t3, t4 and t5. In the infiltration area, there is a smooth decrease of the values, up to 15–20% after 23 h (t = t5). The conductive plume tends to spread horizontally, interesting a portion of the section between the coordinates 25÷35 m, in the depth range between 0 and 2 m.
The test pointed out that the infiltration proceeded very fast in the near surface of the landfill body, where the waste material is characterized by drier conditions; the infiltration started to spread laterally when the front of the infiltration reached the lower more humid layers, approximately located at the depth of 5 m below the surface.
3.3. Leachate Recirculation Monitoring
The borehole electrodes directly under the surface line were adopted with a non-conventional “T” dipole–dipole array to increase the data coverage with the depth. The T-dipole is organized with a series of electrodes distributed along a transect on the surface (Line L5) and another series of electrodes located along a borehole (Figure 5). The borehole is located approximately in the centre of the array transect on the surface. Additionally, the test was monitored with the cross-hole array configuration between the two boreholes located in Figure 1 (green circle), in dipole–dipole configuration.
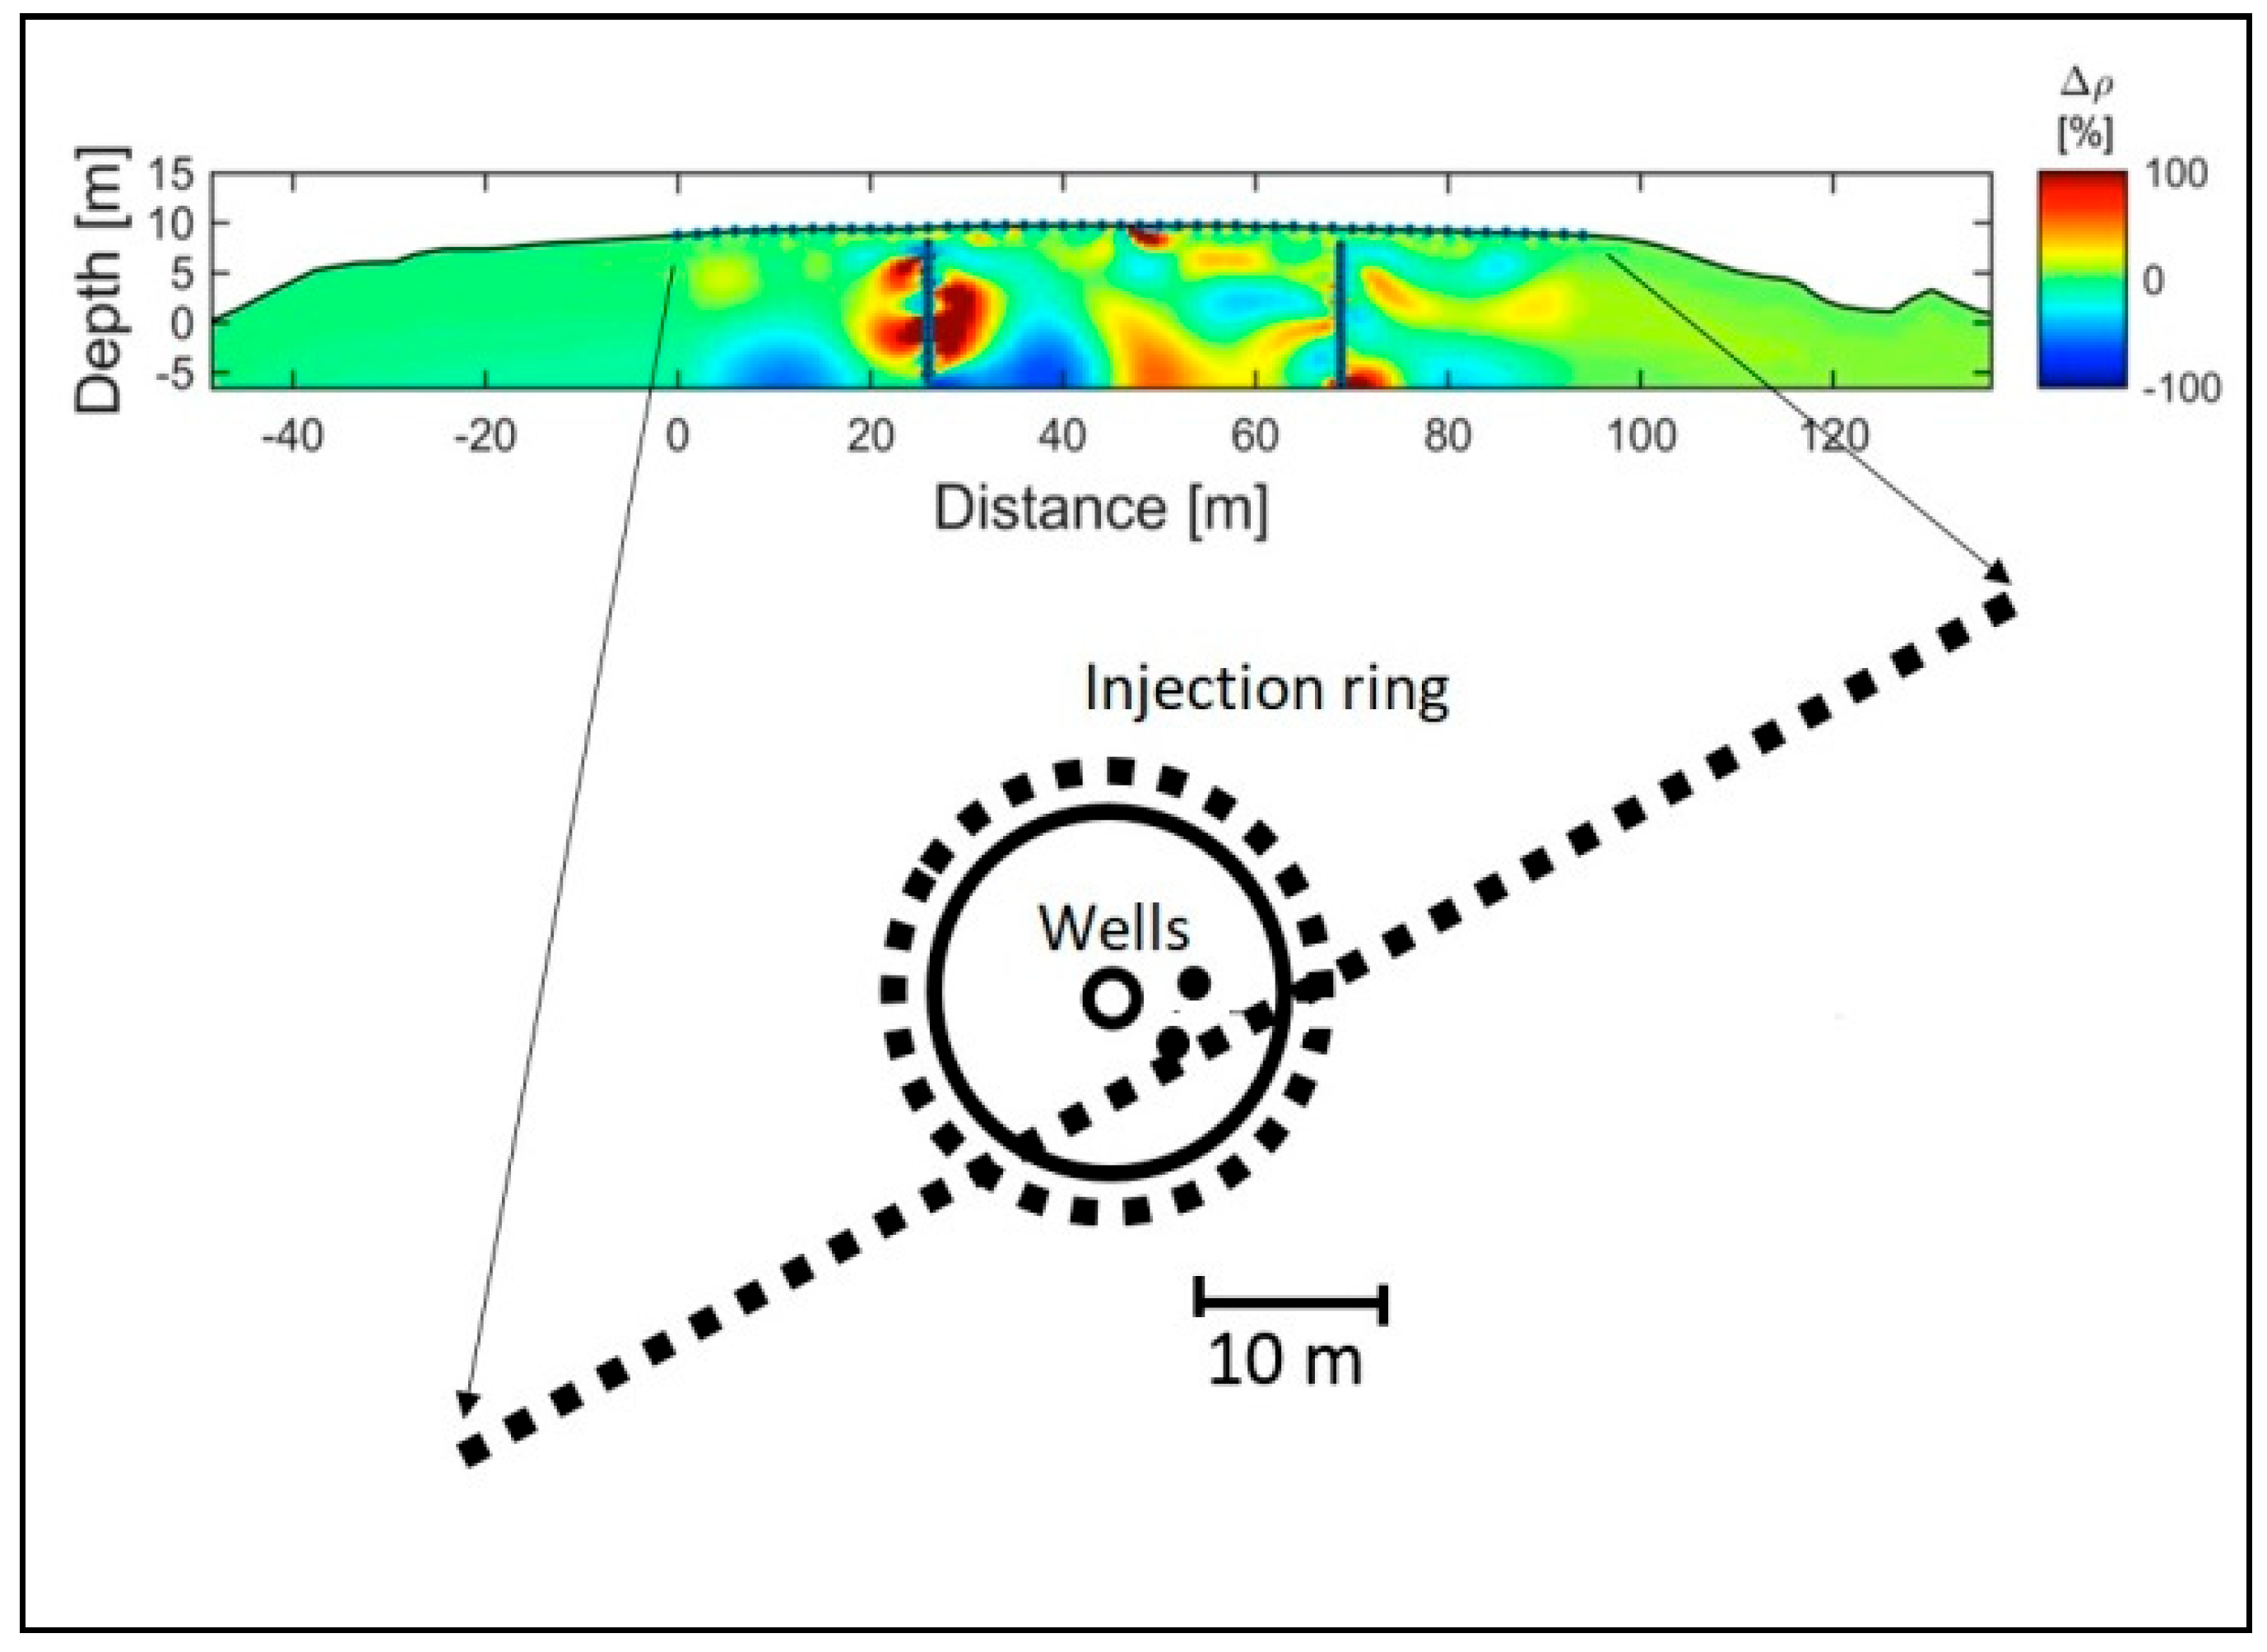
Figure 6 shows the resulting electrical resistivity distribution for both the surface-T and cross-hole arrays to critically understand the phenomena that occurred during leachate recirculation.
The plot shows the difference between the resistivity measured after two days of leachate injection (about 70 m3 of leachate) and the background one. In the zones near the borehole electrodes (i.e., the most reliable ones), the ERT monitoring recorded anomalous growths, with difference values far higher than 100%, that is to say, more than double the background one.
3.4. Leachate Recirculation and Biogas Generation
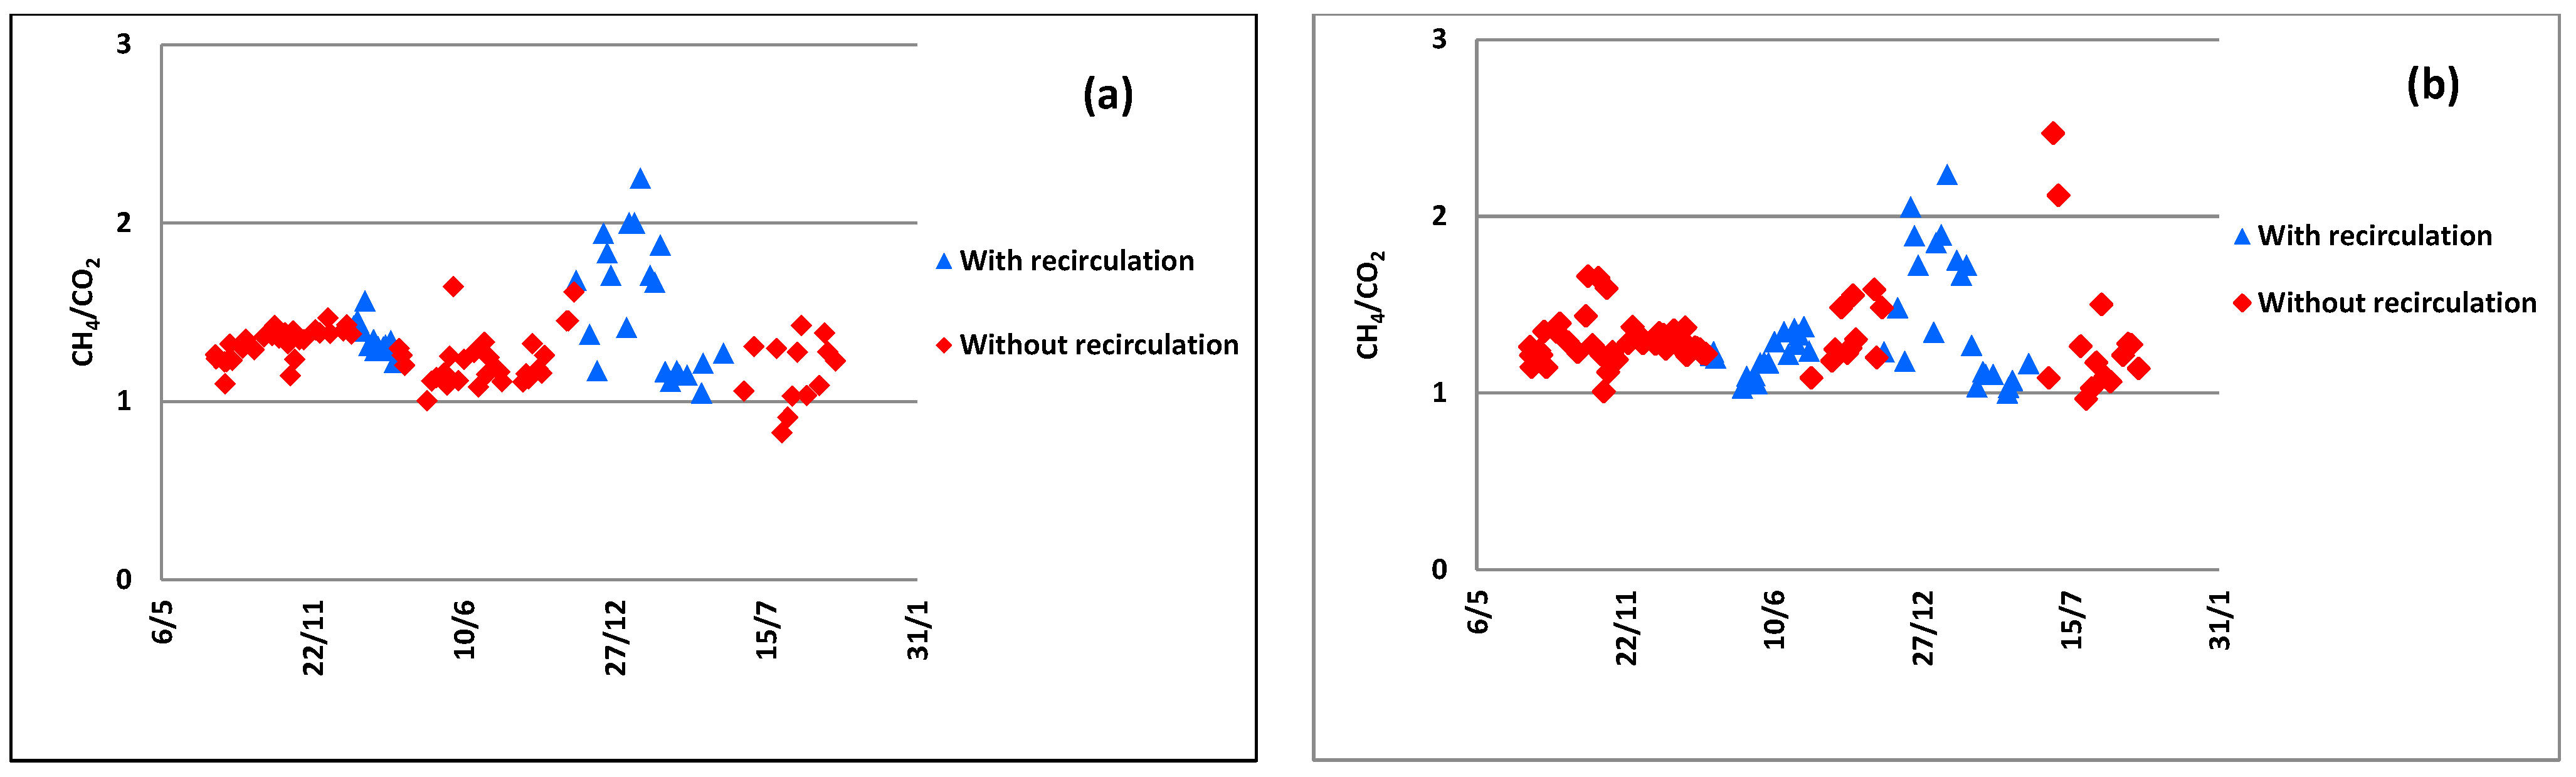
The tests to verify the effects of leachate recirculation on biogas generation were done on two wells, monitoring their biogas composition and flow rate. The data allowed to calculate the ratio volume of methane (CH4) to the volume of carbon dioxide (CO2). This parameter reflects the presence of anaerobic biodegradation with methane generation: in common landfills, usually, it is lower than 1.4, which corresponds to a methane concentration equal to 58–59% by volume in the biogas.
The data obtained for the monitored wells during the tests with and without leachate recirculation are shown in Figure 7a,b, respectively.
The influence of leachate recirculation on methane generation is evident in both cases, and very similar results were achieved.
In both wells, the ratio CH4/CO2 had values around 2 (or higher) during the 2nd period of leachate recirculation. This can be due to different moisture of the waste during the recirculation periods:
- during the 1st period, the leachate could have increased the water content in the waste, that is to say, part of the leachate could be absorbed by the waste itself since the landfill was filled with pre-treated waste (rather dry);
- during the 2nd recirculation period, the operation could have further increased the water content to the optimal values for biodegradation, influencing the methane generation around the well.
Unfortunately, the increase in the ratio CH4/CO2 does not correspond to an evident growth of the biogas flow rate (data not shown). One reason could be the partial filling of landfill porosity by leachate itself, which would constitute a barrier to biogas extraction.
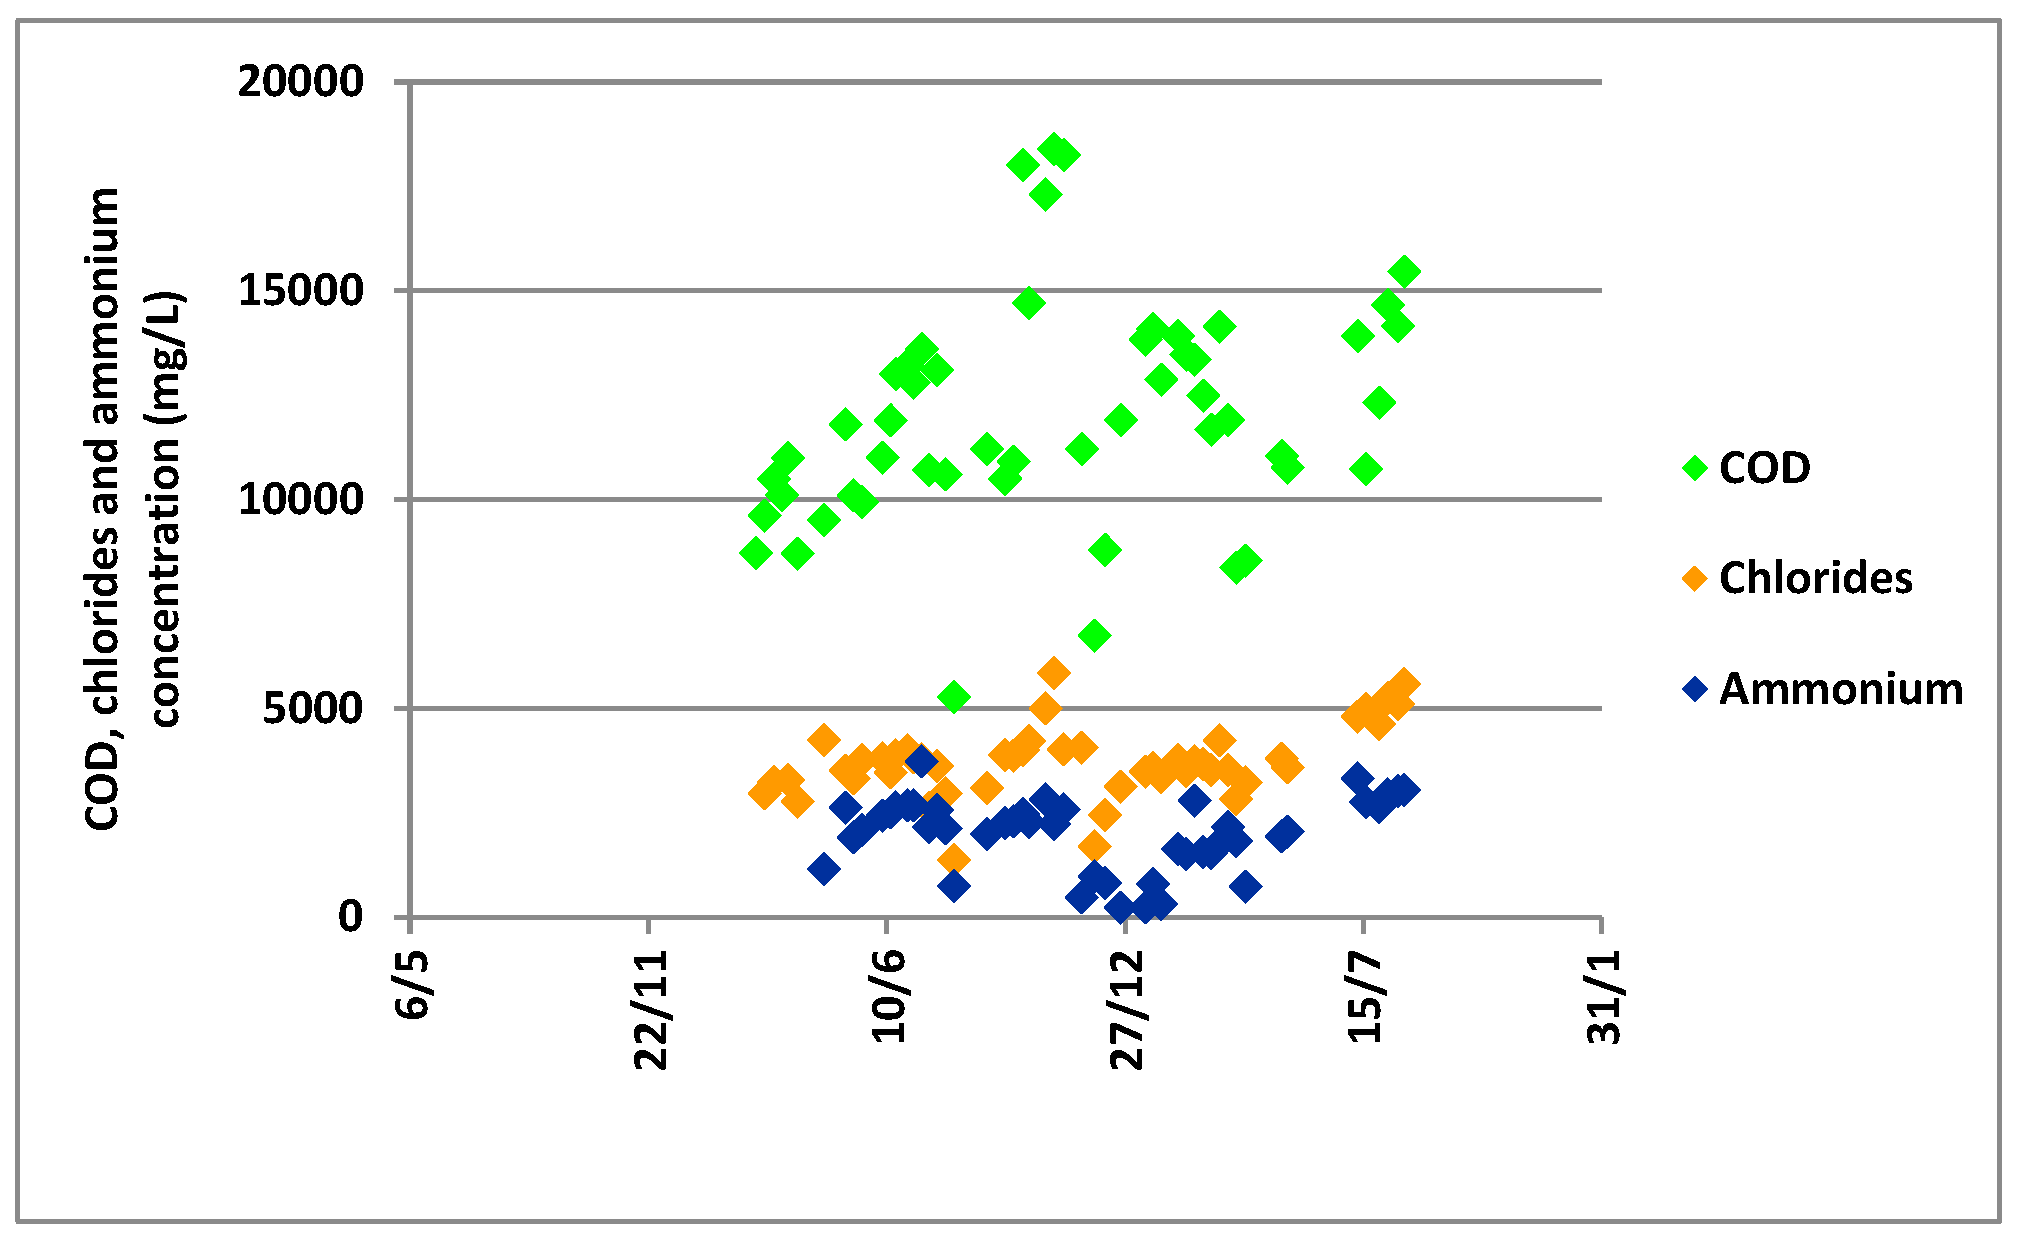
Looking at the leachate properties, we can note that they do not influence the concentration change of methane.
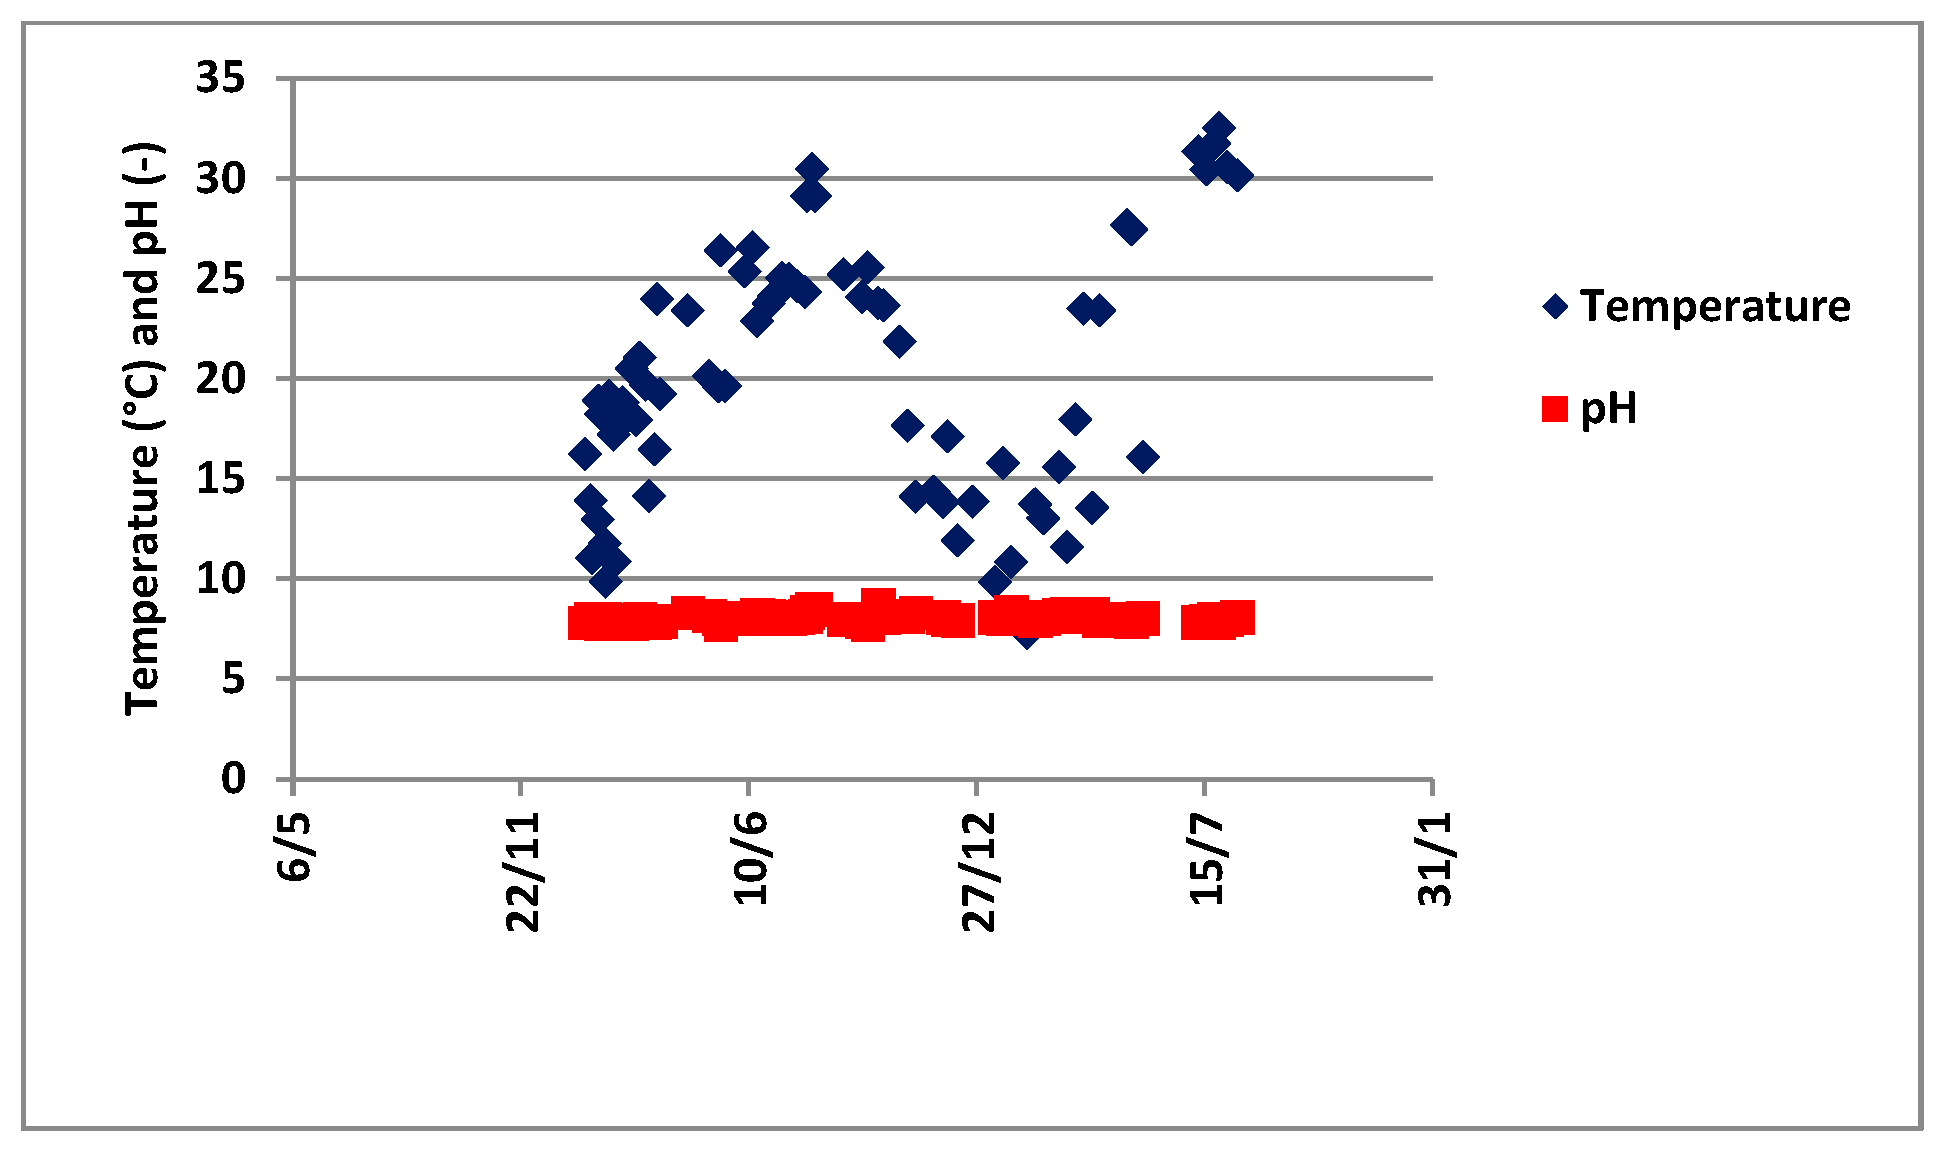
Figure 8 shows the monitoring of temperature and pH, where it is evident that
- the seasonal trend of leachate temperature seems to not influence the biological process since the methane concentration grows anyway during the cold season; the disturbance given by the injection of cold leachate is not evident since the leachate amount is small compared to the hot mass of waste (around 46–48 °C);
- leachate pH is almost constant along the monitoring time and around neutral values suitable for biogas/methane generation.
Figure 9 reports the main chemical properties of the recirculated leachate, such as COD, chlorides concentration and ammonium one. These parameters are rather constant during the season and, as for pH and temperature, they do not show influence on the changes of methane concentration in biogas.
4. Discussion
The preliminary geophysical characterization of the landfill aimed to point out the electrical response of the landfill and the sensitivity of ERT to detect the waste volume affected by leachate recirculation. We pointed out low values of electrical resistivity all around the landfill, with a decrease of values at a deeper level, according to an increase of temperature and moisture with depth.
The preliminary infiltration tests pointed out that the infiltration volume spreads out mainly horizontally, according to the peculiarity of the landfill, and is made by layers of pre-treated waste blocks separated with thinner layers of compost at very low permeability.
The survey permitted the design of the best monitoring strategy by integrating cross-hole and surface electrical resistivity tomography during the leachate recirculation into the cell.
The monitoring of the leachate recirculation demonstrated the relevance of the indirect monitoring (by geophysical survey) of the spatial and temporal distribution of recirculating leachate into the waste so that the whole bioreactor landfill performance can be optimized. The sensitivity of the electrical resistivity of bioreactor landfills to the properties of solid waste, such as moisture content, leachate ionic strength and temperature, is straightforward [17]. Some authors pointed out that an increase in electrical resistivity indicates a decrease in water content and a decrease in electrical resistivity indicates infiltration of a liquid [17,31].
In the present study, the temperature effect seems to play a less important role because rather constant values below 3–4 m from the top were measured (46–48 °C). Therefore, the response change is mainly caused by the variations in water content within the waste.
ERT was applied for the monitoring of leachate recirculation at a bioreactor landfill. This method is sensitive to the transient phenomena associated with leachate movement within the waste. In the monitored injection-extraction location, leachate flows following patterns that cannot be well resolved down to a depth of 6–7 m with preferential channels through macropores in the waste.
The data on biogas production extracted from the tested landfill cells (with and without leachate recirculation) gave relevant information about the influence of waste moisture on biological processes occurring inside the landfill.
Without leachate recirculation, the biogas has a content of methane and carbon dioxide giving a ratio of CH4/CO2 around 1.3–1.4. As shown in Figure 7, higher values were found during the leachate recirculation periods; notwithstanding, the methane flow rate did not grow compared to the ones without recirculation.
The biogas generation does not seem influenced by seasonal changes in the leachate temperature, that is to say, the liquid injection does not constitute an evident disturbance to the biological process; in any situation, this could be verified by the thermal balance to the system (landfill), usually at least in mesophilic conditions (over 35 °C). Even with winter temperatures (close to 0 °C), the leachate flow rate is discontinuous, and this feed does not constitute a thermal disturbance on the huge mass of landfill.
Very probably, one positive effect of leachate recirculation is the transport and distribution of substrates and microorganisms. Similar results were found by other authors:
- Ko et al. [32] studied the effect of leachate recirculation and compaction in lysimeters for municipal solid wastes. Each lysimeter contained 9 kg of waste, and the test lasted more than 5 months. In both cases, the ratio CH4/CO2 was higher than two, showing the effect of waste moisture on the biodegradation process. Moreover, these authors found that leachate COD decreased during the recirculation period, whereas in our study this trend is not so well defined.
- Ozkaya et al. [33] investigated the leachate recirculation effects on a real landfill scale, testing wastes disposed of in about 600,000 m3. The recirculation operation lasted about one month, and during this period, biogas and leachate composition were monitored to compare them to the corresponding ones achieved in the landfill zone managed without leachate injection. Methane concentration was higher in the -m3 zone (53–54% by volume against 46–47% by volume). Regarding leachate composition, the study showed that COD decreased after the recirculation period due to the degradative activity of microorganisms.
- Bialowiec et al. [1] measured the biogas composition and flow rate in a -ton landfill with leachate recirculation in two tests that lasted 20 and 30 days, respectively. Their findings showed the rather sudden growth of the biogas flow rate when the leachate started to be injected. At the same time, the methane concentration increased by some units (from 60 to 65% by volume).
5. Conclusions
The main findings of the experimental activity, achieved on different scales, demonstrate the global positive effect of leachate recirculation on biogas quality. The reasons can be the forced transport of substrates and microbial population inside the waste and the increase of waste moisture suitable for the methanogenic process with a more homogeneous distribution in the landfill.
Notwithstanding their biodegradability, some waste components have low moisture (i.e., paper and cardboard, with moisture around 10% by weight). They are degraded with difficulty if they are located in zones not reached from downward leachate flow. This feature is still more relevant for pretreated wastes that have the most moisture content of around 15% by weight.
Moreover, a higher methane concentration in biogas has evident relevance in economic terms for energy exploitation. Therefore, on one side the leachate recirculation can represent a need to improve the biological degradation of disposed wastes, and on the other, it reflects the optimal approach for energy recovery from partial renewable resources in a sustainable way.
The findings demonstrated that ERT is a method that can be efficiently used to monitor leachate distribution within the landfill, contributing to improving the knowledge about a landfill bioreactor and its management to enhance biogas generation by methane concentration and flow rate, thus improving energy recovery from waste.
This study also demonstrated the need for a multidisciplinary approach to face issues linked to biogas production from waste and energy recovery, especially to monitor processes at a large scale, in systems where the operative conditions are not well defined and known.
At present, some features are still open and need further studies; these should be carried out directly in landfill, when feasible, to get real-scale data that are better representatives of specific situations.
All the findings have relevance in terms of environmental impacts (shortened impact due to landfill biogas generation and collection) and economic ones (shortened management of biogas extraction and exploitation).
Author Contributions
Conceptualization, A.G. and F.C.; methodology, A.G. and F.C.; software, A.G.; validation, A.G. and F.C.; data curation, A.G. and F.C.; writing—original draft preparation, A.G. and F.C.; writing—review and editing, A.G. and F.C.; supervision, A.G and F.C.; project administration, A.G. and F.C.; funding acquisition, A.G. and F.C. All authors have read and agreed to the published version of the manuscript.
Funding
This research was funded by Program Life+ 2009 “Full scale use of liquid injection, for innovative control of waste moisture to enhance biogas production in pretreated waste landfill” (LIFE09-ENV/IT/000101).
Institutional Review Board Statement
Not applicable.
Informed Consent Statement
Not applicable.
Data Availability Statement
Not applicable.
Conflicts of Interest
The authors declare no conflict of interest. The funders had no role in the design of the study; in the collection, analyses, or interpretation of data; in the writing of the manuscript; or in the decision to publish the results.
References
- Bialowiec, A.; Siudak, M.; Jakubowski, B.; Wisniewski, D. The influence of leachate recirculation on biogas production in a landfill bioreactor. Env. Prot. Eng. 2017, 43, 113–120. [Google Scholar] [CrossRef]
- Chugh, S.; Clarke, W.; Pullammanappallil, P.; Rudolph, V. Effect of recirculated leachate volume on MSW degradation. Waste Manag. Res. 1998, 16, 564–573. [Google Scholar] [CrossRef]
- Guérin, R.; Munoz, M.L.; Aran, C.; Laperrelle, C.; Hidra, M.; Drouart, E.; Grellier, S. Leachate recirculation: Moisture content assessment by means of a geophysical technique. Waste Manag. 2004, 24, 785–794. [Google Scholar] [CrossRef] [PubMed]
- Liu, L.; Xiong, H.; Ma, J.; Ge, S.; Yiu, X.; Zeng, G. Leachate recirculation for enhancing methane generation within field site in China. J. Chem. 2018, 2018, 9056561. [Google Scholar] [CrossRef]
- Nwaokorie, K.J.; Bareither, C.A.; Mantell, S.C.; Leclaire, D.J. The influence of moisture enhancement on landfill gas generation in a full-scale landfill. Waste Manag. 2018, 79, 647–657. [Google Scholar] [CrossRef]
- Reinhart, D.R.; McCreanor, P.T.; Townsend, T. The bioreactor landfill: Its status and future. Waste Manag. Res. 2002, 20, 172–186. [Google Scholar] [CrossRef]
- Arato, A.; Cappato, G.; Manfredi, F.; Fischetti, M.; Perissinotto, E.; Godio, A. Geophysical Time-lapse Monitoring of Leachate Recirculation in a Bioreactor Landfill. Proc. Near Surf. Geosci. 2015, 2015, 1–5. [Google Scholar]
- Audebert, M.; Clément, R.; Moreau, S.; Duquennoi, C.; Loisel, S.; Touze-Foltz, N. Understanding leachate flow in municipal solid waste landfills by combining time-lapse ERT and subsurface flow modelling—Part I: Analysis of infiltration shape on two different waste deposit cells. Waste Manag. 2016, 55, 165–175. [Google Scholar] [CrossRef]
- Imhoff, P.T.; Reinhart, D.R.; Englund, M.; Guérin, R.; Gawande, N.; Han, B.; Jonnalagadda, S.; Townsend, T.G.; Yazdani, R. Review of state of the art methods for measuring water in landfills. Waste Manag. 2007, 27, 729–745. [Google Scholar] [CrossRef]
- Kumar, D.; Jonnalagadda, S.; Jain, P.; Gawande, N.A.; Townsend, T.G.; Reinhart, D.R. Field evaluation of resistivity sensors for in situ moisture measurement in a bioreactor landfill. Waste Manag. 2009, 29, 1547–1557. [Google Scholar] [CrossRef]
- Yuen, S.T.S.; McMahon, T.A.; Styles, J.R. Monitoring in situ moisture content of municipal solid waste landfills. J. Environ. Eng. 2000, 126, 1088–1095. [Google Scholar] [CrossRef]
- Gawande, N.A.; Reinhart, D.R.; Thomas, P.A.; McCreanor, P.T.; Townsend, T.G. Municipal solid waste in situ moisture content measurement using an electrical resistance sensor. Waste Manag. 2003, 23, 667–674. [Google Scholar] [CrossRef] [PubMed]
- LaBrecque, D.J.; Miletto, M.; Daily, W.; Ramirez, A.; Owen, E. The effects of noise on Occam’s inversion of resistivity tomography data. Geophysics 1996, 61, 538–548. [Google Scholar] [CrossRef]
- Binley, A.; Shaw, B.; Henry-Poulter, S. Flow pathways in porous media: Electrical resistance tomography and dye staining image verification. Meas. Sci. Technol. 1996, 7, 384–390. [Google Scholar] [CrossRef]
- Bernstone, C.; Dahlin, T.; Ohlsson, T.; Hogland, H. DC-resistivity mapping of internal landfill structures: Two pre-excavation surveys. Environ. Geol. 2000, 39, 360–371. [Google Scholar] [CrossRef]
- Buselli, G.; Lu, K. Groundwater contamination monitoring with multichannel electrical and electromagnetic methods. J. Appl. Geophys. 2001, 48, 11–23. [Google Scholar] [CrossRef]
- Clément, R.; Descloitres, M.; Günther, T.; Oxarango, L.; Morra, C.; Laurent, J.P.; Gourc, J.P. Improvement of electrical resistivity tomography for leachate injection monitoring. Waste Manag. 2010, 30, 452–464. [Google Scholar] [CrossRef]
- Clément, R.; Oxarango, L.; Descloitres, M. Contribution of 3-D time-lapse ERT to the study of leachate recirculation in a landfill. Waste Manag. 2011, 31, 457–467. [Google Scholar] [CrossRef]
- Audebert, M.; Clément, R.; Touze-Foltz, N.; Günther, T.; Moreau, S.; Duquennoi, C. Time-lapse ERT interpretation methodology for leachate injection monitoring based on multiple inversions and a clustering strategy (MICS). J. Appl. Geophys. 2014, 111, 320–333. [Google Scholar] [CrossRef]
- Neyamadpour, A.; Wan Abdullah, W.A.T.; Taib, S.; Neyamadpour, B. Comparison of Wenner and dipole–dipole arrays in the study of an underground three-dimensional cavity. J. Geophys. Eng. 2010, 7, 30–40. [Google Scholar] [CrossRef]
- Martorana, R.; Fiandaca, G.; Casas Ponsati, A.; Cosentino, P.L. Comparative tests on different multi-electrode arrays using models in near-surface geophysics. J. Geophys. Eng. 2008, 6, 1–20. [Google Scholar] [CrossRef]
- Ogilvy, R.; Meldrum, P.; Chambers, J.; Williams, G. The use of 3D electrical resistivity tomography to characterise waste and leachate distribution within a closed landfill, Thriplow, UK. J. Environ. Eng. Geophys. 2002, 7, 11–18. [Google Scholar] [CrossRef]
- Godio, A.; Ferraris, S. Time lapse geophysics for monitoring an infiltration test in vadose zone. Boll. Geofis. Teor. Appl. 2005, 46, 201–216. [Google Scholar]
- Cassiani, G.; Godio, A.; Stocco, S.; Villa, A.; Deiana, R.; Frattini, P.; Rossi, M. Monitoring the hydrologic behaviour of a mountain slope via time-lapse electrical resistivity tomography. Near Surf. Geophys. 2009, 7, 475–486. [Google Scholar] [CrossRef]
- Lapenna, V.; Perrone, A. Time-Lapse Electrical Resistivity Tomography (TL-ERT) for Landslide Monitoring: Recent Advances and Future Directions. Appl. Sci. 2022, 12, 1425. [Google Scholar] [CrossRef]
- Binley, A.; Kemna, A. DC resistivity and induced polarization methods. In Hydrogeophysics, 1st ed.; Rubin, Y., Hubbard, S.S., Eds.; Springer: Dordrecht, The Netherlands, 2005; Volume 50, pp. 129–156. [Google Scholar]
- Binley, A. Tools and techniques: DC electrical methods, In Treatise on Geophysics, 2nd ed.; Schubert, G., Ed.; Elsevier: Amsterdam, The Netherlands, 2015; Volume 11, pp. 233–259. [Google Scholar]
- LaBrecque, D.J.; Yang, X. Difference inversion of ERT data: A fast inversion method for 3-D in-situ monitoring. J. Environ. Eng. Geophys. 2001, 6, 83–89. [Google Scholar] [CrossRef]
- Audebert, M.; Clément, R.; Grossin-Debattista, J.; Günther, T.; Touze-Foltz, N.; Moreau, S. Influence of the geomembrane on time-lapse ERT measurements for leachate injection monitoring. Waste Manag. 2014, 34, 780–790. [Google Scholar] [CrossRef]
- Loke, M.H. and Barker, R.D. Least-squares deconvolution of apparent resistivity pseudosections. Geophysics 1995, 60, 1682–1690. [Google Scholar] [CrossRef]
- Grellier, S.; Reddy, K.R.; Gangathulasi, J.; Adib, R.; Peters, C.C. Correlation between electrical resistivity and moisture content of municipal solid waste in Bioreactor landfill. Geoenviron. Eng. 2007, 163, 1–14. [Google Scholar]
- Ko, J.H.; Yang, F.; Xu, Q. The impact of compaction and leachate recirculation on waste degradation in simulated landfills. Bioresour. Technol. 2016, 211, 72–79. [Google Scholar] [CrossRef]
- Ozkaya, B.; Demir, A.; Basturk, A.; Bilgili, M.S. Investigation of leachate recirculation effects in Istanbul Odayeri sanitary landfill. J. Environ. Sci. Health Part A 2004, A39, 873–883. [Google Scholar] [CrossRef] [PubMed]
Figure 1.
Test site with the position of the transects of the ERT on the landfill (L1–L6); the coordinate of the lower-left corner of the image is 44°53′02 N–8°22′7 E. The image is aligned south to north along the vertical direction. Red lines refer to the ERT lines of the preliminary characterization (48 electrodes, spacing 2 m): the labels of each line indicate the position of the first electrode of each section (relative coordinate of 0 m). The yellow line refers to the position of the ERT adopted for the infiltration test (48 electrodes, spacing 1 m); the first electrode is located at the south-east side. The blue circle refers to the injection well of the test of leachate recirculation; the green circle refers to the position of the borehole, which is addressed with electrodes and used for monitoring the leachate recirculation process within the landfill.

Figure 2.
Forward modelling of the apparent resistivity distribution in a section of the landfill to check the impact of high-resistive material at the bottom of the waste (to simulate the effect of the liner); (a) a high-resistive layer is added at the depth of the 15 m from the ground surface (yellow layer); (b) the same model computation without the high-resistive material at the bottom.


Figure 3.
Preliminary characterization of the landfill by ERT sections: lines L1 and L3 along SW–NE direction, and line L6 along SE–NW direction.
Figure 3.
Preliminary characterization of the landfill by ERT sections: lines L1 and L3 along SW–NE direction, and line L6 along SE–NW direction.

Figure 4.
Infiltration results: resistivity section at t = t0 and relative resistivity difference at t = t1, t2, t3, t4 and t5 (the black rectangle shows the section of the irrigation trench).
Figure 4.
Infiltration results: resistivity section at t = t0 and relative resistivity difference at t = t1, t2, t3, t4 and t5 (the black rectangle shows the section of the irrigation trench).

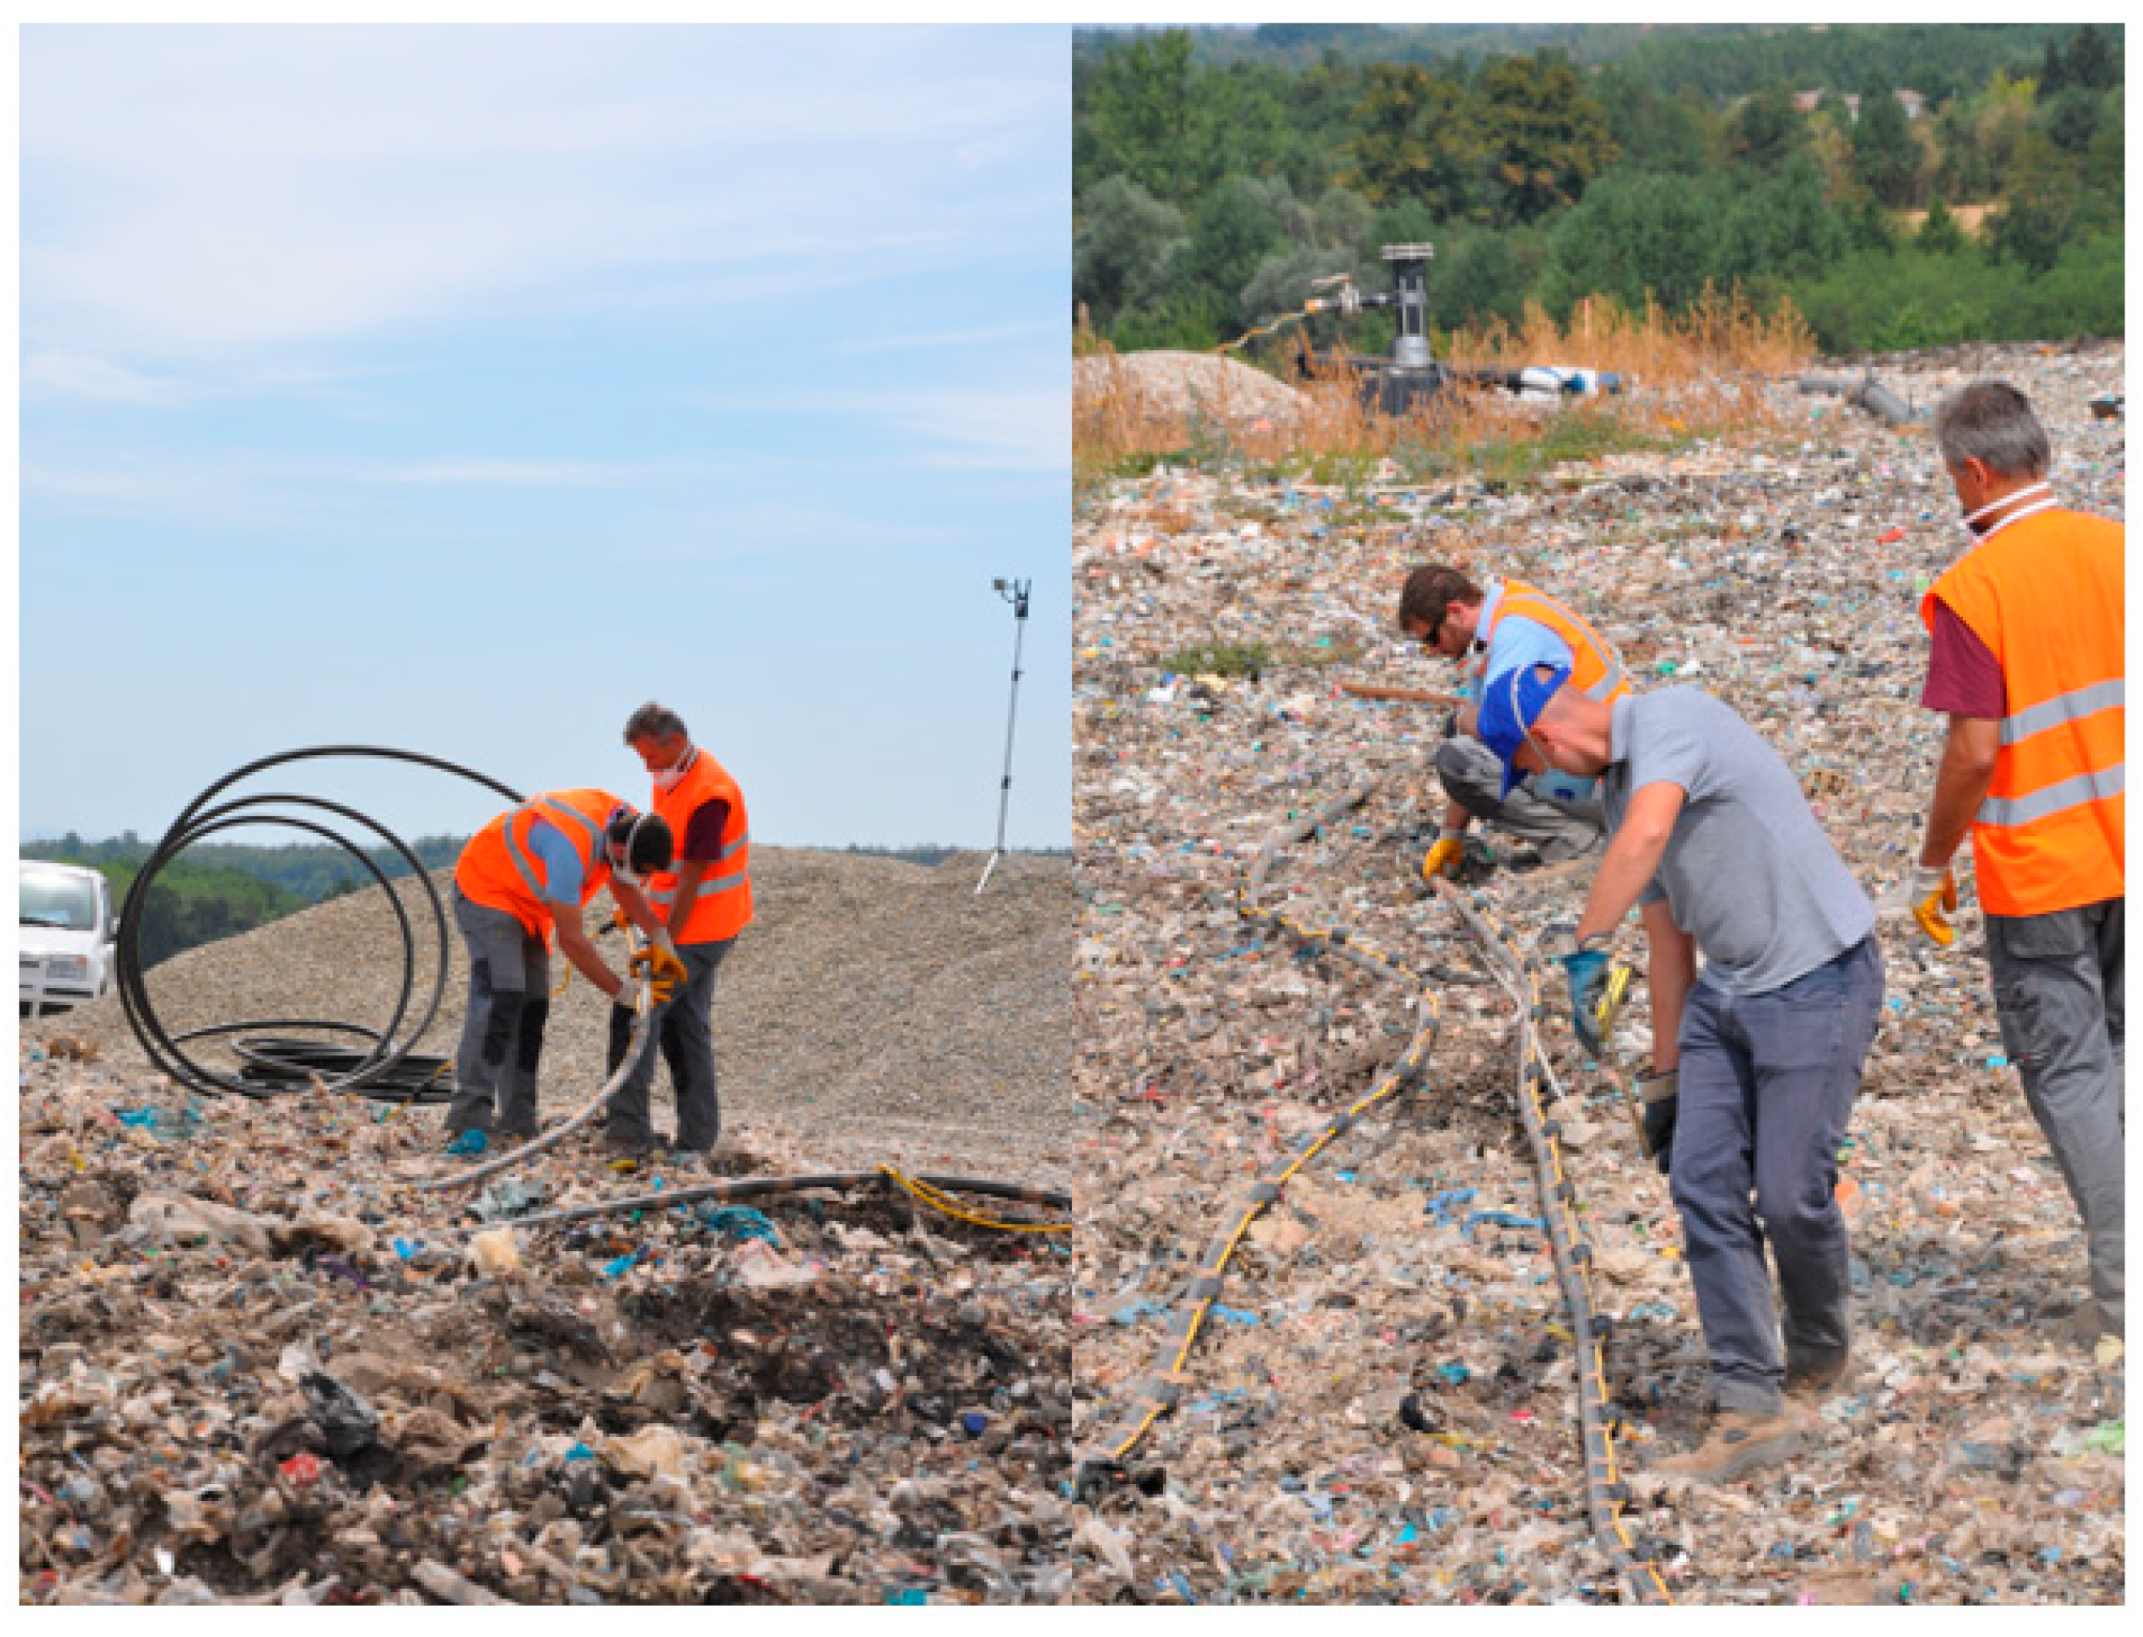
Figure 5.
Phases of preparation and installation of the electrodes for borehole and cross-hole monitoring of electrical resistivity. The graphite electrodes are installed on the external side of the HDPE tube of the piezometers.
Figure 5.
Phases of preparation and installation of the electrodes for borehole and cross-hole monitoring of electrical resistivity. The graphite electrodes are installed on the external side of the HDPE tube of the piezometers.

Figure 6.
ERT results during leachate recirculation, with resistivity difference after 2 days of leachate injection (the dashed line and circle detect the position of surface electrodes).
Figure 6.
ERT results during leachate recirculation, with resistivity difference after 2 days of leachate injection (the dashed line and circle detect the position of surface electrodes).

Figure 7.
Influence of leachate recirculation on ratio CH4/CO2: (a) well A; (b) well C.

Figure 8.
Temperature and pH of the recirculated leachate.

Figure 9.
COD, chlorides and N-NH4+ content of the recirculated leachate.

Disclaimer/Publisher’s Note: The statements, opinions and data contained in all publications are solely those of the individual author(s) and contributor(s) and not of MDPI and/or the editor(s). MDPI and/or the editor(s) disclaim responsibility for any injury to people or property resulting from any ideas, methods, instructions or products referred to in the content. |
© 2023 by the authors. Licensee MDPI, Basel, Switzerland. This article is an open access article distributed under the terms and conditions of the Creative Commons Attribution (CC BY) license (https://creativecommons.org/licenses/by/4.0/).
Share and Cite
MDPI and ACS Style
Godio, A.; Chiampo, F. Geophysical Monitoring of Leachate Injection in Pretreated Waste Landfill. Appl. Sci. 2023, 13, 5661. https://doi.org/10.3390/app13095661
AMA Style
Godio A, Chiampo F. Geophysical Monitoring of Leachate Injection in Pretreated Waste Landfill. Applied Sciences. 2023; 13(9):5661. https://doi.org/10.3390/app13095661
Chicago/Turabian StyleGodio, Alberto, and Fulvia Chiampo. 2023. "Geophysical Monitoring of Leachate Injection in Pretreated Waste Landfill" Applied Sciences 13, no. 9: 5661. https://doi.org/10.3390/app13095661
Note that from the first issue of 2016, this journal uses article numbers instead of page numbers. See further details here.