Article

Evaluation of the Different Fractions of Organic Matter in an Electrochemical Treatment System Applied to Stabilized Leachates from the Bordo Poniente Landfill in Mexico City

by
Alfredo Martínez-Cruz
and
María Neftalí Rojas-Valencia
*
Institute of Engineering, National Autonomous University of Mexico, External Circuit, University City, Coyoacan Delegation, Mexico City 04510, Mexico
*
Author to whom correspondence should be addressed.
Appl. Sci. 2023, 13(9), 5605; https://doi.org/10.3390/app13095605
Submission received: 12 April 2023 / Revised: 28 April 2023 / Accepted: 29 April 2023 / Published: 1 May 2023

Abstract

:

Featured Application

Understanding leachate treatment systems through organic matter monitoring.

Abstract

The presence of refractory compounds in stabilized leachates makes treatment complex. In leachate treatment systems, the lack of data on the characterization of leachates and effluents makes it difficult to track and explain the evolution of organic matter. In this study, the fractionation of chemical oxygen demand (COD) and humic substances, including humic acids (HA) and fulvic acids (FA), in addition to the application of spectroscopic techniques (Fourier transform infrared and ultraviolet–visible spectroscopy), were used to solve this data gap. A treatment system was proposed: electro-coagulation (EC) and electro-oxidation (EO). Optimal conditions (maximum COD removal) were EC, I: 4.3 A, stirring: 120 revolutions per minute, and pH: 7; EO, added NaCl: 1.0 g L−1, distance between electrodes: 0.75 cm, I: 2 A, and pH: 7. Under optimal conditions COD, HA, and FA % removals were achieved: EC: 64, 69, and 63; EO: 83, 40, and 55; respectively. In EC, the % of biodegradable COD increased from 26 to 39 and in EO it increased from 39 to 58. The biodegradability index increased from 0.094 to 0.26 with EC and reached 0.46 with EO. The generated data allowed us to establish the transformations of organic matter in the process, which was useful for understanding the processes and functioning as a tool for improving treatment systems.

1. Introduction

The generation of municipal solid waste (MSW) has increased as a result of continuous improvements in living standards and the expansion of the global economy [1,2]. MSW management has very different characteristics in developed and developing countries. European countries have focused their attention on prevention and recycling rather than final disposal. The European Commission has set a target of recycling 65% of the MSW generated in 2023, thereby reducing MSW deposited in landfills. In 2014, some countries recycled at least 50% of their waste, as was the case in the Netherlands, Belgium, Austria, Sweden, and Switzerland. The percentage of MSW deposited in landfills decreased from 49% in 2004 to 34% in 32 member countries of the European Economic Area [3]. A different situation occurs in developing countries, where more than 90% of urban solid waste is burned or deposited in uncontrolled places [4]. The risks to the environment and health are significantly increased by inadequate management of MSW. Based on studies by Seibert et al. [5] and Khalil et al. [6], landfill operations present a risk of contamination in aquifers, seas, soils, and surface water. Owing to the decomposition of MSW and the filtration of rainwater, landfills produce highly contaminated wastewater known as leachate landfills [7], which will be referred to as leachates in this document. Leachate treatment is a fundamental requirement to prevent possible environmental effects. However, owing to its high degree of compositional and quantitative variability, the leachate treatment is complex [8,9,10]. More specifically, stabilized leachates from landfills over ten years old contain refractory or recalcitrant compounds, which further problematize treatment [11]. Low chemical oxygen demand (COD) characterizes stabilized leachates (<5.0 g L−1), low biodegradability index (BI) (ratio between biochemical oxygen demand (BOD5) and COD) <0.1, and high pH > 7.5 [11,12,13,14]. Leachates typically contain heavy metals such as copper (Cu2+), zinc (Zn2+), cadmium (Cd2+), lead (Pb2+), chromium (Cr3+), and nickel (Ni2+) [15,16,17,18]. For stabilized leachates, these levels remain low due to an increase in pH, which is characteristic of the methane-generating stages of MSW decomposition in landfills, increasing the soil’s sorption capacity and immobilizing the metals [15,19]. The refractory organic fraction of stabilized leachates consists mainly of humic materials, such as humic acids (HA) and fulvic acids (FA), which are highly toxic and complex in composition. Owing to their aromatic structures, humic substances are known for their high molecular weight and low biodegradability [11,20]. Due to the presence of refractory organic compounds that affect the microbial activity of these systems, conventional biological methods are ineffective for treating the stabilized leachates. Different processing technologies are usually required owing to the complex nature of stabilized leachates [21].
Electrochemical processes have replaced chemical oxidation as the preferred method for the treatment of stabilized leachates and have proven to be a viable alternative [22,23]. Electro-oxidation (EO) and electro-coagulation (EC) are electrochemical treatment options. Economically viable and employing an ecological strategy, EC has a high capacity for removing pollutants. Adb et al. [24] reported that EC works by producing ions via electricity-mediated electrolysis. Owing to their accessibility, superior ability to remove contaminants, and continuous production of active ions, aluminum (Al) and iron (Fe) are the materials most frequently used as anodes in the EC process [25]. In the case of treatment with EO, it is essential to emphasize that it is a safe and environmentally friendly alternative that is good at what it does, does not generate secondary contamination, and has applications in the treatment of wastewater with recalcitrant organic matter content. Both direct and indirect oxidation can occur during EO. In direct oxidation, a hydroxyl radical (•OH) is produced, which causes oxidation of organic matter on the anode surface. Organic matter undergoes indirect oxidation when byproducts of the solution (•OH, O3, and HClO) are produced [13]. Clematis and Panizza [26] asserted that boron-doped diamond (BDD) anodes remove organic matter at a high rate. The presence of colloidal and hydrophobic humic substances (HA and FA), which can affect process efficiency and increase energy costs, is a challenge in the treatment of stabilized leachates through the EO process. The development of a separation alternative, such as pretreatment, would increase the effectiveness of the treatment process by eliminating interference from these colloidal species [27,28,29]. The treatment of leachates is difficult and the organic matter involved is not sufficiently characterized. Abunama et al. [30] examined more than 210 scientific papers on leachates and their treatments published between 2009 and 2021 and found that pH (95%) was the most frequently evaluated parameter, followed by COD (85%), BOD5 (78%), chloride (Cl) (61%), and ammonia nitrogen (NH3-N) (55%).
Monitoring the development of organic matter throughout the process is required to improve the leachate treatment systems. By characterizing organic matter, we can better understand its evolution in terms of composition, origin, and biodegradability, which supports the choice of treatment options. Because stabilized leachates could contain humic substances that the EC process can eliminate [31], this study suggests that the EC process is the initial stage of treatment, followed by EO. From the suggested treatment system (EC-EO), the contribution of this research was to create, in addition to the distinctive measurements of COD and dissolved organic carbon (DOC), a complete characterization of the present organic matter. It was challenging to track and explain the evolution of organic matter in various fractions because of the scarcity of information on the characterization of leachates and effluents. This study used analytical and spectroscopic methods to measure and track various fractions of organic matter in a stabilized leachate treatment system in order to close this data gap. The methods of analysis included determination of COD fractions (soluble COD-CODs, biodegradable COD-CODb, and particulate COD-CODp) and fractions of humic substances (HA, FA, and hydrophilic fraction -HyL). In addition, spectroscopic techniques, including ultraviolet–visible (UV-VIS) and Fourier transform infrared spectroscopy (FTIR), were used. These findings will be useful in determining how the process transforms recalcitrant organic matter and for understanding and improving stabilized leachate treatment systems. The characterization of organic matter in wastewater has recently been the subject of numerous investigations using spectroscopic methods [32,33], including leachate analysis [21,34]. Various studies have monitored humic substances in leachates [35,36,37], including COD fractionation [23,38,39,40]. However, there are knowledge gaps in the use of these techniques as tools to understand processes and make decisions to determine the best treatment strategy. As far as we know, this study is the first to follow the evolution of organic matter in a system with specific characteristics, as suggested by this project.
The main aims of this study were as follows: (a) to characterize leachates from the Bordo Poniente landfill in Mexico City, Mexico and classify them according to their parameters (pH, COD, and BOD5); (b) to optimize the operating conditions of EC and EO processes through a fractional orthogonal experimental design and response surface methodology; (c) to use fractionation of COD and humic substances as well as UV-VIS and FTIR spectroscopic methods to characterize organic matter in leachates and effluents produced by the proposed treatment system; (d) to interpret and explain the results of organic matter characterization in terms of composition, origin, and biodegradability.

2. Materials and Methods

The methodology of this project was divided into six phases. The first phase involved a description of the study area. The second phase represented the sampling of leachates. The third stage detailed the procedures for the characterization of the samples (leachates and effluents), including the methods used for the characterization of organic matter using analytical and spectroscopic techniques. The fourth phase included details of the experimental procedures for the EC and EO processes. The fifth phase incorporated the experimental design and statistical analysis of the generated data. The sixth phase involved the elaboration of graphs to follow the organic matter in the proposed treatment system.

2.1. First Phase: Description of the Study Area

The leachates used in this study were obtained from the Bordo Poniente landfill Stage III. This landfill is located southwest of the former Lake Texcoco (onto whose dried bed it was moved) five kilometers from the international airport of the City of Mexico, has an area of 670 ha, and was operated from 1985 to 2011. The largest landfill in Latin America is 76 million tons [41]. The average characterization of the MSW contained in this landfill included 40% recyclable materials (cardboard, paper, plastics, etc.), 40% organic matter (food waste, wood, etc.), and 20% other materials (cotton, rag, ceramics, etc.) [42]. The average altitude of the area is approximately 2220 m above average sea level and the average annual rainfall is 554 mm, with concentrated precipitation between June and September and a peak in August. The average minimum and maximum temperatures recorded in the area are approximately 6.4 °C and 24.5 °C in January and May, respectively. The prevailing winds are from the northwest and occasionally from the north. The climate of the area is dry, temperate, or semi-cold [43]. Its geographical coordinates are longitude 99°00′14.51″ and 99°02′36.21″ west; latitude 19°26′09.36″ and 19°29′09.22″ north. Currently, this landfill is closed and is subject to leachate control [44,45]. The soil is of the Solonchak type, which is distinguished by an excess of salts (influenced by its lacustrine origin) and is present on the surface of a clay layer that breaks into polygons when dry [46,47]. This landfill has four stages that represent the different stages of operation. The leachates used in this project were collected from Stage III, with an area of 104 ha and received 6.9 million tons of MSW from Mexico City from 1991 to 1994 [45] (Figure 1).

2.2. Second Phase: Leachate Sampling

In the field sampling, leachate samples were collected from the main culvert of Stage III of the Bordo Poniente landfill, approximately 80 L, in previously cleaned polyethylene bottles filled without leaving space to avoid contact with air, according to the standard method ISO 5667-10 [48]. All samples were immediately transferred to the laboratory at 4 °C prior to the analysis.

2.3. Third Phase: Characterization of Leachates and Effluents

The American Standard Test Methods (ASTM) were used to determine the DOC and color. Standardized APHA (American Public Health Association) methods were used for pH, COD, BOD5, Cl, electrical conductivity (ELC), oxidation/reduction potential (Eh), and NH3-N. The methods used to characterize the leachates and effluents are listed in Table 1.
The inert or non-biodegradable COD fraction (CODnb) was determined by aerating a 1.0 L sample, keeping the initial volume constant by adding distilled water. CODb was determined by the difference in CODt [23,40]. The CODs were determined using ZnSO4 as a coagulant and passing the sample through a 0.45 µm membrane filter. Particulate COD (CODp) was obtained by subtracting CODt [23,38]. CODsb was reported as CODb, whereas non-biodegradable soluble COD (CODsnb) was determined by the difference between CODs and CODsb [22]. In addition, the percentage of each COD fraction (in relation to CODt or CODb) was calculated to identify variations in the data during the treatment process. The humic fractions of organic matter in the leachates and effluents (HA, FA, and HyL) were determined according to their solubilities in acidic and basic media [35]. HA is only soluble in alkaline media, whereas FA can solubilize under any pH condition [24]. The methodology used to determine the fractions of humic substances is presented in detail in Figure 2.

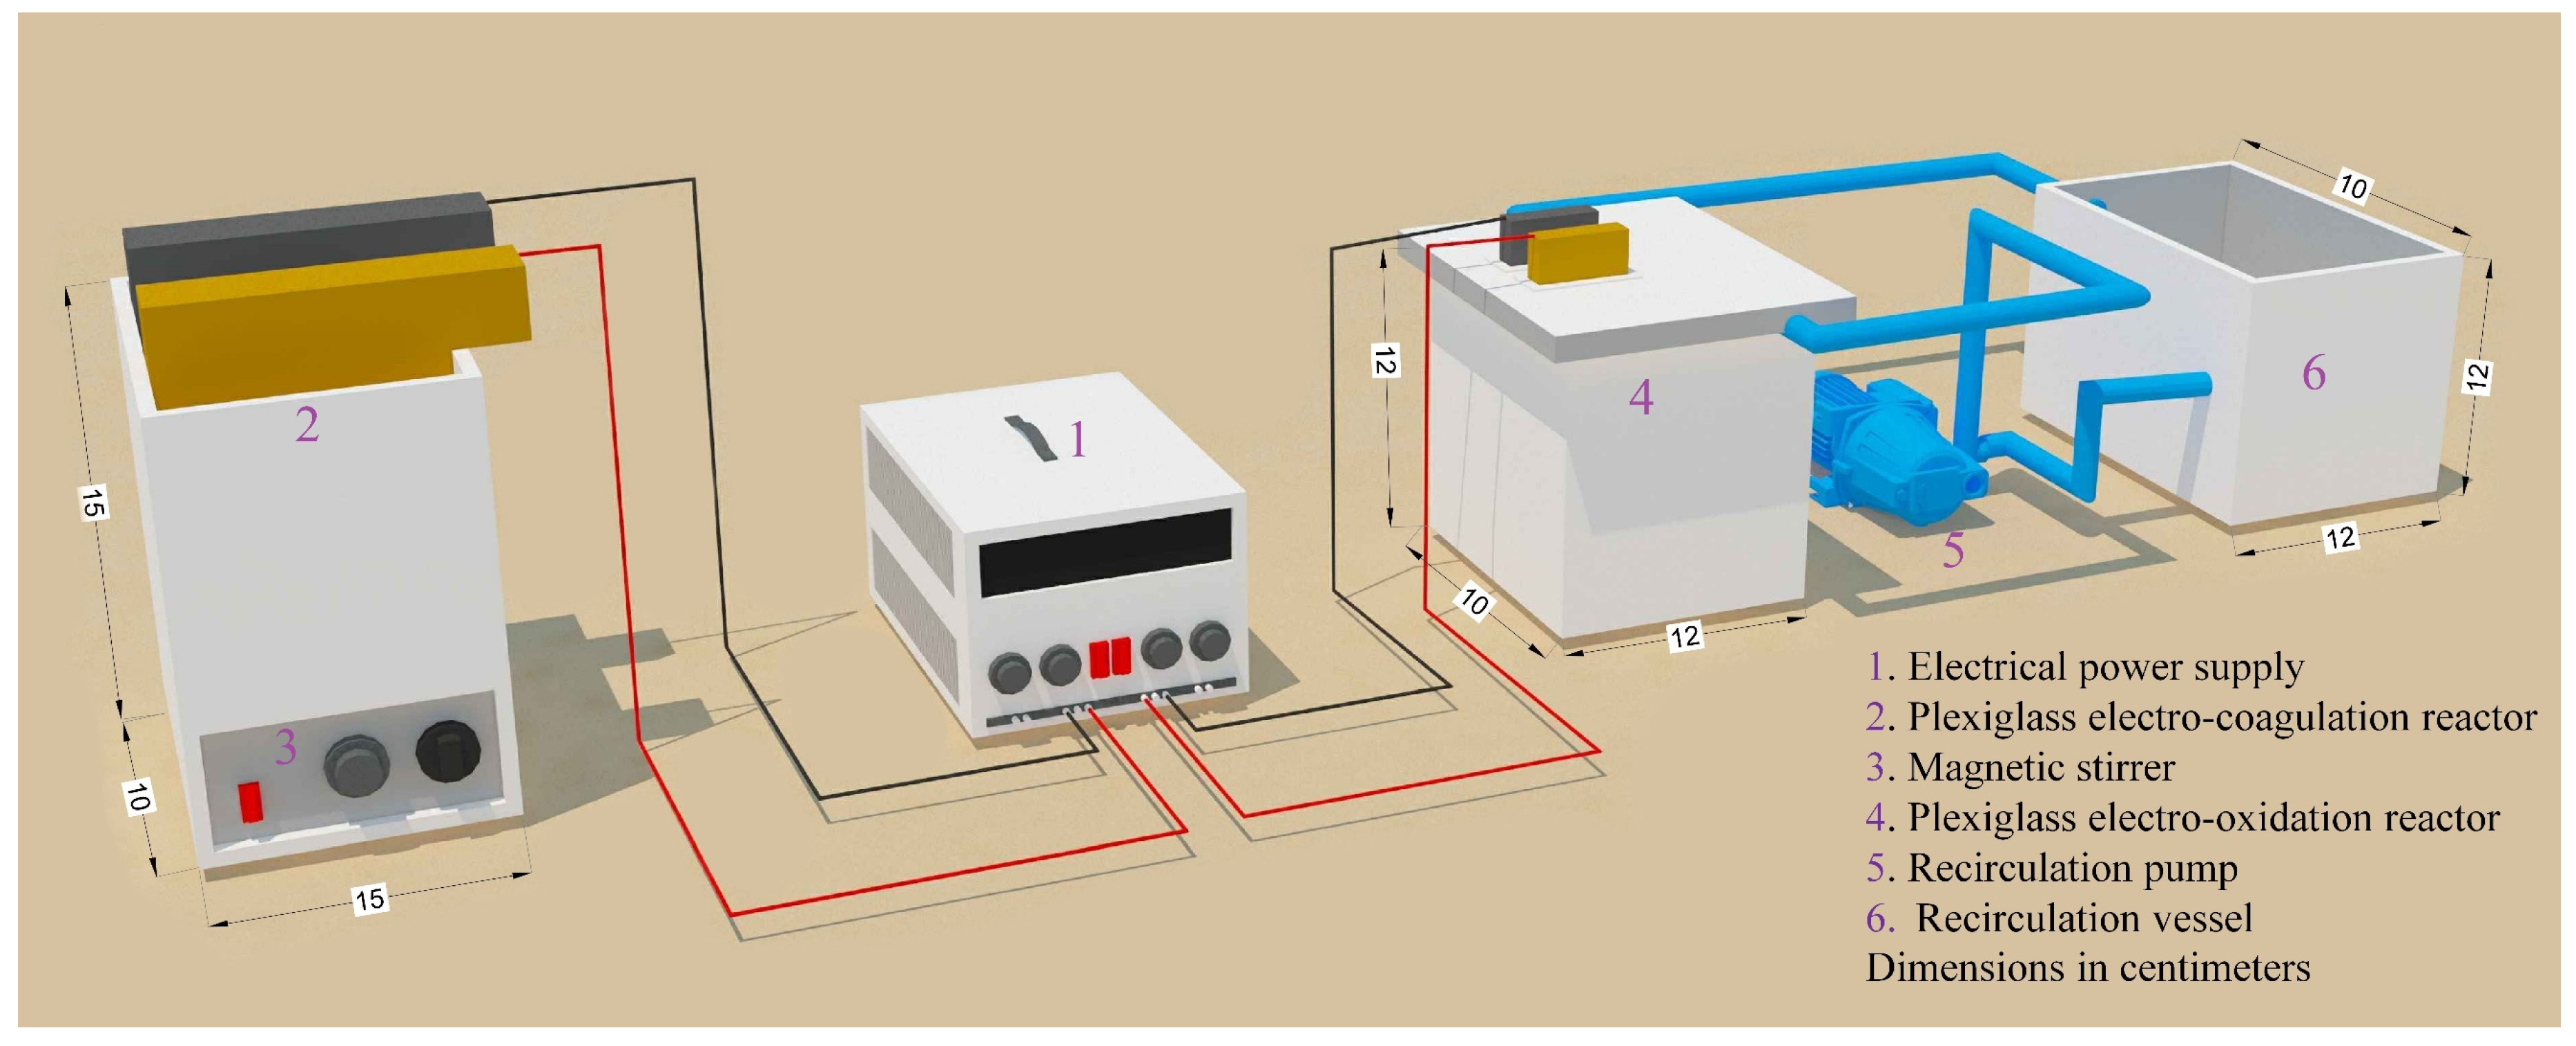
Equipment and Materials

The total COD (CODt) of leachates and samples was determined by a closed-reflux method using a portable DR1900 Hach spectrophotometer® (Hach®, Loveland, CO, USA). In this study, mercuric sulfate (HgSO4) was used to reduce Cl interference when the concentration exceeded 2000 ppm, as recommended by APHA method 5220D [49]. DOC was determined using a Shimadzu TOC-NT CSH analyzer® (Shimadzu®, Tokyo, Japan), equipped with a self-sampler. The ELC and pH were measured using a Hach Sension+ MM374 pH meter® (Hach®, Loveland, CO, USA) equipped with pH and conductivity probes. All the chemicals used were of laboratory grade (Merck KGaA®, Darmstadt, Germany). The DAX 8 (Supelite® DAX-8) resin was purchased from Sigma-Aldrich®(Merck KGaA®, Darmstadt, Germany). It is a non-functionalized resin with strong hydrophobic organic matter, endorsed by humic and fulvic acids. MilliQ® (Merck KGaA®, Darmstadt, Germany) water was used for all dilutions of the reagents and samples. Before use, all glass articles were cleaned with 1% HCl solution and rinsed with Milli Q water. All analyses were performed in triplicates.
The characteristics of the organic matter in the samples were studied using two spectroscopic methods: UV-VIS and FTIR. Absorbance (UV-VIS) was measured with an AquaMate Plus brand spectrophotometer® (Thermo Fisher Scientific Inc.®, Waltham, MA, USA) with a 1 cm quartz cell, measuring absorbance at wavelengths of 200 to 600 nm with a spectral bandwidth of 1 nm in increments of 4 nm. MilliQ® water was used as the white sample. A deuterium lamp and a tungsten lamp were used to generate UV and visible light, respectively. The equipment had a spectral accuracy (for equipment validation) of ±0.1 nm for the tungsten lamp and ±0.3 nm for the deuterium lamp.
FTIR spectra were recorded on a Nicolet 6700 device® (Thermo Fisher Scientific Inc.®, Waltham, MA, USA) in the wavenumber range 400 cm−1–1800 cm−1. The attenuated total reflection (ATR) technique allows spectra to be measured without having to prepare samples or use dilutions, and, if it was a method with good resolution of the resulting spectra regardless of the physical state of the samples, this method was chosen. The penetration (interaction) of the infrared beam was recorded in an attenuated form in the sample at a short distance. Light energy passes through a high-refractive-index optical crystal that does not absorb infrared radiation (i.e., the ATR sensor, zinc selenide (ZnSe) reinforced with a diamond coating was used). A simple internal reflection ATR accessory with a press was used. The equipment had a signal-to-noise ratio of 50,000:1 and a spectral resolution of 0.25 cm−1 and a fast recovery deuterated triglycine sulfate (DTGS) detector with OMNIC software. The samples were analyzed in the solid state with the aim of eliminating water interference (broadband around 3500–3200 cm−1, which was due to O-H bond stretch vibrations), for which the sample was dried by means of moderate heating at 50 °C. The spectra were recorded in absorbance mode.

2.4. Fourth Phase: Experimental Procedure

Two different plexiglass parallelepiped-shaped reactors were used for EC and EO processes. For the EC process, the dimensions of the reactor were 15 cm × 10 cm × 15 cm, with a useful volume of 1.5 L, and an Fe anode and a stainless-steel cathode with dimensions of 10 cm × 10 cm × 0.4 cm, with an effective area of 160 cm2 each and a distance between electrodes of 1 cm. The dimensions of the EO reactor were 12 cm × 10 cm × 12 cm, with a useful volume of 1.5 L, and a BDD anode and a stainless-steel cathode were used, with dimensions of 7 cm × 5 cm × 0.1 cm, both with an effective area of 60 cm2. The EO process used a filter-press arrangement in an upper frame that held the electrodes (with the option of varying the distance between electrodes at 0.5, 1.0, and 1.5 cm), with a continuous flow of input and output using a recirculation vessel at a rate of 1.5 L min−1. Both the EC and EO electrodes were connected in monopolar mode in parallel to a digital DC power supply Steren PRL258® (Steren®, Mexico City, Mexico) in the batch operation mode (Figure 3).
In the first stage, the leachate was subjected to EC treatment, in which the independent variables were the intensity of electrical current (I), stirring (in revolutions per minute -RPM-), and pH. Once the optimal values were obtained for maximum COD removal, the effluent obtained was subjected to the EO process, in which the independent variables were I, electrode separation (D), addition of additional electrolyte (NaCl), and pH, to obtain optimal conditions for maximum COD removal.

2.5. Fifth Phase: Statistical Analysis and Design of Experiments

Kolmogorov–Smirnov (KS) tests were performed to check normality (p > 0.05) and the Levene analysis (LA) was used to evaluate the equality of variances (p > 0.05) of the experimental data. The EC and EO processes were optimized for maximum COD removal using a fractional orthogonal design L9 (34) to minimize the number of runs and standard error of the model (nine experiments with three replicates) [52] with response surface methodology (RSM).
RSM was used to evaluate the effects of the variables of the processes and thus determine the conditions of greater removal of COD [53]. The statistical program Minitab 14 (Minitab LLC.®, State College, PA, USA) was used for the analysis of experimental data, including fractional orthogonal design, response surface methodology, and analysis of variance (ANOVA). The values of the independent variables in the EC and EO systems were established based on data from the literature and preliminary experimental tests. The experimental conditions are listed in Table 2.

2.6. Monitoring the Evolution of the Evaluated Parameters and Kinetic Analysis

Graphs for COD, DOC, color, NH3-N, and Cl were constructed to follow the evolution of the parameters evaluated in the EC and EO processes. To perform this, the standard values of the parameters (XN) were calculated using Equation (1), where “Xt” represents the parameter in time “t” and “X0” is the value of the parameter in the influent.
X N = X t X 0
Considering that the reaction rate was a measure of the rapidity with which the reagents were consumed, or the product was formed, it was possible to express the change in the evaluated parameters of the effluents over a certain time span using the reaction rate equation (Equation (2)).
d   X d   t = k   X α
where “k” is the so-called kinetic constant (which depends on the type of reaction) and “α” is the order of the reaction with respect to “X”. A pseudo-first-order reaction was established for the evaluated parameters, as shown in Equation (3) and its integrated and linearized expressions (Equation (4)).
Ao A d [ X ] [ X ] = k 0 t dt
Ln   [ X ] t = k   t + Ln [ X ] O
“X” represents the evaluated parameter. The kinetic constant of reaction (k) was calculated by evaluating model adjustment using the correlation coefficient of determination (R2). The coefficient of determination was used as a measure of the regression equation’s ability to obtain good predictions (in the sense that they were as least erroneous as possible). The coefficient of determination is the square of the Pearson correlation coefficient and gives the proportion of variation of the variable “Y”, which is explained by the variable “X” (predictor or explanatory variable). If it is equal to “0” it means that the predictor variable has zero predictive capacity. The higher the value, the better the prediction. If it were to be equal to 1 the predictor variable would explain all the variations of “Y” and the predictions would not be wrong [54].

3. Results and Discussion

3.1. Characterization of Raw Leachates

The characterization results of the raw leachates are listed in Table 3. The crude leachate had a relatively high electrical conductivity of 8.5 ± 0.3 mS cm−1, which was directly attributed to the high charge of dissolved anions and cations, both as dissolved organic matter and in the form of inorganic ions [7]. The inorganic ions present included Cl. The concentration of Cl in the crude leachates was 6700 ± 200 mg L−1. It is important to note that the Cl content in leachates is usually not mitigated by soil and is highly mobile [55]. Cl content can be used as a strong indicator of pollution [56].
The high amount of Cl in the leachate can be attributed to the particular mixture of MSWs in the landfill site [57]. These MSWs contain significant amounts of soluble salts from anthropogenic sources, such as food waste from hotels, restaurants, and homes [30]. Although we must not forget that the Bordo Poniente landfill is located in a highly saline area, it also contributed to the high value of Cl present in the leachates analyzed. This high conductivity prevented the addition of any additional electrolytes during the EC treatment. The total COD value was 3400 ± 100 mg L−1. Significant differences were found when comparing the results obtained with other stabilized leachates. Aftab et al. [58] obtained a COD of 536 mg L−1. Poblete and Pérez [59] found a COD of 12,300 mg L−1. Even in a previous investigation carried out by the same working group at the same sampling site, a COD of 2100 ± 100 mg L−1 was obtained [60]. These distinct differences between leachates are caused by the variability in their composition and production [61,62]. Owing to the MSW composition, landfill practices, ambient temperature, and age of the MSW, leachate composition varies considerably [7].
The DOC value of the crude leachates was 1200 ± 50 mg L−1. The determination of organic carbon in samples is considered a more environmentally friendly parameter with respect to the use of chemicals and is more accurate in the case of wastewater. It should be noted that DOC determination may underestimate the levels of organic carbon in municipal and industrial wastewater [63]. Although leachates came from a landfill closed in 1994, the DOC content could mainly include high-molecular-weight humic compounds [24]. Humic compounds included HA and FA, which were two main classes. HA was soluble only in alkaline media, whereas FA was soluble under all pH conditions [64]. The pH obtained was 8.4 ± 0.2, which was consistent with other investigations of stabilized leachates. Poblete and Pérez [59] and Martínez-Cruz et al. [60] found a pH of 8.9 in stabilized leachates. The alkaline pH values for stabilized leachates are justified by the acetogenic and methanogenic stages of MSW in a sanitary landfill, as discussed in the literature [65]. At the general level, stabilized leachates have a pH value greater than 7.0 because of the microbiological reduction of volatile fatty acids and the depletion of the leaching force during the methanogenic phase [66,67].
The BI value obtained for raw leachates was 0.094 ± 0.003. BI values are commonly used to provide information on the biodegradability of leachates. Young leachates have a BI of 0.4–0.6 or even more [68] and stabilized leachates have low BI values between 0.05–0.2 [69]. It was confirmed that the sampled leachate belonged to the stabilized type. This was to be expected, given that Stage III of the Bordo Poniente landfill has been closed since 1994, with an age well above 10 years. A BI below 0.1 is a sign of a high content of stabilized and recalcitrant organic matter [30]. This was confirmed by the obtained value of 74% CODnb. Generally, it is recommended that young leachates undergo biological treatment [70]. The low biodegradability of stabilized leachates indicates that physicochemical options are recommended for biological processes [30,71]. Therefore, the choice of the electrochemical treatment for this project was successful.
The raw leachate had a color value of 3200 ± 100 Pt-Co U. The color of leachates can be associated with the presence of stabilized organic substances, such as humic substances, mainly HA and FA [60,72,73]. Darker leachates are associated with a higher content of humic substances; therefore, the organic matter content can be determined according to the color of the leachate [74]. A decrease in color in the treated leachates implies a reduction in the humic substance content (see Section 3.4.1). Hydrogen sulfide (H2S) and NH3-N give raw leachates a mild unpleasant smell [75,76]. A total of 660 ± 30 mg L−1 of NH3-N was detected. The biological breakdown of amino acids and other nitrogenous organic materials in MSW results in the presence of NH3-N in leachates [30]. Because NH3-N is the longest-lasting component of leachate and has a high degree of stability under anaerobic conditions, it is used to assess the contamination risk in landfills [77]. Eutrophication, which is caused by high NH3-N values, causes a decrease in dissolved oxygen. The treatment of biological leachates may be halted owing to the toxicity of NH3-N [31,56]. It was possible to verify that the electrochemical treatment options chosen in this study were appropriate. The % of CODp was 48, indicating that the colloidal materials were amenable to EC. CODsnb accounted for 50 percent of the total soluble material.

3.2. Characterization of Effluents Generated in Electro-Coagulation and Electro-Oxidation Experiments

The evolution results of the parameters evaluated with respect to time in the CE and EO processes are shown in Figure 4 and Figure 5, respectively. Raw leachate was used as an influent in the EC experiments. The leachate treated under the maximum DOC removal conditions was used as an influent for the EO tests.
After the experiments, the percentage of COD removal from the effluents generated for the EC and EO experiments was calculated. Table 4 records the data generated, the values that served as the basis for statistical analysis, and the calculation of the operating conditions for maximum DOC removal.

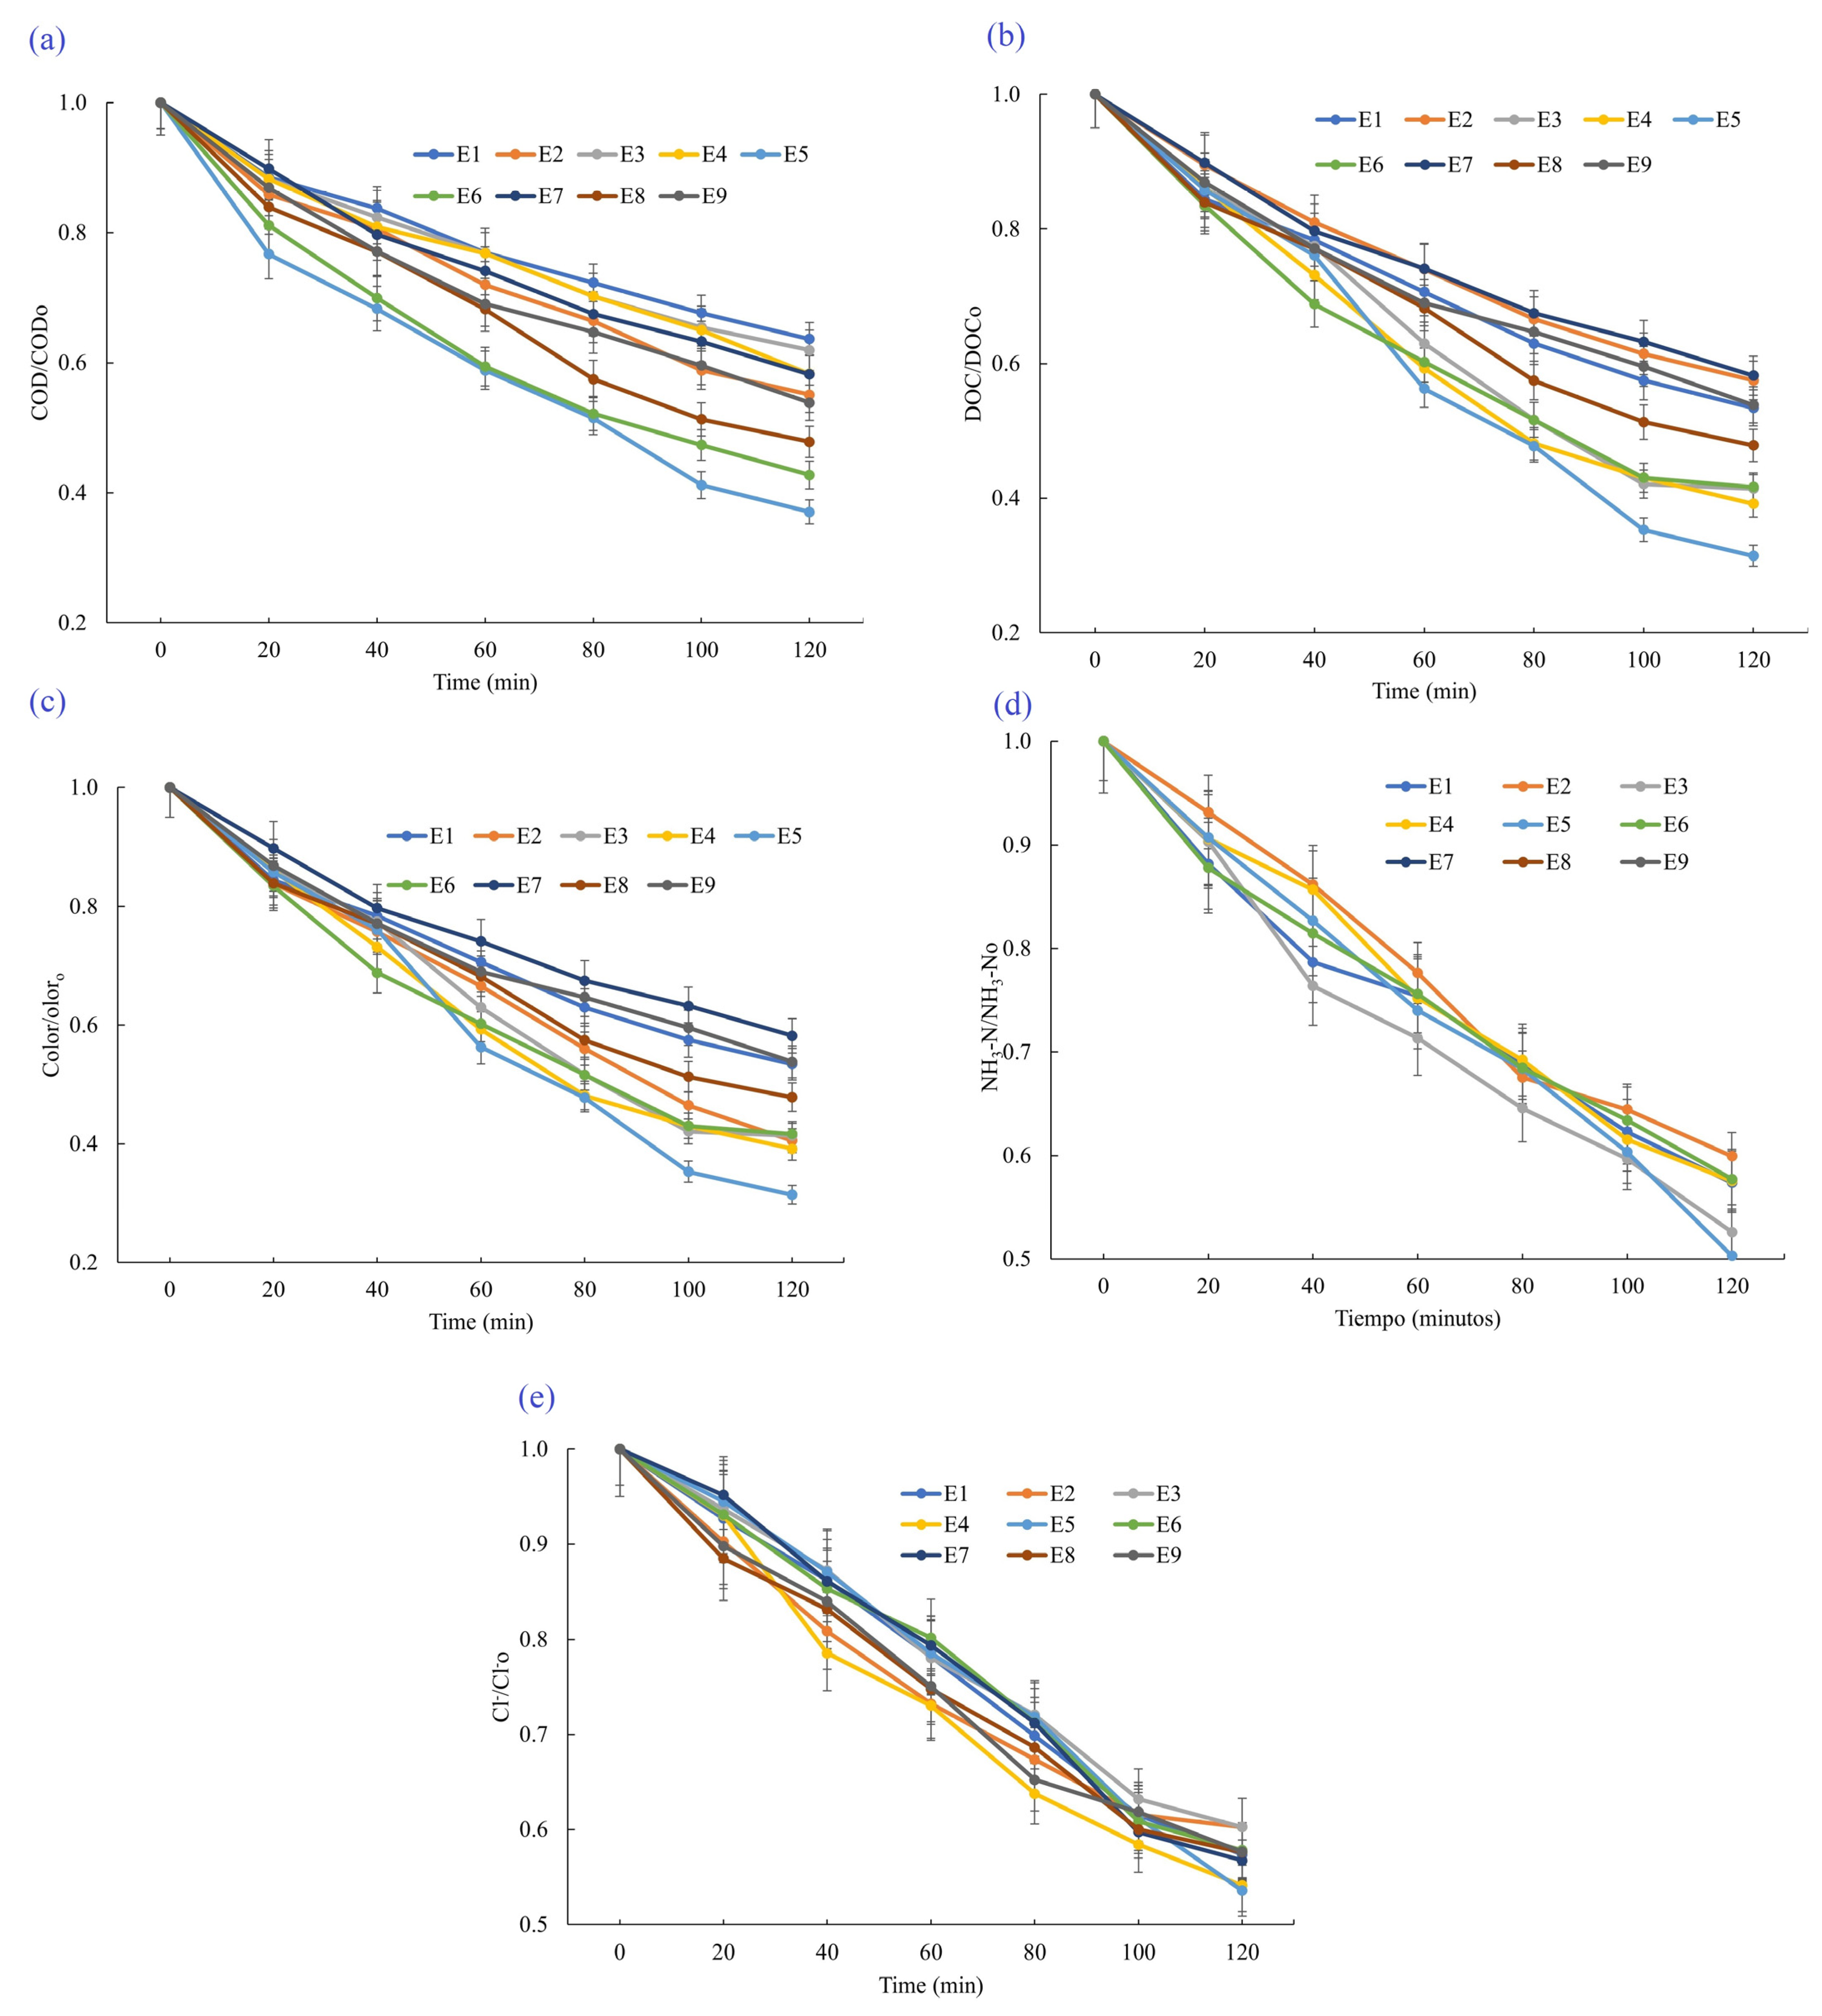
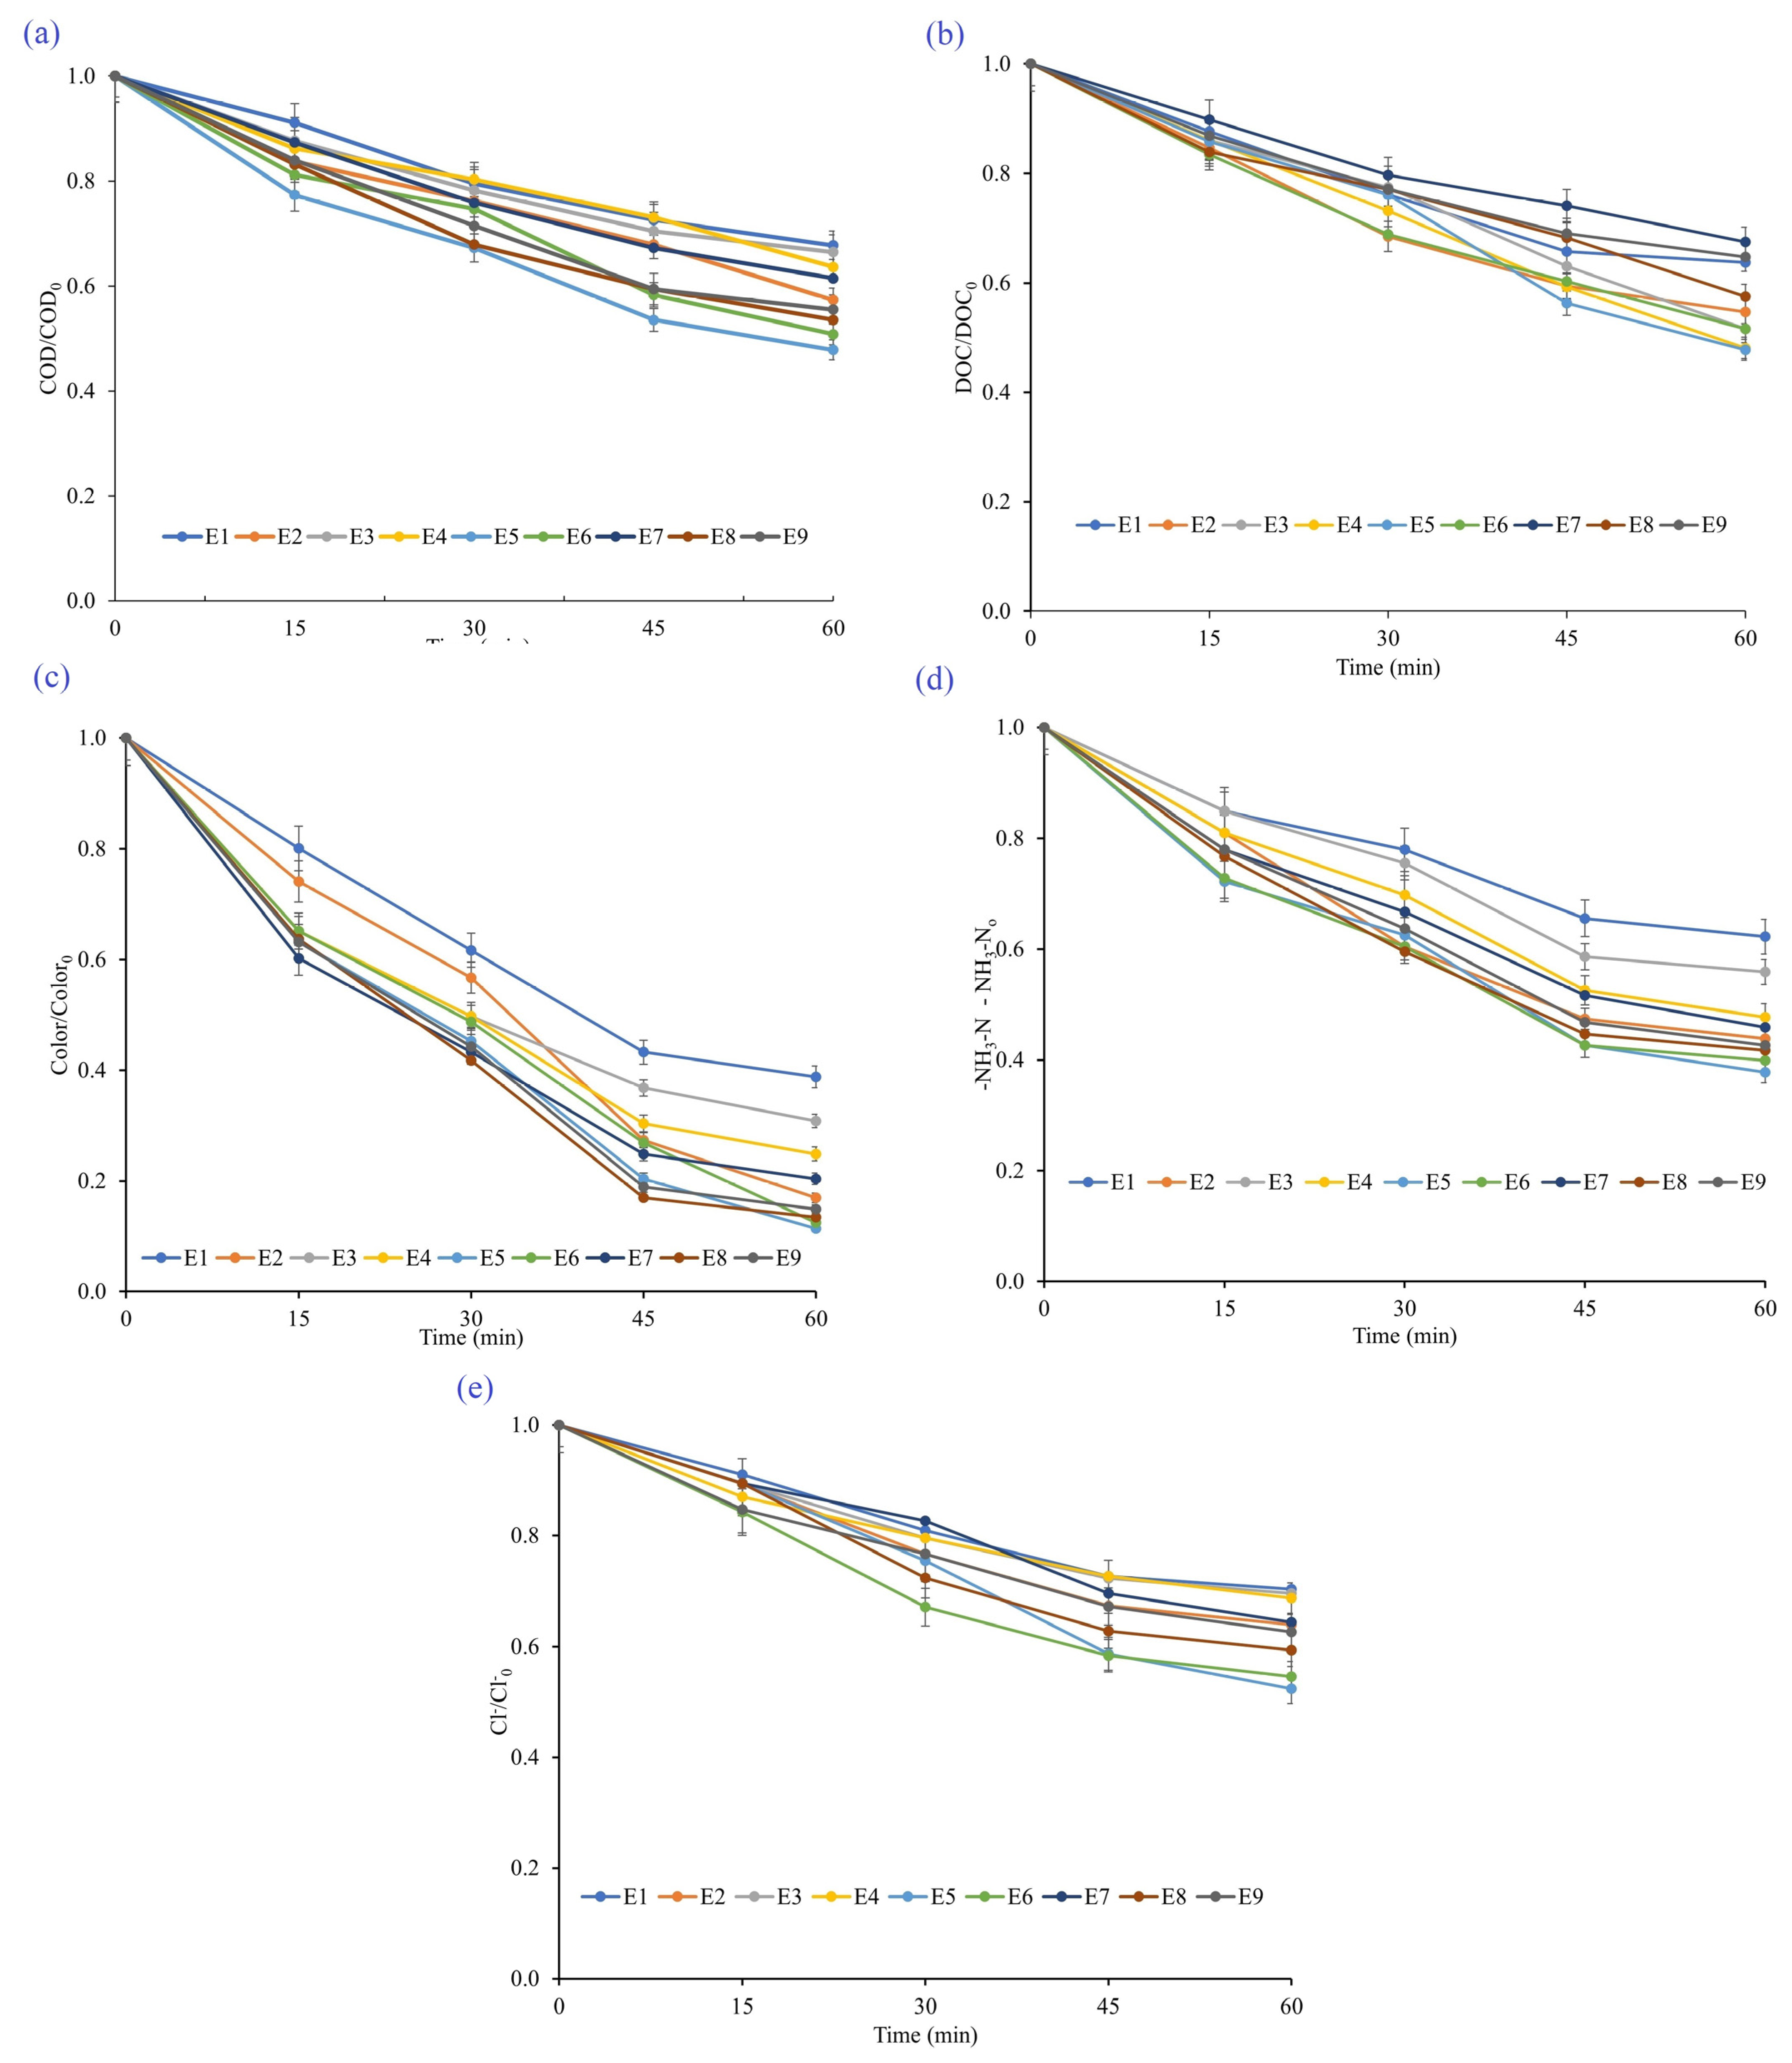
3.2.1. Monitoring of Chemical Oxygen Demand

Reaction time is of significant importance in the EC and EO processes. Figure 4a and Figure 5a show the evolution of COD values, shown as the standard COD in the EC and EO, respectively. The longer the treatment time, the lower the COD values. In the case of the EC process, this was attributable to the higher amount of hydroxide formed [78]. In the EO process, the longer the time, the greater the electron transfer, which promoted the direct oxidation of organic matter [79]. In the EC process, the greatest removal was achieved in experiment 5 (62 ± 2) in 120 min. Other leachate studies have yielded different COD removal results using Fe anodes. Sun et al. [31] obtained 53% in 60 min, Yazici et al. [23] removed 57% in 90 min, whereas Bouhezila et al. [80] achieved 68% in 60 min. The explanation for COD removal above 50% is that the Fe anode is very efficient through the generation of “in situ” ions that favor the removal of polluting organic compounds [81]. In the EO process, the highest COD removal was achieved in experiment 5 (52 ± 2%). Other EO investigations using BDD anodes in leachates have generated different chemical oxygen demand (COD) removal results. Fernandes et al. [82] achieved an 80% removal within 90 min. Anglada et al. [83] removed 51% of COD after 8 h of treatment. The efficacy of BDD anodes for the degradation of recalcitrant organic compounds during EO is known. The anode BDD favors the formation of •OH, which can participate in the non-selective combination of all organic materials [84].
In electrochemical processes, ELC is a crucial factor. The higher the ELC, the greater the efficiency of the process, the shorter the time required for treatment, and, consequently, the lower the energy consumption [78]. A comparison of the ELC values in the EC effluents showed a decrease in values in all experiments performed. Effluents with values of 2.2 to 2.9 mS cm−1 were obtained. Under optimal conditions for greater COD removal, an effluent with 2.2 mS cm−1 was obtained. This decrease could be explained by the decrease in dissolved organic matter, which indicated that, in addition to the EC process that decreased suspended organic matter (colloids), an indirect EO process occurred. During EC, EO could occur simultaneously [78]. The decrease in the ELC values of the effluents of the EC process could be a problem for the second stage of treatment, EO. A lower ELC value could decrease process efficiency. To remedy this situation, the addition of an additional electrolyte (NaCl) increased ELC. The electrolyte addition was an independent variable in the experimental design of the EO process.

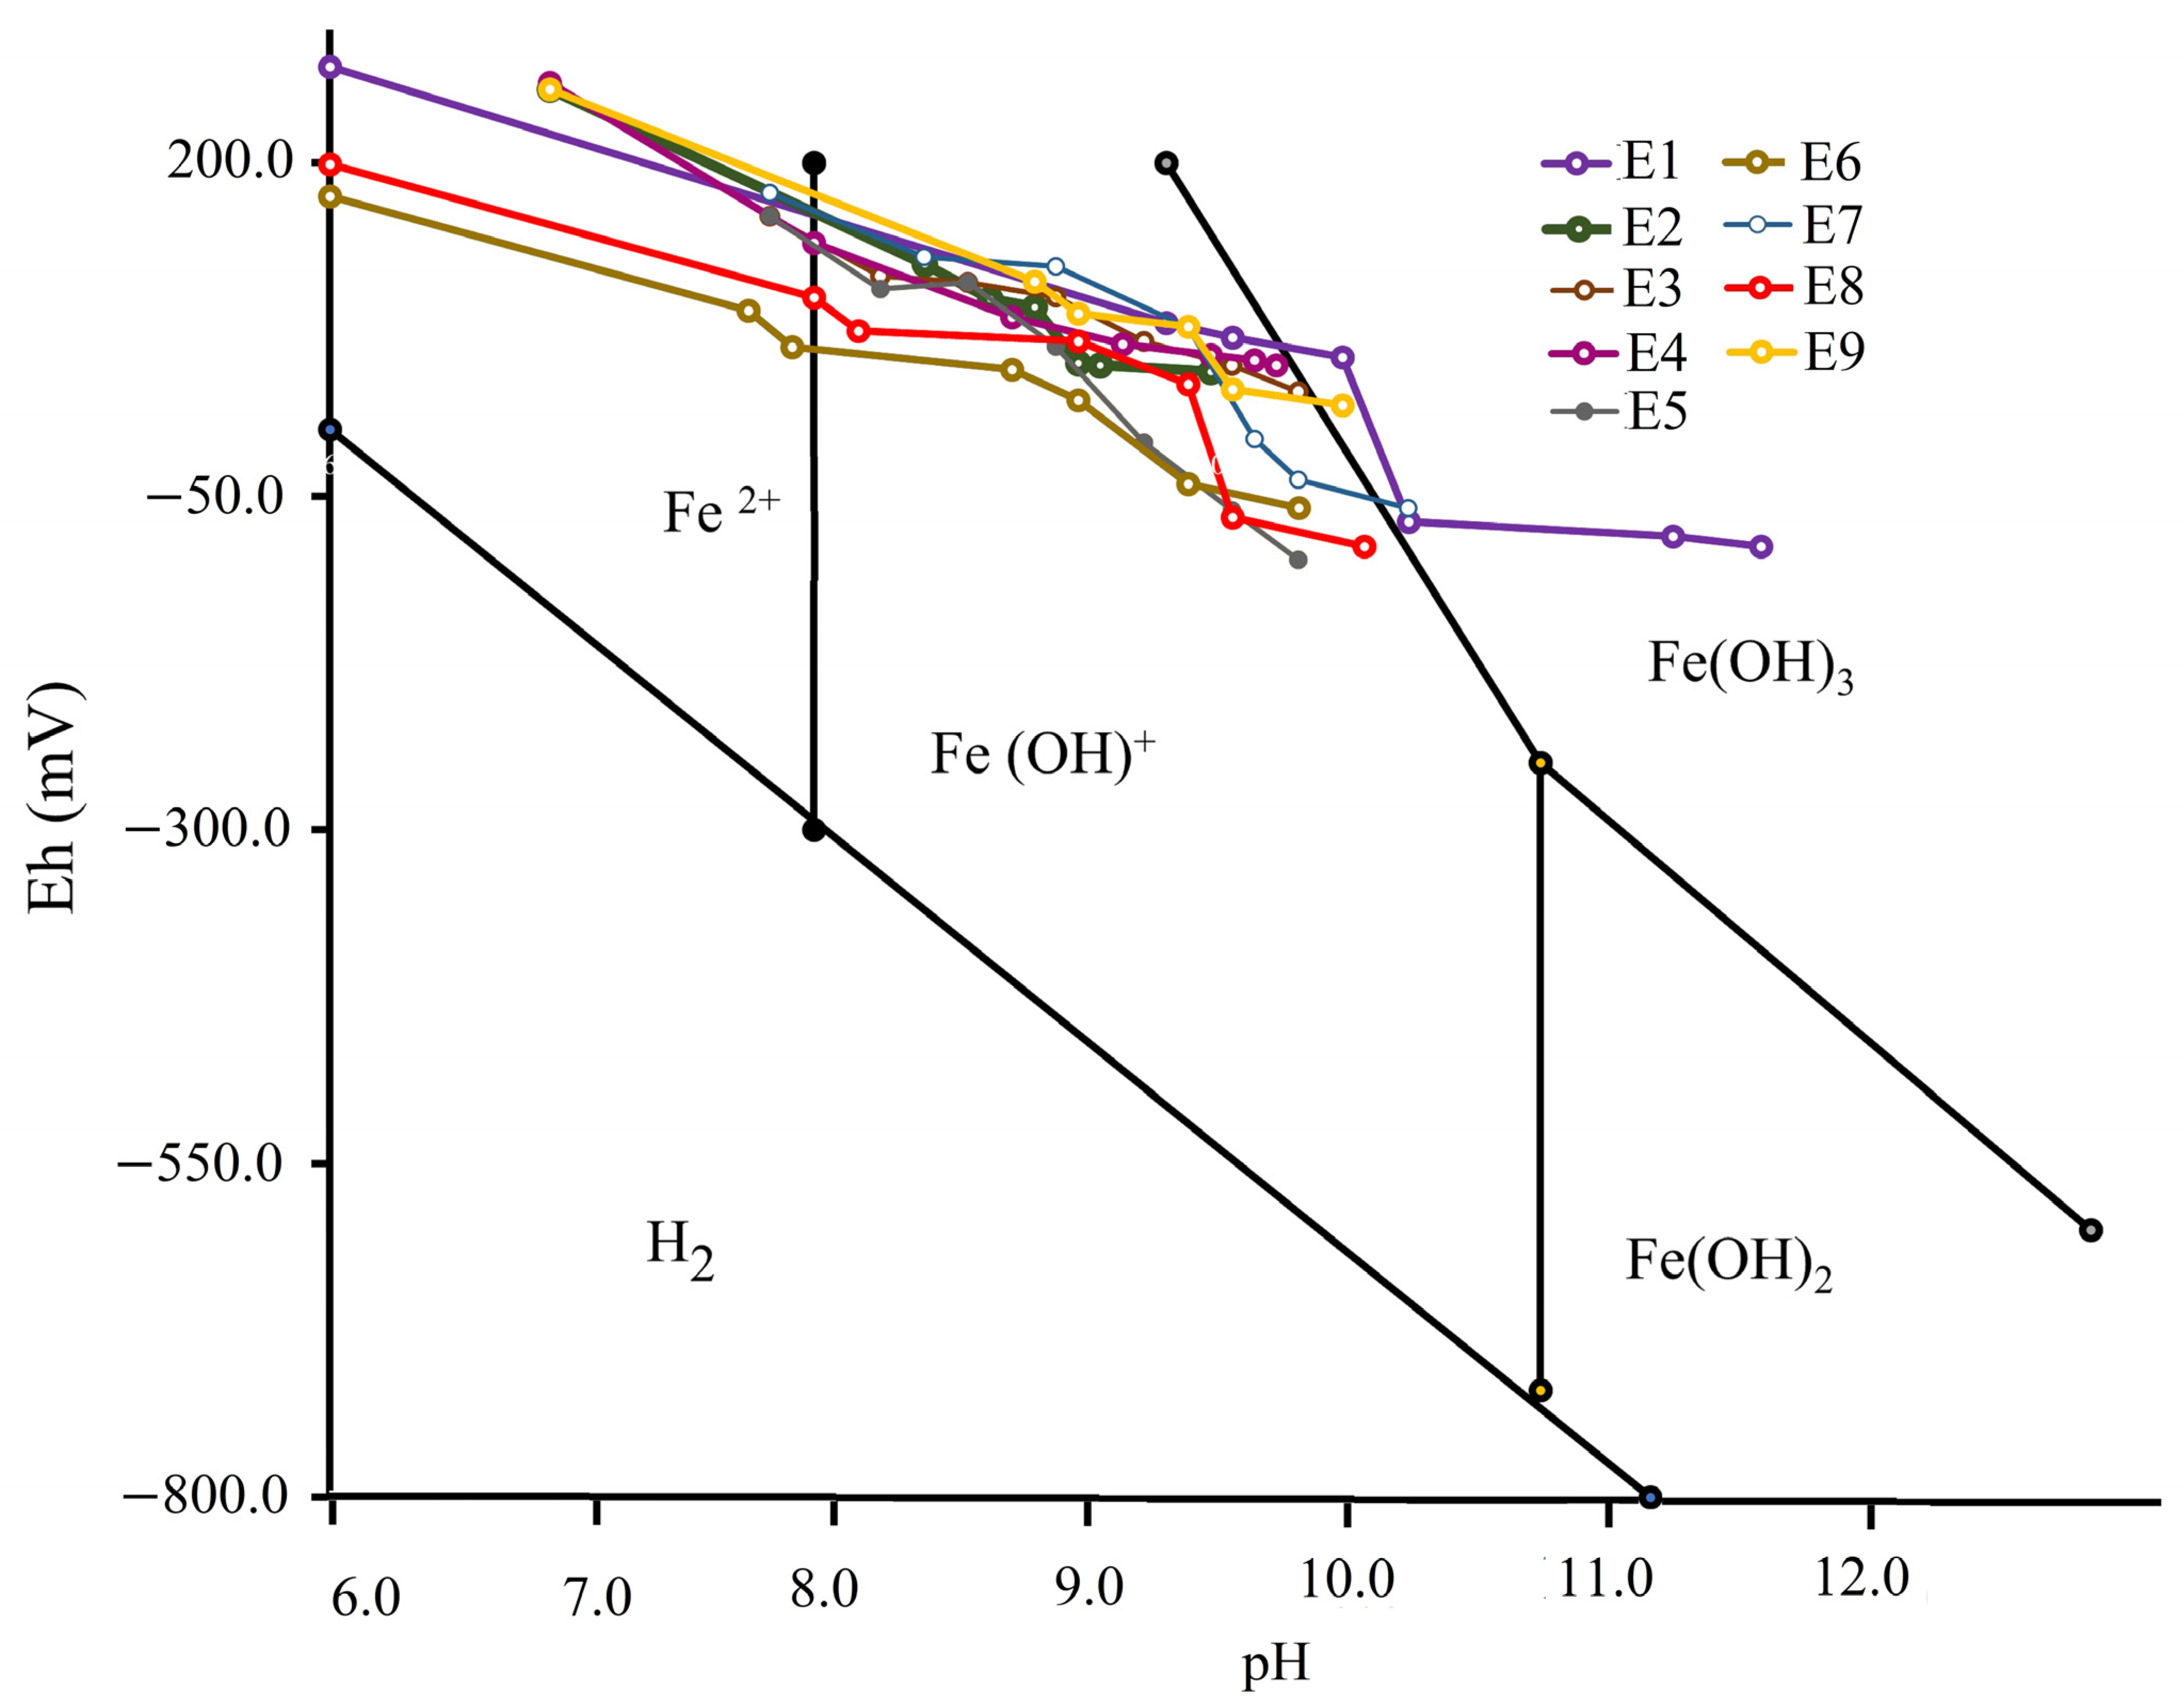
3.2.2. Eh-pH Diagram for the Electro-Coagulation Experiments

To monitor the EC process, an Eh-pH diagram was developed from t = 0 min to t = 120 min (Figure 6). According to the trajectories, Eh-pH can establish the presence of stable forms of Fe during the process [85]. Ferrous ions (Fe2+) are highly soluble and poorly coagulant and do not adsorb contaminants [23]. The efficiency of the process is enhanced when ferrous ions are oxidized to ferric ions (Fe3+), which occurs when the pH is higher than 5 (that, in fact, was what happened in the experiments), although this oxidation was conducted completely at a pH of 8 to 9 [23,86]. Fe (OH)+ was observed in all experiments.
In the EC process, positive values of Eh (200 mV < Eh < 50 mV) were accompanied by lower pH values (6 < pH < 9), whereas low values of Eh (0 mV < Eh < −280 mV) were associated with higher pH values (9 < pH < 11). A statistically significant negative correlation between Eh and pH was found for all data grouped in the seven experiments (R = −0.85, p < 0.05, n = 63) and for the individual experiments (R = −0.98, experiment 9 to R: −0.86, experiment 2; p < 0.05, n = 7). Eh is the physicochemical property of the solutes that can exchange electrons with inert electrodes. If Eh is negative, there is a reduction, that is, the reducing power is stronger than that of the oxidant. If Eh is positive, it means that there has been oxidation, that is, that the oxidizing agent is stronger than the reducer [87]. A possible explanation for this negative correlation between Eh and pH is that the positive values of Eh are indicative of the presence of hydronium ions, which explains the relationship between the high values of Eh and lower pH values in the experiments (more acidic and less alkaline). As the EC process develops, the values of Eh decrease, unequivocal signal generation of hydroxyl ions (which is the beginning of the EC process) occurs, the Fe anode is oxidized (loses electrons), and electrons that are captured in the cathode favor the reduction process and increase the pH.

3.2.3. Kinetic Analysis

Using the generated data, the chemical kinetics of the decreases in COD, DOC, NH3-N, color, and Cl were analyzed for the EC and EO processes and it was found that, under conditions of maximum COD removal, the evaluated parameters followed pseudo-first-order kinetics. The results are listed in Table 5, with determination coefficients greater than 0.9, indicating good adjustment of the experimental data to the proposed kinetic model.
The parameter for which the highest value of the kinetic constant was obtained was color, which was attributable to the removal of 95% and 98% for the EC and EO processes, respectively. In the case of kinetic constants for NH3-N, the EO process obtained a value of more than double the EC process (0.2475 min−1 compared with 0.1095 min−1), a situation attributable to the EO process having a greater ability to degrade NH3-N; in the case of the EC process, the decrease in the concentration of NH3-N was due to aeration generated by the agitation in the process and in addition to the indirect EO mediated by Cl. The higher kinetic constant value for Cl in the EO process compared with that in the EC process (0.1715 min−1 versus 0.1048 min−1) was explained by the fact that the indirect EO in the EC process (which consumed Cl) was lower than that in the EO process.

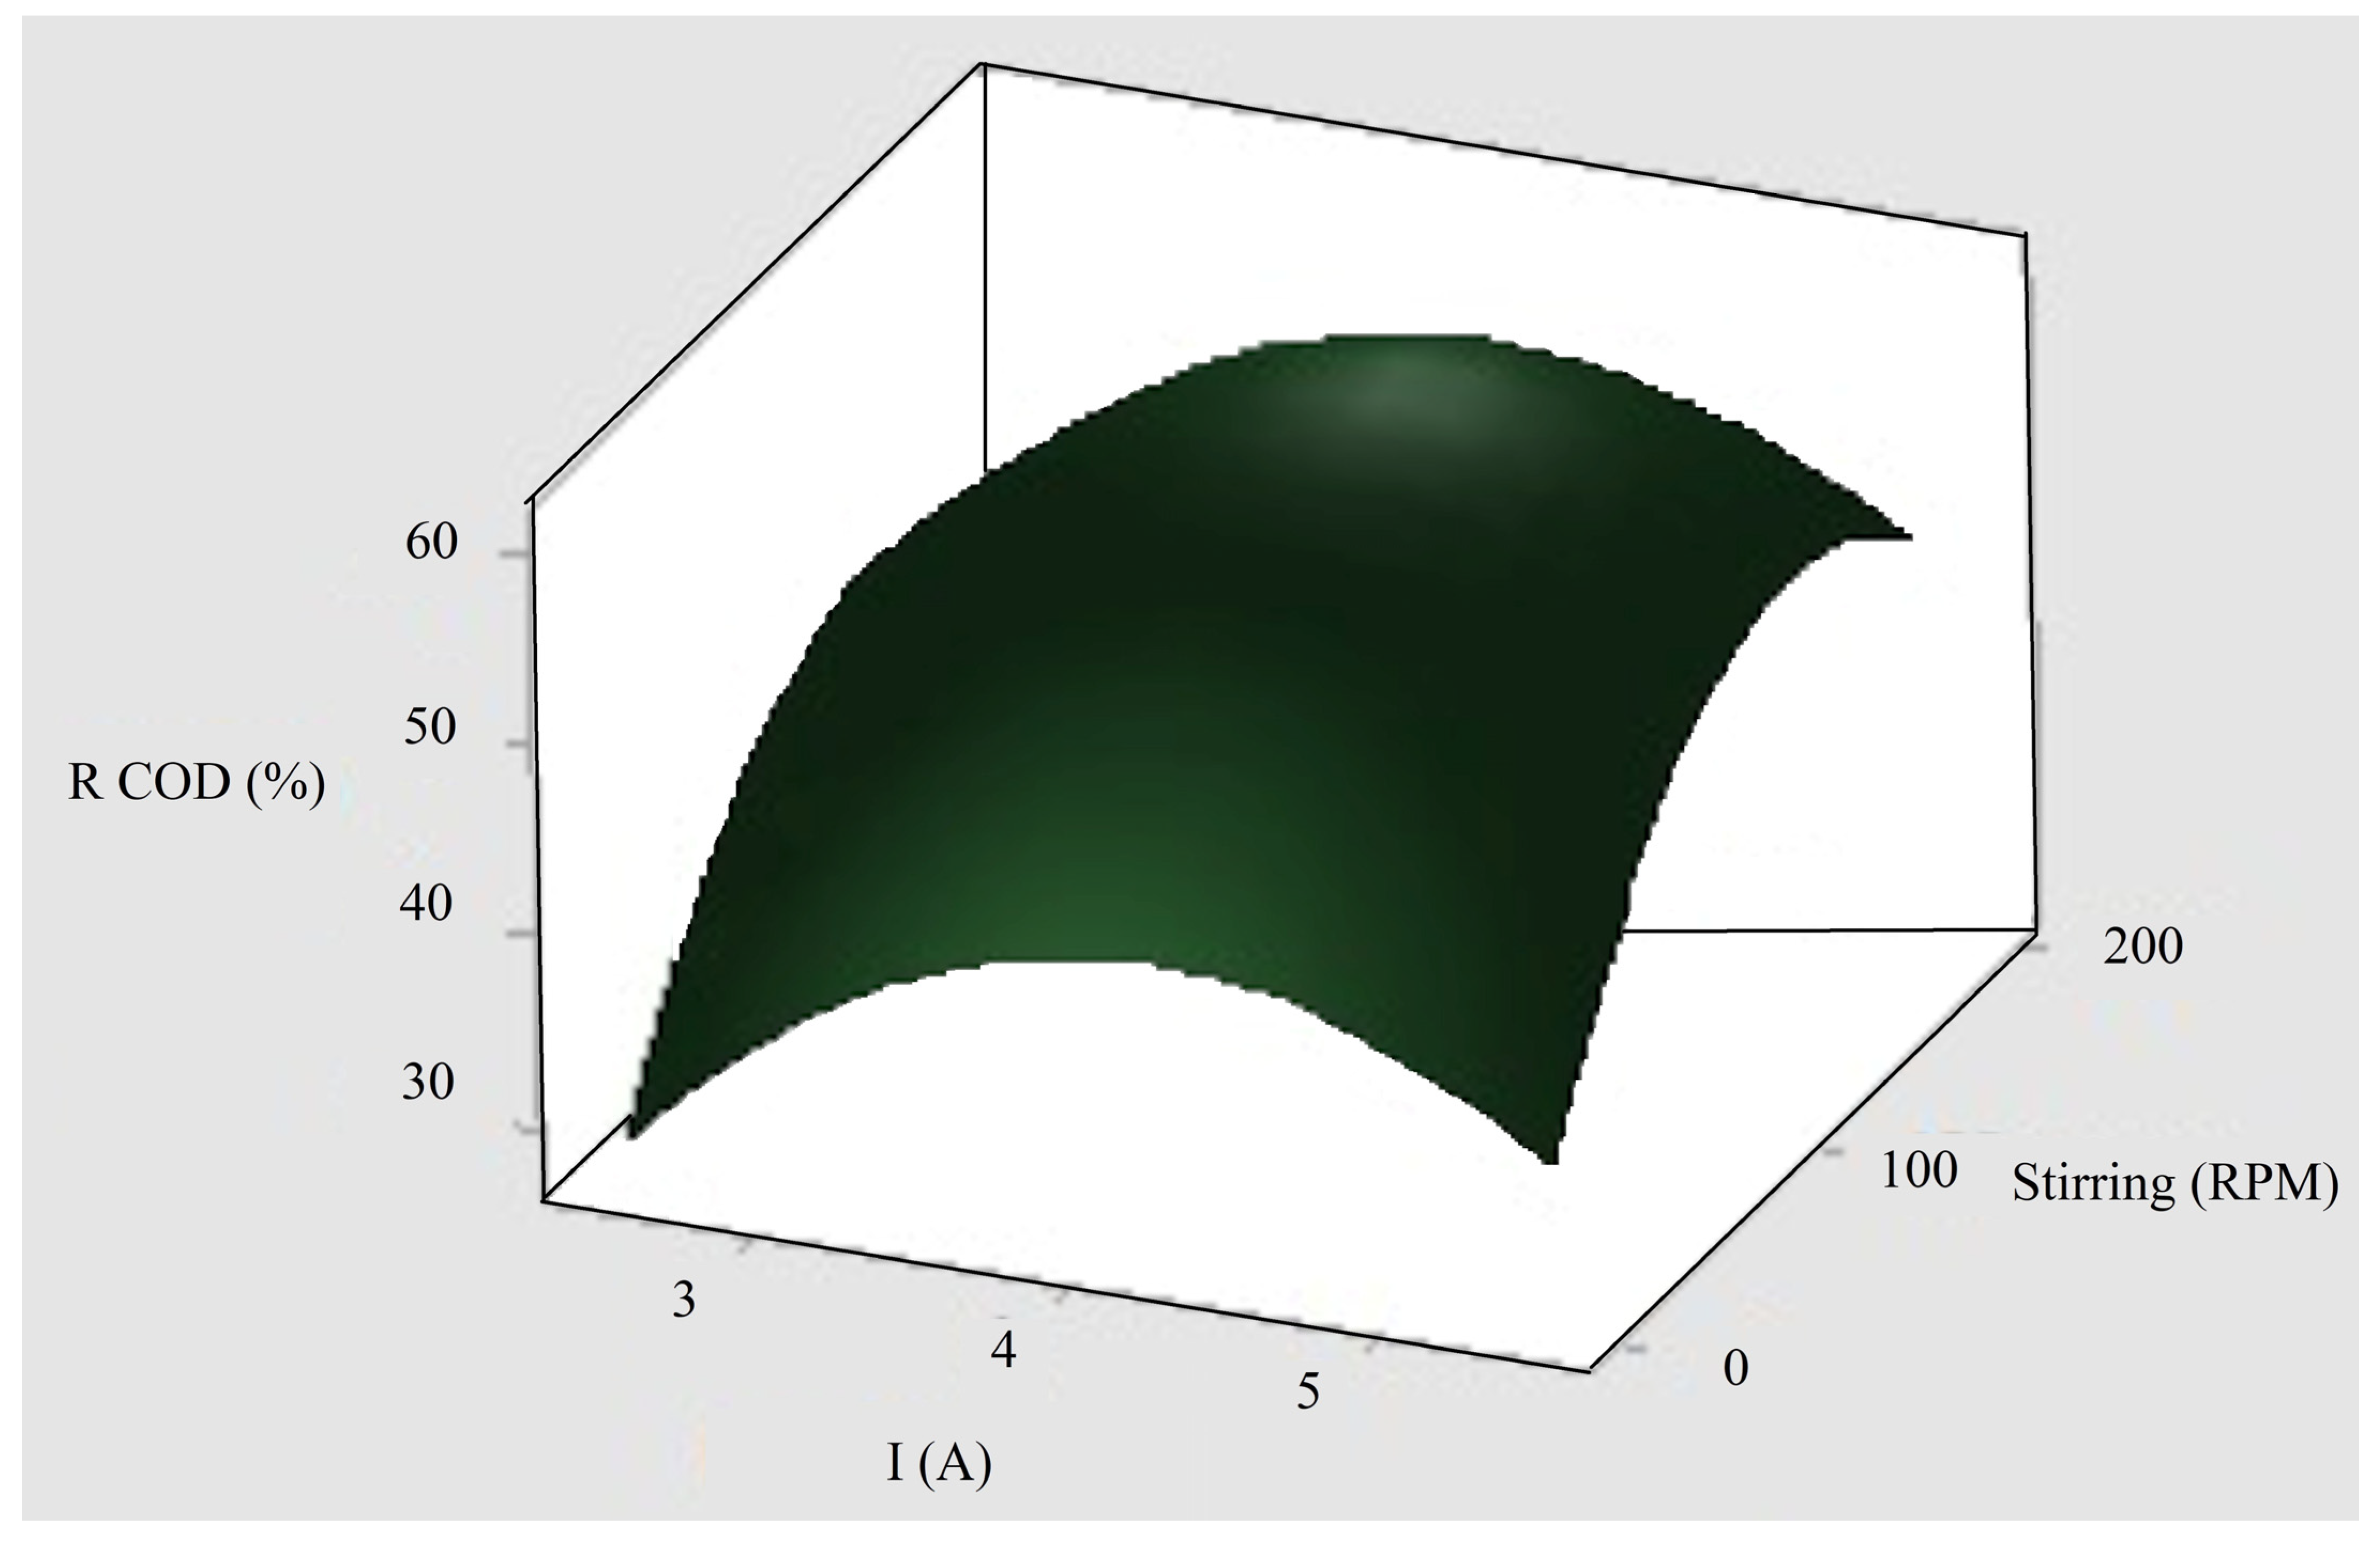
3.3. Determination of Optimal Conditions

Verification of the normal distribution of the data using the KS test was positive (p > 0.05), as was the verification of the equality of variances using the LA test (p > 0.05) for the experimental data. ANOVA was performed using the design of a fractional orthogonal experiment to determine the statistically significant variables (p < 0.05). For the EC process, the significant variables were current intensity (I) and agitation; however, pH was not statistically significant. The explanation for this result was that, when conducting the preliminary experimental tests, we chose to use pH values (6.0, 7.0, and 8.0) that favored the removal of COD. The significant variables for the EO process were the addition of an additional electrolyte (NaCl), distance between electrodes (D), and pH. Surface graphs of the EC and EO processes were generated (Figure 7 and Figure 8, respectively). Recall that the EO process was conducted in the second stage of treatment, with the effluent generated under the maximum COD removal conditions in the EC. The experimental conditions for the maximum COD removal in the EC process were I: 4.3 A, agitation: 120 RPM, and pH: 7.0, with a COD removal of 63%. In the case of the EO process, the maximum COD removal conditions were NaCl: 1.0 g L−1; distance between electrodes: 0.75 cm; I: 2 A, pH: 7; removal of 82% COD. The models indicated in Equations (5) and (6) were generated to obtain the percentage of COD removal (%R COD) by means of RSM. It was possible to explain 97% and 98% of the variability in the data for EC and EO, respectively, which guaranteed the statistical value of the proposed models.
%R DQO = 219.7 + 19.72 I + 0.3012 RPM 62.91 pH – 4.728 I2 – 0.001217 RPM2 + 3.628 pH2 + 2.907 I*pH
%R DQO = –149.7 + 16.04 NaCl + 206.5 D – 0.599 I + 34.01 pH – 6.271 NaCl2 – 128.76 D2 – 2.579 pH2

3.4. Effluent Characterization at Optimal Conditions

Under optimal conditions (EC I: 4.0 A; RPM: 100; pH: 7; EO NaCl: 1.0 g L−1; D: 0.75 cm. I: 2 A; pH 7), the generated effluent was characterized and the results are shown in Figure 9. The COD, DOC, color, and NH3-N removals for the EC process were 63%, 69%, 94%, and 50%, respectively, and the EO system generated 82%, 86%, 99%, and 81%, respectively. The application of the EO process as an additional treatment to the EC system allowed leaching with a higher level of treatment, achieving increases in COD, DOC, color, and NH3-N removal of 19%, 17%, 5%, and 31%, respectively. An increase was achieved for IB. An IB of 0.26 (BOD5: 300 ± 10 mg L−1) was obtained for EC. An IB of 0.48 (BOD5: 280 ± 10 mg L−1) was obtained for the EO process.
In the EC process, the removal of COD (63%) and DOC (69%) could be explained by the destabilization of the colloidal material caused by the formation of Fe hydroxides. The removal of COD (82%) and DOC (86%) in the EO process could explained by the complete oxidation of organic material to CO2 owing to the action of •OH radicals formed in the DDB anode and indirect EO mediated by the presence of Cl. The EO process removed 94% of the color; in contrast, the EO process only generated an additional 5% removal (from 94% to 99%). EC had a good removal effect on humic substances responsible for color (HA and FA) [88]; however, EO further decreased the color from 200 to 20 Pt Co U, indicating that EO removed humic substances that were unaffected by the EC process. The removal of 50% of NH3-N in the EC process could be explained by two different processes. During the first stay, agitation favored the elimination of NH3-N in a gaseous form, in addition to an increase in pH and temperature, which decreased the solubility of NH3-N. The second process was indirect EO in the EC reactor, which was favored by the presence of Cl in the raw leachates (6700 ± 200 mg L−1), which were transformed electrochemically to hypochlorous acid (EC process removed 46% of Cl, from 6700 ± 300 mg L−1 to 3600 ± 100 mg L−1). The 31% additional removal of NH3-N in the EO process (from 50% to 81%) could be explained as follows: Cl was oxidized at the anode in the presence of an electrical current (electrons) and chlorine gas was formed (Cl2). Water and Cl2 reacted immediately to produce HClO and hypochlorite (ClO), which were responsible for the oxidation of NH3-N to N2 (EO process removed 59% of Cl, from 4600 ± 100 mg L−1 to 1900 ± 100 mg L−1) [89].

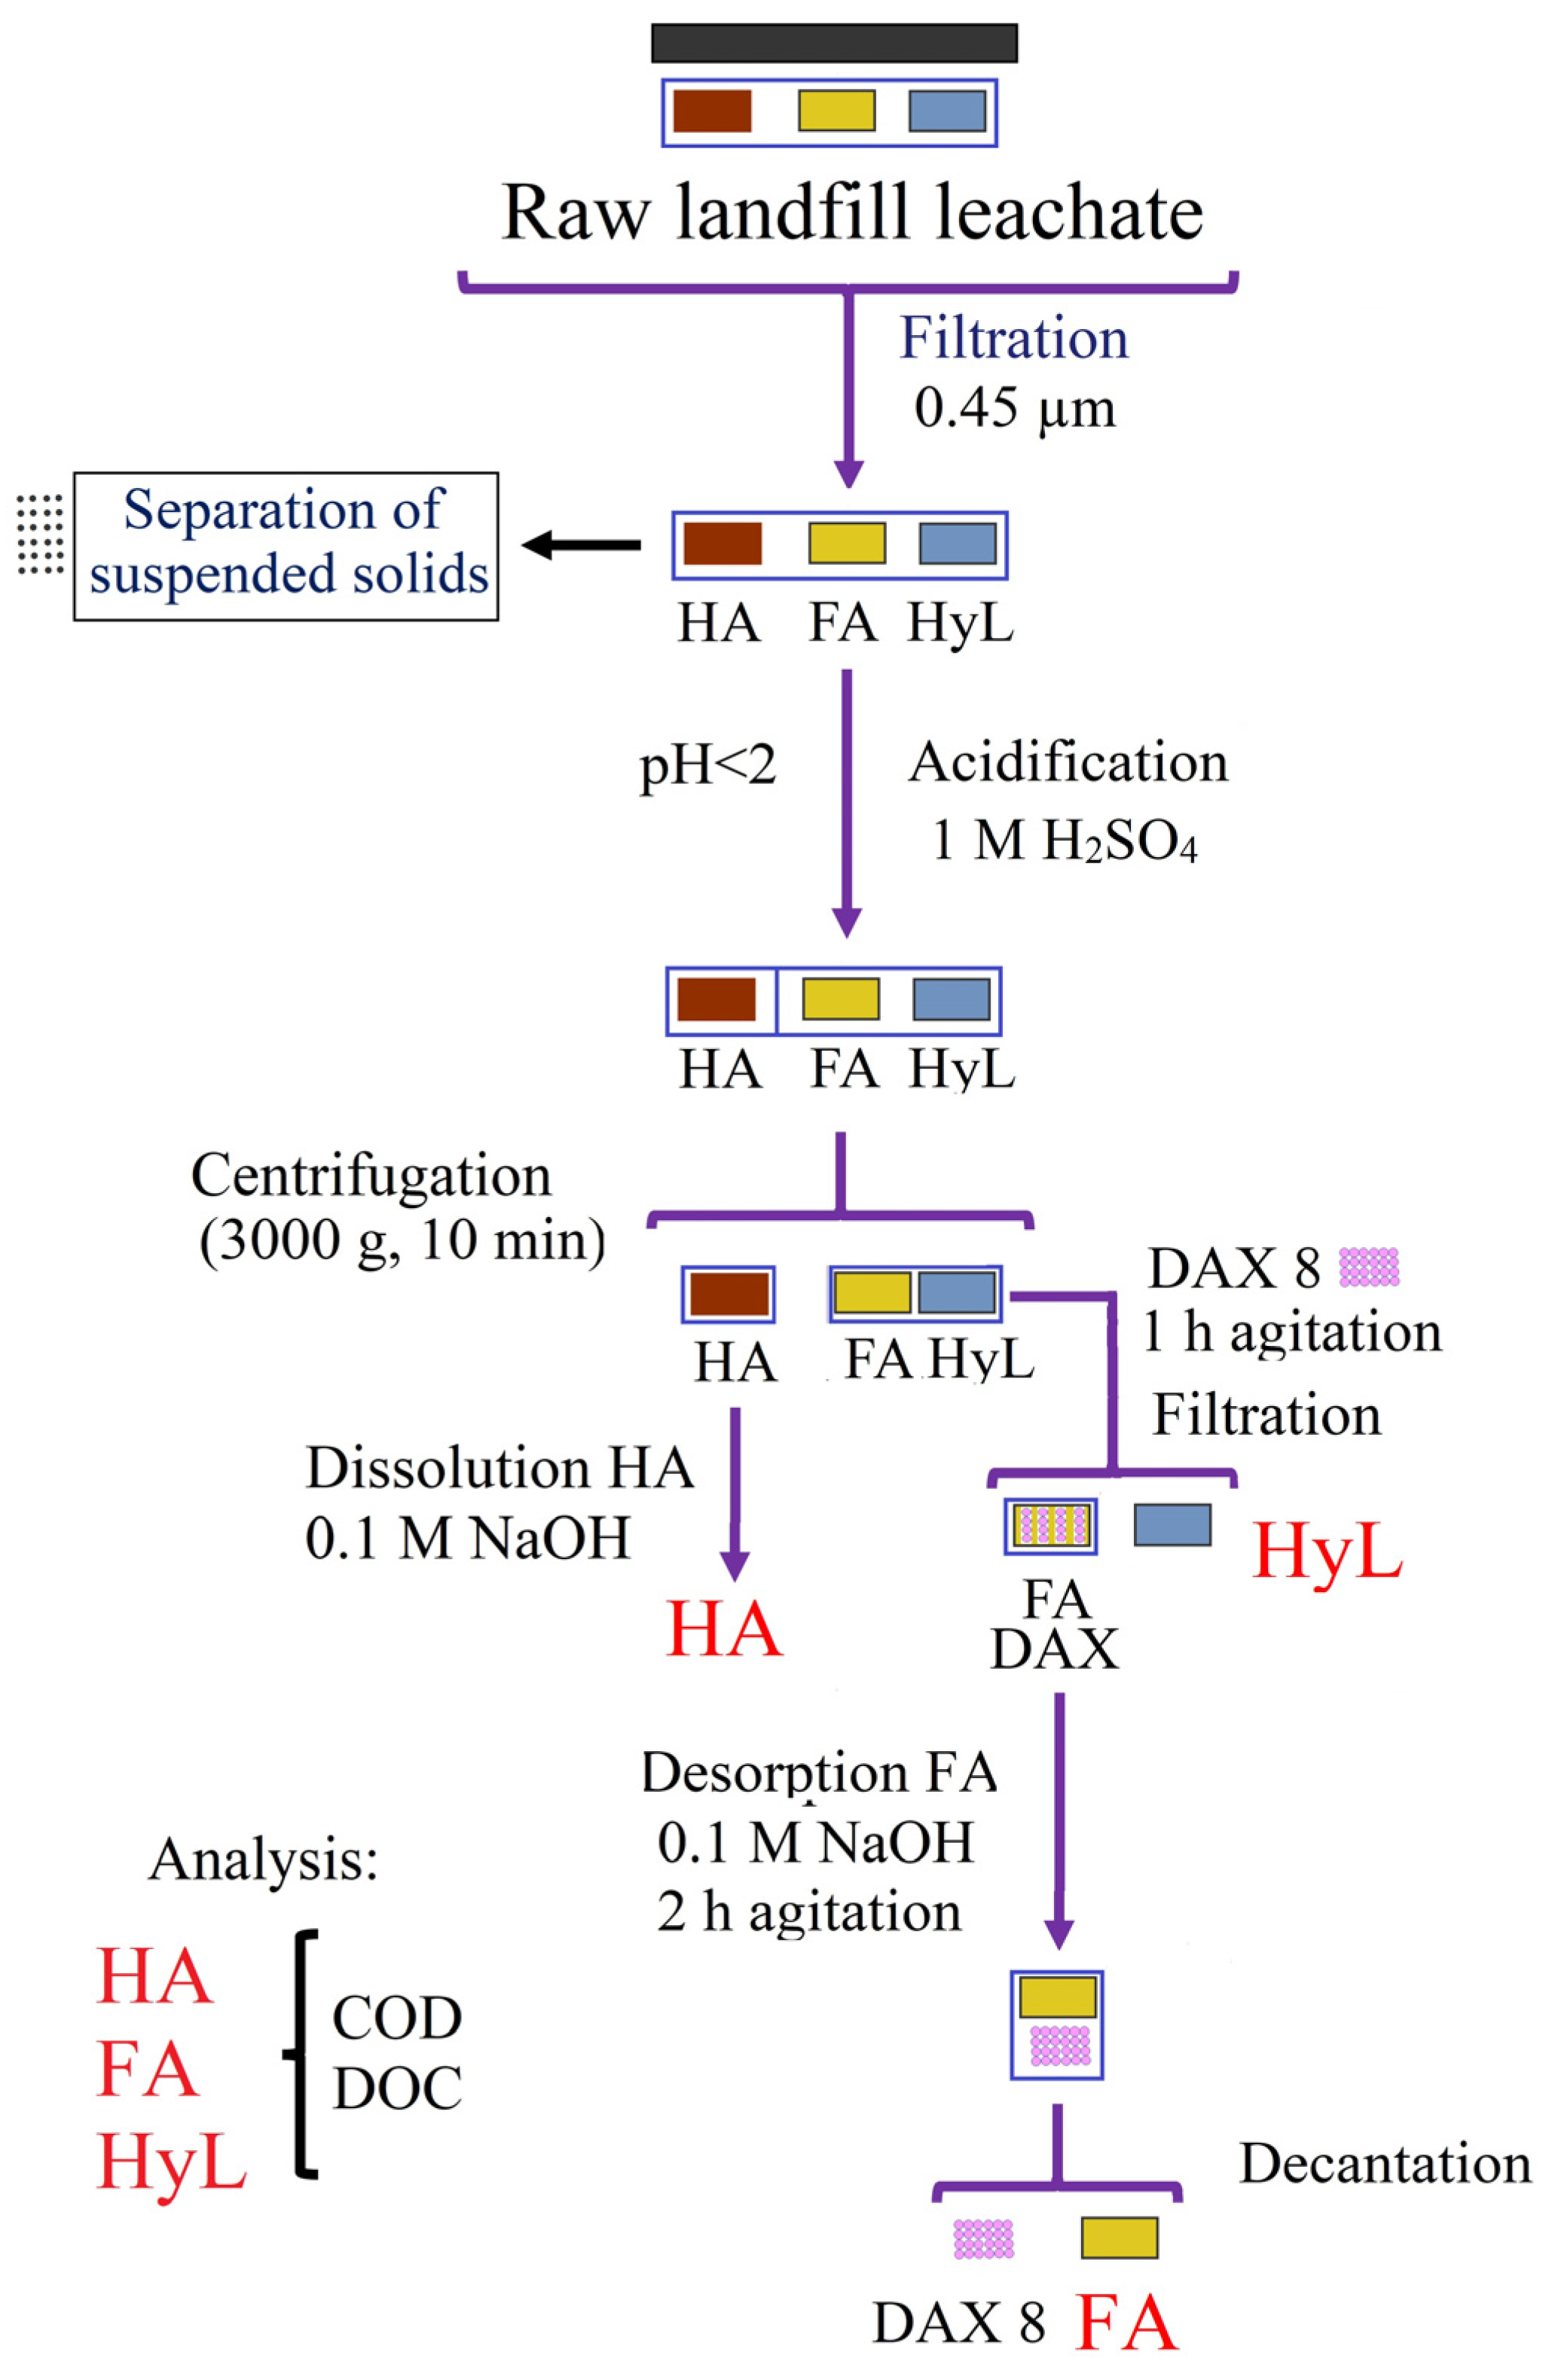
3.4.1. Fractionation of Humic Substances

Under optimal COD removal conditions, the EC process removed fractions of humic substances, measured as COD and DOC, in the same order, from highest to lowest: HA, FA, and HyL. Measured as COD, 69% HA (from 1900 ± 100 mg L−1 to 600 ± 20 mg L−1), 63% FA (from 770 ± 30 mg L−1 to 290 ± 10 mg L−1), and 61% HyL (from 870 ± 30 mg L−1 to 340 ± 10 mg L−1). Measured as DOC, 75% of HA was removed from the EC process (850 ± 40 mg L−1 to 270 ± 10 mg L−1), 67% of FA (330 ± 10 mg L−1 to 100 ± 5 mg L−1), and 46% of HyL (260 ± 10 mg L−1 to 82 ± 5 mg L−1). These differences in removal were related to the different molecular weights and surface loads of the three organic fractions [36]. The surfaces of humic substances were negatively charged because of the abundance of carboxyl and hydroxyl functional groups [90]. In the EC process, HA was preferentially eliminated by the adsorption mechanism, which implied an electrostatic attraction between humic substances and metal hydroxides, which were positively charged [36].
The greater removal of HA could be explained by its greater degree of polymerization, which had a greater ability to interact with metal hydroxides than the other two fractions evaluated (FA and HyL) [20,91]. These results were consistent with those of several studies that have characterized dissolved organic leachate materials [36,92,93]. In the crude leachate, the sum of HA and FA represented 76% and 82% of the COD and DOC, respectively, confirming the high degree of stabilization of the sampled leachates [88]. Día et al. [36] characterized biologically pretreated leachates in an anaerobic peat and wood biofilter and obtained removal values of HA and FA of 92%, which were higher than those obtained in this study, although the leachates used were not of the stabilized type. In the EO process, the removal of different fractions of humic substances occurred in an inverse order to that of the EO, from lower to higher: HA, FA, and HyL. Measured as COD, 40% of HA was removed (620 ± 30 mg L−1 to 370 ± 10 mg L−1), 55% of FA was removed (290 ± 10 mg L−1 to 130 ± 6 mg L−1), and 68% of HyL was removed (320 ± 10 mg L−1 to 100 ± 40 mg L−1). Measured as DOC, the EO process removed 60% HA (210 ± 10 mg L−1 to 80 ± 4 mg L−1), 65% FA (111 ± 5 mg L−1 to 39 ± 1 mg L−1), and 76% HyL (141 ± 7 mg L−1 to 34 ± 1 mg L−1). This could be explained by the fact that, in this case, elimination was generated by the action of • OH radicals, which more easily degraded the less complex molecules, in order of structural complexity from lower to higher, HyL, FA, and HA [94,95].

3.4.2. Chemical Oxygen Demand Fractionation

Under optimal conditions, in the EC process, the variations in the COD fractions and their representative percentages between the crude leachate and effluent were as follows: CODb, from 870 ± 40 mg L−1 (26%) to 490 ± 20 mg L−1 (39%); CODp, from 1600 ± 50 mg L−1 (48%) to 290 ± 10 mg L−1 (23%); CODsb, from 870 ± 40 mg L−1 (49%) to 490 ± 20 mg L−1 (51%). The CODb fraction increased from 26% to 39%, which was attributed to the elimination of HA (hydrophobic substances) during the EC process, which was precisely what was sought with this treatment [35]. A similar behavior has been reported in other investigations using the EC process with Fe anodes in stabilized leachates. Yazici et al. [22] increased the CODb content from 6% to 17%. The CODp decreased from 48% to 23% owing to the removal of colloids [78]. CODsb decreased from 51% to 49%, which could be explained by the fact that the EC process had a marginal effect on the soluble fraction because the destabilization process preferentially affected the particulate fraction [96]. Under optimal conditions, the EO process increased CODb from 39% to 58%, which was expected because of the oxidation of non-biodegradable organic matter by indirect electro-oxidation mediated by • OH radicals. The CODs fraction decreased from 77% to 67%, owing to oxidation of the hydrophilic fraction during the process. The CODsb fraction increased significantly from 51% to 87%, owing to the action of •OH radicals that oxidized recalcitrant organic matter (HA and AF). Radical •OH could react with aromatic and aliphatic components, breaking the C-H bond and resulting in a decrease in high-strength non-soluble organic compounds [62,97]. The results revealed that EO efficiently decreased the non-soluble COD, which could not be removed during the initial stage of EC.

3.4.3. Evolution of Organic Matter Using UV-VIS and FTIR Spectra

Using UV-VIS spectroscopy, it was possible to monitor the aromatic structures of the generated effluents. The absorbance at 254 nm (ABS254) was considered an indirect measure of the degree of aromaticity [20]. The EC process reduced ABS254 by 35% (4.9 AU to 3.6 AU) and the EO process reduced the value by 43% (4.9 AU to 3.1 AU). It could be established that, in both processes, there was a reduction in aromaticity, as confirmed by the decreases in COD and DOC values, as well as the decrease in humic fractions indicated in Section 3.4.1. A decrease in the ABS254 value in treated leachates has been confirmed in other studies [98,99,100]. The decrease in ABS254 also led to a decrease in color, owing to the high coloring power of HA. The UV-VIS spectra of the analyzed samples are included in the Supplementary Materials section (Figure S1).
The FTIR spectra allowed the identification of functional groups in the organic matter present in the evaluated sample, providing information on its evolution in the treatment system. In the FTIR spectra shown in Figure 10, a change in the functional groups associated with the removal of organic matter generated by the treatment processes was observed. The peak at 1650 cm−1 could be related to the presence of the C=C bond by an isolated torsion vibration, indicating the presence of aromatic compounds [101], since the matrix under study was leached. This peak was directly related to the presence of humic substances. When evaluating the samples, it was observed that this peak was eliminated by the treatment system, indicating the effectiveness of electrochemical treatments in the degradation of recalcitrant compounds. This could be confirmed by the increase in biodegradable COD in the effluents, as well as the increase in BI. The peaks at 1440 cm−1 and 1380 cm−1 could be associated with the presence of -CH2 and -CH3 bonds caused by deformation vibration [101], indicating the presence of aliphatic compounds in simple bonds. The samples showed an increase in these peaks with the proposed treatment system from zero presence in the raw leachates to very pronounced peaks in the effluents of EC and EO. The effectiveness of the proposed system in the degradation of recalcitrant organic matter was confirmed. The peak at 1110 cm−1 was due to the presence of the C-0 bond caused by the stress vibration of single-chain aliphatic compounds [102,103]. In the effluents evaluated, an increase in this peak was observed from a very small peak in the raw leachate to a very pronounced peak in the EO effluent. The increase in this peak indicated the degradation of recalcitrant organic matter. The peak at 880 cm−1 could be related to the C-H bond of flexion in aliphatic compounds. It was observed that the treatment generated an increase in this peak, starting from a zero peak in the raw leachate to a pronounced peak in the EO effluent. This confirmed the degradation of recalcitrant compounds to compounds with simpler structures [104]. Finally, the peak at 610 cm−1 could have had two distinct origins. The first was the vibration of O-H with an out-of-plane flex [102] or a vibration that was twice degenerated by the presence of CO2. CO2 is a linear molecule that does not rotate around the molecular axis, generating two equivalent normal vibrations, which would be stretching vibrations that would have the same frequency of vibration, precisely causing double degenerate vibration. A possible source of this CO2 in the samples was the presence of air in the samples and, at the time of measurements, there were several people in the laboratory. Although the background spectrum was measured to eliminate residual peaks, this situation occurred.

4. Conclusions

The leachate sampled at the Bordo Poniente landfill was of the stabilized type, with BI values of 0.094, COD, DOC, color, and NH3-N of 3400 ± 100 mg L−1, 1200 ± 50 mg L−1, 3200 ± 100 Pt Co U, and 660 ± 30 mg L−1, respectively.
The optimal operating conditions for the EC and EO processes were established to maximize COD removal. DOC, COD, color, and NH3-N removal efficiencies of 69%, 63%, 94%, and 50%, respectively, were achieved in the EC process under optimal conditions (I: 4.3 A, agitation: 120 RPM, and pH: 7). For the EO process the removal efficiencies of 86%, 82%, 99%, and 81% for DOC, COD, color, and NH3-N, respectively, were achieved under the best conditions (NaCl: 1.0 g L−1, distance between electrodes: 0.75 cm, I: 2 A, and pH: 7).
The proposed treatment improved the biodegradability of the effluent. CODb increased from 26% to 39% in the EC process, resulting in 58% CODb in the effluent from the EO process. As anticipated, the EC process eliminated more HA than FA (69% and 63%, respectively). A total of 40 and 55 percent of HA and FA, respectively, were eliminated during the EO process.
The EC process eliminated the interference of colloidal species in the leachates; it proved to be a suitable alternative to the first stage of treatment. Recalcitrant organic matter could be effectively converted into biodegradable materials and CO2 using EO.
Owing to the low reactivity of recalcitrant compounds, the rate at which organic matter is degraded to CO2 is limited by reaction kinetics.
Recalcitrant organic matter undergoes EC and EO processes that alter its chemical structure, changing the absorption characteristics of the electromagnetic spectrum at various wavelengths, including ultraviolet, visible, and infrared.
Using coupled EC-EO processes as part of the treatment process, this study helped to better understand the variability in the evolution of organic matter.
The optimal conditions proposed in this investigation were applicable to sampled leachates. If leachates of other origins are to be treated, further experimental tests would need to be carried out because of the variability in leachate composition due to the particular conditions of each landfill.

Supplementary Materials

The following supporting information can be downloaded at: https://www.mdpi.com/article/10.3390/app13095605/s1, Figure S1: the UV-VIS spectrum of raw leachates and effluents was included as supplementary material under optimal conditions of EC and EO processes.

Author Contributions

Conceptualization, A.M.-C. and M.N.R.-V.; methodology, A.M.-C. and M.N.R.-V.; validation, M.N.R.-V.; formal analysis, M.N.R.-V.; investigation, A.M.-C.; resources, M.N.R.-V.; writing—original draft preparation, A.M.-C.; writing—review and editing, M.N.R.-V.; supervision, M.N.R.-V.; project administration, M.N.R.-V.; funding acquisition, M.N.R.-V. All authors have read and agreed to the published version of the manuscript.

Funding

This research was supported by the UNAM project. Project No. R-275, Name of the project “Investigation Lines under Dr. Neftalí Rojas”.

Institutional Review Board Statement

Not applicable.

Informed Consent Statement

Not applicable.

Data Availability Statement

All datasets are publicly available.

Acknowledgments

The authors thank the USI-IIUNAM for help in finding some references.

Conflicts of Interest

The authors declare no conflict of interest.

References

  1. Gu, Z.; Bao, M.; He, C.; Chen, W. Transformation of Dissolved Organic matter in Landfill Leachate during a Membrane Bioreactor Treatment. Sci. Total Environ. 2023, 856, 159066. [Google Scholar] [CrossRef] [PubMed]
  2. Han, Z.; Liu, Y.; Zhong, M.; Shi, G.; Li, Q.; Zeng, D.; Zhang, Y.; Fei, Y.; Xie, Y. Influencing Factors of Domestic Waste Characteristics in Rural Areas of Developing Countries. Waste Manag. 2018, 72, 45–54. [Google Scholar] [CrossRef]
  3. EEA. European Environmental Agency: Municipal Waste Management across European Countries. Available online: https://www.eea.europa.eu/publications/municipal-waste-management-across-european-countries (accessed on 21 April 2023).
  4. Silpa, K.; Yao, L.; Bhada-Tata, P.; Van Woerden, F. What a Waste 2.0: A Global Snapshot of Solid Waste Management to 2050; Word Bank Group: Washington, DC, USA, 2018; pp. 1–8. ISBN 9781464813290. [Google Scholar]
  5. Seibert, D.; Quesada, H.; Bergamasco, R.; Borba, F.H.; Pellenz, L. Presence of Endocrine Disrupting Chemicals in Sanitary Landfill Leachate, Its Treatment and Degradation by Fenton Based Processes: A Review. Process Saf. Environ. Prot. 2019, 131, 255–267. [Google Scholar] [CrossRef]
  6. Khalil, C.; Al Hageh, C.; Korfali, S.; Khnayzer, R.S. Municipal Leachates Health Risks: Chemical and Cytotoxicity Assessment from Regulated and Unregulated Municipal Dumpsites in Lebanon. Chemosphere 2018, 208, 1–13. [Google Scholar] [CrossRef] [PubMed]
  7. El Fadili, H.; Ben Ali, M.; Touach, N.; El Mahi, M.; Lotfi, E.M. Ecotoxicological and Pre-Remedial Risk Assessment of Heavy Metals in Municipal Solid Wastes Dumpsite Impacted Soil in Morocco. Environ. Nanotechnol. Monit. Manag. 2022, 17, 100640. [Google Scholar] [CrossRef]
  8. Ding, W.; Zeng, X.; Hu, X.; Deng, Y.; Hossain, M.N.; Chen, L. Characterization of Dissolved Organic Matter in Mature Leachate during Ammonia Stripping and Two-Stage Aged-Refuse Bioreactor Treatment. J. Environ. Eng. 2018, 144, 0401782. [Google Scholar] [CrossRef]
  9. Arimi, M.M. Integration of Fenton with Biological and Physical–Chemical Methods in the Treatment of Complex Effluents: A Review. Environ. Technol. Rev. 2017, 6, 156–173. [Google Scholar] [CrossRef]
  10. Iskander, S.M.; Zhao, R.; Pathak, A.; Gupta, A.; Pruden, A.; Novak, J.T.; He, Z. A Review of Landfill Leachate Induced Ultraviolet Quenching Substances: Sources, Characteristics, and Treatment. Water Res. 2018, 145, 297–311. [Google Scholar] [CrossRef]
  11. Teng, C.; Zhou, K.; Peng, C.; Chen, W. Characterization and Treatment of Landfill Leachate: A Review. Water Res. 2021, 203, 117525. [Google Scholar] [CrossRef]
  12. Renou, S.; Givaudan, J.; Poulain, S.; Dirassouyan, F.; Moulin, P. Landfill Leachate Treatment: Review and Opportunity. J. Hazard. Mater. 2008, 150, 468–493. [Google Scholar] [CrossRef]
  13. Liu, J.; Ren, N.; Qu, C.; Lu, S.; Xiang, Y.; Liang, D. Recent Advances in the Reactor Design for Industrial Wastewater Treatment by Electro-Oxidation Process. Water 2022, 14, 3711. [Google Scholar] [CrossRef]
  14. Foo, K.Y.; Hameed, B.H. An Overview of Landfill Leachate Treatment via Activated Carbon Adsorption Process. J. Hazard. Mater. 2009, 171, 54–60. [Google Scholar] [CrossRef] [PubMed]
  15. El-Saadony, M.T.; Saad, A.M.; El-Wafai, N.A.; Abou-Aly, H.E.; Salem, H.M.; Soliman, S.M.; El-Mageed, T.A.A.; Elrys, A.S.; Selim, S.; El-Hack, M.E.A.; et al. Hazardous Wastes and Management Strategies of Landfill Leachates: A Comprehensive Review. Environ. Technol. Innov. 2023, 31, 103150. [Google Scholar] [CrossRef]
  16. Baun, D.L.; Christensen, T.H. Speciation of Heavy Metals in Landfill Leachate: A Review. Waste Manag. Res. J. A Sustain. Circ. Econ. 2004, 22, 3–23. [Google Scholar] [CrossRef]
  17. Christensen, T.H. Solid Waste Technology and Management; Blackwell Publishing Ltd.: Hoboken, NJ, USA; John Wiley & Sons, Ltd.: Chichester, UK, 2010; p. 1026. ISBN 9780470666883. [Google Scholar]
  18. Abd El-Mageed, T.A.; Abdurrahman, H.A.; Abd El-Mageed, S.A. Residual Acidified Biochar Modulates Growth, Physiological Responses, and Water Relations of Maize (Zea mays) under Heavy Metal—Contaminated Irrigation Water. Environ. Sci. Pollut. Res. 2020, 27, 22956–22966. [Google Scholar] [CrossRef]
  19. Christensen, T.H.; Kjeldsen, P.; Bjerg, P.L.; Jensen, D.L.; Christensen, J.B.; Baun, A.; Albrechtsen, H.-J.; Heron, G. Biogeochemistry of Landfill Leachate Plumes. Appl. Geochem. 2001, 16, 659–718. [Google Scholar] [CrossRef]
  20. Deng, Y.; Chen, N.; Feng, C.; Chen, F.; Wang, H.; Feng, Z.; Zheng, Y.; Kuang, P.; Hu, W. Research on Complexation Ability, Aromaticity, Mobility and Cytotoxicity of Humic-like Substances during Degradation Process by Electrochemical Oxidation. Environ. Pollut. 2019, 251, 811–820. [Google Scholar] [CrossRef]
  21. Moody, C.M.; Townsend, T.G. A Comparison of Landfill Leachates Based on Waste Composition. Waste Manag. 2017, 63, 267–274. [Google Scholar] [CrossRef]
  22. Del Moro, G.; Prieto-Rodríguez, L.; De Sanctis, M.; Di Iaconi, C.; Malato, S.; Mascolo, G. Landfill Leachate Treatment: Comparison of Standalone Electrochemical Degradation and Combined with a Novel Biofilter. Chem. Eng. J. 2016, 288, 87–98. [Google Scholar] [CrossRef]
  23. Guvenc, S.Y.; Dincer, K.; Varank, G. Performance of Electrocoagulation and Electro-Fenton Processes for Treatment of Nanofiltration Concentrate of Biologically Stabilized Landfill Leachate. J. Water Process Eng. 2019, 31, 100863. [Google Scholar] [CrossRef]
  24. Hamid, M.A.A.; Aziz, H.A.; Yusoff, M.S. Electrocoagulation Process in the Treatment of Landfill Leachate. In Sustainable Solutions for Environmental Pollution, 1st ed.; Nour, E.G., Ed.; Scrivener Publishing Wiley: Beverly, MA, USA, 2021; Volume 1, pp. 257–283. ISBN 9781119785354. [Google Scholar]
  25. Magnisali, E.; Yan, Q.; Vayenas, D.V. Electrocoagulation as a Revived Wastewater Treatment Method-practical Approaches: A Review. J. Chem. Technol. Biotechnol. 2022, 97, 9–25. [Google Scholar] [CrossRef]
  26. Clematis, D.; Panizza, M. Application of Boron-Doped Diamond Electrodes for Electrochemical Oxidation of Real Wastewaters. Curr. Opin. Electrochem. 2021, 30, 100844. [Google Scholar] [CrossRef]
  27. Baiju, A.; Gandhimathi, R.; Ramesh, S.T.; Nidheesh, P.V. Combined Heterogeneous Electro-Fenton, and Biological Process for the Treatment of Stabilized Landfill Leachate. J. Environ. Manag. 2018, 210, 328–337. [Google Scholar] [CrossRef] [PubMed]
  28. Mahmud, K.; Hossain, M.D.; Shams, S. Different Treatment Strategies for Highly Polluted Landfill Leachate in Developing Countries. Waste Manag. 2012, 32, 2096–2105. [Google Scholar] [CrossRef]
  29. Moradi, M.; Ghanbari, F. Application of Response Surface Method for Coagulation Process in Leachate Treatment as Pretreatment for Fenton Process: Biodegradability Improvement. J. Water Process Eng. 2014, 4, 67–73. [Google Scholar] [CrossRef]
  30. Abunama, T.; Moodley, T.; Abualqumboz, M.; Kumari, S.; Bux, F. Variability of Leachate Quality and Polluting Potentials in Light of Leachate Pollution Index (LPI)—A Global Perspective. Chemosphere 2021, 282, 131119. [Google Scholar] [CrossRef]
  31. Sun, X.; Wang, X.; Liu, Y.; Lian, Y.; Meng, L.; Su, Z. Removing Refractory Organic Matter from Nanofiltration Concentrated Landfill Leachate by Electrooxidation Combined with Electrocoagulation: Characteristics and Implication for Leachate Management. J. Water Process Eng. 2022, 47, 102747. [Google Scholar] [CrossRef]
  32. Carstea, E.M.; Bridgeman, J.; Baker, A.; Reynolds, D.M. Fluorescence Spectroscopy for Wastewater Monitoring: A Review. Water Res. 2016, 95, 205–219. [Google Scholar] [CrossRef]
  33. Thomas, O.; Theraulaz, F. Aggregate Organic Constituents. In UV-Visible Spectrophotometry of Water and Wastewater, 1st ed.; Thomas, O., Burgess, C., Eds.; Elsevier: Amsterdam, The Netherlands, 2017; Volume 27, pp. 89–99. ISBN 978-0-444-53092-9. [Google Scholar]
  34. Xie, Z.; Guan, W. Research on Fluorescence Spectroscopy Characteristics of Dissolved Organic Matter of Landfill Leachate in the Rear Part of Three Gorges Reservoir. J. Spectrosc. 2015, 2015, 785406. [Google Scholar] [CrossRef]
  35. Dia, O.; Drogui, P.; Buelna, G.; Dubé, R. Hybrid Process, Electrocoagulation-Biofiltration for Landfill Leachate Treatment. Waste Manag. 2018, 75, 391–399. [Google Scholar] [CrossRef]
  36. Dia, O.; Drogui, P.; Buelna, G.; Dubé, R.; Ihsen, B.S. Electrocoagulation of Bio-Filtrated Landfill Leachate: Fractionation of Organic Matter and Influence of Anode Materials. Chemosphere 2017, 168, 1136–1141. [Google Scholar] [CrossRef] [PubMed]
  37. Wang, H.; Wang, Y.; Li, X.; Sun, Y.; Wu, H.; Chen, D. Removal of Humic Substances from Reverse Osmosis (RO) and Nanofiltration (NF) Concentrated Leachate Using Continuously Ozone Generation-Reaction Treatment Equipment. Waste Manag. 2016, 56, 271–279. [Google Scholar] [CrossRef] [PubMed]
  38. Abu Amr, S.S.; Aziz, H.A.; Adlan, M.N. Optimization of Stabilized Leachate Treatment Using Ozone/Persulfate in the Advanced Oxidation Process. Waste Manag. 2013, 33, 1434–1441. [Google Scholar] [CrossRef]
  39. Abu Amr, S.S.; Aziz, H.A.; Adlan, M.N.; Bashir, M.J.K. Pretreatment of Stabilized Leachate Using Ozone/Persulfate Oxidation Process. Chem. Eng. J. 2013, 221, 492–499. [Google Scholar] [CrossRef]
  40. Abu Amr, S.S.; Aziz, H.A.; Adlan, M.N.; Alkasseh, J.M.A. Effect of Ozone and Ozone/Persulfate Processes on Biodegradable and Soluble Characteristics of Semiaerobic Stabilized Leachate. Environ. Prog. Sustain. Energy 2014, 33, 184–191. [Google Scholar] [CrossRef]
  41. PROFEPA. Acuerdo de Cierre Del Relleno Sanitario Bordo Poniente [Agreement to Close the Landfill on Bordo Poniente]. Available online: https://www.profepa.gob.mx/innovaportal/v/3476/1/mx.wap/el_gobierno_federal_y_el_gobierno_del_distrito_federal_acuerdan_cerrar_el_relleno_sanitario_bordo_poniente.html (accessed on 3 April 2023).
  42. INEGI. Censo Nacional de Gobiernos Municipales y Delegacionales 2017 [National Census of Municipal and Delegate Governments 2017]. Available online: https://www.inegi.org.mx/programas/cngmd/2017/default.html#Datos_abiertos (accessed on 2 April 2023).
  43. CONAGUA. Promedios Mensuales de Temperatura y Lluvia [Monthly Averages of Temperature and Rain]. Available online: https://smn.conagua.gob.mx/es/climatologia/temperaturas-y-lluvias/resumenes-mensuales-de-temperaturas-y-lluvias (accessed on 2 April 2023).
  44. Alcantar, R.F. Evolución de Las Características Físico-Químicas Del Lixiviado Generado en El Relleno Sanitario Bordo Poniente [Evolution of the Physical-Chemical Characteristics of Leachate Generated in Bordo Poniente Landfill]. Bachelor’s Thesis, UNAM, Mexico City, Mexico, 2015. [Google Scholar]
  45. GDF Cierre de la Etapa IV del relleno sanitario Bordo Poniente [Close of Stage IV of Bordo Poniente Landfill]. Available online: http://sinat.semarnat.gob.mx/dgiraDocs/documentos/mex/estudios/2004/15EM2004U0019.pdf (accessed on 2 April 2023).
  46. INEGI. Geografía y Medio Ambiente: Climatología [Geography and Environment: Climatology]. Available online: https://www.inegi.org.mx/temas/climatologia/ (accessed on 2 April 2023).
  47. INEGI Síntesis de Información Geográfica Del Estado de México [State of Mexico Geographic Information Synthesis]. Available online: https://searchworks.stanford.edu/view/4811414 (accessed on 2 April 2023).
  48. ISO 5667-10:2020; Water Quality Sampling Part 10: Guidance on Sampling of Wastewater. International Standards Organisation: Geneva, Switzerland, 2020. Available online: https://www.iso.org/standard/70934.html (accessed on 4 April 2023).
  49. APHA. Standard Methods for the Examination of Water and Wastewater, 24th ed.; Lipps, W.C., Baxter, T.E., Braun-Howland, E., Eds.; APHA Press: Washington, DC, USA, 2022; pp. 50–120. ISBN 9780875532998. [Google Scholar]
  50. ASTM D7573-09; Standard Test Method for Total Carbon and Organic Carbon in Water by High Temperature Catalytic Combustion and Infrared Detection. ASTM: West Conshohocken, PA, USA, 2009. Available online: https://www.astm.org/ (accessed on 2 April 2023).
  51. ASTM D1209-05; Standard Test Method for Color of Clear Liquids (Platinum-Cobalt Scale). ASTM: West Conshohocken, PA, USA, 2005. Available online: https://www.astm.org/ (accessed on 2 April 2023).
  52. Taguchi, G.; Chowdhury, S.; Wu, Y. Taguchi’s Quality Engineering Handbook, 1st ed.; John Wiley & Sons, Inc.: Hoboken, NJ, USA, 2004; pp. 605–607. ISBN 9780470258354. [Google Scholar]
  53. Montgomery, D.C. Design and Analysis of Experiments, 8th ed.; John Wiley & Sons Inc.: Hoboken, NJ, USA; Arizona State University: Hoboken, NJ, USA, 2017; pp. 478–486. ISBN 9781118146927. [Google Scholar]
  54. Upadhyay, S.K. Chemical Kinetics and Reaction Dynamics, 1st ed.; Anamaya Publishers Springer: Dordrecht, The Netherlands, 2006; pp. 12–13. ISBN 978-1-4020-4546-2. [Google Scholar]
  55. Ofomola, M.O.; Umayah, O.S.; Akpoyibo, O. Contamination Assessment of Dumpsites in Ughelli, Nigeria Using the Leachate Pollution Index Method. J. Appl. Sci. Environ. Manag. 2017, 21, 77–84. [Google Scholar] [CrossRef]
  56. Umar, M.; Aziz, H.A.; Yusoff, M.S. Variability of Parameters Involved in Leachate Pollution Index and Determination of LPI from Four Landfills in Malaysia. Int. J. Chem. Eng. 2010, 2010, 747953. [Google Scholar] [CrossRef]
  57. Mor, S.; Ravindra, K.; Dahiya, R.P.; Chandra, A. Leachate Characterization and Assessment of Groundwater Pollution Near Municipal Solid Waste Landfill Site. Environ. Monit. Assess. 2006, 118, 435–456. [Google Scholar] [CrossRef]
  58. Aftab, B.; Cho, J.; Hur, J. Intermittent Osmotic Relaxation: A Strategy for Organic Fouling Mitigation in a Forward Osmosis System Treating Landfill Leachate. Desalination 2020, 482, 114406. [Google Scholar] [CrossRef]
  59. Poblete, R.; Pérez, N. Use of Sawdust as Pretreatment of Photo-Fenton Process in the Depuration of Landfill Leachate. J. Environ. Manag. 2020, 253, 109697. [Google Scholar] [CrossRef]
  60. Martínez-Cruz, A.; Valencia, M.N.R.; Araiza-Aguilar, J.A.; Nájera-Aguilar, H.A.; Gutiérrez-Hernández, R.F. Leachate Treatment: Comparison of a Bio-Coagulant (Opuntia Ficus Mucilage) and Conventional Coagulants Using Multi-Criteria Decision Analysis. Heliyon 2021, 7, e07510. [Google Scholar] [CrossRef] [PubMed]
  61. Martínez-Cruz, A.; Fernandes, A.; Ciríaco, L.; Pacheco, M.J.; Carvalho, F.; Afonso, A.; Madeira, L.; Luz, S.; Lopes, A. Electrochemical Oxidation of Effluents from Food Processing Industries: A Short Review and a Case-Study. Water 2020, 12, 3546. [Google Scholar] [CrossRef]
  62. Mandal, P.; Dubey, B.K.; Gupta, A.K. Review on Landfill Leachate Treatment by Electrochemical Oxidation: Drawbacks, Challenges and Future Scope. Waste Manag. 2017, 69, 250–273. [Google Scholar] [CrossRef] [PubMed]
  63. Park, J.W.; Kim, S.Y.; Noh, J.H.; Bae, Y.H.; Lee, J.W.; Maeng, S.K. A Shift from Chemical Oxygen Demand to Total Organic Carbon for Stringent Industrial Wastewater Regulations: Utilization of Organic Matter Characteristics. J. Environ. Manag. 2022, 305, 114412. [Google Scholar] [CrossRef]
  64. Schellekens, J.; Buurman, P.; Kalbitz, K.; Zomeren, A.V.; Vidal-Torrado, P.; Cerli, C.; Comans, R.N.J. Molecular Features of Humic Acids and Fulvic Acids from Contrasting Environments. Environ. Sci. Technol. 2017, 51, 1330–1339. [Google Scholar] [CrossRef]
  65. Wijekoon, P.; Koliyabandara, P.A.; Cooray, A.T.; Lam, S.S.; Athapattu, B.C.L.; Vithanage, M. Progress and Prospects in Mitigation of Landfill Leachate Pollution: Risk, Pollution Potential, Treatment and Challenges. J. Hazard. Mater. 2022, 421, 126627. [Google Scholar] [CrossRef]
  66. Zakaria, S.N.F.; Abdul Aziz, H. Characteristic of Leachate at Alor Pongsu Landfill Site, Perak, Malaysia: A Comparative Study. IOP Conf. Ser. Earth Environ. Sci. 2018, 140, 012013. [Google Scholar] [CrossRef]
  67. Hussein, M.; Yoneda, K.; Zaki, Z.; Othman, N.; Amir, A. Leachate Characterizations and Pollution Indices of Active and Closed Unlined Landfills in Malaysia. Environ. Nanotechnol. Monit. Manag. 2019, 12, 100232. [Google Scholar] [CrossRef]
  68. Naveen, B.P.; Sivapullaiah, P.V.; Sitharam, T.G. Effect of Aging on the Leachate Characteristics from Municipal Solid Waste Landfill. Jpn. Geotech. Soc. Spec. Publ. 2016, 2, 1940–1945. [Google Scholar] [CrossRef]
  69. Kamaruddin, M.A.; Yusoff, M.S.; Aziz, H.A.; Hung, Y.-T. Sustainable Treatment of Landfill Leachate. Appl. Water Sci. 2015, 5, 113–126. [Google Scholar] [CrossRef]
  70. Fan, H.; Shu, H.-Y.; Yang, H.-S.; Chen, W.-C. Characteristics of Landfill Leachates in Central Taiwan. Sci. Total Environ. 2006, 361, 25–37. [Google Scholar] [CrossRef] [PubMed]
  71. Li, H.S.; Zhou, S.Q.; Sun, Y.B.; Feng, P.; Li, J.D. Advanced Treatment of Landfill Leachate by a New Combination Process in a Full-Scale Plant. J. Hazard. Mater. 2009, 172, 408–415. [Google Scholar] [CrossRef] [PubMed]
  72. Tripathy, B.K.; Kumar, M. Sequential Coagulation/Flocculation and Microwave-Persulfate Processes for Landfill Leachate Treatment: Assessment of Bio-Toxicity, Effect of Pretreatment and Cost-Analysis. Waste Manag. 2019, 85, 18–29. [Google Scholar] [CrossRef] [PubMed]
  73. Ibrahim, A.; Yaser, A.Z. Colour Removal from Biologically Treated Landfill Leachate with Tannin-Based Coagulant. J. Environ. Chem. Eng. 2019, 7, 103483. [Google Scholar] [CrossRef]
  74. Aziz, H.; Rahim, N.; Ramli, S.; Alazaiza, M.; Omar, F.; Hung, Y.-T. Potential Use of Dimocarpus Longan Seeds as a Flocculant in Landfill Leachate Treatment. Water 2018, 10, 1672. [Google Scholar] [CrossRef]
  75. Shadi, A.M.H.; Kamaruddin, M.A.; Niza, N.M.; Emmanuela, M.I.; Shaah, M.A.; Yusoff, M.S.; Allafi, F.A. Characterization of Stabilized Leachate and Evaluation of LPI from Sanitary Landfill in Penang, Malaysia. Desalination Water Treat 2020, 189, 152–164. [Google Scholar] [CrossRef]
  76. Shehzad, A.; Bashir, M.J.K.; Sethupathi, S.; Lim, J.-W. An Insight into the Remediation of Highly Contaminated Landfill Leachate Using Sea Mango Based Activated Bio-Char: Optimization, Isothermal and Kinetic Studies. Desalination Water Treat 2016, 57, 22244–22257. [Google Scholar] [CrossRef]
  77. Gamar, A.; Khiya, Z.; Zair, T.; Kabriti, M.E.; Bouhlal, A.; Hilali, F.E. Assessment of Psysico Chemical Quality of the Polluting Load of Leachates from the Wild Dump of The Hajeb City. Int. J. Res.-Granthaalayah 2017, 5, 63–71. [Google Scholar] [CrossRef]
  78. Hakizimana, J.N.; Gourich, B.; Chafi, M.; Stiriba, Y.; Vial, C.; Drogui, P.; Naja, J. Electrocoagulation Process in Water Treatment: A Review of Electrocoagulation Modeling Approaches. Desalination 2017, 404, 1–21. [Google Scholar] [CrossRef]
  79. Zhou, B.; Yu, Z.; Wei, Q.; Long, H.; Xie, Y.; Wang, Y. Electrochemical Oxidation of Biological Pretreated and Membrane Separated Landfill Leachate Concentrates on Boron Doped Diamond Anode. Appl. Surf. Sci. 2016, 377, 406–415. [Google Scholar] [CrossRef]
  80. Bouhezila, F.; Hariti, M.; Lounici, H.; Mameri, N. Treatment of the OUED SMAR Town Landfill Leachate by an Electrochemical Reactor. Desalination 2011, 280, 347–353. [Google Scholar] [CrossRef]
  81. Chen, R.-F.; Wu, L.; Zhong, H.-T.; Liu, C.-X.; Qiao, W.; Wei, C.-H. Evaluation of Electrocoagulation Process for High-Strength Swine Wastewater Pretreatment. Sep. Purif. Technol. 2021, 272, 118900. [Google Scholar] [CrossRef]
  82. Fernandes, A.; Santos, D.; Pacheco, M.J.; Ciríaco, L.; Lopes, A. Electrochemical Oxidation of Humic Acid and Sanitary Landfill Leachate: Influence of Anode Material, Chloride Concentration and Current Density. Sci. Total Environ. 2016, 541, 282–291. [Google Scholar] [CrossRef] [PubMed]
  83. Anglada, Á.; Urtiaga, A.; Ortiz, I.; Mantzavinos, D.; Diamadopoulos, E. Boron-Doped Diamond Anodic Treatment of Landfill Leachate: Evaluation of Operating Variables and Formation of Oxidation by-Products. Water Res. 2011, 45, 828–838. [Google Scholar] [CrossRef] [PubMed]
  84. Can, O.T.; Gazigil, L.; Keyikoglu, R. Treatment of Intermediate Landfill Leachate Using Different Anode Materials in Electrooxidation Process. Environ. Prog. Sustain. Energy 2022, 41, e13722. [Google Scholar] [CrossRef]
  85. Deng, Y.; Chen, N.; Feng, C.; Chen, F.; Wang, H.; Kuang, P.; Feng, Z.; Liu, T.; Gao, Y.; Hu, W. Treatment of Organic Wastewater Containing Nitrogen and Chlorine by Combinatorial Electrochemical System: Taking Biologically Treated Landfill Leachate Treatment as an Example. Chem. Eng. J. 2019, 364, 349–360. [Google Scholar] [CrossRef]
  86. Gatsios, E.; Hahladakis, J.N.; Gidarakos, E. Optimization of Electrocoagulation (EC) Process for the Purification of a Real Industrial Wastewater from Toxic Metals. J. Environ. Manag. 2015, 154, 117–127. [Google Scholar] [CrossRef]
  87. Nabuyanda, M.M.; Kelderman, P.; Sankura, M.G.; Rousseau, D.; Irvine, K. Investigating the Effect of Eh and PH on Binding Forms of Co, Cu, and Pb in Wetland Sediments from Zambia. J. Environ. Manag. 2022, 319, 115543. [Google Scholar] [CrossRef]
  88. Gandhimathi, R.; Babu, A.; Nidheesh, P.V.; Ramesh, S.T.; Singh, T.S.A. Laboratory Study on Leachate Treatment by Electrocoagulation Using Fly Ash, and Bottom Ash as Supporting Electrolytes. J. Hazard. Toxic Radioact. Waste 2015, 19, 04014033. [Google Scholar] [CrossRef]
  89. Drogui, P.; Blais, J.-F.; Mercier, G. Review of Electrochemical Technologies for Environmental Applications. Recent Pat. Eng. 2007, 1, 257–272. [Google Scholar] [CrossRef]
  90. Gu, B.; Schmitt, J.; Chen, Z.; Liang, L.; McCarthy, J.F. Adsorption and Desorption of Different Organic Matter Fractions on Iron Oxide. Geochim. Cosmochim. Acta 1995, 59, 219–229. [Google Scholar] [CrossRef]
  91. Buffle, J. The Analytical Challenge Posed by Fulvic and Humic Compounds. Anal. Chim. Acta 1990, 232, 1–2. [Google Scholar] [CrossRef]
  92. Zhao, X.; Wei, X.; Xia, P.; Liu, H.; Qu, J. Removal and Transformation Characterization of Refractory Components from Biologically Treated Landfill Leachate by Fe2+/NaClO and Fenton Oxidation. Sep. Purif. Technol. 2013, 116, 107–113. [Google Scholar] [CrossRef]
  93. Wu, Y.; Zhou, S.; Ye, X.; Chen, D.; Zheng, K.; Qin, F. Transformation of Pollutants in Landfill Leachate Treated by a Combined Sequence Batch Reactor, Coagulation, Fenton Oxidation and Biological Aerated Filter Technology. Process Saf. Environ. Prot. 2011, 89, 112–120. [Google Scholar] [CrossRef]
  94. Fernandes, A.; Pacheco, M.J.; Ciríaco, L.; Lopes, A. Anodic Oxidation of a Biologically Treated Leachate on a Boron-Doped Diamond Anode. J. Hazard. Mater. 2012, 199–200, 82–87. [Google Scholar] [CrossRef]
  95. Fernandes, A.; Pacheco, M.J.; Ciríaco, L.; Lopes, A. Review on the Electrochemical Processes for the Treatment of Sanitary Landfill Leachates: Present and Future. Appl. Catal. B 2015, 176–177, 183–200. [Google Scholar] [CrossRef]
  96. Garcia-Segura, S.; Eiband, M.M.S.G.; de Melo, J.V.; Martínez-Huitle, C.A. Electrocoagulation and Advanced Electrocoagulation Processes: A General Review about the Fundamentals, Emerging Applications, and Its Association with Other Technologies. J. Electroanal. Chem. 2017, 801, 267–299. [Google Scholar] [CrossRef]
  97. Ding, J.; Wei, L.; Huang, H.; Zhao, Q.; Hou, W.; Kabutey, F.T.; Yuan, Y.; Dionysiou, D.D. Tertiary Treatment of Landfill Leachate by an Integrated Electro-Oxidation/Electro-Coagulation/Electro-Reduction Process: Performance and Mechanism. J. Hazard. Mater. 2018, 351, 90–97. [Google Scholar] [CrossRef]
  98. Bolyard, S.C.; Motlagh, A.M.; Lozinski, D.; Reinhart, D.R. Impact of Organic Matter from Leachate Discharged to Wastewater Treatment Plants on Effluent Quality and UV Disinfection. Waste Manag. 2019, 88, 257–267. [Google Scholar] [CrossRef]
  99. Weishaar, J.L.; Aiken, G.R.; Bergamaschi, B.A.; Fram, M.S.; Fujii, R.; Mopper, K. Evaluation of Specific Ultraviolet Absorbance as an Indicator of the Chemical Composition and Reactivity of Dissolved Organic Carbon. Environ. Sci. Technol. 2003, 37, 4702–4708. [Google Scholar] [CrossRef]
  100. Niveditha, S.V.; Gandhimathi, R. Flyash Augmented Fe3O4 as a Heterogeneous Catalyst for Degradation of Stabilized Landfill Leachate in Fenton Process. Chemosphere 2020, 242, 125189. [Google Scholar] [CrossRef] [PubMed]
  101. Zhang, Z.; Teng, C.; Zhou, K.; Peng, C.; Chen, W. Degradation Characteristics of Dissolved Organic Matter in Nanofiltration Concentrated Landfill Leachate during Electrocatalytic Oxidation. Chemosphere 2020, 255, 127055. [Google Scholar] [CrossRef] [PubMed]
  102. Abdulla, H.A.N.; Minor, E.C.; Dias, R.F.; Hatcher, P.G. Changes in the Compound Classes of Dissolved Organic Matter along an Estuarine Transect: A Study Using FTIR and 13C NMR. Geochim. Cosmochim. Acta 2010, 74, 3815–3838. [Google Scholar] [CrossRef]
  103. Zheltikov, A. Course Notes on the Interpretation of Infrared and Raman Spectra. J. Raman Spectrosc. 2005, 36, 834. [Google Scholar] [CrossRef]
  104. Merck Tabla y Gráfico de Espectros Infrarrojos [Table and Graph of Infrared Spectra]. Available online: https://www.sigmaaldrich.com/MX/es/technical-documents/technical-article/analytical-chemistry/photometry-and-reflectometry/ir-spectrum-table (accessed on 23 April 2023).
Figure 1. Study area. Bordo Poniente landfill, Mexico City.
Applsci 13 05605 g001
Figure 2. Procedure developed for fractionation of humic substances. HA—humic acids; FA—fulvic acids; HyL—hydrophilic fraction; DAX 8—polymethylmethacrylate resin; DOC—dissolved organic carbon; COD—chemical oxygen demand. Adapted from Dia et al. [35].
Applsci 13 05605 g002
Figure 3. Experimental setup for electro-coagulation and electro-oxidation processes.
Applsci 13 05605 g003
Figure 4. Evolution of the different parameters evaluated in experimental tests of the electro-coagulation process. (a) chemical oxygen demand; (b) dissolved organic carbon; (c) color; (d) ammoniacal nitrogen; (e) chlorides. E—experiments.
Applsci 13 05605 g004
Figure 5. Evolution of the different parameters evaluated in experimental tests of the electro-oxidation process. (a) chemical oxygen demand; (b) dissolved organic carbon; (c) color; (d) ammoniacal nitrogen; (e) chlorides. E—experiments.
Applsci 13 05605 g005
Figure 6. Eh-pH diagram for the electro-coagulation experiments. Eh—oxidation/reduction potential; E—experiments.
Applsci 13 05605 g006
Figure 7. Surface graph of electro-coagulation process at pH 7. R COD—COD remotion; I—intensity of electrical current; RPM—revolutions per minute; COD—chemical oxygen demand.
Applsci 13 05605 g007
Figure 8. Surface graph of the electro-oxidation process at an electrical current of 1 A. I—intensity of electrical current; D—distance between electrodes; R COD—remotion COD; COD—chemical oxygen demand.
Applsci 13 05605 g008
Figure 9. Effluent characterization under optimal treatment conditions. COD—chemical oxygen demand; BOD5—biochemical oxygen demand; BI—biodegradability index; DOC—dissolved organic carbon; NH3-N—ammoniacal nitrogen; Pt-Co U—platinum–cobalt units.
Applsci 13 05605 g009
Figure 10. FTIR spectra of leachates and effluents at optimum conditions. AU—absorbance units.
Applsci 13 05605 g010
Table 1. Analytical methods used for characterization of leachates and effluents [49,50,51].
ParameterMethodDescription
Chemical oxygen demand5220DClosed-reflux colorimetric method.
Biochemical oxygen demand5210Incubation for five days with oxygen monitoring.
Dissolved organic carbonASTM D7573 09Catalytic combustion 950 °C.
Ammoniacal nitrogen4500 CVolumetric method with H2SO4 predistillation.
pH4500 HElectrometric method for measuring the electromotive force.
Electrical conductivity2510Electrometric method using an electric field.
Oxidation/reduction potential 2580 BPotentiometric determination using an indicator electrode.
Chlorides4500 BArgentometric method with precipitation of AgCl.
ColorASTM 1209-05 19Percentage transmittance of light.
Table 2. Experimental conditions of electro-coagulation and electro-oxidation treatments.
Electro-Coagulation
ExperimentI (A)Stirring (RPM)pH
E12.506.0
E22.51007.0
E32.52008.0
E44.007.0
E54.01008.0
E64.02006.0
E75.508.0
E85.51006.0
E95.52007.0
Electro-Oxidation
ExperimentAdded Extra Electrolyte NaCl (g L−1)D (cm)I (A)pH
E10.00.501.06.0
E20.00.752.07.0
E30.01.003.08.0
E41.00.502.08.0
E51.00.753.06.0
E61.01.001.07.0
E72.00.503.07.0
E82.00.751.08.0
E92.01.002.06.0
I—intensity of electrical current; RPM—revolutions per minute; D—distance between electrodes; E—experiments.
Table 3. Results of characterization of raw leachates.
ParameterValue%ParameterValue%
COD3400 ± 100-HyL (COD)880 ± 4024 ± 1
BOD5320 ± 20-HA (DOC)850 ± 3059 ± 2
BI0.094 ± 0.003-FA(DOC)330 ± 1023 ± 1
DOC1200 ± 50-HyL (DOC)260 ± 1018 ± 1
NH3-N660 ± 30-CODnb2500 ± 10074 ± 1
Cl6700 ± 200-CODs1800 ± 10052 ± 1
Color3200 ± 100-CODp1600 ± 10048 ± 1
Eh240 ± 10-CODsb900 ± 3049 ± 1
HA (COD)1900 ± 10055 ± 3CODsnb900 ± 2050 ± 1
FA (COD)800 ± 4022 ± 1pH8.4 ± 0.2
The results were expressed in mg L−1, except for BI, Eh (mV), and pH. COD—chemical oxygen demand; BOD5—biochemical oxygen demand; BI—biodegradability index; DOC—dissolved organic carbon; NH3-N—ammoniacal nitrogen; NT-N—total nitrogen; Cl—chlorides; Eh—oxidation/reduction potential; HA—humic acids; FA—fulvic acids; HyL—hydrophilic fraction; CODnb—non-biodegradable COD; CODb—biodegradable COD; CODs—soluble COD; CODp—particulate COD; CODsb—soluble biodegradable COD; CODsnb—soluble non-biodegradable COD.
Table 4. Chemical oxygen demand removal results in electro-coagulation and electro-oxidation experiments.
% R COD
ExperimentElectro-CoagulationElectro-Oxidation
E136 ± 132 ± 1
E245± 243 ± 2
E338 ± 133 ± 1
E442 ± 136 ± 1
E562 ± 252 ± 2
E657 ± 249 ± 2
E742 ± 238 ± 1
E852 ± 146 ± 2
E946 ± 244 ± 2
R COD—remotion COD; COD—chemical oxygen demand; E—experiments.
Table 5. Estimation of pseudo-first reaction kinetic constant for optimal conditions of electro-coagulation and electro-oxidation systems.
ParameterElectro-CoagulationElectro-Oxidation
R2k (min−1)R2k (min−1)
COD0.980.16100.980.1844
DOC0.980.20620.980.1390
Color0.990.36990.980.5466
NH3-N0.980.10950.970.2475
Cl0.970.10480.980.1715
R2—coefficient of determination; k—kinetic constant; COD—chemical oxygen demand—DOC: dissolved organic carbon; NH3-N—ammoniacal nitrogen; Cl—chlorides.
Disclaimer/Publisher’s Note: The statements, opinions and data contained in all publications are solely those of the individual author(s) and contributor(s) and not of MDPI and/or the editor(s). MDPI and/or the editor(s) disclaim responsibility for any injury to people or property resulting from any ideas, methods, instructions or products referred to in the content.

