Article

Assessment of Temperature, Precipitation, and Snow Cover at Different Altitudes of the Varzob River Basin in Tajikistan

by
Nekruz Gulahmadov
1,2,
Yaning Chen
1,*,
Manuchekhr Gulakhmadov
1,2,3,4,
Zulqarnain Satti
1,2,
Muhammad Naveed
5,
Rashid Davlyatov
4,
Sikandar Ali
1,2 and
Aminjon Gulakhmadov
1,3
1
State Key Laboratory of Desert and Oasis Ecology, Xinjiang Institute of Ecology and Geography, Chinese Academy of Sciences, Urumqi 830011, China
2
University of Chinese Academy of Sciences, Beijing 100049, China
3
Institute of Water Problems, Hydropower and Ecology of the National Academy of Sciences of Tajikistan, Dushanbe 734042, Tajikistan
4
Committee for Environmental Protection under the Government of the Republic of Tajikistan, Dushanbe 734034, Tajikistan
5
Key Laboratory of Geographical Processes and Ecological Security in Changbai Mountains, Ministry of Education, School of Geographical Sciences, Northeast Normal University, Changchun 130024, China
*
Author to whom correspondence should be addressed.
Appl. Sci. 2023, 13(9), 5583; https://doi.org/10.3390/app13095583
Submission received: 6 March 2023 / Revised: 17 April 2023 / Accepted: 27 April 2023 / Published: 30 April 2023
(This article belongs to the Special Issue Advances in Environmental Management and Climate Change)

Abstract

:
The analysis of precipitation, snow cover, and temperature based on measured data is important for many applications in hydrology, meteorology, climatology, disaster management, and human activities. In this study, we used long-term historical datasets from the Varzob River Basin (VRB) in Tajikistan to evaluate the trend and magnitudinal changes in temperature, precipitation, and snow cover area in the Anzob (upstream), Maykhura (midstream), and Hushyori (downstream) regions of the VRB using the original Mann–Kendall test, modified Mann–Kendall test, Sen’s slope test, and Pettitt test. The results revealed a decreasing trend in the mean monthly air temperature at Anzob station in the upstream region for all months except January, February, and December between 1960 and 2018 and 1991 to 2018. In each of the three regions, the mean annual temperature indicated a clear upward trend. Seasonal precipitation indicated a large increasing trend in January and February at the Anzob station from 1960 to 2018, but a significant downward trend in April in the upstream, midstream, and downstream regions between 1960 and 1990 and from 1991 to and 2018. In the VRB, almost all stations exhibited a downward trend in annual precipitation across all periods, whereas the upstream region showed a non-significant upward trend between 1960 and 1990. The monthly analysis of snow cover in the VRB based on ground data showed that the maximum increase in snow cover occurs in April at the Anzob station (178 cm) and in March at Maykhura (138 cm) and Hushyori stations (54 cm). The Mann–Kendall test, based on MODIS data, revealed that the monthly snow cover in the VRB increased in April and July while a decrease was recorded in February, September, November, and December from 2001 to 2022. The trend’s stable pattern was observed in March, May, August, and October.

1. Introduction

One-fifth of the Earth’s surface is made up of mountainous areas [1]. It is considered that more than 40% of the world’s population lives in river basins originating in the planet’s different mountainous regions [2]. Mountains alter the local temperature, regulate river flow, and determine the types of soil [3,4,5]. For nearby lowlands, mountains provide crucial ecological and economic purposes, such as preserving a minimum ecological flow and providing water supplies for agriculture, food production, and hydropower generation [6].
The mountainous Varzob River Basin in Tajikistan is the subject of this study. The landlocked nation of Tajikistan is situated in the southeast of Central Asia. The Tien Shan, Gissar-Alai, and Pamir Mountain systems make up approximately 93% of Tajikistan’s total area [7]. The elevation of Tajikistan’s land varies from 300 to 7495 m above sea level, and more than half of it is situated at an elevation of more than 3000 m [8]. Central Asia is thought to be a “hotspot” for climate change and one of the world’s largest semi-arid regions [9,10]. While mean precipitation based on some studies shows a slight increase [11,12], temperatures are rising faster than the global average [13,14]. Considering the intricacy of the domain and many atmospheric factors, regional patterns at the valley and district levels can substantially diverge from the global level. The growing demand for water for agriculture and hydropower generation in Central Asia contrasts with the shrinking resource base of the region [15,16].
The typical arid and semi-arid terrain of Central Asia is tremendously vulnerable to changes in the climate [13]. The present temperature is the warmest in recorded history [17]. Feng et al. reported that, in Central Asia, from 1942 to 1972 and from 1973 to 2003, the temperature increased by 0.65 °C [18], and it is expected to continue to rise in the next decades [19]. Another study reported that the mean temperature will probably rise by 7 °C by the end of the 21st century [19], which is a pretty severe prediction considering that a temperature increase of more than 1.5 °C will flatten or lower the world net primary production (NPP) [20,21]. Klein Tank et al. have shown that between 1961 and 2000, the distribution of daily minimum and maximum temperatures in both the cold and warm tails increased in Central and South Asia [22]. Additionally, according to Feng et al. [18]‘s analysis of the extreme temperature in Central Asia, the maximum temperature grew faster than lowest temperature between 1981 and 2015.
Plenty of studies have been carried out to assess the trend of seasonal and annual precipitation in various regions of the world. Such studies have been performed in Florida during the periods 1895–2009 and 1970–2009 by Martinez et al. [23], in India during the period 1901–2022 by Duhan and Pendy [24], in the upstream Zambian Zambezi River Basin by Kampata et al. [25], and in Yellow River Basin in China during the period 1960–2006 by Liu et al. [26]. All of these studies showed a trend towards a decrease in the amount of precipitation on a seasonal and annual scale. However, the investigation of the geographical and temporal variability and trend analysis by Tomozeiu et al. [27] revealed a systematic and substantial increasing trend in summer precipitation in northern Italy during the period 1922–1995. Applying the historical data from 1951 to 2001, the Zoï Ecological Network discovered that a slight increase in precipitation also occurred in the mountains of Uzbekistan, northern Kyrgyzstan, and central Tajikistan (western Pamir and Turkestan-Alai). In the southern and eastern parts of Turkmenistan, Kazakhstan, Tajikistan (particularly in the eastern Pamirs), and the central Tien Shan of Kyrgyzstan, a decrease in precipitation was observed [28]. Similarly to this, investigations by Chen et al. [29] demonstrated an increase in precipitation in Central Asia’s dry region from 1930 to 2009. To study the amount of precipitation in the Syr Darya Basin of Central Asia, Yao et al. used data from the Royal Netherlands Meteorological Institute for the period from 1891 to 2011. The annual precipitation results revealed a significant upward trend (4.44 mm per decade) [30]. Earlier research revealed that the pattern of precipitation varied depending on the time of year [31].
The nature of seasonal temperature fluctuations can be used to explain how the seasonal snow cover affects the soil’s thermal regime. Compared to other natural materials, snow acts as an insulator and makes a major contribution to protecting the Earth from heat loss in winter [32]. The volume and frequency of snowfall determine Central Asia’s primary source of freshwater [33,34]. In Central Asia, water balance has changed as a result of climate change and human activity, which has led to severe water shortages, retreating glaciers, desertification, and the shrinking of the Aral Sea [35,36]. Given this phenomenon, it is crucial to conduct a thorough examination of the processes that affect the duration of snow cover and the commencement of snow-covered areas. The analysis of Central Asia’s snow cover characteristics from 2000 to 2011 by Dietz et al. [37,38] covered both periods. There has been a continued trend toward earlier snowmelt in the mountains of Central Asia according to the results of the long-term alterations [37,38].
Tajikistan is one of the countries in Central Asia that is vulnerable and sensitive to climate change and has poor adaptive capacity to climate change. The country’s Fourth National Communication reports that Tajik society is exceptionally vulnerable to the threats caused by climate change [39]. A review of the aforementioned literature indicates that current research will focus on changes in climate variables in the regions of the three climate stations. Unfortunately, the networks of climate stations are frequently sparse and situated in open areas due to logistical, financial, or other factors, which prevents a trustworthy evaluation of how local conditions affect the climate [40]. To the best of our knowledge, no study has been conducted on trend analysis combining snow cover, precipitation, and temperature based on the ground measurement and MODIS datasets at various elevations in the Varzob River Basin. The objectives of the current paper are to analyze the interannual changes and annual variability in temperature, precipitation, and snow cover in upstream, midstream, and downstream areas of the Varzob River Basin.

2. Study Area

The Varzob River Basin is located in the southwest of Tajikistan. It is formed by the confluence of the rivers Ziddi and Myakhura [41]. The length of the river is 71 km [42]. The Varzob River Basin covers an area of 1740 km2 [43]. The VRB’s territory has a significant economic impact on the nation. The city of Dushanbe is situated on the extensive terraces of the Dushanbinka River’s lower reaches (capital of Tajikistan). As a passageway to the high-mountainous region of Central Tajikistan and the basin of the upstream and midstream regions of the river, the Varzob gorge cuts over the southern slope of the Gissar Range [41]. Zeravshan, which is situated in the Fergana intermountain valley, is the only exit from the south to the republic’s northern areas. Due to its dependence on the height of the sun above the horizon and the length of solar illumination of the Earth’s surface, the latitudinal position is of critical physical and geographical significance. The vast continental massif of Eurasia contains the Varzob River Basin. It receives atmospheric moisture from Atlantic Ocean which is thousands of kilometers away. The formidable Hindu Kush chain blocks access to the Indian Ocean, which is located approximately 1400–1500 km away [44]. All of this comes together to establish the primary characteristics of the climate of the land as well as the denudation processes that take place on it. Because of the great distance that separates it from the primary regions that contribute moisture to the atmosphere, the basin features a distinctly continental climate. As a result of its location on the southern slope of the Gissar Range and the foothills of that range, the VRB has a large southern exposure, and the surface of the land that is the focus of this analysis faces south. This also has an effect on the processes that are involved in denudation as well as the conditions that are necessary for the production of denudation relief.
The orographic core of the basin is the gorge of the river. The Varzob River Basin is stretched in a meridional orientation from north to south. It creates two halves that are roughly equivalent to one another within the basin. The Ziddi and Maykhura rivers form the Varzoba River in the middle reaches, close to the village Gushary on 1890 m a.s.l. [45] This location is at the foot of the axial part of the Gissar Range (1100 m) [42]. The elevation of Kofarnihon River is 720 m [8]. That is a drop of 1200 m over approximately 55 km. Although the Ziddi and Maykhura rivers form the Varzob River, originating at an elevation of 3700–3800 m, the actual drop is significantly greater [42]. The transverse character of the gorge changes in the higher sections of the Varzob, ranging from V-shaped to a classic canyon with vertical slopes. Short routes have relative heights of 1500–2000 m [43]. There are no conditions for the formation and preservation of accumulative terraces. Massive scree cones with avalanche origins descend to the river almost everywhere along the gorge’s slopes. The river frequently alters its grade [45]. Figure 1 shows the study area and the locations of the climate station in the VRB.
The valleys of the Varzob’s large tributaries resemble essentially identical great gorges formed by erosion to the main valley. Among these are the valleys of the rivers Ziddi, Maikhura, Sioma, Gurke, and Varzobi-Bolo, as well as the valleys of their individual constituents Diamalik and Takob, Obidzhuk, and Luchob [44]. Some of them, such as the Maykhura, Sioma, and Ziddi rivers, as well as their tributaries, have characteristic glacial valleys in their higher stages (trogs) [42].
The Varzob River significantly affects the runoff and water content of the Kofarnihon River Basin. The main runoff (80%) of the Kofarnihon River is formed in the right-bank part of the basin, on the southern slope of the Gissar Range [46]. In the northeastern part of the basin, where the flow of the Kofarnihon river itself and its tributary of the Varzob River Basin is formed, the heights of the ridges exceed 4500 m above sea level [43].

3. Materials and Methodology

3.1. Data

In this study, we obtained snow cover, precipitation, and temperature data from the Agency of Hydrometeorology of the Committee of Environmental Protection under the Government of the Republic of Tajikistan. A detail description of the data is given in Table 1.
In this work, the statistical techniques of the Sen’s slope, modified Mann–Kendall (MMK) test, and Mann–Kendall (MK) test were used to identify trends in an abiding scale of data such as snow cover, precipitation, and temperature from recorded stations on the ground. The Pettitt’s test was also applied to identify rapid changes.

3.2. Mann–Kendall (MK) Test

The MK test (non-parametric test) can be used to spot trends in an abiding scale of data [47]. Equation (1) is used to find the trend rate m 1 using linear regression:
y = m 1 x t + c o ,
where x represents the temperature, precipitation, and snow cover. By a t-test, the significance of m 1 was confirmed. The rising and falling patterns in various time series of snow cover, precipitation, and temperature are indicated by the positive and negative of m 1 [48]. The strength of a trend is influenced by its adjusted significance level, size, the sample size and the number of changes over a durable scale of data [49]. Equation (2) yields the MK test statistics (S):
S = k = 1 n 1 j = k + 1 n s g n X j X k ,
s g n X j X k = if X j X k > 0 , + 1 if X j X k = 0 , 0 if X j X k < 0 , 1 ,
where X j and X k are the data values at times j and k , respectively, n is the length of the dataset, and s g n is the sign function which accepts values of −1, 0, and +1. The function from the t value of S displays trends in the climate datasets, which are either positive or negative:
V a r S = n n 1 2 n + 5 k = 1 p t k t k 1 2 t k + 5 18 ,
where t k is the number of observations in the k th group and p is the linked group. Equation (5) yields the (STS) standardized test statistic (ZS), which can be calculated by
Z S = S 1 V a r ( S ) , S > 0 0 , S = 0 S + 1 V a r ( S ) , S < 0 ,
where ZS illustrates how important the trend is. If Z s > Z α / 2 , the STS is then used to test the null hypothesis, H 0 , and displays the confidence level. The trend of snow cover, precipitation and temperature datasets is statistically significant at the significance levels of α = 0.01 (or 99% confidence intervals), α = 0.05 (or 95% confidence intervals), and α = 0.1 (or 90% confidence intervals), and the trend is considered to be real. The null hypothesis of no trend is rejected if Z s > 1.45 , Z s > 1.96 , and Z s > 2.56 , at the 1%, 5%, and 10% significance levels, respectively. Detailed information on the modified Mann–Kendall test can be found in our previous study [47].

3.3. Sen’s Slope Test

The Sen’s slope test applied to evaluate the size of the trend [47,50]. Equation (6) was first used [50] to calculate the slope of the pair of data n :
Q = X j X k j k   i f   k < j ,
where the data values at times j and k are X j and X k , respectively. Sen’s estimator of the slope is the median of the n values of Q . The temperature, precipitation, and snow cover records show an increasing and a declining trend for both the positive and negative values of Q . The n values’ slopes ( Q ) were graded from low to high. Equation (7) can be used to calculate Sen’s estimator [51].
S e n s   e s t i m a t o r = Q n + 1 2   i f   n   i s   o d d ,   1 2 Q n 2 + Q n + 1 2   i f   n   i s   e v e n .

3.4. Pettitt’s Test

The Pettitt [52] technique is used to find a single abrupt change in snow cover, precipitation, and temperature-abiding datasets. Normally, the highest value K T will be chosen as the change point when an adjacent abrupt change is present in a series:
K T = m a x U t , T
U t , T = i = 1 t j = t + 1 T s g n X i + X j .
In contrast, if U t , T exhibits a decelerating trend against time t, then an abrupt change has happened in the series. If U t , T increases with time t, then the sequence does not have an abrupt change. If the statistic is significant, K T is where the series’ abrupt change lies. For p 0.05 , the significance probability of K T is approximately calculated using
p = 2 exp 6 K T 2 T 3 + T 2 .

3.5. Normalized Difference Snow Index

In 1999 and 2002, the MODIS model was launched in the Earth Observation System for snow detection. The normalized snow index method mainly uses the Terra and Aqua platforms to accurately determine snow [53]. Daily snow cover data from MODIS Terra and Aqua (MOD10A1 and MYD10A1 version 61) are available from the National Snow and Ice Data Center Distributed Data Archive from 2000 to the present (https://nsidc.org/data/MOD10A1/versions/61, accessed on 15 January 2023). For the entire Varzob River Basin, we have extracted the MODIS datasets from 2001 to 2022. To create MOD10A1 landscapes in the Terra platform spanning the morning time (approximately 11:00 at the equator) and Aqua platform spanning the afternoon time (approximately 14:00 at the equator) the MODIS data from those two platforms were applied. The normalized snow index method is used to classify snow and is computed, applying reflected solar radiation in the observable (band 4, 0.545–0.565 m) and shortwave infrared (band 6, 1.628–1.672 µm) for the MODIS Terra and (band 7, 2.105–2.155 µm) for MODIS Aqua bands. In order to increase the contrast between snow-covered and snow-free surfaces, band 7 is used instead of band 6 in the MODIS Aqua model [54].

3.6. MODIS Data Analysis Approach

For the current study, the MODIS data were obtained from NASA’s EOS website (https://earthdata.nasa.gov/, accessed on 15 January 2023) with the HDF-EOS format (Hierarchical Data Format files converted to TIFF by M.R.T.) [55]. After that, by applying the MATLAB code, we have mosaicked and projected the 500 m Albers Equal Area Conic onto WGS84 data [56]. Data were averaged monthly for the spatial analysis of snow cover data. This was facilitated by a visual assessment of the snow cover in the Varzob River Basin. An NDSI pixel value > 0.4 indicates the presence of snow in the study area [57], and for further analysis, the snow pixels were converted into km2. To generate NDSI, the snow mapping method [54] was used, which takes into account the reflectance values for the spectral bands in order to correctly classify pixels as snow [58].
The daily snow cover product MOD10A1 and the weather station datasets were compared by Huang et al. [59]. Using MOD10A2, the snow cover area in northern Xinjiang, Central Asia, showed a clear seasonal trend. The air temperature has a significant impact on how snow is distributed, and different parts of northern Xinjiang in Central Asia have quite diverse spatial patterns of snow cover [59]. The snow cover trend in the Amu Darya Basin was evaluated by Zhou et al. [60] using MODIS 8-day snow data. A seasonal analysis of snow cover from 1986 to 2008 showed patterns in snow distribution over space and time as well as a decline in snow cover duration because of earlier runoff periods. Moreover, [60] proposed that the MODIS data are suitable to be used for a study of seasonal snow cover in mountainous areas across Central Asia.

4. Results

4.1. Air Temperature Analysis in the Varzob River Basin

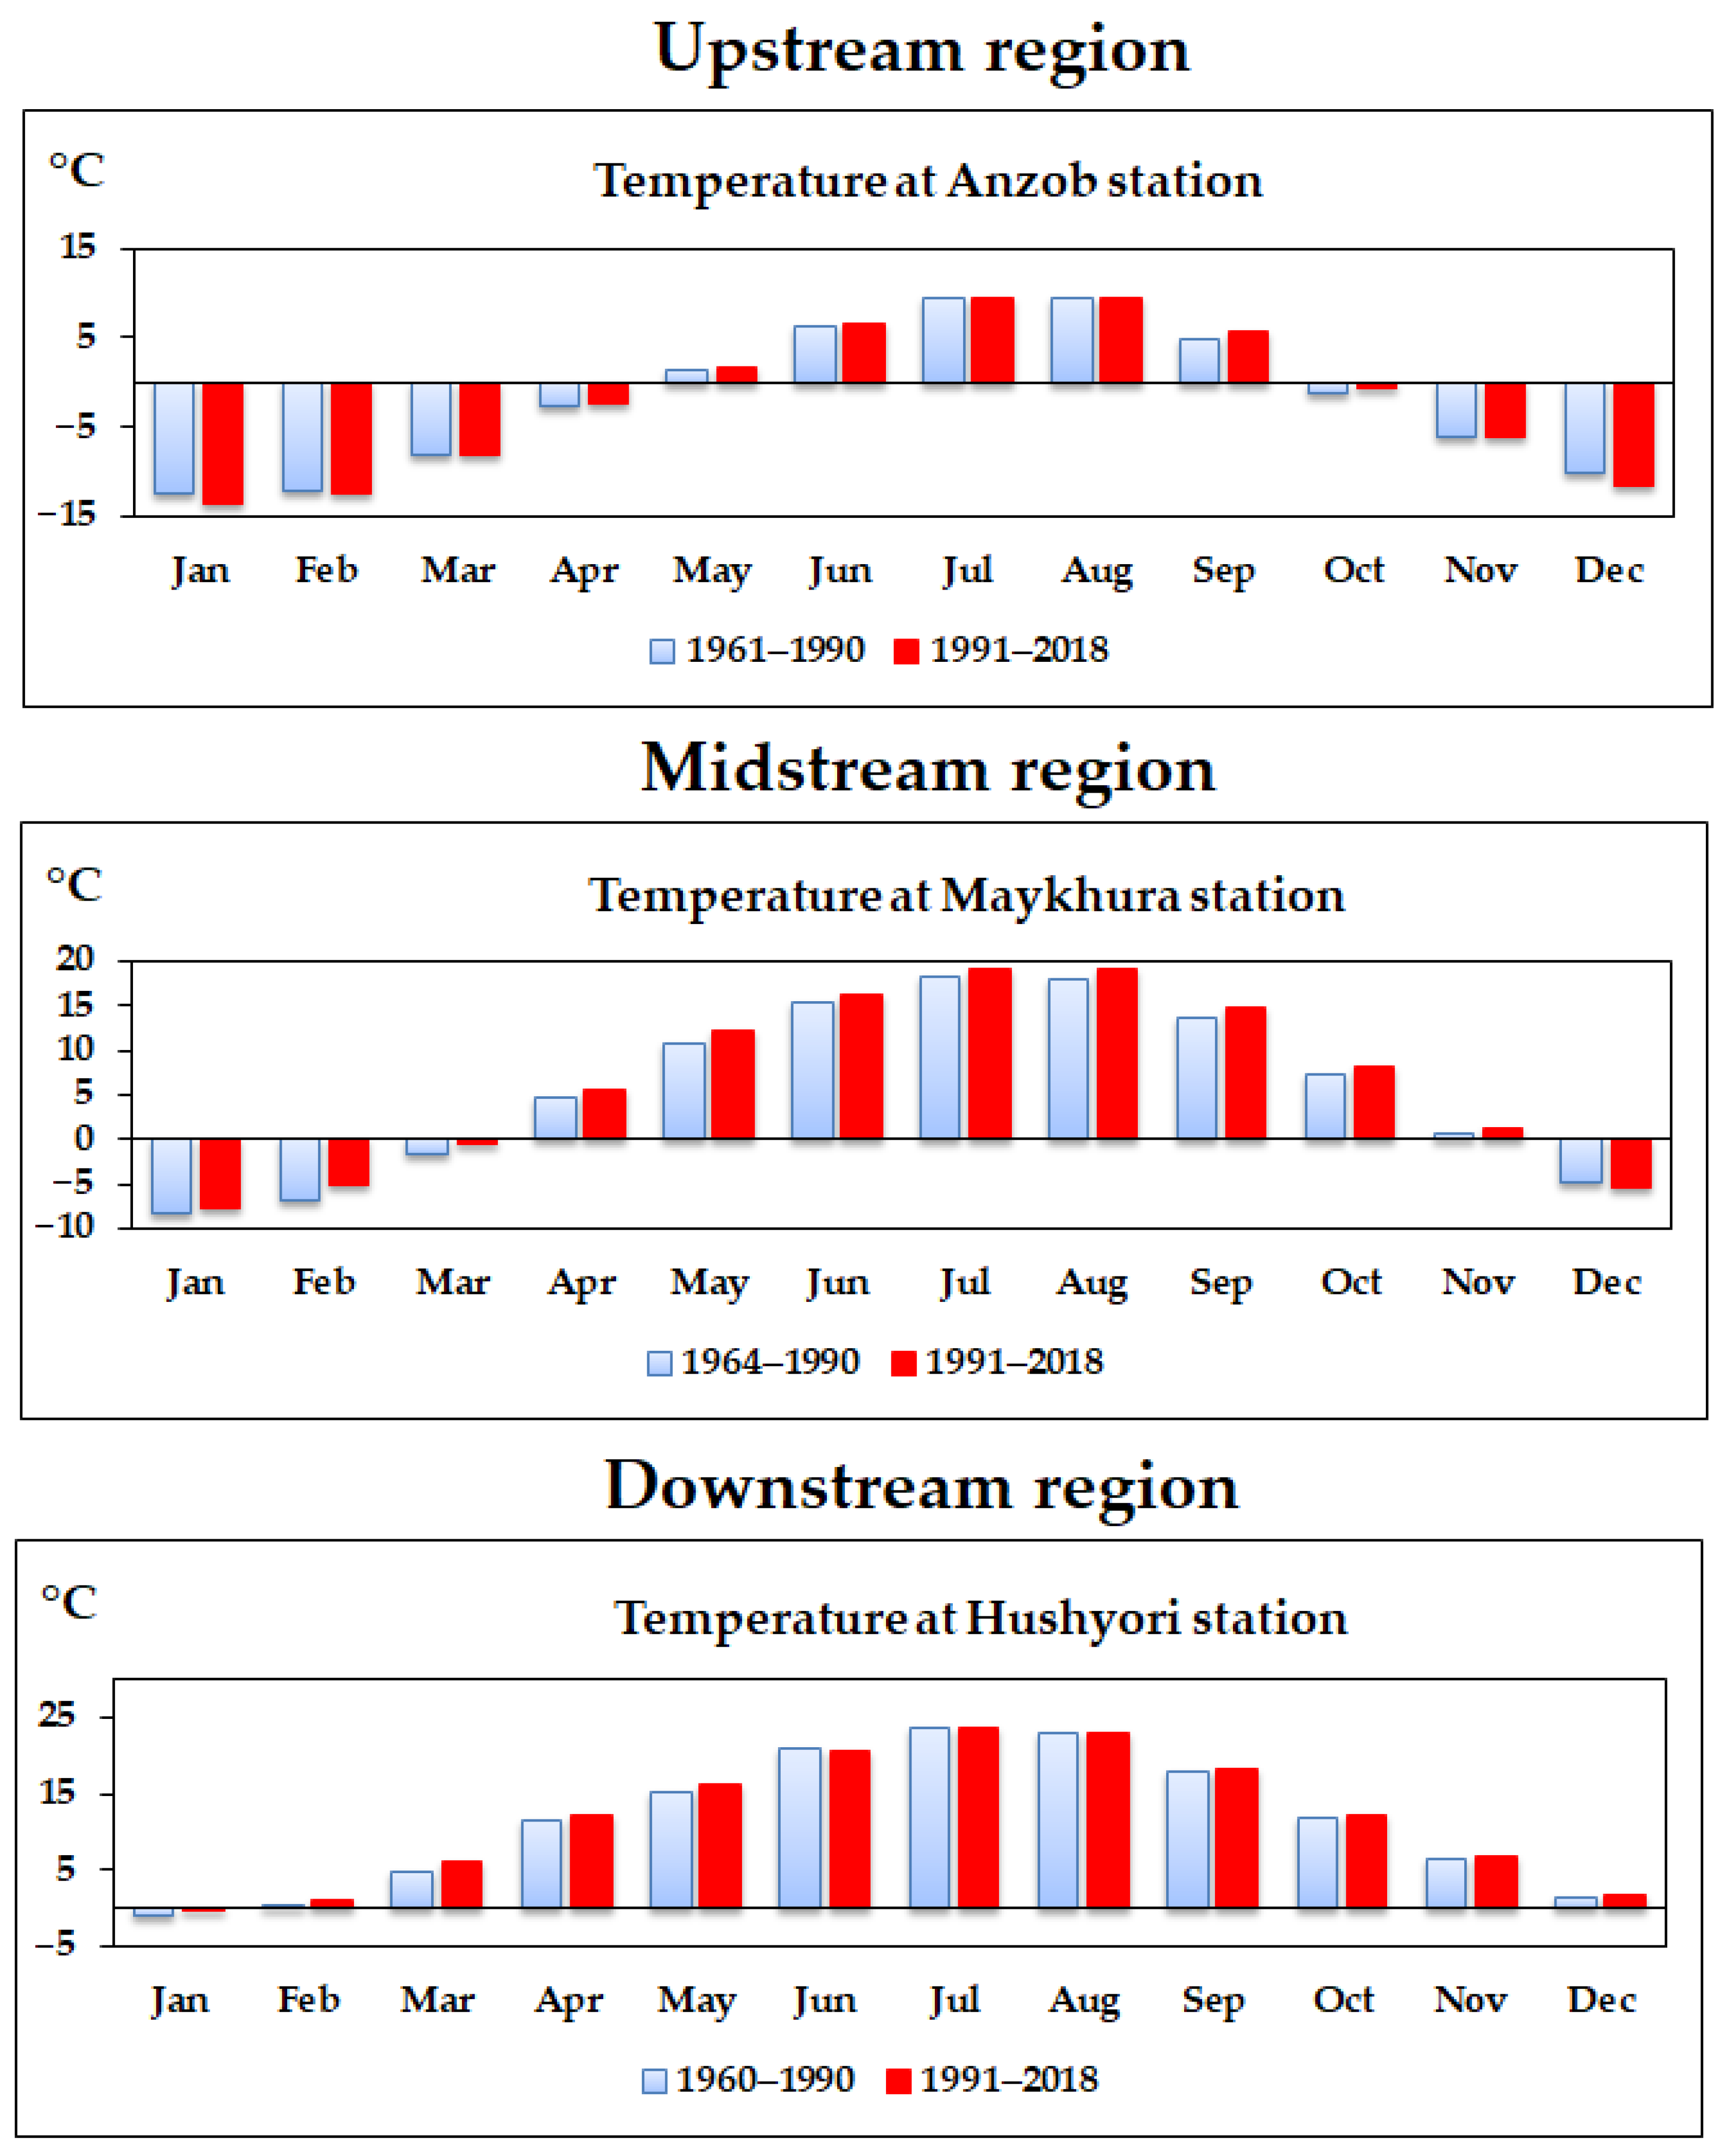
The Varzob River Basin’s various regions’ monthly air temperatures are shown in Figure 2. The Anzob station’s territory is in an area with a climate that is only moderately humid, with mild winters and relatively warm summers. The ambient temperature is −1.8 °C on a yearly average. The time without frost typically lasts 83 days. January is the coldest month with an average temperature of (−12.1 °C). The average minimum air temperature is −15.8 °C in January, however, severe cold air masses can cause it to plunge as low as −24–−36 °C. At the same time, throughout the winter, it can warm up to −5 °C during the day on some days. July is the hottest month (+9.7 °C). The maximum temperature during the hottest months is +24 °C, with the air warming up to +20 °C during the day. At the same time, if the minimum temperature is typically +5–−6 °C in the summer, it can occasionally fall to −4–−5 °C at night in the coldest years. In the summer, the absolute minimum temperature was −10 °C.
The Maykhura and Ziddi rivers meet at the Maykhura station area. The valley close to the station has rather steep slopes and is relatively narrow (200–300 m). The station is 1921 m a.s.l. The station’s territory is in an area with a climate that is moderately humid, with mild winters and pleasant summers. The first frosts appear in October, and the air-frost period lasts until mid-May. January is the coldest month of the year (average temperature of −8.6 °C). The severe cold air masses can cause the average minimum air temperature to plunge as low as −20–−27 °C. At the same time, during the daytime in the winter, the air temperature might drop to 0–−7 °C below zero on some days. July is the hottest month of the year (average temperature of +18.6 °C). The air warms up to +25–28 °C during the warmer months, with +35 °C being the absolute maximum. At the same time, if the minimum temperature is typically +7–−8 °C in the summer, it may occasionally fall to +3 °C at night in the coldest years. We discovered that the warmest month of the year is thought to be July, and the coldest month of the year is thought to be January by keeping track of the meteorological data (temperature) during the period 1960–1990.
The winter period in the middle part of the river basin is not very severe and the temperature background practically corresponds to the seasons. The calendar months of winter, namely December, January, and February, show relatively negative values. With the onset of spring, the temperature consistently shows a positive temperature.
Hushyori station’s region is in an area with a climate that is moderately humid, with pleasant summers and mild winters. The average yearly temperature is +11.2 °C. The time without frost is typically 225 days long. January is the coldest month. The minimum air temperature is typically −5.2 °C, although it can fall as low as −20–−27 °C when huge cold air masses arrive. At the same time, it can get warmer during midday in the winter on some days, reaching +5–14 °C heat. July is the hottest month with +24.2 °C (average temperature). The maximum temperature in the hottest months is +39 °C, with the air warming up to +25–30 °C during the day. In contrast, if the minimum temperature is typically +13–−16 °C in the summer, it may occasionally fall to + 3 °C at night in the coldest years.
By monitoring the meteorological data of the two periods (1960–1990 and 1991–2018), we found out that July is the warmest month and January is the coldest month of the year. The winter period in the lower reaches of the river is not very severe and the two remaining months of winter are December and February. The spring–autumn period practically does not cause sharp jumps in temperature.
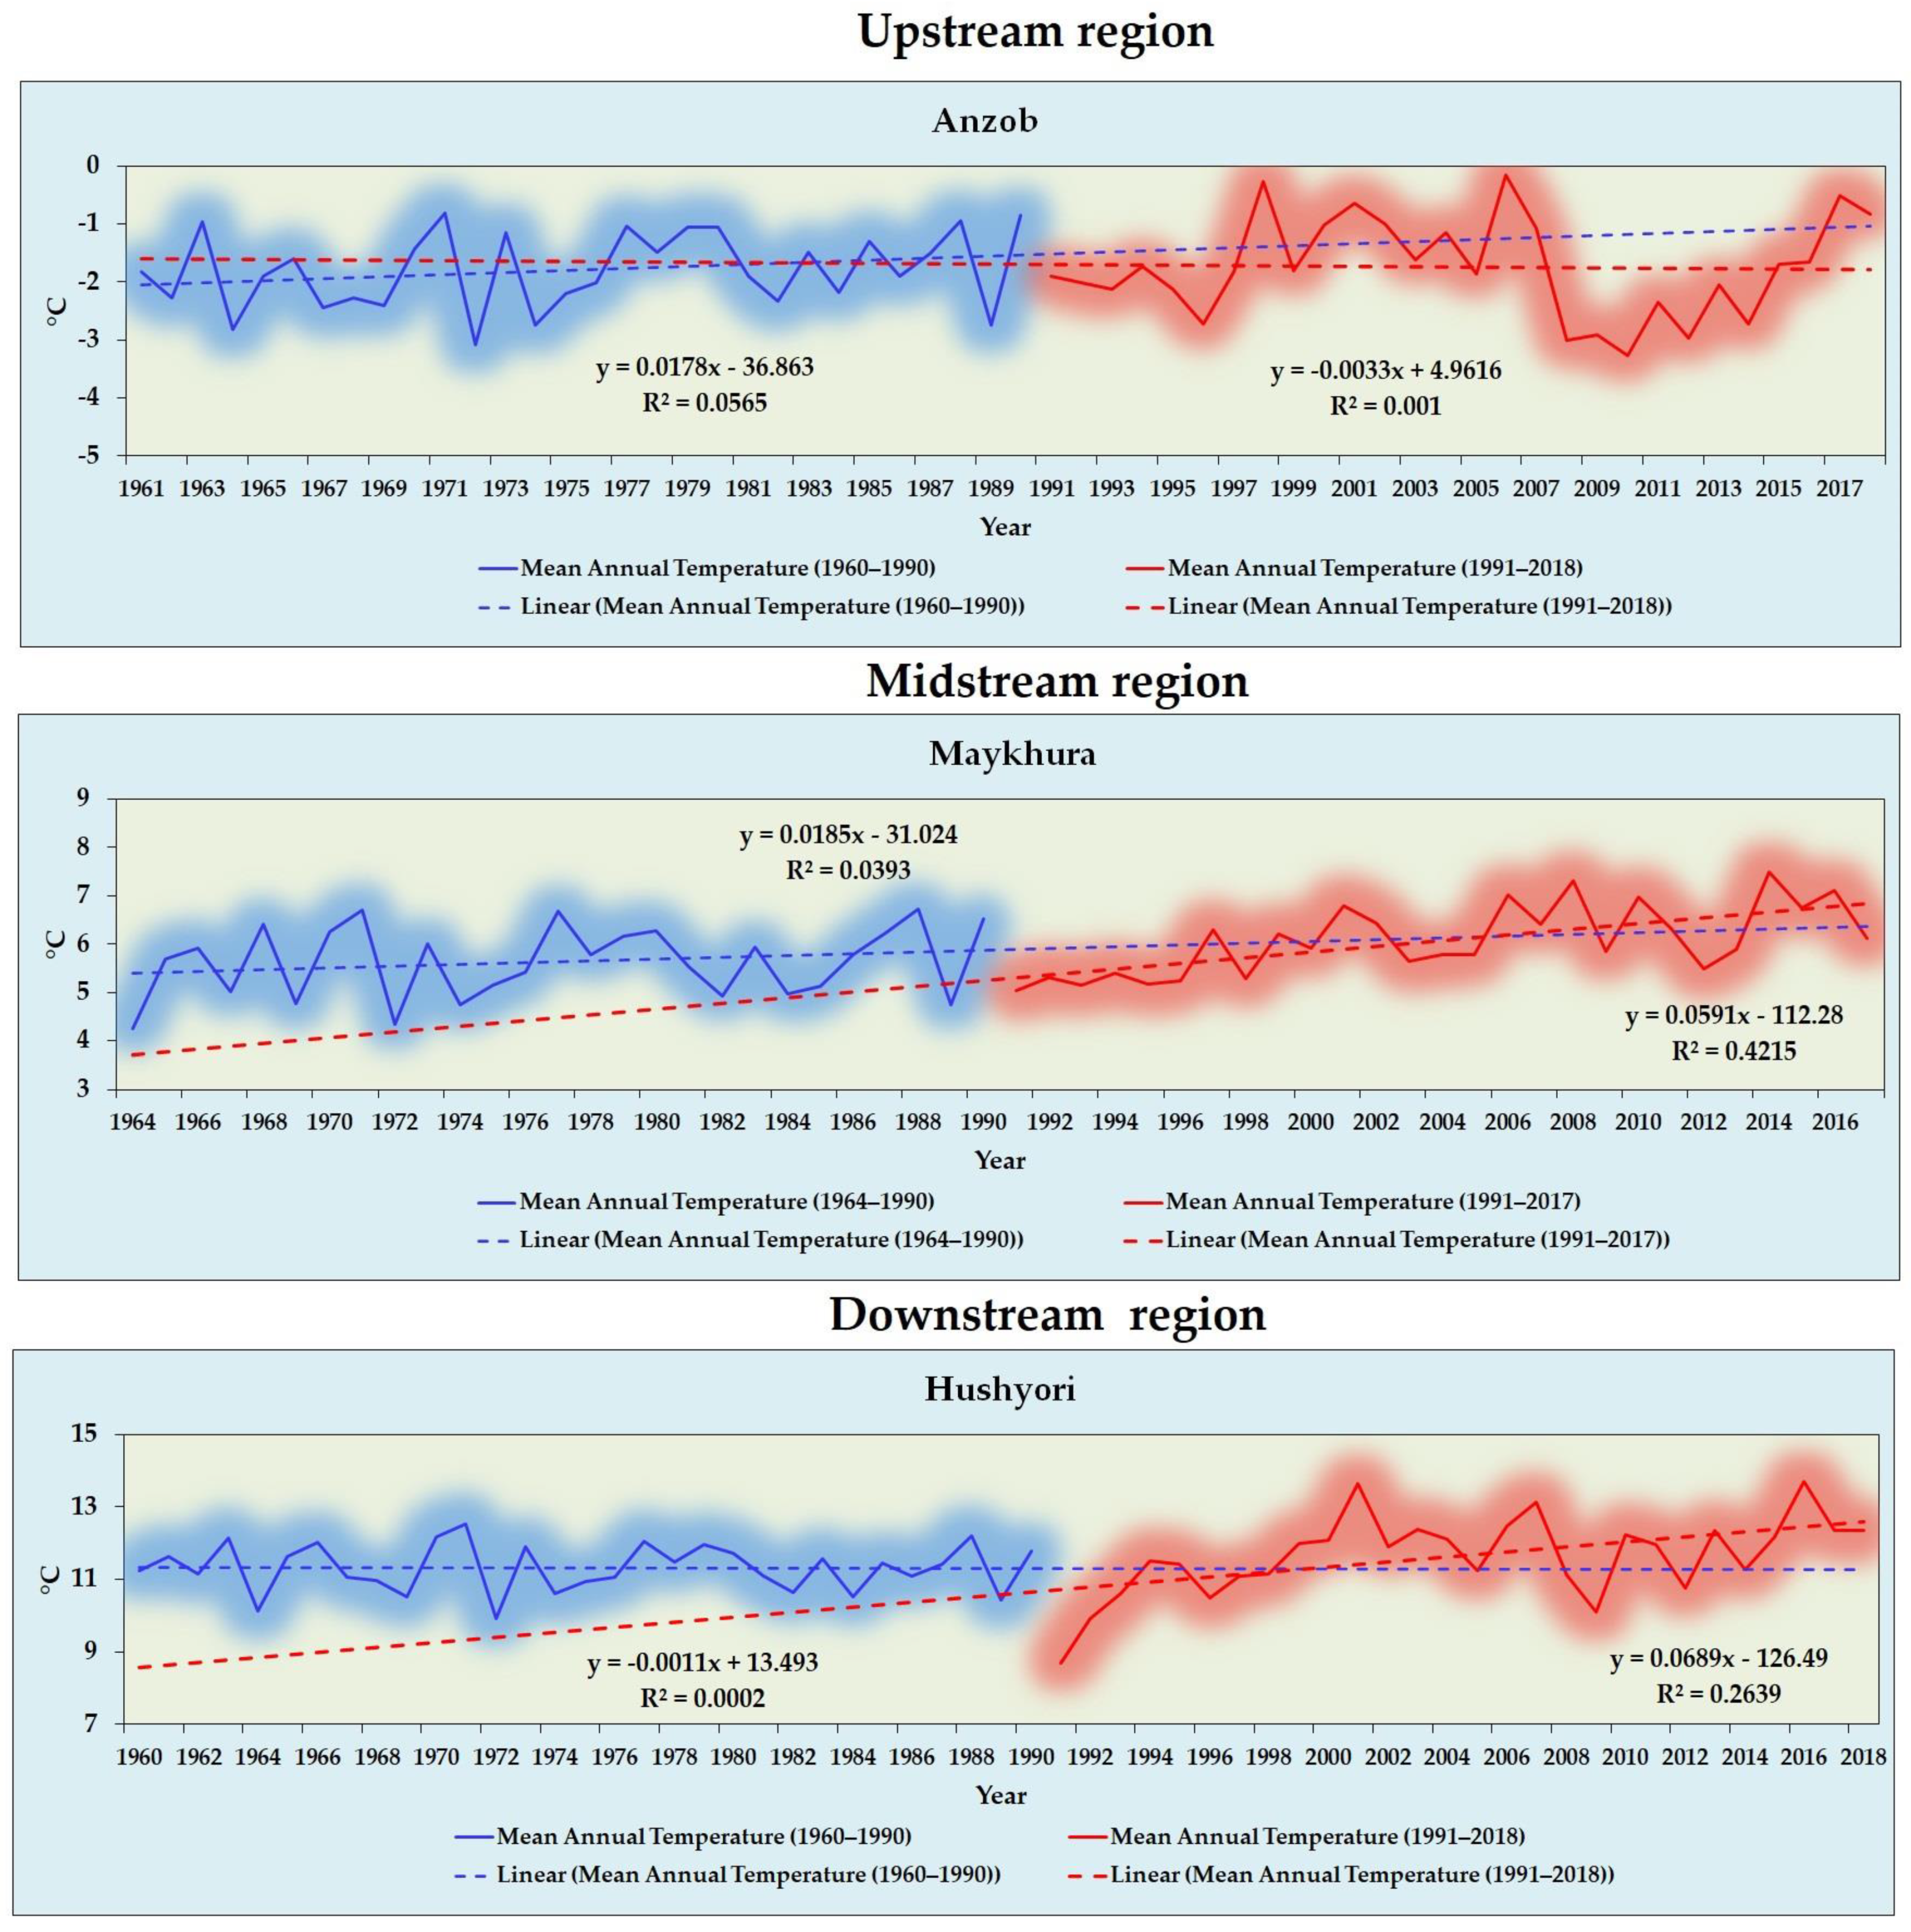
Assessing the temperature values by years at Anzob station in the upstream region, we can say that the predominance of sub-zero temperatures is clearly visible on the graphs and the relative minimum is below zero (Figure 3). General temperature monitoring for the period 1990–2018 showed that the trend line is in the mode of stable sub-zero temperatures. Additionally, small temperature spikes in 1998 and 2006, when the temperature jumped out of the zero mark, showed us relative anomalous years.
During the period under consideration, several years with a relatively hot weather were observed at Maykhura station: 1966, 1970, 1971, 1973, 1977, 1979, 1980, 1987, 1988, 1990. Additionally, in contrast to them, rather cold year weather periods were observed: 1964, 1967, 1969, 1972, 1974, 1975, 1976, 1981, 1982, 1984, 1989. During the period 1990–2018, in several years, relatively hot weather was observed at Maykhura station including 1997, 2002, 2006, 2007, 2008, 2010, 2014, 2015, 2016, and 2017. On the contrary, the cold weather periods were observed for the following years: 1991, 1992, 1993, 1995, 1996, 1998, 2004, 2005, 2009 and 2012.
Analyzing the temperature values over the years (1960–1990) at Hushyori station, we can say that relatively, several years with relatively hot weather were observed during the considered period: 1963, 1966, 1970, 1971, 1973, 1977, 1979, and 1988. Additionally, the opposite of them was observed in rather cold winter periods of weather: 1964, 1969, 1972, 1974, 1982, 1984, and 1989. For the second period (1991–2018), there were few years with relatively hot weather: 2001, 2007, and 2016. Additionally, the opposite was observed in rather cold winter weather periods: 1991–1993, 1996, and 2012.
Table 2 shows the trend analysis of the average temperature in the upstream, midstream, and downstream areas of the VRB. In the Anzob region (upstream area), according to the observational data in this region, the mean temperature trend in the first period (1961–1990) was recorded in March, September, and November. However, with a relatively large difference in the second period (1991–2018), a considerable increase can be observed in most months of the year. In general, from 1961 to 2018, the average air temperature in January, May, September, October, and December recorded a significant trend. The mean temperature in the Maykhura region in the period from 1964 to 1990 in January and September revealed a significant trend. However, in the next 30 years, that is, from 1991 to 2017, the average air temperature in almost all months, except for August, November, December, and January, has shown a significant trend. In general, during the period from 1964 to 2017, in January, February, March, April, May, and September, an increasing trend in mean temperature was observed. The air temperature in the period from 1960 to 1990 at Hushyori station (downstream region) in January, April, May, September, November, and December shows an upward trend. In February, March, June, July, August, and October, a downward trend was registered (Table 2). In total, six different months of the year have an upward trend at Hushyori station, and the other 6 months of the year, on the contrary, have a downward trend. During the period 1991–2018, in January, March, April, May, June, and July, a significant increase in air temperature was shown. During the same period, only in November and December, the air temperature recorded a downward trend. From 1960 to 2018, the temperature in March, April, May, and September significantly increased.
Table 3 shows the trend and magnitudinal analysis of the mean annual air temperature at Anzob, Maykhura, and Hushyori stations, which was carried out by Sen’s slope, Pettit’s test, as well as the original and modified MK tests for the trends (Z) in the upstream, midstream, and downstream areas of the Varzob River Basin in Tajikistan during the three time periods. In the Anzob region, during the period from 1961 to 1990, the mean annual temperature indicated a significant upward trend, while during the periods 1991–2018 and 1961–2018, a non-significant positive trend was observed. The analysis of the mean annual temperatures in 1964–1990, 1991–2017, and 1964–2017 exhibited a significant increasing trend in the Maykhura region. In the years from 1991 to 2018, a significant increasing trend in the mean annual temperature was observed at Hushyori station. Similarly, in this region, during the period from 1960 to 2018, we observed an increasing trend for the mean annual temperature.
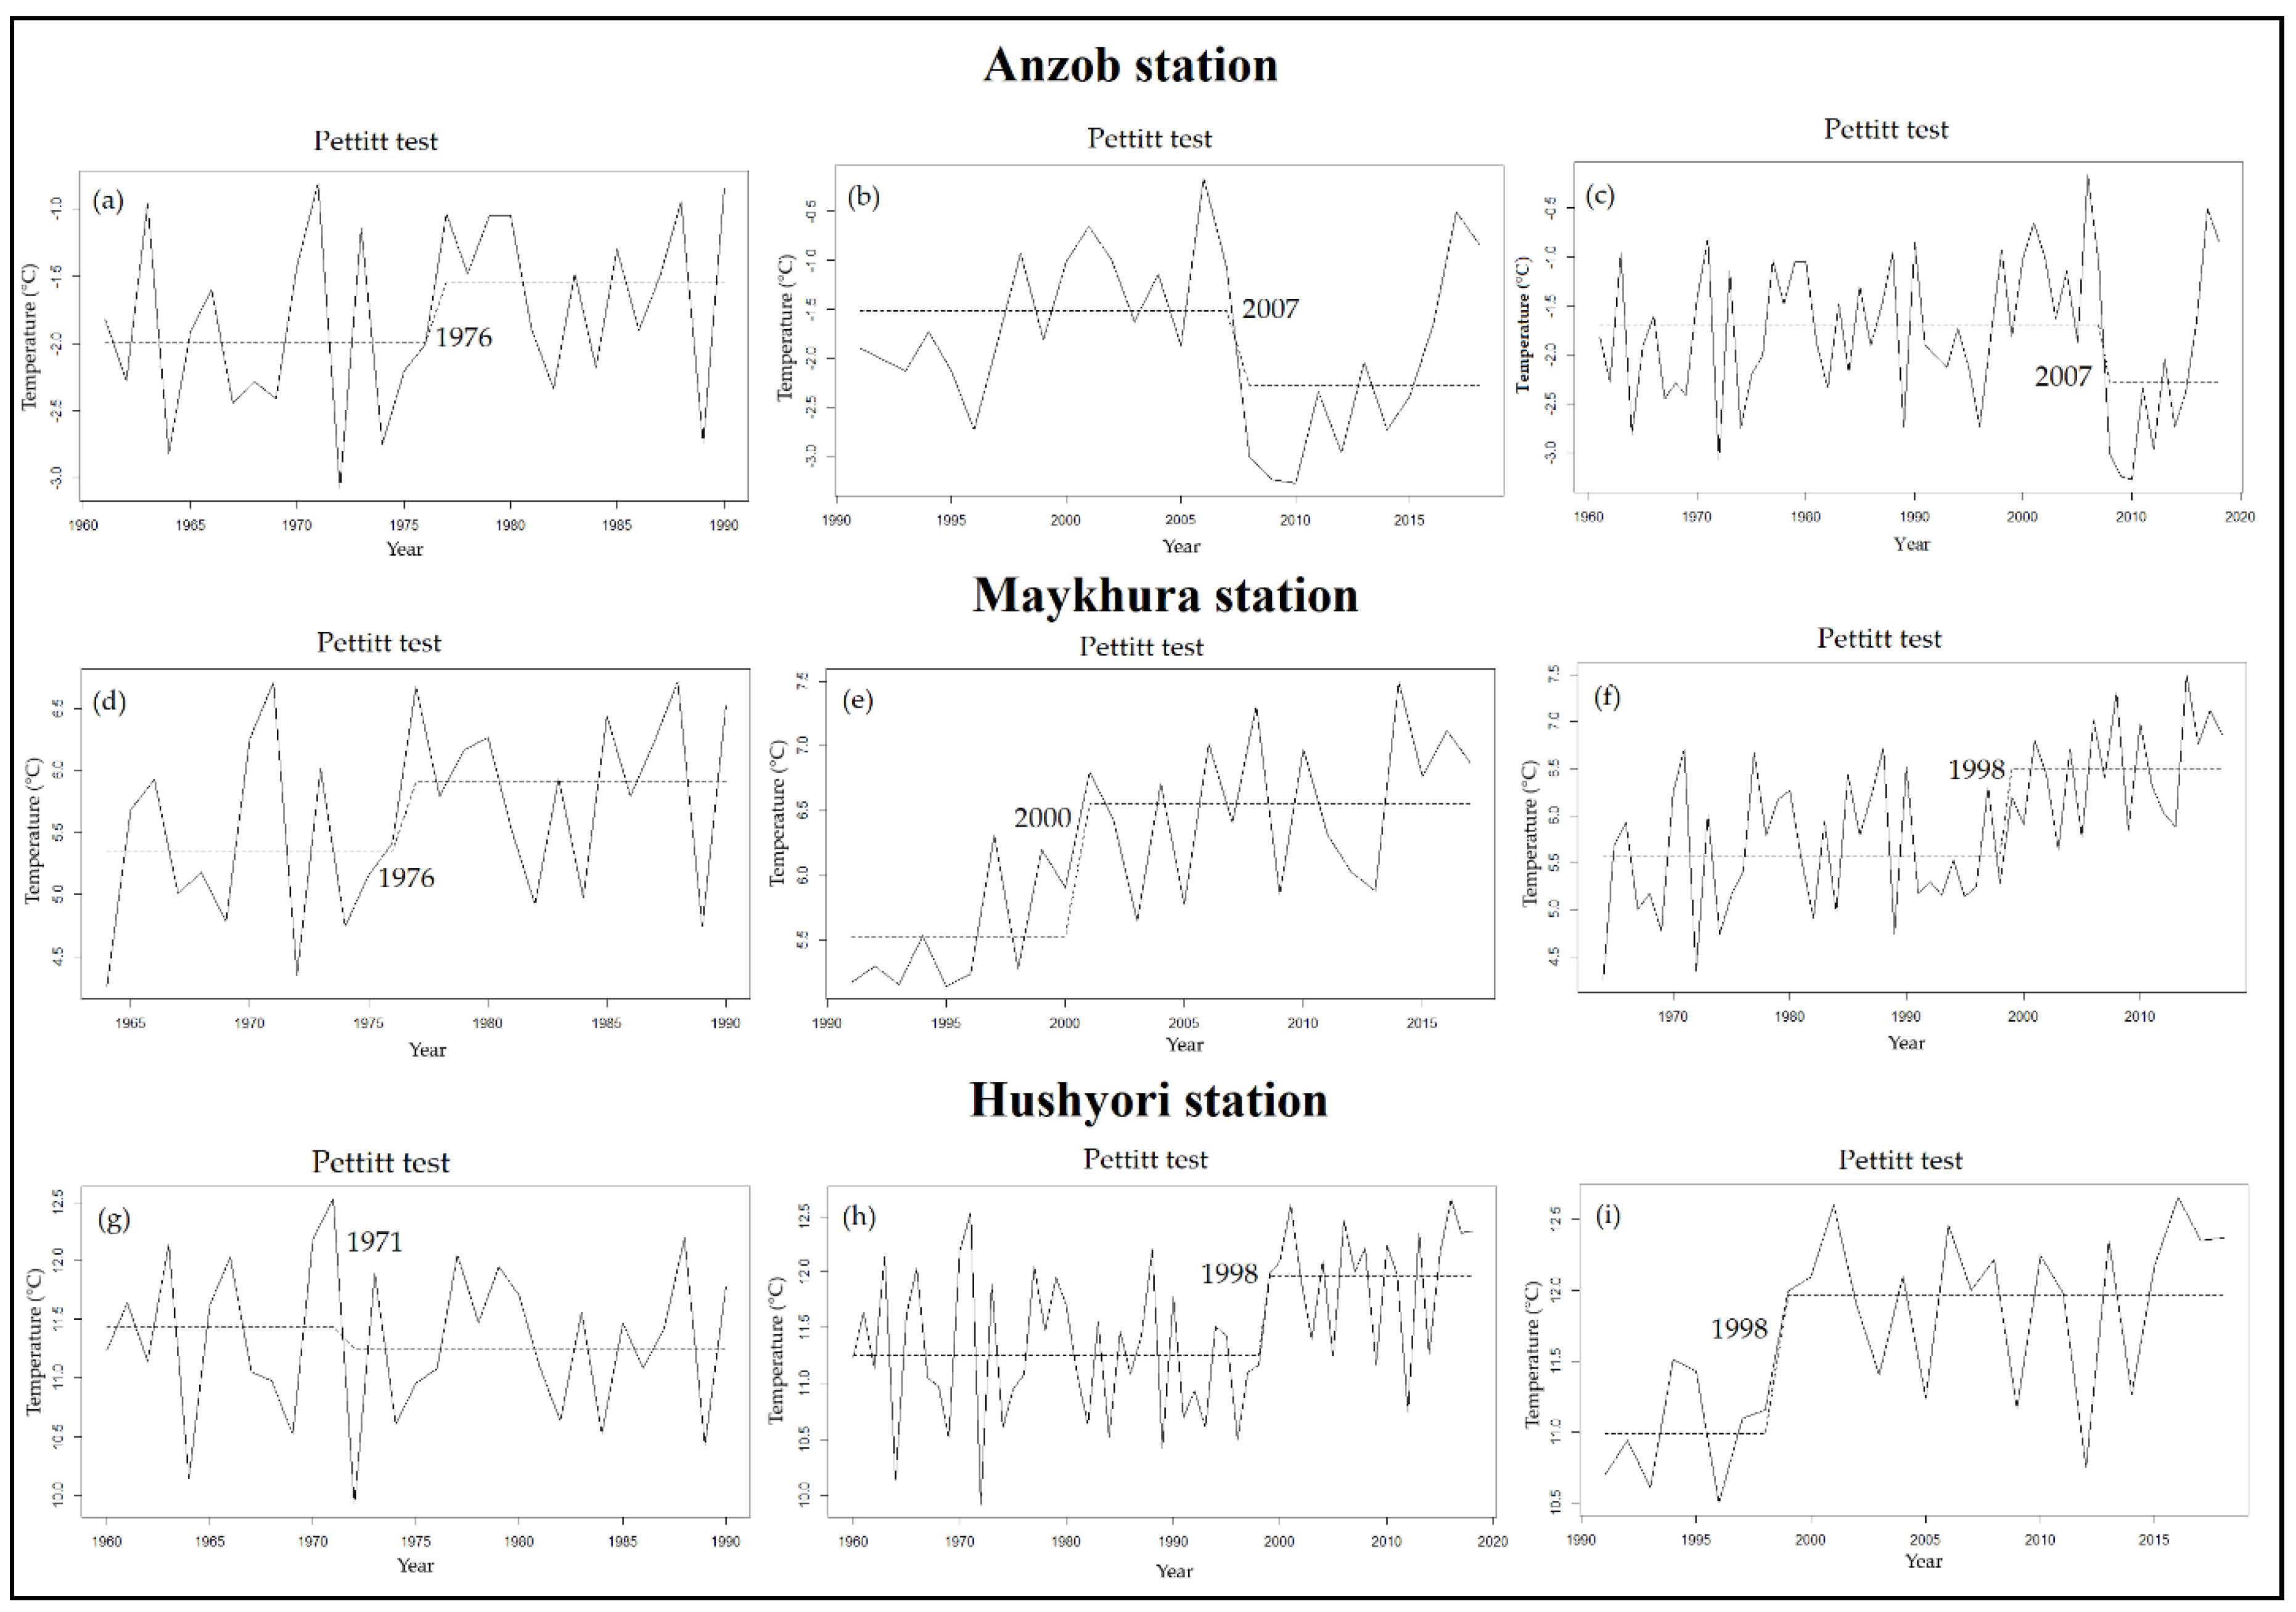
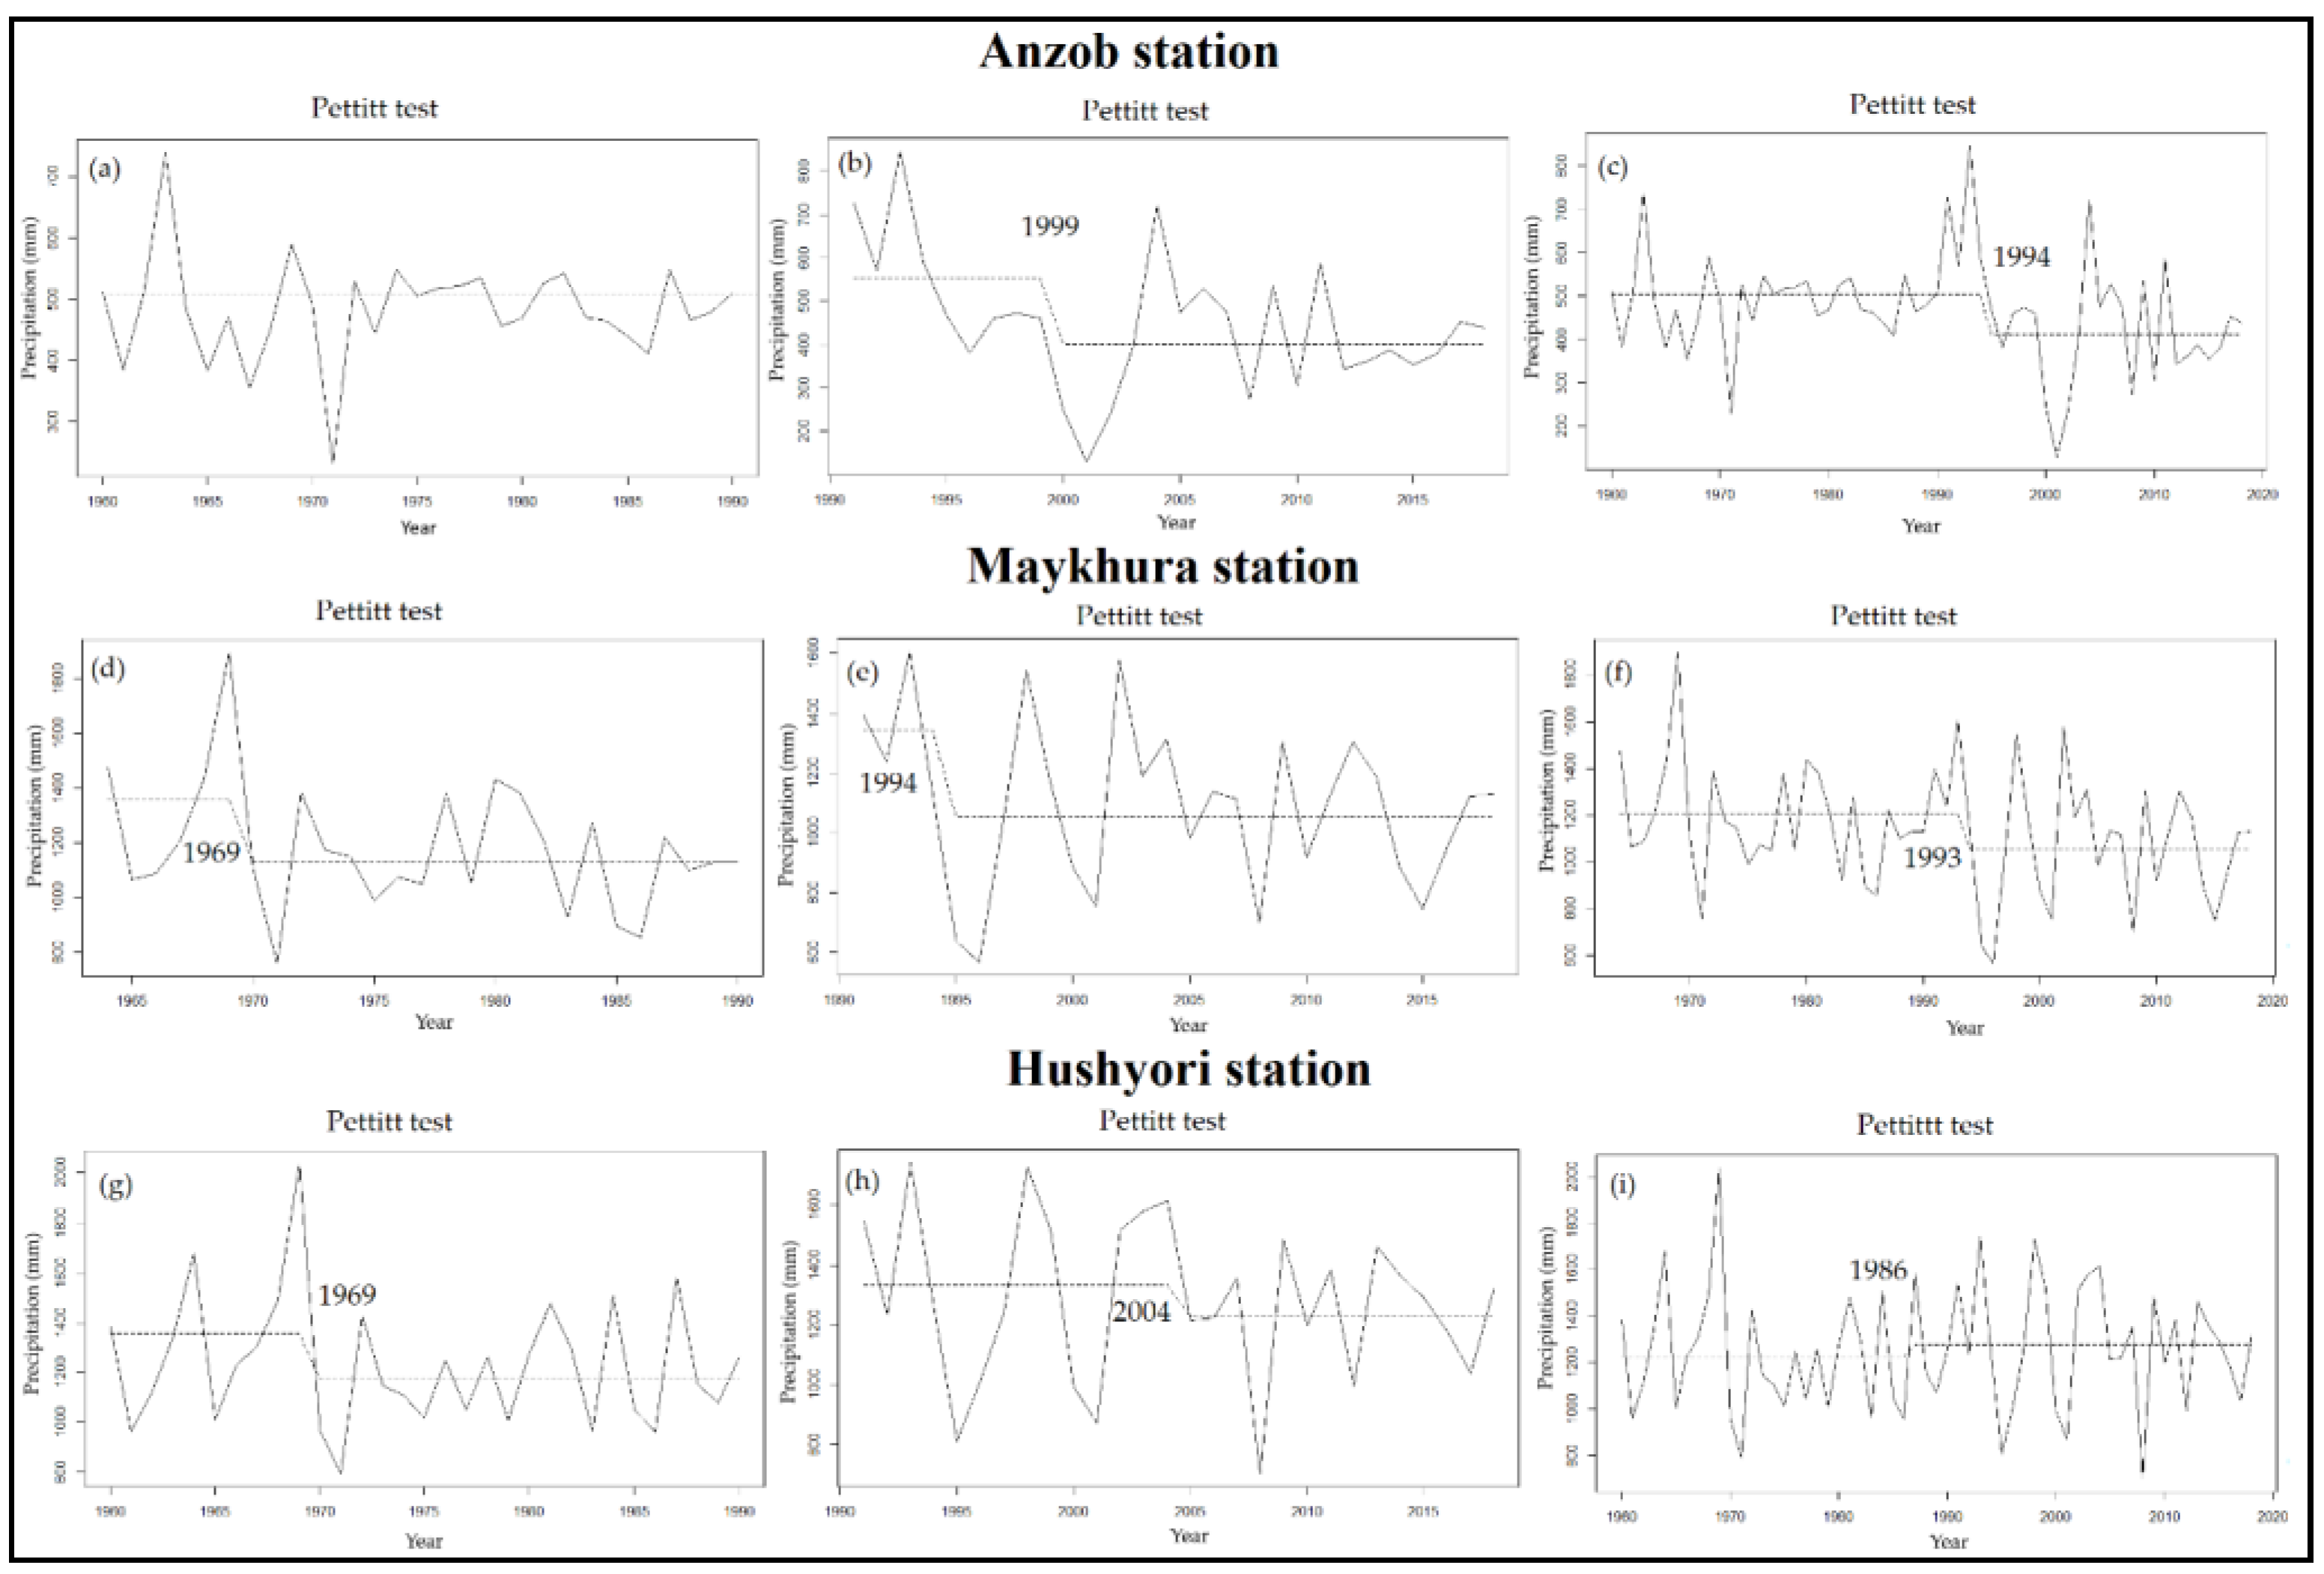
Figure 4 depicts the change point in the mean annual temperature over three historical periods in the headwaters, midstream, and downstream regions of the Varzob River Basin. The dramatic changes happened in 1976 (in Anzob station), 1976 (in Maykhura station), and 1971 (in Hushyori station) during the first period (1960–1990). For the Anzob, Maykhura, and Hushyori stations for the second period (1991–2018), the rapid changes in mean annual air temperature took place in 2007, 2000, and 1998. The dramatic change occurred for the Maykhura and Hushyori stations in 1998 for the full time (1960–2018) and for the Anzob station in 2007.

4.2. Precipitation Analysis in the Varzob River Basin

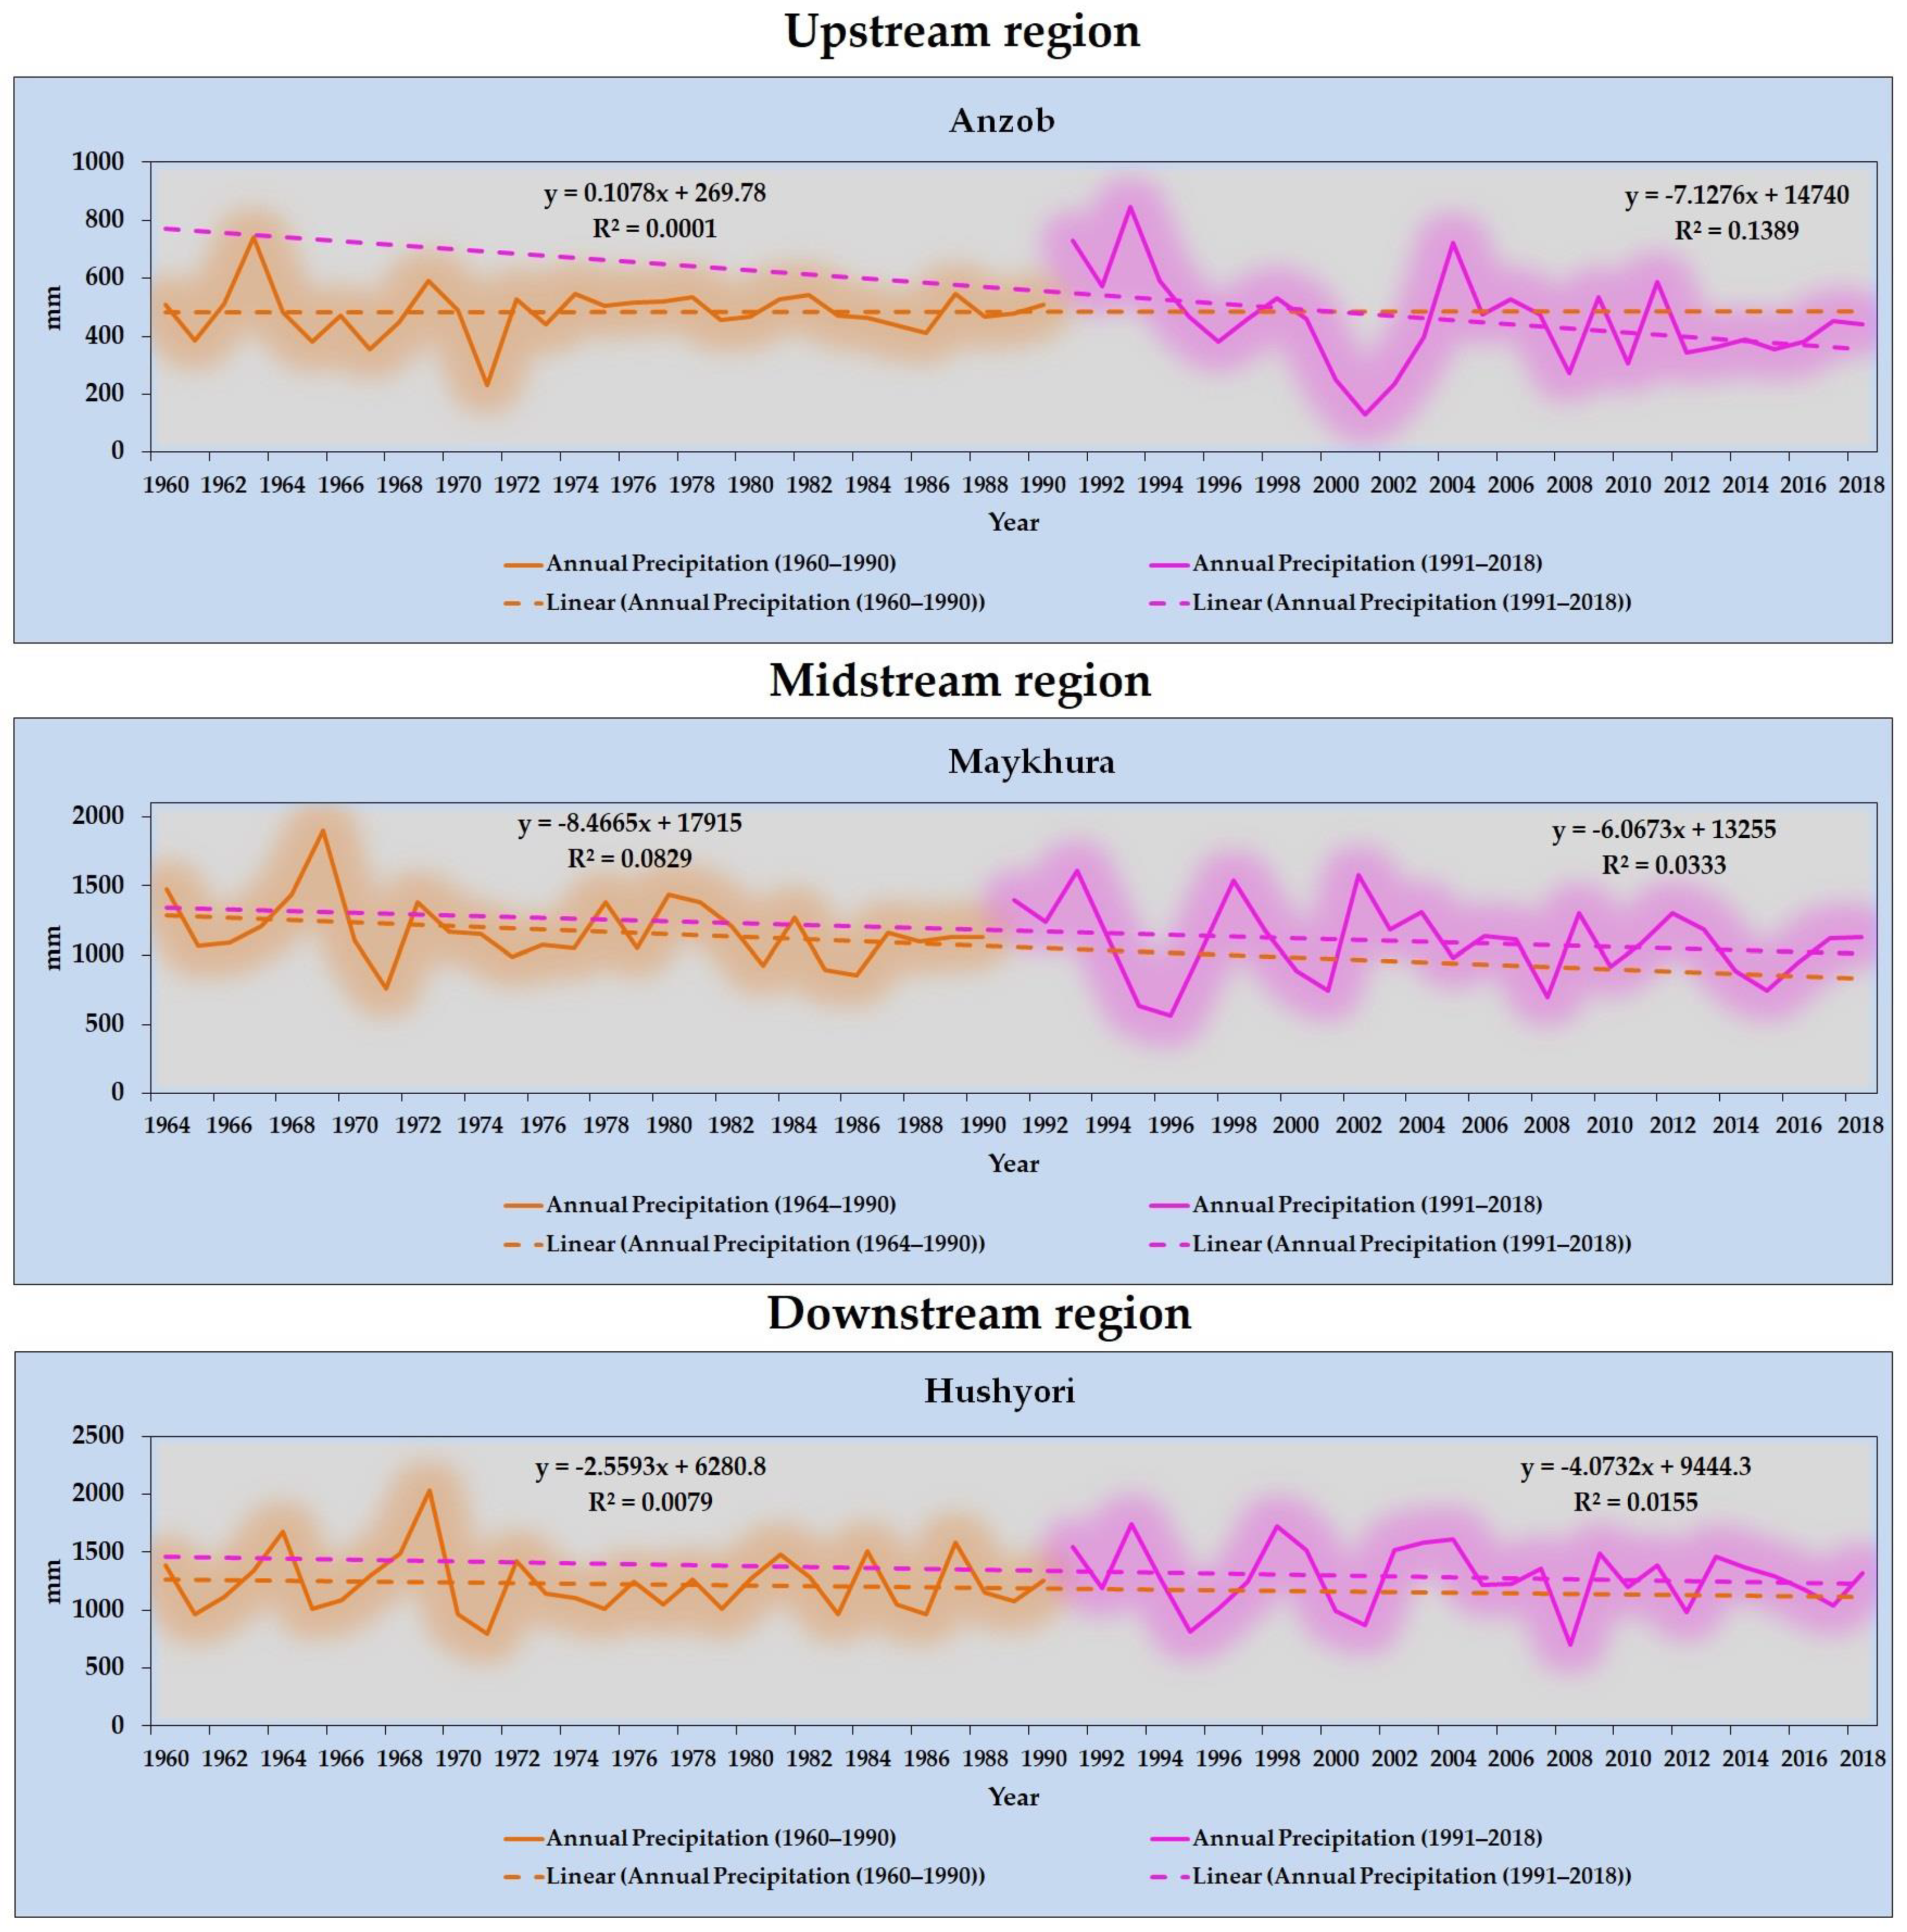
Figure 5 indicates the monthly precipitation changes in upstream, midstream, and downstream areas of the VRB. The annual amount of precipitation is 494 mm at Anzob station. The Anzob region is characterized by an annual course of precipitation reaching its minimum in August–September and its maximum in March–May. Annually precipitation mostly (44%) falls in the spring, 26% falls in winter, and 13–17% falls in the summer and autumn months. The average annual relative humidity is 65% and the average monthly ranges from 50 to 80%. Considering the second period (1991–2018), we can say that the period of precipitation has partially changed in temporal precipitation, as there was an increase in precipitation in February and March and a decrease in April. In mountainous terrain, precipitation forms mudflows on the river during the periods of late autumn and during spring floods.
At the Maykhura station, the annual amount of precipitation is about 1185 mm. The Maykhura meteorological station area is characterized by an annual precipitation pattern with a maximum in March (1964–1990) and in February and March (1991–2018) and a minimum in August–September. Most of them fall from December to April. According to the analysis and monitoring of precipitation during the period 1960–1990 at Maykhura station, it can be said that March is considered the most intense month in terms of precipitation, and August is considered the least water. Considering the second period (1991–2018), we can say that the period of precipitation has partially changed in temporal precipitation, as there was an increase in precipitation in February and March and a decrease in April.
At Hushyori station, the annual amount of precipitation is 1188 mm. The station is characterized by an annual course of precipitation with a minimum in August–September and a maximum in March. Their main amount of 45% falls in the spring, 35% falls in the winter, and 5–15% of the annual precipitation falls in the summer and autumn months. The average annual relative humidity is 54% and the average monthly readings range from 38% to 67%. We can note that March is considered the most intense month in terms of precipitation, and August is considered the driest. Considering the second period (1991–2018), it can be said that the period of precipitation has partially changed in the time of precipitation, so in February, there was an increase in precipitation and a decrease in April. The driest month was August.
Considering the period 1960–1990 at Anzob station, one can note that the years with the maximum amount of precipitation were 1963 and 1969, and the year with the least amount of precipitation was 1971. Relative to the obtained graph, it is possible to single out the cyclicity of the repetition of years with unstable precipitation. During the second period 1991–2018, the years with the maximum amount of precipitation were: 1991, 1993, 2004, 2006, 2009, and 2011, while the minimum amount was recorded in the following years: 1996, 2000, 2001, 2002, 2003, 2008, 2010, and 2012–2016 (Figure 6).
Analyzing the period of 1964–1990 at Maykhura station in the midstream region of the Varzob River Basin, one can note the years with the maximum amount of precipitation—1964 and 1969—as well as the years with the minimum amount of precipitation—1971. During the second period 1991–2018, the years with the maximum amount of precipitation can be noted—1991, 1993, 1998, 2002–2004, 2009, and 2012—as can those with a minimum amount of precipitation—1995, 1996, 2000, 2001, 2008, 2010, and 2015 (Figure 6). With regard to the obtained graph, one can single out the cyclicity of the repetition of years with unstable precipitation, i.e., sharp fluctuations in precipitation, with strong bursts of years with high precipitation and as opposed to those with the least precipitation. The repetition of years with unstable precipitation, i.e., below normal, ultimately affects the overall flow of the river.
During the period 1960–1990 at Hushyori station, the years with the maximum amount of precipitation were noted to be 1964 and 1969, whilst the year with the minimum amount of precipitation was 1971. During the second period 1990–2018, the years with the maximum amount of precipitation were noted to be 1991, 1993, 1998, 2002–2004, 2009, 2006, and 2013, and the years with the minimum amount of precipitation were 1992, 1995, 1996, 2000, 2001, 2008, 2012, and 2017. Concerning the obtained graph, one can single out the cyclicity of the repetition of years with unstable precipitation, i.e., sharp fluctuations in precipitation, when there were strong bursts of years with high precipitation as opposed to those with the least precipitation.
Table 4 shows the seasonal trend in precipitation in the upstream, midstream, and downstream areas of the VRB. During the period from 1960 to 1990, a significantly increasing precipitation was recorded in the Anzob region only in December and January. During the period from 1991 to 2018, a decreasing trend was recorded in June, July, and December. In general, during the period from 1960 to 2018, a significantly increasing trend was indicated in January and February, and a significantly downward in precipitation was shown in April and May. In the Maykhura station, during the period from 1964 to 1990, precipitation showed a decreasing trend only in April. During the period from 1991 to 2018, a significant trend of decreasing precipitation in June and July was registered, while from 1964 to 2018, a significant trend in decreasing precipitation in April was registered. During the period from 1960 to 1990, at Hushyori station, a significantly downward trend presented in November. From 1960 to 2018, a significant increase in precipitation was recorded in February and June, while a significant decrease in precipitation was only shown in December from 1991 to 2018.
Table 5 presents the results of the annual precipitation trend, slope, and change points in the three meteorological stations in the VRB. In the Anzob station, a significant negative trend in the annual precipitation was found in the upstream region during the periods of 1991–2018 and 1960–2018, while a non-significant positive trend was indicated during the period 1960–1990. According to the conducted analysis, in the Maykhura station (midstream region), precipitation during three historical times periods indicated a significant decreasing trend. Our result for the annual precipitation analysis presented a significant decreasing trend during the period of 1991–2018 at the Hushyori station, while from 1960 to 2018, the annual precipitation was found to have a slightly increasing trend in this region.
Figure 7 depicts the rapid shifts in yearly precipitation in the Varzob River Basin during the three historical periods. At the Maykhura and Hishyori stations, the yearly precipitation experienced dramatic shifts in the first historical time period in 1969, but not at the Anzob station between 1960 and 1990. The dramatic change occurred in the second historical period in 1999 (in Anzob station), 1994 (in Maykhura station), and 2004 (in Hushyori station). Dramatic changes at the Anzob, Maykhura, and Hushyori stations occurred in 1994, 1993, and 1986 during the entire period (1960–2018).

4.3. Snow Cover Analysis in the Varzob River Basin

Here, we described how dependent the river runoff is on snow reserves and trace its maximum runoff and low water period. Let us conduct a small study according to the Anzob meteorological station, which is the only station located in the Varzob river basin at an elevation of more than 3000 m.a.s.l. As can be seen in Figure 6, the period of maximum snow cover growth occurs in April, when the maximum snow height reaches 178 cm. Note that these data are considered to be the average of three rails installed at the meteorological site. This value is considered optimal for long-term data. There are periods with maximum snow height above two meters (240 cm along one of the rails installed at the meteorological site) and here you need to make allowances for the wind, which plays a role in the horizontal transfer of snow cover.
Before beginning the analysis for this part, it should be noted that we chose the data for 2014 for demonstration purposes due to the availability of snow cover data from the measurement-based weather station for a limited period of time. As shown in Figure 8a, snow cover is observed all year around for almost nine months and only three months—when the low-water period is considered to be almost zero (with possible precipitation in the form of rain). Thus, we observed that the snow cover appears in early October and practically does not melt after that. Wet-dry snow begins to accumulate in the high-mountainous part of the Varzob River and the fall of this snow does not affect the overall flow of the river. The sub-zero temperature firmly holds the snow crust until the spring, when the warm rays of light begin to saturate the snow cover with warmth in the daytime and “squeeze out” the resulting water at night. The flow of the river during this period is considered the most complete and full-flowing. The coldest months were February and December at Anzob station with a mean daily temperature of −15 °C, and the warmest temperature was recorded in July at +10.1 °C. At the same time, the snow cover lay until June, i.e., it can be said that the last natural recharge of the river runoff ends in June and precipitation in the form of rain wash away the remnants of the snow cover. The accumulation of snow cover occurs from October and continues until the beginning of April, and then, precipitation in the form of rain begins to wash away the accumulated snow cover, which has a beneficial effect on the runoff of the Varzob River. During the low-water period (July, August, September), the precipitation does not have a special effect on the increase in the river flow.
The Maykhura snow avalanche station in the midstream region (Figure 8b) is the only station located in the Varzob River Basin at an elevation of 2000 m.a.s.l. As shown in Figure 6, the maximum height in snow cover occurs in March, when the maximum snow height reaches almost 138 cm. Snow cover is observed all year for almost six months and only six months—the low-water period is considered to be almost zero (with the possible loss of small precipitation in the form of rain). Thus, we note that the snow cover appears in the first ten days of November and is practically unstable. Wet-dry snow begins to accumulate in December when the temperature is firmly in minus weather. The sub-zero temperature firmly holds the snow crust until the onset of spring. The coldest months at Maykhura station were January, with a mean daily temperature of −6.1 °C, and the warmest temperature was recorded in July at +19.4 °C. At the same time, the snow cover lay until May, i.e., it can be said that the last natural recharge of the Varzob river runoff ends in May.
We analyze the period of the accumulation of snow cover in the lower parts of the Varzob river. At Hushyori station, the maximum increase in snow cover occurs in February, when the maximum snow height reaches almost 54 cm (Figure 8c). These data are considered the average value for three rails installed at the meteorological site. Snow cover is observed all year around for almost five months and the low-water period is considered to be almost zero (with possible slight precipitation in the form of rain) for only seven months. Snow cover appears in the last ten days of November and is practically unstable. Wet-dry snow begins to accumulate in December when the night temperature is firmly in below zero.
At Hushyori station, the temperature is below zero only in February—this is the coldest month with a mean daily temperature of −2.4 °C, and the warmest temperature was recorded in July at +24.2 °C. At the same time, the snow cover lay until April, i.e., it can be said that the last natural recharge of the river flow ends in March in VRB and the observed precipitation in the form of rain washes away the remnants of the snow cover. The highest snow is observed in the high-mountain zone (Anzob area) of the Varzob River Basin, with a maximum snow height exceeding 2.5 m. Snow saturation occurs in winter during unstable weather and fog formation, as well as in February–March at positive daytime temperatures.
Ackroyd et al. [61] studied the snow cover dynamics in the Amu Draya and Syr Darya River Basin in Central Asia. Their study indicated that the trends along the Syr Darya River and Amu Darya River did not fully apprehend the inconsistency across various features and other topographical factors. An increasing rate of warming does have a greater effect at higher elevations, according to the trends analysis across elevation bands [62]. Nonetheless, there is still potential to determine more localized trends within each basin to better understand the spatial variability in mountainous regions. This study applied the snow cover data from the MODIS in the Varzob River Basin in Amu Darya River Basin. It should be noted that MODIS images have been extracted which have less than a 10 percent cloud. The MODIS satellite data are available for the period of 2001–2022, which is used to analyze snow cover in the region of interest. Therefore, the study is limited to this time period as it is the only period for which the necessary data are available. Figure 9 shows the MK trend test based on the p-value. The p-value is a statistical metric that helps define whether the observed snow cover trend is more likely to be a real and significant trend or just the result of chance or random variation in the data. The p-value for our study was found to be less than 0.05, which means that there is a 95% probability that the observed trend in snow cover is real and significant rather than the result of chance or random variation in the data. Accordingly, the snow cover trend is regarded as statistically significant at a 95% confidence level [63].
The MK test was applied to analyze the snow cover area trend. 
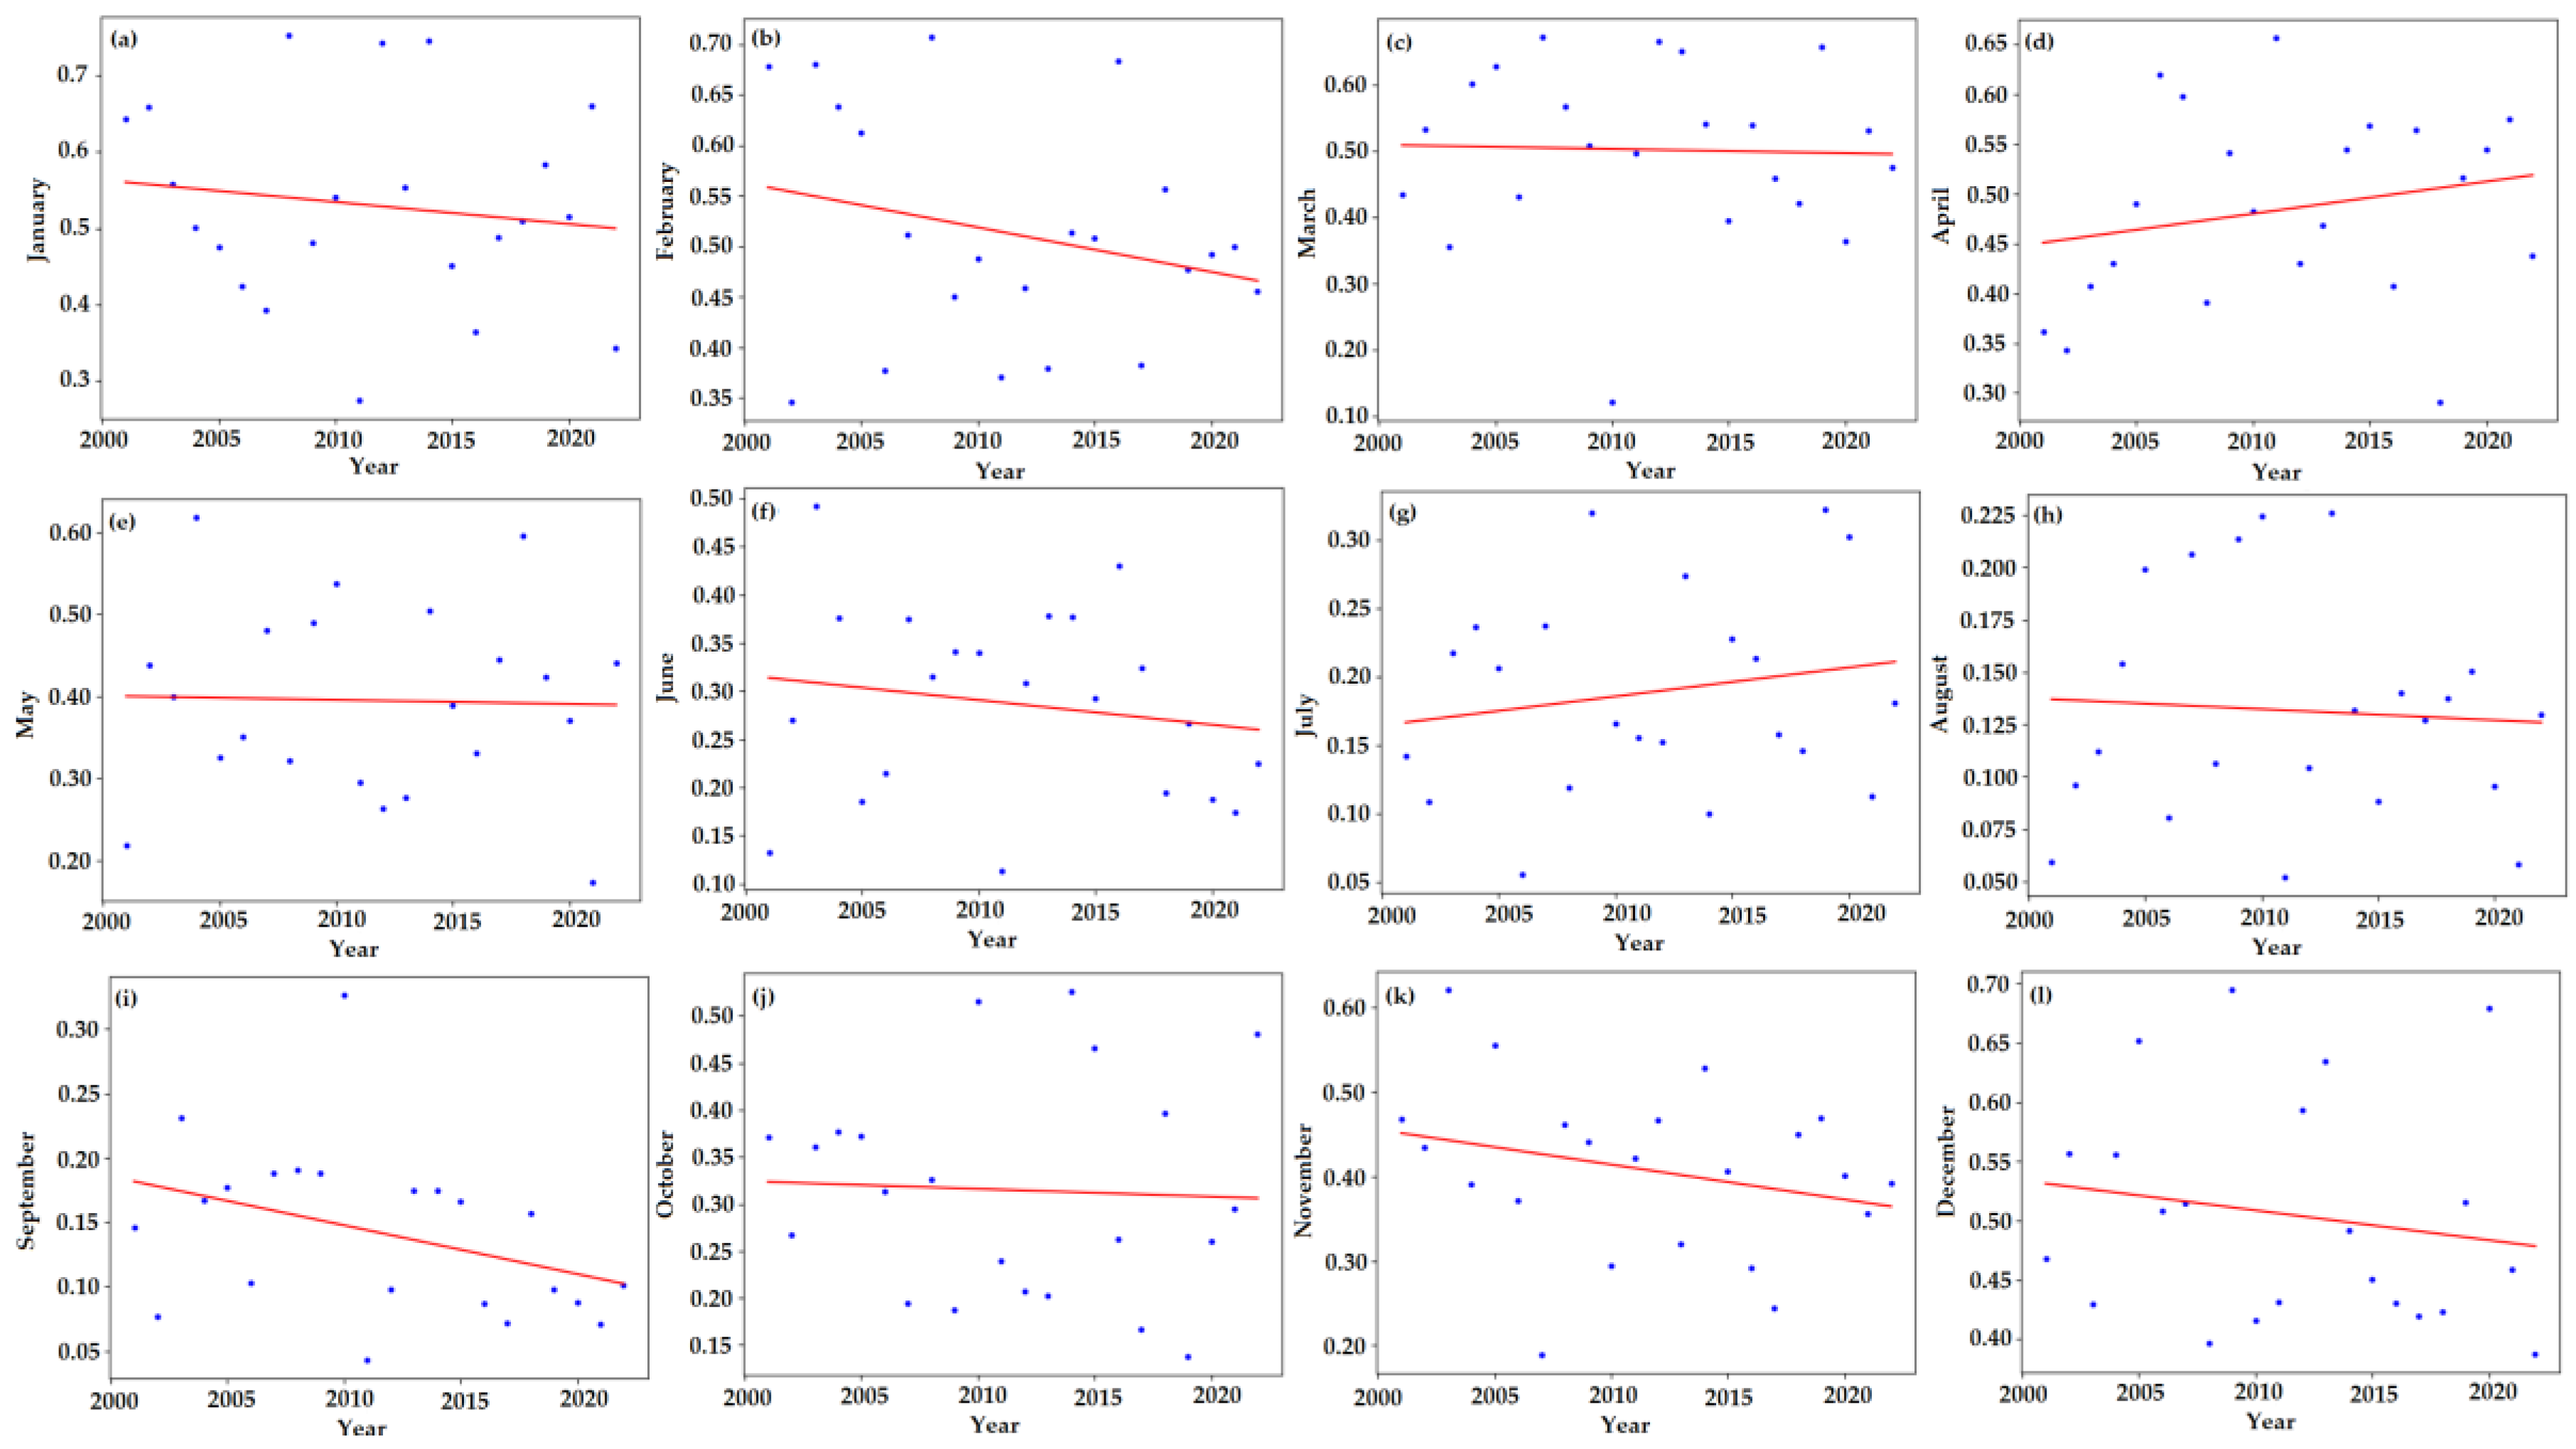
Figure 9 shows the overall monthly snow cover trends of the study area. Our results indicate the overall decreasing trend in snow cover area during February, September, and November and an increasing trend in July. We further analyzed the snow cover trends at three available station-based data and describe these results in Table 6. We observed that, at a height elevation area, the snow cover area showed a decreasing trend spatially in the winter season. Hushyori station belongs to the low elevated region and showed the decreasing trend during most of the months. These results explain the clear picture of the snow cover area overall, and at the evolution level, show trends on a monthly basis in the VRB. The decreasing trend in February and September could be more of a concern about the hydrological system of the study area because these months relate to the season shifting month, and the trend results indicate the intensity of the warming conditions in VRB during the period 2001–2022.
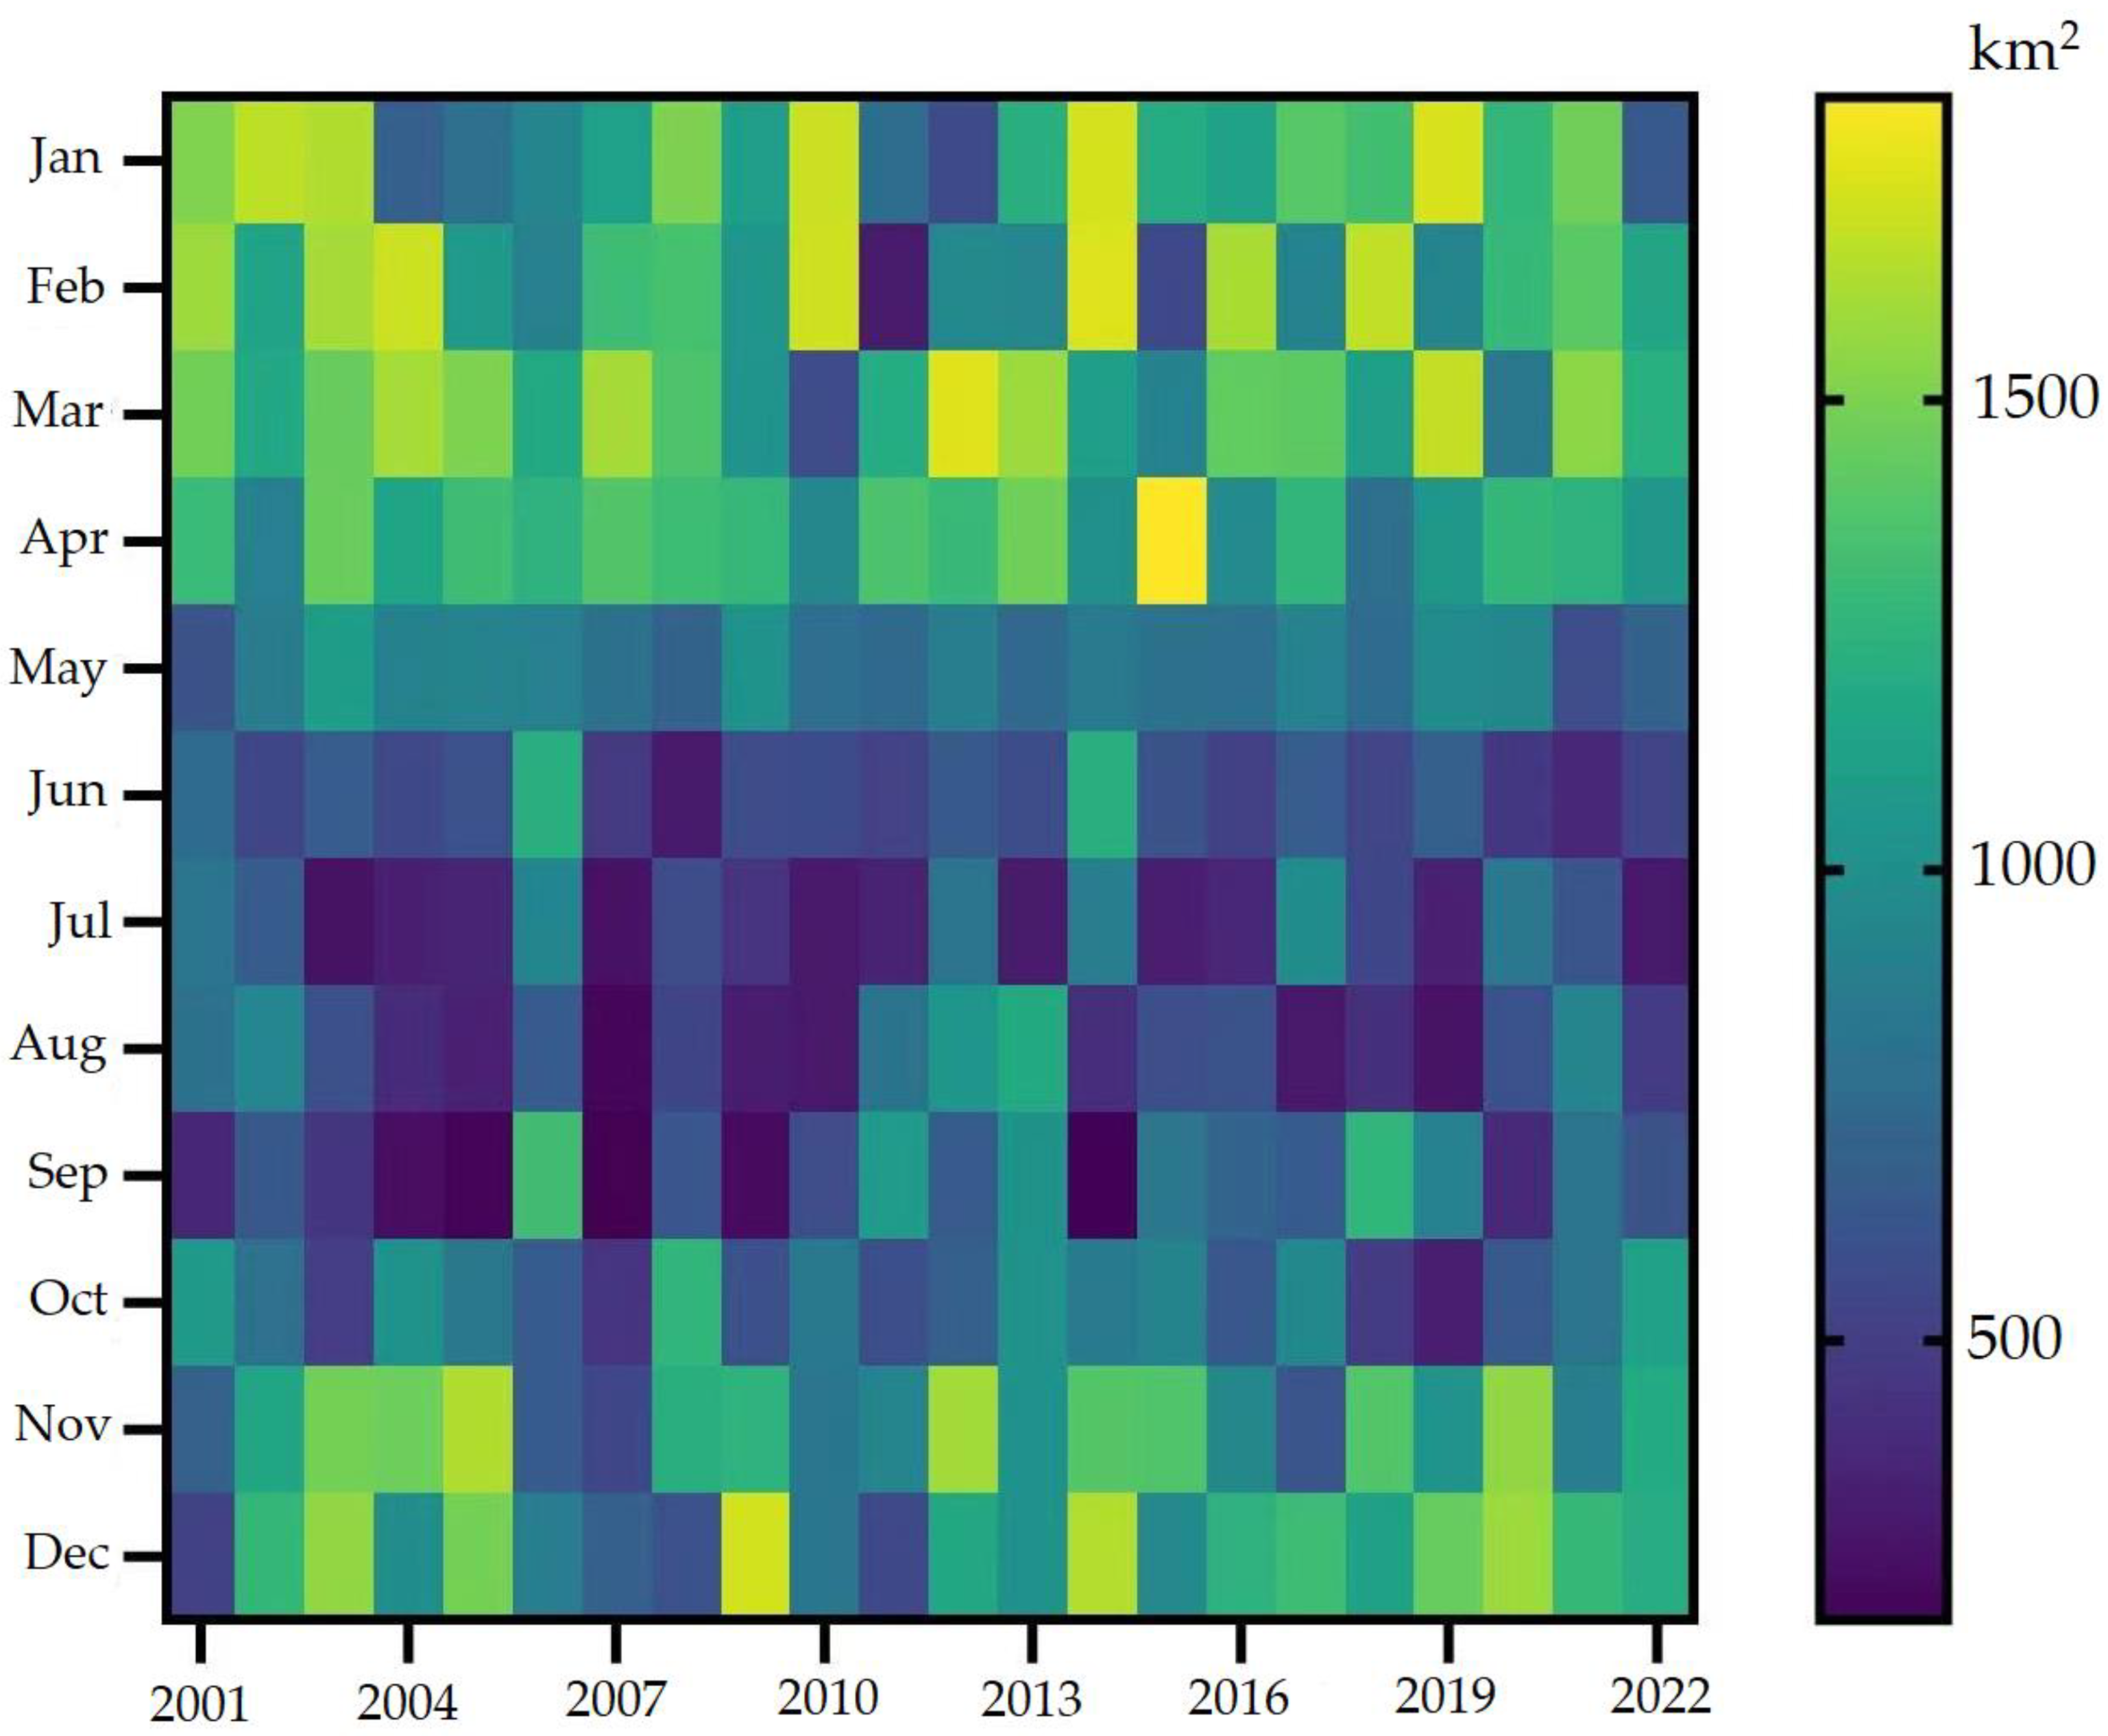
In our study area, the heatmap reveals some interesting trends. Understanding the snow cover dynamics can be helped by looking at the heatmap, which provides a visual depiction of the patterns and changes in snow cover area over time and across several months (Figure 10). The heatmap demonstrates that, as is typical for most places, the maximum amount of snow cover is in winter (December–February) and the minimum is in summer (June–August). Likewise, the amount of snow cover over the period represented in our heatmap may vary slightly from year to year. The X axis also appears to indicate some variation in snow cover from year to year, with some years having higher snow cover than others. The spatial patterns of snow cover also vary across the years. For instance, some years show a more widespread snow cover over the study region, while the other years show a sparser snow cover. In the Varzob River Basin, the sum of the snow cover area from January to December was found for 13,013 km2 in 2014 and 9063 km2 in 2007, which are considered the maximum and minimum snow cover zones during the period 2001–2022, respectively. In general, seasonal snow cover changes during the study period (2001–2022) indicated the largest area covered by snow in January, February, March, and December, and showed the smallest area of snow cover in June, July, and August. Figure 10 indicates that there appears to be a pattern in snow cover throughout the year, as well as across the 22 years from 2001 to 2022. There is maybe a connection between these patterns and variables including the temperature and precipitation patterns.

5. Discussion

There are many contradictory results in various areas of the highlands regarding the increase in temperature in the regions dependent on the elevation. In some mountainous terrain, warming increases with altitude [64,65]. On the contrary, some studies have revealed that the rate of temperature increase in high mountain areas is lower than in low mountain areas [66,67]. In our study, the seasonal air temperature analysis revealed an increasing trend in all three stations at different altitudes for most months during the 1960–2018 and 1991–2018 periods. However, for the months of January, February, and December, a decreasing trend was observed in the Anzob climate station, located in the upstream regions of the VRB. This finding is consistent with the results reported in the literature [66,67]. The mean annual temperature showed a significant increasing trend during all periods in the upstream, midstream, and downstream regions, which is in a line with the findings of the previous studies [64,65].
For the precipitation trend investigation, in the historical time from 1960 to 2018, a significant upward trend was indicated in January and February in the Anzob station. Similarly to this, Chen et al. [11] and Song et al. [68] discovered a significant increasing trend in the winter precipitation for the Central Asia region, where they identified an increasing trend throughout the 1930–2009, 1960–1991, and 1960–2013 time periods. According to the assessment by Pendergrass et al. [69], the global winter precipitation increased during the second half of the 20th century, which can be attributed to the role of increasing moisture counteracted by weakening circulation. Our results showed a decreasing trend in precipitation in April in the upstream, midstream, and downstream regions during the periods 1960–1990 and 1991–2018 in the VRB. The current result is in line with the results of the Martinez et al., wherein a significant downward trend was found in October and May during the period 1970–2009 [23]. The annual precipitation presented a significant decreasing trend during two periods (1991–2018 and 1960–2018) in the upstream region of VRB, while a non-significant positive trend was indicated during the period 1960–1990. Almost all stations during all periods exhibited a downward trend in annual precipitation in the VRB, which corresponds to the results of Liu et al. in the Yellow River Basin in China [70] and the same statistical trend revealed by Li et al. [71] over Central Asia. According to Ahmed et al. [72], the MMK trend test revealed a significant upward trend in annual precipitation along the Yangtze River in the Qinghai–Tibet Plateau from 1961 to 2015. These discrepancies in our findings may be attributable to the rising concentration of anthropogenic absorbing aerosols and the prevailing westerlies (west winds in the middle latitudes 30–60°), including the Asian region [73,74].
We can better understand how climate change and other factors that impact snow energy balance, such as light-absorbing particle deposition, affect snow cover in Central Tajikistan by examining snow cover duration trends. Although patterns differ on a sub-basin scale across the Syr Darya River and the Amu Darya River, changes in precipitation and temperature usually result in less snow accumulation along with earlier snow melt, which combine to result in shorter annual snow cover duration [37]. Our outcomes of the monthly trend analysis of snow cover indicated an increasing trend in April and July and a stable trend pattern in March, May, August, and October in the Varzob River Basin in Tajikistan, which is in line with the results of Singh et al. [75], Zafar et al. [76], and Atif et al. [51]. For example, Singh et al. showed that the snow cover in the western Himalayas is either stable or slightly increasing [77]. Atif et al. reported a slightly upward trend with a Sen’s slope of 0.394% year−1 in snow cover frequency within the 2000–5000 m elevation band in the Central Karakoram region [51]. Another study also indicated a significant rise in snow cover from 2001 to 2016 in the Karakoram region [75]. This increasing trend may be due to the stronger influence of westerly winds, as well as a downward trend in temperatures in the Karakorum and parts of the western Himalaya area [76]. However, Aizen et al. [64] detected a decline of 9 days in snow cover duration in Central Asia when observing measurement-based data from 1940 to 1991. This contradiction to our study is maybe is due to the time and scale of the study area.
The study of climatic characteristics at meteorological observation points exhibited that the region of the Varzob River Basin, which is located in the northern part of the Amu Darya River Basin, isolated and to a greater extent located in mountainous areas [8]. The formation of snow reserves for water runoff is located at an elevation of more than 3000 m.s.a.l. The temperature background is very unstable and fluctuates from −25 °C frost to +25 °C [78]. In mountainous terrain, precipitation forms mudflows on the river during the period of late autumn and forms floods during spring. In winter, the accumulation and growth of snow cover on the slopes of the mountains leads to massive avalanches, which form outbursts and dangerous spontaneous small lakes.

6. Conclusions

The long-term climate data in the upstream, midstream, downstream areas of the Varzob River Basin in Tajikistan have been assessed using original Mann–Kendall test, modified Mann–Kendall test, Sen’s slope test, and Pettitt test. The main findings are as follows:
(1)
The trend in mean annual temperature showed a significant increasing trend in all areas in VRB during the period 1991–2018. Almost all months indicated an increasing trend except November and December during the period 1991–2018.
(2)
The results of the annual precipitation showed a decreasing trend in upstream, midstream, and downstream areas, whereas in alpine areas (Anzob station), an increasing trend of annual precipitation was observed from 1960 to 1990. The monthly precipitation showed a significant decreasing trend in April, while January and February showed a significant increasing trend.
(3)
The trend in the MODIS data showed an increasing trend in snow cover area in April and July, while a decreasing trend was observed in February, September, November, and December during the period 2001–2022 in the VRB. The results revealed that at highly elevated areas, the snow cover area showed a spatially decreasing trend in the winter season. Hushyori station belongs to a low elevated region and showed the decreasing trend during most months. The station measurement-based data indicated the maximum monthly snow cover height in April (178 cm) at the Anzob station and in March at the Maykhura (138 cm) and Hushyori (54 cm) stations.
A limitation of this study is that we only used the three climate stations that were available in three parts of the basin, and the snow cover based on the measurement was used for 2014. The MODIS data used have a spatial resolution of 500 m, and Landsat and Sentinel snow cover data can be taken into account in future studies. This study will serve as a basis for decision making for impact analysis and more in-depth climate research at the district level. To maintain the livelihoods of Central Asian populations, it is crucial to comprehend how temperature, precipitation, and snow cover have been altered through time and space. Further research could focus on reducing uncertainties and combining climate measurements with global climate model (GCM) data linked to a hydrological model to predict the impact of climate variability on water resources in the VRB.

Author Contributions

All authors were involved in the intellectual elements of this paper. Conceptualization, N.G. and Y.C.; formal analysis and writing—original draft preparation, N.G.; writing—review and editing, A.G.; methodology, Z.S., M.N., R.D. and S.A.; data curation and investigation, M.G. All authors have read and agreed to the published version of the manuscript.

Funding

This study is supported by the National Natural Science Foundation of China (Grant No. U1903208) and the Research Fund for International Scientists of National Natural Science Foundation of China (Grant No. 42150410393).

Informed Consent Statement

Not applicable.

Data Availability Statement

Not applicable.

Acknowledgments

Nekruz Gulahmadov would like to express his sincere gratitude to the Chinese Academy of Science (CAS) and the World Academy of Science for the Developing World (TWAS) Presidents Fellowship program for international Ph.D. students (Awardee of 2019 CAS-TWAS Presidents fellowship) for the financial support for this study. The authors are thankful to the Ministry of Energy and Water Resources of the Republic of Tajikistan and the Agency of Hydrometeorology of the Committee for Environmental Protection under the Government of the Republic of Tajikistan for providing the data for this research.

Conflicts of Interest

The authors declare no conflict of interest.

References

  1. Kräuchi, N.; Brang, P.; Schönenberger, W. Forests of mountainous regions: Gaps in knowledge and research needs. For. Ecol. Manag. 2000, 132, 73–82. [Google Scholar] [CrossRef]
  2. Beniston, M. Climatic change in mountain regions: A review of possible impacts. Clim. Var. Chang. High Elev. Reg. Past Present Future 2003, 59, 5–31. [Google Scholar]
  3. Burns, D.A.; Klaus, J.; McHale, M.R. Recent climate trends and implications for water resources in the Catskill Mountain region, New York, USA. J. Hydrol. 2007, 336, 155–170. [Google Scholar] [CrossRef]
  4. Griffiths, R.; Madritch, M.; Swanson, A. The effects of topography on forest soil characteristics in the Oregon Cascade Mountains (USA): Implications for the effects of climate change on soil properties. For. Ecol. Manag. 2009, 257, 1–7. [Google Scholar] [CrossRef]
  5. Gulakhmadov, A.; Davlyatov, R.; Kobuliev, Z.; Chen, X. Elevation Dependency of Climatic Variables Trends in the Last Decades in the Snow-Fed and Glacier-Fed Vakhsh River Basin, Central Asia. Water Resour. 2021, 48, 914–924. [Google Scholar] [CrossRef]
  6. Buytaert, W.; Célleri, R.; De Bièvre, B.; Cisneros, F.; Wyseure, G.; Deckers, J.; Hofstede, R. Human impact on the hydrology of the Andean páramos. Earth-Sci. Rev. 2006, 79, 53–72. [Google Scholar] [CrossRef]
  7. Baratov, R. Tajikistan-country of mountains. In Gori i Nedra Tajikistana (Mountains and Bowels of Tajikistan); International Atomic Energy Agency: Vienna, Austria, 1989. [Google Scholar]
  8. Scientific Notes. Очерки Пo Геoграфии Таджикистана [Текст]/Ученые Записки, т. XXI; Серия геoграфическая: Stalinabad, Tajikistan, 1959; pp. 8–58. (In Russian) [Google Scholar]
  9. Giorgi, F. Climate change hot-spots. Geophys. Res. Lett. 2006, 33, 101029. [Google Scholar] [CrossRef]
  10. de Beurs, K.M.; Henebry, G.M.; Owsley, B.C.; Sokolik, I.N. Large scale climate oscillation impacts on temperature, precipitation and land surface phenology in Central Asia. Environ. Res. Lett. 2018, 13, 065018. [Google Scholar] [CrossRef]
  11. Chen, F.; Huang, W.; Jin, L.; Chen, J.; Wang, J. Spatiotemporal precipitation variations in the arid Central Asia in the context of global warming. Sci. China Earth Sci. 2011, 54, 1812–1821. [Google Scholar] [CrossRef]
  12. Hu, Z.; Zhou, Q.; Chen, X.; Qian, C.; Wang, S.; Li, J. Variations and changes of annual precipitation in Central Asia over the last century. Int. J. Climatol. 2017, 37, 157–170. [Google Scholar] [CrossRef]
  13. Hu, Z.; Zhang, C.; Hu, Q.; Tian, H. Temperature changes in Central Asia from 1979 to 2011 based on multiple datasets. J. Clim. 2014, 27, 1143–1167. [Google Scholar] [CrossRef]
  14. Zhang, M.; Chen, Y.; Shen, Y.; Li, B. Tracking climate change in Central Asia through temperature and precipitation extremes. J. Geogr. Sci. 2019, 29, 3–28. [Google Scholar] [CrossRef]
  15. Siegfried, T.; Bernauer, T.; Guiennet, R.; Sellars, S.; Robertson, A.W.; Mankin, J.; Bauer-Gottwein, P.; Yakovlev, A. Will climate change exacerbate water stress in Central Asia? Clim. Chang. 2012, 112, 881–899. [Google Scholar] [CrossRef]
  16. Rakhmatullaev, S.; Huneau, F.; Le Coustumer, P.; Motelica-Heino, M.; Bakiev, M. Facts and perspectives of water reservoirs in Central Asia: A special focus on Uzbekistan. Water 2010, 2, 307–320. [Google Scholar] [CrossRef]
  17. Davi, N.K.; D’Arrigo, R.; Jacoby, G.; Cook, E.R.; Anchukaitis, K.; Nachin, B.; Rao, M.P.; Leland, C. A long-term context (931–2005 CE) for rapid warming over Central Asia. Quat. Sci. Rev. 2015, 121, 89–97. [Google Scholar] [CrossRef]
  18. Feng, R.; Yu, R.; Zheng, H.; Gan, M. Spatial and temporal variations in extreme temperature in Central Asia. Int. J. Climatol. 2018, 38, e388–e400. [Google Scholar] [CrossRef]
  19. Mannig, B.; Müller, M.; Starke, E.; Merkenschlager, C.; Mao, W.; Zhi, X.; Podzun, R.; Jacob, D.; Paeth, H. Dynamical downscaling of climate change in Central Asia. Glob. Planet. Chang. 2013, 110, 26–39. [Google Scholar] [CrossRef]
  20. Pan, S.; Tian, H.; Dangal, S.R.; Zhang, C.; Yang, J.; Tao, B.; Ouyang, Z.; Wang, X.; Lu, C.; Ren, W. Complex spatiotemporal responses of global terrestrial primary production to climate change and increasing atmospheric CO2 in the 21st century. PLoS ONE 2014, 9, e112810. [Google Scholar] [CrossRef]
  21. Zhang, C.; Ren, W. Complex climatic and CO2 controls on net primary productivity of temperate dryland ecosystems over central Asia during 1980–2014. J. Geophys. Res. Biogeosci. 2017, 122, 2356–2374. [Google Scholar] [CrossRef]
  22. Klein Tank, A.M.; Peterson, T.; Quadir, D.; Dorji, S.; Zou, X.; Tang, H.; Santhosh, K.; Joshi, U.; Jaswal, A.; Kolli, R. Changes in daily temperature and precipitation extremes in central and south Asia. J. Geophys. Res. Atmos. 2006, 111. [Google Scholar] [CrossRef]
  23. Martinez, C.J.; Maleski, J.J.; Miller, M.F. Trends in precipitation and temperature in Florida, USA. J. Hydrol. 2012, 452, 259–281. [Google Scholar] [CrossRef]
  24. Duhan, D.; Pandey, A. Statistical analysis of long term spatial and temporal trends of precipitation during 1901–2002 at Madhya Pradesh, India. Atmos. Res. 2013, 122, 136–149. [Google Scholar] [CrossRef]
  25. Kampata, J.M.; Parida, B.P.; Moalafhi, D. Trend analysis of rainfall in the headstreams of the Zambezi River Basin in Zambia. Phys. Chem. Earth Parts A/B/C 2008, 33, 621–625. [Google Scholar] [CrossRef]
  26. Liu, Q.; Yang, Z.; Cui, B. Spatial and temporal variability of annual precipitation during 1961–2006 in Yellow River Basin, China. J. Hydrol. 2008, 361, 330–338. [Google Scholar] [CrossRef]
  27. Tomozeiu, R.; Busuioc, A.; Marletto, V.; Zinoni, F.; Cacciamani, C. Detection of changes in the summer precipitation time series of the region Emilia-Romagna, Italy. Theor. Appl. Climatol. 2000, 67, 193–200. [Google Scholar] [CrossRef]
  28. FOEN. Climate Change in Central Asia: A Visual Synthesis; Zoï Environment Network: Vernier, Switzerland, 2009.
  29. Chen, F.; Huang, W.; Jin, L. Characteristics and spatial differences of precipitation in arid region of Central Asia under the background of global warming. Chin. Sci. Earth Sci. 2012, 41, 1647–1657. [Google Scholar]
  30. Yao, J.; Chen, Y. Trend analysis of temperature and precipitation in the Syr Darya Basin in Central Asia. Theor. Appl. Climatol. 2015, 120, 521–531. [Google Scholar] [CrossRef]
  31. Maillard, É.; McConkey, B.G.; Luce, M.S.; Angers, D.A.; Fan, J. Crop rotation, tillage system, and precipitation regime effects on soil carbon stocks over 1 to 30 years in Saskatchewan, Canada. Soil Tillage Res. 2018, 177, 97–104. [Google Scholar] [CrossRef]
  32. Zhang, T. Influence of the seasonal snow cover on the ground thermal regime: An overview. Rev. Geophys. 2005, 43. [Google Scholar] [CrossRef]
  33. Ososkova, T.; Gorelkin, N.; Chub, V. Water resources of Central Asia and adaptation measures for climate change. Environ. Monit. Assess. 2000, 61, 161–166. [Google Scholar] [CrossRef]
  34. Klein, I.; Gessner, U.; Kuenzer, C. Regional land cover mapping and change detection in Central Asia using MODIS time-series. Appl. Geogr. 2012, 35, 219–234. [Google Scholar] [CrossRef]
  35. Aizen, V.B.; Aizen, E.M.; Melack, J.M. Climate, snow cover, glaciers, and runoff in the Tien Shan, Central Asia 1. JAWRA J. Am. Water Resour. Assoc. 1995, 31, 1113–1129. [Google Scholar] [CrossRef]
  36. Lioubimtseva, E.; Henebry, G.M. Climate and environmental change in arid Central Asia: Impacts, vulnerability, and adaptations. J. Arid Environ. 2009, 73, 963–977. [Google Scholar] [CrossRef]
  37. Dietz, A.J.; Conrad, C.; Kuenzer, C.; Gesell, G.; Dech, S. Identifying changing snow cover characteristics in Central Asia between 1986 and 2014 from remote sensing data. Remote Sens. 2014, 6, 12752–12775. [Google Scholar] [CrossRef]
  38. Dietz, A.J.; Kuenzer, C.; Conrad, C. Snow-cover variability in central Asia between 2000 and 2011 derived from improved MODIS daily snow-cover products. Int. J. Remote Sens. 2013, 34, 3879–3902. [Google Scholar] [CrossRef]
  39. Fourth National Communication of the Republic of Tajikistan under the UN Framework Convention on Climate Change. Dushanbe, 232p. Available online: https://unfccc.int/sites/default/files/resource/4NC_TJK_eng_0.pdf (accessed on 26 April 2023).
  40. Shen, Y.J.; Shen, Y.; Goetz, J.; Brenning, A. Spatial-temporal variation of near-surface temperature lapse rates over the Tianshan Mountains, central Asia. J. Geophys. Res. Atmos. 2016, 121, 14006–14017. [Google Scholar] [CrossRef]
  41. Katalog lednikov SSSR. Каталoг Ледникoв СССР. Т. 14. Средняя Азия. Выпуск 3. Амударья. Ч.5. Бассейн р. Кoфирнигана //В.И. Квачев, А.Г. Санникoв, Л.Н. Сoкoлoв; Gidrometeoizdat: Leningrad, Russia, 1968; p. 44. (In Russian) [Google Scholar]
  42. Statistic, RT. Паспoрт Варзoбскoгo Райoна, 2008, Гoсударственный Кoмитет Статистики РТ-Региoны РТ; Statistic RT: Dushanbe, Tajikistan, 2008; p. 82. (In Russian) [Google Scholar]
  43. Atlas. Атлас Таджикскoй ССР [Текст] ГУГК; Atlas: Dushanbe, Tajikistan, 1968; p. 199. (In Russian) [Google Scholar]
  44. Nazirova, D. Прирoдные Услoвия Развития Геoрискoв в Пределах Теритoрии Бассейна Реки Варзoб; Science and Innovation: Dushanbe, Tajikistan, 2016; pp. 89–92. (In Russian) [Google Scholar]
  45. Konovalov, V.G. Таяние и Стoк с Ледникoв в Бассейнах Средней Азии. САРНИГМИ; Gidrometeoizdat: Leningrad, Russia, 1985; pp. 217–2018. (In Russian) [Google Scholar]
  46. Gulakhmadov, A.; Chen, X.; Gulahmadov, N.; Liu, T.; Davlyatov, R.; Sharofiddinov, S.; Gulakhmadov, M. Long-Term Hydro–Climatic Trends in the Mountainous Kofarnihon River Basin in Central Asia. Water 2020, 12, 2140. [Google Scholar] [CrossRef]
  47. Gulahmadov, N.; Chen, Y.; Gulakhmadov, A.; Rakhimova, M.; Gulakhmadov, M. Quantifying the relative contribution of climate change and anthropogenic activities on runoff variations in the central part of Tajikistan in Central Asia. Land 2021, 10, 525. [Google Scholar] [CrossRef]
  48. Mavromatis, T.; Stathis, D. Response of the water balance in Greece to temperature and precipitation trends. Theor. Appl. Climatol. 2011, 104, 13–24. [Google Scholar] [CrossRef]
  49. Yue, S.; Wang, C.Y. Applicability of prewhitening to eliminate the influence of serial correlation on the Mann-Kendall test. Water Resour. Res. 2002, 38, 4-1–4-7. [Google Scholar] [CrossRef]
  50. Sen, P.K. Estimates of the regression coefficient based on Kendall’s tau. J. Am. Stat. Assoc. 1968, 63, 1379–1389. [Google Scholar] [CrossRef]
  51. Atif, I.; Iqbal, J.; Mahboob, M.A. Investigating snow cover and hydrometeorological trends in contrasting hydrological regimes of the Upper Indus Basin. Atmosphere 2018, 9, 162. [Google Scholar] [CrossRef]
  52. Pettitt, A. A non-parametric approach to the change-point problem. J. R. Stat. Soc. Ser. C Appl. Stat. 1979, 28, 126–135. [Google Scholar] [CrossRef]
  53. Riggs, G.A.; Hall, D.; Salomonson, V. MODIS snow products user guide. NASA Goddard Space Flight Cent. Rep. 2006, 80, 1–45. [Google Scholar]
  54. Hall, D.K.; Riggs, G.A. Accuracy assessment of the MODIS snow products. Hydrol. Process. Int. J. 2007, 21, 1534–1547. [Google Scholar] [CrossRef]
  55. Gao, Y.; Xie, H.; Yao, T.; Xue, C. Integrated assessment on multi-temporal and multi-sensor combinations for reducing cloud obscuration of MODIS snow cover products of the Pacific Northwest USA. Remote Sens. Environ. 2010, 114, 1662–1675. [Google Scholar] [CrossRef]
  56. Zhu, X. GIS for Environmental Applications: A Practical Approach; Routledge: Oxfordshire, UK, 2016. [Google Scholar]
  57. Li, X.; Jing, Y.; Shen, H.; Zhang, L. The recent developments in spatio-temporally continuous snow cover product generation. Hydrol. Earth Syst. Sci. Discuss. 2019, 1–28. [Google Scholar] [CrossRef]
  58. Negi, H.S.; Kulkarni, A.; Semwal, B. Estimation of snow cover distribution in Beas basin, Indian Himalaya using satellite data and ground measurements. J. Earth Syst. Sci. 2009, 118, 525–538. [Google Scholar] [CrossRef]
  59. Huang, X.; Liang, T.; Zhang, X.; Guo, Z. Validation of MODIS snow cover products using Landsat and ground measurements during the 2001–2005 snow seasons over northern Xinjiang, China. Int. J. Remote Sens. 2011, 32, 133–152. [Google Scholar] [CrossRef]
  60. Zhou, H.; Aizen, E.; Aizen, V. Deriving long term snow cover extent dataset from AVHRR and MODIS data: Central Asia case study. Remote Sens. Environ. 2013, 136, 146–162. [Google Scholar] [CrossRef]
  61. Ackroyd, C.; Skiles, S.M.; Rittger, K.; Meyer, J. Trends in snow cover duration across river basins in high mountain Asia from daily gap-filled MODIS fractional snow covered area. Front. Earth Sci. 2021, 9, 713145. [Google Scholar] [CrossRef]
  62. Pepin, N.; Bradley, R.; Diaz, H.; Baraer, M.; Caceres, E.; Forsythe, N.; Fowler, H.; Greenwood, G.; Hashmi, M.; Liu, X.; et al. Elevation-dependent warming in mountain regions of the world. Nat. Clim. Chang. 2015, 5, 424–430. [Google Scholar]
  63. Hopkins, W.G. A spreadsheet for deriving a confidence interval, mechanistic inference and clinical inference from a p value. J Sport. 2007, 11, 16–21. [Google Scholar]
  64. Aizen, V.B.; Aizen, E.M.; Melack, J.M.; Dozier, J. Climatic and hydrologic changes in the Tien Shan, central Asia. J. Clim. 1997, 10, 1393–1404. [Google Scholar] [CrossRef]
  65. Beniston, M.; Rebetez, M. Regional behavior of minimum temperatures in Switzerland for the period 1979–1993. Theor. Appl. Climatol. 1996, 53, 231–243. [Google Scholar] [CrossRef]
  66. Giese, E.; Moßig, I. Klimawandel in Zentralasien. Zentrum für internationale Entwicklungs-und Umweltforschung (ZEU) der Justus-Liebig-Universität Gießen. Discuss. Pap. 2004, 17. [Google Scholar]
  67. Bolch, T. Climate change and glacier retreat in northern Tien Shan (Kazakhstan/Kyrgyzstan) using remote sensing data. Glob. Planet. Chang. 2007, 56, 1–12. [Google Scholar] [CrossRef]
  68. Song, S.; Bai, J. Increasing winter precipitation over arid central Asia under global warming. Atmosphere 2016, 7, 139. [Google Scholar] [CrossRef]
  69. Pendergrass, A.G.; Knutti, R.; Lehner, F.; Deser, C.; Sanderson, B.M. Precipitation variability increases in a warmer climate. Sci. Rep. 2017, 7, 17966. [Google Scholar] [CrossRef]
  70. Liu, Q.; Cui, B. Impacts of climate change/variability on the streamflow in the Yellow River Basin, China. Ecol. Model. 2011, 222, 268–274. [Google Scholar] [CrossRef]
  71. Li, Z.; Chen, Y.; Fang, G.; Li, Y. Multivariate assessment and attribution of droughts in Central Asia. Sci. Rep. 2017, 7, 1316. [Google Scholar] [CrossRef] [PubMed]
  72. Ahmed, N.; Wang, G.; Booij, M.J.; Oluwafemi, A.; Hashmi, M.Z.-u.-R.; Ali, S.; Munir, S.J.W. Climatic variability and periodicity for upstream sub-basins of the Yangtze River, China. Water 2020, 12, 842. [Google Scholar] [CrossRef]
  73. Folini, D.; Wild, M. The effect of aerosols and sea surface temperature on China’s climate in the late twentieth century from ensembles of global climate simulations. J. Geophys. Res. Atmos. 2015, 120, 2261–2279. [Google Scholar] [CrossRef]
  74. Wang, C. Impact of anthropogenic absorbing aerosols on clouds and precipitation: A review of recent progresses. Atmos. Res. 2013, 122, 237–249. [Google Scholar] [CrossRef]
  75. Singh, D.K.; Gusain, H.S.; Mishra, V.; Gupta, N. Snow cover variability in North-West Himalaya during last decade. Arab. J. Geosci. 2018, 11, 1–12. [Google Scholar] [CrossRef]
  76. Zafar, M.U.; Ahmed, M.; Rao, M.P.; Buckley, B.M.; Khan, N.; Wahab, M.; Palmer, J. Karakorum temperature out of phase with hemispheric trends for the past five centuries. Clim. Dyn. 2016, 46, 1943–1952. [Google Scholar] [CrossRef]
  77. Singh, S.; Rathore, B.; Bahuguna, I. Snow cover variability in the Himalayan–Tibetan region. Int. J. Climatol. 2014, 34, 446–452. [Google Scholar] [CrossRef]
  78. Shul’ts, V.L. Reki Sredney Azii. CH. I (Rivers of Central Asia. Part I); Gidrometeoizdat: Leningrad, Russia, 1963; p. 300. [Google Scholar]
Figure 1. The study area (Varzob River Basin in Tajikistan) and the location of the meteorological stations.
Applsci 13 05583 g001
Figure 2. The mean monthly air temperature in the upstream, midstream, and downstream regions in the Varzob River Basin during the two time period of 1960–1990 and 1991–2018.
Applsci 13 05583 g002
Figure 3. The mean annual temperature in the upstream, midstream, and downstream regions of the Varzob River Basin in Tajikistan during the two historical periods of 1960–1990 and 1991–2018.
Applsci 13 05583 g003
Figure 4. The mean annual temperature change points during the (a,d,g) 1960–1990, (b,e,h) 1991–2018, and (c,f,i) 1960–2018 periods based on the Pettitt’s test at Anzob, Maykhura, and Hushyori meteorological stations in the upstream, midstream, and downstream regions of the Varzob River Basin in Tajikistan.
Applsci 13 05583 g004
Figure 5. The monthly precipitation in the upstream, midstream, and downstream regions in the Varzob River Basin during the two time periods of 1960–1990 and 1991–2018.
Applsci 13 05583 g005
Figure 6. The annual precipitation in the upstream, midstream, and downstream regions of the Varzob River Basin in Tajikistan during the two historical periods of 1960–1990 and 1991–2018.
Applsci 13 05583 g006
Figure 7. The annual precipitation change points during the periods of (a,d,g) 1960–1990, (b,e,h) 1991–2018, and (c,f,i) 1960–2018 based on the Pettitt’s test at Anzob, Maykhura, and Hushyori meteorological stations in the upstream, midstream, and downstream areas of the Varzob River Basin in Tajikistan.
Applsci 13 05583 g007
Figure 8. The monthly changes of the snow cover, temperature, and precipitation in the upstream, midstream, and downstream regions in 2014 in the Varzob River Basin in Tajikistan.
Applsci 13 05583 g008
Figure 9. Mann–Kendall trend analysis p-value information based on the spatial-temporal analysis in the Varzob River Basin in Tajikistan from 2001 to 2022. Note: (a) January; (b) February; (c) March; (d) April; (e) May; (f) June; (g) July; (h) August; (i) September; (j); October; (k) November; and (l) December.
Applsci 13 05583 g009
Figure 10. The Y axis represents the months of the year and the X axis represents the years. The colors in the heatmap indicate the amount of snow cover, ranging from low (dark colors) to high (light colors), with a range of 0–2000 km2.
Applsci 13 05583 g010
Table 1. Coordinate the used meteorological stations and detail the MODIS dataset applied in the Varzob River Basin in Tajikistan.
NameDatasetsIndexLon.Lat.Alt. (m)Period
1AnzobTemperature, precipitation38,71939°50′68°52′33731961–2018
2MaykhuraTemperature, precipitation38,71739°01′68°47′19221964–2017
3HushyoriTemperature, precipitation38,83338°53′68°50′13611960–2018
ParameterDatasetsTemporal resolutionSpatial resolution
4MODIS-NDSISnow cover, MOD10A1 Terra/MYD10A1 AquaDaily500 m2001–2022
Table 2. The seasonal air temperature trends are based on the original Mann–Kendall test in upstream, midstream, and downstream meteorological stations in the Varzob River Basin in Tajikistan during three different periods (1960–1990, 1991–2018, and 1960–2018).
MonthAnzob Average Temperature (°C)Maykhura Average Temperature (°C)Hushyori Average Temperature (°C)
1961–19901991–20181961–20181964–19901991–20171964–20171960–19901991–20181960–2018
January0.429−1.7 *−1.919 *1.795 *1.0432.851 ***0.2721.9 *1.616 *
February−0.071−1.662 *−1.107−0.0212.003 **2.851 ***−0.5950.9490.942
March−1.519 *1.108−0.389−0.2712.9 ***3.232 ***−1.1572.69 ***2.068 **
April0.8391.838 *1.4161.2952.189 **2.419 **1.3442.196 **2.912 ***
May0.7322.312 **1.611 *1.4192.755 ***2.493 **0.4782.492 **2.037 **
June0.3572.688 **1.5301.816 *0.366−0.5622.95 ***0.281
July1.0191.4030.8321.1282.169 **0.105−0.462.573 ***−0.111
August1.179−0.1981.2021.4020.8560.388−0.8351.2480.347
September2.769 ***0.6133.519 ***3.298 ***1.711 *2.994 ***0.291.1282.269 *
October0.78602.074 **0.6892.045 **2.143−0.5960.850.89
November1.554 *−1.897 *−0.3290.751−0.2920.6421.618 *−0.5340.838
December0.786−3.182 ***−2.128 **1.126−1.3990.1340.612−1.068−0.079
The significance levels tested are *** for p < 0.001, ** for p < 0.01, * for p < 0.05.
Table 3. Annual air temperature trends, Sen’s slope, change point (Pettit’s test), as well as the original and modified Mann–Kendall (MK) tests for the trends (Z) in the upstream, midstream, and downstream regions of the Varzob River Basin in Tajikistan during three time periods (1960–1990, 1991–2018, and 1960–2018).
Anzob Average Temperature (°C)
PeriodChange PointSen’s SlopeOriginal MK Test Z-ValueModified MK Test Z-Valuep-ValueSignificance Based on the Modified MK Test
1961–199019760.0191.3565.7750***
1991–20182007−0.00064001NS
1961–201820070.0020.4891.0670.285NS
Maykhura Average Temperature (°C)
PeriodChange pointSen’s slopeOriginal MK Test Z-ValueModified MK Test Z-Valuep-valueSignificance Based on the Modified MK Test
1964–199019760.0340.2426.6950***
1991–201720000.0653.8359.3310***
1964–201719980.0284.1038.5420***
Hushyori Average Temperature (°C)
PeriodChange pointSen’s slopeOriginal MK Test Z-valueModified MK Test Z-valuep-valueSignificance Based on the Modified MK Test
1960–19901971−0.004−0.187−0.8390.401NS
1991–201819980.053.326.2240***
1960–201819980.0152.8255.0320***
The significance levels tested are *** for p < 0.001, NS for p ≥ 0.1.
Table 4. The seasonal precipitation trends applying the original Mann–Kendall test in upstream, midstream, and downstream meteorological stations in the Varzob River Basin in Tajikistan during three different periods (1960–1990, 1991–2018, and 1960–2018).
MonthAnzob Precipitation (mm)Maykhura Precipitation (mm)Hushyori Precipitation (mm)
1960–19901991–20181960–20181964–19901991–20181964–20181960–19901991–20181960–2018
January2.567 ***−0.3752.426 **−0.521−0.356−1.0750.799−0.5930.131
February0.034−0.3562.152 **−0.7720.3560.9−0.6460.4541.713 *
March−0.085−1.087−0.19−0.208−1.246−1.350.17−0.099−0.137
April−0.884−0.771−3.714 ***−1.981 **−0.514−3.035 ***−1.428−0.771−1.04
May−0.323−1.127−4.362 ***−0.208−0.04−1.416−1.292−0.257−0.497
June0.952−2.47 **−1.2360.709−1.681 *0.6530.102−1.1261.524 *
July0.425−2.312 **−0.935−0.521−2.018 *−0.8420.493−0.6330.916
August−0.102−1.146−0.7260.668−0.514−0.0360.935−0.8171.06
September−1.122−0.929−0.903−0.73−0.929−0.4430.732−0.1390.269
October0.6291.344−1.014−0.4590.376−1.1760.9350.711−0.301
November−0.306−0.356−0.02−0.0830.3561.198−1.751 *0.5730.517
December2.465 **−1.995 **−0.0981.251−1.186−0.2980.918−1.561 *−0.216
The significance levels tested are *** for p < 0.001, ** for p < 0.01, * for p < 0.05, NS for p ≥ 0.1.
Table 5. Annual precipitation trends, Sen’s slope, change point (Pettit’s test), as well as original and modified Mann–Kendall (MK) tests for the trends (Z) in the upstream, midstream, and downstream meteorological stations in the Varzob River Basin in Tajikistan during three time periods (1960–1990, 1991–2018, and 1960–2018).
Anzob Precipitation (mm)
PeriodChange pointSen’s slopeOriginal MK Test Z-ValueModified MK Test Z-Valuep-valueSignificance Based on the Modified MK Test
1960–1990(-)0.4810.1860.6320.527NS
1991–20181999−5.615−1.639−2.8440.004***
1960–20181994−1.343−1.752−3.5210***
Maykhura Precipitation (mm)
PeriodChange pointSen’s slopeOriginal MK Test Z-ValueModified MK Test Z-Valuep-valueSignificance Based on the Modified MK Test
1964–19901969−7.794−1.167−4.1740***
1991–20181994−6.33−1.027−3.3710***
1964–20181993−3.262−1.604−6.0640***
Hushyori Precipitation (mm)
PeriodChange pointSen’s slopeOriginal MK Test Z-ValueModified MK Test Z-Valuep-valueSignificance Based on the Modified MK Test
1960–19901969−1.01−0.204−0.5960.551NS
1991–20182004−4.325−0.968−3.7540***
1960–201819860.9250.4771.8790.06*
The significance levels tested are *** for p < 0.001, ** for p < 0.01, * for p < 0.05, NS for p ≥ 0.1.
Table 6. Mann–Kendall’s test results estimations for snow cover area for the three stations: Anzob, Maykhura, and Hushyori in the Varzob River Basin in Tajikistan based on the MODIS data during the period 2001–2022.
MonthAnzob Snow CoverMaykhura Snow CoverHushyori Snow Cover
p-Value 1Sen’s SlopeTrendp-Value 1Sen’s SlopeTrendp-Value 1Sen’s SlopeTrend
January0.600−0.003Decr.0.472−0.004Decr.0.277−0.007Decr.
February0.071−0.009Decr.0.593−0.003Decr.0.284−0.005Decr.
March0.872−0.001Decr.0.71−0.002Decr.0.3330.006Incr.
April0.1800.008Incr.0.5200.003Incr.0.363−0.005Decr.
May0.8210.002Incr.0.670.002Incr.0.701−0.001Decr.
June0.625−0.002Decr.0.647−0.002Decr.0.254−0.004Decr.
July0.6130.002Incr.0.0220.008Incr.0.863−0.001Decr.
August0.5890.002Incr.0.2770.003Incr.0.9050.000Incr.
September0.011−0.010Decr.0.781−0.001Decr.0.249−0.004Decr.
October0.9250.001Incr.0.6−0.003Decr.0.67−0.002Decr.
November0.722−0.002Decr.0.9190.001Incr.0.032−0.011Decr.
December0.811−0.001Decr.0.647−0.002Decr.0.288−0.006Decr.
1 No significant trend at the 5.0% level. Decr.: decreasing, Incr.: increasing.
Disclaimer/Publisher’s Note: The statements, opinions and data contained in all publications are solely those of the individual author(s) and contributor(s) and not of MDPI and/or the editor(s). MDPI and/or the editor(s) disclaim responsibility for any injury to people or property resulting from any ideas, methods, instructions or products referred to in the content.

