
Greenhouse Residues’ Potential for Biogas Production


Abstract
:1. Introduction
2. Materials and Methods
2.1. Substrate Collection and Pretreatment
2.2. Analysis
2.3. BMP Test
2.4. Statistics and Model Evaluation
3. Results
3.1. Physicochemical Characteristics
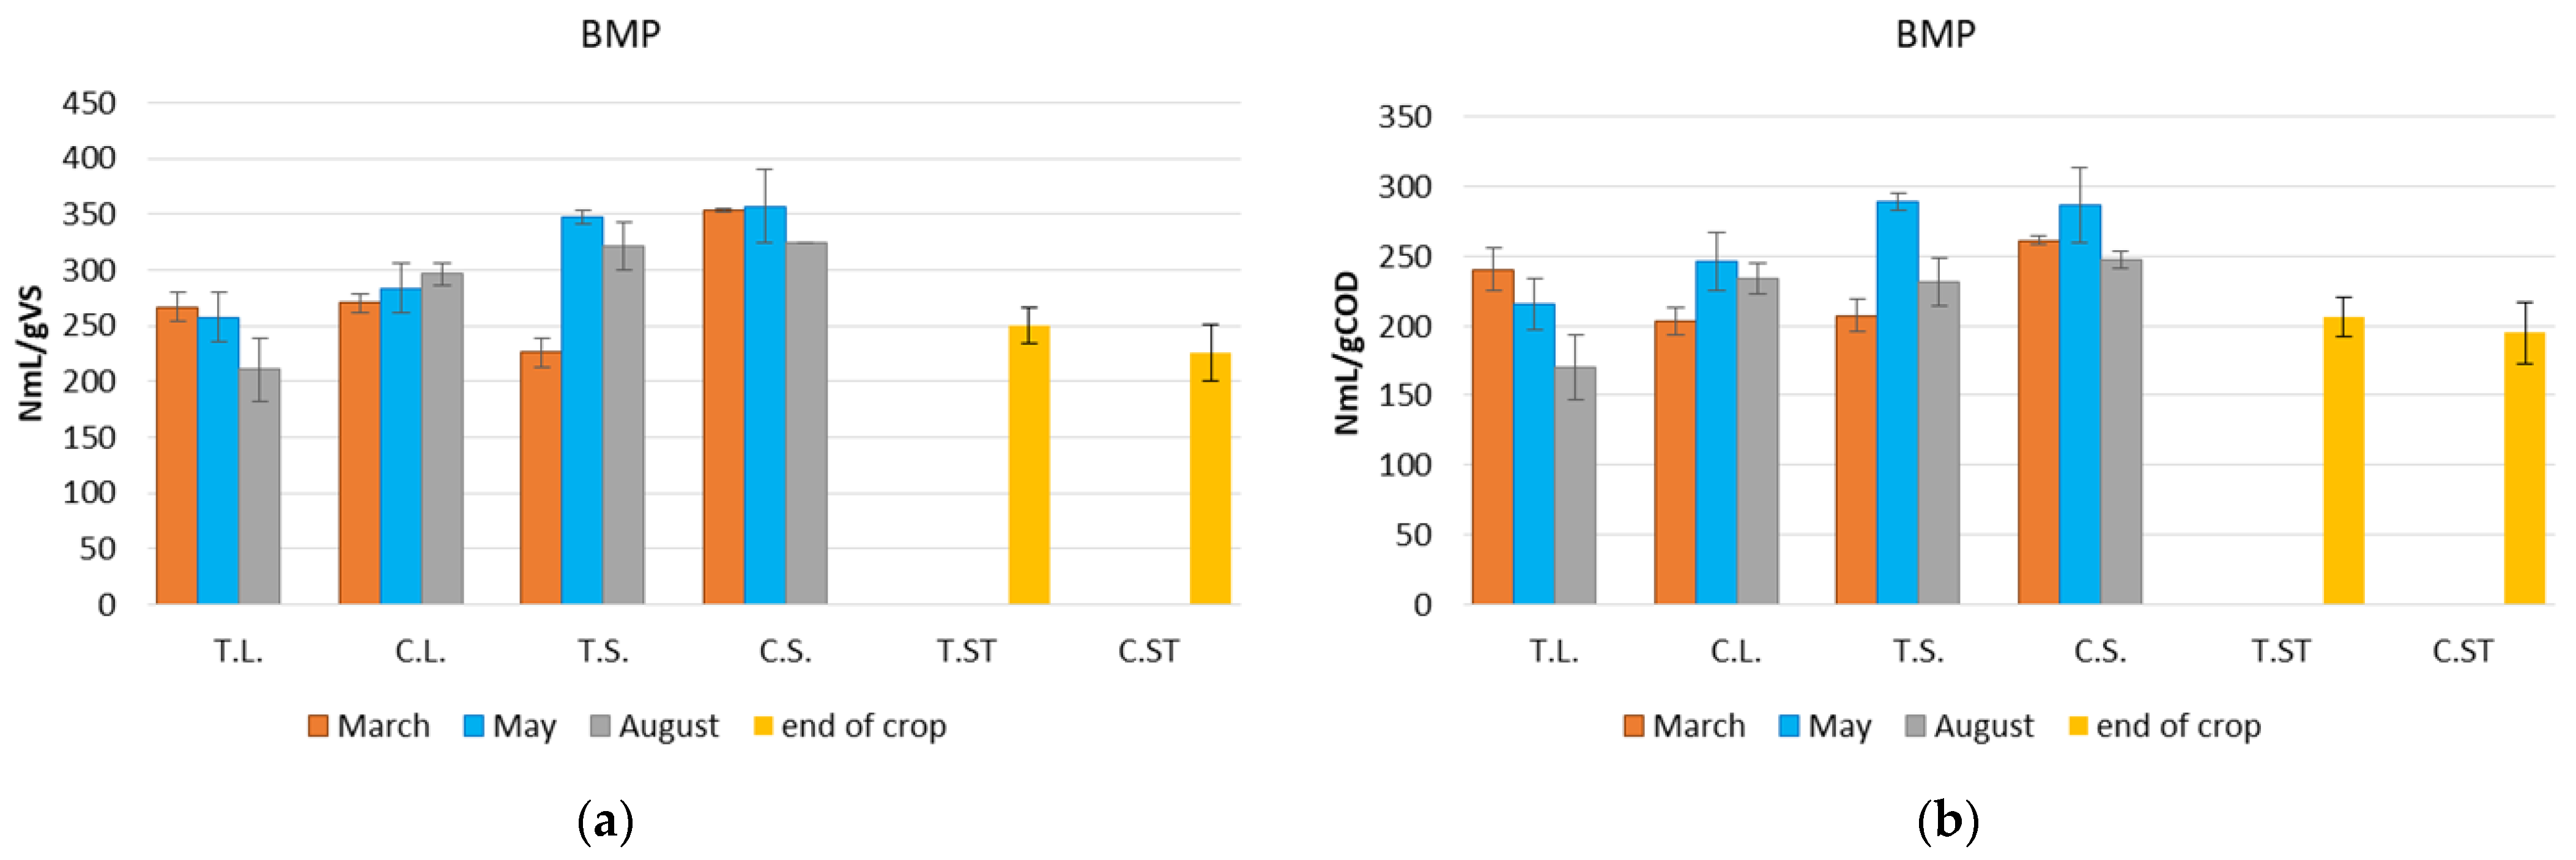
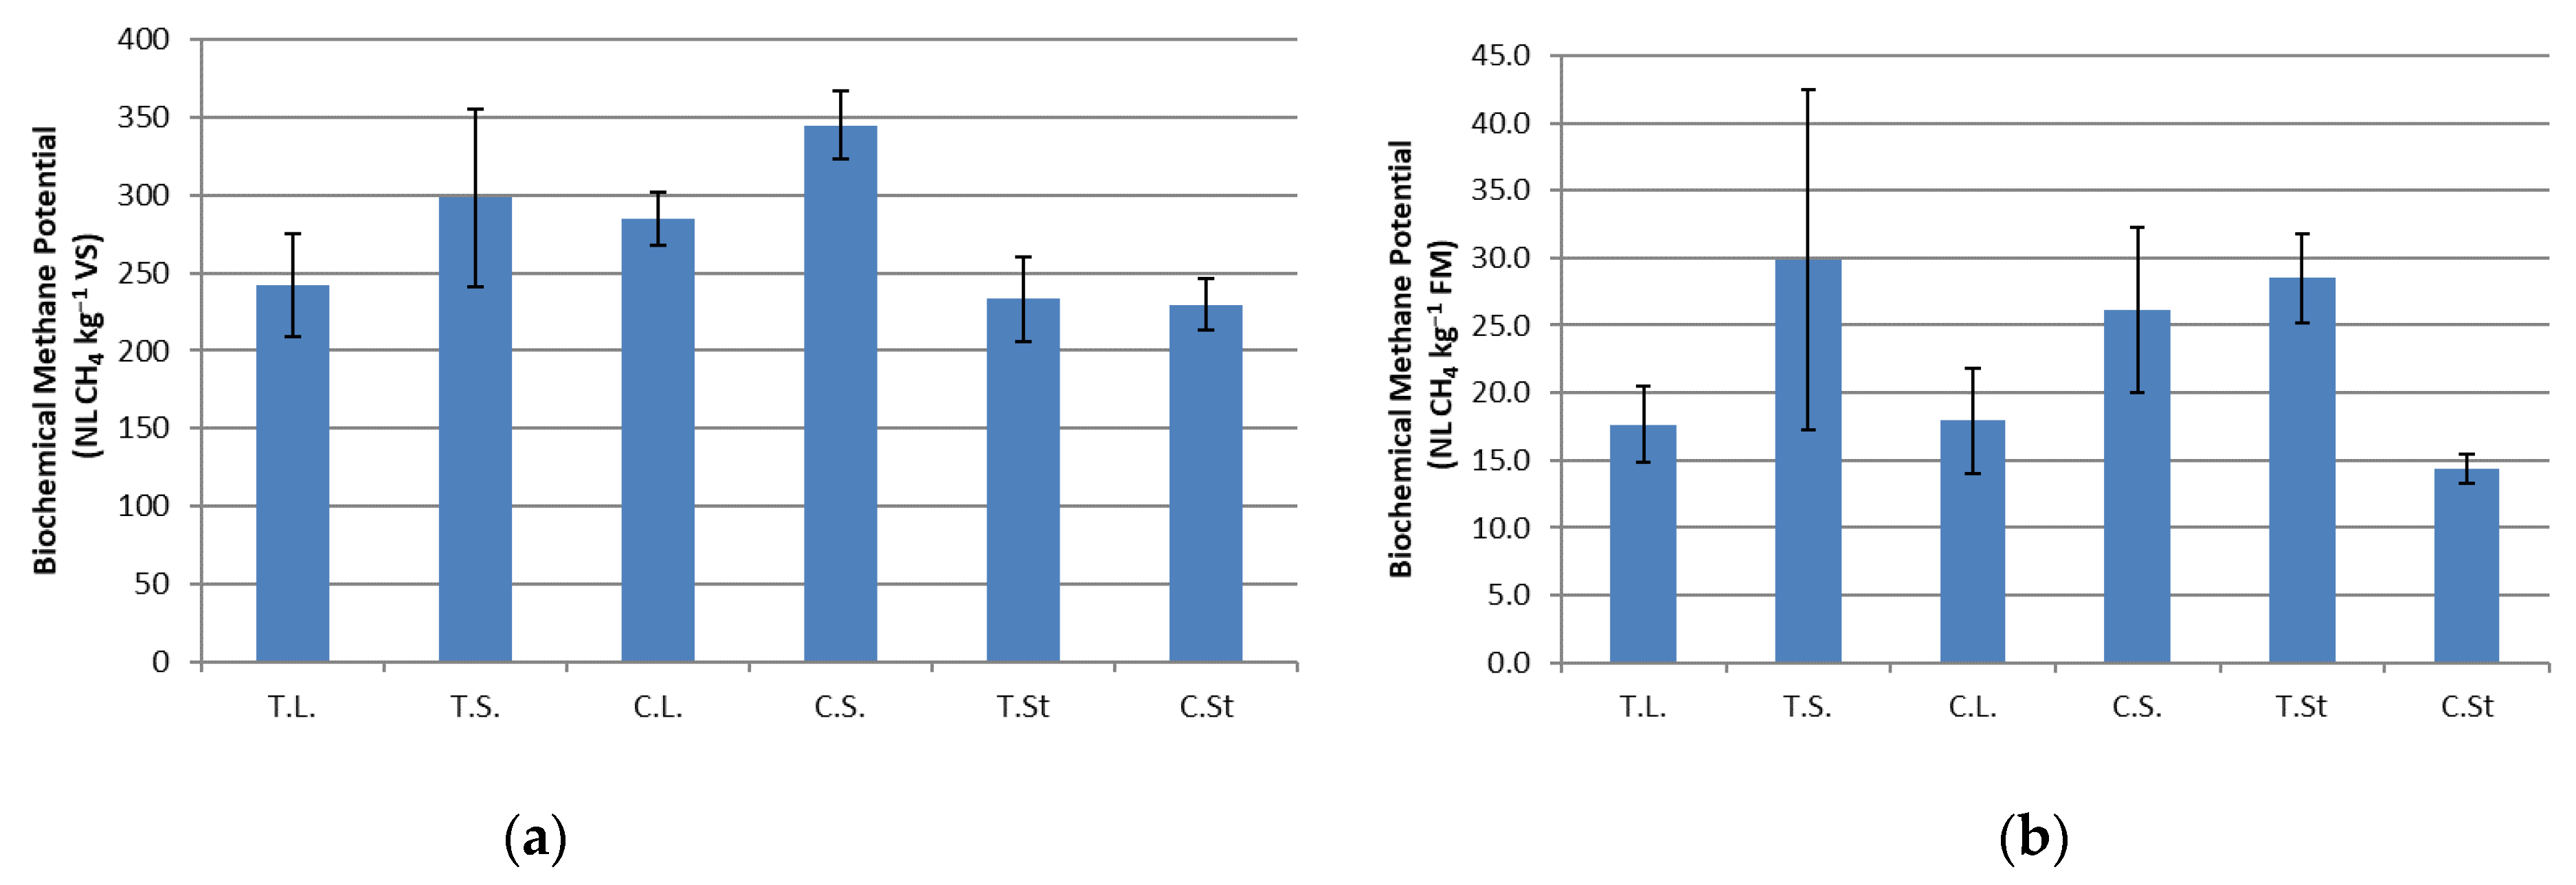
3.2. BMP Evaluation
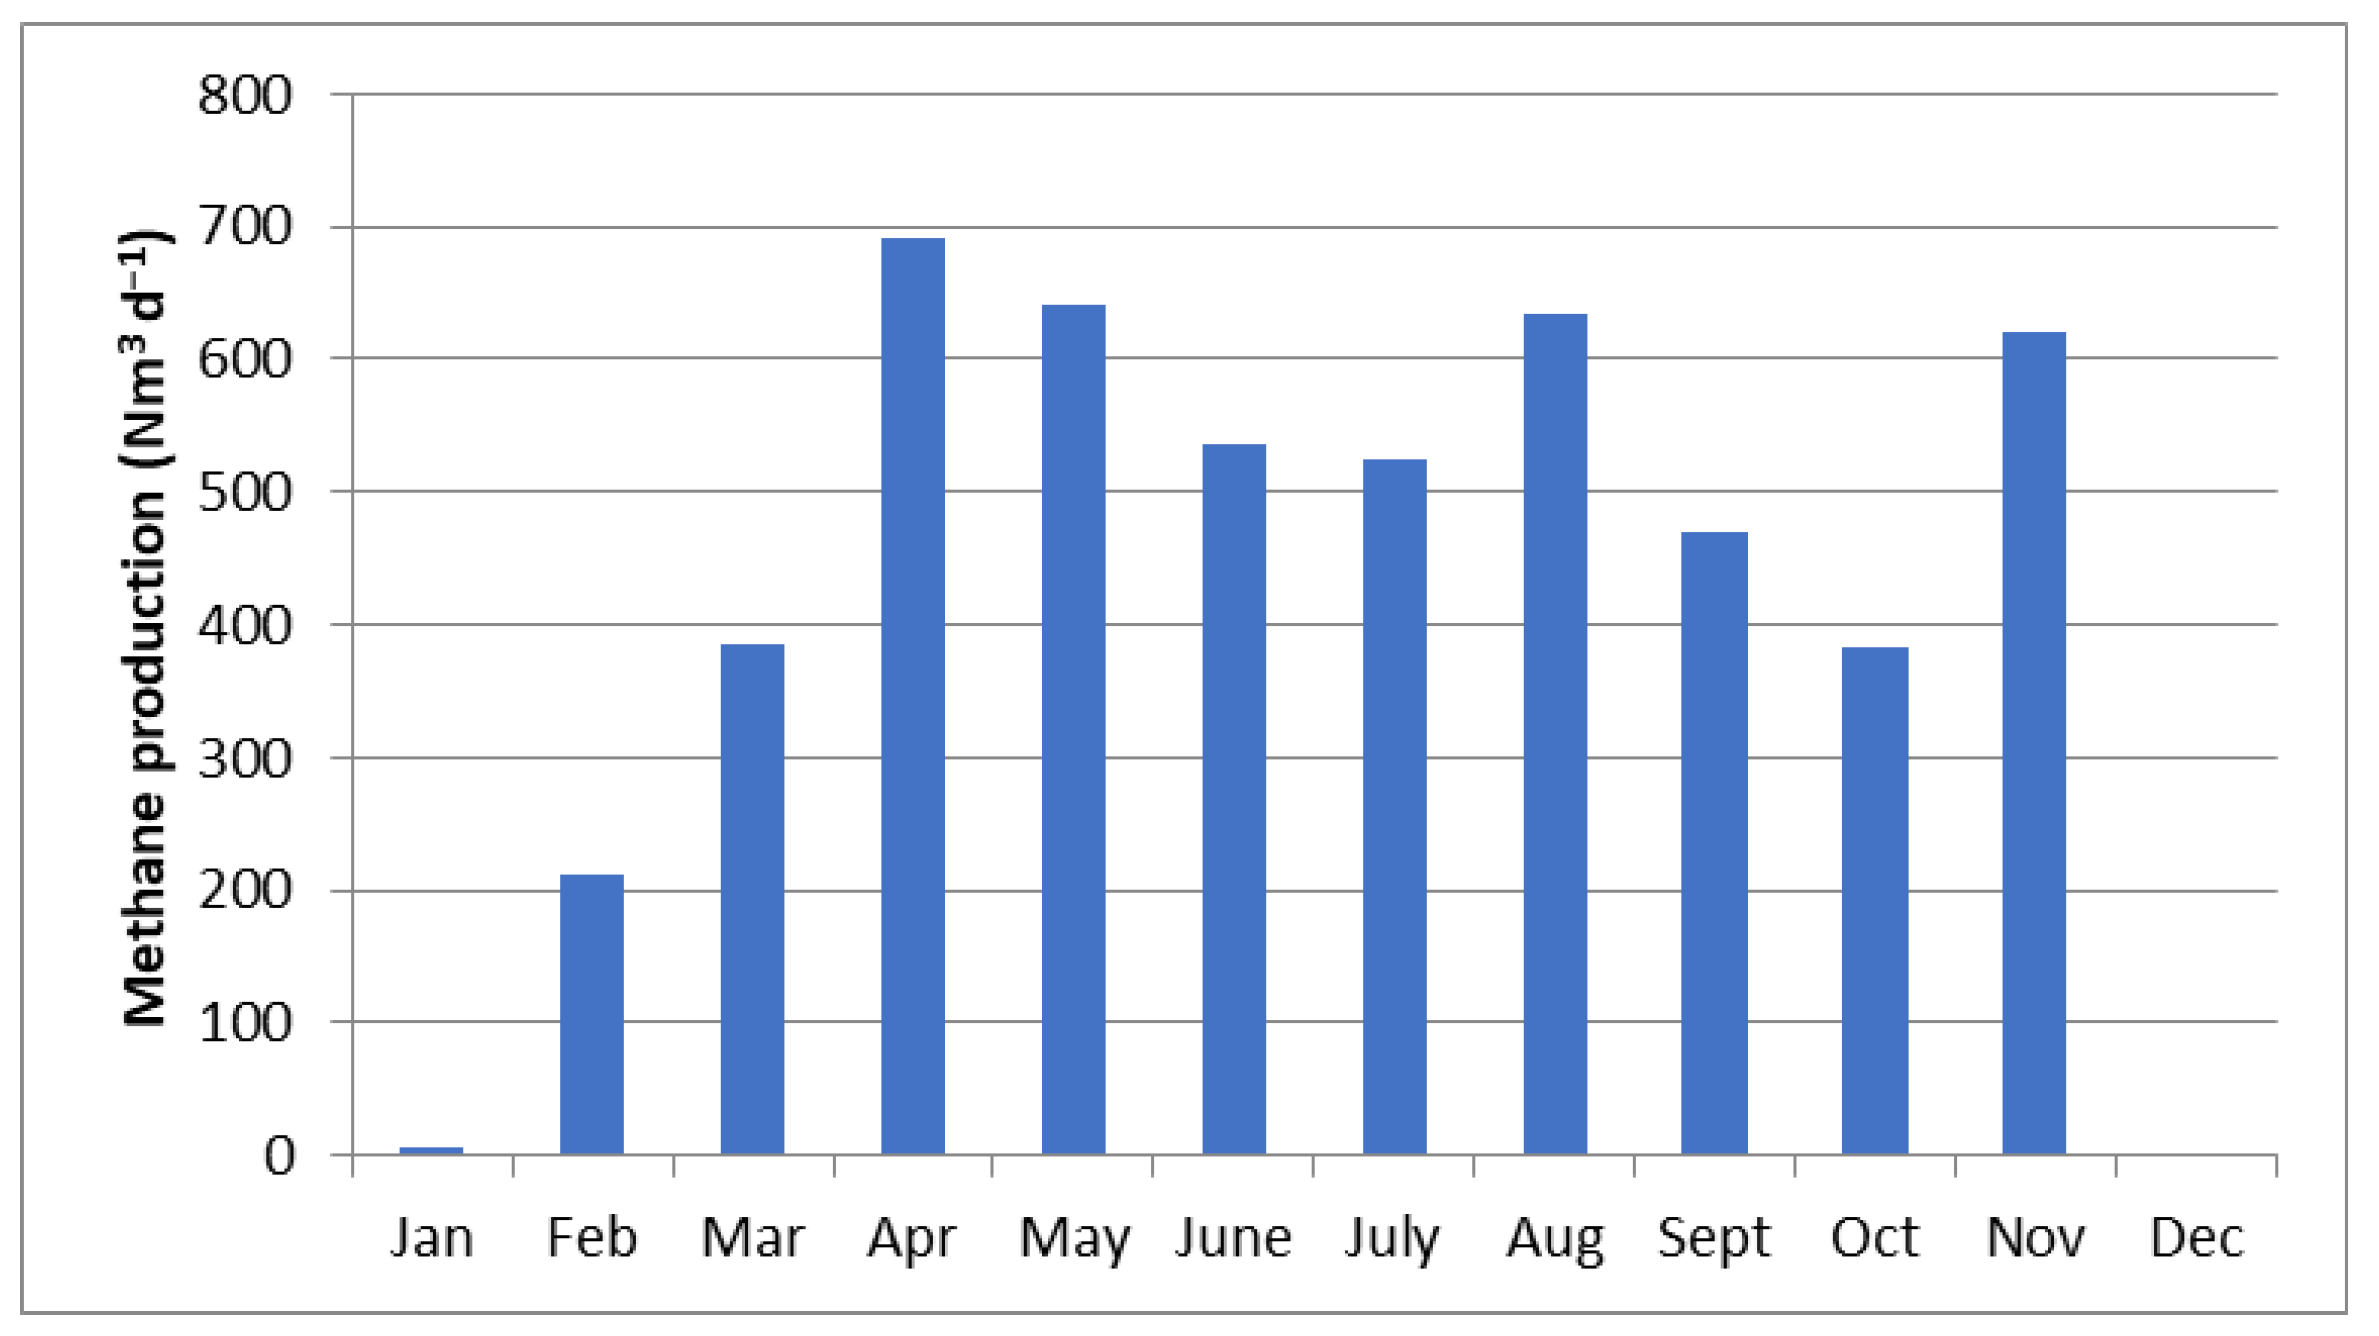
3.3. BMP Simulation
4. Discussion
5. Conclusions
Supplementary Materials
Author Contributions
Funding
Institutional Review Board Statement
Informed Consent Statement
Data Availability Statement
Acknowledgments
Conflicts of Interest
References
- Eurostat. Gross Electricity Production by Fuel, EU, 2000–2021. Available online: https://ec.europa.eu/eurostat/statistics-explained/index.php?title=Electricity_and_heat_statistics (accessed on 29 March 2023).
- IEA. Outlook for Biogas and Prospects for Organic Growth World Energy Outlook Special Report Biomethane; IEA: Paris, France, 2020. [Google Scholar]
- Sadh, P.K.; Duhan, S.; Duhan, J.S. Agro-industrial wastes and their utilization using solid state fermentation: A review. Bioresour. Bioprocess. 2018, 5, 1. [Google Scholar] [CrossRef]
- Food and Agriculture Organization of the United Nations (FAO). FAOSTAT: Agricultural Land–Area by Country; FAO: Rome, Italy, 2018. [Google Scholar]
- Hellenic Statistical Authority. Vegetables Areas and Production by Region and Regional Unity. 2019. Available online: https://www.statistics.gr/en/statistics/-/publication/SPG06/- (accessed on 21 November 2022).
- Isci, A.; Demirer, G.N. Biogas production potential from cotton wastes. Renew. Energy 2007, 32, 750–757. [Google Scholar] [CrossRef]
- Jain, N.; Bhatia, A.; Pathak, H. Emission of air pollutants from crop residue burning in India. Aerosol Air Qual. Res. 2014, 14, 422–430. [Google Scholar] [CrossRef]
- Zhang, L.; Liu, Y.; Hao, L. Contributions of open crop straw burning emissions to PM2.5 concentrations in China. Environ. Res. Lett. 2016, 11, 014014. [Google Scholar] [CrossRef]
- Sharratt, B.; Auvermann, B. Dust Pollution from Agriculture. In Encyclopedia of Agriculture and Food Systems; Elsevier: Amsterdam, The Netherlands, 2014; pp. 487–504. [Google Scholar] [CrossRef]
- Keshtkar, H.; Ashbaugh, L.L. Size distribution of polycyclic aromatic hydrocarbon particulate emission factors from agricultural burning. Atmos Environ. 2007, 41, 2729–2739. [Google Scholar] [CrossRef]
- Rakkar, M.K.; Blanco-Canqui, H. Grazing of crop residues: Impacts on soils and crop production. Agric. Ecosyst. Environ. 2018, 258, 71–90. [Google Scholar] [CrossRef]
- Flower, K.C.; Ward, P.R.; Passaris, N.; Cordingley, N. Uneven crop residue distribution influences soil chemical composition and crop yield under long-term no-tillage. Soil Tillage Res. 2022, 223, 105498. [Google Scholar] [CrossRef]
- Cesaro, A. The valorization of the anaerobic digestate from the organic fractions of municipal solid waste: Challenges and perspectives. J. Environ. Manag. 2021, 280, 111742. [Google Scholar] [CrossRef]
- Klimek, K.E.; Wrzesińska-Jedrusiak, E.; Kapłan, M.; Łaska-Zieja, B. Management of biomass of selected grape leaves varieties in the process of methane fermentation. J. Water Land Dev. 2022, 55, 17–27. [Google Scholar] [CrossRef]
- Yang, L.; Cosolini, S.I. A Case Study on Converting Organic Farm Waste Vegetables to Biogas Using a Cartridge Design Anaerobic Digester. Appl. Biochem. Biotechnol. 2019, 189, 638–646. [Google Scholar] [CrossRef]
- Okolie, J.A.; Epelle, E.I.; Tabat, M.E.; Orivri, U.; Amenaghawon, A.N.; Okoye, P.U.; Gunes, B. Waste biomass valorization for the production of biofuels and value-added products: A comprehensive review of thermochemical, biological and integrated processes. Process Saf. Environ. Prot. 2022, 159, 323–344. [Google Scholar] [CrossRef]
- Nguyen, P.H.L.; Kuruparan, P.; Visvanathan, C. Anaerobic digestion of municipal solid waste as a treatment prior to landfill. Bioresour. Technol. 2007, 98, 380–387. [Google Scholar] [CrossRef]
- Kovács, E.; Wirth, R.; Maróti, G.; Bagi, Z.; Rákhely, G.; Kovács, K.L. Biogas Production from Protein-Rich Biomass: Fed-Batch Anaerobic Fermentation of Casein and of Pig Blood and Associated Changes in Microbial Community Composition. PLoS ONE 2013, 8, e77265. [Google Scholar] [CrossRef] [PubMed]
- Kofoed, M.V.W.; Jensen, M.B.; Ottosen, L.D.M. Chapter 12—Biological Upgrading of Biogas through CO2 Conversion to CH4. In Emerging Technologies and Biological Systems for Biogas Upgrading; Academic Press: Cambridge, MA, USA, 2021. [Google Scholar]
- EurObserv’ER. Measures the Progress Made by Renewable Energies European Union. 2022. Available online: https://www.eurobserv-er.org/ (accessed on 1 March 2023).
- Ervine, C. Directive 2004/39/Ec of the European Parliament and of the Council of 21 April 2004. In Core Statutes on Company Law; Macmillan Education: London, UK, 2015; pp. 757–759. [Google Scholar]
- Hellenic Electricity Distribution Network Operator S.A. 2020. Available online: https://deddie.gr/en/ (accessed on 19 February 2020).
- Alexandridis, C. Map of biogas plants. Bioenergy News 2018, 2, 14–17. (in Greek). [Google Scholar]
- Ionel, I.; Cioablă, A.E. Biogas Production Based on Agricultural Residues. From History to Results and Perspectives. Available online: http://mec.upt.ro (accessed on 24 January 2023).
- Kiran, E.U.; Stamatelatou, K.; Antonopoulou, G.; Lyberatos, G. Production of biogas via anaerobic digestion. In Handbook of Biofuels Production: Processes and Technologies, 2nd ed.; Elsevier Inc.: Amsterdam, The Netherlands, 2016; pp. 259–301. [Google Scholar] [CrossRef]
- Szilágyi, Á.; Bodor, A.; Tolvai, N.; Kovács, K.L.; Bodai, L.; Wirth, R.; Bagi, Z.; Szepesi, Á.; Markó, V.; Kakuk, B.; et al. A comparative analysis of biogas production from tomato bio-waste in mesophilic batch and continuous anaerobic digestion systems. PLoS ONE 2021, 16, e0248654. [Google Scholar] [CrossRef] [PubMed]
- Nawirska, A.; Sokol-Letowska, A.; Kucharska, A.Z.; Biesiada, A.; Bednarek, M. Comparing the contents of dietary fibre fractions in some varieties of Cucurbita maxima and Cucurbita pepo. Zywnosc. Nauka Technol. Jakosc 2008, 15, 65–73. [Google Scholar]
- Komolka, P.; Górecka, D.; Dziedzic, K. The Effect of Thermal Processing of Cruciferous Vegetables on Their Content of Dietary Fiber and Its Fractions. Acta Sci. Pol. Technol. Aliment. 2012, 11, 347–354. [Google Scholar]
- Ji, C.; Kong, X.C.; Mei, Z.-L.; Li, J. A Review of the Anaerobic Digestion of Fruit and Vegetable Waste. Appl. Biochem. Biotechnol. 2017, 183, 906–922. [Google Scholar] [CrossRef]
- Banaszuk, P.; Wysocka-Czubaszek, A.; Czubaszek, R.; Roj-Rojewski, S. Implications of Biomass Use for Energy Production. WieŚ I Rol. 2015, 169, 139–152. [Google Scholar]
- Prochnow, A.; Heiermann, M.; Plöchl, M.; Linke, B.; Idler, C.; Amon, T.; Hobbs, P.J. Bioenergy from Permanent Grassland—A Review: 1. Biogas. Bioresour. Technol. 2009, 100, 4931–4944. [Google Scholar] [CrossRef]
- Czubaszek, R.; Wysocka-Czubaszek, A.; Tyborowski, R. Methane Production Potential from Apple Pomace, Cabbage Leaves, Pumpkin Residue and Walnut Husks. Appl. Sci. 2022, 12, 6128. [Google Scholar] [CrossRef]
- Feiz, R.; Metson, G.S.; Wretman, J.; Ammenberg, J. Key Factors for Site-Selection of Biogas Plants in Sweden. 2022. Available online: https://ssrn.com/abstract=4023474 (accessed on 24 January 2023).
- Saev, M.; Koumanova, B.; Simeonov, I. Anaerobic co-digestion of wasted vegetables and activated sludge. Biotechnol. Biotechnol. Equip. 2009, 23, 832–835. [Google Scholar] [CrossRef]
- Belhadj, S.; Joute, Y.; El Bari, H.; Serrano, A.; Gil, A.; Siles, J.Á.; Chica, A.F.; Martín, M.Á. Evaluation of the anaerobic co-digestion of sewage sludge and tomato waste at mesophilic temperature. Appl. Biochem. Biotechnol. 2014, 172, 3862–3874. [Google Scholar] [CrossRef]
- Luengo, E.; Álvarez, I.; Raso, J. Improving Carotenoid Extraction from Tomato Waste by Pulsed Electric Fields. Front. Nutr. 2014, 1, 12. [Google Scholar] [CrossRef] [PubMed]
- Deressa, L.; Libsu, S.; Chavan, R.B.; Manaye, D.; Dabassa, A. Production of Biogas from Fruit and Vegetable Wastes Mixed with Different Wastes. Environ. Ecol. Res. 2015, 3, 65–71. [Google Scholar] [CrossRef]
- Budiyono; Manthia, F.; Amalin, N.; Matin, H.H.A.; Sumardiono, S. Production of Biogas from Organic Fruit Waste in Anaerobic Digester using Ruminant as the Inoculum. In MATEC Web of Conferences; EDP Sciences: Les Ulis, France, 2018. [Google Scholar] [CrossRef]
- Atem, A.D.; Indiveri, M.E.; Llamas, S. Biomass storage for further energy use through biogas production. Int. J. Hydrogen Energy 2010, 35, 6048–6051. [Google Scholar] [CrossRef]
- Saghouri, M.; Mansoori, Y.; Rohani, A.; Khodaparast, M.H.H.; Sheikhdavoodi, M.J. Modelling and evaluation of anaerobic digestion process of tomato processing wastes for biogas generation. J. Mater. Cycles Waste Manag. 2018, 20, 561–567. [Google Scholar] [CrossRef]
- Nugroho, A.; Sumantri, I. Biogas production of tomato sauce wastewater by batch anaerobic digestion. In AIP Conference Proceedings; American Institute of Physics Inc.: College Park, MD, USA, 2020. [Google Scholar] [CrossRef]
- Ulusoy, Y.; Ulukardeler, A.H.; Ünal, H.; Aliba, K. Analysis of Biogas Production in Turkey Utilising Three Different Materials and Two Scenarios. 2009. Available online: http://www.academicjournals.org/AJAR (accessed on 11 March 2023).
- Li, Y.; Xu, F.; Li, Y.; Lu, J.; Li, S.; Shah, A.; Zhang, X.; Zhang, H.; Gong, X.; Li, G. Reactor performance and energy analysis of solid state anaerobic co-digestion of dairy manure with corn stover and tomato residues. Waste Manag. 2018, 73, 130–139. [Google Scholar] [CrossRef]
- Almeida, P.V.; Rodrigues, R.P.; Gaspar, M.C.; Braga, M.E.M.; Quina, M.J. Integrated management of residues from tomato production: Recovery of value-added compounds and biogas production in the biorefinery context. J. Environ. Manag. 2021, 299, 113505. [Google Scholar] [CrossRef]
- Oleszek, M.; Tys, J.; Wiącek, D.; Król, A.; Kuna, J. The Possibility of Meeting Greenhouse Energy and CO2 Demands Through Utilisation of Cucumber and Tomato Residues. Bioenergy Res. 2016, 9, 624–632. [Google Scholar] [CrossRef]
- Jagadabhi, P.S.; Kaparaju, P.; Rintala, J. Two-stage anaerobic digestion of tomato, cucumber, common reed and grass silage in leach-bed reactors and upflow anaerobic sludge blanket reactors. Bioresour. Technol. 2011, 102, 4726–4733. [Google Scholar] [CrossRef] [PubMed]
- Gioulounta, K.; Kosmadakis, I.; Elmasides, C.; Diamantis, V.; Piskilopoulos, A.; Amiridis, I.; Stamatelatou, K. Energy valorisation of the residual biomass from greenhouses in the framework of a circular economy. In IOP Conference Series: Earth and Environmental Science; IOP Publishing: Bristol, UK, 2022. [Google Scholar] [CrossRef]
- Torres-León, C.; Ramírez-Guzman, N.; Londoño-Hernandez, L.; Martinez-Medina, G.A.; Díaz-Herrera, R.; Navarro-Macias, V.; Alvarez-Pérez, O.B.; Picazo, B.; Villarreal-Vázquez, M.; Ascacio-Valdes, J.; et al. Food Waste and Byproducts: An Opportunity to Minimize Malnutrition and Hunger in Developing Countries. Front. Sustain. Food Syst. 2018, 2, 52. [Google Scholar] [CrossRef]
- Li, Z.; Reichel, R.; Xu, Z.; Vereecken, H.; Brüggemann, N. Return of crop residues to arable land stimulates N2O emission but mitigates NO3− leaching: A meta-analysis. Agron. Sustain. Dev. 2021, 41, 66. [Google Scholar] [CrossRef]
- APHA. Standard Methods for the Examination of Water and Wastewater the Nineteenth and Earlier Editions; APHA: Washington, DC, USA, 1999. [Google Scholar]
- Sluiter, A.; Hames, B.; Ruiz, R.; Scarlata, C.; Sluiter, J.; Templeton, D.; Crocker, D.L.A.P. Determination of Structural Carbohydrates and Lignin in Biomass Laboratory Analytical Procedure (LAP) Issue Date: 7/17/2005. 2008. Available online: www.nrel.gov (accessed on 25 August 2022).
- Holliger, C.; Alves, M.; Andrade, D.; Angelidaki, I.; Astals, S.; Baier, U.; Bougrier, C.; Buffière, P.; Carballa, M.; De Wilde, V.; et al. Towards a standardization of biomethane potential tests. Water Sci. Technol. 2016, 74, 2515–2522. [Google Scholar] [CrossRef] [PubMed]
- Gomes, C.S.; Strangfeld, M.; Meyer, M. Diauxie studies in biogas production from gelatin and adaptation of the modified gompertz model: Two-phase gompertz model. Appl. Sci. 2021, 11, 1067. [Google Scholar] [CrossRef]
- Nash, J.E.; Sutcliffe, J.V. River flow forecasting through conceptual models part I—A discussion of principles. J. Hydrol. 1970, 10, 282–290. [Google Scholar] [CrossRef]
- Gupta, H.V.; Sorooshian, S.; Yapo, P.O. Status of Automatic Calibration for Hydrologic Models: Comparison with Multilevel Expert Calibration. J. Hydrol. Eng. 1999, 4, 135–143. [Google Scholar] [CrossRef]
- Moriasi, D.N.; Arnold, J.G.; Van Liew, M.W.; Bingner, R.L.; Harmel, R.D.; Veith, T.L. Model Evaluation Guidelines for Systematic Quantification of Accuracy in Watershed Simulations. Trans. ASABE 2007, 50, 885–900. [Google Scholar] [CrossRef]
- Li, P.; Li, W.; Sun, M.; Xu, X.; Zhang, B.; Sun, Y. Evaluation of biochemical methane potential and kinetics on the anaerobic digestion of vegetable crop residues. Energies 2019, 12, 26. [Google Scholar] [CrossRef]
- Gunaseelan, V.N. Biochemical methane potential of fruits and vegetable solid waste feedstocks. Biomass Bioenergy 2004, 26, 389–399. [Google Scholar] [CrossRef]
- Aravani, V.P.; Tsigkou, K.; Kornaros, M.; Papadakis, V.G. Laboratory analyses for assessing the potential for biogas production of various agricultural residues in Greece. Agron. Res. 2021, 19, 1339–1350. [Google Scholar] [CrossRef]
- Kim, M.J.; Kim, S.H. Minimization of diauxic growth lag-phase for high-efficiency biogas production. J. Environ. Manag. 2017, 187, 456–463. [Google Scholar] [CrossRef]
- Buitrón, G.; Hernández-Juárez, A.; Hernández-Ramírez, M.D.; Sánchez, A. Biochemical methane potential from lignocellulosic wastes hydrothermally pretreated. Ind. Crops Prod. 2019, 139, 111555. [Google Scholar] [CrossRef]
- Khan, M.T.; Huelsemann, B.; Krümpel, J.; Wüst, D.; Oechsner, H.; Lemmer, A. Biochemical Methane Potential of a Biorefinery’s Process-Wastewater and its Components at Different Concentrations and Temperatures. Fermentation 2022, 8, 476. [Google Scholar] [CrossRef]
- Kim, D.S.; Kwack, Y.; Lee, J.H.; Chun, C. Antimicrobial activity of various parts of tomato plants varied with different solvent extracts. Plant Pathol. J. (Faisalabad) 2019, 35, 149–155. [Google Scholar] [CrossRef] [PubMed]
- Mendoza, Y.; Arias-Londoño, M.; Sánchez-Garzón, J.; Rojas-Vahos, D.F.; Robledo-Sierra, J. Antioxidant and Inhibitory Capacity of Tomato Leaf Ethanolic Extract against Streptococcus mutans, Porphyromonas gingivalis, and Candida albicans. Vitae 2022, 29, 349996. [Google Scholar] [CrossRef]


| Sieve Diameter (mm) | T.L. (%) | T.S. (%) | T.St. (%) | C.L. (%) | C.S. (%) | C.St. (%) |
|---|---|---|---|---|---|---|
| >1.7 | 12.32 | 16.29 | 22.52 | 16.99 | 7.35 | 23.21 |
| 1.7–1.4 | 5.63 | 6.72 | 9.35 | 2.68 | 6 | 5.46 |
| 1.4–1 | 10.98 | 11.81 | 10.81 | 5.1 | 14.53 | 10.52 |
| 1–0.85 | 4.61 | 4.7 | 2.22 | 2.42 | 5.94 | 5.97 |
| 0.85–0.71 | 5.46 | 5.33 | 6.5 | 2.9 | 7.08 | 3.23 |
| 0.71–0.6 | 3.71 | 3.81 | 4.73 | 2.5 | 5.13 | 4.79 |
| 0.6–0.5 | 5.21 | 5.05 | 3.68 | 4.05 | 6.76 | 6.49 |
| 0.5–0.25 | 13.98 | 12.97 | 13.88 | 14.6 | 15.3 | 12.93 |
| 0.25–0.15 | 9.62 | 9.34 | 9.97 | 15.12 | 6.91 | 8.25 |
| <0.15 | 28.47 | 23.98 | 16.33 | 33.64 | 25.02 | 19.16 |
| T.L. | T.S. | T.St. | C.L. | C.S. | C.St. | |
|---|---|---|---|---|---|---|
| Humidity (%) | 89.6 ± 0.6 | 88.8 ± 3 | 85.8 ± 1.7 | 91.6 ± 1.3 | 91 ± 1.9 | 92.3 ± 2.8 |
| TS (% FM) | 10.4 ± 0.6 | 11.2 ± 3 | 14.2 ± 1.7 | 8.4 ± 1.3 | 9 ± 1.9 | 7.7 ± 2.8 |
| VS (% TS) | 69.5 ± 2.6 | 85.9 ± 2.5 | 86.1 ± 1.4 | 71.6 ± 4.3 | 83.8 ± 1 | 81.3 ± 0.5 |
| COD (g kg−1 VS) | 1179 ± 64 | 1239 ± 129 | 1215 ± 7 | 1251 ± 83 | 1304 ± 49 | 1157 ± 14 |
| TKN (g kg−1 VS) | 38 ± 3.9 | 60.4 ± 4.5 | 11.7 ± 0.5 | 47.3 ± 2.1 | 62.6 ± 7.4 | 15.3 ± 1.2 |
| P (g kg−1 VS) | 69.1 ± 16 | 70.5 ± 18 | 26.8 ± 0.5 | 80.5 ± 25.4 | 110.9 ± 18 | 47.5 ± 5 |
| Acid Insoluble Acid-insoluble lignin (% e.f.s.) | 10 ± 1.1 | 10.1 ± 1.4 | ||||
| Acid-soluble lignin (%e.f.s.) | n.d. | 16.4 ± 0.6 |
| Tons | January | February | March | April | May | June | July | August | September | October | November | December | Total |
|---|---|---|---|---|---|---|---|---|---|---|---|---|---|
| T.S. | 0 | 0 | 27 | 264 | 346 | 437 | 458 | 360 | 275 | 339 | 127 | 0 | 2633 |
| T.L. | 0 | 0 | 7 | 66 | 86 | 109 | 115 | 90 | 69 | 85 | 32 | 0 | 658 |
| T.St. | 425.7 | 426 | |||||||||||
| C.S. | 8 | 264 | 500 | 625 | 495 | 155 | 213 | 471 | 317 | 149 | 74 | 0 | 3272 |
| C.L. | 1 | 47 | 88 | 110 | 87 | 27 | 38 | 83 | 56 | 26 | 13 | 0 | 577 |
| C.St. | 113 | 113 | 225 | ||||||||||
| Total | 9 | 311 | 622 | 1065 | 1015 | 841 | 823 | 1004 | 718 | 600 | 672 | 0 | 7567 |
Disclaimer/Publisher’s Note: The statements, opinions and data contained in all publications are solely those of the individual author(s) and contributor(s) and not of MDPI and/or the editor(s). MDPI and/or the editor(s) disclaim responsibility for any injury to people or property resulting from any ideas, methods, instructions or products referred to in the content. |
© 2023 by the authors. Licensee MDPI, Basel, Switzerland. This article is an open access article distributed under the terms and conditions of the Creative Commons Attribution (CC BY) license (https://creativecommons.org/licenses/by/4.0/).
Share and Cite
Gioulounta, K.; Matska, M.; Piskilopoulos, A.; Stamatelatou, K. Greenhouse Residues’ Potential for Biogas Production. Appl. Sci. 2023, 13, 5445. https://doi.org/10.3390/app13095445
Gioulounta K, Matska M, Piskilopoulos A, Stamatelatou K. Greenhouse Residues’ Potential for Biogas Production. Applied Sciences. 2023; 13(9):5445. https://doi.org/10.3390/app13095445
Chicago/Turabian StyleGioulounta, Kleio, Maria Matska, Arsenios Piskilopoulos, and Katerina Stamatelatou. 2023. "Greenhouse Residues’ Potential for Biogas Production" Applied Sciences 13, no. 9: 5445. https://doi.org/10.3390/app13095445