
Assessment of the Quality of Video Sequences Performed by Viewers at Home and in the Laboratory


Abstract
:Featured Application
Abstract
1. Introduction
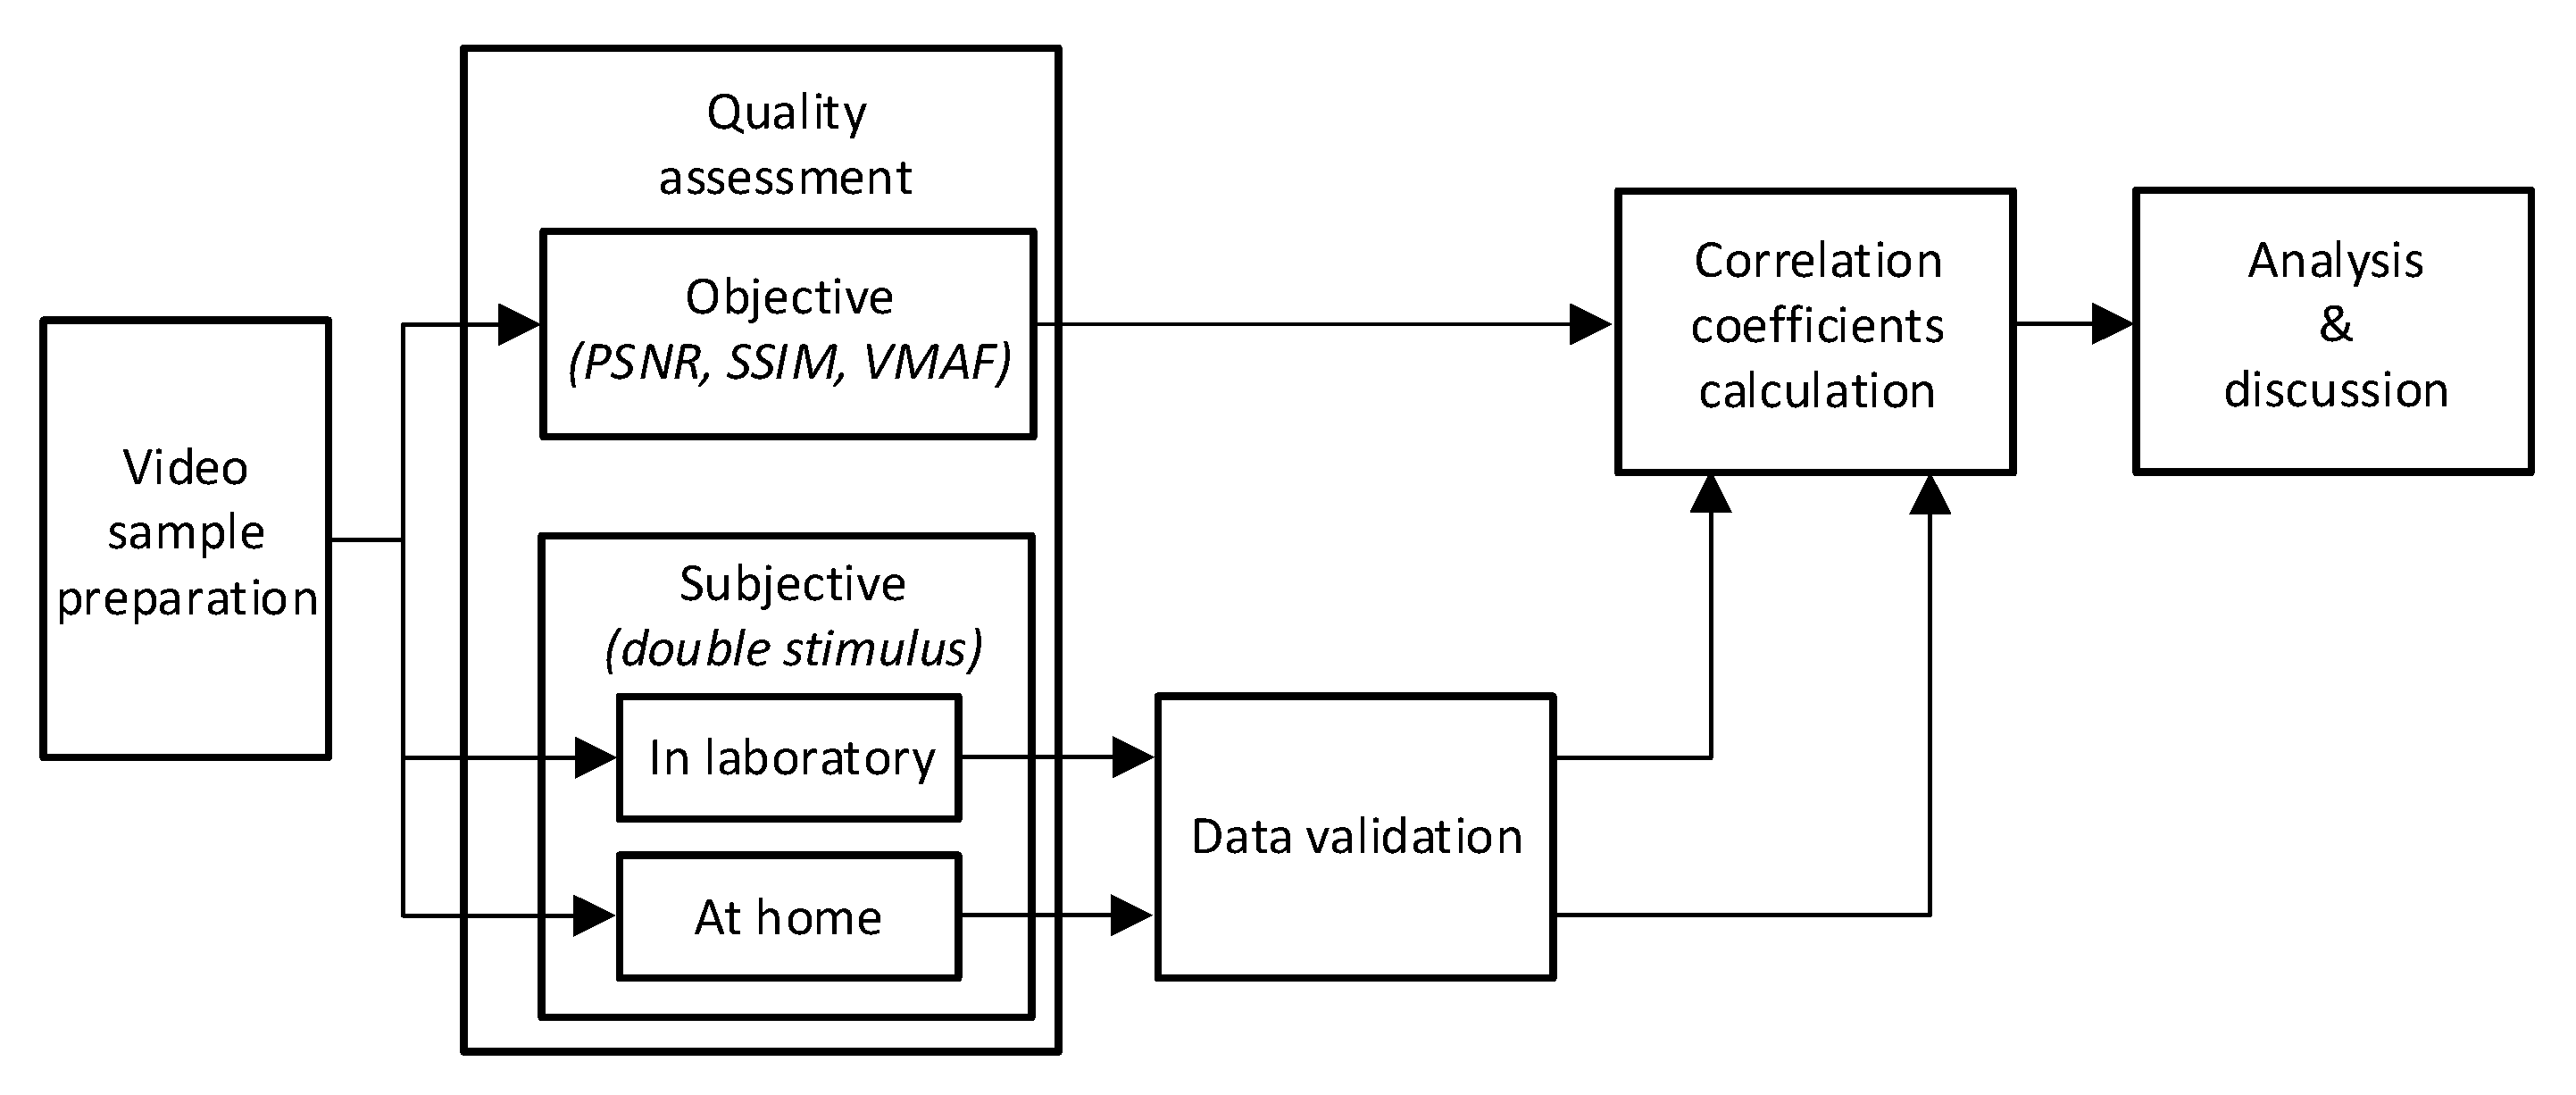
- Conduct a comparative analysis of the video quality assessment results obtained under laboratory and real home (not lab-emulated) conditions;
- Find correlations between objective results and subjective assessment scores, taking into account the influence of the test environment.
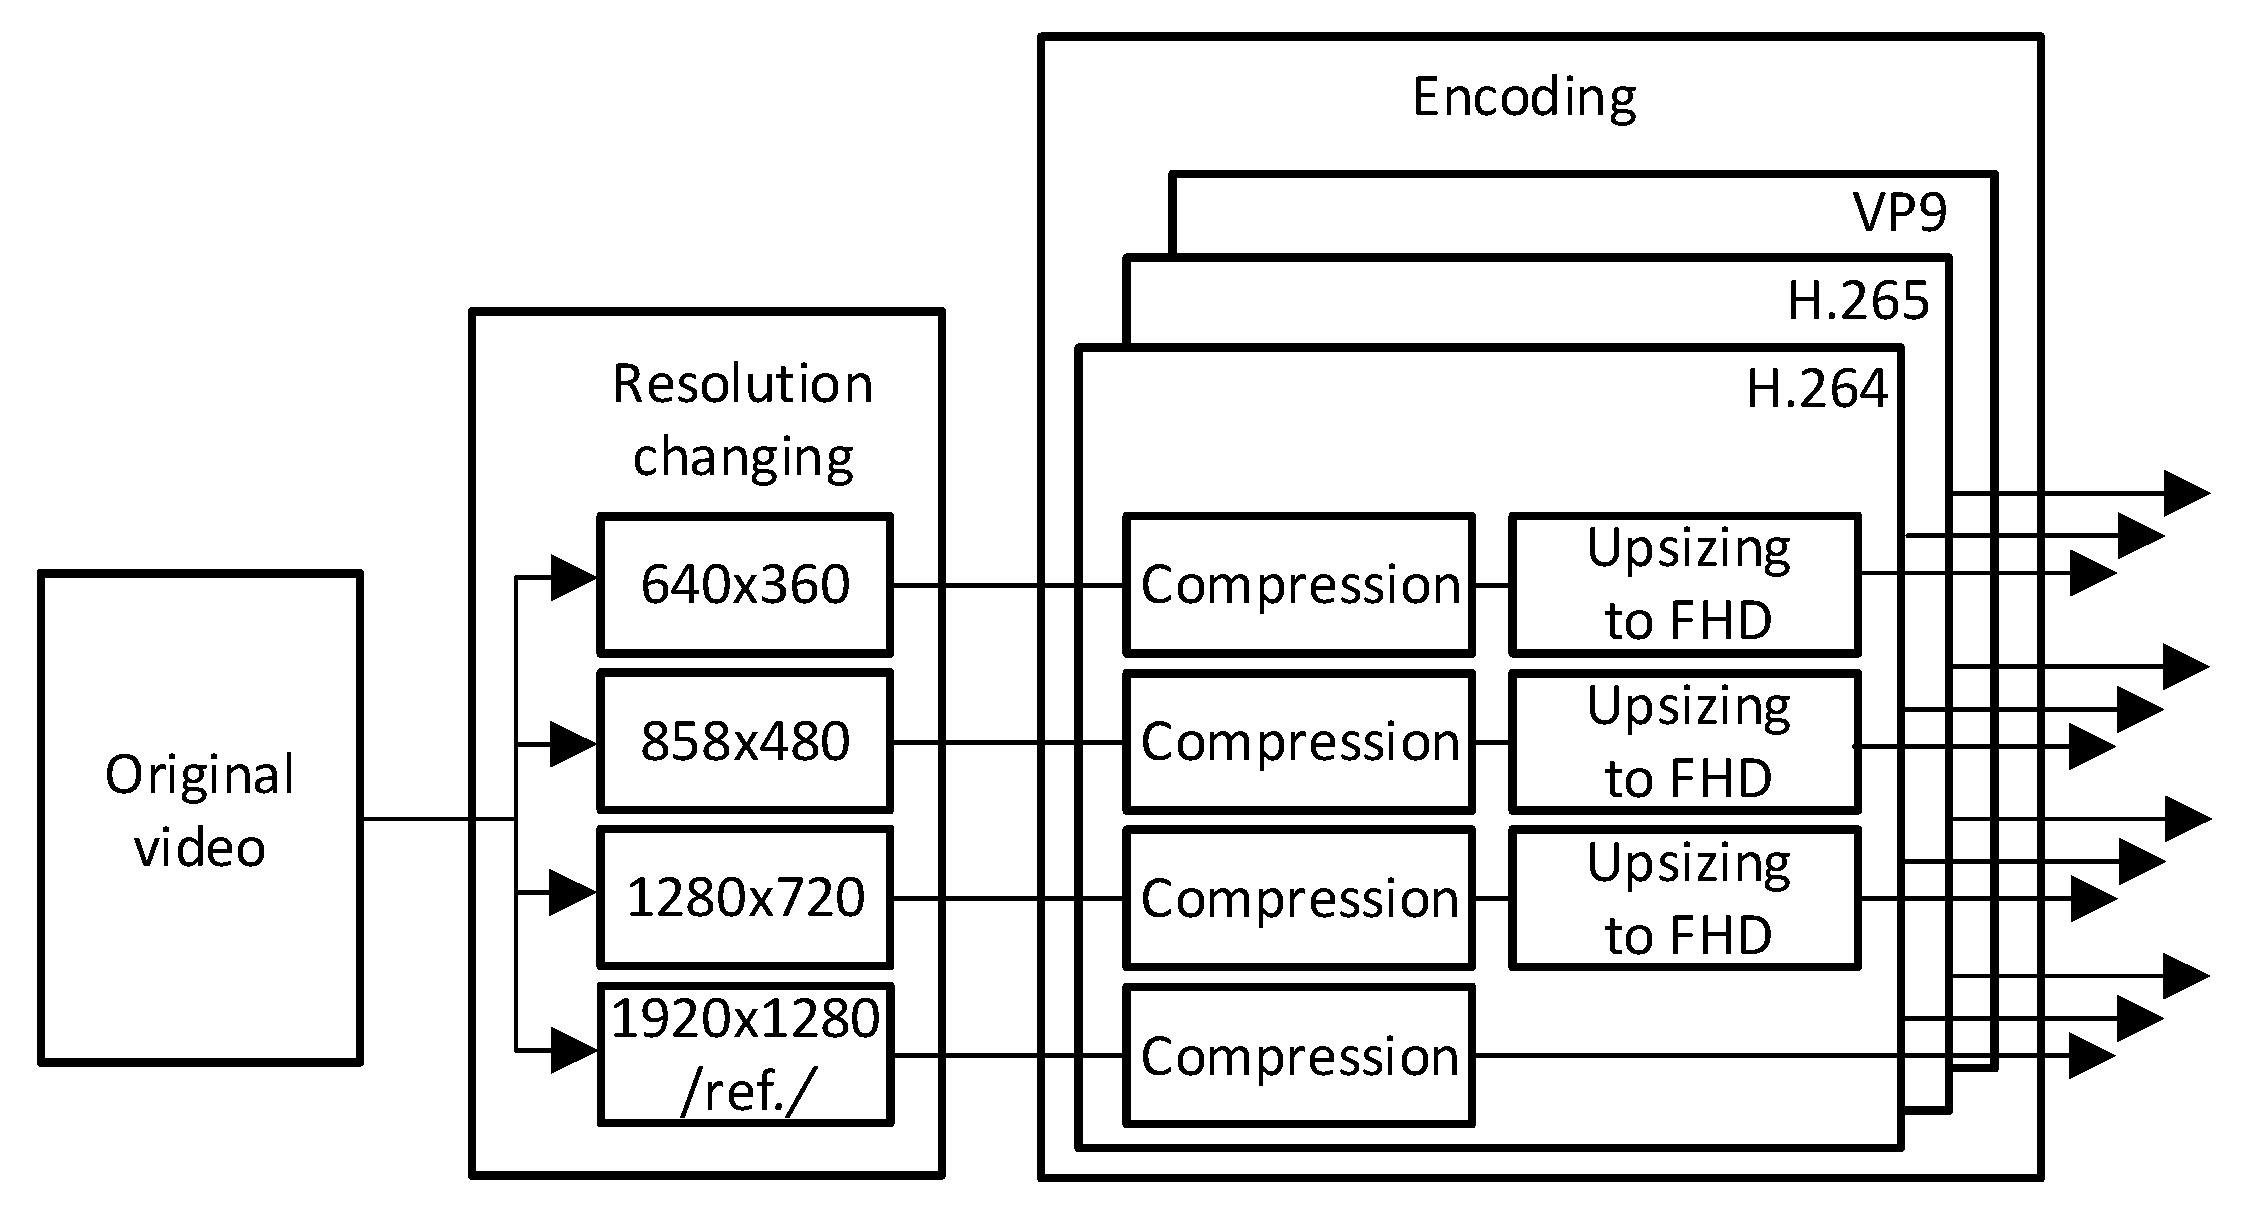
- The bit rate (from 300 kbps to 6000 kbps);
- Resolutions (640 × 360—ninth high definition (nHD), 858 × 480—standard definition (SD), 1280 × 720—high definition (HD), and 1920 × 1080—full high definition (Full HD)).
2. Materials and Methods
- Evaluation in the laboratory;
- Ratings at the viewer’s home.
- H.264—25 people under home conditions and 45 people under laboratory conditions;
- H.265—35 people under home conditions and 35 people under laboratory conditions;
- VP09—30 people under home conditions and 40 people under laboratory conditions.
3. Results and Discussion
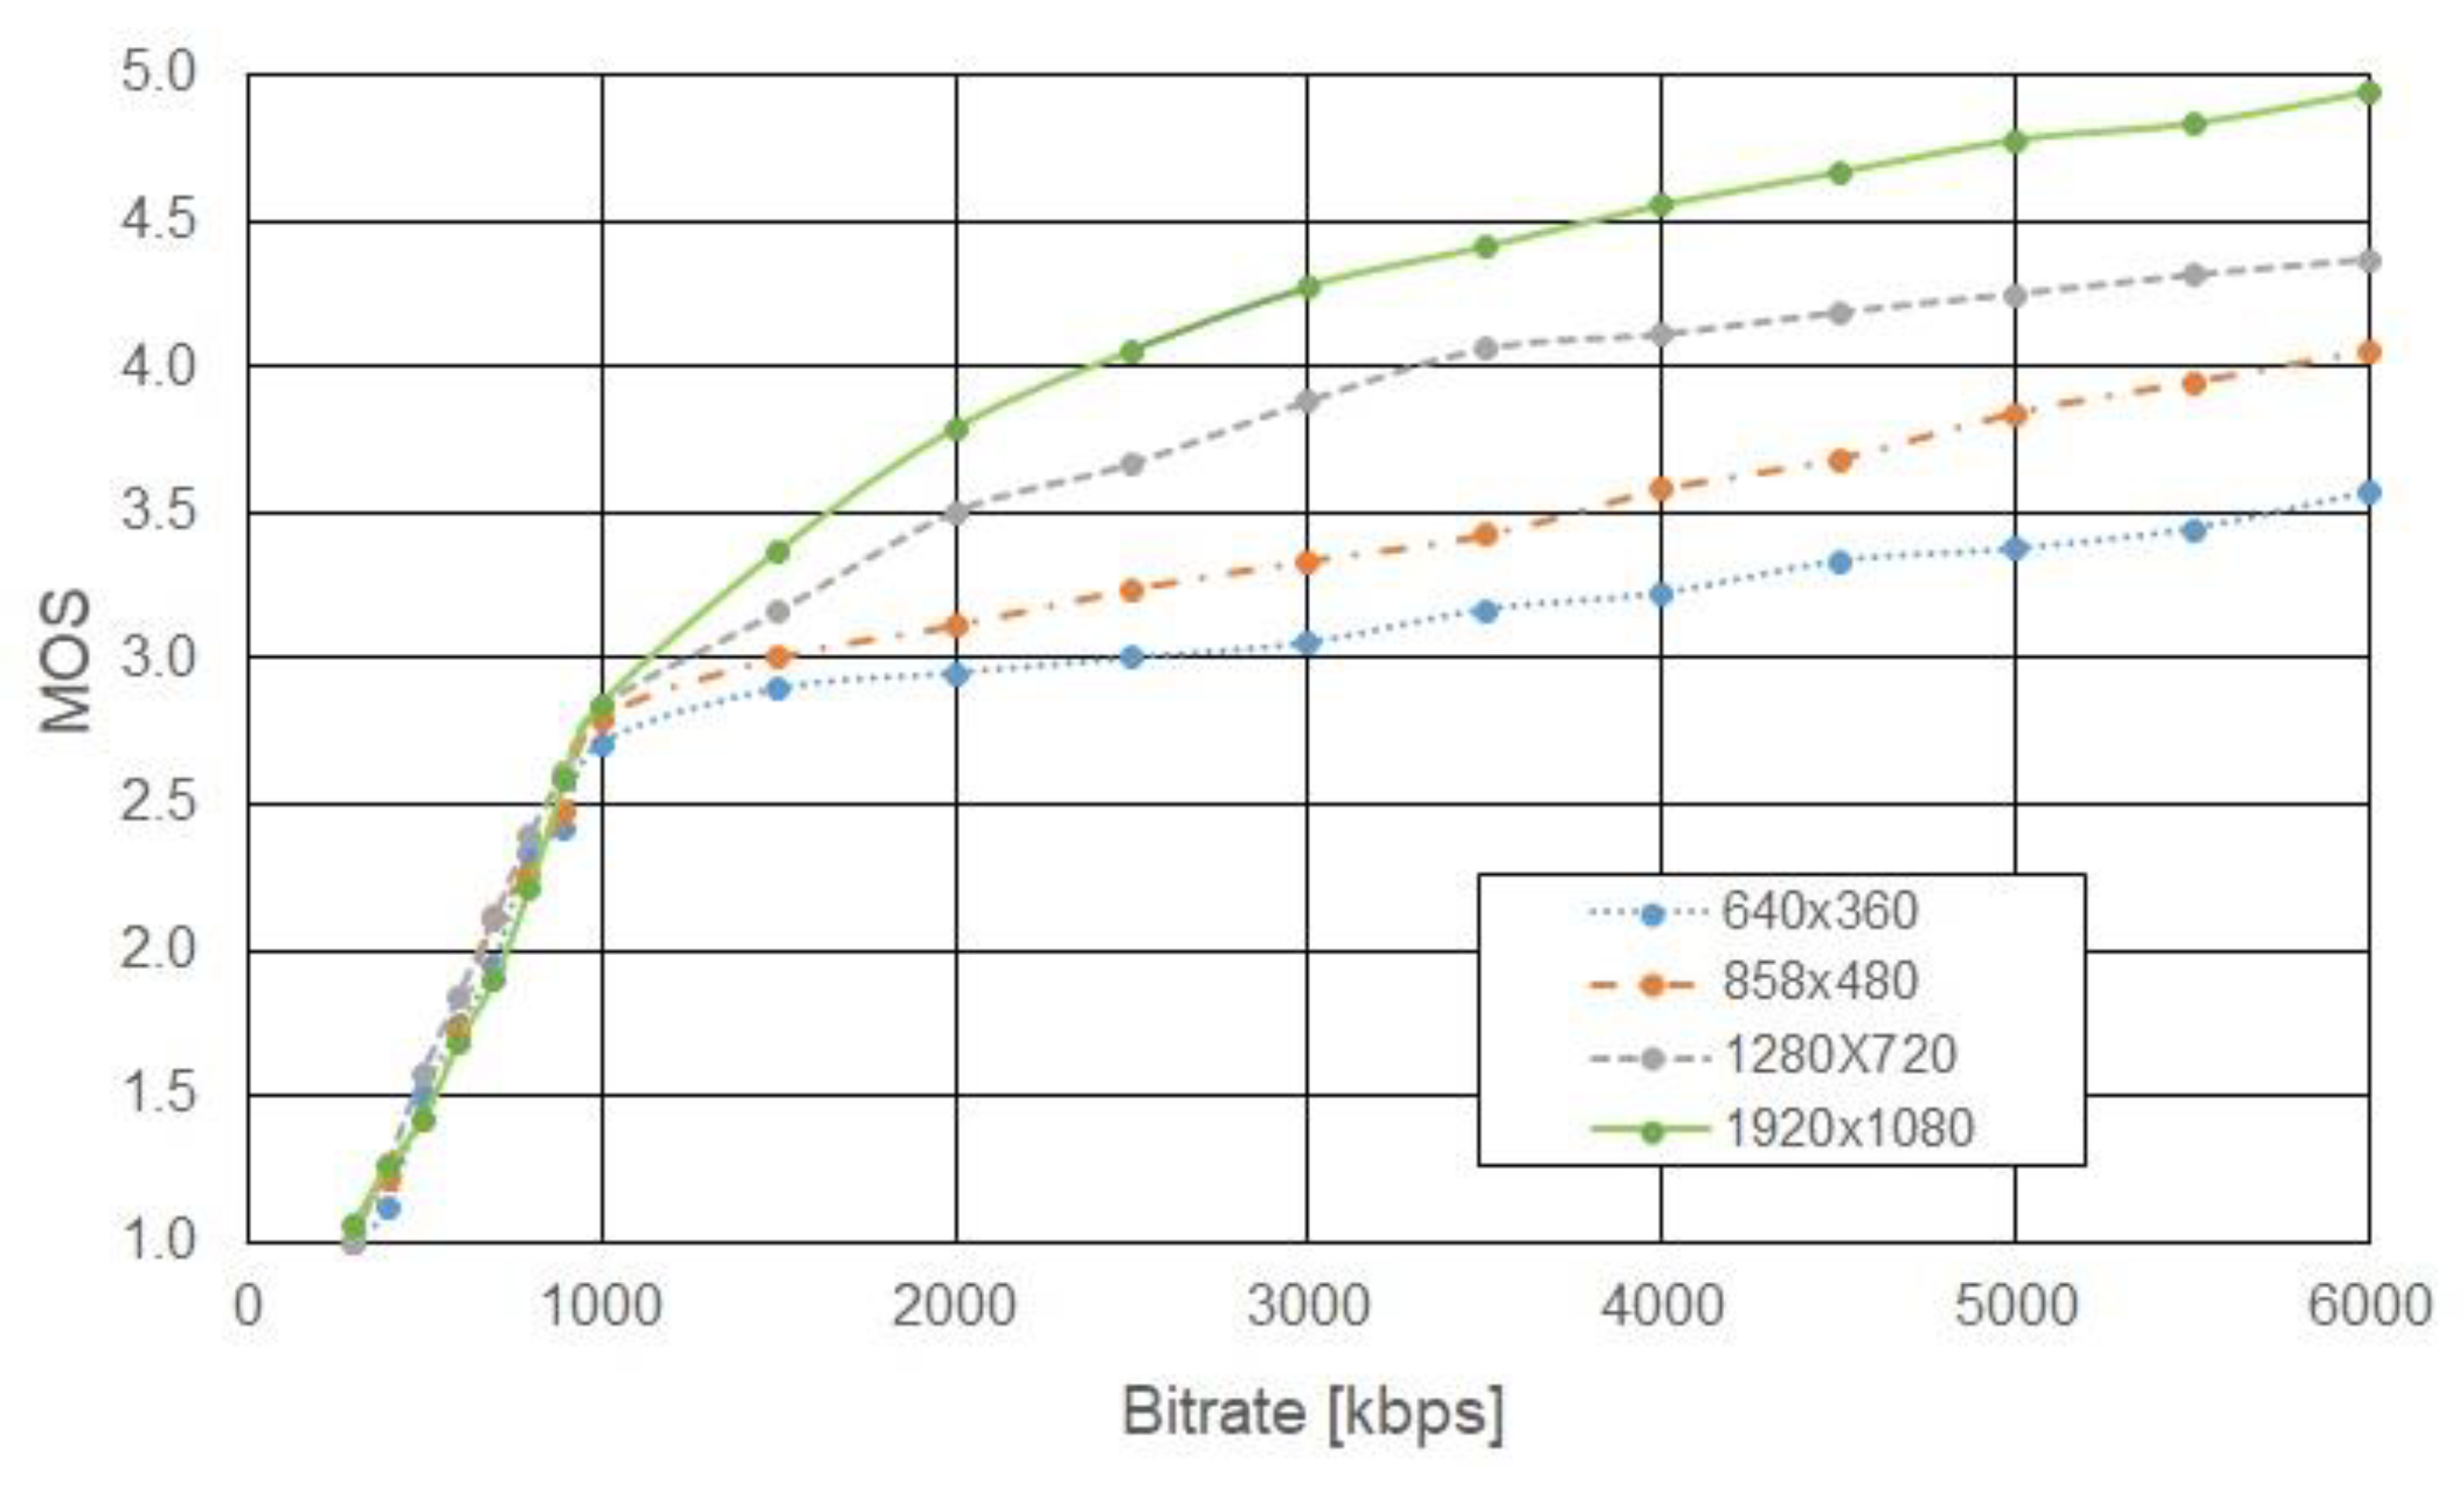
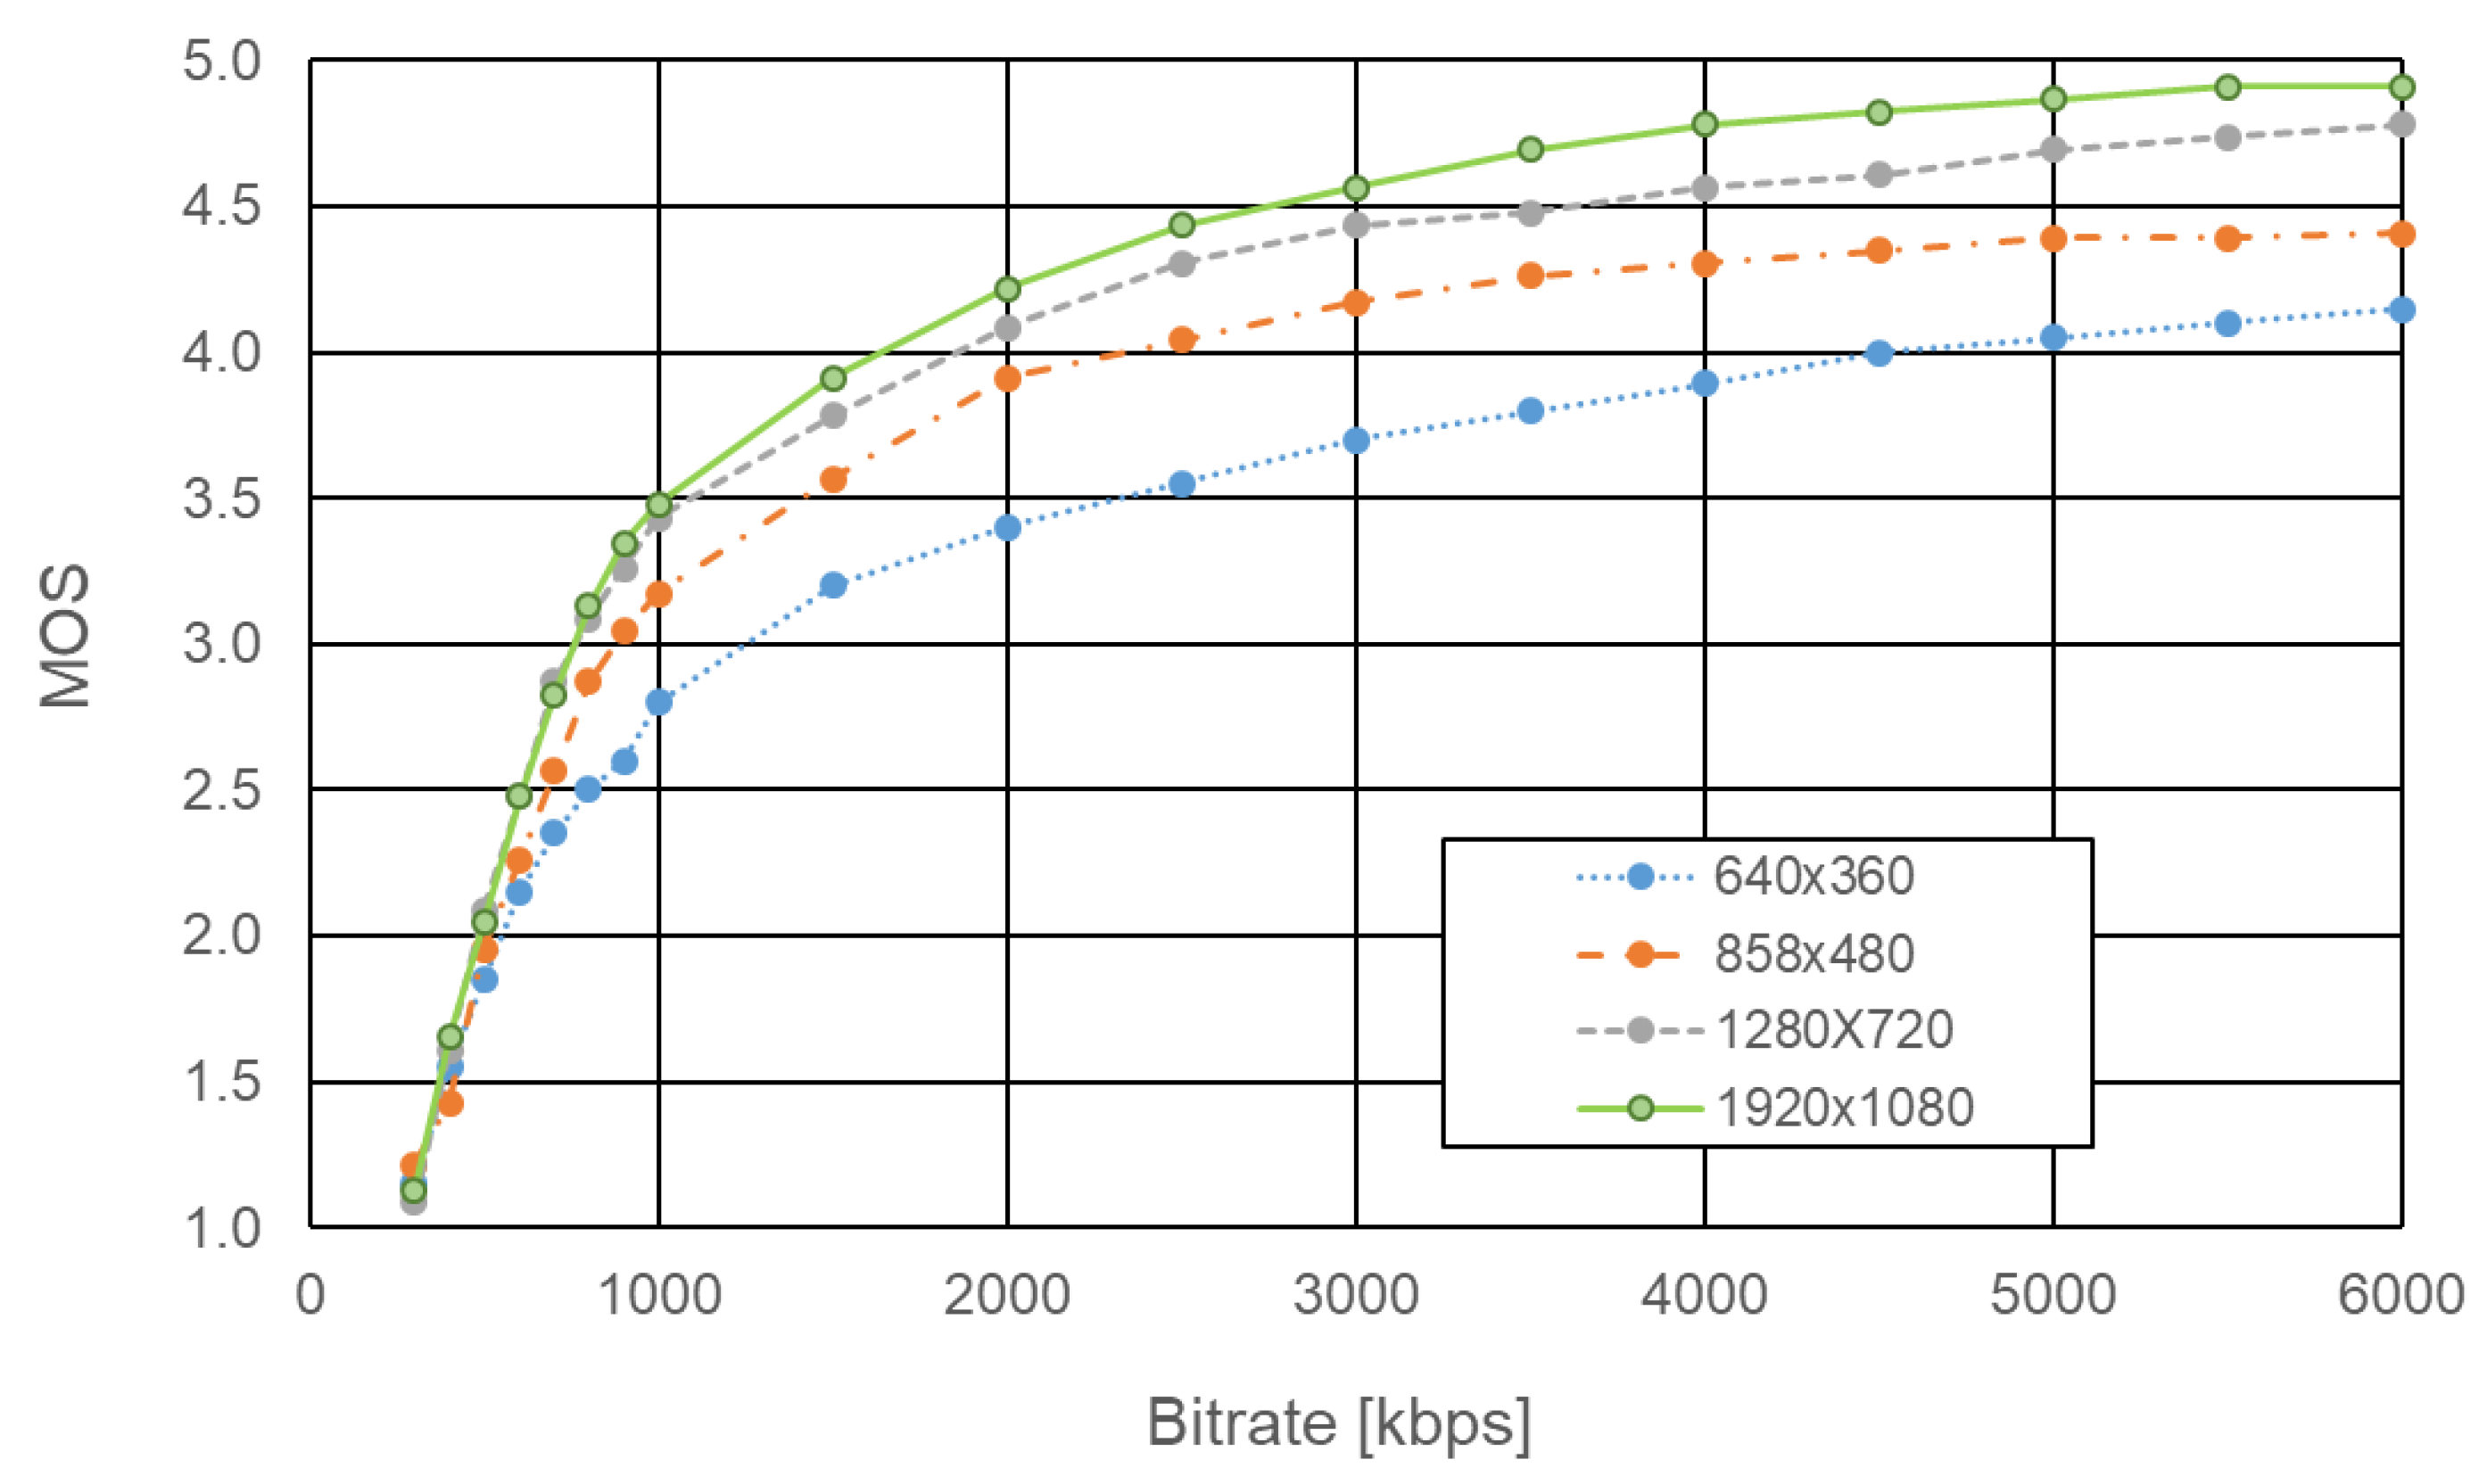
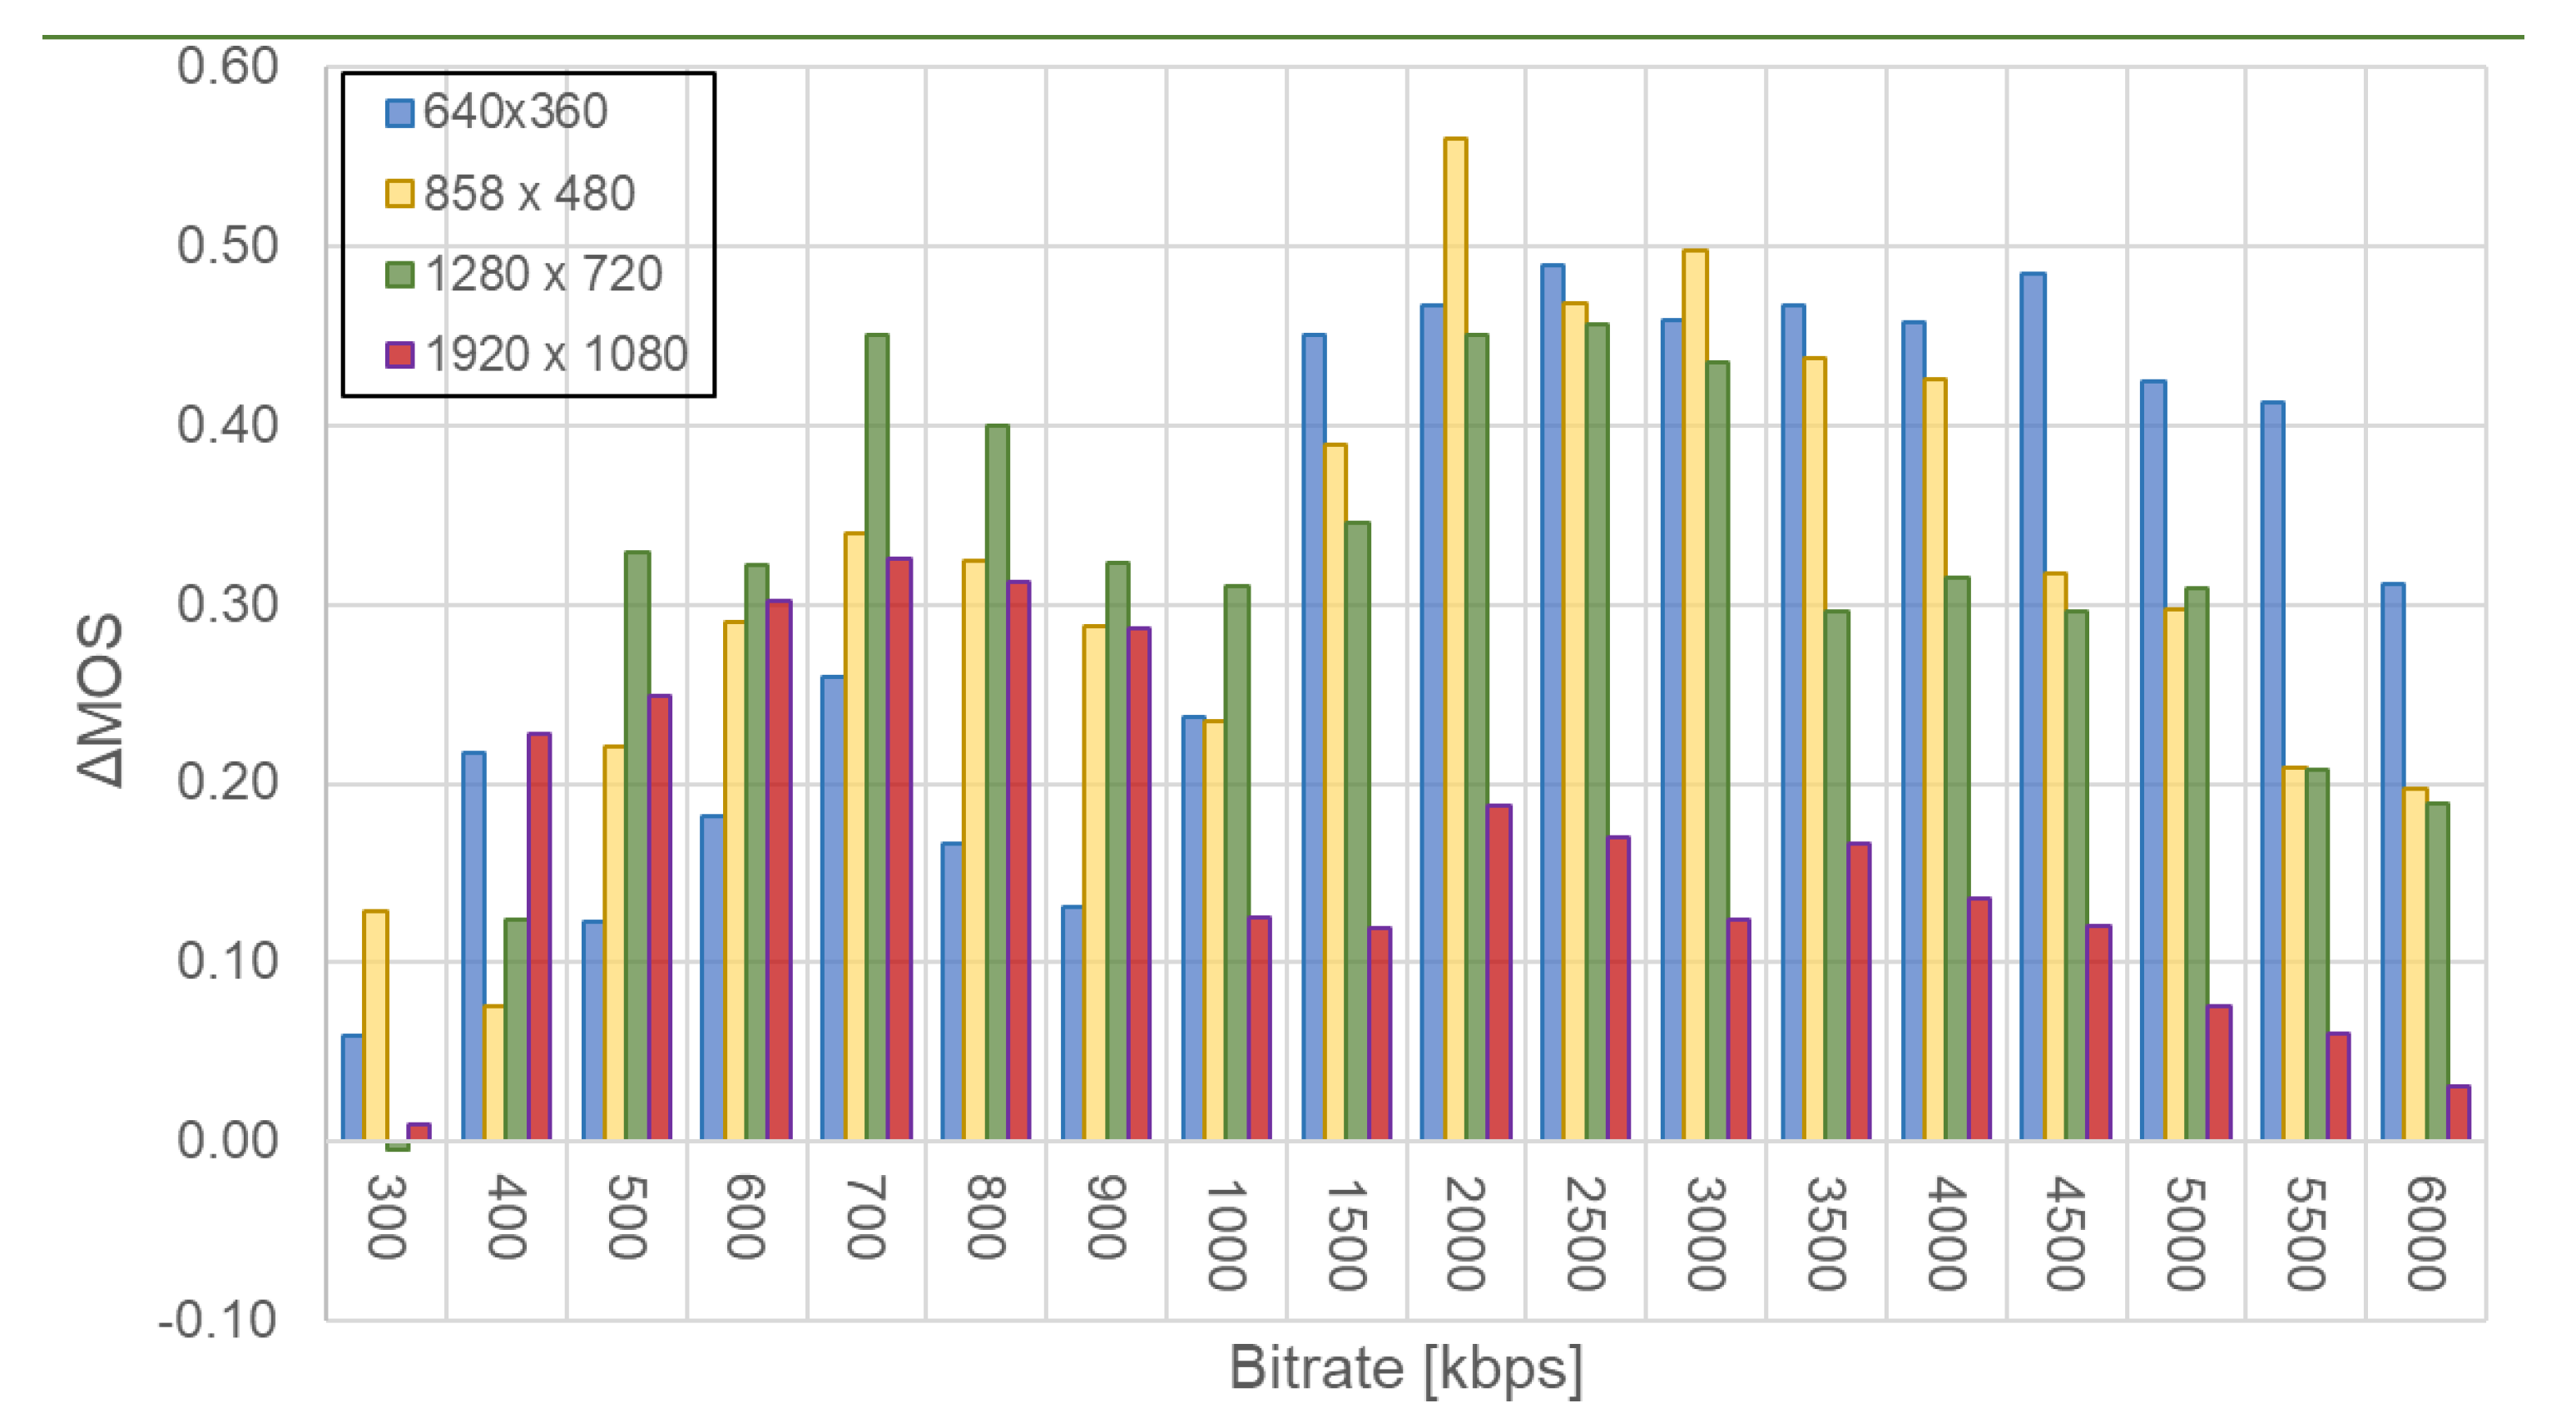
3.1. Subjective Quality Assessment of Video Encoded Using H.264 Standard
- -
- 640 × 360; t = 17.6 > t α = 2.1, at α = 0.05;
- -
- 858 × 480; t = 14.9 > t α = 2.1, at α = 0.05;
- -
- 1280 × 720; t = 10.7 > t α = 2.1, at α = 0.05;
- -
- 1920 × 1080; t = 2.9 > t α = 2.1, with α = 0.05.
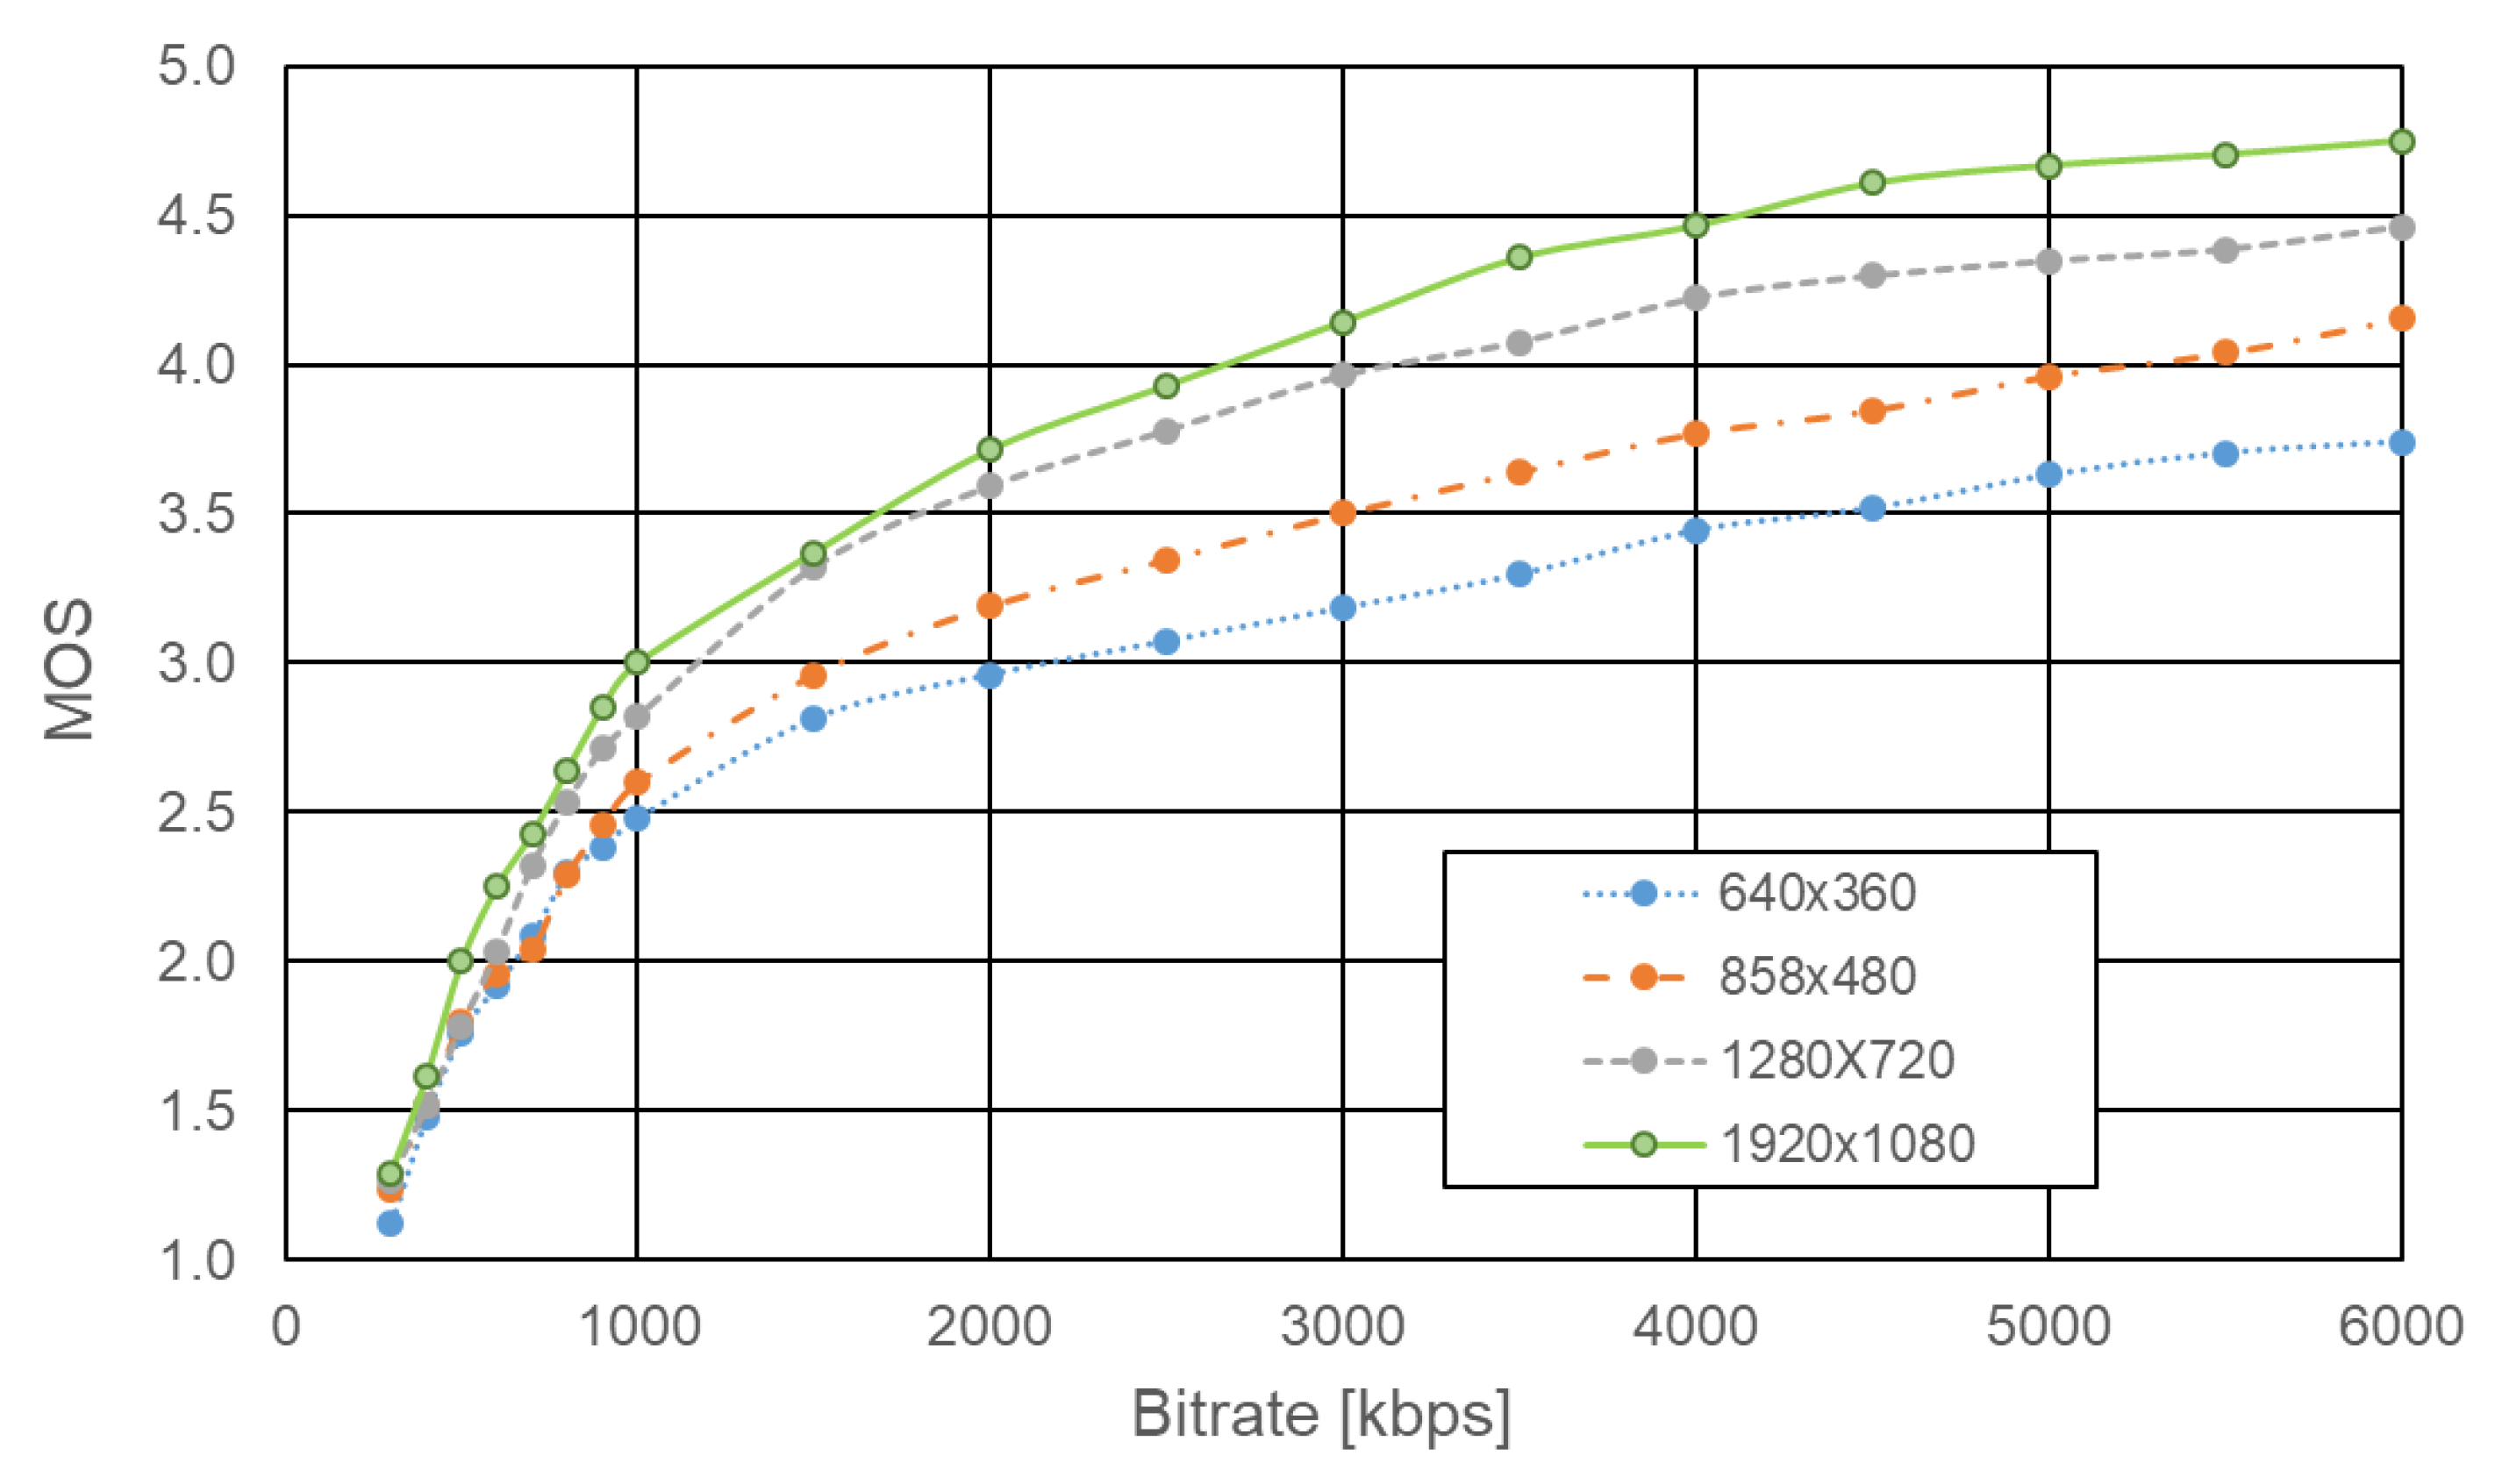
3.2. Subjective Quality Assessment of Video Encoded Using H.265 Standard
- -
- 640 × 360; t = 9.1 > t α = 2.1, at α = 0.05;
- -
- 858 × 480; t = 10.4 > t α = 2.1, at α = 0.05;
- -
- 1280 × 720; t = 10.9 > t α = 2.1, at α = 0.05;
- -
- 1920 × 1080; t = 7.3 > t α = 2.1, at α = 0.05.
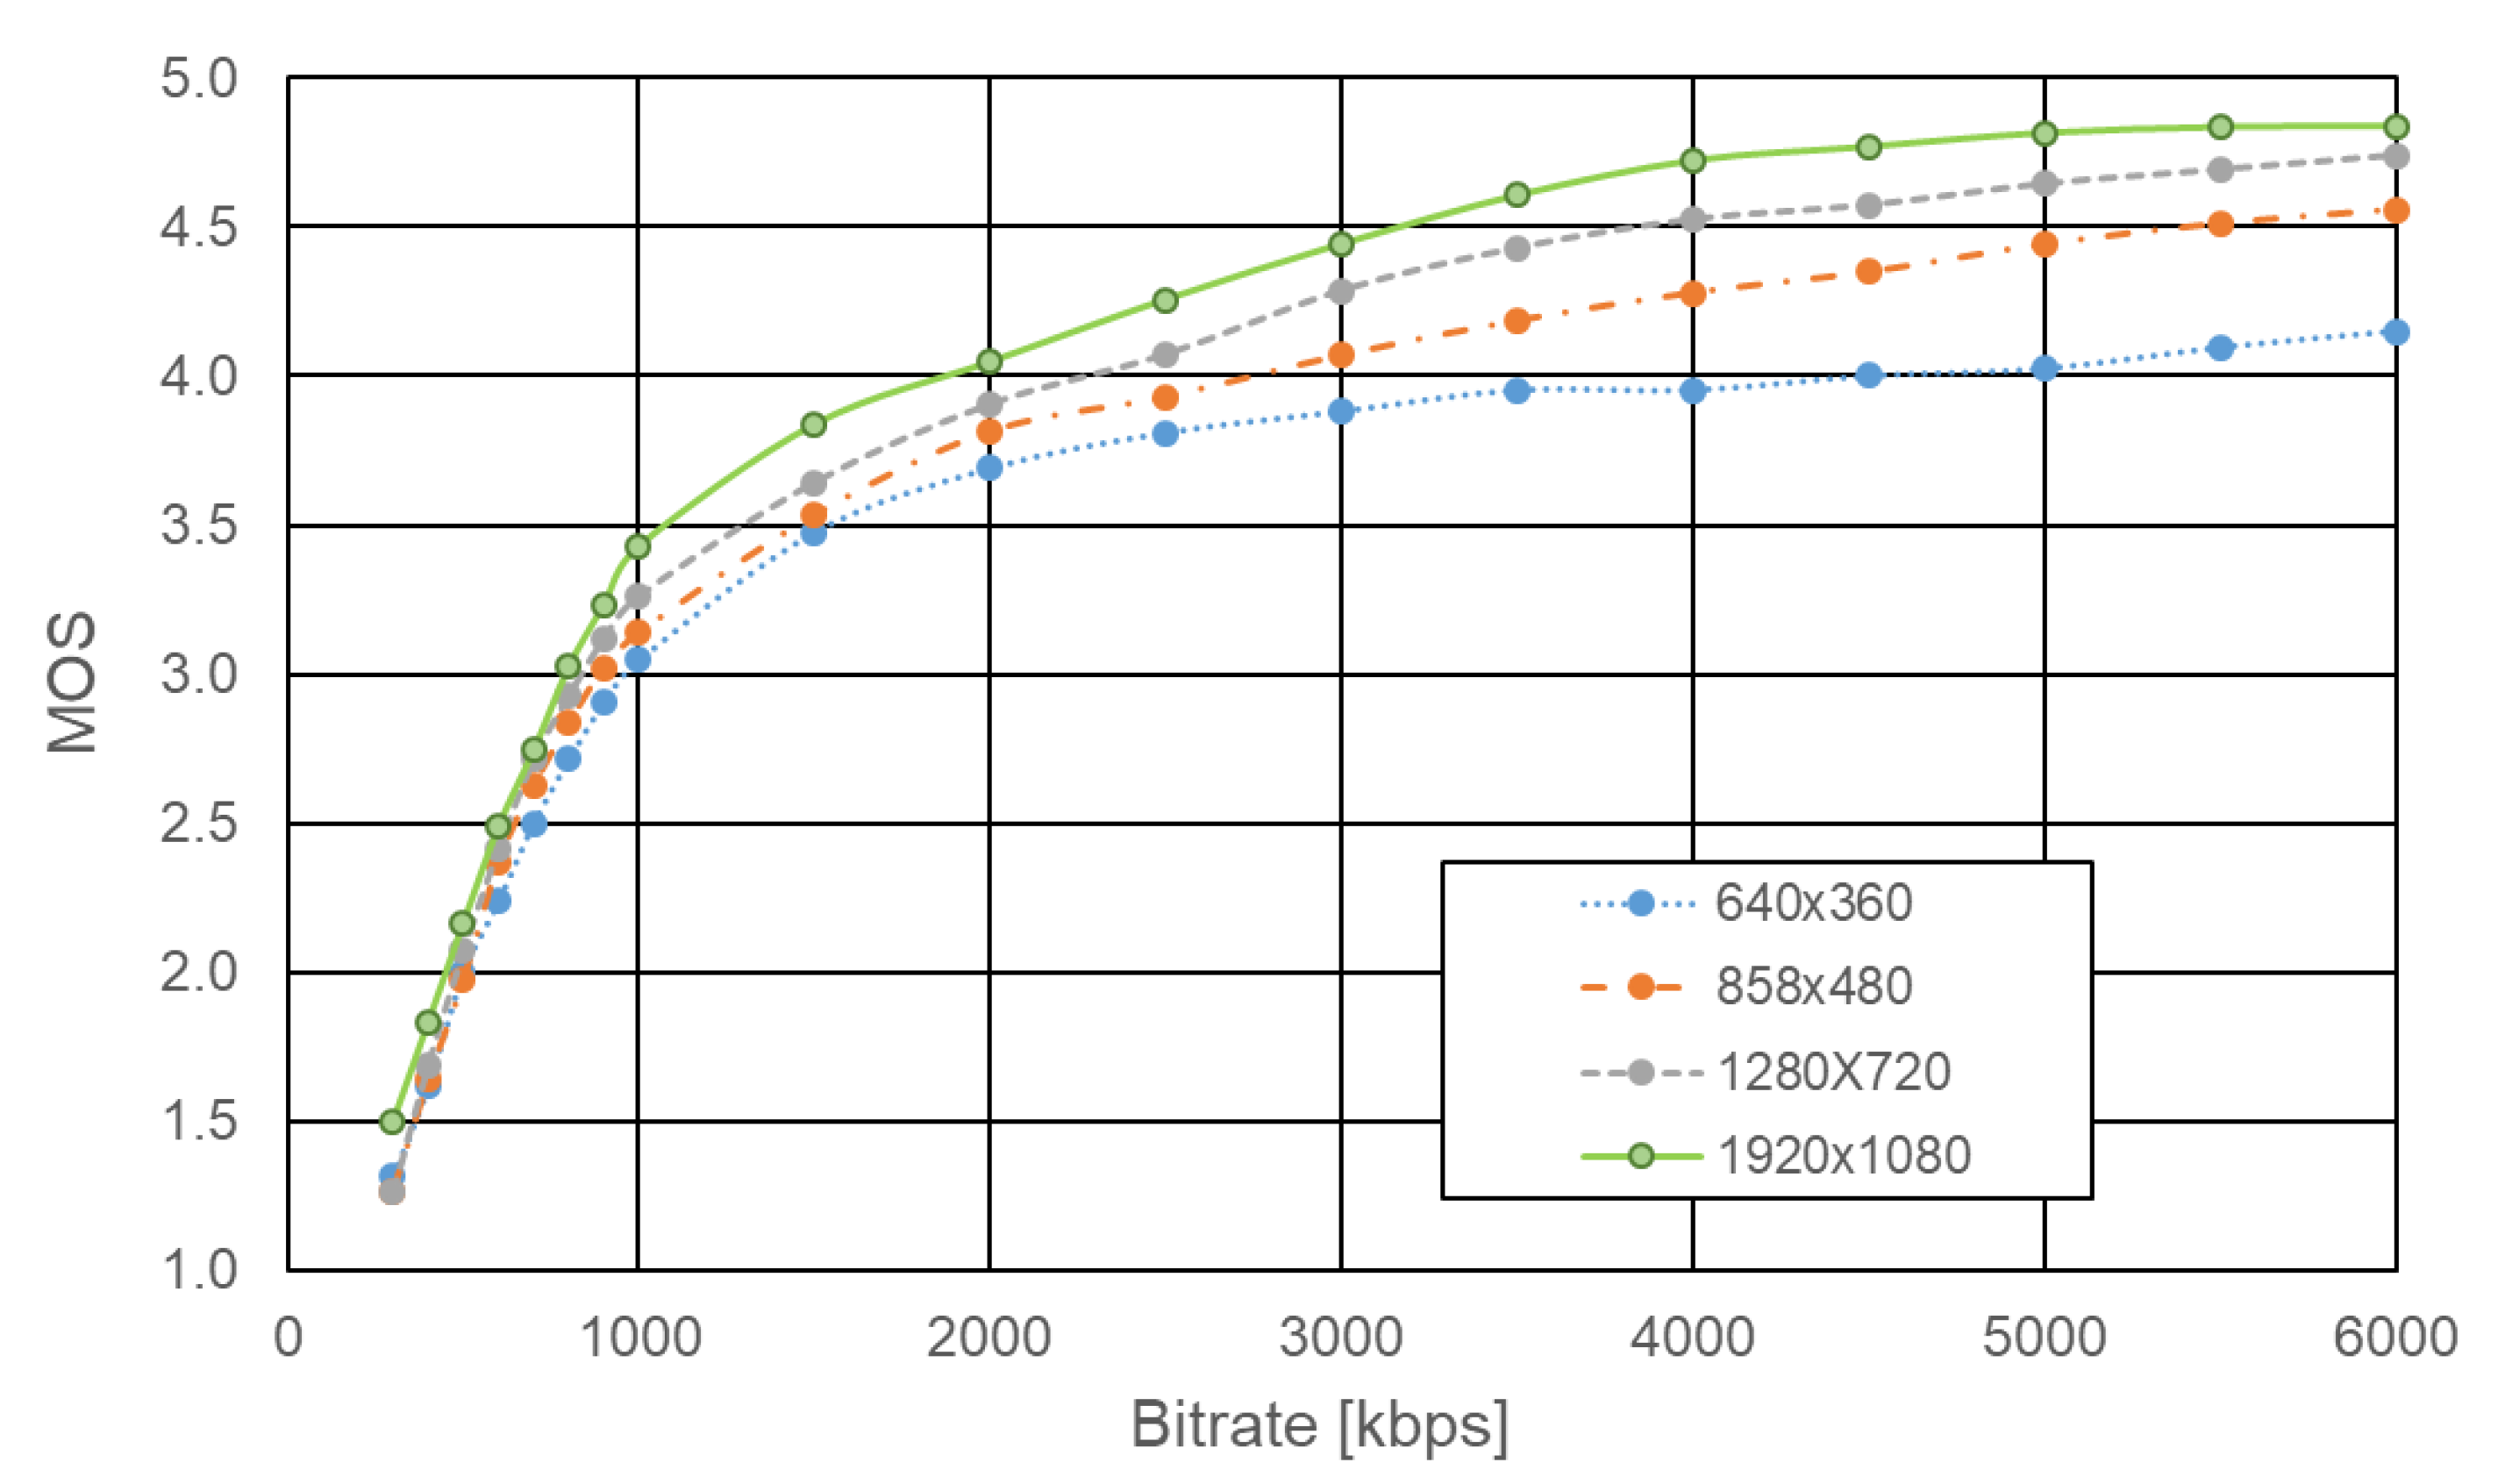
3.3. Subjective Quality Assessment of Video Encoded Using VP9 Standard
- -
- 640 × 360; t = 11.1 > t α = 2.1, at α = 0.05;
- -
- 858 × 480; t = 11.3 > t α = 2.1, at α = 0.05;
- -
- 1280 × 720; t = 13.0 > t α = 2.1, at α = 0.05;
- -
- 1920 × 1080; t = 10.5 > t α = 2.1, at α = 0.05.
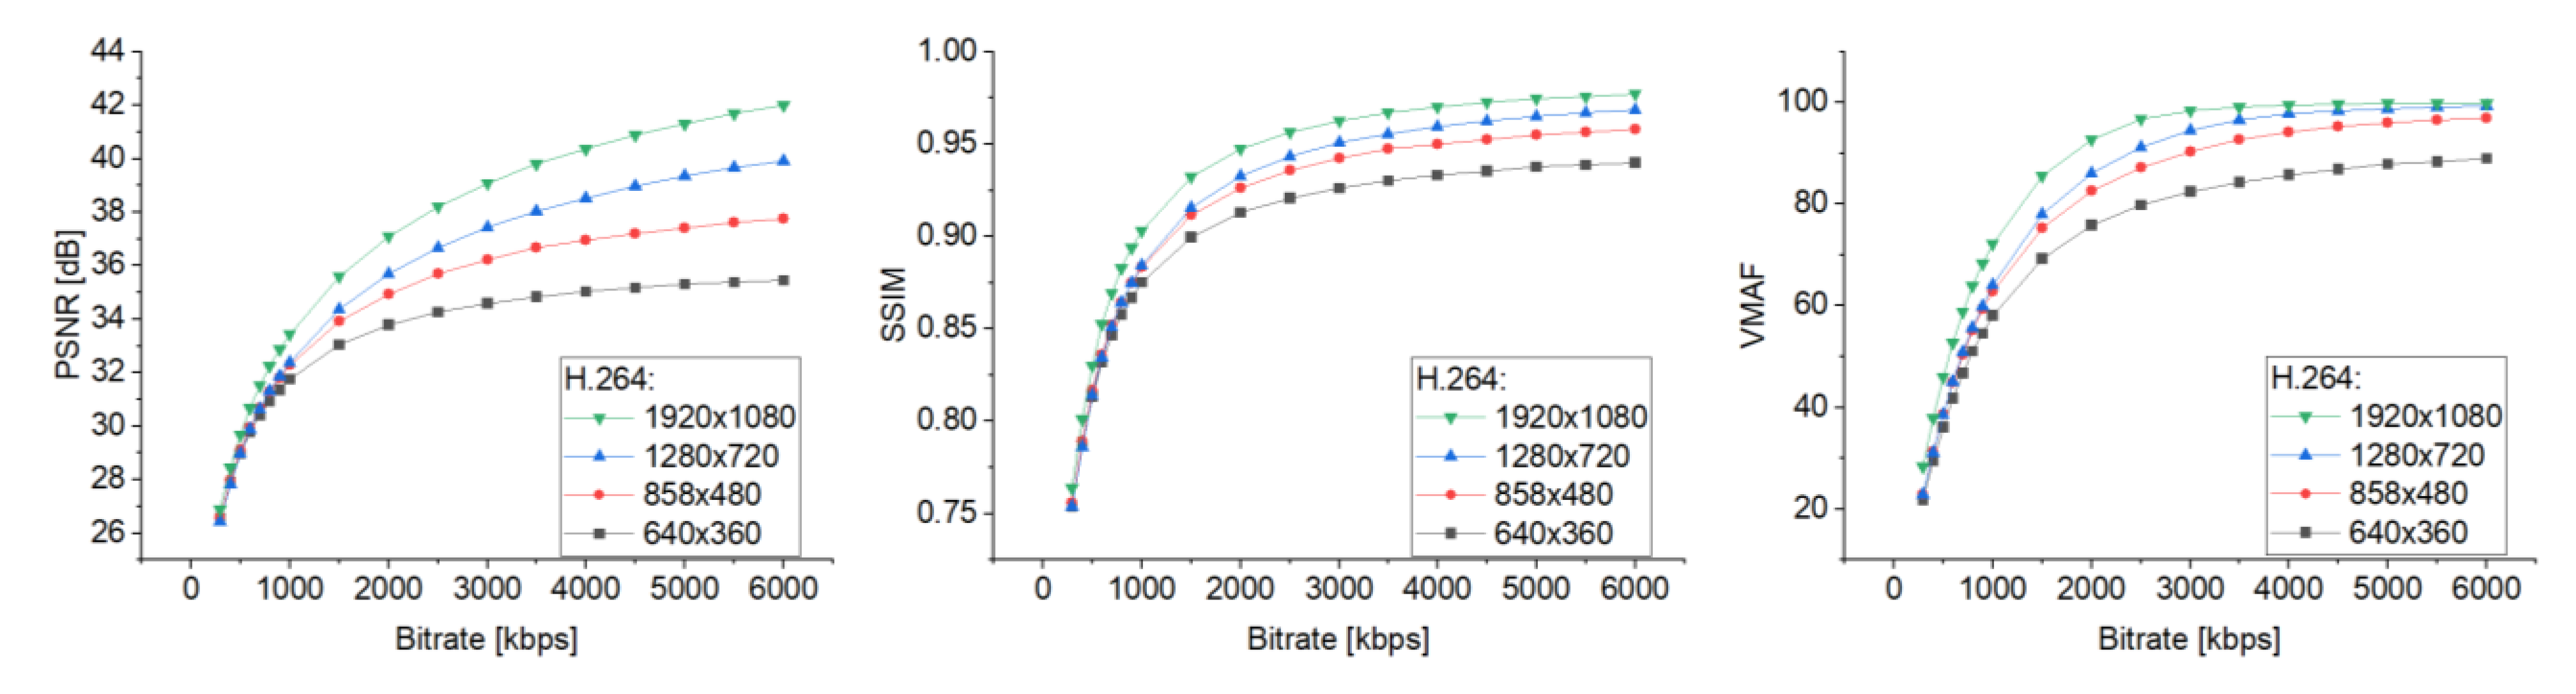
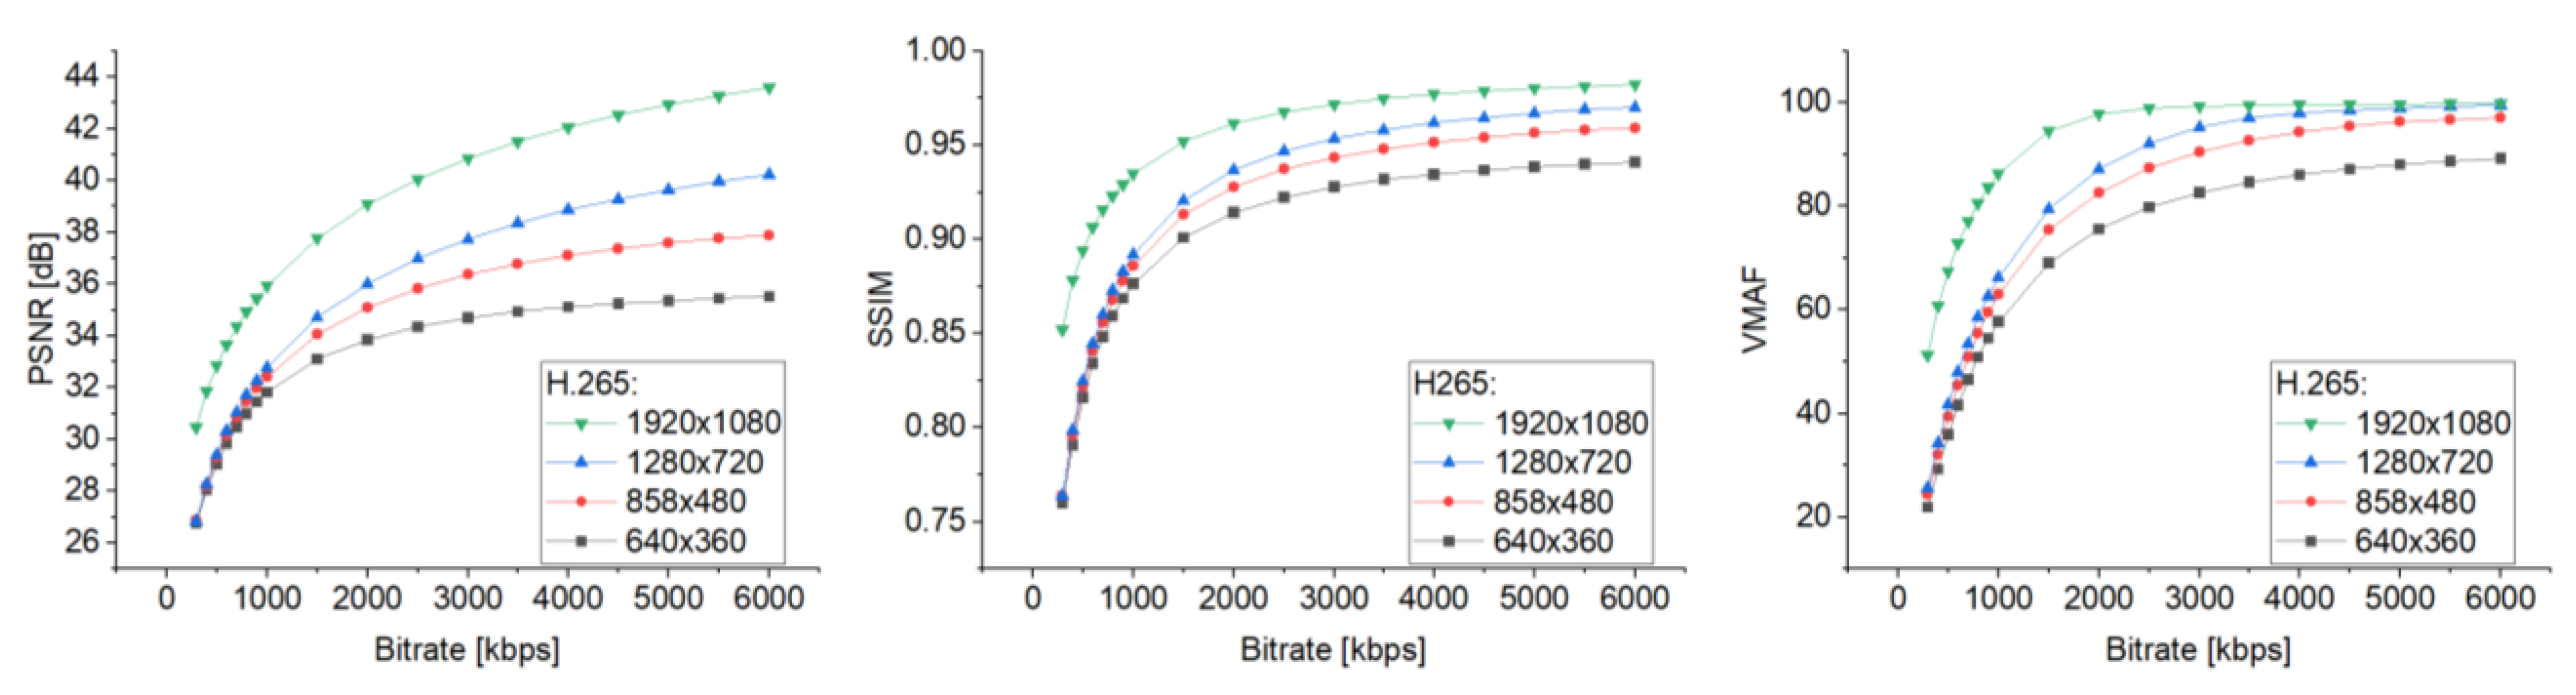
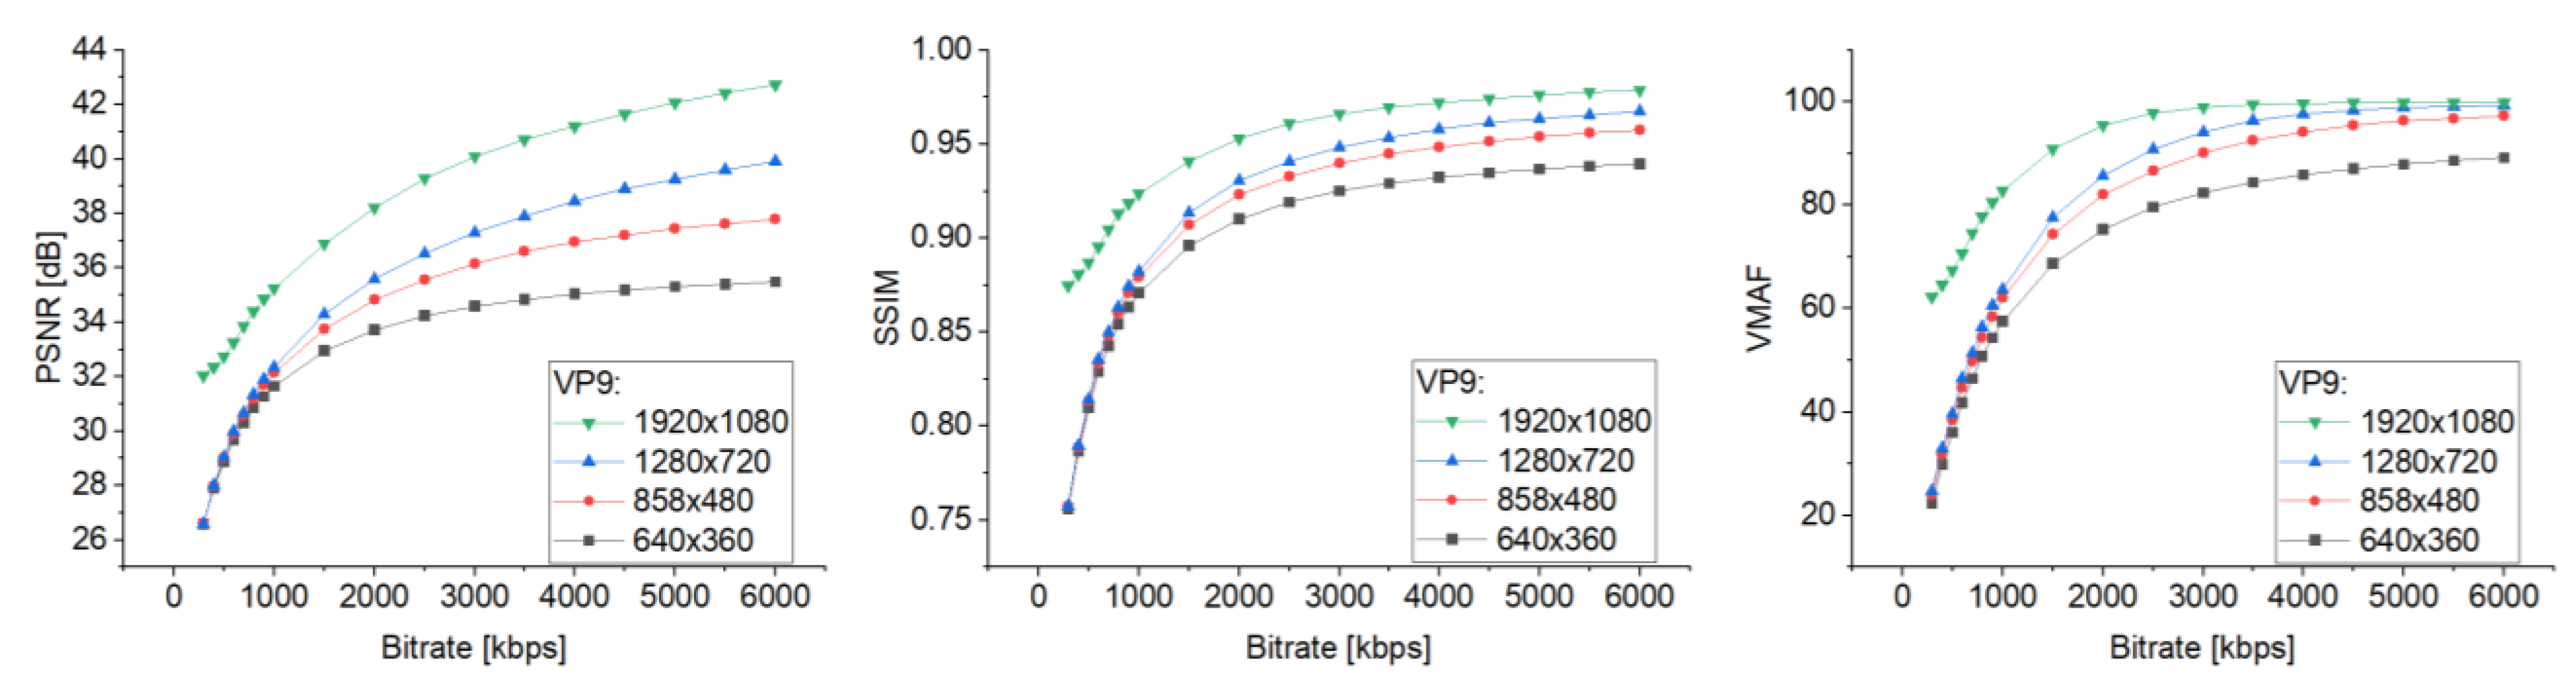
3.4. Objective Quality Assessment of Video Encoded Using H.264, H.265, and VP9 Standards
- For the H.264 codec: from 0.9 to 0.996;
- For the H.265 codec: from 0.931 to 0.998;
- For the VP9 codec: from 0.905 to 0.998.
4. Conclusions
Author Contributions
Funding
Informed Consent Statement
Data Availability Statement
Acknowledgments
Conflicts of Interest
References
- ITU-R BT 500-14; Methodologies for the Subjective Assessment of the Quality of Television Images. ITU: Geneva, Switzerland, 2020.
- Fela, R.F.; Zacharov, N.; Forchhammer, S. Comparison of Full Factorial and Optimal Experimental Design for Perceptual Evaluation of Audiovisual Quality. J. Audio Eng. Soc. 2023, 71, 4–19. [Google Scholar] [CrossRef]
- Barman, N.; Martini, M.G. QoE Modeling for HTTP Adaptive Video Streaming–A Survey and Open Challenges. IEEE Access 2019, 7, 30831–30859. [Google Scholar] [CrossRef]
- Wang, Z.; Bovik, A.C. Mean squared error: Love it or leave it? A new look at Signal Fidelity Measures. IEEE Signal Process. Mag. 2009, 26, 98–117. [Google Scholar] [CrossRef]
- Huynh-Thu, Q.; Ghanbari, M. The accuracy of PSNR in predicting video quality for different video scenes and frame rates. Telecommun. Syst. 2012, 49, 35–48. [Google Scholar] [CrossRef]
- Klink, J.; Uhl, T. Video Quality Assessment: Some Remarks on Selected Objective Metrics. In Proceedings of the 2020 28th International Conference Software, Telecommun. Comput. Networks, SoftCOM, Split, Croatia, 17–19 September 2020. [Google Scholar]
- Vranjes, M.; Rimac-Drlje, S.; Zagar, D. Objective video quality metrics. In Proceedings of the ELMAR 2007, Zadar, Croatia, 12–14 September 200; pp. 45–49. [CrossRef]
- Kotevski, Z.; Mitrevski, P. Performance Assessment of Metrics for Video Quality Estimation. In Proceedings of the International Scientific Conference on Information, Communication and Energy Systems and Technologies, Macedonia, Greece, 23–26 June 2010; pp. 693–696. [Google Scholar]
- Chikkerur, S.; Sundaram, V.; Reisslein, M.; Karam, L.J. Objective video quality assessment methods: A classification, review, and performance comparison. IEEE Trans. Broadcast. 2011, 57, 165–182. [Google Scholar] [CrossRef]
- Akramullah, S.; Akramullah, S. Video quality metrics. In Digital Video Concepts, Methods, and Metrics; Apress: New York, NY, USA, 2014; pp. 101–160. [Google Scholar]
- Chen, Y.; Wu, K.; Zhang, Q. From QoS to QoE: A Tutorial on Video Quality Assessment. IEEE Commun. Surv. Tutor. 2015, 17, 1126–1165. [Google Scholar] [CrossRef]
- Hanhart, P.; Korshunov, P.; Ebrahimi, T. Benchmarking of quality metrics on ultra-high definition video sequences. In Proceedings of the 2013 18th International Conference on Digital Signal Processing (DSP), Santorini, Greece, 1–3 July 2013; pp. 1–8. [Google Scholar]
- Hanhart, P.; Bernardo, M.V.; Pereira, M.; Pinheiro, A.M.G.; Ebrahimi, T. Benchmarking of objective quality metrics for HDR image quality assessment. EURASIP J. Image Video Process. 2015, 2015, 39. [Google Scholar] [CrossRef]
- Klink, J. A Method of Codec Comparison and Selection for Good Quality Video Transmission Over Limited-Bandwidth Networks. Sensors 2021, 21, 4589. [Google Scholar] [CrossRef]
- Barman, N.; Martini, M.G. H. 264/MPEG-AVC, H. 265/MPEG-HEVC and VP9 codec comparison for live gaming video streaming. In Proceedings of the 2017 Ninth International Conference on Quality of Multimedia Experience (QoMEX), Erfurt, Germany, 31 May–2 June 2017; pp. 1–6. [Google Scholar]
- You, J.; Reiter, U.; Hannuksela, M.M.; Gabbouj, M.; Perkis, A. Perceptual-based quality assessment for audio–visual services: A survey. Signal Process. Image Commun. 2010, 25, 482–501. [Google Scholar] [CrossRef]
- Akhtar, Z.; Siddique, K.; Rattani, A.; Lutfi, S.L.; Falk, T.H. Why is Multimedia Quality of Experience Assessment a Challenging Problem? IEEE Access 2017, 7, 117897–117915. [Google Scholar] [CrossRef]
- Rassool, R. VMAF reproducibility: Validating a perceptual practical video quality metric. In Proceedings of the 2017 IEEE International Symposium on Broadband Multimedia Systems and Broadcasting (BMSB), Cagliari, Italy, 7–9 June 2017; pp. 1–2. [Google Scholar]
- Moldovan, A.-N.; Ghergulescu, I.; Muntean, C.H. VQAMap: A Novel Mechanism for Mapping Objective Video Quality Metrics to Subjective MOS Scale. IEEE Trans. Broadcast. 2016, 62, 610–627. [Google Scholar] [CrossRef]
- Bentaleb, A.; Taani, B.; Begen, A.C.; Timmerer, C.; Zimmermann, R. A Survey on Bitrate Adaptation Schemes for Streaming Media Over HTTP. IEEE Commun. Surv. Tutor. 2018, 21, 562–585. [Google Scholar] [CrossRef]
- Sani, Y.; Mauthe, A.; Edwards, C. Adaptive Bitrate Selection: A Survey. IEEE Commun. Surv. Tutor. 2017, 19, 2985–3014. [Google Scholar] [CrossRef]
- Zabrovskiy, A.; Feldmann, C.; Timmerer, C. Multi-codec DASH dataset. In Proceedings of the 9th ACM Multimedia Systems Conference, Amsterdam, The Netherlands, 12–15 June 2018; pp. 438–443. [Google Scholar]
- Tanchenko, A. Visual-PSNR measure of image quality. J. Vis. Commun. Image Represent. 2014, 25, 874–878. [Google Scholar] [CrossRef]
- Wang, Z.; Bovik, A.C.; Sheikh, H.R.; Simoncelli, E.P. Image Quality Assessment: From Error Visibility to Structural Similarity. IEEE Trans. Image Process. 2004, 13, 600–612. [Google Scholar] [CrossRef]
- Bampis, C.G.; Li, Z.; Bovik, A.C. Spatiotemporal Feature Integration and Model Fusion for Full Reference Video Quality Assessment. IEEE Trans. Circuits Syst. Video Technol. 2018, 29, 2256–2270. [Google Scholar] [CrossRef]
- Wang, Z.; Bovik, A.C. A universal image quality index. IEEE Signal Process. Lett. 2002, 9, 81–84. [Google Scholar] [CrossRef]
- Li, L.; Lin, W.; Wang, X.; Yang, G.; Bahrami, K.; Kot, A.C. No-Reference Image Blur Assessment Based on Discrete Orthogonal Moments. IEEE Trans. Cybern. 2015, 46, 39–50. [Google Scholar] [CrossRef]
- Li, L.; Zhu, H.; Yang, G.; Qian, J. Referenceless Measure of Blocking Artifacts by Tchebichef Kernel Analysis. IEEE Signal Process. Lett. 2013, 21, 122–125. [Google Scholar] [CrossRef]
- Liu, H.; Klomp, N.; Heynderickx, I. A No-Reference Metric for Perceived Ringing Artifacts in Images. IEEE Trans. Circuits Syst. Video Technol. 2009, 20, 529–539. [Google Scholar] [CrossRef]
- Zhu, H.; Li, L.; Wu, J.; Dong, W.; Shi, G. MetaIQA: Deep meta-learning for no-reference image quality assessment. In Proceedings of the IEEE/CVF Conference on Computer Vision and Pattern Recognition, Seattle, WA, USA, 14 June 2020–19 June 2020; pp. 14143–14152. [Google Scholar]
- Kang, L.; Ye, P.; Li, Y.; Doermann, D. Convolutional neural networks for no-reference image quality assessment. In Proceedings of the 2014 IEEE Computer Vision and Pattern Recognition, Columbus, OH, USA, 23–28 June 2014; pp. 1733–1740. [Google Scholar]
- Bosse, S.; Maniry, D.; Müller, K.R.; Wiegand, T.; Samek, W. Deep neural networks for no-reference and full-reference image quality assessment. IEEE Trans. Image Process. 2017, 27, 206–219. [Google Scholar] [CrossRef] [PubMed]
- Zhang, W.; Ma, K.; Yan, J.; Deng, D.; Wang, Z. Blind Image Quality Assessment Using a Deep Bilinear Convolutional Neural Network. IEEE Trans. Circuits Syst. Video Technol. 2018, 30, 36–47. [Google Scholar] [CrossRef]
- Sun, S.; Yu, T.; Xu, J.; Zhou, W.; Chen, Z. GraphIQA: Learning Distortion Graph Representations for Blind Image Quality Assessment. IEEE Trans. Multimedia 2022, 14, 1–14. [Google Scholar] [CrossRef]
- Liu, J.; Zhou, W.; Li, X.; Xu, J.; Chen, Z. LIQA: Lifelong Blind Image Quality Assessment. IEEE Trans. Multimedia 2022, 14, 1–13. [Google Scholar] [CrossRef]
- ITU-T Rec; H.264. Audiovisual and Multimedia Systems: Infrastructure of Audiovisual Services-Coding of Moving Video, Advanced Video Coding for Generic Audiovisual Services. International Telecommunication Union: Geneva, Switzerland, 2021.
- ITU-T Rec; H.265. Infrastructure of Audiovisual Services—Coding of Moving Video. High Efficiency Video Coding. International Telecommunication Union: Geneva, Switzerland, 2021.
- Grange, A.; De Rivaz, P.; Hunt, J. VP9 Bitstream Decoding Process Specification. WebM Project. 2016. Available online: http://downloads.webmproject.org.storage.googleapis.com/docs/vp9/vp9-bitstream-specification-v0.6-20160331-draft.pdf (accessed on 25 February 2023).
- ITU-T Rec; P.910. Subjective Video Quality Assessment Methods for Multimedia Applications. International Telecommunication Union: Geneva, Switzerland, 2021.
- Mukherjee, D.; Bankoski, J.; Grange, A.; Han, J.; Koleszar, J.; Wilkins, P.; Xu, Y.; Bultje, R. The latest open-source video codec VP9—An overview and preliminary results. In Proceedings of the 2013 Picture Coding Symposium, San Jose, CA, USA, 8–11 December 2013; pp. 390–393. [Google Scholar] [CrossRef]
- Winkler, S. Video quality measurement standards—Current status and trends. In Proceedings of the 2009 7th International Conference on Information, Communications and Signal Processing (ICICS), Macau, China, 8–10 December 2009; pp. 1–5. [Google Scholar]
- Winkler, S. On the properties of subjective ratings in video quality experiments. In Proceedings of the 2009 International Workshop on Quality of Multimedia Experience, Lippstadt, Germany, 5–7 September 2022; pp. 139–144. [Google Scholar] [CrossRef]
- ITU-T Recommendation P.913; Methods for the Subjective Assessment of Video Quality, Audio Quality and Audiovisual Quality of Internet Video and Distribution Quality Television in Any Environment. ITU: Geneva, Switzerland, 2021.
- Harysandi, D.K.; Oktaviani, R.; Meylani, L.; Vonnisa, M.; Hashiguchi, H.; Shimomai, T.; Aris, N.A.M. International Telecommunication Union-Radiocommunication Sector P. 837-6 and P. 837-7 performance to estimate Indonesian rainfall. Telkomnika 2020, 18, 2292–2303. [Google Scholar]
- ITU-R BT 709-6; Parameter Values for the HDTV Standards for Production and International Programme Exchange BT Series Broadcasting Service. ITU: Geneva, Switzerland, 2015.
- Taha, M.; Ali, A.; Lloret, J.; Gondim, P.R.L.; Canovas, A. An automated model for the assessment of QoE of adaptive video streaming over wireless networks. Multimedia Tools Appl. 2021, 80, 26833–26854. [Google Scholar] [CrossRef]
- Mercat, A.; Viitanen, M.; Vanne, J. UVG dataset: 50/120fps 4K sequences for video codec analysis and development. In Proceedings of the 11th ACM Multimedia Systems Conference, Istanbul, Turkey, 8– 11 June 2020; pp. 297–302. [Google Scholar]
- FFmpeg: A Complete, Cross -Platform Solution to Record, Convert and Stream Audio and Video. Available online: https://ffmpeg.org/ (accessed on 25 February 2023).
- Brachmański, S.; Klink, J. Subjective Assessment of the Quality of Video Sequences by the Young Viewers. In Proceedings of the 30 th International Conference on Software, Telecommunications and Computer Networks (SoftCOM 2022), Split, Croatia, 22–24 September 2022; pp. 1–6. [Google Scholar]


| Bit Rate | 640 × 360 | 858 × 480 | 1280 × 720 | 1920 × 1080 | ||||||||
|---|---|---|---|---|---|---|---|---|---|---|---|---|
| (kbps) | MOS | S | δ | MOS | S | δ | MOS | S | δ | MOS | S | δ |
| 300 | 1.00 | 0.00 | 0.00 | 1.00 | 0.00 | 0.00 | 1.00 | 0.00 | 0.00 | 1.05 | 0.23 | 0.10 |
| 400 | 1.11 | 0.32 | 0.15 | 1.21 | 0.42 | 0.19 | 1.26 | 0.45 | 0.20 | 1.26 | 0.45 | 0.20 |
| 500 | 1.50 | 0.51 | 0.24 | 1.42 | 0.69 | 0.31 | 1.58 | 0.69 | 0.31 | 1.42 | 0.51 | 0.23 |
| 600 | 1.74 | 0.73 | 0.33 | 1.72 | 0.57 | 0.27 | 1.84 | 0.60 | 0.27 | 1.68 | 0.48 | 0.21 |
| 700 | 1.94 | 0.73 | 0.34 | 2.11 | 0.58 | 0.27 | 2.11 | 0.57 | 0.26 | 1.89 | 0.32 | 0.14 |
| 800 | 2.33 | 0.49 | 0.22 | 2.26 | 0.65 | 0.29 | 2.39 | 0.70 | 0.32 | 2.21 | 0.54 | 0.24 |
| 900 | 2.42 | 0.51 | 0.23 | 2.47 | 0.62 | 0.30 | 2.61 | 0.70 | 0.32 | 2.58 | 0.51 | 0.23 |
| 1000 | 2.71 | 0.92 | 0.44 | 2.79 | 0.54 | 0.24 | 2.83 | 0.62 | 0.29 | 2.84 | 0.50 | 0.23 |
| 1500 | 2.89 | 0.88 | 0.39 | 3.00 | 0.49 | 0.22 | 3.16 | 0.76 | 0.34 | 3.37 | 0.50 | 0.22 |
| 2000 | 2.95 | 0.71 | 0.32 | 3.11 | 0.68 | 0.31 | 3.50 | 0.51 | 0.24 | 3.79 | 0.63 | 0.28 |
| 2500 | 3.00 | 0.67 | 0.30 | 3.24 | 0.75 | 0.36 | 3.67 | 0.59 | 0.27 | 4.06 | 0.73 | 0.34 |
| 3000 | 3.05 | 0.62 | 0.28 | 3.33 | 0.77 | 0.35 | 3.88 | 0.78 | 0.37 | 4.28 | 0.67 | 0.31 |
| 3500 | 3.17 | 0.62 | 0.29 | 3.42 | 0.77 | 0.35 | 4.06 | 0.68 | 0.33 | 4.41 | 0.51 | 0.24 |
| 4000 | 3.22 | 0.55 | 0.25 | 3.58 | 0.84 | 0.38 | 4.11 | 0.58 | 0.27 | 4.56 | 0.51 | 0.24 |
| 4500 | 3.33 | 0.59 | 0.27 | 3.68 | 0.89 | 0.40 | 4.19 | 0.66 | 0.32 | 4.67 | 0.49 | 0.22 |
| 5000 | 3.38 | 0.72 | 0.35 | 3.84 | 0.76 | 0.34 | 4.25 | 0.58 | 0.28 | 4.78 | 0.43 | 0.20 |
| 5500 | 3.44 | 0.62 | 0.28 | 3.95 | 0.71 | 0.32 | 4.32 | 0.58 | 0.26 | 4.83 | 0.38 | 0.18 |
| 6000 | 3.57 | 0.65 | 0.34 | 4.06 | 0.73 | 0.34 | 4.37 | 0.50 | 0.22 | 4.94 | 0.24 | 0.11 |
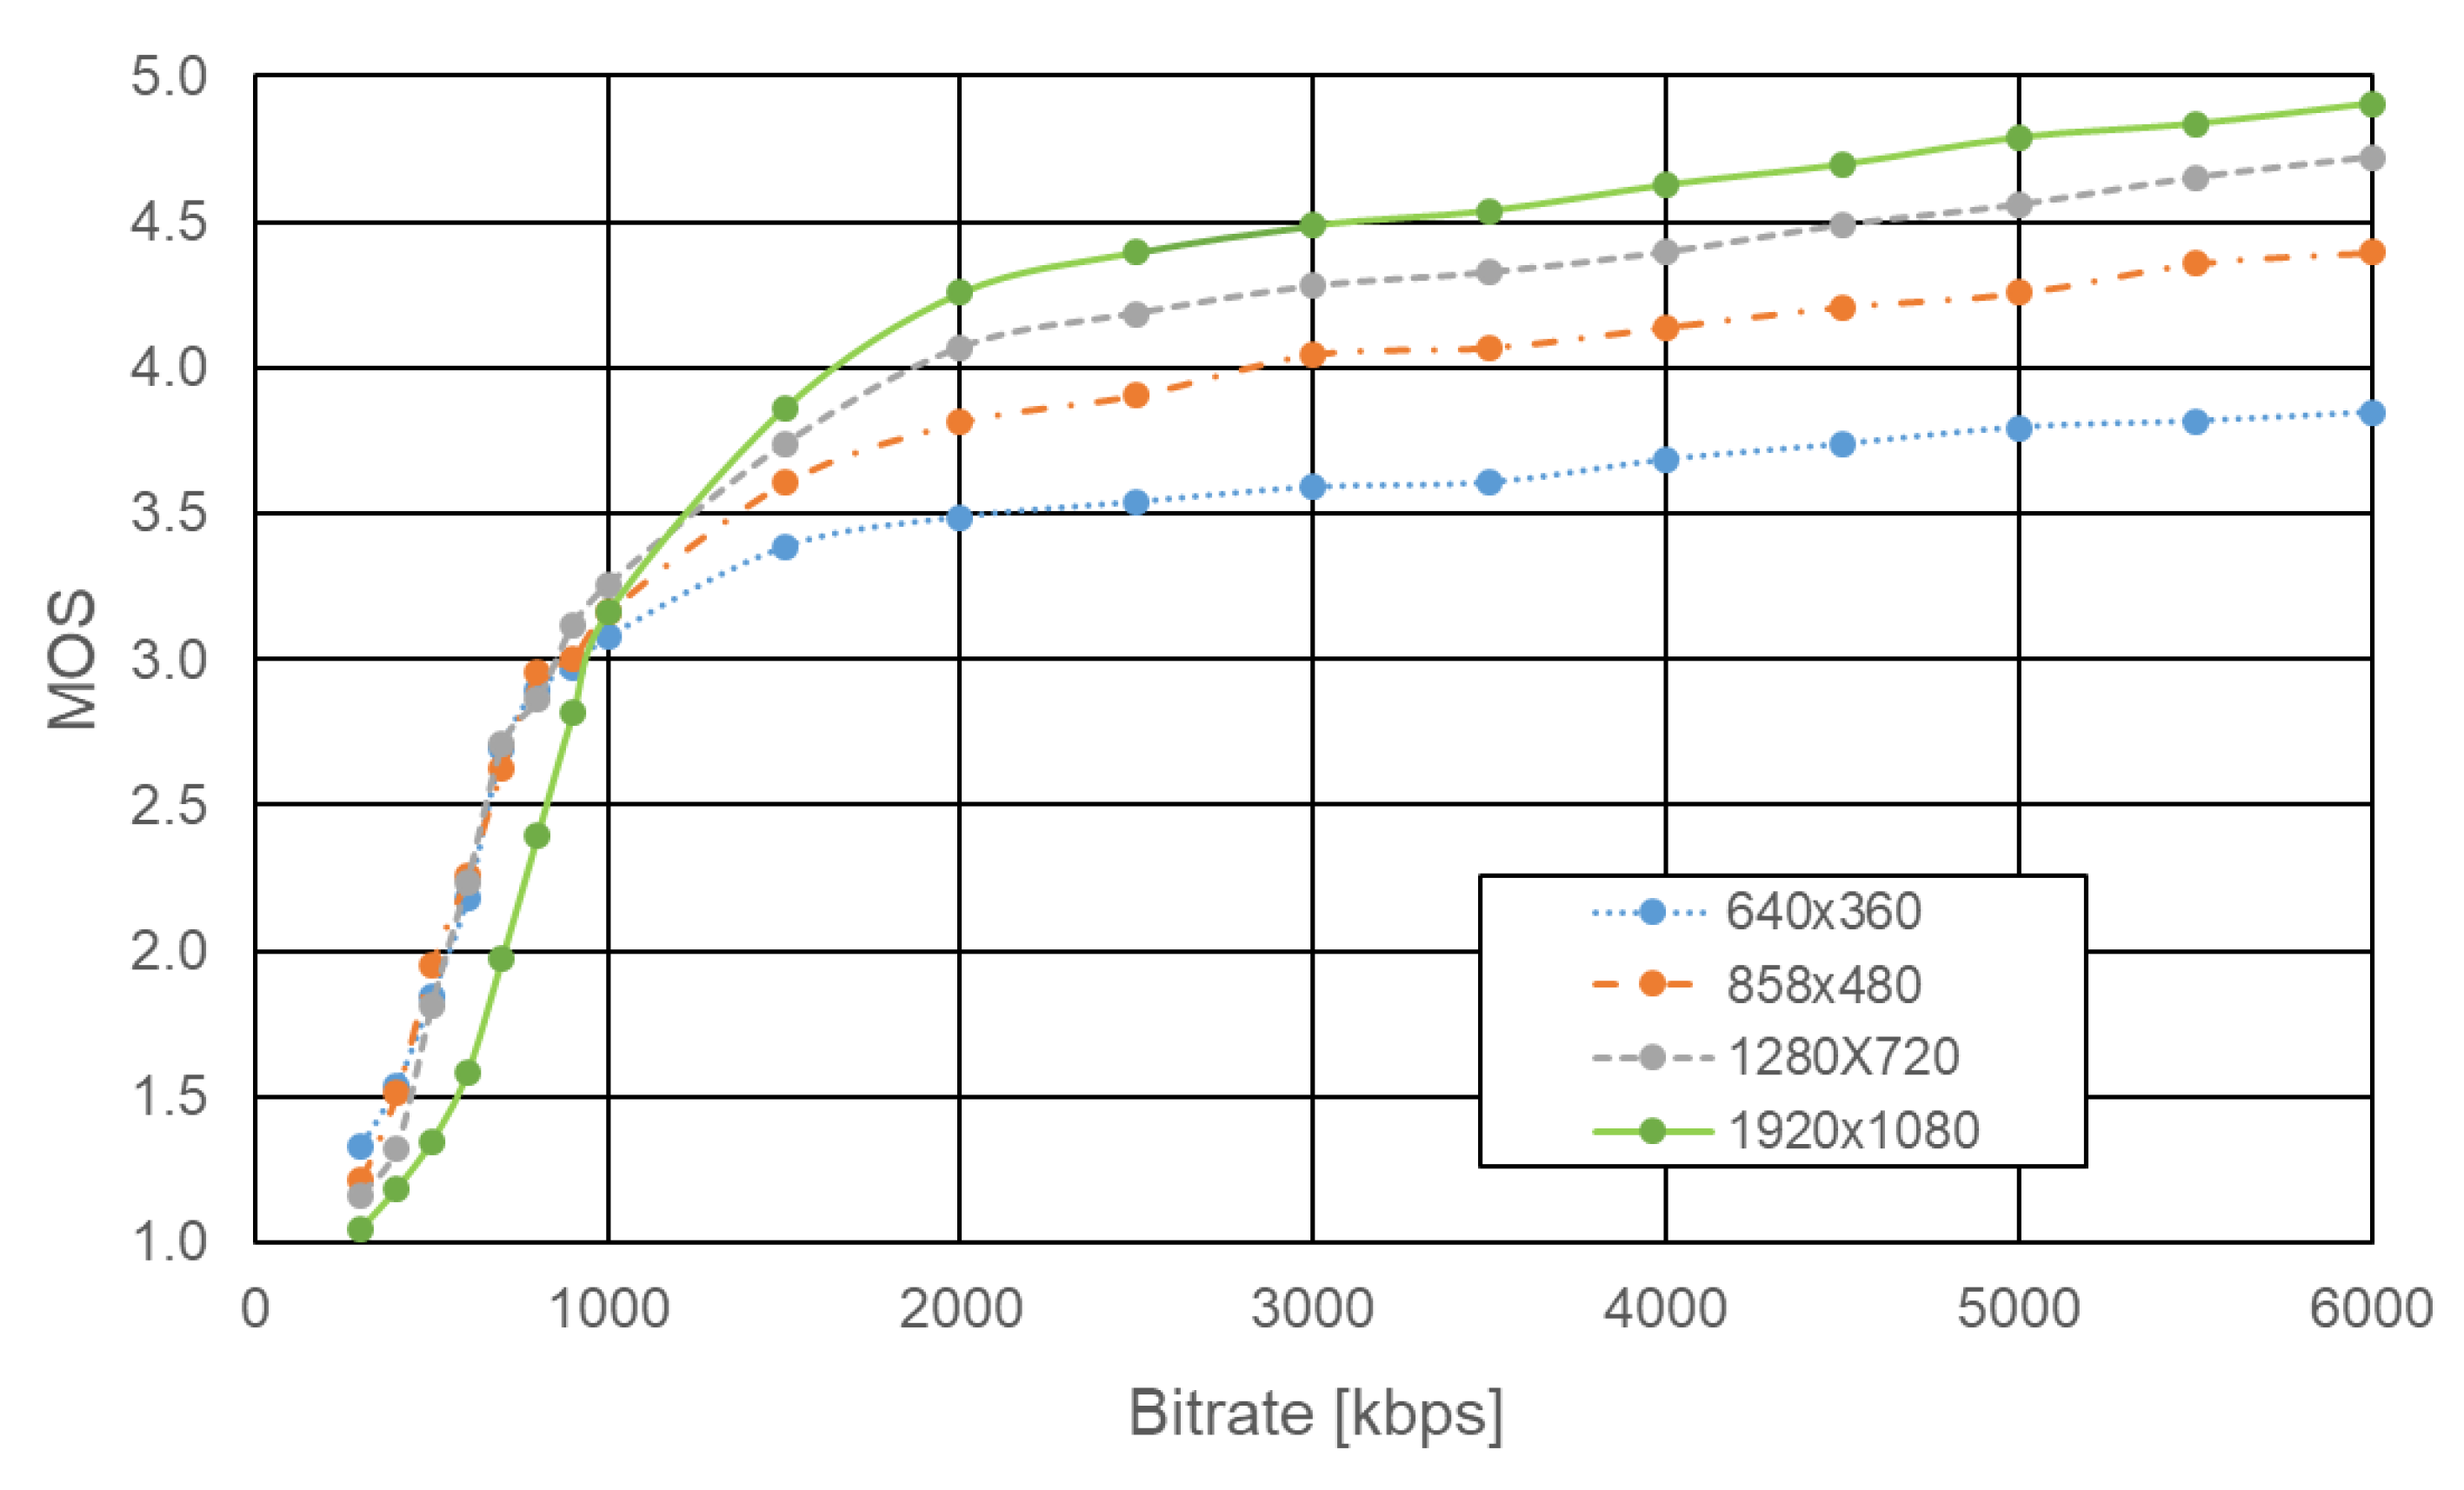
| Bit Rate | 640 × 360 | 858 × 480 | 1280 × 720 | 1920 × 1080 | ||||||||
|---|---|---|---|---|---|---|---|---|---|---|---|---|
| (kbps) | MOS | S | δ | MOS | S | δ | MOS | S | δ | MOS | S | δ |
| 300 | 1.33 | 0.48 | 0.15 | 1.21 | 0.42 | 0.13 | 1.16 | 0.43 | 0.13 | 1.05 | 0.32 | 0.10 |
| 400 | 1.54 | 0.51 | 0.16 | 1.51 | 0.55 | 0.16 | 1.33 | 0.57 | 0.17 | 1.19 | 0.45 | 0.13 |
| 500 | 1.85 | 0.71 | 0.22 | 1.95 | 0.49 | 0.15 | 1.81 | 0.55 | 0.16 | 1.35 | 0.57 | 0.17 |
| 600 | 2.18 | 0.79 | 0.25 | 2.26 | 0.62 | 0.19 | 2.24 | 0.66 | 0.20 | 1.58 | 0.59 | 0.18 |
| 700 | 2.69 | 0.52 | 0.16 | 2.63 | 0.66 | 0.20 | 2.71 | 0.56 | 0.17 | 1.98 | 0.64 | 0.19 |
| 800 | 2.90 | 0.55 | 0.17 | 2.95 | 0.49 | 0.15 | 2.86 | 0.64 | 0.19 | 2.40 | 0.54 | 0.16 |
| 900 | 2.97 | 0.49 | 0.15 | 3.00 | 0.62 | 0.19 | 3.12 | 0.54 | 0.16 | 2.81 | 0.55 | 0.16 |
| 1000 | 3.08 | 0.62 | 0.20 | 3.16 | 0.69 | 0.21 | 3.26 | 0.54 | 0.16 | 3.16 | 0.57 | 0.17 |
| 1500 | 3.38 | 0.49 | 0.15 | 3.60 | 0.69 | 0.21 | 3.74 | 0.66 | 0.20 | 3.86 | 0.47 | 0.14 |
| 2000 | 3.49 | 0.64 | 0.20 | 3.81 | 0.70 | 0.21 | 4.07 | 0.70 | 0.21 | 4.26 | 0.49 | 0.15 |
| 2500 | 3.54 | 0.79 | 0.25 | 3.91 | 0.53 | 0.16 | 4.19 | 0.59 | 0.18 | 4.40 | 0.54 | 0.16 |
| 3000 | 3.59 | 0.64 | 0.20 | 4.05 | 0.58 | 0.17 | 4.28 | 0.55 | 0.16 | 4.49 | 0.51 | 0.15 |
| 3500 | 3.61 | 0.72 | 0.23 | 4.07 | 0.74 | 0.22 | 4.33 | 0.47 | 0.14 | 4.54 | 0.55 | 0.17 |
| 4000 | 3.68 | 0.66 | 0.21 | 4.14 | 0.74 | 0.22 | 4.40 | 0.49 | 0.15 | 4.63 | 0.49 | 0.15 |
| 4500 | 3.74 | 0.60 | 0.19 | 4.21 | 0.60 | 0.18 | 4.49 | 0.51 | 0.15 | 4.70 | 0.46 | 0.14 |
| 5000 | 3.79 | 0.77 | 0.24 | 4.26 | 0.62 | 0.19 | 4.56 | 0.50 | 0.15 | 4.79 | 0.41 | 0.12 |
| 5500 | 3.82 | 0.51 | 0.16 | 4.36 | 0.48 | 0.15 | 4.65 | 0.48 | 0.14 | 4.84 | 0.37 | 0.11 |
| 6000 | 3.85 | 0.49 | 0.15 | 4.40 | 0.49 | 0.15 | 4.72 | 0.45 | 0.14 | 4.91 | 0.29 | 0.09 |
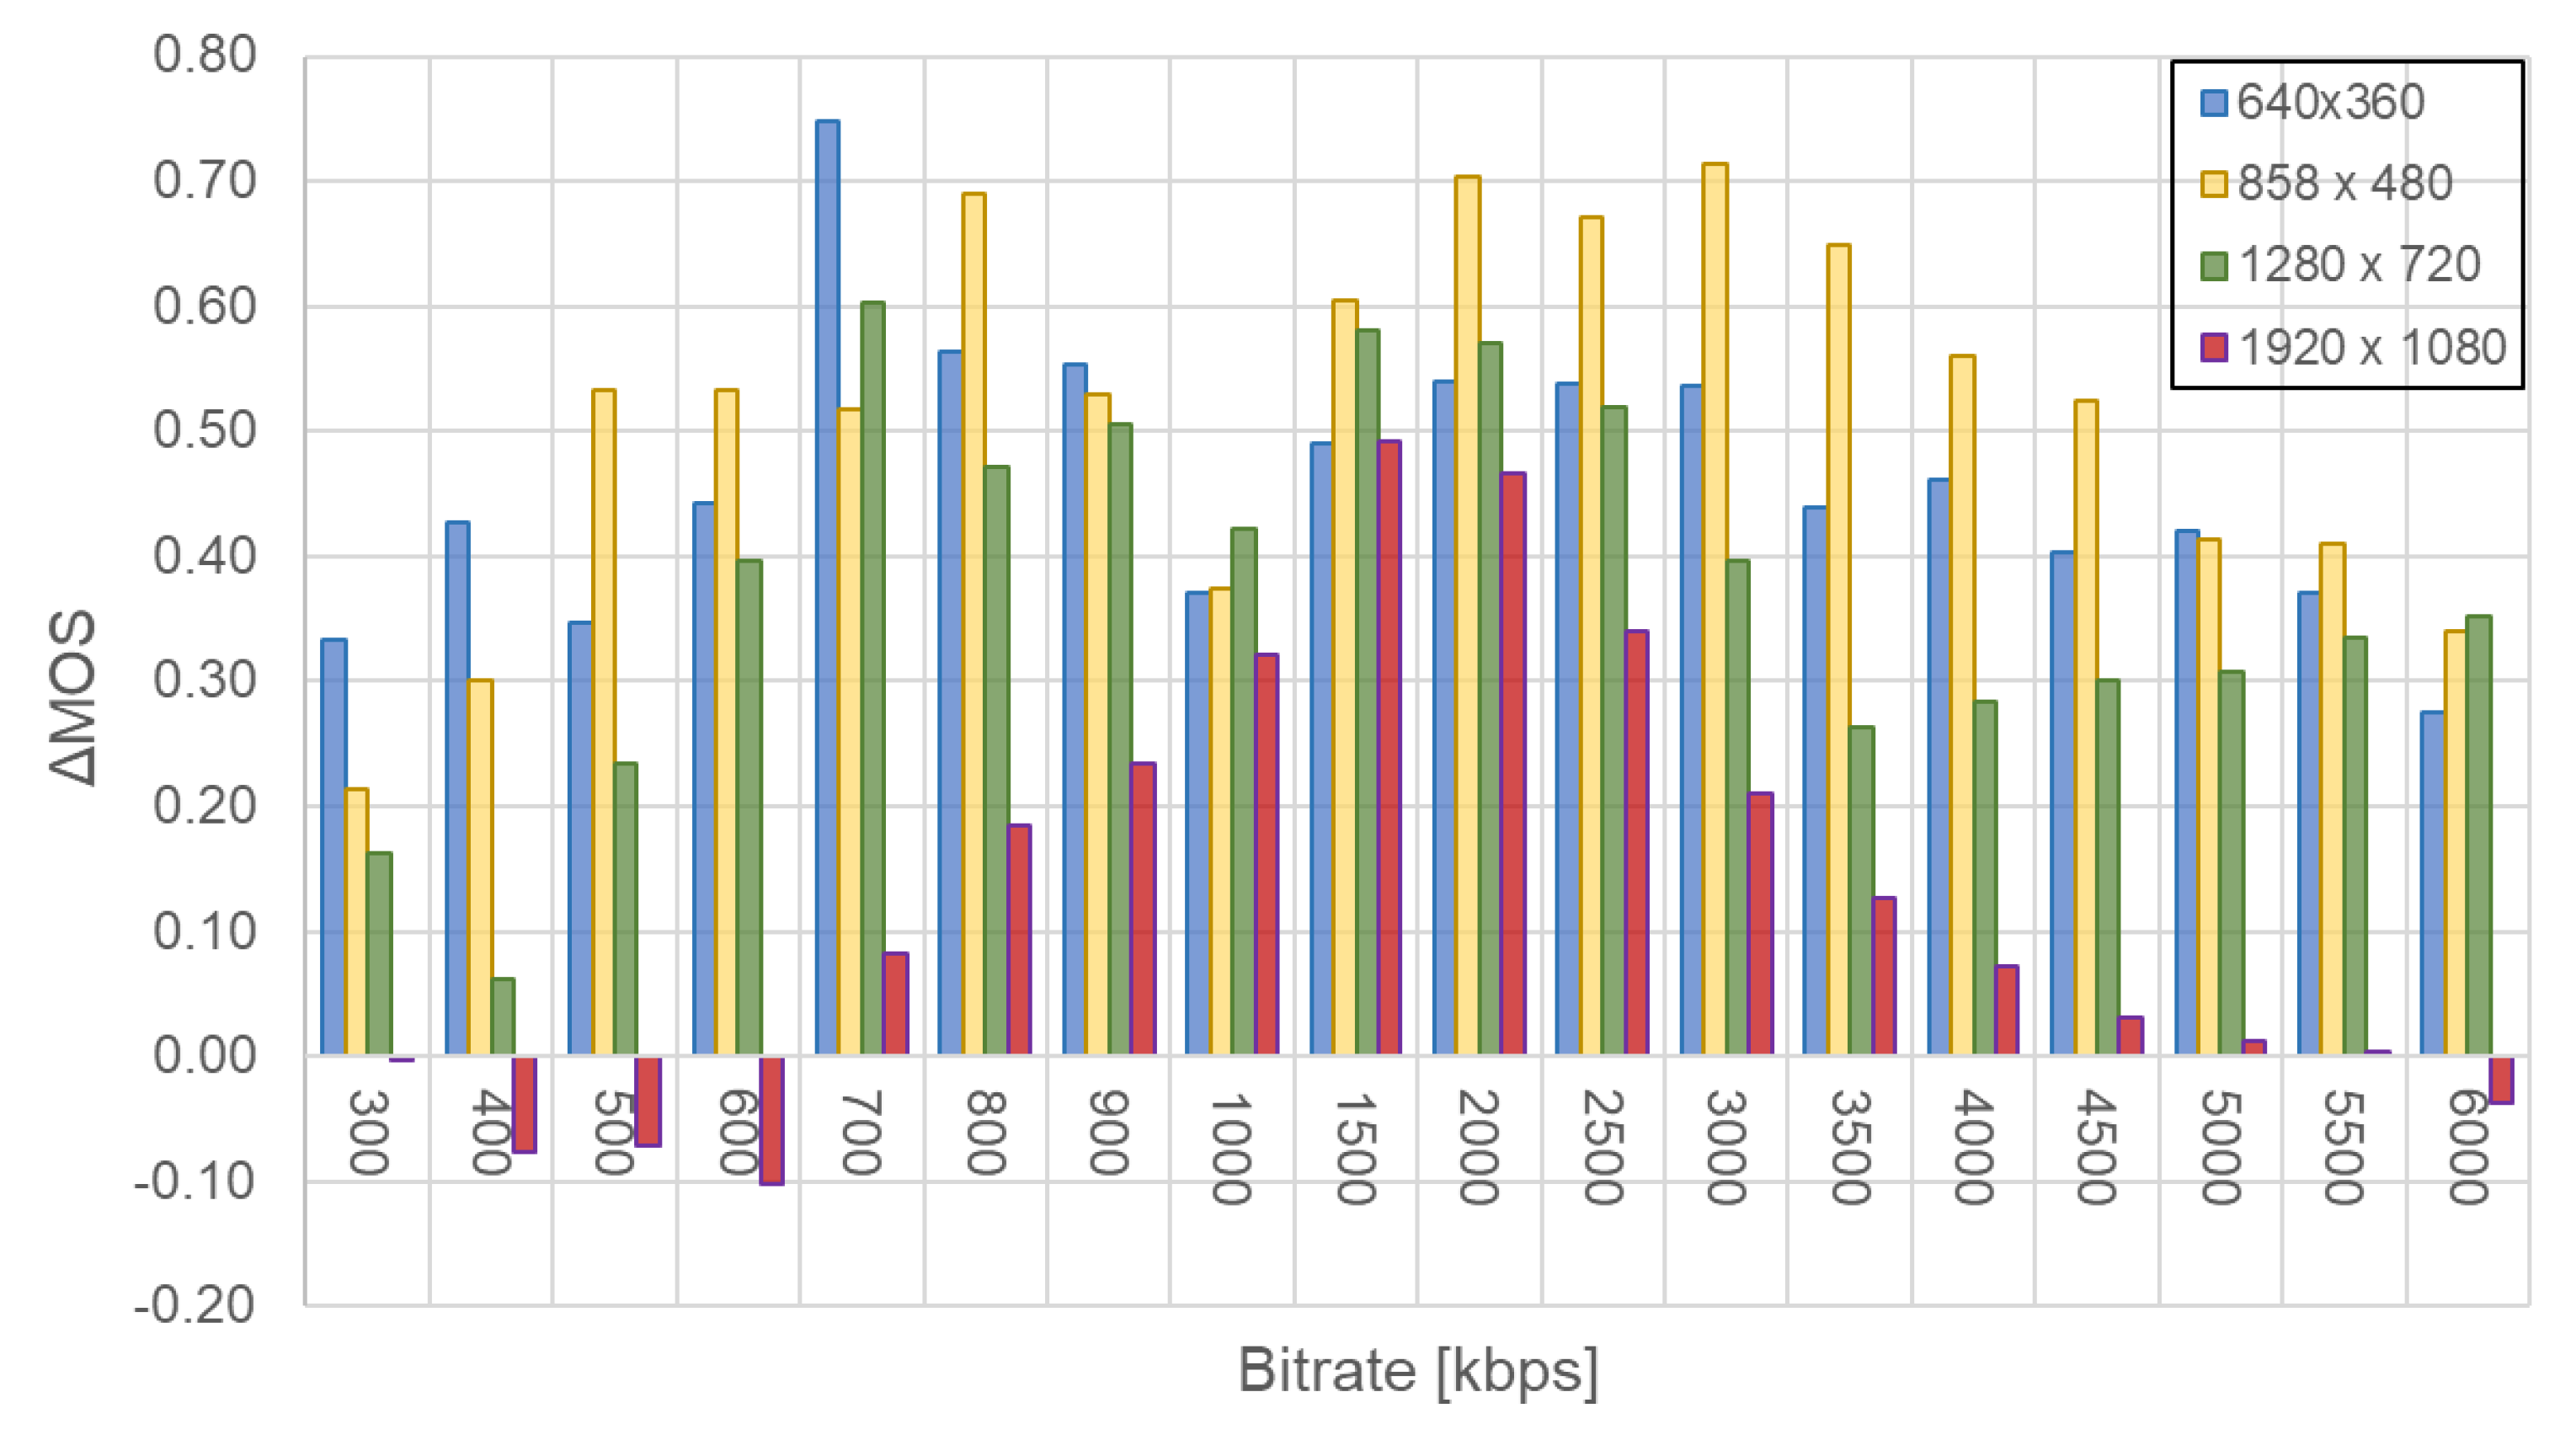
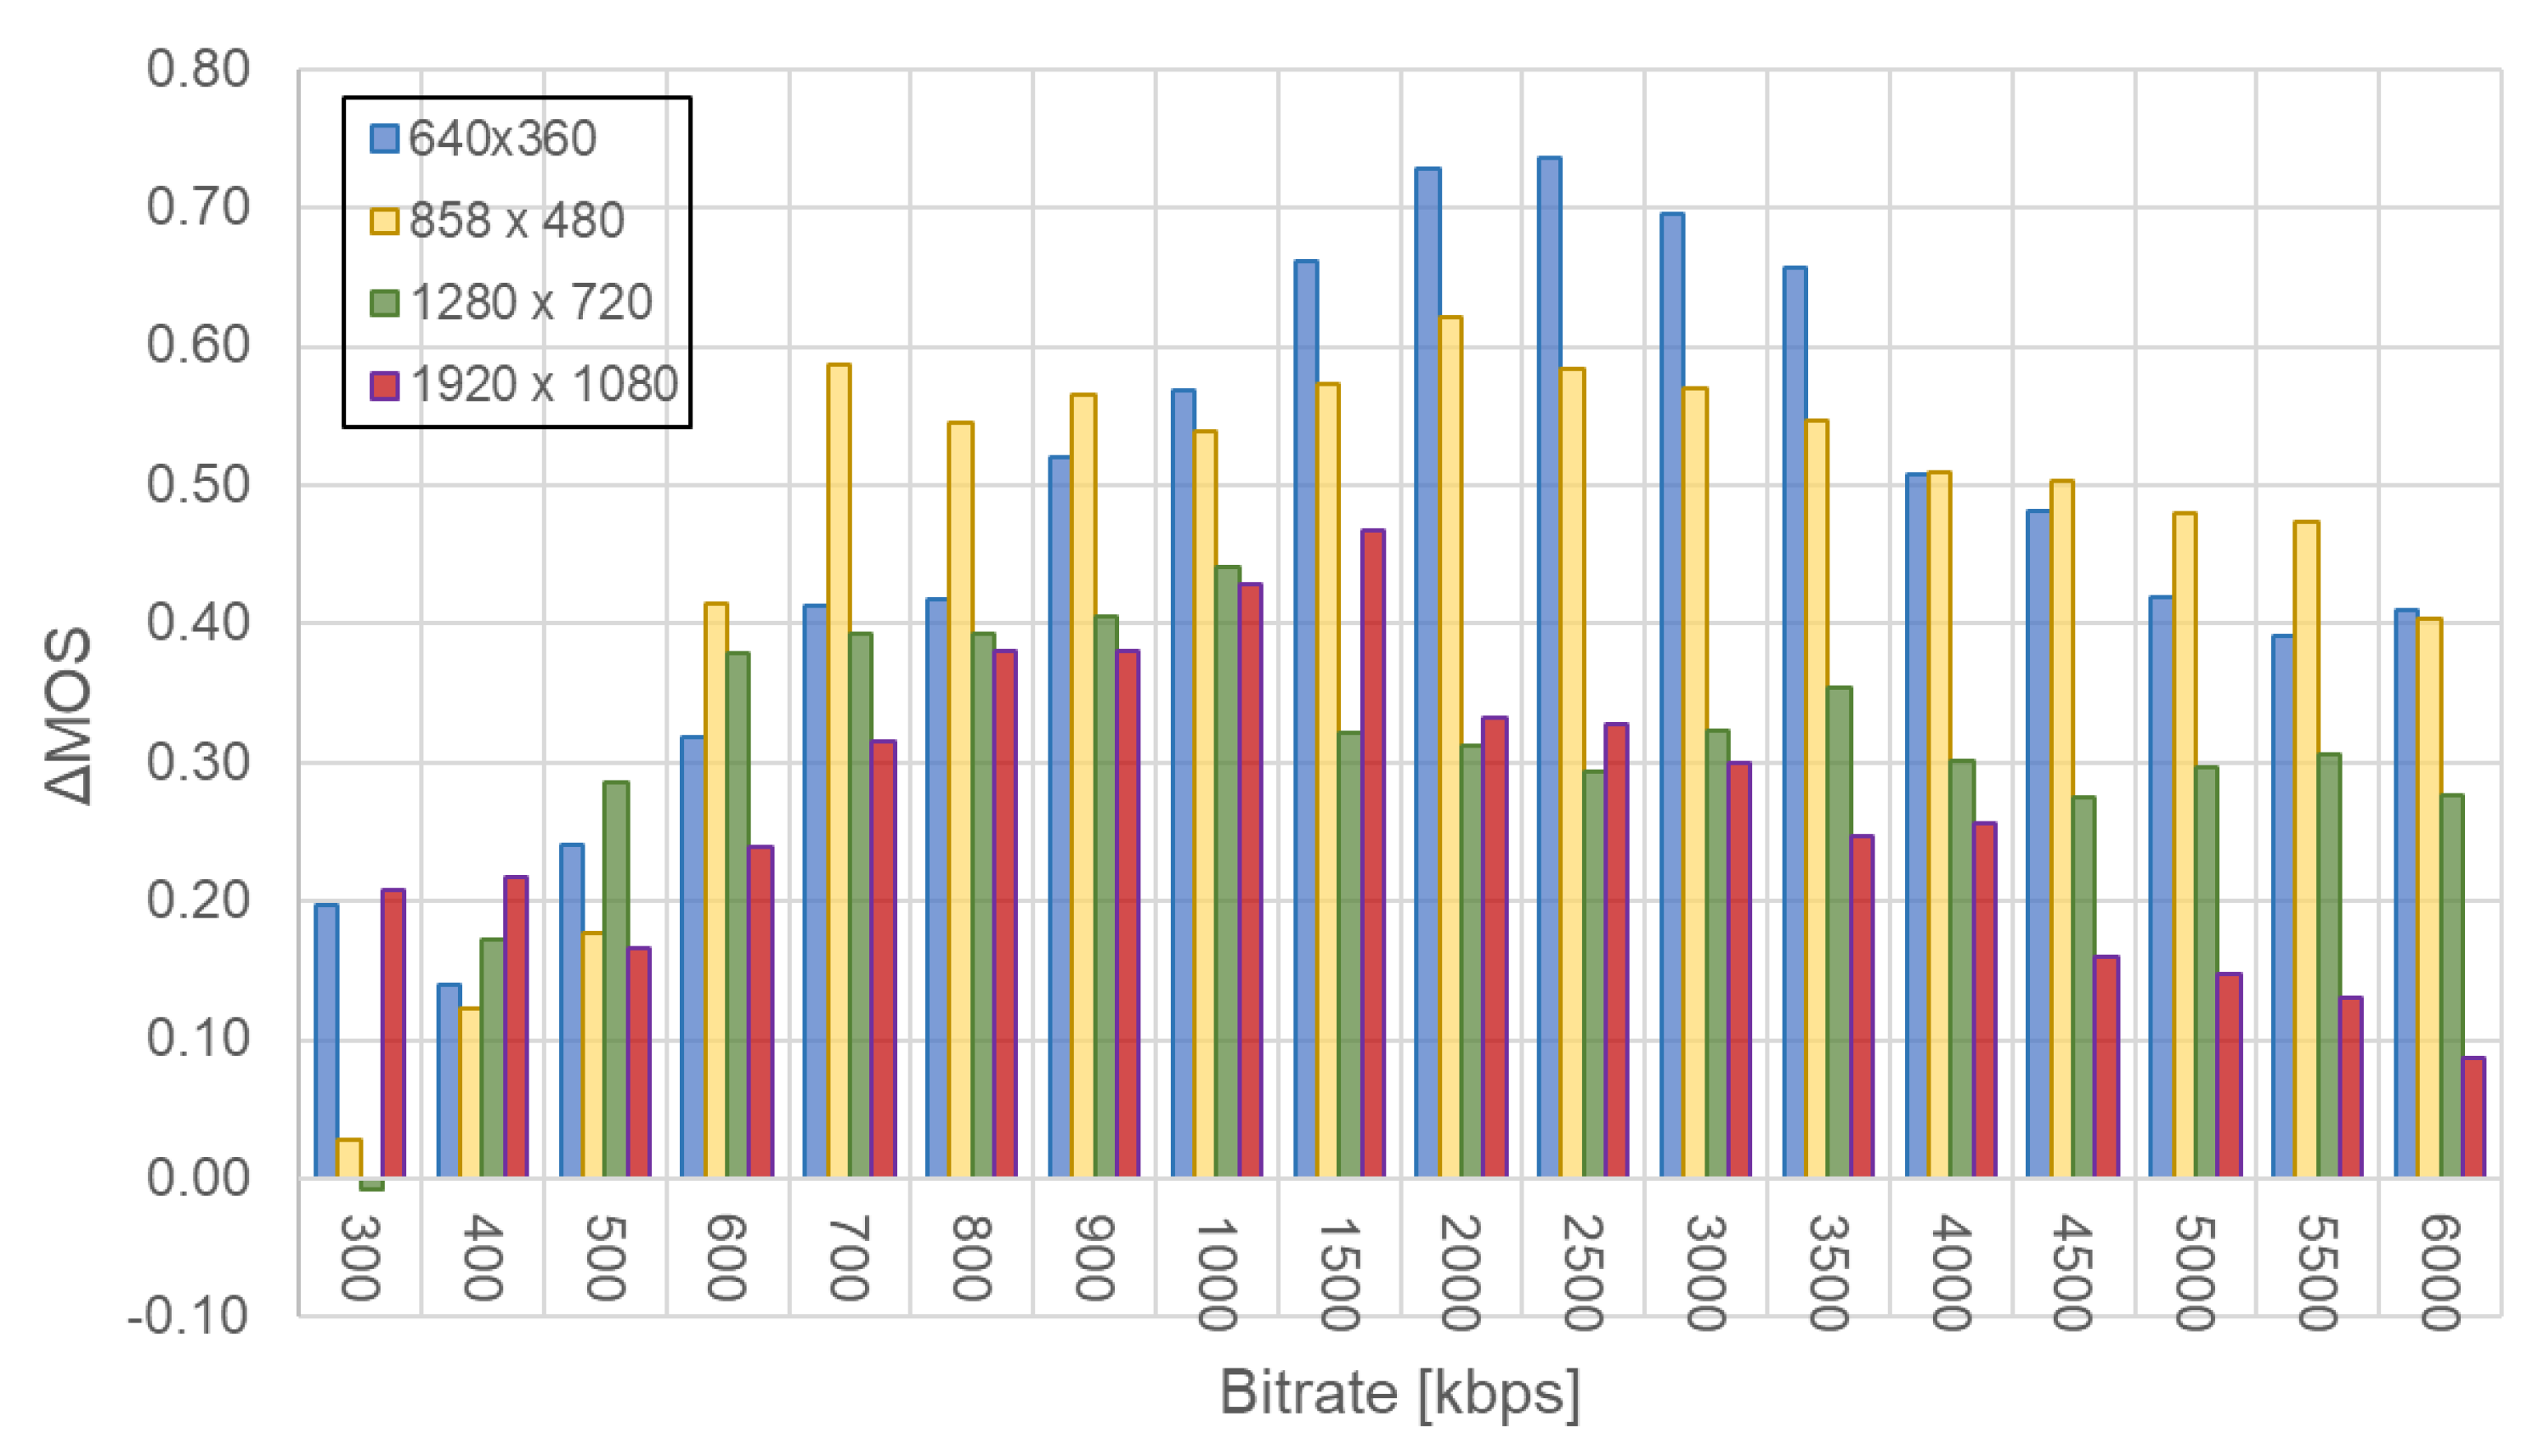
| Bit Rate | ΔMOS | |||
|---|---|---|---|---|
| (kbps) | 640 × 360 | 858 × 480 | 1280 × 720 | 1920 × 1080 |
| 300 | 0.33 | 0.21 | 0.16 | 0.00 |
| 400 | 0.43 | 0.30 | 0.06 | −0.08 |
| 500 | 0.35 | 0.53 | 0.24 | −0.07 |
| 600 | 0.44 | 0.53 | 0.40 | −0.10 |
| 700 | 0.75 | 0.52 | 0.60 | 0.08 |
| 800 | 0.56 | 0.69 | 0.47 | 0.18 |
| 900 | 0.55 | 0.53 | 0.51 | 0.24 |
| 1000 | 0.37 | 0.37 | 0.42 | 0.32 |
| 1500 | 0.49 | 0.60 | 0.58 | 0.49 |
| 2000 | 0.54 | 0.70 | 0.57 | 0.47 |
| 2500 | 0.54 | 0.67 | 0.52 | 0.34 |
| 3000 | 0.54 | 0.71 | 0.40 | 0.21 |
| 3500 | 0.44 | 0.65 | 0.26 | 0.13 |
| 4000 | 0.46 | 0.56 | 0.28 | 0.07 |
| 4500 | 0.40 | 0.53 | 0.30 | 0.03 |
| 5000 | 0.42 | 0.41 | 0.31 | 0.01 |
| 5500 | 0.37 | 0.41 | 0.34 | 0.00 |
| 6000 | 0.27 | 0.34 | 0.35 | −0.04 |
| Bit Rate | 640 × 360 | 858 × 480 | 1280 × 720 | 1920 × 1080 | ||||||||
|---|---|---|---|---|---|---|---|---|---|---|---|---|
| (kbps) | MOS | S | δ | MOS | S | δ | MOS | S | δ | MOS | S | δ |
| 300 | 1.09 | 0.34 | 0.16 | 1.09 | 0.33 | 0.11 | 1.09 | 0.28 | 0.10 | 1.12 | 0.38 | 0.13 |
| 400 | 1.33 | 0.56 | 0.22 | 1.35 | 0.50 | 0.17 | 1.48 | 0.59 | 0.20 | 1.42 | 0.65 | 0.22 |
| 500 | 1.73 | 0.79 | 0.33 | 1.74 | 0.85 | 0.29 | 1.76 | 0.74 | 0.25 | 1.79 | 0.73 | 0.24 |
| 600 | 1.97 | 0.73 | 0.26 | 1.97 | 0.71 | 0.24 | 2.16 | 0.62 | 0.21 | 2.18 | 0.71 | 0.24 |
| 700 | 2.09 | 0.72 | 0.26 | 2.23 | 0.77 | 0.27 | 2.42 | 0.67 | 0.24 | 2.50 | 0.76 | 0.26 |
| 800 | 2.33 | 0.66 | 0.22 | 2.55 | 0.82 | 0.28 | 2.69 | 0.65 | 0.22 | 2.82 | 0.72 | 0.25 |
| 900 | 2.47 | 0.56 | 0.22 | 2.76 | 0.74 | 0.25 | 2.94 | 0.55 | 0.19 | 3.06 | 0.55 | 0.19 |
| 1000 | 2.56 | 0.59 | 0.27 | 2.94 | 0.73 | 0.25 | 3.13 | 0.29 | 0.10 | 3.35 | 0.57 | 0.19 |
| 1500 | 2.75 | 0.72 | 0.23 | 3.18 | 0.58 | 0.19 | 3.44 | 0.51 | 0.18 | 3.79 | 0.57 | 0.19 |
| 2000 | 2.93 | 0.84 | 0.22 | 3.35 | 0.56 | 0.19 | 3.64 | 0.49 | 0.17 | 4.03 | 0.57 | 0.19 |
| 2500 | 3.06 | 0.86 | 0.33 | 3.58 | 0.58 | 0.20 | 3.85 | 0.53 | 0.18 | 4.26 | 0.68 | 0.23 |
| 3000 | 3.24 | 0.81 | 0.21 | 3.68 | 0.60 | 0.20 | 4.00 | 0.60 | 0.21 | 4.44 | 0.65 | 0.22 |
| 3500 | 3.33 | 0.75 | 0.16 | 3.82 | 0.85 | 0.29 | 4.18 | 0.54 | 0.18 | 4.53 | 0.58 | 0.19 |
| 4000 | 3.44 | 0.72 | 0.15 | 3.88 | 0.61 | 0.21 | 4.25 | 0.58 | 0.20 | 4.65 | 0.46 | 0.15 |
| 4500 | 3.52 | 0.78 | 0.00 | 4.03 | 0.62 | 0.21 | 4.31 | 0.60 | 0.21 | 4.71 | 0.41 | 0.14 |
| 5000 | 3.63 | 0.65 | 0.20 | 4.09 | 0.63 | 0.22 | 4.39 | 0.65 | 0.23 | 4.79 | 0.41 | 0.14 |
| 5500 | 3.69 | 0.63 | 0.16 | 4.18 | 0.76 | 0.26 | 4.53 | 0.58 | 0.20 | 4.85 | 0.37 | 0.13 |
| 6000 | 3.84 | 0.80 | 0.19 | 4.21 | 0.78 | 0.27 | 4.59 | 0.51 | 0.18 | 4.88 | 0.37 | 0.13 |
| Bit Rate | 640 × 360 | 858 × 480 | 1280 × 720 | 1920 × 1080 | ||||||||
|---|---|---|---|---|---|---|---|---|---|---|---|---|
| (kbps) | MOS | S | δ | MOS | S | δ | MOS | S | δ | MOS | S | δ |
| 300 | 1.15 | 0.37 | 0.16 | 1.22 | 0.42 | 0.17 | 1.09 | 0.29 | 0.12 | 1.13 | 0.34 | 0.14 |
| 400 | 1.55 | 0.51 | 0.22 | 1.43 | 0.51 | 0.22 | 1.61 | 0.50 | 0.20 | 1.65 | 0.49 | 0.20 |
| 500 | 1.85 | 0.75 | 0.33 | 1.96 | 0.71 | 0.29 | 2.09 | 0.42 | 0.17 | 2.04 | 0.64 | 0.26 |
| 600 | 2.15 | 0.59 | 0.26 | 2.26 | 0.54 | 0.22 | 2.48 | 0.59 | 0.24 | 2.48 | 0.51 | 0.21 |
| 700 | 2.35 | 0.59 | 0.26 | 2.57 | 0.66 | 0.27 | 2.87 | 0.34 | 0.14 | 2.83 | 0.58 | 0.24 |
| 800 | 2.50 | 0.51 | 0.22 | 2.87 | 0.55 | 0.22 | 3.09 | 0.42 | 0.17 | 3.13 | 0.76 | 0.31 |
| 900 | 2.60 | 0.50 | 0.22 | 3.05 | 0.49 | 0.20 | 3.26 | 0.45 | 0.18 | 3.35 | 0.49 | 0.20 |
| 1000 | 2.80 | 0.62 | 0.27 | 3.17 | 0.49 | 0.20 | 3.43 | 0.51 | 0.21 | 3.48 | 0.59 | 0.24 |
| 1500 | 3.20 | 0.52 | 0.23 | 3.57 | 0.51 | 0.21 | 3.78 | 0.42 | 0.17 | 3.91 | 0.51 | 0.21 |
| 2000 | 3.40 | 0.50 | 0.22 | 3.91 | 0.60 | 0.24 | 4.09 | 0.67 | 0.27 | 4.22 | 0.52 | 0.21 |
| 2500 | 3.55 | 0.76 | 0.33 | 4.04 | 0.47 | 0.19 | 4.30 | 0.56 | 0.23 | 4.43 | 0.51 | 0.21 |
| 3000 | 3.70 | 0.47 | 0.21 | 4.17 | 0.39 | 0.16 | 4.43 | 0.59 | 0.24 | 4.57 | 0.51 | 0.21 |
| 3500 | 3.80 | 0.41 | 0.18 | 4.26 | 0.45 | 0.18 | 4.48 | 0.59 | 0.24 | 4.70 | 0.47 | 0.19 |
| 4000 | 3.89 | 0.32 | 0.14 | 4.30 | 0.47 | 0.19 | 4.57 | 0.51 | 0.21 | 4.78 | 0.42 | 0.17 |
| 4500 | 4.00 | 0.00 | 0.00 | 4.35 | 0.49 | 0.20 | 4.61 | 0.50 | 0.20 | 4.83 | 0.39 | 0.16 |
| 5000 | 4.05 | 0.39 | 0.17 | 4.39 | 0.50 | 0.20 | 4.70 | 0.47 | 0.19 | 4.87 | 0.34 | 0.14 |
| 5500 | 4.10 | 0.31 | 0.13 | 4.39 | 0.50 | 0.20 | 4.74 | 0.45 | 0.18 | 4.91 | 0.29 | 0.12 |
| 6000 | 4.15 | 0.37 | 0.16 | 4.41 | 0.50 | 0.21 | 4.78 | 0.42 | 0.17 | 4.91 | 0.29 | 0.12 |
| Bit Rate | ΔMOS | |||
|---|---|---|---|---|
| (kbps) | 640 × 360 | 858 × 480 | 1280 × 720 | 1920 × 1080 |
| 300 | 0.06 | 0.13 | 0.00 | 0.01 |
| 400 | 0.22 | 0.08 | 0.12 | 0.23 |
| 500 | 0.12 | 0.22 | 0.33 | 0.25 |
| 600 | 0.18 | 0.29 | 0.32 | 0.30 |
| 700 | 0.26 | 0.34 | 0.45 | 0.33 |
| 800 | 0.17 | 0.32 | 0.40 | 0.31 |
| 900 | 0.13 | 0.29 | 0.32 | 0.29 |
| 1000 | 0.24 | 0.23 | 0.31 | 0.13 |
| 1500 | 0.45 | 0.39 | 0.35 | 0.12 |
| 2000 | 0.47 | 0.56 | 0.45 | 0.19 |
| 2500 | 0.49 | 0.47 | 0.46 | 0.17 |
| 3000 | 0.46 | 0.50 | 0.43 | 0.12 |
| 3500 | 0.47 | 0.44 | 0.30 | 0.17 |
| 4000 | 0.46 | 0.43 | 0.32 | 0.14 |
| 4500 | 0.48 | 0.32 | 0.30 | 0.12 |
| 5000 | 0.43 | 0.30 | 0.31 | 0.08 |
| 5500 | 0.41 | 0.21 | 0.21 | 0.06 |
| 6000 | 0.31 | 0.20 | 0.19 | 0.03 |
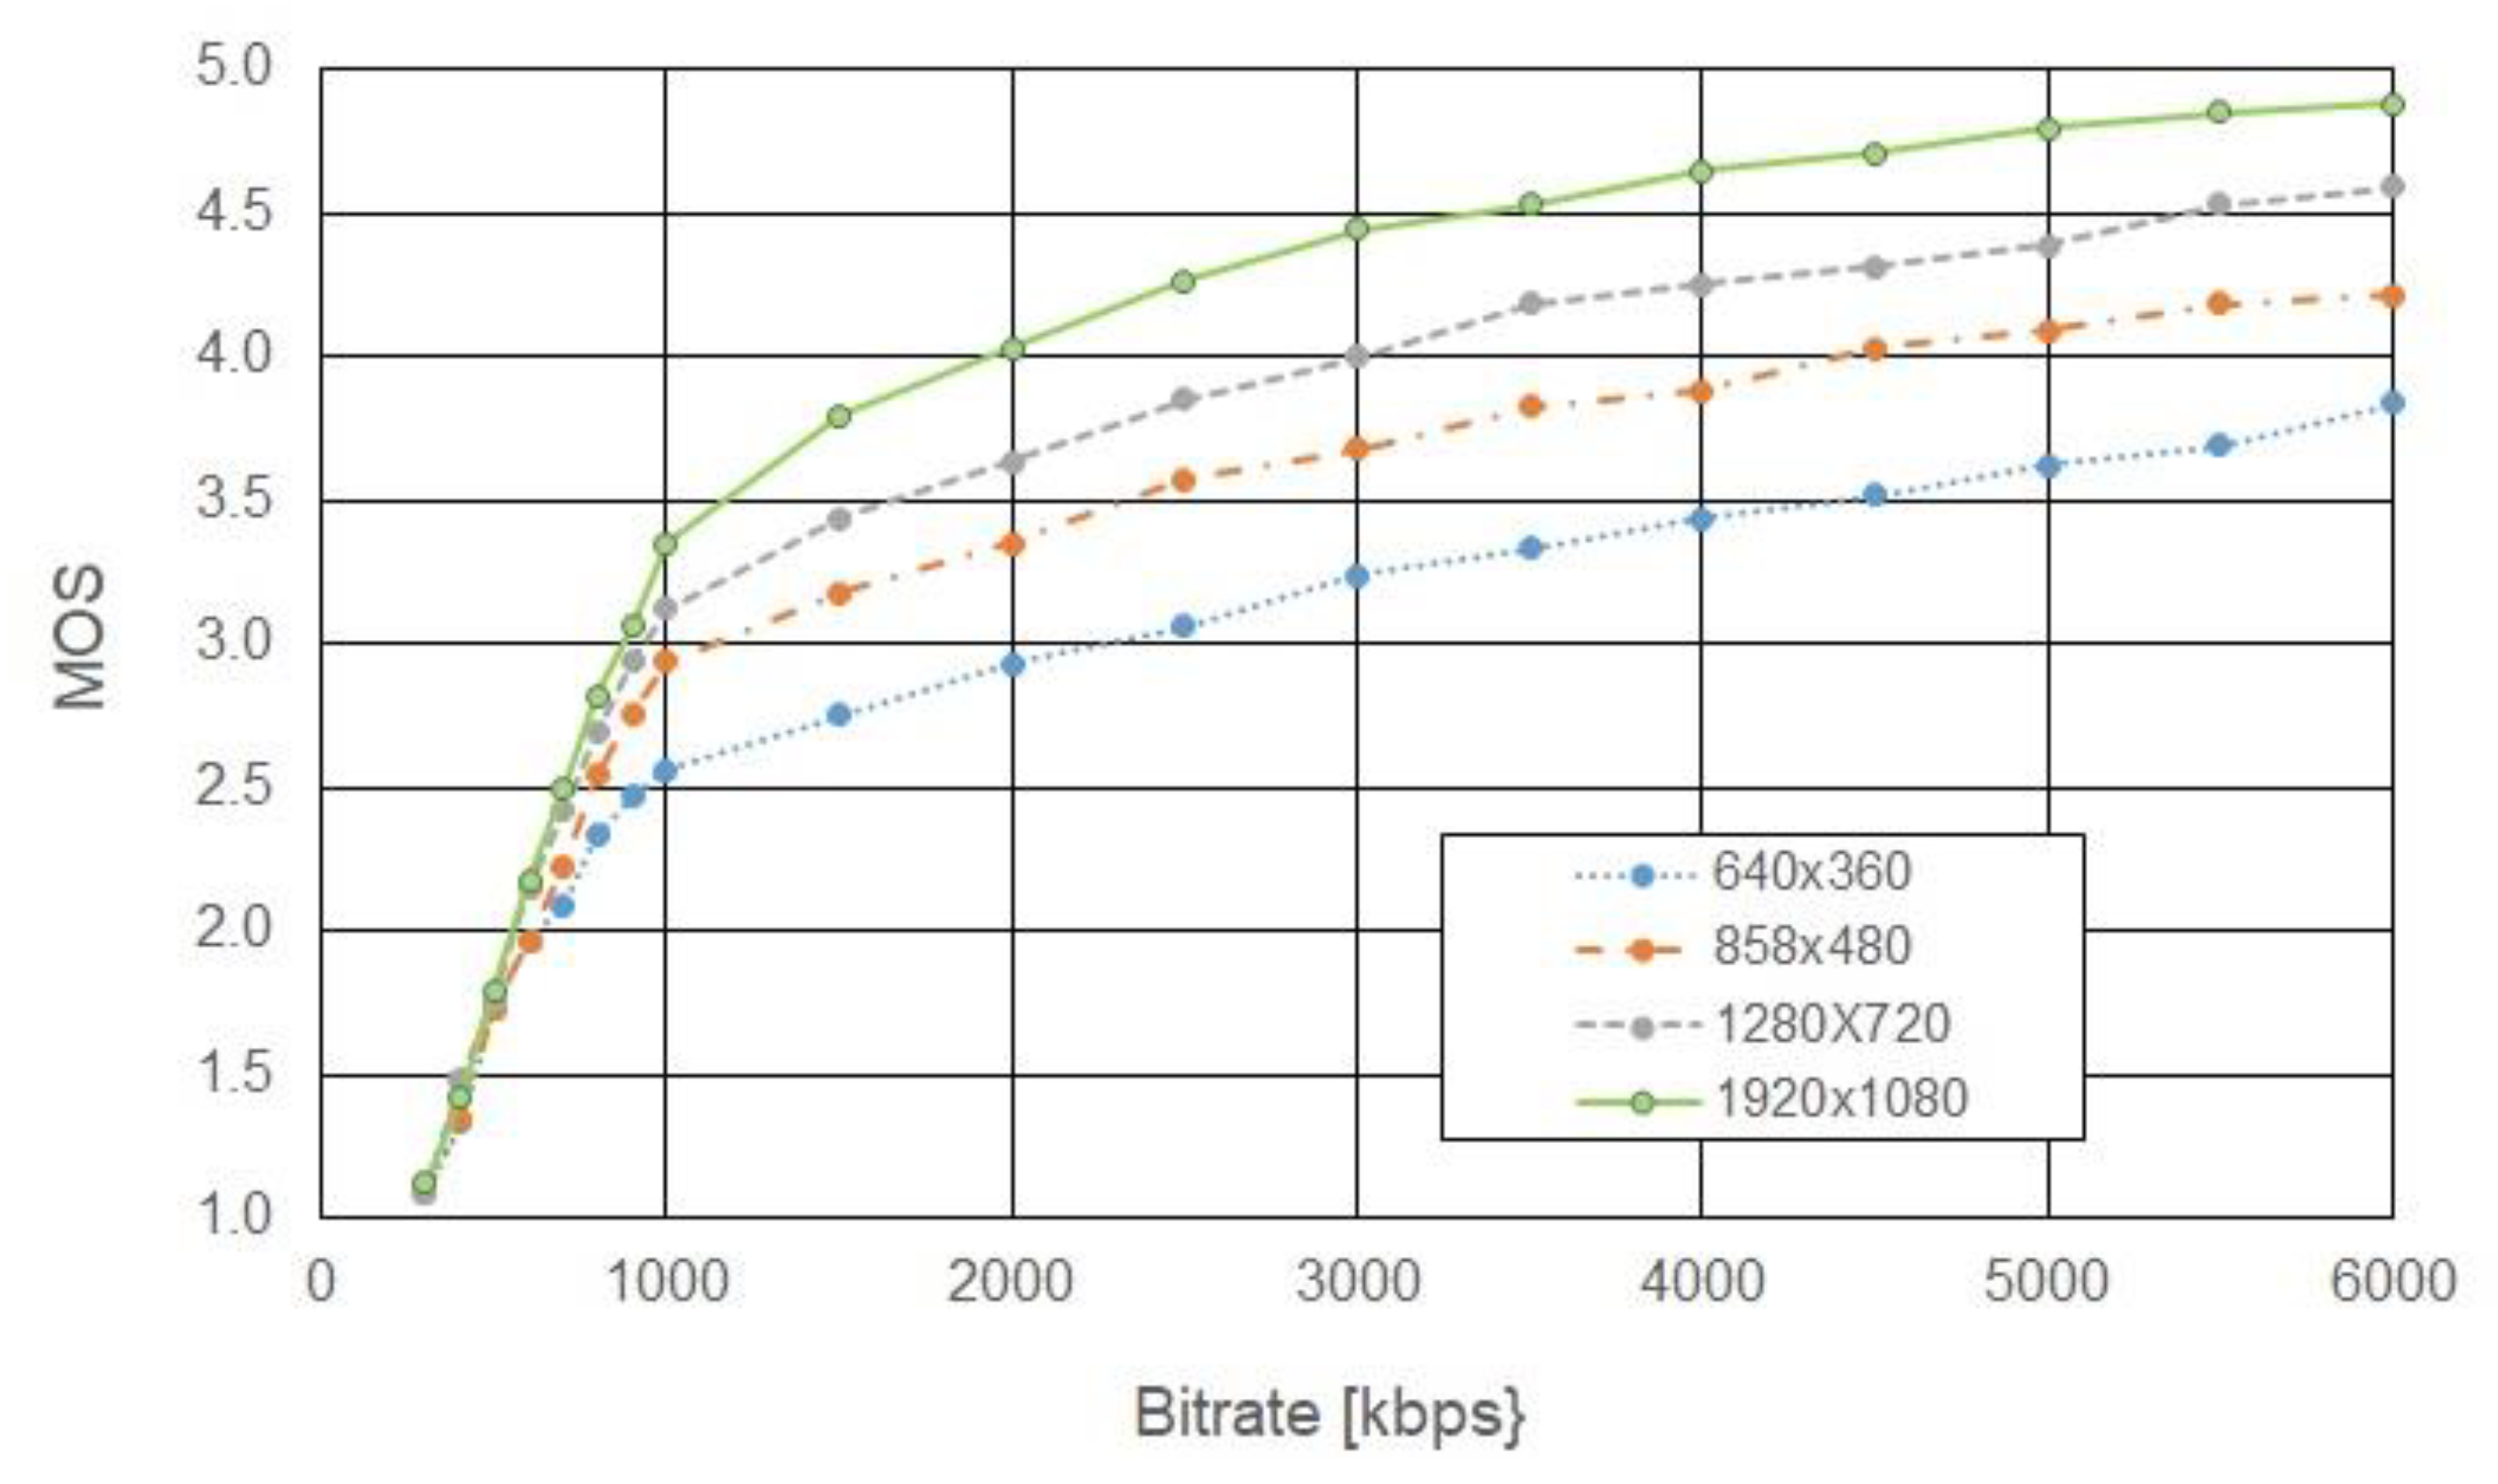
| Bit Rate | 640 × 360 | 858 × 480 | 1280 × 720 | 1920 × 1080 | ||||||||
|---|---|---|---|---|---|---|---|---|---|---|---|---|
| (kbps) | MOS | S | δ | MOS | S | δ | MOS | S | δ | MOS | S | δ |
| 300 | 1.12 | 0.35 | 0.14 | 1.24 | 0.46 | 0.18 | 1.26 | 0.45 | 0.13 | 1.29 | 0.48 | 0.19 |
| 400 | 1.48 | 0.51 | 0.20 | 1.52 | 0.51 | 0.20 | 1.69 | 0.56 | 0.17 | 1.62 | 0.76 | 0.29 |
| 500 | 1.76 | 0.43 | 0.17 | 1.80 | 0.71 | 0.28 | 2.07 | 0.64 | 0.19 | 2.00 | 0.86 | 0.32 |
| 600 | 1.92 | 0.56 | 0.22 | 1.96 | 0.71 | 0.28 | 2.41 | 0.55 | 0.17 | 2.25 | 0.75 | 0.28 |
| 700 | 2.09 | 0.57 | 0.23 | 2.04 | 0.74 | 0.30 | 2.71 | 0.55 | 0.17 | 2.43 | 0.92 | 0.34 |
| 800 | 2.30 | 0.62 | 0.24 | 2.29 | 0.58 | 0.23 | 2.93 | 0.71 | 0.22 | 2.64 | 0.85 | 0.32 |
| 900 | 2.38 | 0.66 | 0.25 | 2.46 | 0.60 | 0.24 | 3.12 | 0.50 | 0.15 | 2.85 | 0.80 | 0.30 |
| 1000 | 2.48 | 0.51 | 0.20 | 2.60 | 0.50 | 0.20 | 3.26 | 0.45 | 0.13 | 3.00 | 0.76 | 0.28 |
| 1500 | 2.81 | 0.74 | 0.28 | 2.96 | 0.71 | 0.27 | 3.64 | 0.48 | 0.15 | 3.37 | 0.81 | 0.31 |
| 2000 | 2.96 | 0.85 | 0.33 | 3.19 | 0.72 | 0.28 | 3.90 | 0.43 | 0.13 | 3.71 | 0.56 | 0.21 |
| 2500 | 3.07 | 0.72 | 0.27 | 3.35 | 0.70 | 0.27 | 4.07 | 0.51 | 0.16 | 3.93 | 0.57 | 0.21 |
| 3000 | 3.19 | 0.72 | 0.27 | 3.50 | 0.59 | 0.23 | 4.29 | 0.60 | 0.18 | 4.14 | 0.60 | 0.22 |
| 3500 | 3.30 | 0.64 | 0.24 | 3.64 | 0.66 | 0.26 | 4.43 | 0.55 | 0.17 | 4.36 | 0.56 | 0.21 |
| 4000 | 3.44 | 0.59 | 0.22 | 3.77 | 0.62 | 0.24 | 4.52 | 0.55 | 0.17 | 4.46 | 0.51 | 0.19 |
| 4500 | 3.52 | 0.51 | 0.19 | 3.85 | 0.58 | 0.22 | 4.57 | 0.55 | 0.17 | 4.61 | 0.51 | 0.19 |
| 5000 | 3.63 | 0.65 | 0.24 | 3.96 | 0.71 | 0.27 | 4.64 | 0.48 | 0.15 | 4.67 | 0.49 | 0.19 |
| 5500 | 3.70 | 0.62 | 0.24 | 4.04 | 0.71 | 0.27 | 4.69 | 0.47 | 0.14 | 4.70 | 0.48 | 0.18 |
| 6000 | 3.74 | 0.61 | 0.23 | 4.15 | 0.63 | 0.24 | 4.74 | 0.45 | 0.13 | 4.75 | 0.46 | 0.17 |
| Bit Rate | 640 × 360 | 858 × 480 | 1280 × 720 | 1920 × 1080 | ||||||||
|---|---|---|---|---|---|---|---|---|---|---|---|---|
| (kbps) | MOS | S | δ | MOS | S | δ | MOS | S | δ | MOS | S | δ |
| 300 | 1.32 | 0.47 | 0.14 | 1.27 | 0.45 | 0.14 | 1.26 | 0.45 | 0.13 | 1.50 | 0.55 | 0.17 |
| 400 | 1.62 | 0.58 | 0.18 | 1.64 | 0.58 | 0.17 | 1.69 | 0.56 | 0.17 | 1.83 | 0.66 | 0.20 |
| 500 | 2.00 | 0.44 | 0.13 | 1.98 | 0.51 | 0.15 | 2.07 | 0.64 | 0.19 | 2.17 | 0.61 | 0.20 |
| 600 | 2.24 | 0.48 | 0.15 | 2.37 | 0.62 | 0.18 | 2.41 | 0.55 | 0.17 | 2.49 | 0.63 | 0.19 |
| 700 | 2.50 | 0.51 | 0.15 | 2.63 | 0.49 | 0.15 | 2.71 | 0.55 | 0.17 | 2.74 | 0.76 | 0.23 |
| 800 | 2.71 | 0.46 | 0.14 | 2.84 | 0.43 | 0.13 | 2.93 | 0.71 | 0.22 | 3.02 | 0.47 | 0.14 |
| 900 | 2.90 | 0.30 | 0.09 | 3.02 | 0.34 | 0.10 | 3.12 | 0.50 | 0.15 | 3.23 | 0.43 | 0.13 |
| 1000 | 3.05 | 0.44 | 0.13 | 3.14 | 0.41 | 0.12 | 3.26 | 0.45 | 0.13 | 3.43 | 0.50 | 0.15 |
| 1500 | 3.48 | 0.51 | 0.15 | 3.53 | 0.50 | 0.15 | 3.64 | 0.48 | 0.15 | 3.84 | 0.48 | 0.14 |
| 2000 | 3.69 | 0.56 | 0.17 | 3.81 | 0.45 | 0.13 | 3.90 | 0.43 | 0.13 | 4.05 | 0.43 | 0.13 |
| 2500 | 3.81 | 0.45 | 0.14 | 3.93 | 0.40 | 0.12 | 4.07 | 0.51 | 0.16 | 4.26 | 0.44 | 0.13 |
| 3000 | 3.88 | 0.33 | 0.10 | 4.07 | 0.40 | 0.12 | 4.29 | 0.60 | 0.18 | 4.44 | 0.50 | 0.15 |
| 3500 | 3.95 | 0.38 | 0.11 | 4.19 | 0.50 | 0.15 | 4.43 | 0.55 | 0.17 | 4.60 | 0.49 | 0.15 |
| 4000 | 3.95 | 0.44 | 0.13 | 4.28 | 0.50 | 0.15 | 4.52 | 0.55 | 0.17 | 4.72 | 0.45 | 0.14 |
| 4500 | 4.00 | 0.58 | 0.18 | 4.35 | 0.53 | 0.16 | 4.57 | 0.55 | 0.17 | 4.77 | 0.43 | 0.13 |
| 5000 | 4.05 | 0.44 | 0.14 | 4.44 | 0.50 | 0.15 | 4.64 | 0.48 | 0.15 | 4.81 | 0.39 | 0.12 |
| 5500 | 4.10 | 0.43 | 0.13 | 4.51 | 0.51 | 0.15 | 4.69 | 0.47 | 0.14 | 4.83 | 0.38 | 0.11 |
| 6000 | 4.15 | 0.48 | 0.15 | 4.56 | 0.50 | 0.15 | 4.74 | 0.45 | 0.13 | 4.84 | 0.37 | 0.11 |
| Bit Rate | ΔMOS | |||
|---|---|---|---|---|
| (kbps) | 640 × 360 | 858 × 480 | 1280 × 720 | 1920 × 1080 |
| 300 | 0.20 | 0.03 | −0.01 | 0.21 |
| 400 | 0.14 | 0.12 | 0.17 | 0.22 |
| 500 | 0.24 | 0.18 | 0.29 | 0.17 |
| 600 | 0.32 | 0.41 | 0.38 | 0.24 |
| 700 | 0.41 | 0.59 | 0.39 | 0.32 |
| 800 | 0.42 | 0.55 | 0.39 | 0.38 |
| 900 | 0.52 | 0.56 | 0.40 | 0.38 |
| 1000 | 0.57 | 0.54 | 0.44 | 0.43 |
| 1500 | 0.66 | 0.57 | 0.32 | 0.47 |
| 2000 | 0.73 | 0.62 | 0.31 | 0.33 |
| 2500 | 0.74 | 0.58 | 0.29 | 0.33 |
| 3000 | 0.70 | 0.57 | 0.32 | 0.30 |
| 3500 | 0.66 | 0.55 | 0.35 | 0.25 |
| 4000 | 0.51 | 0.51 | 0.30 | 0.26 |
| 4500 | 0.48 | 0.50 | 0.28 | 0.16 |
| 5000 | 0.42 | 0.48 | 0.30 | 0.15 |
| 5500 | 0.39 | 0.47 | 0.31 | 0.13 |
| 6000 | 0.41 | 0.40 | 0.28 | 0.09 |
| QoS vs. QoE Correlations | |||||||||
|---|---|---|---|---|---|---|---|---|---|
| Lab | Home | ||||||||
| 360p | 480p | 720p | 1080p | 360p | 480p | 720p | 1080p | ||
| PSNR | 360p | 0.981 | 0.996 | 0.995 | 0.986 | 0.986 | 0.988 | 0.995 | 0.985 |
| 480p | 0.968 | 0.989 | 0.990 | 0.987 | 0.980 | 0.989 | 0.998 | 0.994 | |
| 720p | 0.951 | 0.978 | 0.981 | 0.982 | 0.970 | 0.986 | 0.995 | 0.996 | |
| 1080p | 0.949 | 0.976 | 0.979 | 0.981 | 0.968 | 0.985 | 0.994 | 0.996 | |
| SSIM | 360p | 0.989 | 0.997 | 0.995 | 0.977 | 0.988 | 0.983 | 0.987 | 0.970 |
| 480p | 0.987 | 0.997 | 0.996 | 0.981 | 0.988 | 0.985 | 0.990 | 0.975 | |
| 720p | 0.985 | 0.997 | 0.996 | 0.984 | 0.988 | 0.987 | 0.993 | 0.980 | |
| 1080p | 0.989 | 0.997 | 0.995 | 0.978 | 0.988 | 0.982 | 0.987 | 0.970 | |
| VMAF | 360p | 0.974 | 0.992 | 0.994 | 0.992 | 0.983 | 0.988 | 0.998 | 0.992 |
| 480p | 0.973 | 0.992 | 0.993 | 0.992 | 0.982 | 0.987 | 0.998 | 0.993 | |
| 720p | 0.971 | 0.990 | 0.992 | 0.993 | 0.979 | 0.984 | 0.996 | 0.992 | |
| 1080p | 0.981 | 0.994 | 0.994 | 0.990 | 0.982 | 0.979 | 0.989 | 0.980 | |
| QoS vs. QoE Correlations | |||||||||
|---|---|---|---|---|---|---|---|---|---|
| Lab | Home | ||||||||
| 360p | 480p | 720p | 1080p | 360p | 480p | 720p | 1080p | ||
| PSNR | 360p | 0.998 | 0.997 | 0.997 | 0.998 | 0.991 | 0.995 | 0.996 | 0.997 |
| 480p | 0.999 | 0.991 | 0.990 | 0.993 | 0.993 | 0.994 | 0.995 | 0.996 | |
| 720p | 0.995 | 0.981 | 0.980 | 0.983 | 0.991 | 0.989 | 0.991 | 0.989 | |
| 1080p | 0.991 | 0.975 | 0.973 | 0.977 | 0.989 | 0.986 | 0.987 | 0.985 | |
| SSIM | 360p | 0.993 | 0.997 | 0.999 | 0.998 | 0.986 | 0.991 | 0.992 | 0.993 |
| 480p | 0.995 | 0.998 | 0.999 | 0.999 | 0.988 | 0.993 | 0.994 | 0.995 | |
| 720p | 0.995 | 0.998 | 0.999 | 0.999 | 0.988 | 0.993 | 0.994 | 0.995 | |
| 1080p | 0.994 | 0.996 | 0.998 | 0.998 | 0.987 | 0.991 | 0.993 | 0.993 | |
| VMAF | 360p | 0.998 | 0.995 | 0.992 | 0.995 | 0.989 | 0.994 | 0.995 | 0.998 |
| 480p | 0.997 | 0.995 | 0.992 | 0.995 | 0.988 | 0.993 | 0.995 | 0.997 | |
| 720p | 0.995 | 0.996 | 0.992 | 0.995 | 0.985 | 0.991 | 0.993 | 0.996 | |
| 1080p | 0.976 | 0.989 | 0.991 | 0.989 | 0.965 | 0.976 | 0.977 | 0.981 | |
| QoS vs. QoE Correlations | |||||||||
|---|---|---|---|---|---|---|---|---|---|
| Lab | Home | ||||||||
| 360p | 480p | 720p | 1080p | 360p | 480p | 720p | 1080p | ||
| PSNR | 360p | 0.997 | 0.998 | 0.999 | 0.998 | 0.994 | 0.990 | 0.996 | 0.993 |
| 480p | 0.990 | 0.996 | 0.997 | 0.997 | 0.997 | 0.997 | 0.999 | 0.999 | |
| 720p | 0.980 | 0.989 | 0.990 | 0.991 | 0.995 | 0.999 | 0.997 | 0.999 | |
| 1080p | 0.951 | 0.966 | 0.968 | 0.972 | 0.978 | 0.989 | 0.984 | 0.987 | |
| SSIM | 360p | 0.998 | 0.997 | 0.997 | 0.995 | 0.988 | 0.981 | 0.989 | 0.985 |
| 480p | 0.998 | 0.998 | 0.998 | 0.996 | 0.991 | 0.984 | 0.991 | 0.988 | |
| 720p | 0.998 | 0.998 | 0.998 | 0.997 | 0.991 | 0.986 | 0.993 | 0.990 | |
| 1080p | 0.988 | 0.991 | 0.992 | 0.995 | 0.990 | 0.994 | 0.999 | 0.995 | |
| VMAF | 360p | 0.995 | 0.996 | 0.997 | 0.998 | 0.993 | 0.993 | 0.998 | 0.995 |
| 480p | 0.994 | 0.995 | 0.996 | 0.998 | 0.992 | 0.993 | 0.998 | 0.996 | |
| 720p | 0.994 | 0.994 | 0.995 | 0.997 | 0.989 | 0.990 | 0.997 | 0.993 | |
| 1080p | 0.993 | 0.988 | 0.987 | 0.991 | 0.978 | 0.980 | 0.991 | 0.983 | |
Disclaimer/Publisher’s Note: The statements, opinions and data contained in all publications are solely those of the individual author(s) and contributor(s) and not of MDPI and/or the editor(s). MDPI and/or the editor(s) disclaim responsibility for any injury to people or property resulting from any ideas, methods, instructions or products referred to in the content. |
© 2023 by the authors. Licensee MDPI, Basel, Switzerland. This article is an open access article distributed under the terms and conditions of the Creative Commons Attribution (CC BY) license (https://creativecommons.org/licenses/by/4.0/).
Share and Cite
Klink, J.; Brachmański, S.; Łuczyński, M. Assessment of the Quality of Video Sequences Performed by Viewers at Home and in the Laboratory. Appl. Sci. 2023, 13, 5025. https://doi.org/10.3390/app13085025
Klink J, Brachmański S, Łuczyński M. Assessment of the Quality of Video Sequences Performed by Viewers at Home and in the Laboratory. Applied Sciences. 2023; 13(8):5025. https://doi.org/10.3390/app13085025
Chicago/Turabian StyleKlink, Janusz, Stefan Brachmański, and Michał Łuczyński. 2023. "Assessment of the Quality of Video Sequences Performed by Viewers at Home and in the Laboratory" Applied Sciences 13, no. 8: 5025. https://doi.org/10.3390/app13085025