Article

The Effect of Airflow Velocity through a Laminar Airflow Ceiling (LAFC) on the Assessment of Thermal Comfort in the Operating Room

Research Centre, University of Zilina, Univerzitna 1, 01026 Zilina, Slovakia
*
Author to whom correspondence should be addressed.
Appl. Sci. 2023, 13(8), 4860; https://doi.org/10.3390/app13084860
Submission received: 3 March 2023 / Revised: 4 April 2023 / Accepted: 7 April 2023 / Published: 12 April 2023
(This article belongs to the Special Issue Air Quality in Indoor Environments)

Abstract

:
Forced ventilation is applied in clean rooms, specifically operating rooms, to ensure the health of both the patient and the medical staff. Ventilation reduces the risk of patient contamination, and its parameters are legally prescribed. In addition to preventing contamination, the ventilation system also ensures the creation of a comfortable environment for personnel who spend a large amount of working time in the operating room. This research focuses on the appropriate design of the air flow rate from the distribution element to the operating room. The PMV and PPD indexes were used to evaluate thermal comfort for human beings. The measurements of parameters determining thermal comfort took place in a laboratory with an accurate model of the operating room, including equipment and HVAC system, during the summer months, in cooling mode. Discharge speeds in the range of 0.15–0.175 m/s were evaluated as the most comfortable, with the PPD index ranging up to 22%. There was a significant increase in user dissatisfaction up to the limit of 70% at higher discharge speeds.

1. Introduction

Operating rooms (OR) are legislatively classified as clean rooms according to standard EN 14 644-1 [1]. The first mentions of clean rooms come from the middle of the 19th century. However, their greatest development occurred only after World War II. Legislation determines the conditions of use and the quality of the internal environment of operating rooms [1,2,3,4,5,6,7,8,9]. One of the most important components of clean rooms is the HVAC system, which provides controlled and forced ventilation with air filtration. The HVAC system serves to achieve a low concentration of airborne particles using two mechanisms. The first mechanism works on the principle of diluting the particle concentration by supplying a large amount of clean and filtered air to the OR. The second mechanism consists of pushing particles out of the space around the operating table using laminar air flow [10]. These mechanisms ensure a healthy environment, which is required in the OR for both the patient and the medical staff [11,12]. The concentration of airborne particles and the quality of the indoor environment are monitored to minimize the occurrence of infection during surgery [13]. Infection occurs when an open wound is contaminated with viruses or bacteria that enter the wound through direct contact or are secondarily transmitted by airborne particles [14,15]. Secondary contamination can be prevented by creating a clean zone in the OR. It is an area covered by a laminar airflow ceiling (LAFC), where filtered air is supplied [16,17]. Air flow in the clean zone prevents the dispersion of pathogenic airborne particles [14,18]. Common air flow velocities from LAFC are from 0.1 to 0.5 m/s [1,5,6,7,8,9,19,20], which can result in decreased thermal comfort for staff and patients in clean zone.
The HVAC system defines not only the air flow in the operating room but also the thermal conditions [21], which are specified by legislation and standards [1,2,5,6,7,8,9]. These standards also prescribe the use of LAFC in operating rooms. In addition to infection prevention, HVAC technical standards state that thermal comfort must be achieved in the OR for all members of the surgical staff as well as for the patient [13,21]. Thermal comfort is defined as a state when the thermoregulatory member of the human body is minimally stressed or as a state of mind that expresses satisfaction with the internal microclimate [3,22,23,24,25,26]. The perception of the thermal environment by people is evaluated by the international standard ISO 7730, standard EN 15 251 and standard ASHRAE 55 [3,4,18,27]. Various models and assessment indices have been created to assess the quality of the indoor environment and thermal comfort. Among the first is the “Two-node model”, which compares the temperature of the core of the body and the surface of the body for the analysis of energy exchanges between the human body and the surrounding environment [28]. In the publication “Determining lines of equal comfort” [29], the concept of thermal comfort was empirically expressed using the effective temperature. Subsequently, these studies were improved, and the “Standard Effective Temperature” [30] was introduced. Currently, the most used model is according to Fanger, which represents the PMV (Predicted Mean Vote) and the PPD (Percentage People Dissatisfied) indices for predicting a person’s thermal sensation [31]. In these models, thermal comfort is a function of subjective parameters, including thermal resistance of clothing and heat flow from the body due to metabolism, and objective parameters, including mean radiant temperature, air temperature, air flow velocity and air humidity in the room [31,32,33].
Several studies on thermal comfort in clean rooms, and specifically in the OR, have reported that achieving thermal comfort during LAFC operation is problematic [6,7,8,9,16,17,21,34,35]. Different feelings of comfort and perception of air temperature result in different subjective parameters of thermal well-being. Persons in the operating room differ in the thermal resistance of clothing (CLO) but also in the heat flow from the body due to metabolism (MET). In addition to these parameters, the position of the person in the OR has a fundamental influence on the overall feeling of thermal well-being. By default, the medical staff stands during the procedure in the OR, though some participants can also sit, e.g., anesthesiologist doctor and anesthesiologist nurse. In most cases, the patient is in a horizontal position on the operating table. The mentioned studies state that due to these differences, it is impossible to simultaneously achieve thermophysiological comfort within 10% of the patient’s PPD in terms of the staff, or individual staff in terms of one another. In this study, we will address the reduction of the PPD index for users in the OR by appropriate adjustment of the outlet airflow rate through the LAFC. The novelty of this study is the provision of information for designers on how to appropriately choose the size range and flow rate through LAFC in clean rooms.

2. Materials and Methods

The aim of the study is to improve the thermal comfort in OR spaces by means of the appropriate setting of the flow rate through the LAFC. The PMV and PPD indices were evaluated in an experimental laboratory, which was built as an OR model on a real scale.

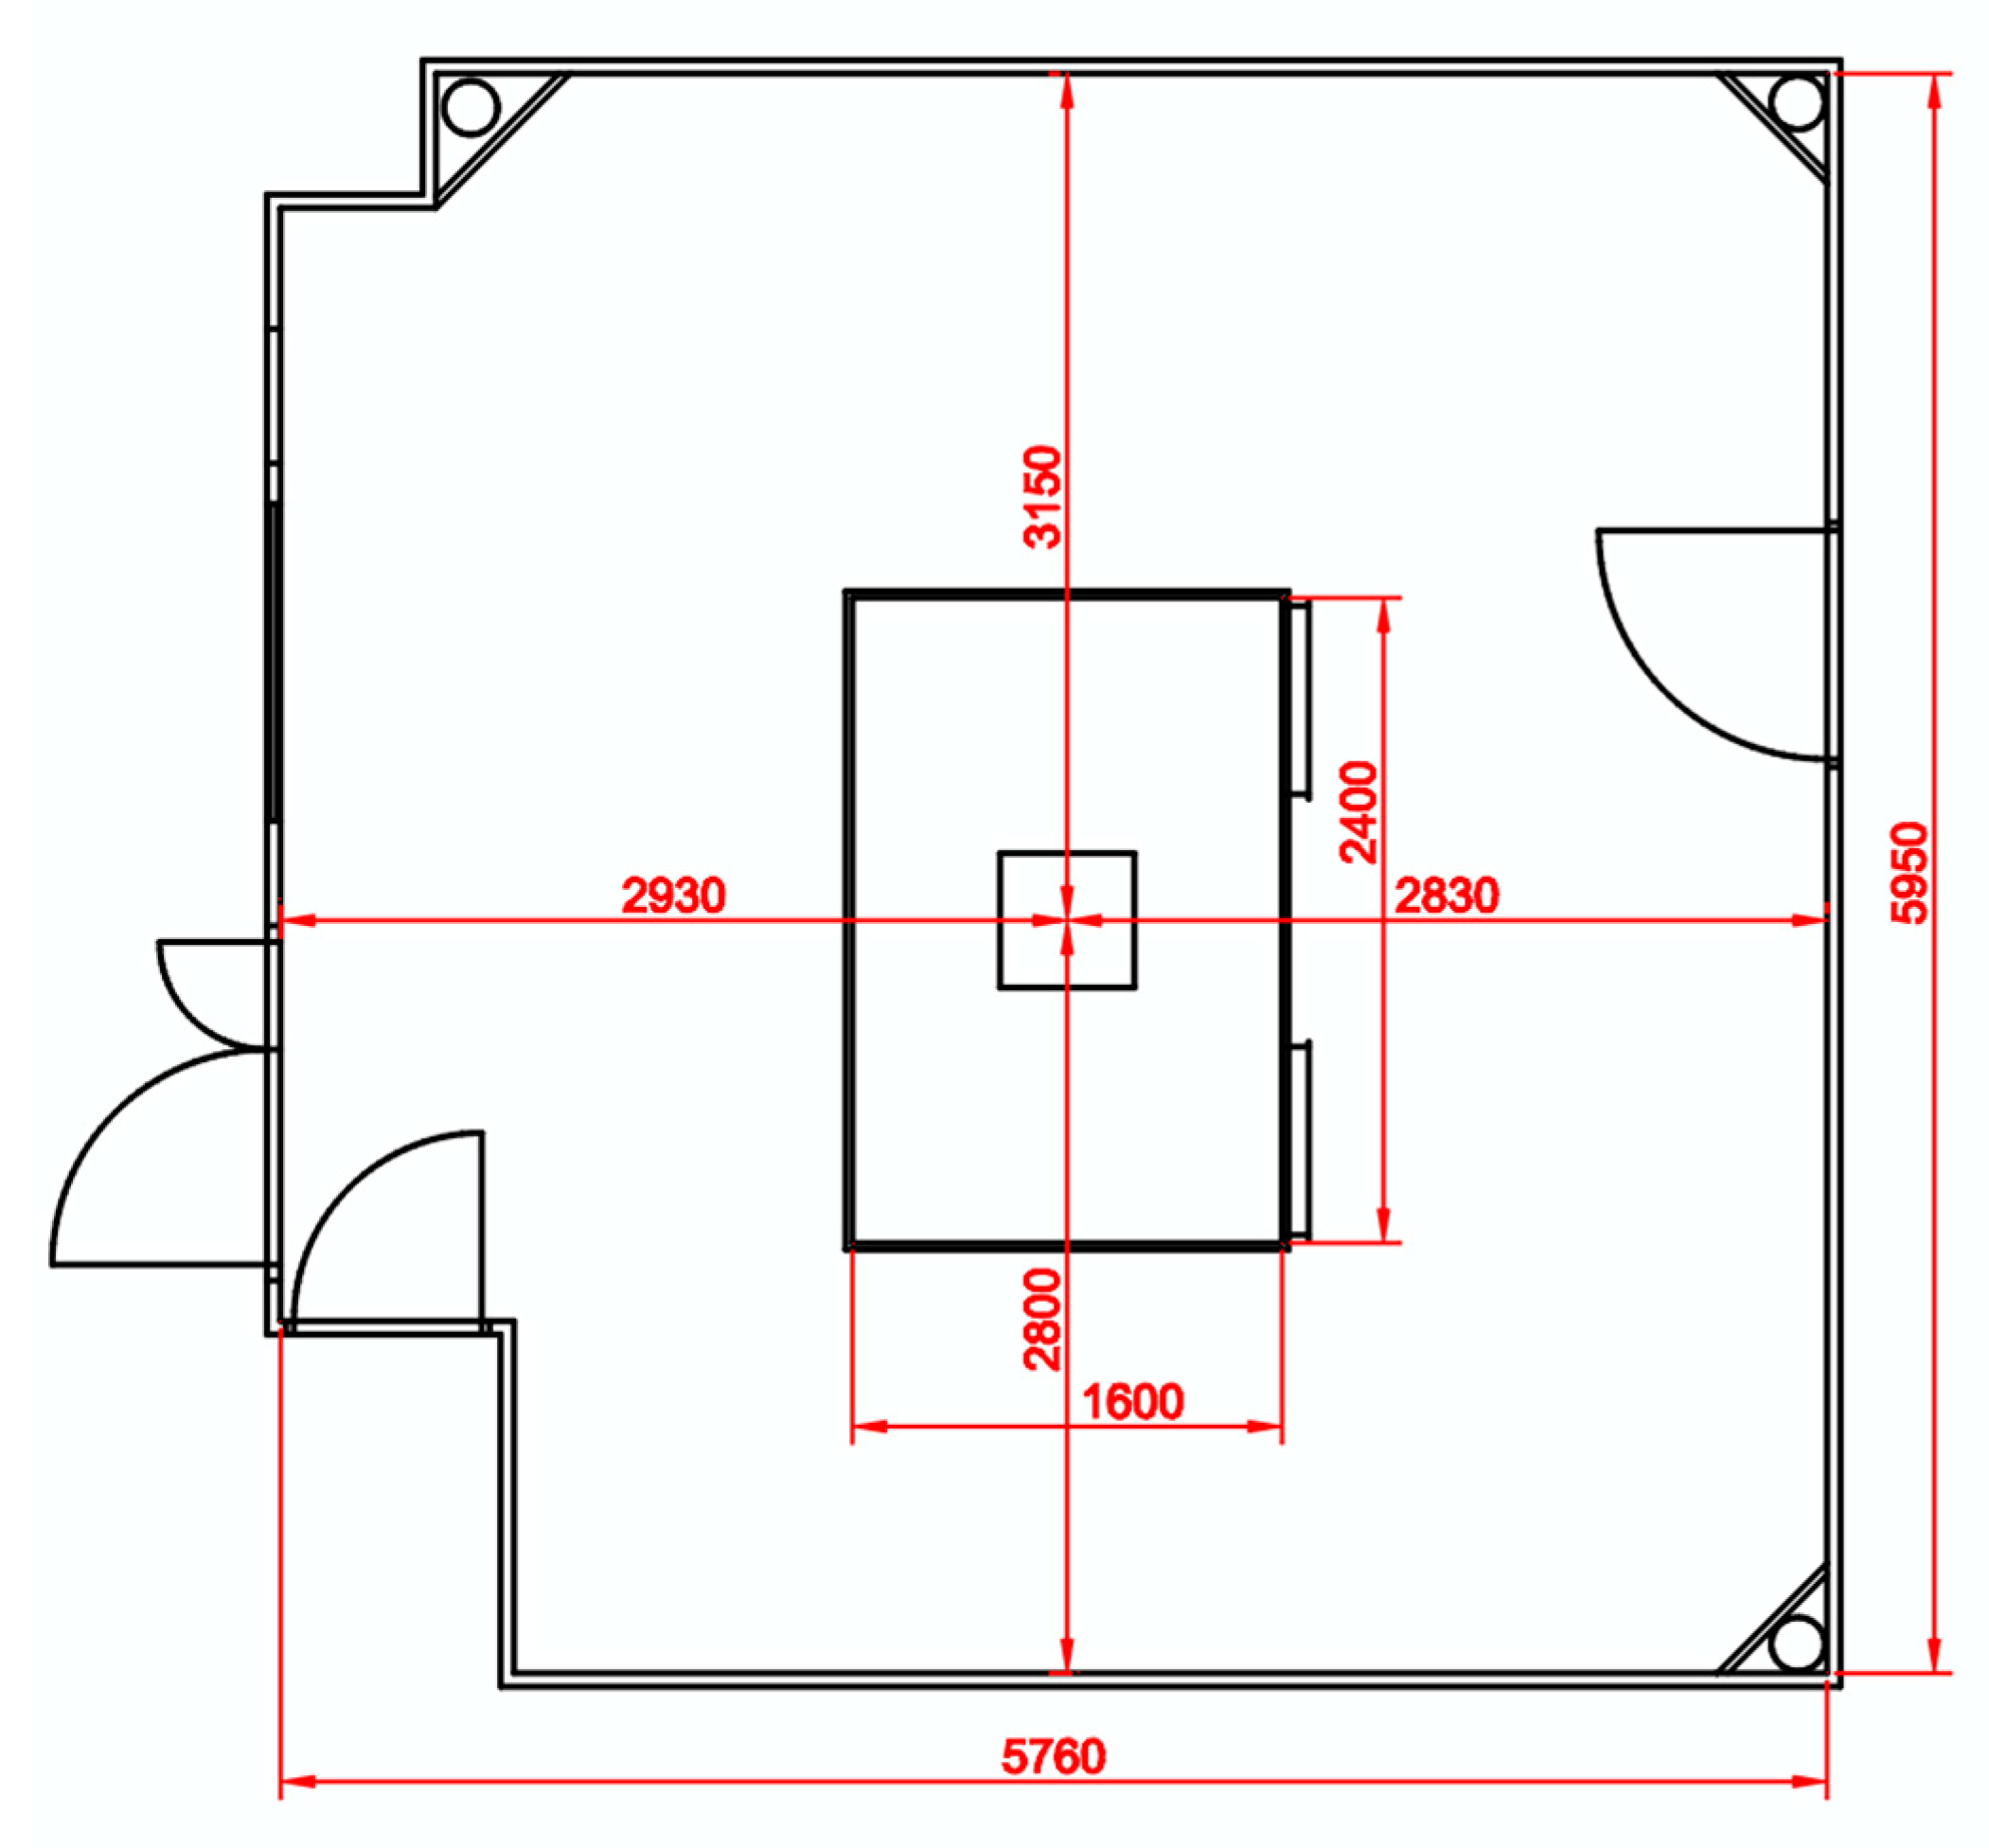
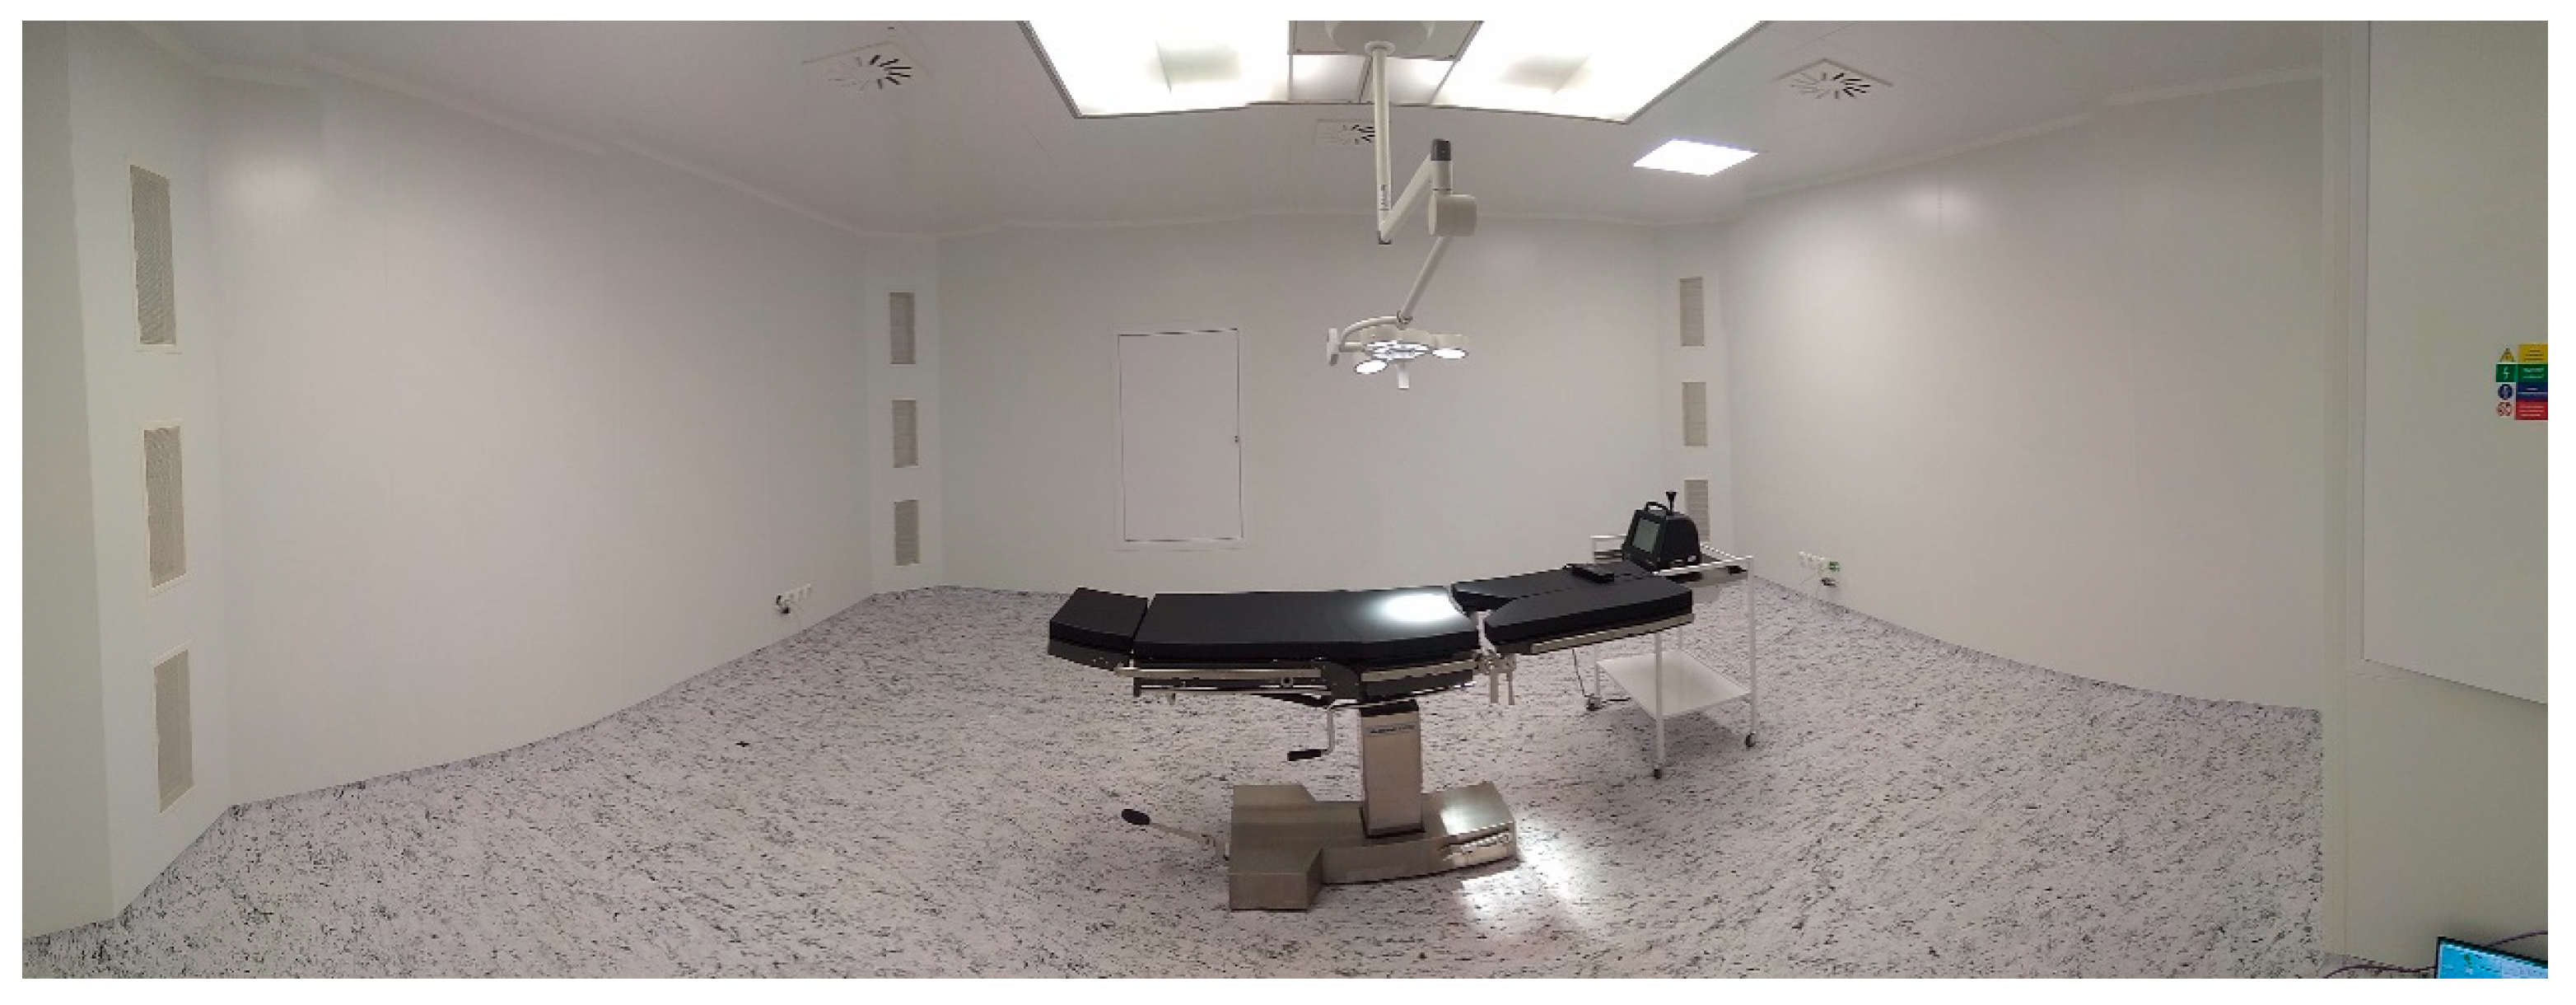
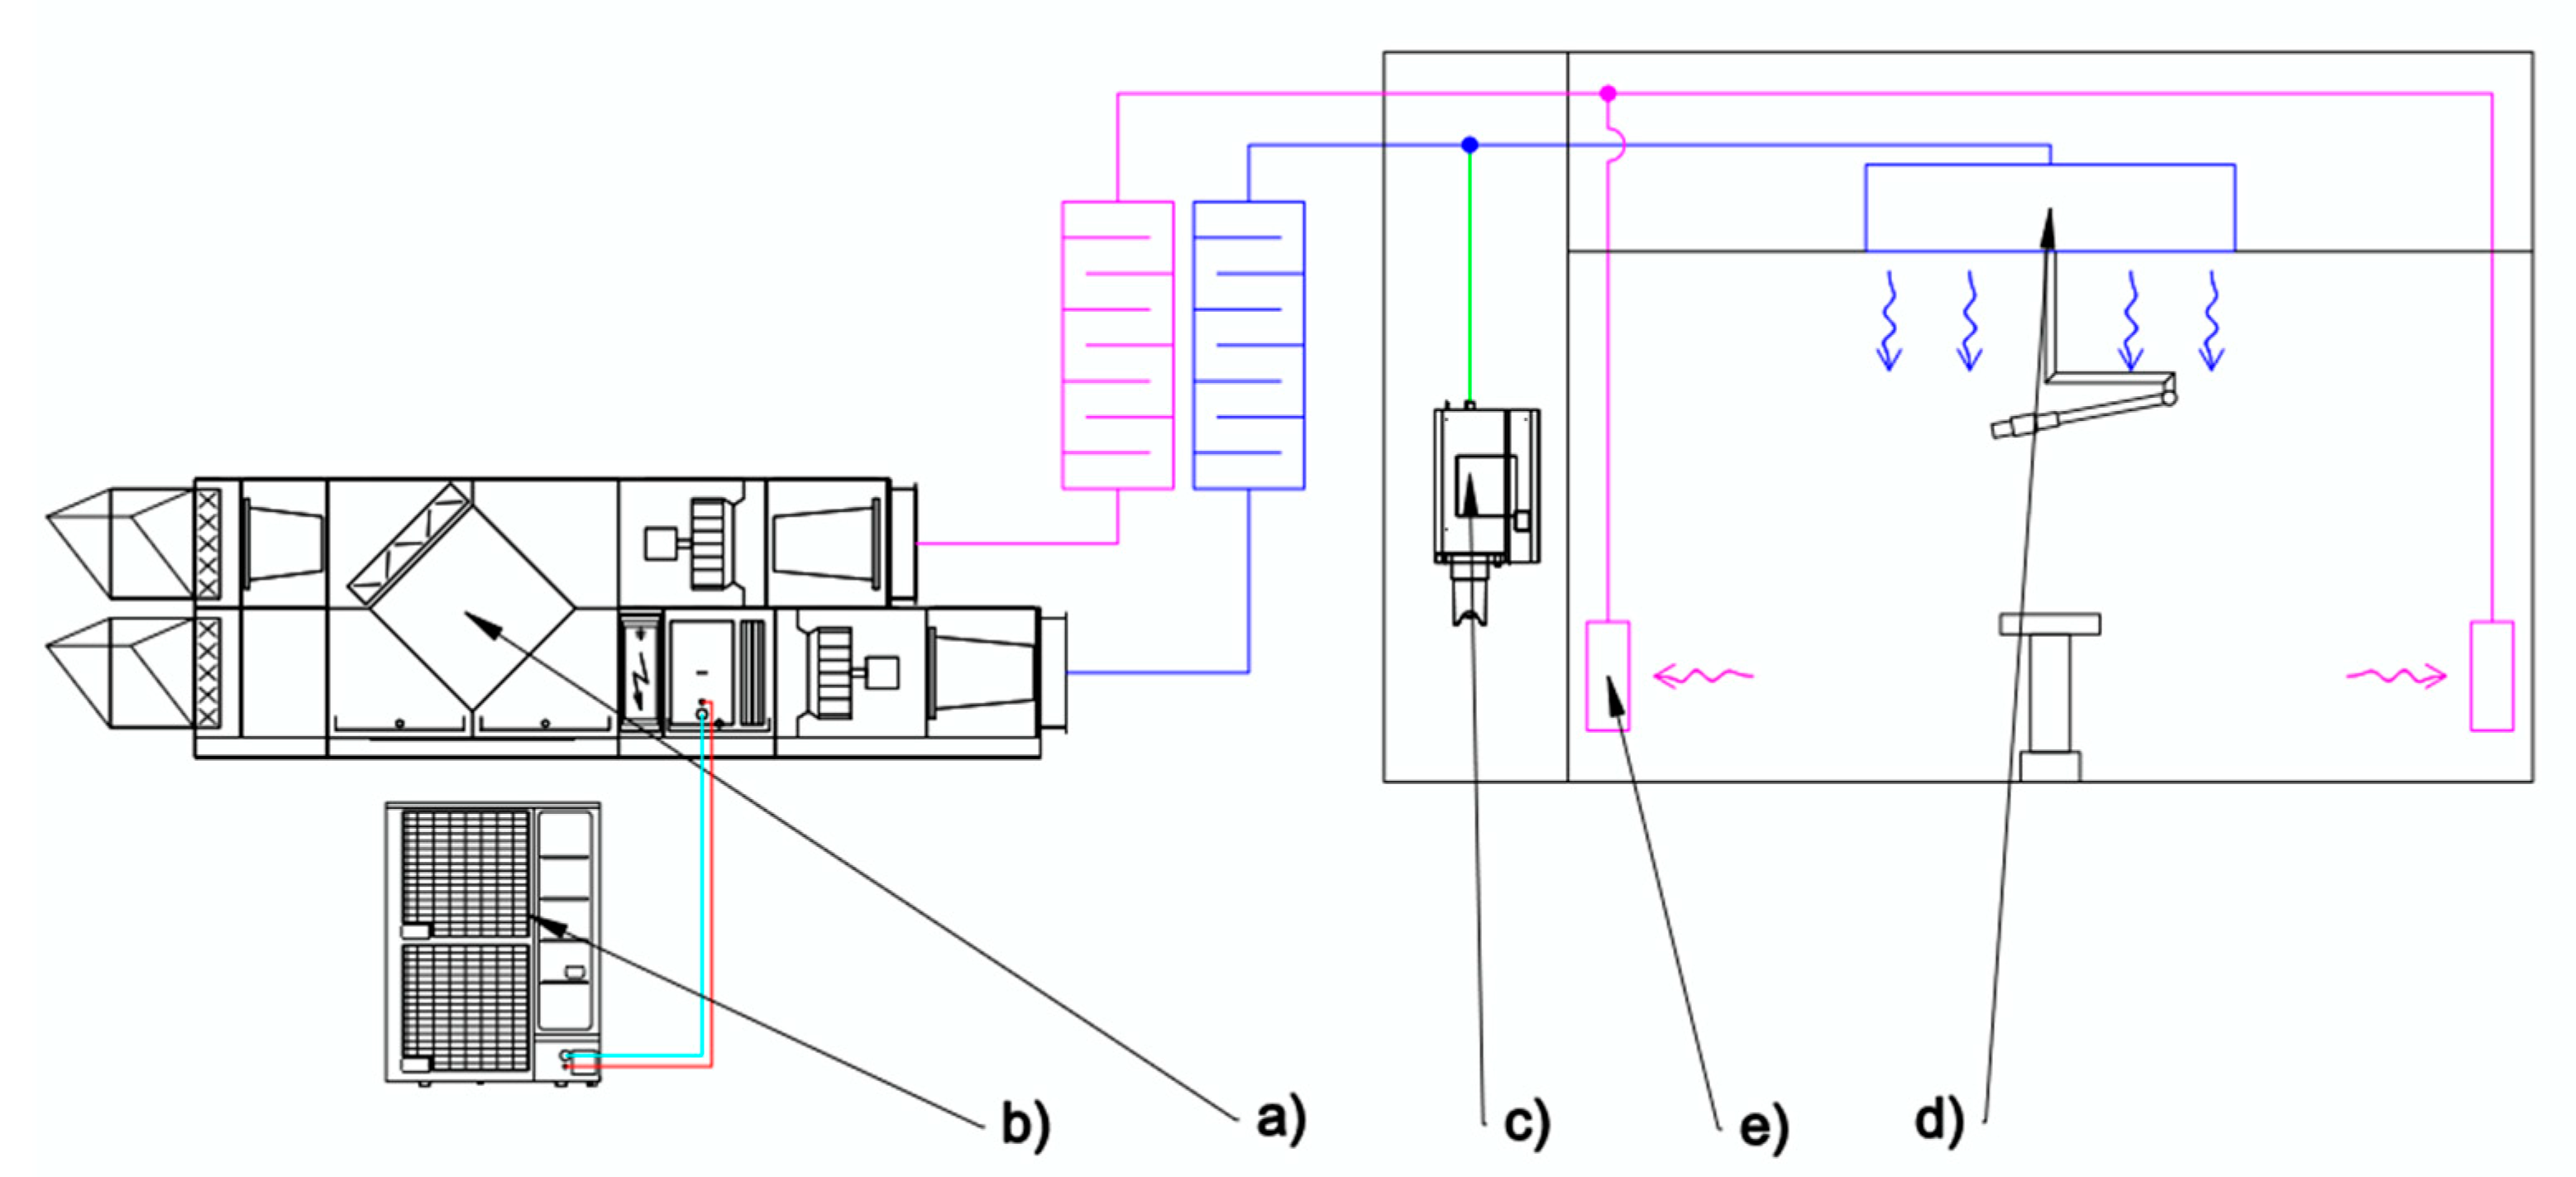
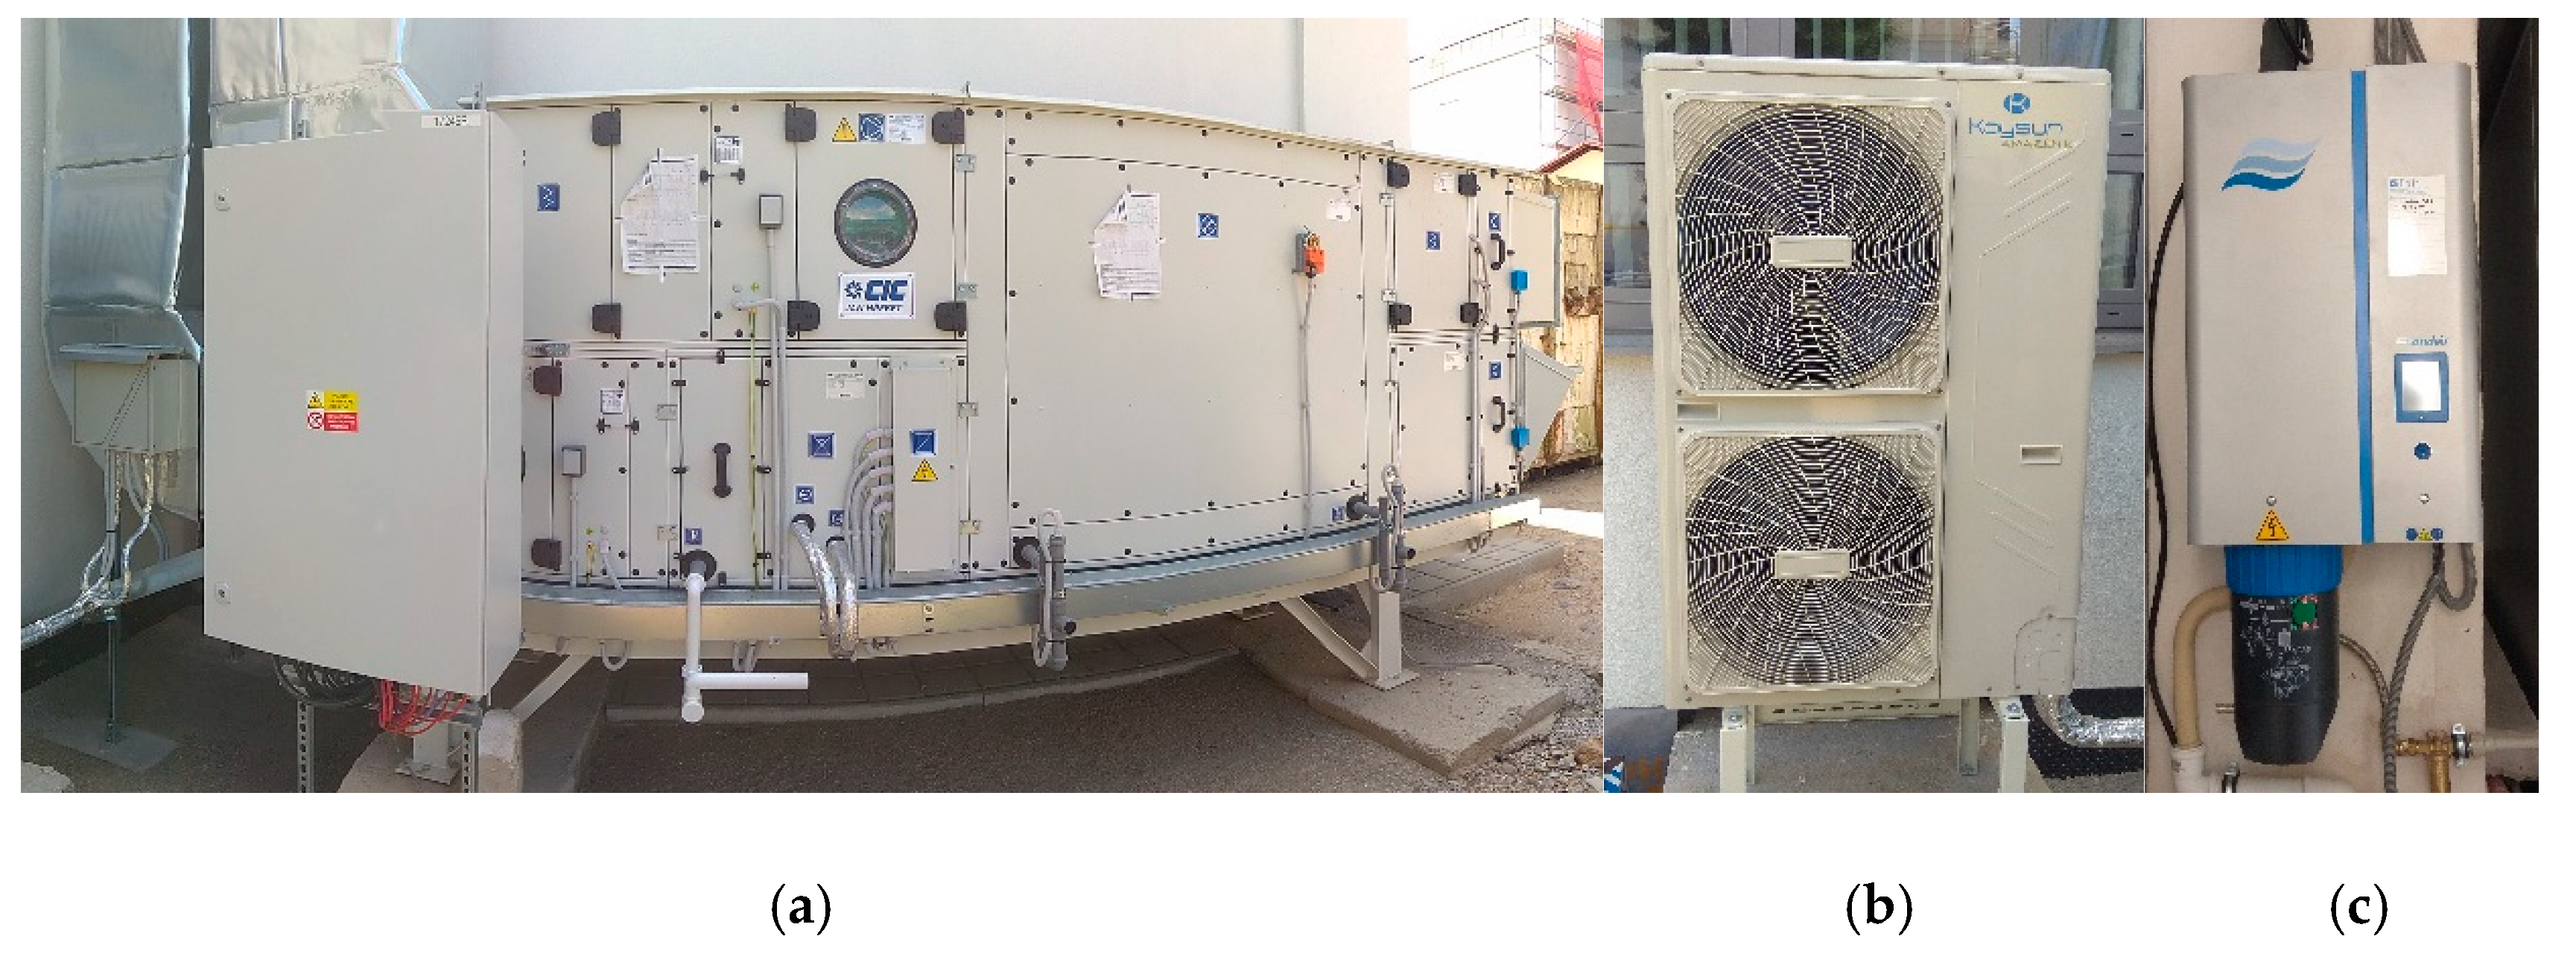
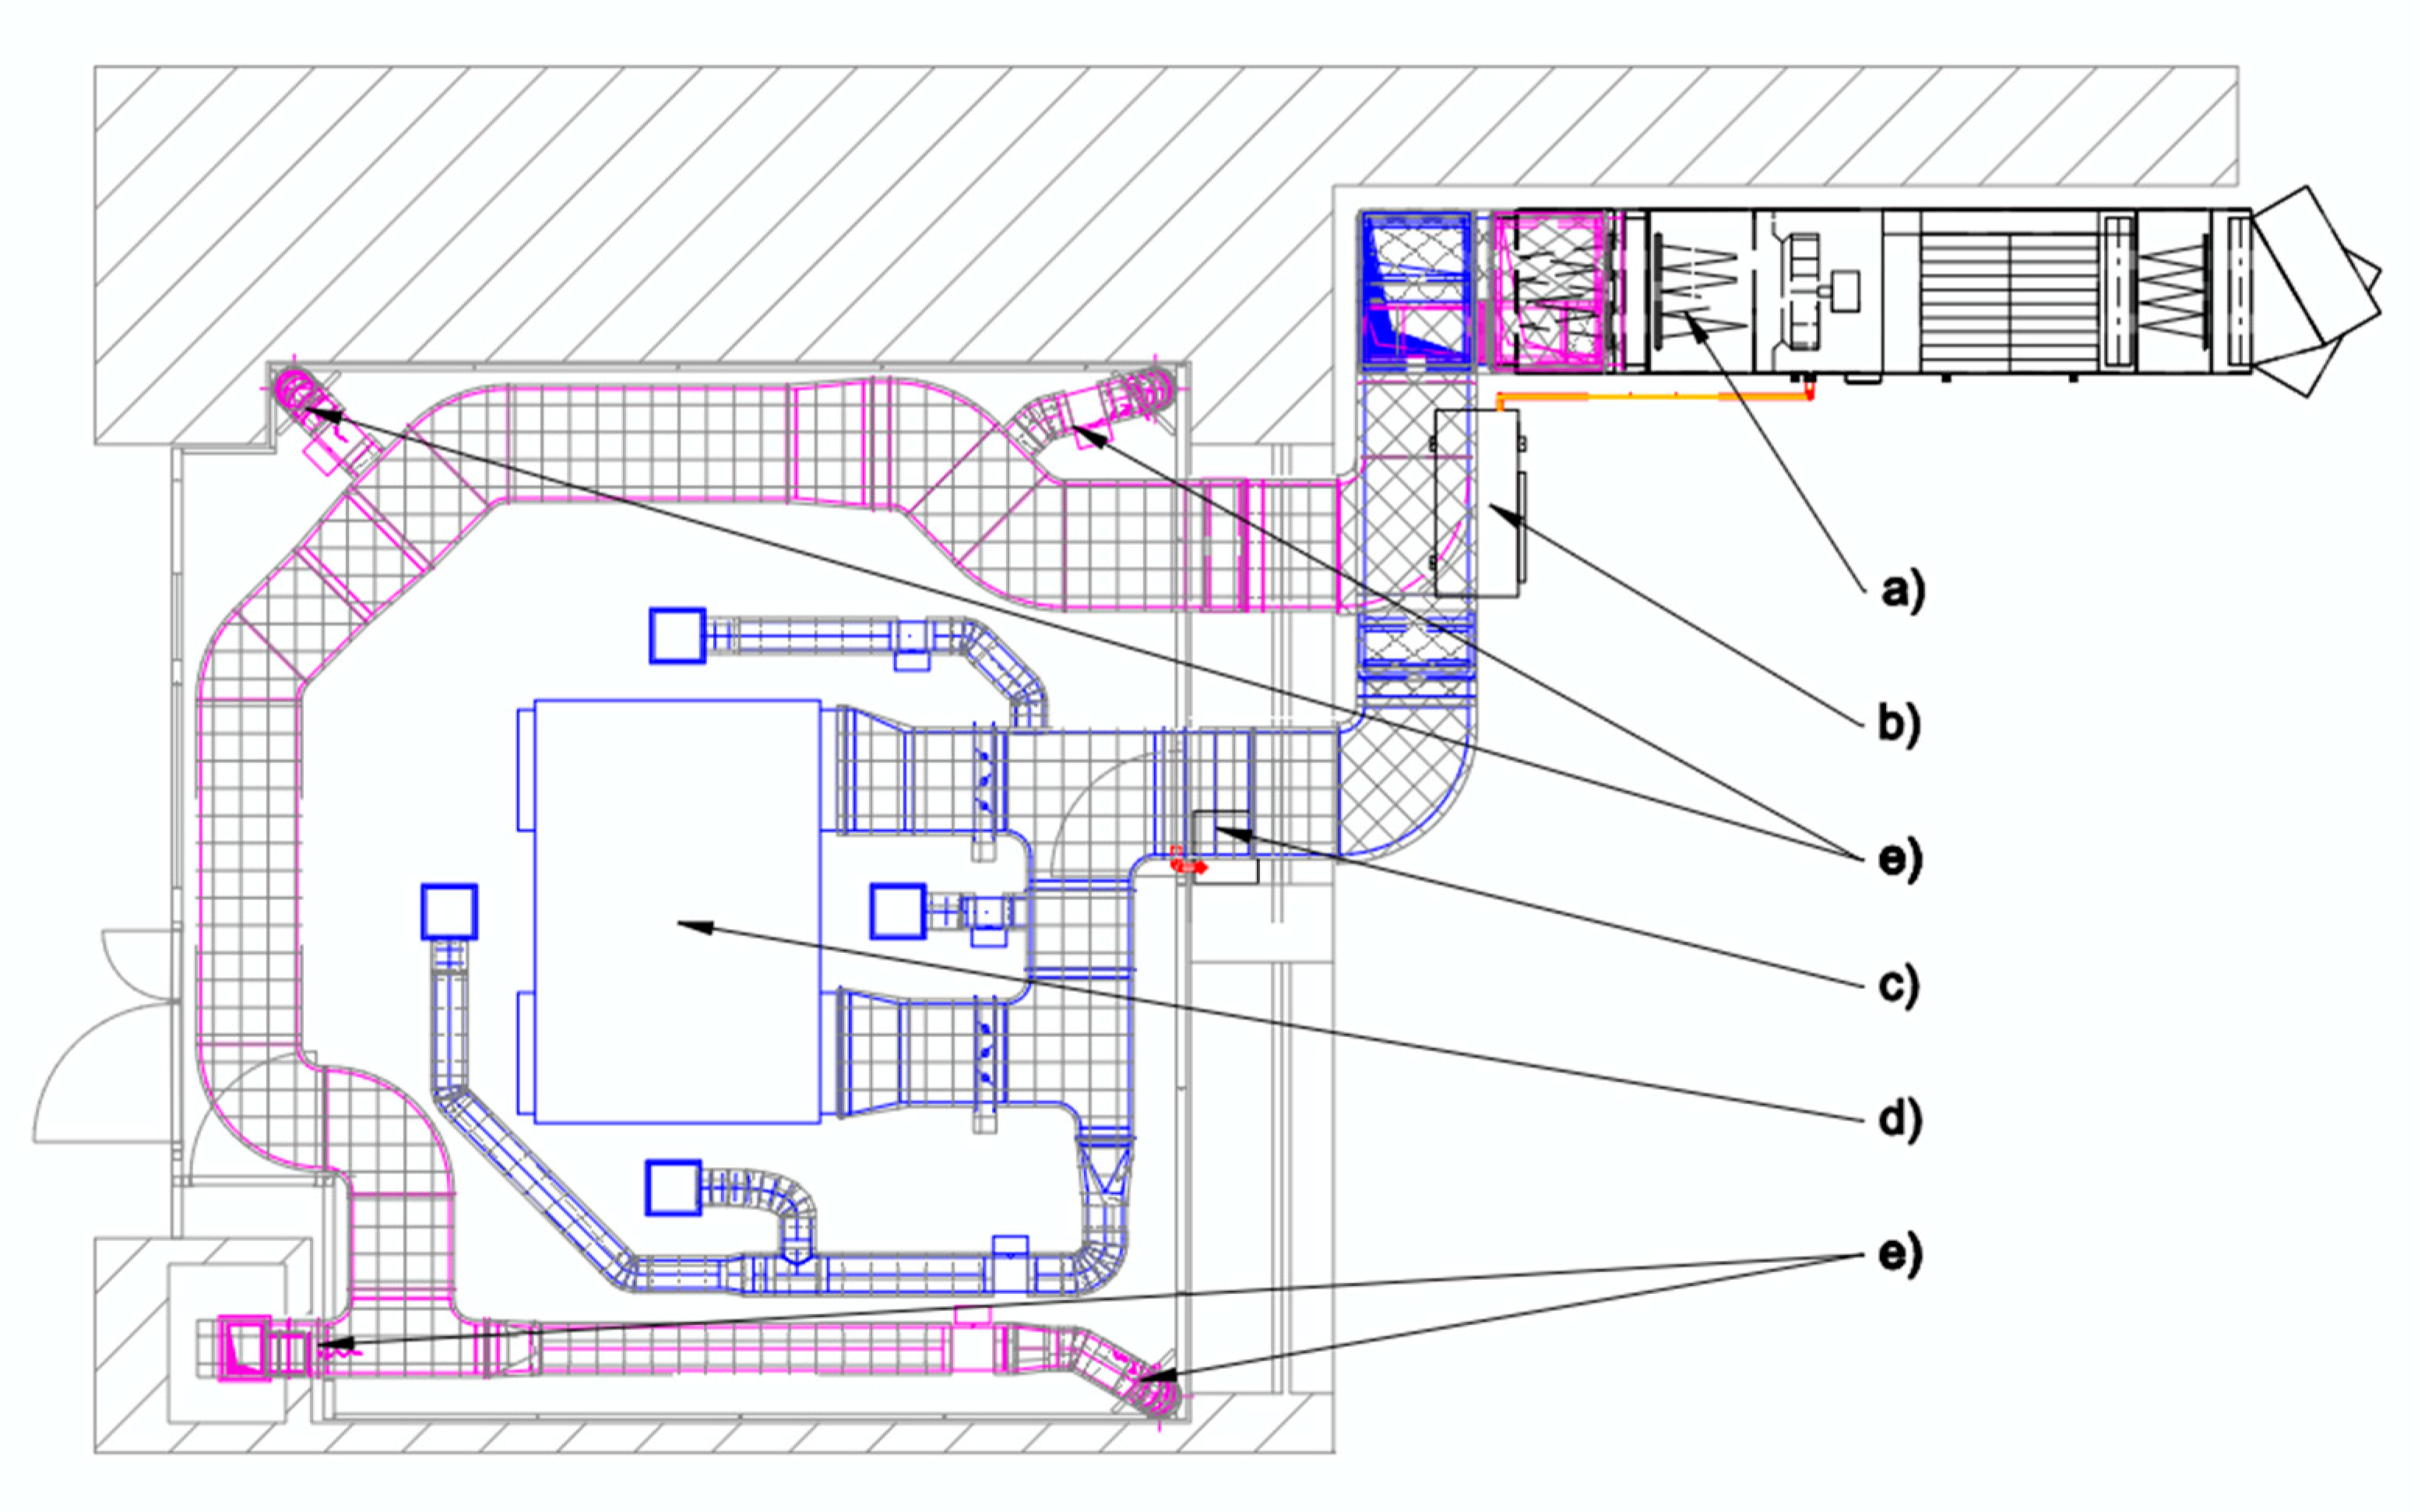
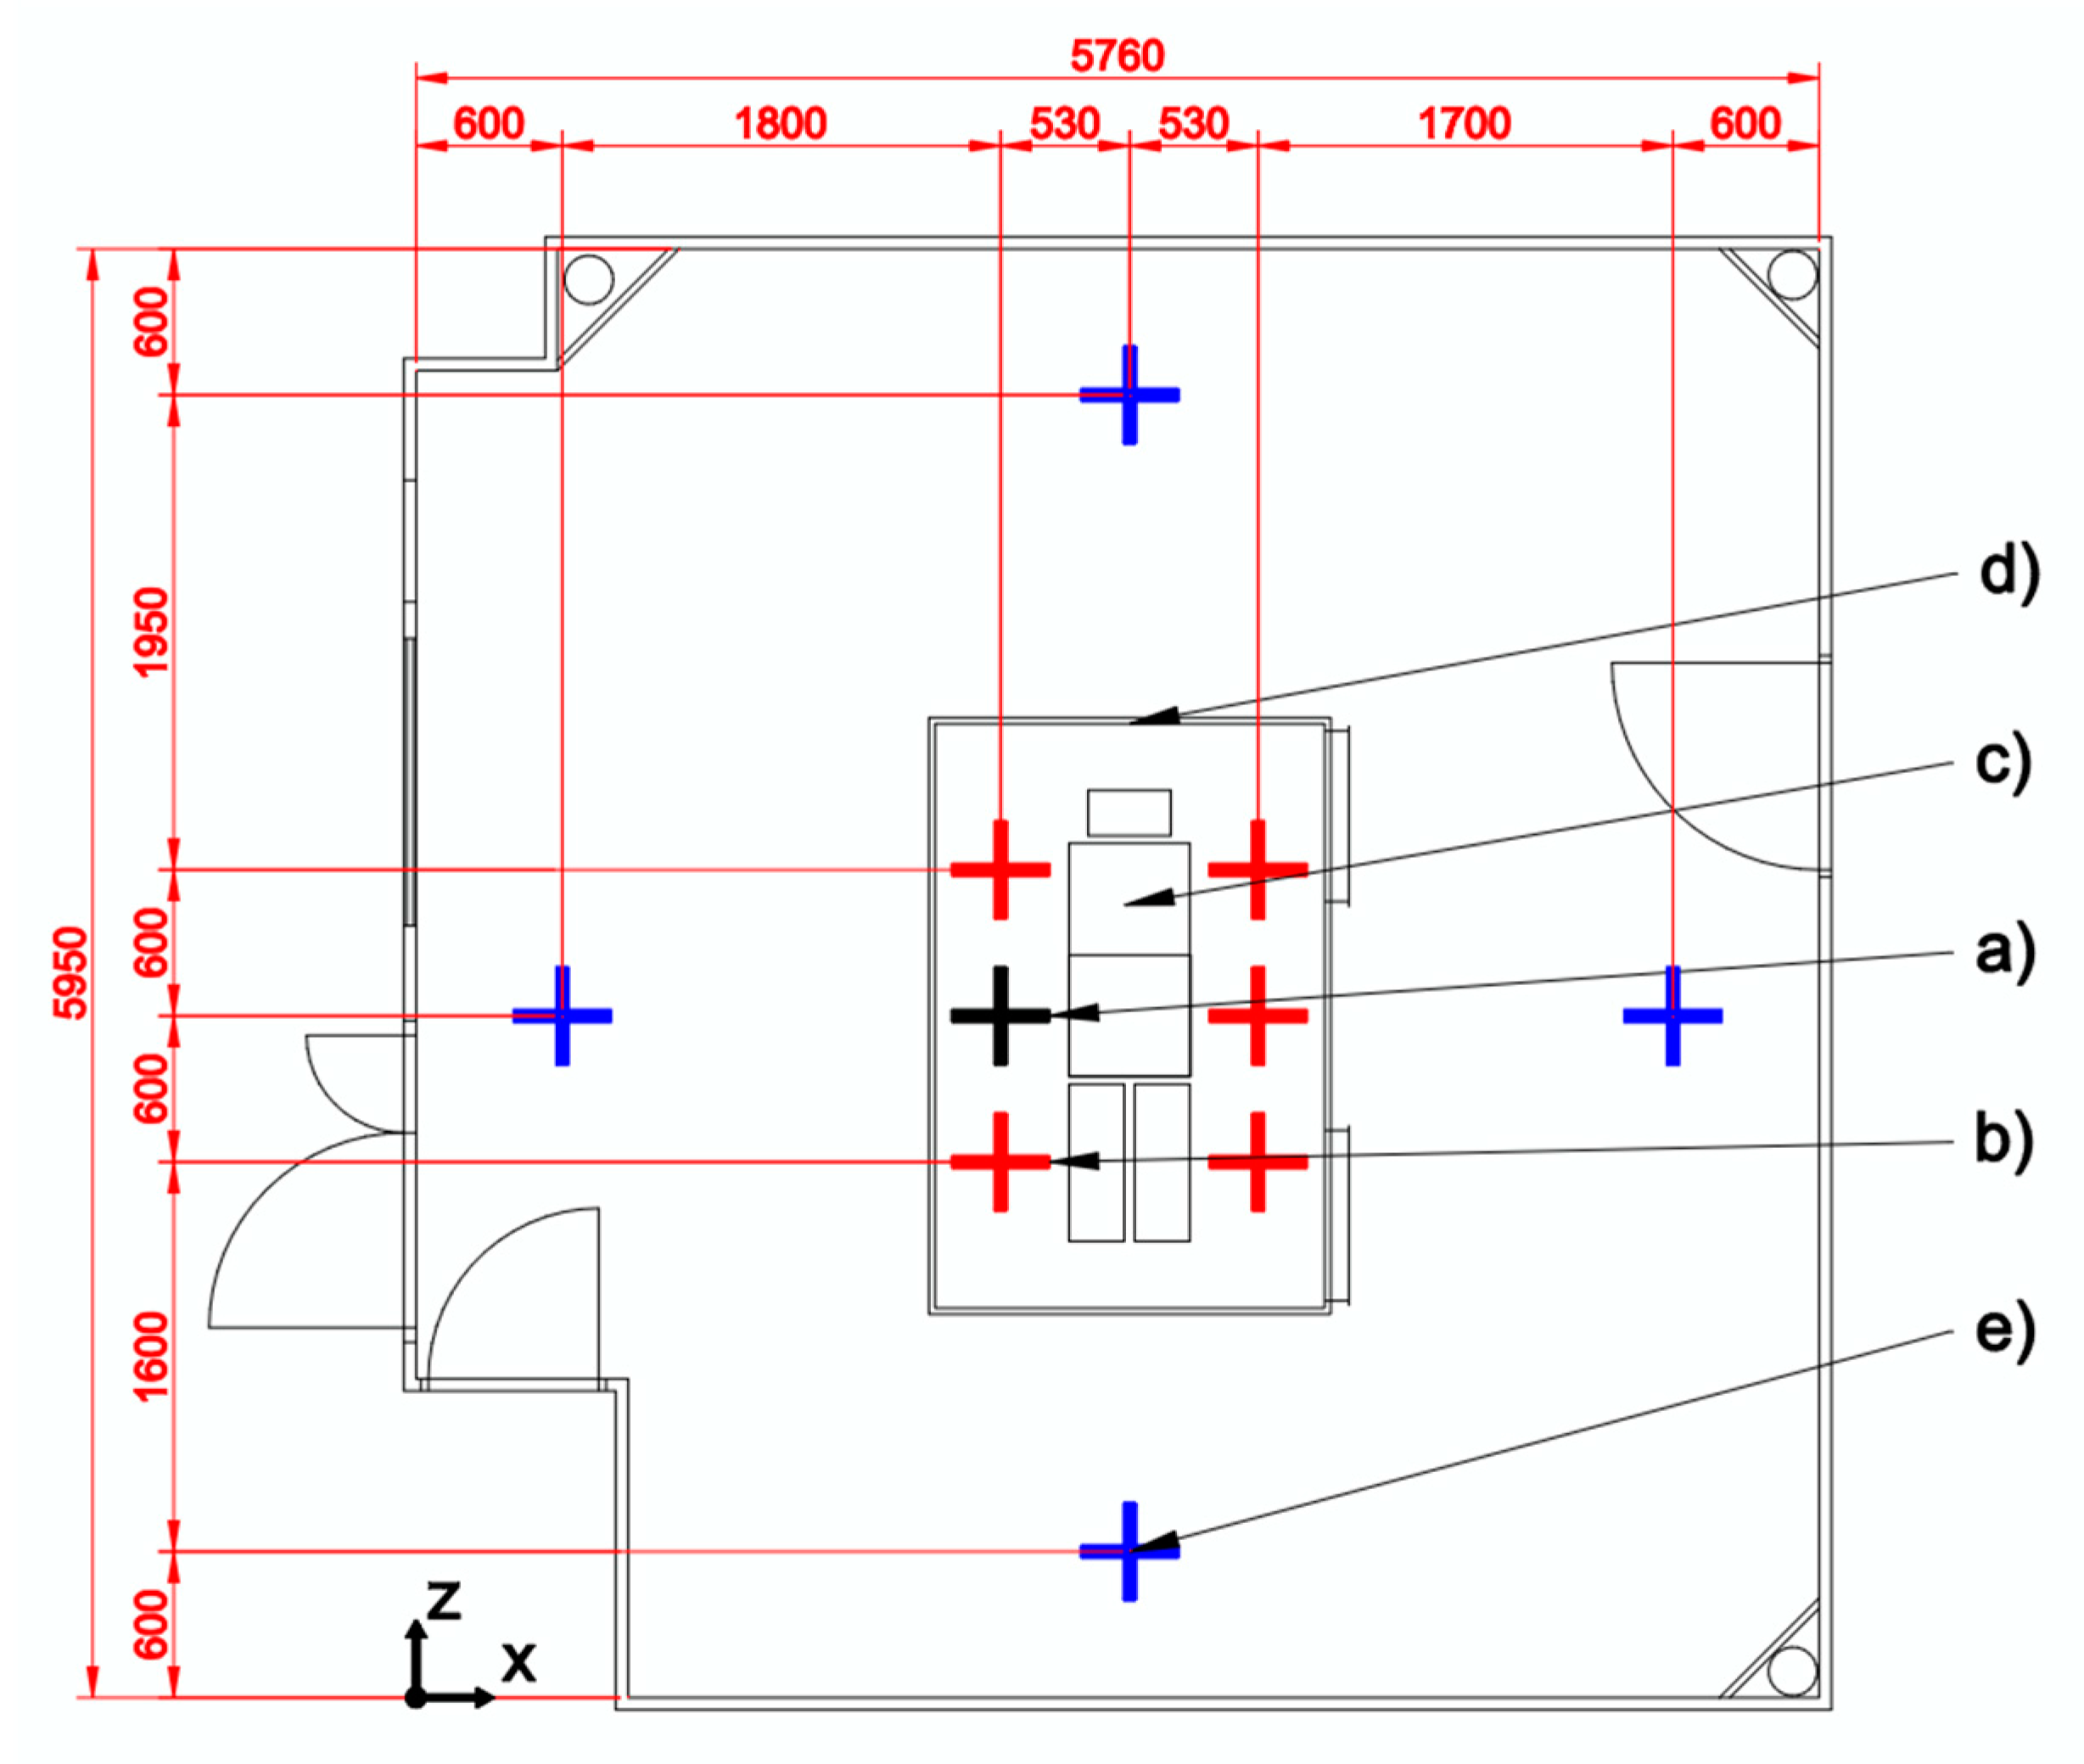
2.1. Operating Room Model

The experimental laboratory for the simulation of operating room ventilation was designed and implemented according to the currently valid legislation in the area of the research [1,2]. The dimensions of the laboratory are 5.76 × 5.95 × 2.70 m3 (Figure 1). The supply distribution element (LAFC) is located slightly asymmetrically from the center of the laboratory floor plan. The structural elements are certified for use in clean rooms and have a low level of airborne particle emission. The floor is made of antistatic material. The walls are composed of metal panels with thermal insulation inside and polyethylene film on the surface. The ceiling is made of metal cassettes with a polyethylene surface to reduce the number of emitted particles. Internal equipment such as electrical sockets, lamps, operating table, operating lamp, instrument tables and others are also certified for use in clean rooms. The equipment of the laboratory can be seen in Figure 2. In a previous study, a CFD model with the same geometry was also created [19].
The HVAC system is designed to ensure an internal microclimate, achieve thermal comfort, and create a clean environment with a low concentration of airborne particles. Its performance, air flow, internal temperature and relative air humidity are specified by legislation and are compared with the study of R.V. Gaever et al. [21]. This comparison is supplemented by legislative requirements of the country origin (Table 1).
As shown in Table 1, the ventilation system was designed to meet legislative requirements, which include the minimum air exchange rate for cleanliness as specified in ISO EN 6 (typical aseptic operating room with LAFC). According to EN ISO 14 644-1, the air-change rate (ACR) should be 120–300 h−1 in the area of the clean zone (floor plan area covered by LAFC, 2.4 × 1.6 m). To fulfill this condition, a volumetric air flow of 1250–3120 m3/h is required. At the same time, according to Z. z. 259/2012, it is necessary to maintain an ACR in the entire volume of the room of at least 15/h, which represents a volume flow of 1320 m3/h. The designed ventilation unit with exterior design enables a variable air flow of up to 3200 m3/h with an external pressure loss of up to 600 Pa in the range of 30–100%. The ventilation unit is equipped with a cross exchanger, two-stage filtration of the supplied air, a heater and cooler in the form of a condenser and evaporator, and a backup electric heater. The backup electric heater serves to prevent the cooling down of air in the OR during defrosting of the heat pump (source of heat and cold for HVAC). An external air humidifier is added to maintain the relative humidity within the permitted range. A schematic representation of the HVAC system is shown in Figure 3. The location of the ventilation unit in the version for clean rooms, as well as the heat pump and air humidifier, are shown in Figure 4; Figure 5 shows a plan view of the HVAC.
The intake square diffusers are also indicated on the HVAC plan drawing. These diffusers are designed for clean spaces and were closed with tight check valves during the measurement. This will avoid affecting the airflow through the LAFC, and only the airflow image formed by the flow through the LAFC will be monitored. In a previous study [20], a difference in the air flow rate gradients in the entire cross-section of the OR was visible, due to the change in the air flow rate through the LAFC. A comparison of the profiles passing through the center of the LAFC for the outflow velocity of 0.15 and 0.25 m/s through the LAFC is shown in Figure 6.

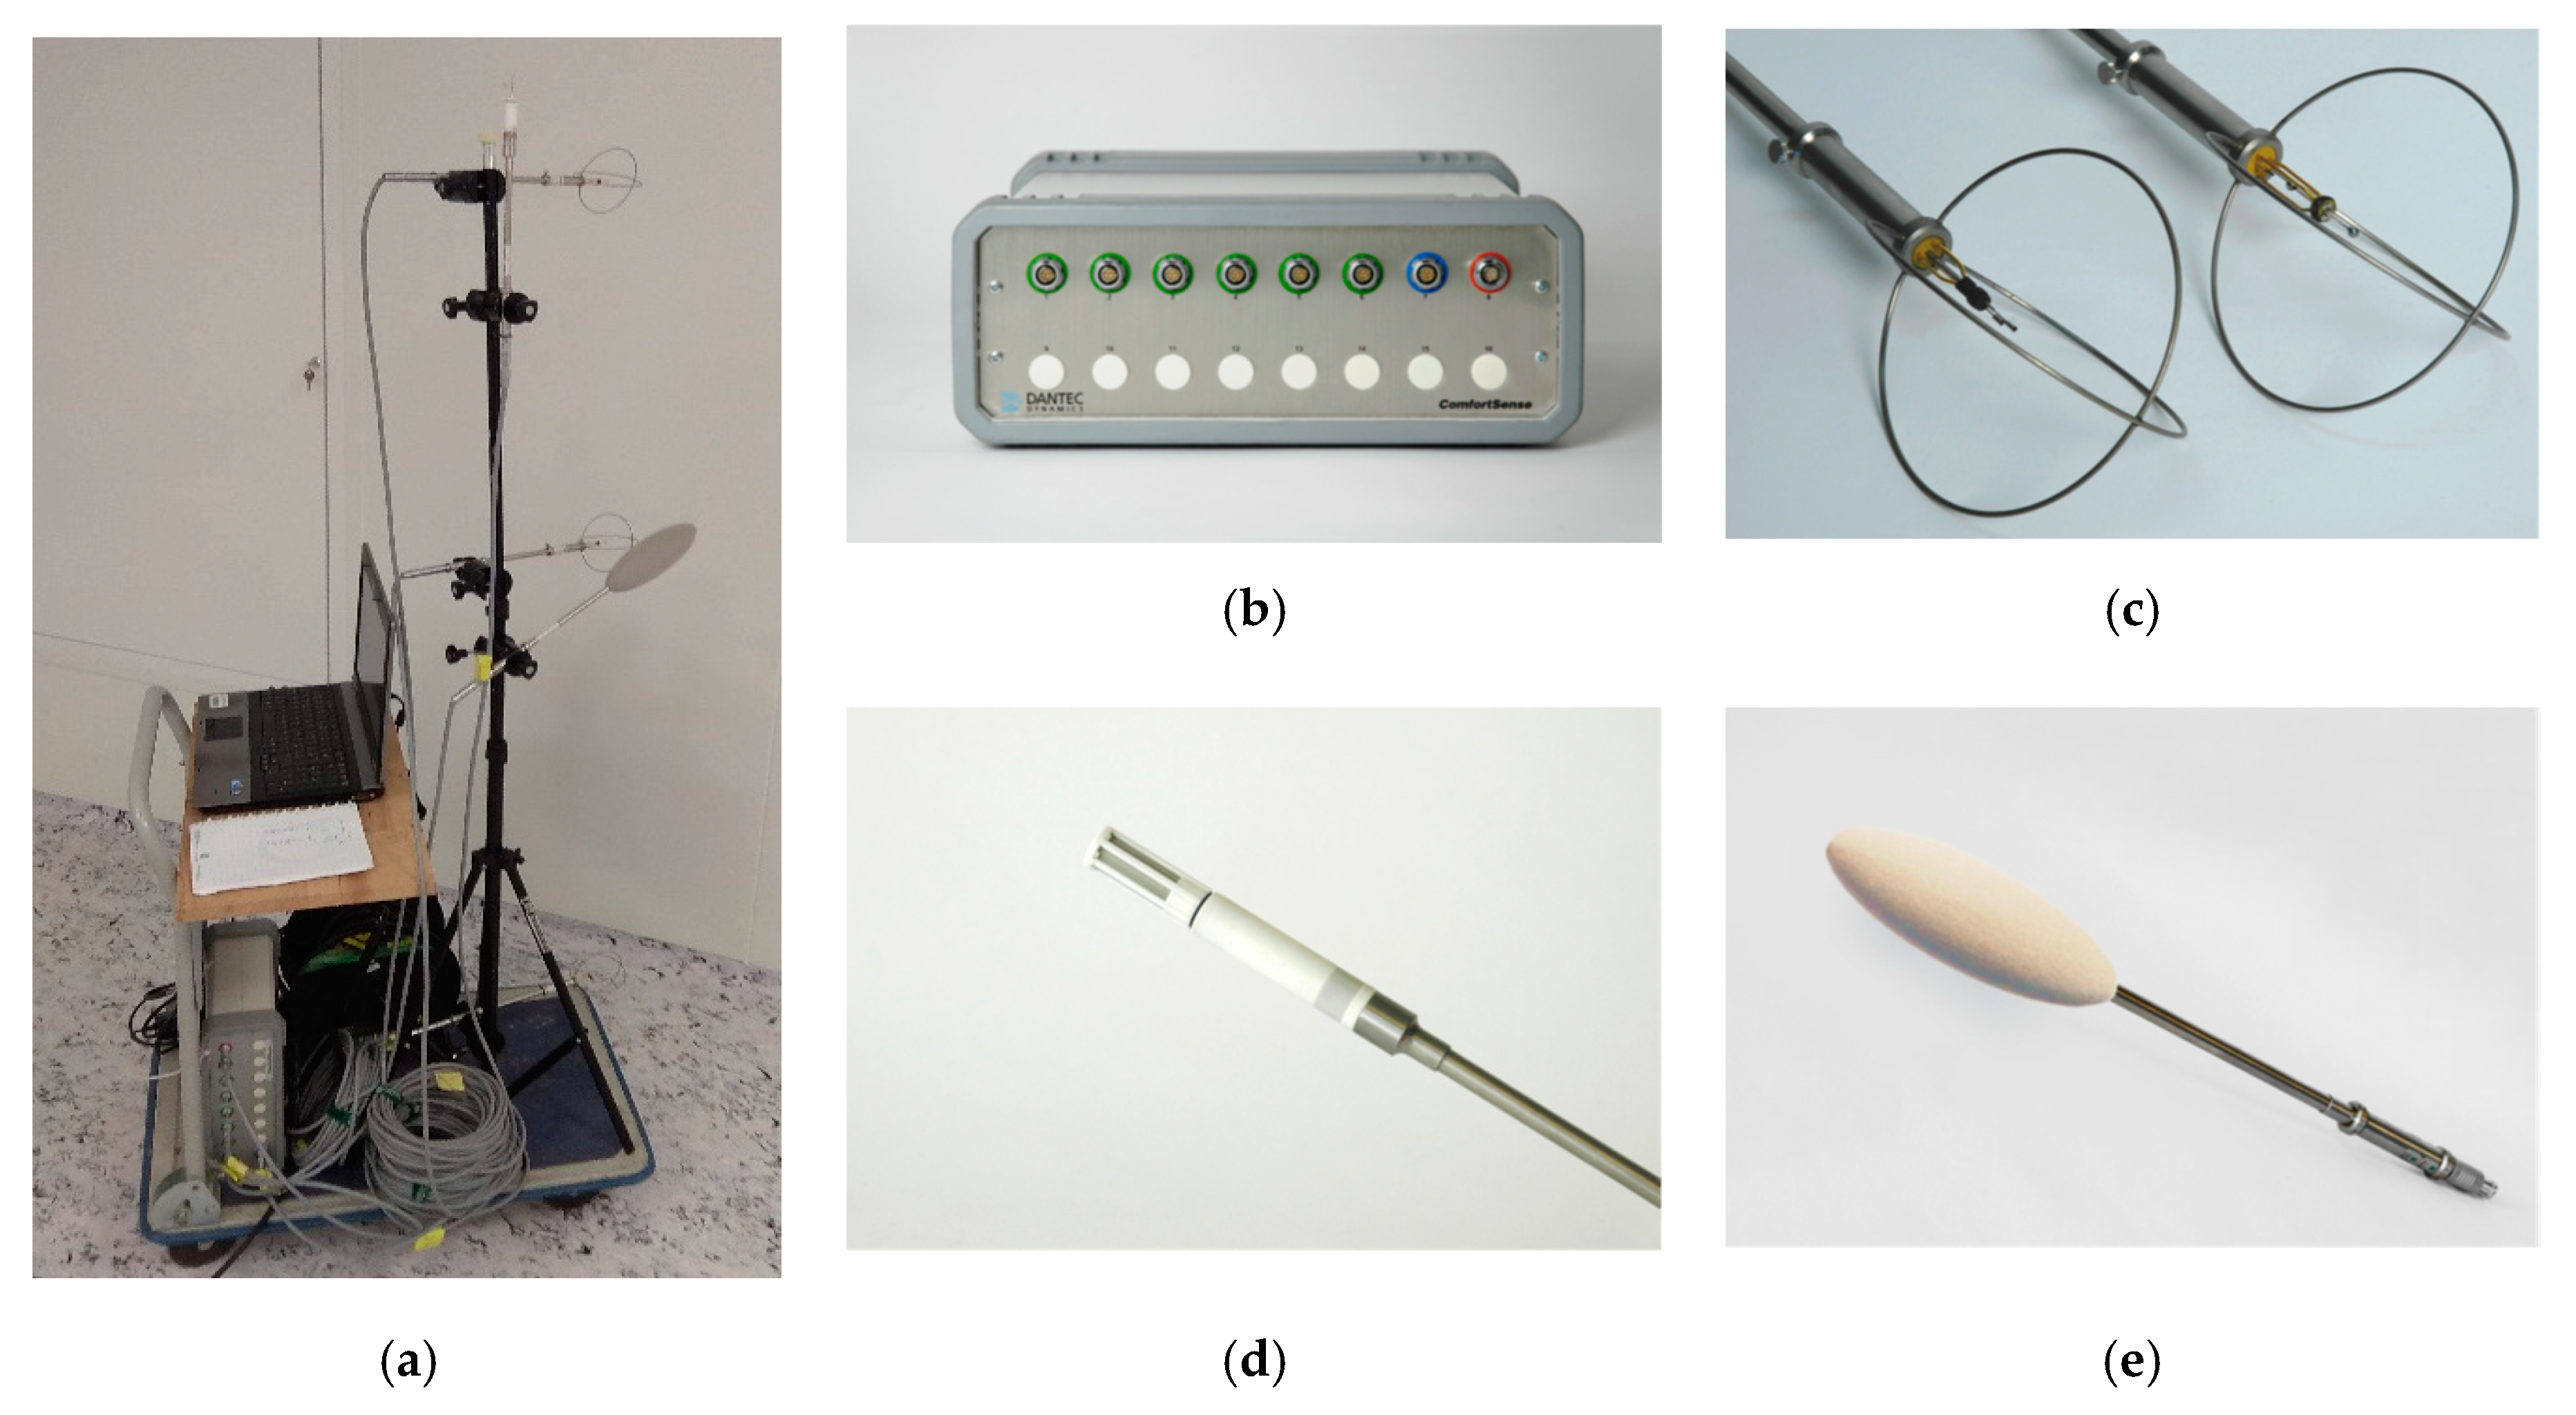
2.2. Evaluation of Thermal Comfort

The thermophysiological model defined by Fanger [31] was used to assess the quality of the thermal comfort environment in the OR. The model describes a person’s thermal sensation according to the predicted mean voice (PMV). It depends on the parameters of the internal environment and the reaction of the human body to these parameters [13,24]. This is a complicated iterative calculation with several variables; it is explained in more detail in several studies [36,37]. In a simplified way, it can be described as a function of the internal parameters of the environment, according to Equation (1).
f q q , R c l , θ i , φ , v i , θ u = 0
where
  • qq—total density of heat flow from the human body (W/m2)
  • Rcl—thermal resistance of clothing (CLO) (m2K/W)
  • θi—indoor air temperature (°C)
  • pi—partial pressure of the water vapor of the internal air (Pa)
  • vi—indoor air flow rate (m/s)
  • θu—average radiant temperature (°C)
The indoor environment is rated on a 7-point scale ranging from −3 (cold) to +3 (hot), with 0 being neutral. Since this scale does not create an adequate idea of the quality of the thermal-humidity microclimate in the environment, the PPD index (predicted percentage of dissatisfied) is also introduced. This index is a function of the PMV index [38]. Optimal thermal comfort is determined as between PMV −0.5 and +0.5 [17,24,31], which represents a range of 5 to 20% PPD.
The ComfortSense Dantec measuring device was used to measure the internal parameters of the thermal-humidity microclimate and evaluate the PMV and PPD indexes. The device is designed for the development and research of heating, cooling and ventilation systems, using multi-point measurement of temperature and air velocity. The device consists of five measuring elements (H1, H2, H3, OT and RH) on a tripod, a measuring unit for the transformation of an analog signal into a digital, cabling and the corresponding NiMax software (https://www.ni.com/en-rs/support/documentation/supplemental/21/what-is-ni-measurement---automation-explorer--ni-max--.html, accessed on 6 April 2023). The designation of measuring elements and measured quantities is given in Table 2. The measuring device and measuring elements are shown in Figure 7. Thermal comfort parameters were measured in the position of the surgeon at the operating table. The measuring station is shown in Figure 8. Stationary measurements were taken for 30 min at each measuring position. The resulting values are averaged over the entire measurement period. The measurement error and the inaccuracy of the measuring members are shown in Table 2.
The measured parameters of the thermal-humidity microclimate at the measuring stand with the surgeon’s position differed minimally from the alternative positions; therefore, only the results from the surgeon’s position will be presented in this chapter. The advantage of the measuring device and the software used is the evaluation of the profiles of air flow speed and air temperature on the imaging planes. In order to evaluate these, it was necessary to supplement the measurements in the middle of the walls with a rebound of 0.6 m (marginal zone). The measuring positions are indicated in Figure 8e. The plane shown is reduced on both sides by the edge zone (2 × 0.6 m). The disadvantage of the used software is the dynamic scale and the possibility of creating only a simple room in the shape of a cuboid. Atypical shapes, bounces and slopes as compared to the actual shape had to be neglected. Subjective parameters were chosen according to estimation and consultation with medical staff. The value of total metabolism was considered as 1.0 MET, which represents 58 W/m2. This value represents the total metabolism of a standing person with moderate physical activity. The thermal resistance of clothing depends on its thermal and technical properties and the combination of individual types of clothing. During the preparation of the study and the design of the model of the operating room, several excursions to real operating rooms were completed. The design of the experimental operating room was inspired by the real conditions in the clean rooms. Protective clothing should consist of long trousers and a coat with long sleeves, gloves, a mask and headgear. In the summer months when the measurement took place, almost all participants wore a coat without long sleeves. According to the parameters of protective clothing, the actual thermal resistance of operating room workers was 0.6 CLO, which is 0.093 m2K/W. Thermal resistance was evaluated in a similar range by Bogdan et al. [39] The effect of the thermal resistance of protective clothing on the assessment of thermal comfort of healthcare workers was also addressed in a study by Wang et al. [34].

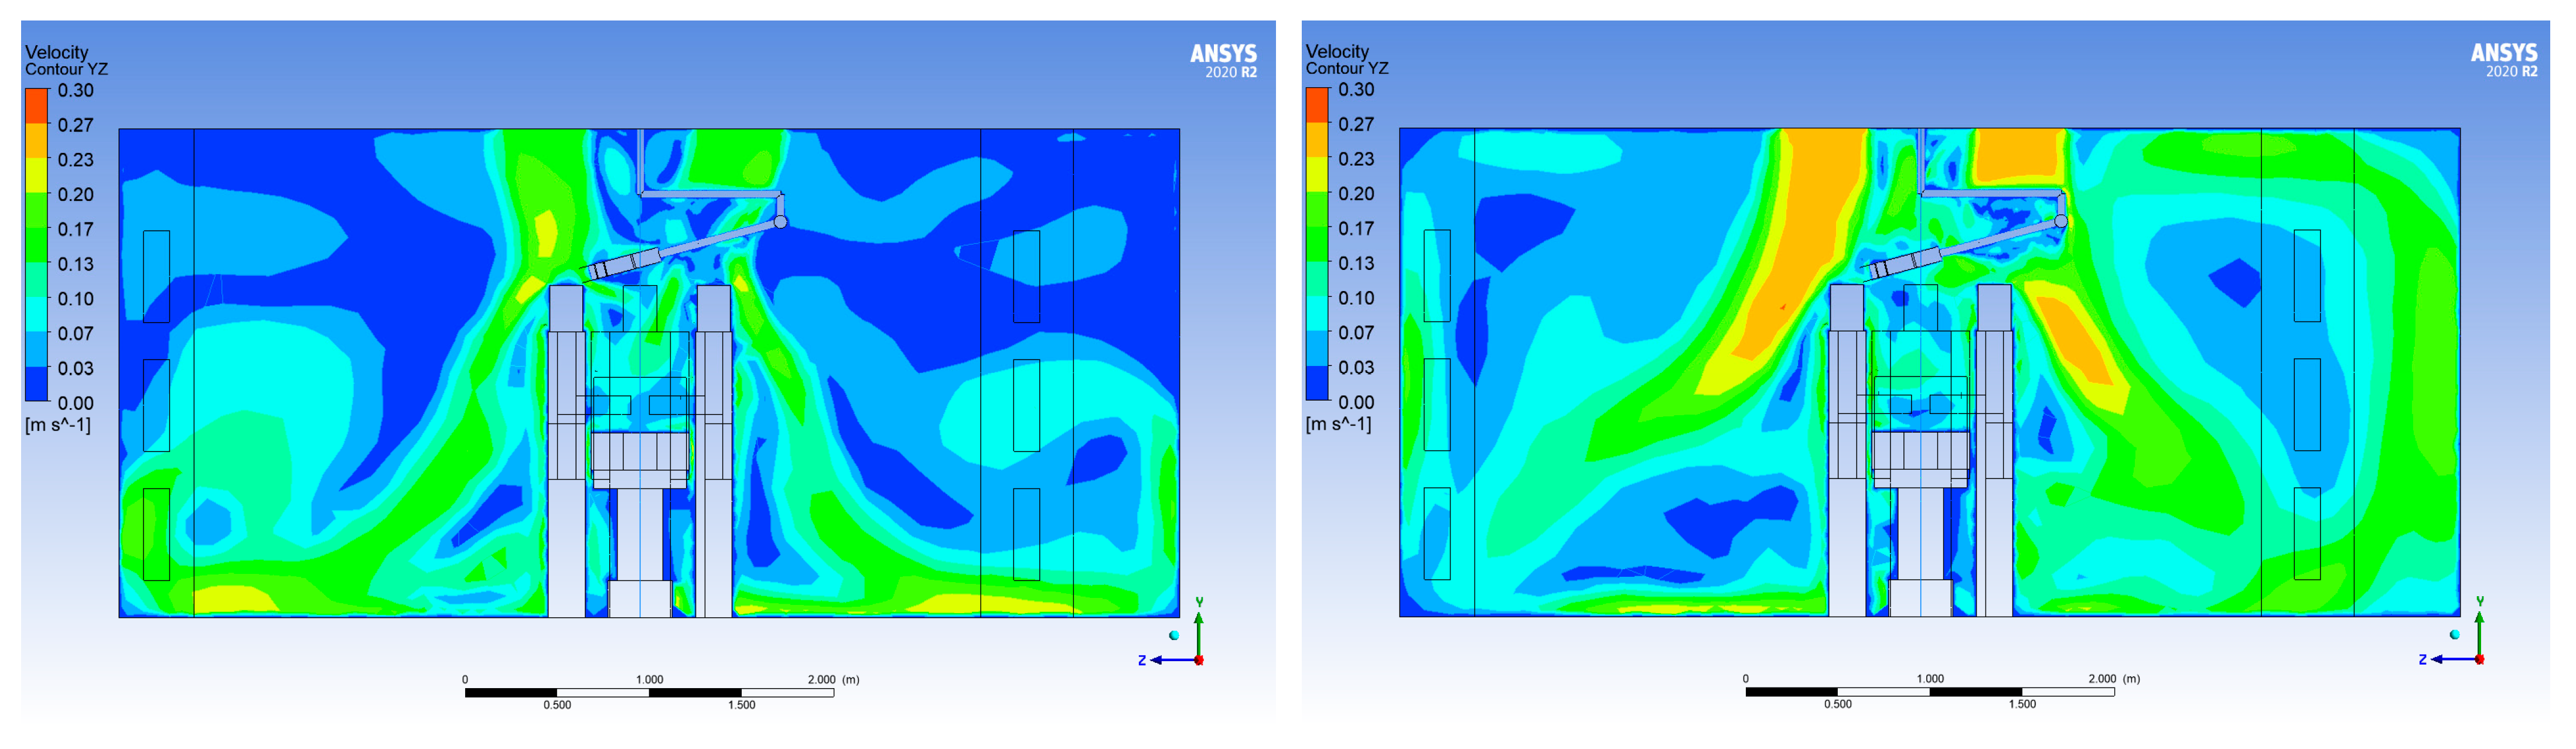
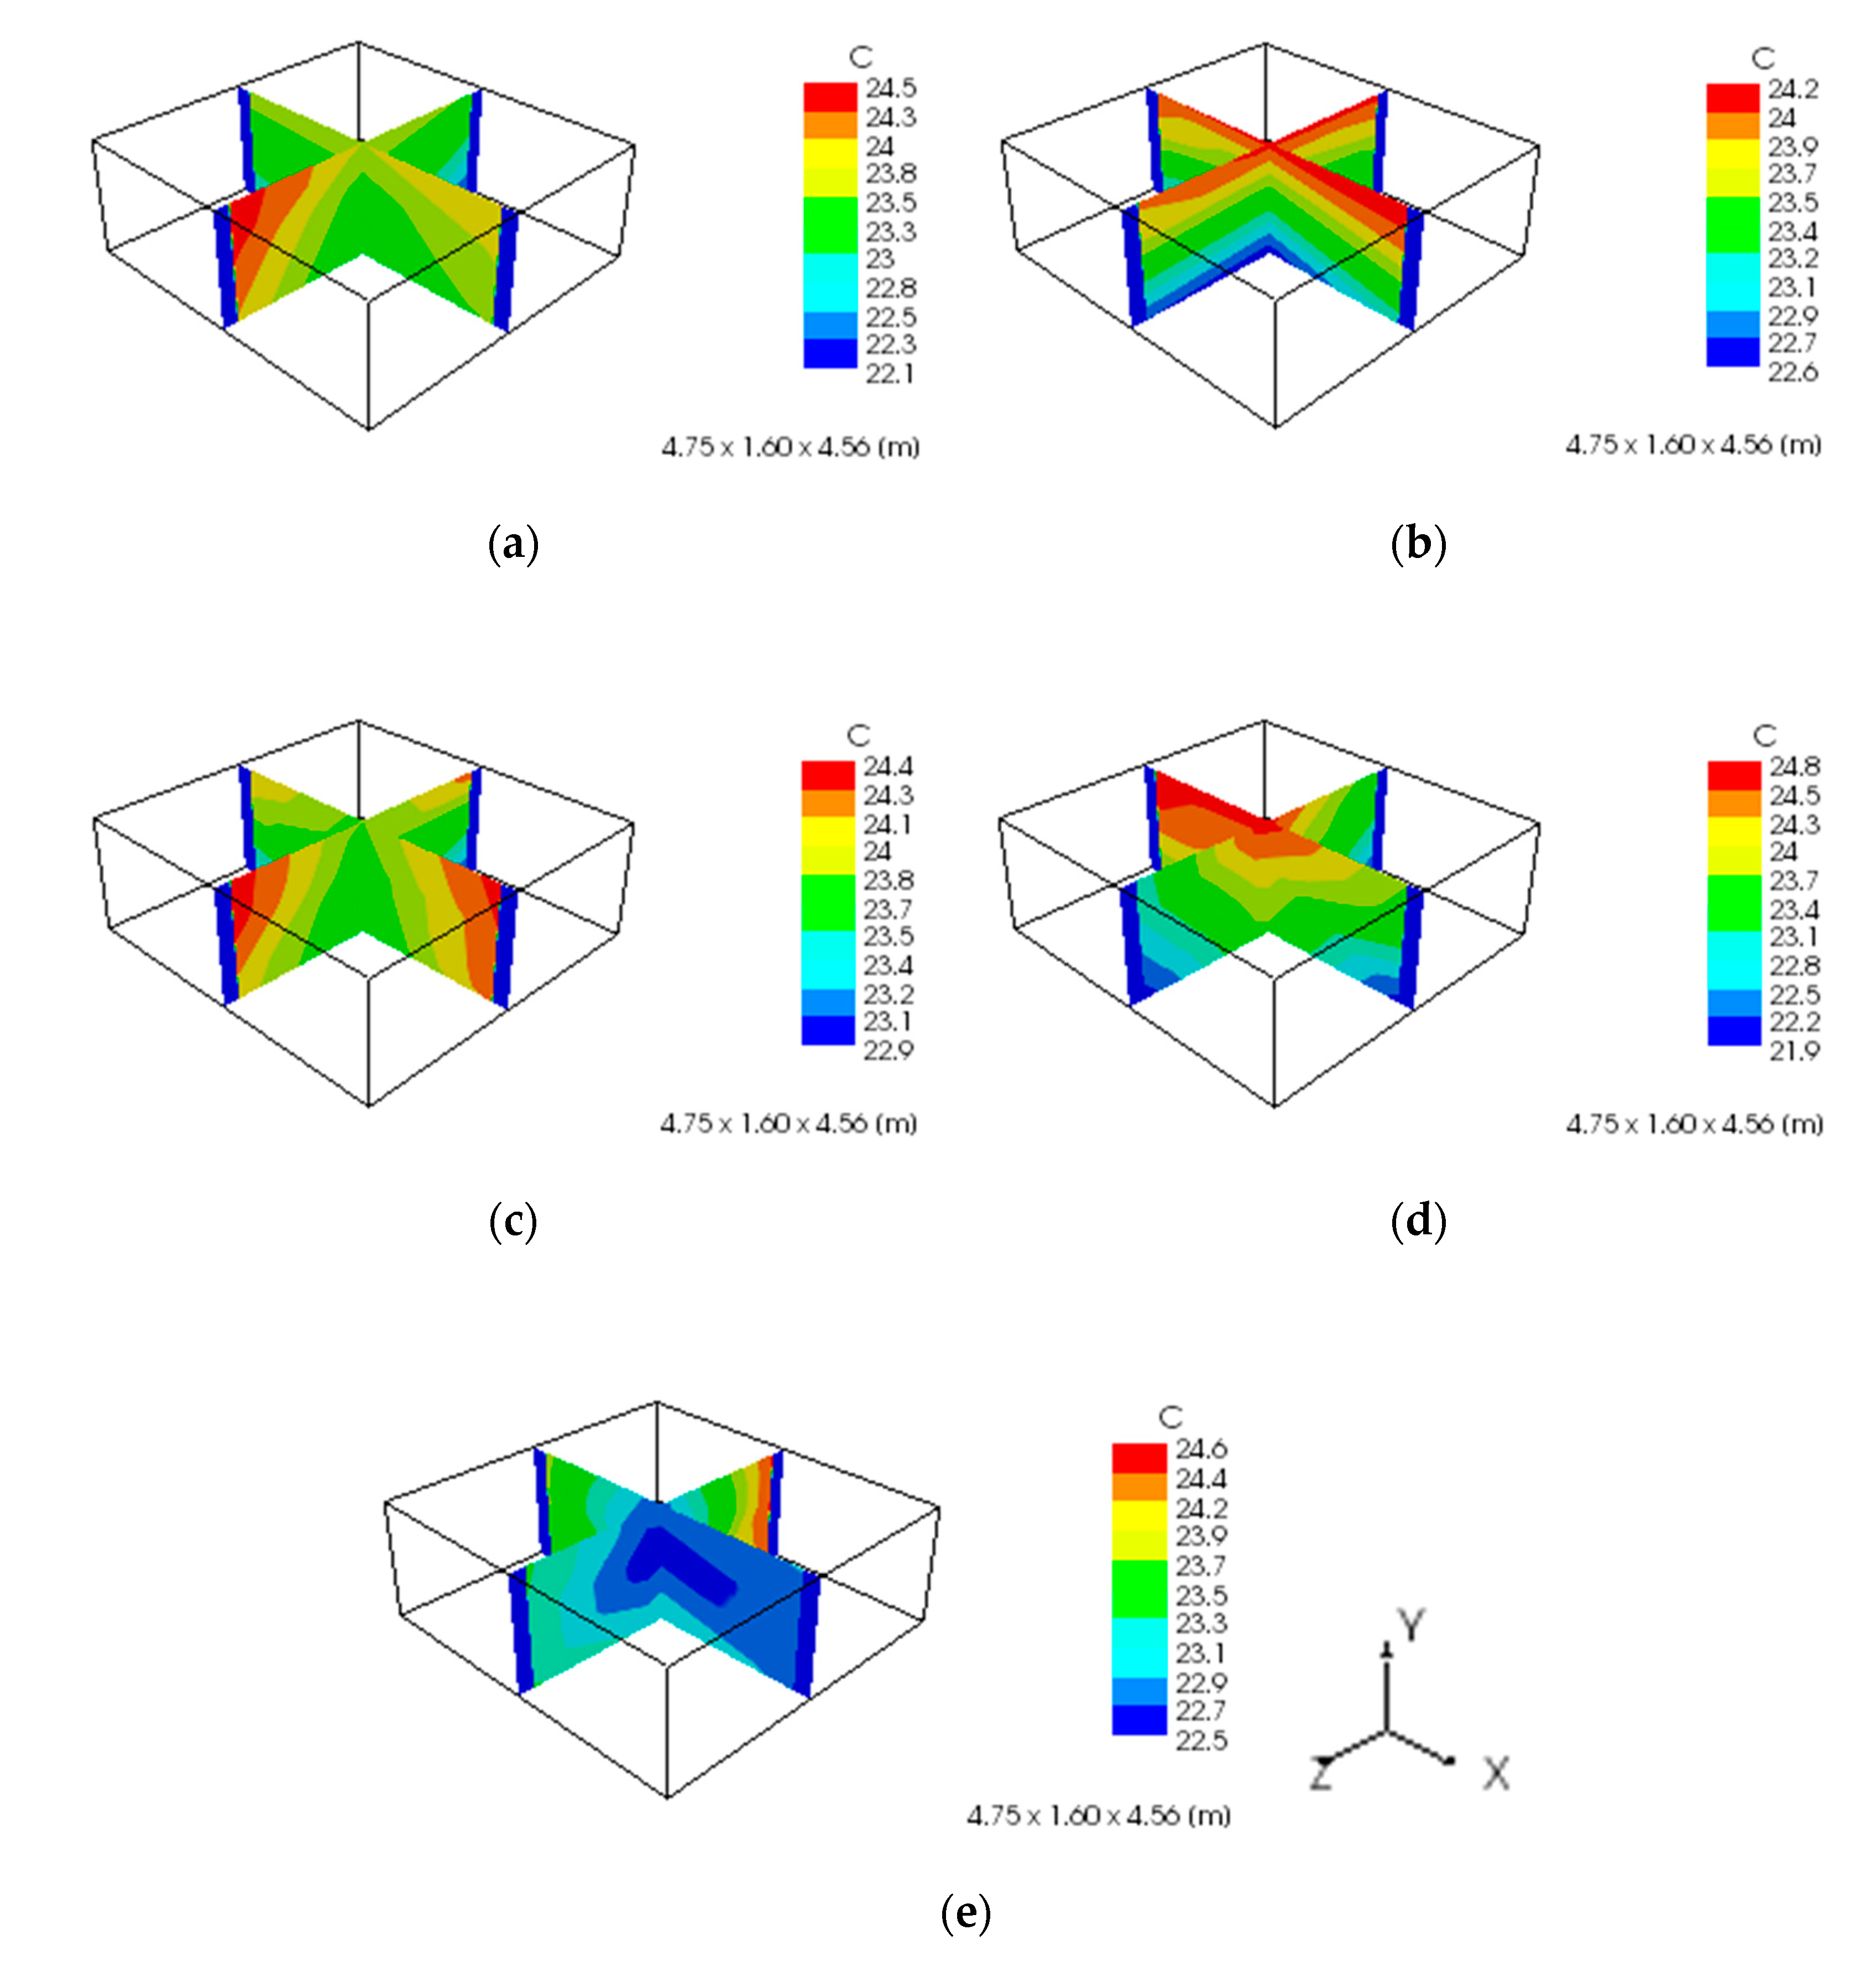
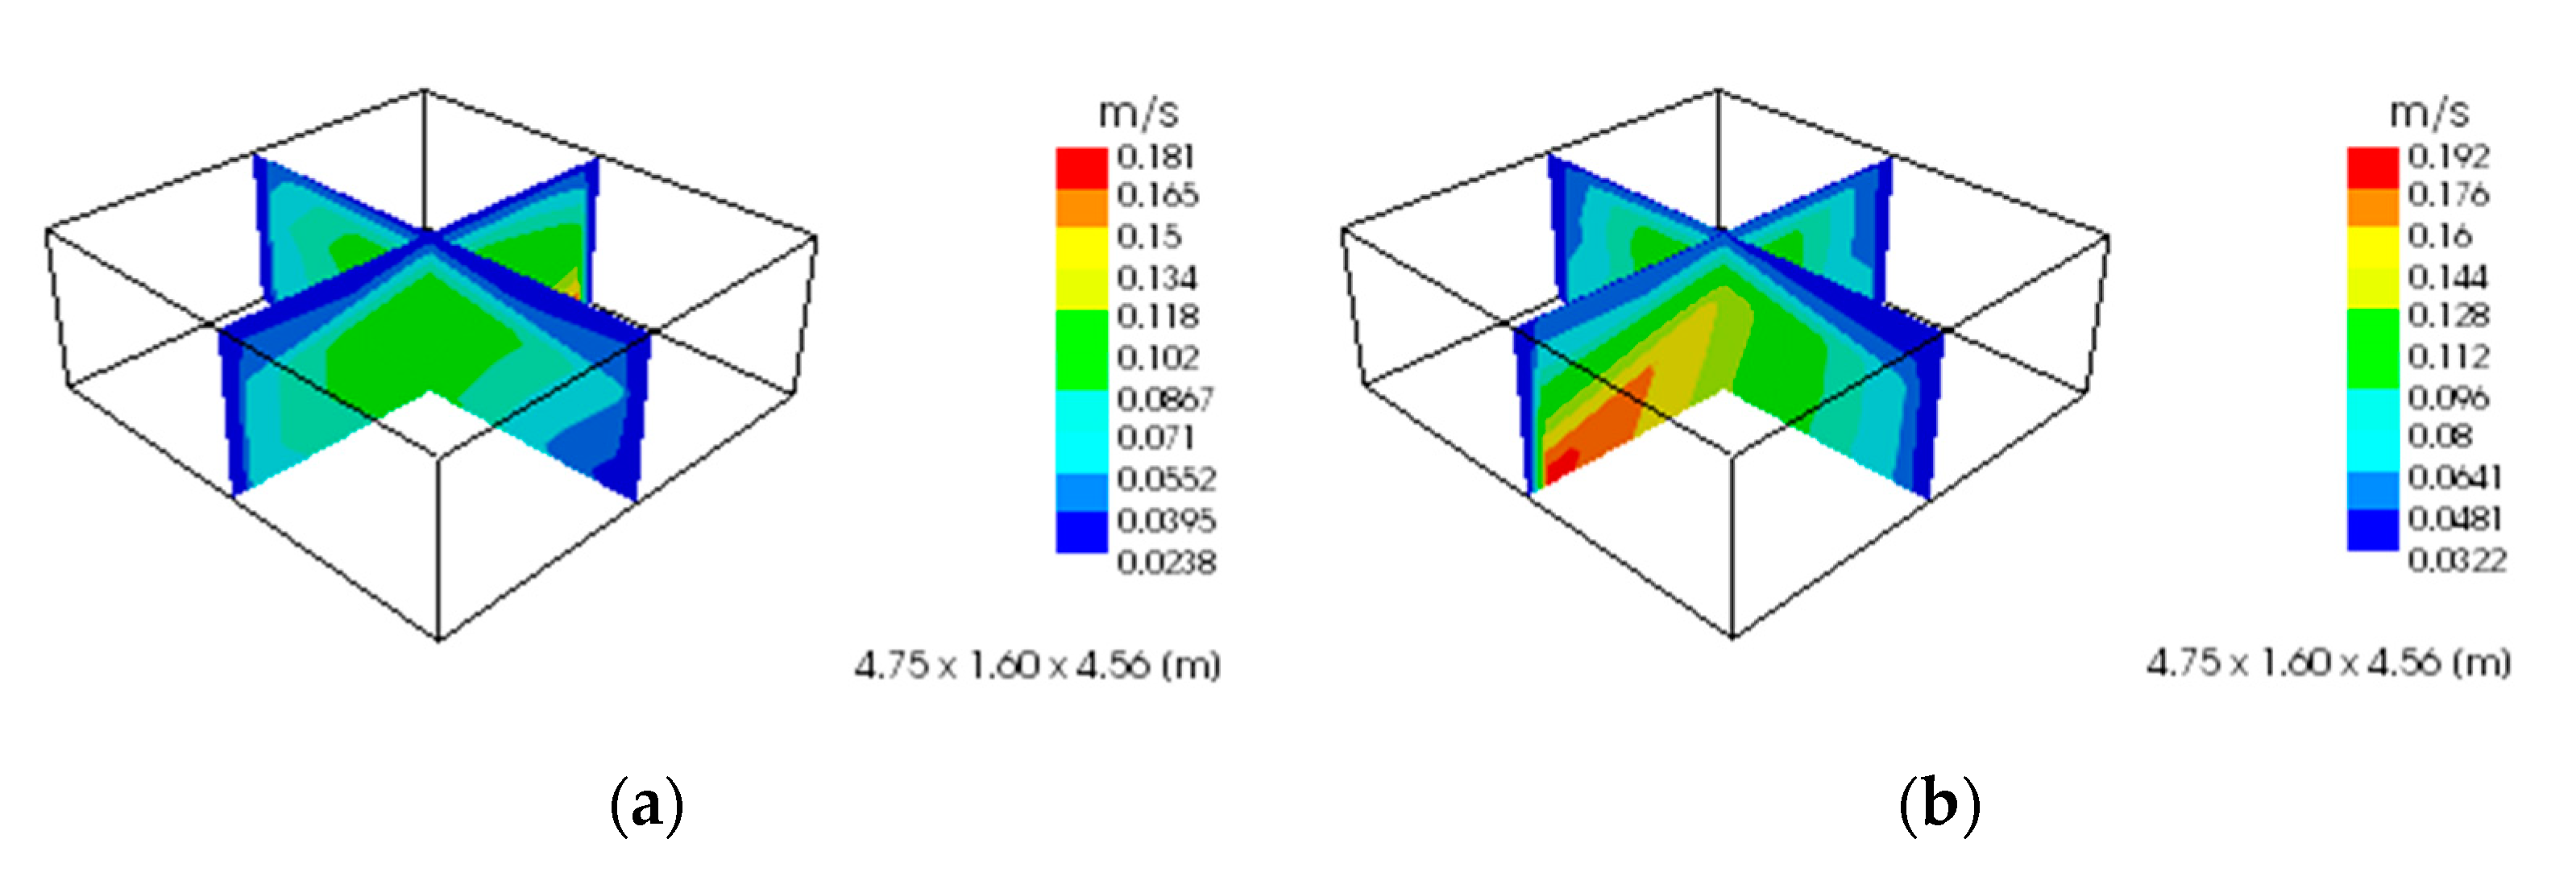
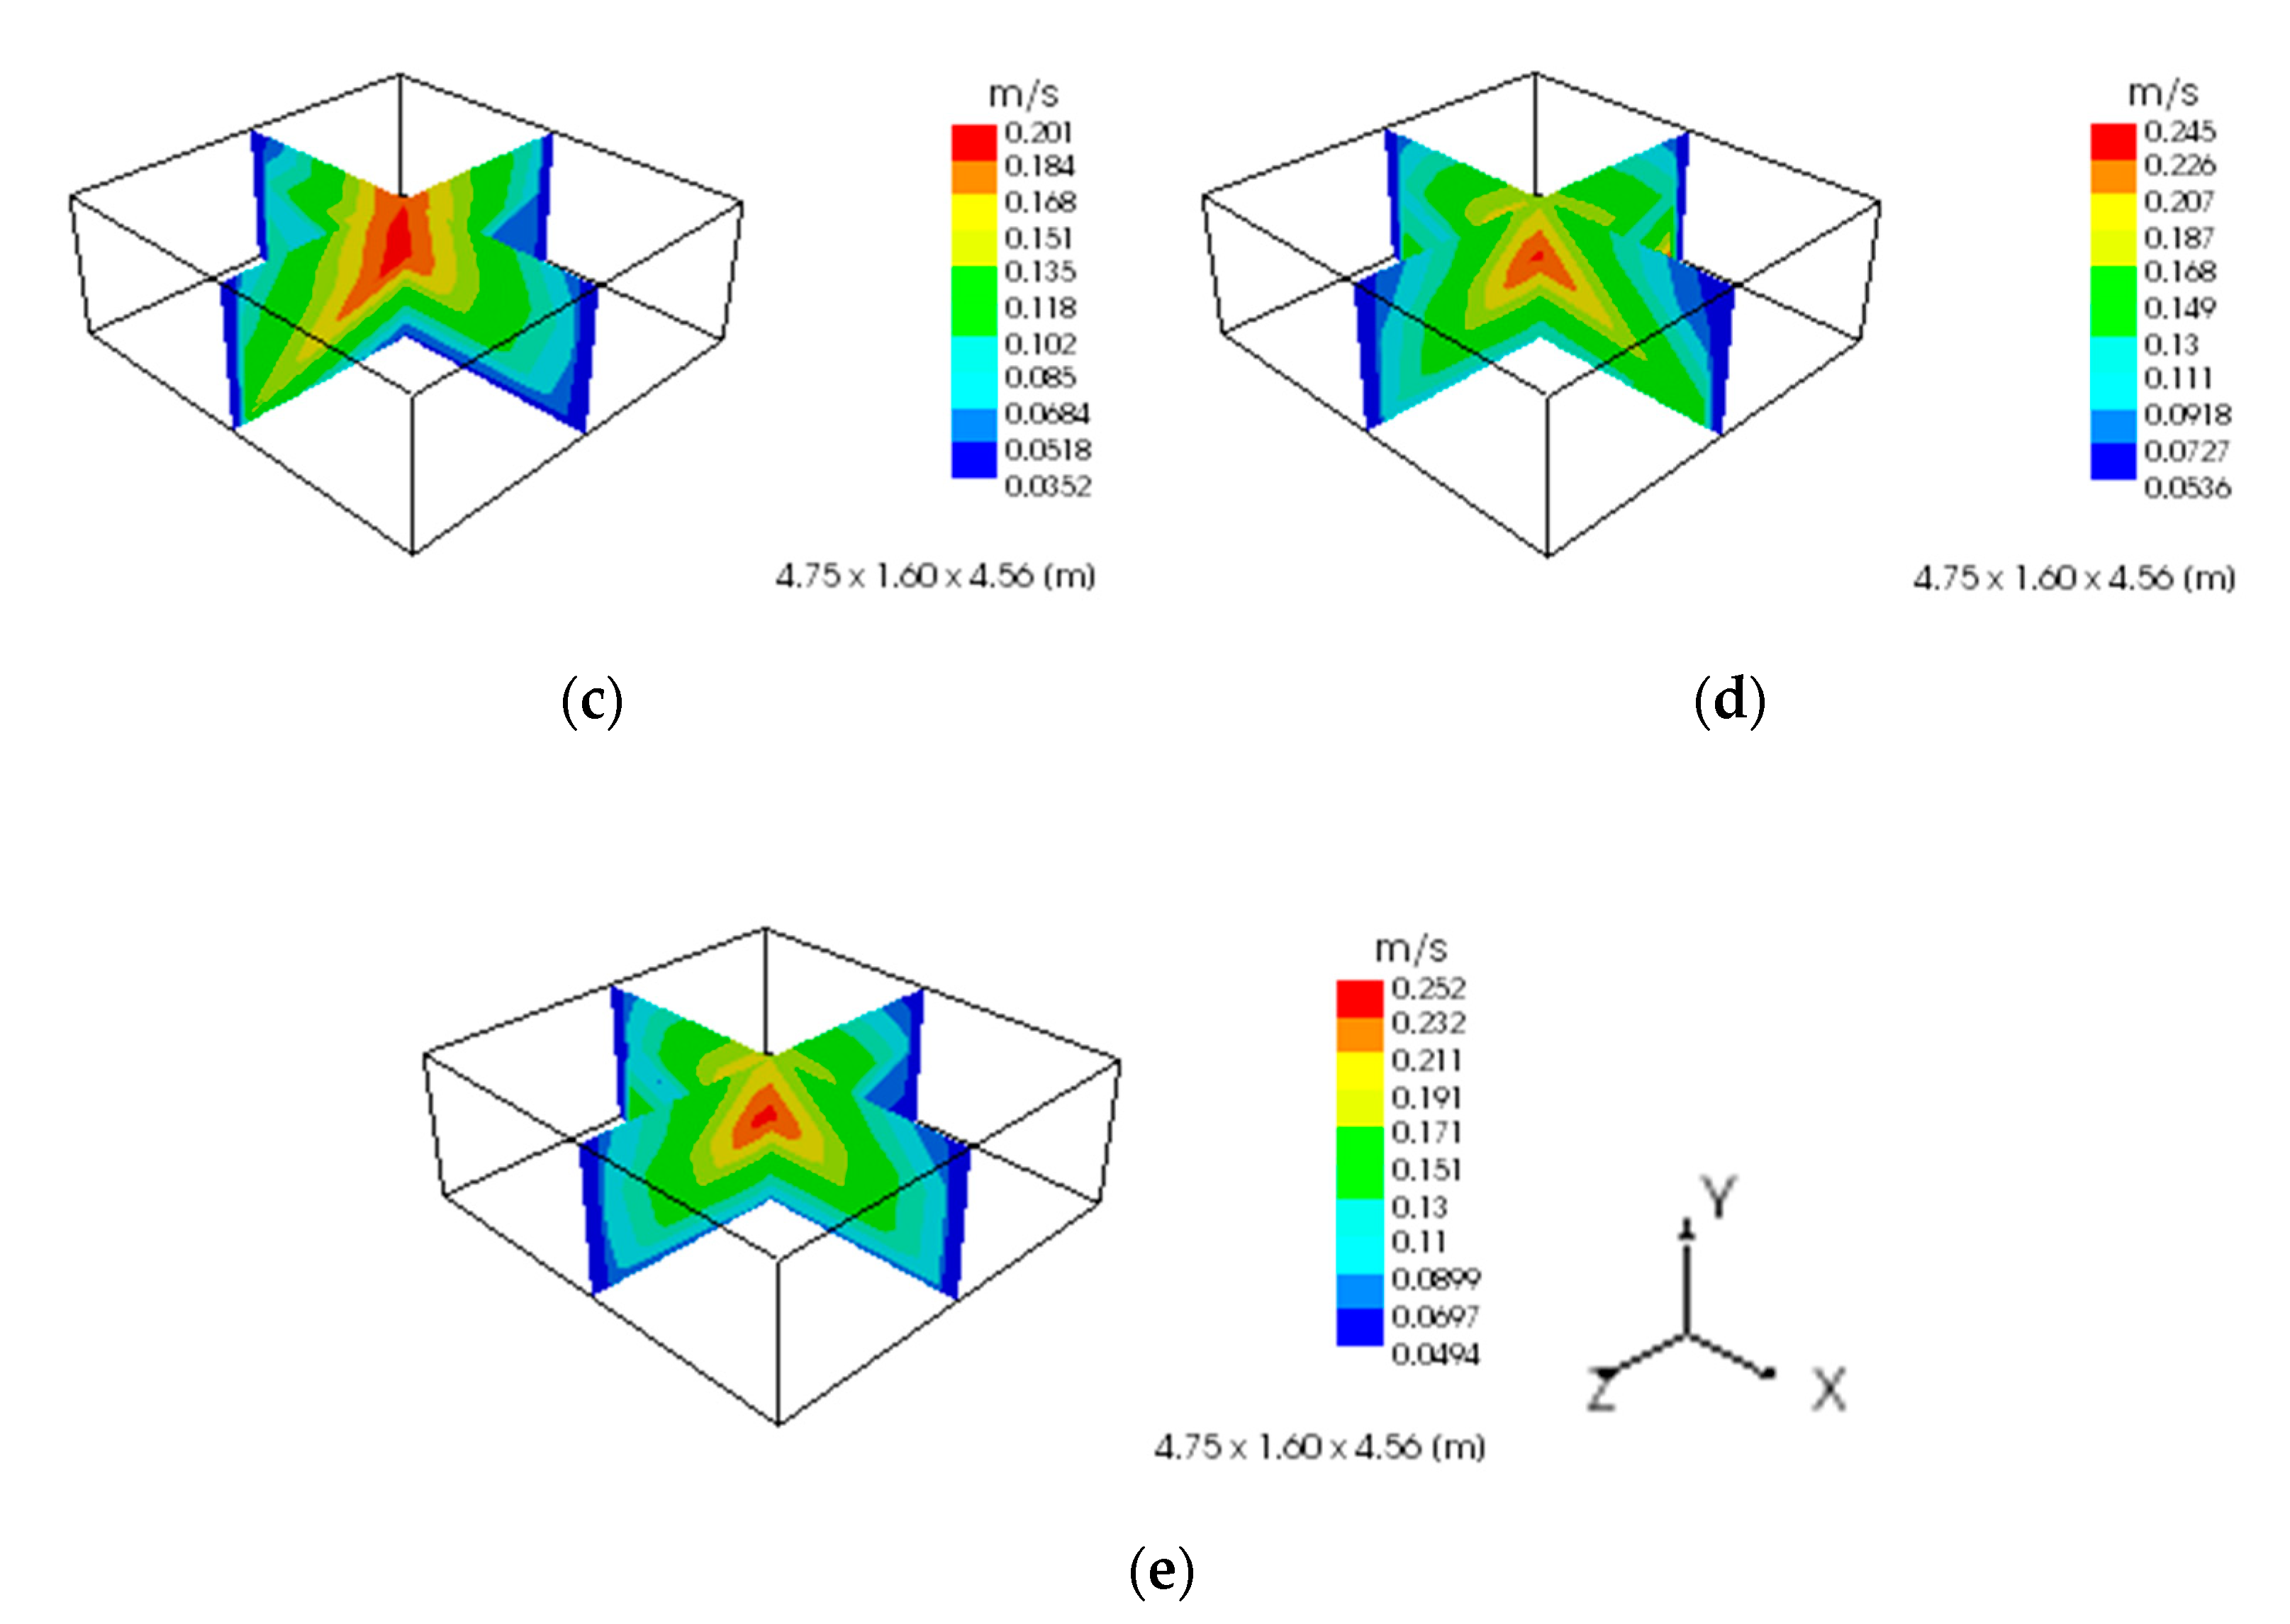
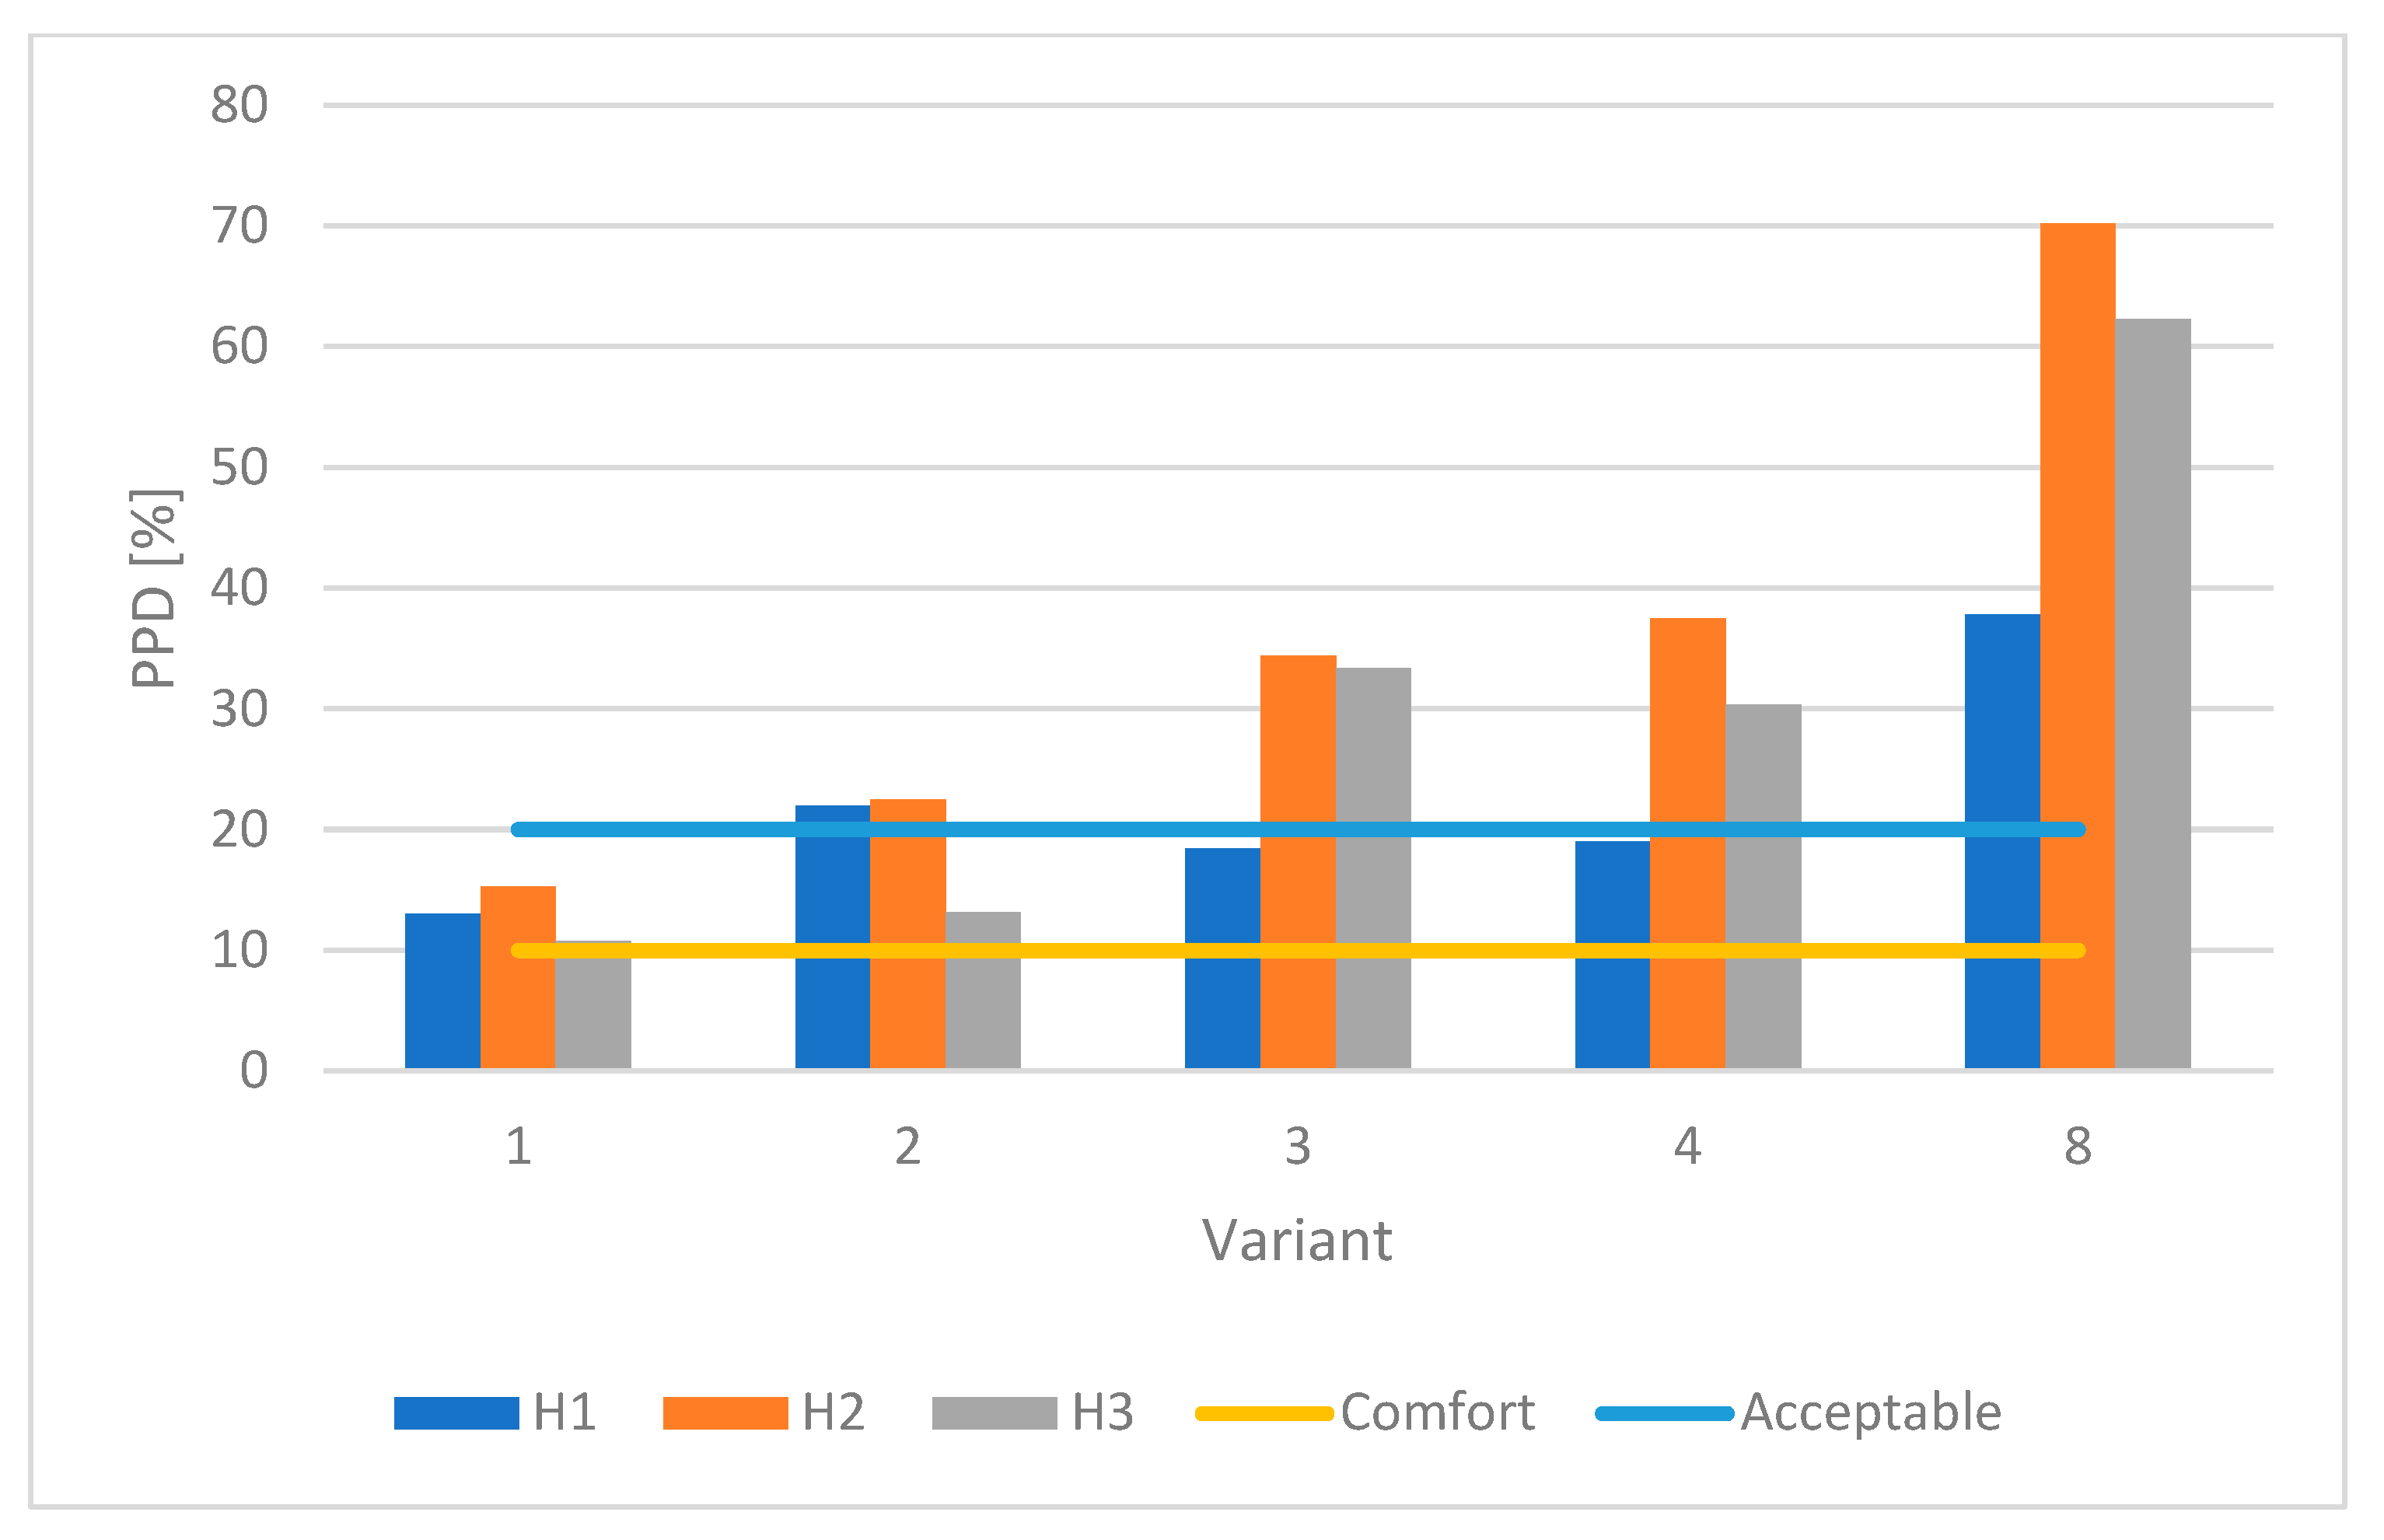
3. Results and Discussion

The effect of air flow speed on the thermal comfort of people in the operating room was monitored during the measurement. The effect of different volumetric flow rates and velocity profiles of air flow on the thermal comfort in the OR was investigated. The higher the speed in the person’s residence zone, the higher the feeling of cold. This can create negative feelings for the staff in the operating room and thus degrade the working conditions and the overall performance of the staff. The measurements in the experimental laboratory were made at different speeds of air flow from the laminar field. The recommended outflow velocity of the laminar field is in the range of 0.15–0.25 m/s for most manufacturers. With the known air speed from the laminar field and the known free outlet area (in our case, 3.55 m2), we can determine the amount of air transported by the distribution element using Equation (2). The amount of air transported at different speeds as well as the designation of variants for these conditions is expressed in Table 3. According to the amount of transported air, five different variants were measured, from a speed of 0.15 m/s to a speed of 0.25 m/s, with graduations of 0.025 m/s. A 10% smaller amount of air is removed from the space, evenly distributed between the four corners of the room through exhaust diffusers of 0.5 × 0.2 m.
V S U P ˙ = v S U P · S S U P
  • V S U P ˙ —air flow of the supply distribution element (m3/h)
  • v S U P —speed of the air flowing from the supply distribution element (m/s)
  • S S U P —free outlet surface of the supply distribution element (m2)
The parameters determining thermal comfort in the environment are listed in Table 4. At three height levels (0.1, 1.1 and 1.7 m from the floor level), the air temperature and air flow velocity in the room were measured using the “draft probes” shown in Figure 7c. The probe for measuring humidity is shown in Figure 7d, and the probe for measuring the mean radiation temperature, or the operating temperature expressed from it, is shown in Figure 7e. The vertical position of the individual measuring members (Y) is determined by the recommendation for measuring thermal comfort and local discomfort (warm head, cold ankle, etc.).
Figure 9 and Figure 10 show the temperature and air velocity profiles on the imaging planes passing through the center of the LAFC (reference point (x,y,z) = (0,0,0), lower left corner of Figure 8). Lower outflow velocities through the LAFC cause the formation of higher temperature gradients in the vertical direction, and stratification of air with a different temperature occurs. With increasing speed, there was a higher degree of air turbulence and mixing of individual layers, which reduced the vertical temperature gradient. It is also interesting to compare the speed of air flow at different height levels. In all cases, lower velocities were measured at the level of the head than at the level of the body’s center of gravity. This can also be seen on the profiles of air flow speed in Figure 10. This phenomenon was discussed in more detail in a previous study, where it was also confirmed by CFD simulation and was created by a combination of the coanda effect, the flow around obstacles and the cumulation of velocity vectors [19].
The PMV and PPD indexes were expressed from the measurable parameters of the thermal-humidity microclimate and from the subjective parameters (thermal resistance of clothing and total metabolism). As indicated in Table 5 and in Figure 11, as the air outlet speed through the LAFC increases, the air flow speed in the residence zone also increases, and people’s dissatisfaction with the indoor environment, i.e., the PPD index, increases. We can notice the connection between the increasing speed of the air flow and the increasing PPD index, especially by comparing the height level. For variant 3, at height level H1, the air flow speed is 0.05 m/s and the temperature is 23.5 °C. At altitude level H2, the temperature is 23.7 °C and the air flow speed is 0.20 m/s. Although the temperature is slightly higher at the H2 level, due to the higher air flow speed, there was an increase in user dissatisfaction with the environment (PPD index) due to the cold, from 18.45% to 34.35%. In the area of the legs (H1), there were no significant changes in air flow speed and PPD index between the first and fourth variants. According to the curve of a comfortable and acceptable environment from the point of view of thermal well-being, there is a significant disturbance of comfort from the outflow velocity of 0.2 m/s.
The measurement of thermal-humidity microclimate parameters took place in laboratory conditions with stabilized air flow. The supplied air was only exterior, and the device was not in circulation mode. This resulted in a slight fluctuation of the air temperature in the interior. The desired temperature in the room was set at 24 ± 2 °C. The outside air temperature was higher than 30 °C, which caused a thermal load on the OR, and at the same time raised the demands for cooling the air behind the recovery exchanger of the HVAC equipment. The temperature supplied through the LAFC must therefore be lower than the required 24 °C [5,6,7,8,40]. As mentioned in the description of the HVAC system, the primary source of heat and cold is the heat pump, which is directly connected to the evaporator, or the condenser in the ventilation unit. The disadvantage of this system is a slower response to changes in the desired temperature of the supplied air and a less sensitive power regulation. Therefore, there were slight variations in the air temperature during individual measurements. However, this also applies to normal operating conditions of OR ventilation and reflects sudden local changes in comfort near the LAFC. The lower temperature of the supply air through the LAFC also affected the overall velocity and trajectory of the air flow in the operating table area, due to Newton’s law of gravity. If the temperature difference is too large, the area of direct flow may decrease, and the air column may narrow [17]. In addition to the inaccuracy of the measuring device, another limitation of the study, compared to the real situation, is the absence of medical personnel, which partially (200–400 W) reduced the heat load of the OR. Other devices in the OR (lamps, surgical equipment, etc.) that produce heat were turned on.
As already mentioned in several studies, the issue is to find a compromise between the requirements of the OR ventilation legislation and the thermal comfort of medical personnel [6,7,8,9,16,17,21,34,35]. Even while maintaining a higher air flow rate, it is possible to achieve a low air outlet velocity through the LAFC by using LAFCs with larger dimensions and a larger outlet area. It is necessary to observe the recommended speeds of legislation, standards and the LAFC manufacturer. Several studies have already indicated that lower discharge velocities reduce the risk of contamination by suppressing unwanted turbulence [19,41,42]. The PMV and PPD indices indicate that in the summer months, when air is supplied to the OR that is cooler than the desired room temperature, it is more advantageous to choose the dimensions of the LAFC so that the outflow velocity is in the range of 0.15–0.175 m/s. The increasing velocity of air flow through the LAFC causes an unpleasant feeling of coldness for the medical staff (surgeon). This can negatively affect the work performance and the success of the surgical procedure [43]. At an air flow speed of 0.2 m/s through the LAFC, the PPD index was higher than 30% in the area of the body’s center of gravity (1.1 m) and the head (1.7 m). At a speed of 0.25 m/s, which is commonly used, the PPD index was evaluated at 70% in the area of the center of the body. Wang et al. [34] monitored the airflow velocity through the LAFC in the range of 0.1–0.5 m/s. In this range of speeds, a difference of up to 5 °C was detected on the surface of the protective clothing. Legislation, standards and regulations in different countries do not have the same statement on the appropriate outflow velocity through the LAFC. Standards VDI 2167 [6] and DIN 1946 [7] recommend speeds above 0.23 m/s, while standard ASHRAE 170 [8] recommends speeds in the range of 0.13–0.18 m/s, which was the range identified in our results. The EN ISO 14 644-1 standard recommends, for operating room in cleanliness class ISO 6, outflow velocities in the range of 0.1–0.25 m/s [1]. It can be concluded that during the summer months, the combination of a lower supply temperature and a higher speed of air flow in the area of the operating table results in the local creation of an uncomfortable environment. This conclusion was confirmed, through personal discussion and consultation with several medical professionals (mainly surgeons). Atmaca et al. [44], in his study, also confirmed the different assessment of thermal comfort between body segments caused by different radiant temperatures. Geaver et al. [21] mentioned that decreasing the air flow rate in the OR is one of the options for reducing the feeling of cold in the OR. The results indicate the least comfortable environment is located in the area of the body’s center. ASHRAE Standard 55 adopts the P.O. Fanger indexes of PMV and PPD and takes into account the effect of local discomfort by increasing PPD by 10% [45]. However, in the mentioned consultation and discussion, the surgeons mainly complained about the unpleasant blowing on the neck and the subsequent pain in the cervical spine after a longer procedure with a LAFC. Medical staff are often not sufficiently informed about the function of the LAFC and the need for forced ventilation in the OR. Due to the uncomfortable environment, during the operation the LAFC is often in attenuation mode (50% air flow), and in some cases the ventilation system is switched off. This can seriously endanger the patient in aseptic ORs or even the staff in septic ORs. From the point of view of patient and staff safety, it is therefore advisable to design LAFC size series at the lower limit of the recommended outflow velocity range. This also has a favorable effect on the lower pressure loss of the filters in the LAFC and the overall energy consumption by the fans [46]. The unpleasant feeling of cold on other parts of the body can be compensated by a higher thermal resistance of the clothing (CLO) [34]. Unfortunately, some medical facilities have their own protocol for protective clothing, which cannot be varied in order to achieve an optimal feeling of thermal well-being.

4. Conclusions

This study investigated the trade-off between thermal comfort ratings and the conditions of legislation and standards for air flow rates through the LAFC. The measurements took place in a clean room laboratory, in a model operating room, with certified equipment. A ComfortSense Dantec device was used to record data and evaluate PMV and PPD indices. Legislation in different countries recommends different discharge velocities through the LAFC, ranging from 0.1 m/s to 0.45 m/s. This research focused on evaluating the thermal comfort during the summer months, when the LAFC is used for cooling, at discharge velocities from 0.15 m/s to 0.25 m/s. The use of speeds up to 0.175 m/s appears to be the most suitable, when the PPD index fluctuates at a value of 20%. At a speed above 0.2 m/s, the PPD index is above 30%. The combination of subcooled air and air speed through the LAFC of 0.25 m/s increased the PPD index up to 70% in the area of the body’s center of gravity. In all cases, the velocities in the area of the center of gravity were higher than in the area of the head. The results of this study should provide valuable information for the design and sizing of LAFCs in ORs and other clean rooms. With the help of the choice of a higher LAFC size series, a lower flow rate will be achieved, which will have a favorable effect on the thermal comfort of healthcare workers in the summer months.

Author Contributions

Conceptualization, P.M.; methodology, P.M.; validation, P.M. and D.H.; formal analysis, R.N.; investigation, D.H.; resources, P.H.; data curation, R.N., P.H. and D.H.; writing—original draft preparation, P.M.; writing—review and editing, R.N.; supervision, P.H.; project administration, P.M. and P.H.; funding acquisition, P.M. and P.H. All authors have read and agreed to the published version of the manuscript.

Funding

This research was funded under the project of Operational Programme Integrated Infrastructure: Independent research and development of technological kits based on wearable electronics products, as tools for raising hygienic standards in a society exposed to the virus causing the COVID-19 disease, ITMS2014+ code 313011ASK8. The project is co-funded by the European Regional Development Fund, and project VEGA 1/0633/23—Optimization of the flow preventing the spread of COVID-19 and other viruses and bacteria to the patient.

Institutional Review Board Statement

Not applicable.

Informed Consent Statement

Not applicable.

Data Availability Statement

Data are available in a publicly accessible repository.

Conflicts of Interest

The funders had no role in the design of the study; in the collection, analyses, or interpretation of data; in the writing of the manuscript, or in the decision to publish the results. The authors declare no conflict of interest.

References

  1. EN ISO 14644-1; Cleanrooms and Associated Controlled Environments-Part 1: Classification of Air Cleanliness by Particle Concentration. International Organization for Standardization: London, UK, 2015.
  2. Vyhláška č. 259/2008 Z. z., Vyhláška Ministerstva Zdravotníctva Slovenskej Republiky o Podrobnostiach o Požiadavkách na Vnútorné Prostredie Budov a o Minimálnych Požiadavkách na Byty Nižšieho Štandardu a na Ubytovacie Zariadenia. Available online: https://www.epi.sk/zz/2008-259 (accessed on 20 February 2023).
  3. ASHRAE Standard 55-2020; Thermal Environmental Conditions for Human Occupancy. ASHRAE: Washington, DC, USA, 2020.
  4. EN ISO 15251; Indoor Environmental Input Parameters for Design and Assessment of Energy Performance of Buildings Addressing Indoor Air Quality, Thermal Environment, Lighting and Acoustics. International Organization for Standardization: London, UK, 2008.
  5. Walenkamp, G.H.I.M. Beheersplan Luchtbehandeling Voor de Operatieafdeling; Werkgroep Infectiepreventie: Maastricht, The Netherlands, 2005. [Google Scholar]
  6. VDI 2167; Technische Gebäudeausrüstung von Krankenhäusen. Verein Deutscher Ingenieure: Alexisbad, Germany, 2007.
  7. Deutsches Institut für Normung e.V. DIN 1946, Teil 4: Raumlufttechnische Anlagen in Krankenhäusern. Krankenh. Up2date 2007, 1, 69–81. [Google Scholar]
  8. ASHRAE/ASHE Standard 170; Ventilation of Health Care Facilities. R. American Society for Heating, Air-Conditioning Engineers Inc.: Washington, DC, USA, 2008.
  9. Standard 170-2013; Ventilation of Health Care Facilities. ASHRAE: Washington, DC, USA, 2013.
  10. Whyte, W. Cleanroom Design, 2nd ed.; John Wiley & Sons Ltd.: Choichester, UK, 1999; ISBN 0-471-94294-9. [Google Scholar]
  11. Balaras, C.A.; Dascalaki, E.; Gaglia, A. HVAC and indoor thermal conditions in hospital operating rooms. Energy Build. 2007, 39, 454–470. [Google Scholar] [CrossRef]
  12. Uścinowicz, P.; Chludzińska, M.; Bogdan, A. Thermal environment conditions in Polish operating rooms. Build. Env. 2015, 94, 296–304. [Google Scholar] [CrossRef]
  13. Verheyen, J.; Theys, N.; Allonsius, L.; Descamps, F. Thermal comfort of patients: Objective and subjective measurements in patient rooms of a Belgian healthcare facility. Build. Env. 2011, 46, 1195–1204. [Google Scholar] [CrossRef]
  14. Zoon, W.; Heijden, M.; Loomans, M.; Hensen, J. On the applicability of the laminar flow index when selecting surgical lighting. Build. Env. 2010, 45, 1976–1983. [Google Scholar] [CrossRef] [Green Version]
  15. Monteiro, A.; Cardoso, J.; Guerra, N.; Ribeiro, E.; Viegas, C.; Cabo Verde, S.; Sousa-Uva, A. Exposure and Health Effects of Bacteria in Healthcare Units: An Overview. Appl. Sci. 2022, 12, 1958. [Google Scholar] [CrossRef]
  16. Chow, T.T. The integrated effect of medical lamp position and diffuser discharge velocity on ultra-clean ventilation performance in an operating theatre. Indoor Built. Env. 2006, 15, 315–331. [Google Scholar] [CrossRef]
  17. Ham, P.J. Handboek Ziekenhuisventilatie; TNO Kwaliteit van Leven: Leiden, The Netherlands, 2004. [Google Scholar]
  18. De Giuli, V.; Zecchin, R.; Salmaso, L.; Corain, L.; De Carli, M. Measured and perceived indoor environmental quality: Padua hospital case study. Build Env. 2013, 59, 211–226. [Google Scholar] [CrossRef]
  19. Mičko, P.; Hečko, D.; Kapjor, A.; Nosek, R.; Kolková, Z.; Hrabovský, P.; Kantová, N.Č. Impact of the Speed of Airflow in a Cleanroom on the Degree of Air Pollution. Appl. Sci. 2022, 12, 2466. [Google Scholar] [CrossRef]
  20. Zhao, F.Y.; Cheng, J.; Liu, B.; Huang, Z.R. Regional flow motion and heat energy balance analysis of a 10,000 class pharmaceutical cleanroom with secondary return air conditioning system. Int. J. Refrig. 2021, 129, 237–249. [Google Scholar] [CrossRef]
  21. Geaver, R.V.; Jacobs, V.A.; Diltoer, M.; Oeeters, L.; Vanlanduit, S. Thermal comfort of the surgical staff in the operating room. Build. Environ. 2014, 81, 37–41. [Google Scholar] [CrossRef]
  22. Yang, B.; Liu, P.; Liu, Y.; Jin, D.; Wang, F. Assessment of Thermal Comfort and Air Quality of Room Conditions by Impinging Jet Ventilation Integrated with Ductless Personalized Ventilation. Sustainability 2022, 14, 12526. [Google Scholar] [CrossRef]
  23. Yang, J.; Zhao, Y.; Zou, Y.; Xia, D.; Lou, S.; Guo, T.; Zhong, Z. Improving the Thermal Comfort of an Open Space via Landscape Design: A Case Study in Hot and Humid Areas. Atmosphere 2022, 13, 1604. [Google Scholar] [CrossRef]
  24. Peeters, L.; Dear, R.D.; Hensen, J.; Dhaeseleer, W. Thermal comfort in residential buildings: Comfort values and scales for building energy simulation. Appl. Energy 2009, 86, 772–780. [Google Scholar] [CrossRef] [Green Version]
  25. Laouadi, A. A New General Formulation for the PMV Thermal Comfort Index. Buildings 2022, 12, 1572. [Google Scholar] [CrossRef]
  26. Mičko, P.; Kapjor, A.; Holubčík, M.; Hečko, D. Experimental Verification of CFD Simulation When Evaluating the Operative Temperature and Mean Radiation Temperature for Radiator Heating and Floor Heating. Processes 2021, 9, 1041. [Google Scholar] [CrossRef]
  27. ISO 7730; Moderate Thermal Environments-Determination of the PMV and PPD Indices and Specification of the Conditions for Thermal Comfort. ISO: Geneva, Switzerland, 2005.
  28. Gagge, A.P. The linearity criterion as applied to partitional calorimetry. Am. J. Physiol. 1946, 116, 656–668. [Google Scholar] [CrossRef]
  29. Houghten, F.C.; Yagloglou, C.P. Determining lines of equal comfort. Trans. Am. Soc. Heat. Vent. Eng. 1923, 29, 165–176. [Google Scholar]
  30. Gagge, A.P.; Fobelets, A.P.; Berglund, L.G. A standard predictive index of human response to the thermal environment. ASHARE Trans. 1986, 92, 709–731. [Google Scholar]
  31. Fanger, P.O. Thermal Comfort-Analysis and Applications in Environmental Engineering; Danish Technical Press: Copenhagen, Denmark, 1970. [Google Scholar]
  32. Krawczyk, B. The Heat Balance of the Human Body as Basis for the Bioclimatic Divide of the Health Resort Iwonicz; Redaktor Techniczny Adam Przylibski: Wrocław, Poland, 1979. [Google Scholar]
  33. Melhado, M.; Hensen, J.; Loomans, M. Literature review of staff thermal comfort and patient “thermal risk” in operating rooms. In Proceedings of the 8th International Healthy Buildings Conference, Lisboa, Portugal, 4–8 June 2006. [Google Scholar]
  34. Wang, F.J.; Zheng, Y.R.; Lai, C.M.; Chiang, C.M. Evaluation of Thermal Comfort and Contamination Control for a Cleanroom. J. Appl. Sci. 2008, 8, 1684–1691. [Google Scholar] [CrossRef] [Green Version]
  35. Angelova, R.A.; Velichkova, R. Thermophysiological Comfort of Surgeons and Patient in an Operating Room Based on PMV-PPD and PHS Indexes. Appl. Sci. 2020, 10, 1801. [Google Scholar] [CrossRef] [Green Version]
  36. Gilani, S.I.U.; Khan, M.H.; Pao, W. Thermal Comfort Analysis of PMV Model Prediction in Air Conditioned and Naturally Ventilated Buildings. Energy Procedia 2015, 75, 1373–1379. [Google Scholar] [CrossRef] [Green Version]
  37. Dyvia, H.A.; Arif, C. Analysis of thermal comfort with predicted mean vote (PMV) index using artificial neural network. Earth Environ. Sci. 2021, 622, 012019. [Google Scholar] [CrossRef]
  38. Cheung, T.; Schiavon, S.; Parkinson, T.; Li, P.; Brager, G. Analysis of the accuracy on PMV–PPD model using the ASHRAE Global Thermal Comfort Database II. Build. Environ. 2019, 153, 205–217. [Google Scholar] [CrossRef] [Green Version]
  39. Bogdan, A.; Sudoł-Szopińska, I.; Szopiński, T. Assessment of textiles for use in operating theatres with respect to the thermal comfort of surgeons. Fibres Text. East. Eur. 2011, 19, 65–69. [Google Scholar]
  40. S. Verein Von Wärme-Und Klima Ingenieuren. Richtlinie 99–103: Heizungs-, Lüftungs-Und Klimaanlagen in Spitalbauten (Planung, Bau, Betreib). 2003. Available online: https://www.sciencedirect.com/science/article/pii/S0360132314001875 (accessed on 6 April 2023).
  41. Novoselac, A.; Srebric, J. Comparison of air exchange efficiency and contaminant removal effectiveness as IAQ indices. ASHRAE Trans. 2003, 109, 339–349. [Google Scholar]
  42. Zhao, F.-Y.; Cheng, J.; Liu, B.; Huang, Z.-R.; Li, X. Indoor airflow and pollutant spread inside the cleanroom with micro-porous supplying panel and different ventilation schemes: Analytical, numerical and experimental investigations. J. Build. Eng. 2020, 31, 101405. [Google Scholar] [CrossRef]
  43. Pereira, P.F.D.C.; Broday, E.E.; Xavier, A.A.D.P. Thermal Comfort Applied in Hospital Environments: A Literature Review. Appl. Sci. 2020, 10, 7030. [Google Scholar] [CrossRef]
  44. Atmaca, I.; Kaynakli, O.; Yigit, A. Effects of radiant temperature on thermal comfort. Build. Environ. 2007, 42, 3210–3220. [Google Scholar] [CrossRef]
  45. Brager, G.S.; Dear, R.D. Climate, comfort & natural ventilation: A new adaptive comfort standard for ASHRAE Standard 55. In Proceedings of the Moving Thermal Comfort Standards into the 21st Century, Windsor, UK, 5–8 April 2001. [Google Scholar]
  46. Tschudi, W.; Mills, E.; Tenfang, X.; Rumsey, P. Measuring and managing cleanroom energy use. Heat. Pip. Air Cond. Eng. 2005, 77, 29–35. [Google Scholar]
Figure 1. Dimensions of the laboratory and the location of the LAFC.
Applsci 13 04860 g001
Figure 2. OR equipment.
Applsci 13 04860 g002
Figure 3. Scheme of HVAC equipment: (a) ventilation unit, (b) heat pump, (c) air humidifier, (d) LAFC, and (e) drainage outlets.
Applsci 13 04860 g003
Figure 4. Location of HVAC equipment: (a) ventilation unit, (b) heat pump, and (c) air humidifier.
Applsci 13 04860 g004
Figure 5. HVAC floor plan drawing: (a) ventilation unit, (b) heat pump, (c) air humidifier, (d) LAFC, and (e) drainage outlets.
Applsci 13 04860 g005
Figure 6. Air velocity profiles for outlet air velocity of 0.15 m/s (left) and 0.25 m/s (right) over LAFC [19].
Applsci 13 04860 g006
Figure 7. ComfortSense measuring device, (a) device during measurement, (b) measuring unit, (c) measuring elements H1–H3, (d) measuring element RH, (e) measuring element OT.
Applsci 13 04860 g007
Figure 8. Measurement positions: (a) thermal comfort of the surgeon, (b) thermal comfort of the assistant surgeon (c) operating table, (d) LAFC (e) additional measurement of the thermal-humidity microclimate parameters.
Applsci 13 04860 g008
Figure 9. Air temperature profiles in the experimental laboratory for individual variants; (a) Variant 1; (b) Variant 2; (c) Variant 3; (d) Variant 4; (e) Variant 5.
Applsci 13 04860 g009
Figure 10. Velocity profiles of air flow in the experimental laboratory for individual variants; (a) Variant 1; (b) Variant 2; (c) Variant 3; (d) Variant 4; (e) Variant 5.
Applsci 13 04860 g010aApplsci 13 04860 g010b
Figure 11. Comparison of PPD indexes for variant 1 to 5.
Applsci 13 04860 g011
Table 1. Comparison of requirements for indoor microclimate in the OR as specified in different international standards.
StandardSupply Air Temperature ta (°C)Relative Humidity (%)Supply Air Velocity (m/s)
EN ISO 14 644-1 [1]22–2640–600.1
ZZ 259/2012 [2]ta > 2530–70-
DIN 1946 [7]19–26-v ≥ 0.23
VDI 2167 [6]2230–50v ≥ 0.23
ASHRAE 170 [8]20–2430–600.13–0.18
ASHRAE application handbook [9]17–2745–551.3–1.8
Table 2. Marking of measuring members, measured quantities and measurement accuracy for the ComfortSense device.
Mark Measuring ElementMeasured QuantityThermal Comfort ParameterAccuracy of MeasurementVertical Position Y (m)
H1
H2
H3
ta—air temperatureta—air temperature± 0.2 °C0.1
1.1
1.7
va—indoor air flow rateva—indoor air flow rate±0.02 m/s
OTto—operative temperaturetr—average radiant temperature±0.2 °C1.1
RHφ—relative humiditypp—partial pressure of water vapor±2%1.8
Table 3. Air flow of the laminar field for individual variants.
VariantvSUP (m/s)VSUP (m3/h)
10.1501916
20.1752235
30.2002555
40.2252874
50.2503194
Table 4. Parameters of thermal-humidity microclimate for individual variants.
Measuring ElementUnitVariant
12345
H1ta (°C)23.122.623.523.723.0
H2ta (°C)23.423.523.724.322.5
H3ta (°C)23.824.123.824.822.7
H1va (m/s)0.100.140.050.110.09
H2va (m/s)0.120.150.200.240.25
H3va (m/s)0.030.050.190.190.20
OTto (°C)23.423.423.524.122.6
RHφ (%)4444424045
Table 5. PMV and PPD indexes for individual variants.
PMV IndexVariant
12345
position H1 [-]−0.62−0.90−0.80−0.81−1.25
position H2 [-]−0.70−0.91−1.18−1.25−1.86
position H3 [-]−0.53−0.62−1.16−1.10−1.71
PPD IndexVariant
12345
position H1 [%]13.0421.9518.4519.0137.77
position H2 [%]15.2622.4734.3537.5070.20
position H3 [%]10.7913.1233.3430.3162.25
Disclaimer/Publisher’s Note: The statements, opinions and data contained in all publications are solely those of the individual author(s) and contributor(s) and not of MDPI and/or the editor(s). MDPI and/or the editor(s) disclaim responsibility for any injury to people or property resulting from any ideas, methods, instructions or products referred to in the content.

