
Influenced Zone of Deep Excavation and a Simplified Prediction Method for Adjacent Tunnel Displacement in Thick Soft Soil

1
School of Civil Engineering, Southeast University, Nanjing 211189, China
2
Key Laboratory of Water Management and Water Security for Yellow River Basin, Ministry of Water Resources, Zhengzhou 450003, China
3
China Railway 16th Bureau Group Co., Ltd., Beijing 100018, China
4
Jiangsu Transportation Institute Group Co., Ltd., Nanjing 210017, China
5
School of Transportation, Southeast University, Nanjing 211189, China
*
Author to whom correspondence should be addressed.
Appl. Sci. 2023, 13(7), 4647; https://doi.org/10.3390/app13074647
Submission received: 24 January 2023
/
Revised: 3 April 2023
/
Accepted: 4 April 2023
/
Published: 6 April 2023
(This article belongs to the Special Issue Advanced Technologies in Deep Excavation)
Abstract
:Based on the statistics of 42 case histories, 732 finite element numerical simulations are conducted to determine the scope of the influenced zone of deep excavation under different conditions of excavation depth (He) and the maximum retaining wall deflection (δhm). On this basis, the effects of He and δhm on the scope of the influenced zone are studied, and a simplified prediction method for the scope of the influenced zone under any He and δhm conditions and the adjacent tunnel displacement is proposed. Then, the reliability of the proposed method is verified by comparing it with the current research and case histories. And finally, the proposed method is applied to an actual project, and the application effect is evaluated. The results show that the range outside the pit can be divided into “primary”, “secondary”, “general”, and “weak” influenced zones. The influenced zone can be simplified as a right-angled trapezoid shape, and the scope of influence zones can be quickly determined by defining three parameters: width coefficient M, depth coefficients N1 and N2. The parameters M and N2 have a linear relationship with He and δhm, and N1 varies between 1–2 with an average of about 1.5. In actual application, the effect of deep excavation on the adjacent tunnel can be alleviated by using the proposed method to predict the excavation-induced displacement of the adjacent tunnel and take some measures.
1. Introduction
In recent years, more and more deep excavations adjacent to existing tunnels have emerged [1,2,3,4]. The excavation can inevitably destroy the original stress and displacement fields and then lead to the displacement of the tunnel in the soil. To guarantee the safety of the tunnel, it is important to predict the possible displacement of the tunnel and take some control measures before excavation.
Generally, the commonly used prediction methods for tunnel displacement include empirical formulas, theoretical analysis, and numerical simulation. In terms of empirical formula, Wei et al. [5] put forward an empirical prediction formula for horizontal displacement of tunnel induced by adjacent deep excavation based on 11 case histories. However, the proposed formula only considers the single factor of the clear distance between the tunnel and deep excavation, and it is obtained based on the limited cases in Shanghai soft soil. Considering the above shortcomings, Wei et al. [6] supplemented the factor of excavation width along the tunnel axis to reflect the stress release degree of deep excavation and put forward a new prediction formula for horizontal displacement of the tunnel. Liu et al. [7] put forward empirical prediction formulas for excavation-induced tunnel displacement in three different soil types based on 42 case histories. In terms of theoretical analysis, Zhang et al. [8,9] proposed a two-stage method for predicting the longitudinal displacement of the tunnel induced by adjacent deep excavation; that is, the excavation-induced unloading stress at the existing tunnel location is estimated firstly using the Mindlin solution [10], and then the displacement response of tunnel is calculated using the Galerkin method regarding the tunnel as an Euler–Bernoulli beam locating on the Winkler foundation model. Considering the Euler–Bernoulli beam ignores the shear displacement of the jointed tunnel segments, and the Winkler foundation model is unable to consider the interaction of soil springs, Liang et al. [11,12] and Zhou et al. [13] used the Timoshenko beam to simulate the tunnel response with joints and used the Pasternak foundation model to consider tunnel–soil interaction. However, during the establishment and derivation of the above theoretical solutions, many simplifications and assumptions were made, and the values of some parameters have a significant effect on the accuracy of the results. In terms of numerical simulation, some scholars [14,15,16,17,18,19,20,21,22,23,24,25,26] predicted the excavation-induced tunnel displacement and evaluated the control effect of some measures based on specific projects. However, the credibility of numerical simulation results depends on the constitutive model and parameters, boundary conditions, the simulation process, etc.
The above-mentioned prediction methods for tunnel displacement, especially theoretical solutions and numerical simulations, are relatively complex and require high professional skills for users. To realize a simple prediction of excavation-induced tunnel displacement, Zheng et al. [27] took a deep excavation adjacent to an existing tunnel as the background and studied the excavation-induced tunnel displacement behaviors considering the different deformation modes and magnitudes of the retaining wall. Then, through an analysis of tunnel displacement isolines, the influenced zone of deep excavation was determined, and the tunnel displacement was predicted according to the actually influenced zone where it locates. This method considers the effects of the deformation mode and magnitude of the retaining wall, and the relationship between the influenced zone and tunnel displacement control standards is established, which is scientific and reasonable in theory. The tunnel displacement can be predicted just according to the actually influenced zone where it locates, which is simple in application. However, in this study, the influenced zone of deep excavation is obtained on the premise that the excavation depth is 18 m and the maximum retaining wall deflection is 30 mm, 45 mm and 60 mm. If the excavation depth or retaining wall deflection in the actual engineering is inconsistent with the above-assumed value, the applicability of the current study will be limited.
In this paper, based on the statistics of case histories, a series of numerical simulations are conducted to determine the influenced zone of deep excavation considering the factors of excavation depth (He) and the maximum retaining wall deflection (δhm). On this basis, the effects of He and δhm on the scope of the influenced zone are studied, and a simplified prediction method for the scope of the influenced zone under any He and δhm conditions and the adjacent tunnel displacement is proposed. Then, the reliability of the proposed method is verified by comparing it with the current research and case histories. And finally, the proposed method is applied to an actual project, and the application effect is evaluated. The research results can provide a useful reference for practical projects.
2. Collection and Statistics of Case Histories
2.1. Collection of Case Histories
To provide data support for the setting of parameters and calculation conditions in the following numerical simulations, 42 case histories in which the tunnel was affected by adjacent deep excavation were collected [7].
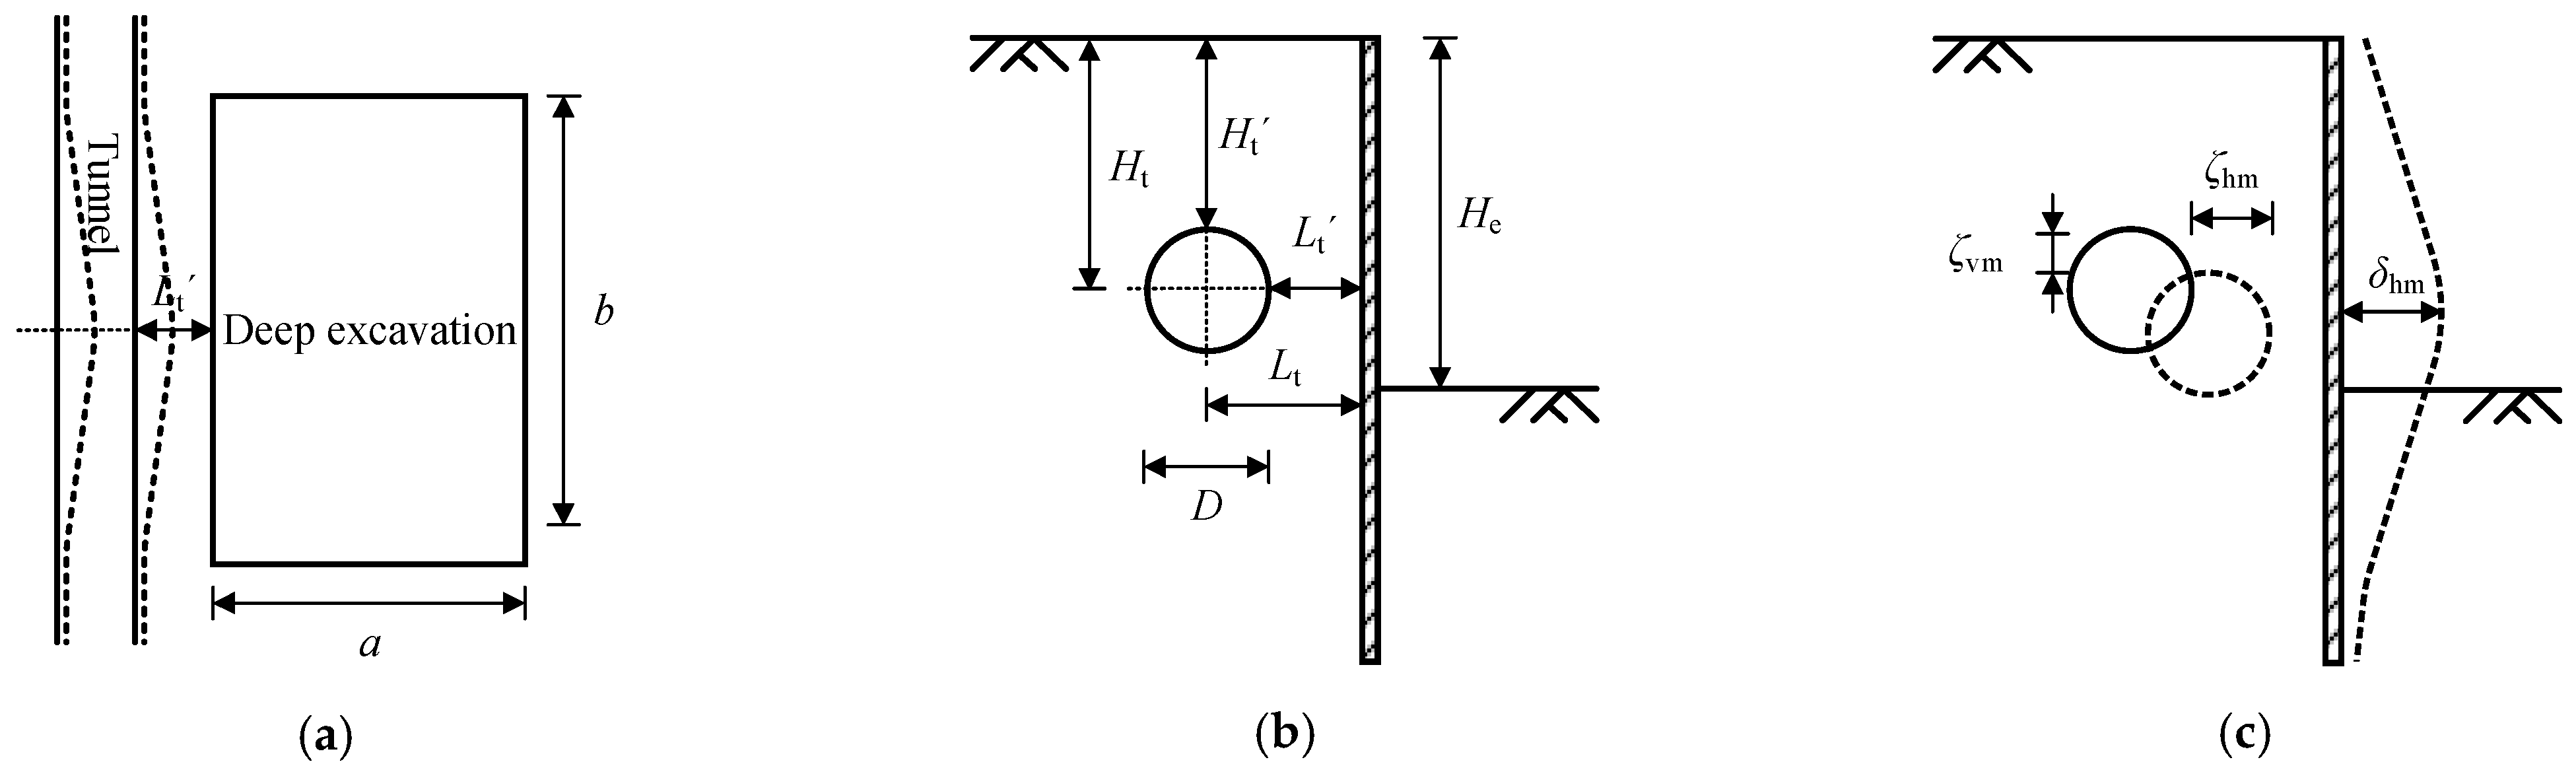
Figure 1 shows the dimensions, relative positions, and structure deformations of the deep excavation and tunnel, where a and b are the transverse and longitudinal widths of the deep excavation, respectively, He is the excavation depth, D is the diameter of the tunnel, Ht and Ht′ are the buried depths of the tunnel center and tunnel crown, respectively, Lt and Lt′ are the horizontal distances from the tunnel center and tunnel outline to the deep excavation, respectively, δhm is the maximum horizontal displacement of the retaining structure of the deep excavation, ζhm and ζvm are the maximum horizontal and vertical displacements of the tunnel, respectively.
2.2. Statistics of Case Histories
2.2.1. Typical Strata Where the Case History Occurred
According to the statistics [7], the typical strata where the case histories occurred include three types: soft soil, silt and silty sand, sandy pebble and weathered rock. Cases 1–29 mainly occurred in the soft soil strata represented by silty clay, accounting for about 69.0%. Cases 30–38 mainly occurred in the silt and silty sand strata, accounting for about 21.4%. Cases 39–42 mainly occurred in the sandy pebble and weathered rock strata, accounting for about 9.5%. Therefore, it is concluded that the case histories in the soft soil strata occupy a dominant position.
The above statistical results provide data support for the setting of strata conditions in the following numerical simulations.
2.2.2. Structure Forms and Dimensions of the Deep Excavation and Tunnel
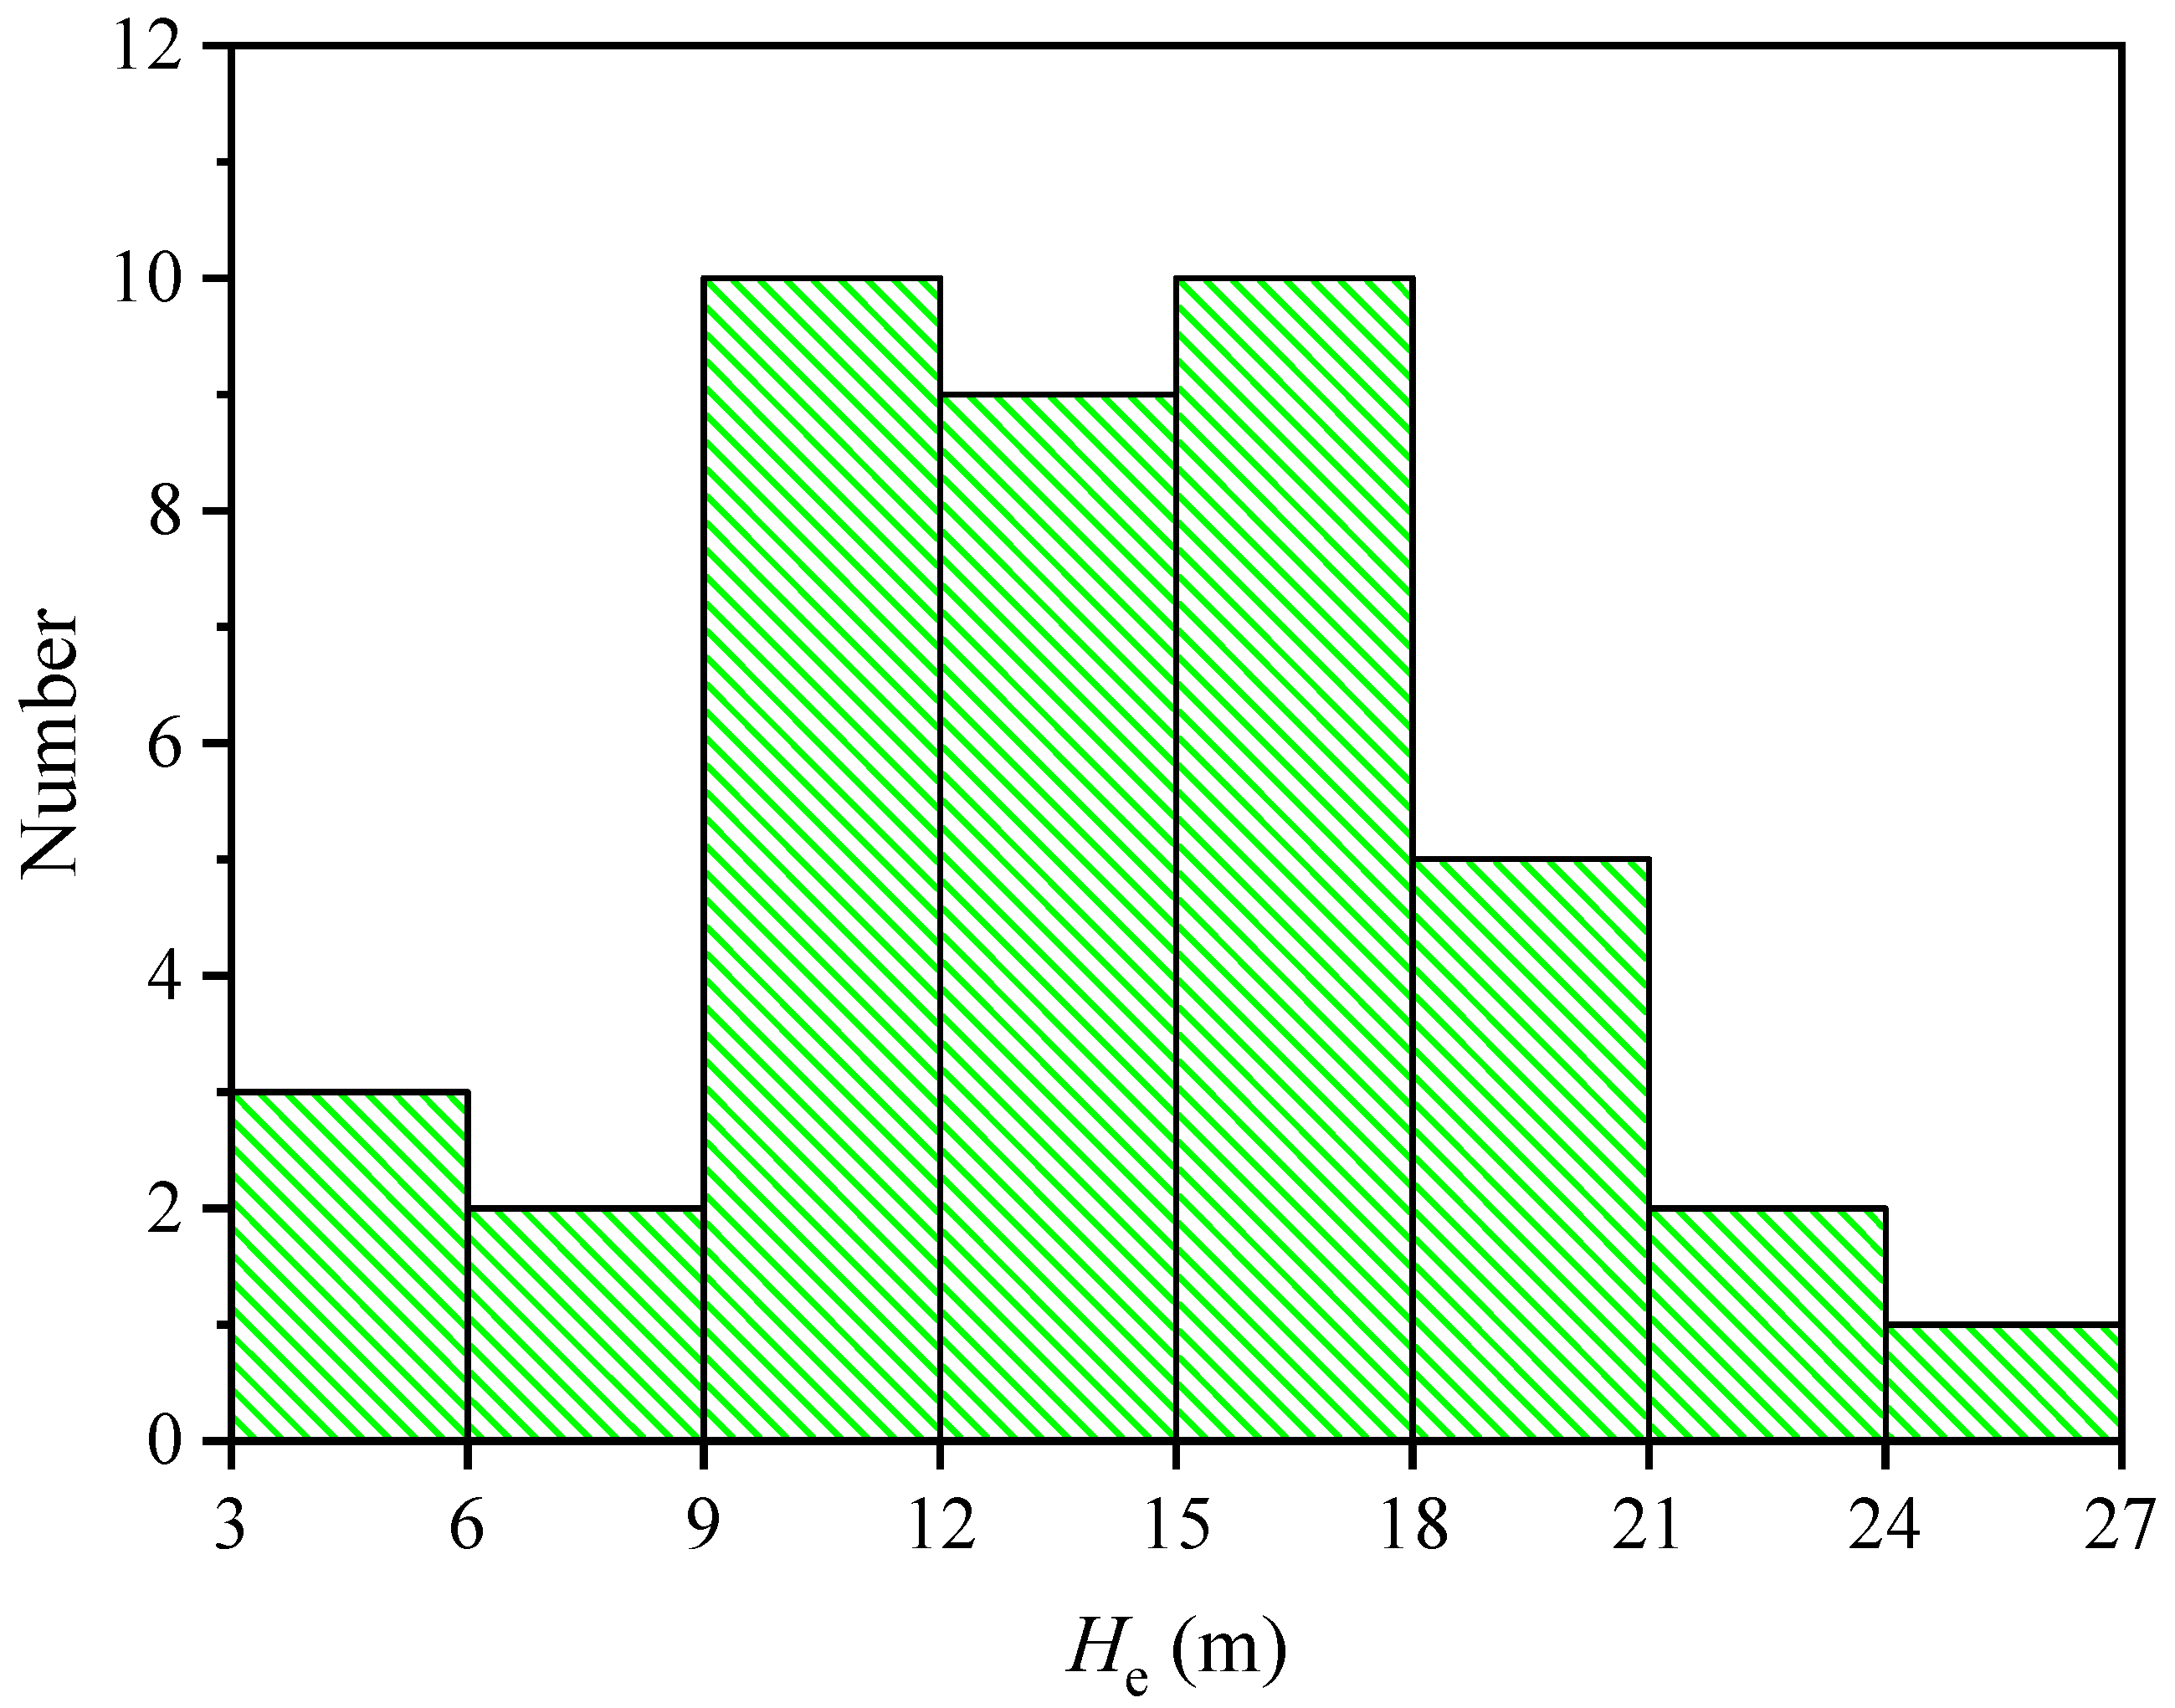
According to the statistics [7], the form of deep excavation in the case histories is mainly the basement of high-rise buildings, which usually has a large excavation area, deep excavation depth, and strong unloading effect, and it has a significant effect on the adjacent existing tunnels. Figure 2 shows a histogram of excavation depth He. It is observed that the distribution range of He is 3–27 m, in which 9–12 m and 15–18 m account for the highest proportion, and the number of deep excavations with He ≤ 18 m accounts for about 81.0% of the total case histories.
The form of retaining structure of the deep excavation mainly includes a diaphragm wall, bored pile, etc. Diaphragm walls are widely used in engineering owing to their high rigidity and good integrity. The form of horizontal struts in the pit mainly includes concrete struts and steel pipe struts, which have been widely used in excavation engineering, particularly in large-scale excavation engineering. The structure form of the adjacent tunnel is a shield tunnel with a circular cross-section, and the diameter of the tunnel is 6 m or 6.2 m.
The above statistical results provide data support for the setting of structure forms and dimensions of the deep excavation and adjacent tunnel in the following numerical simulations.
2.2.3. Relative Position between the Tunnel and Deep Excavation
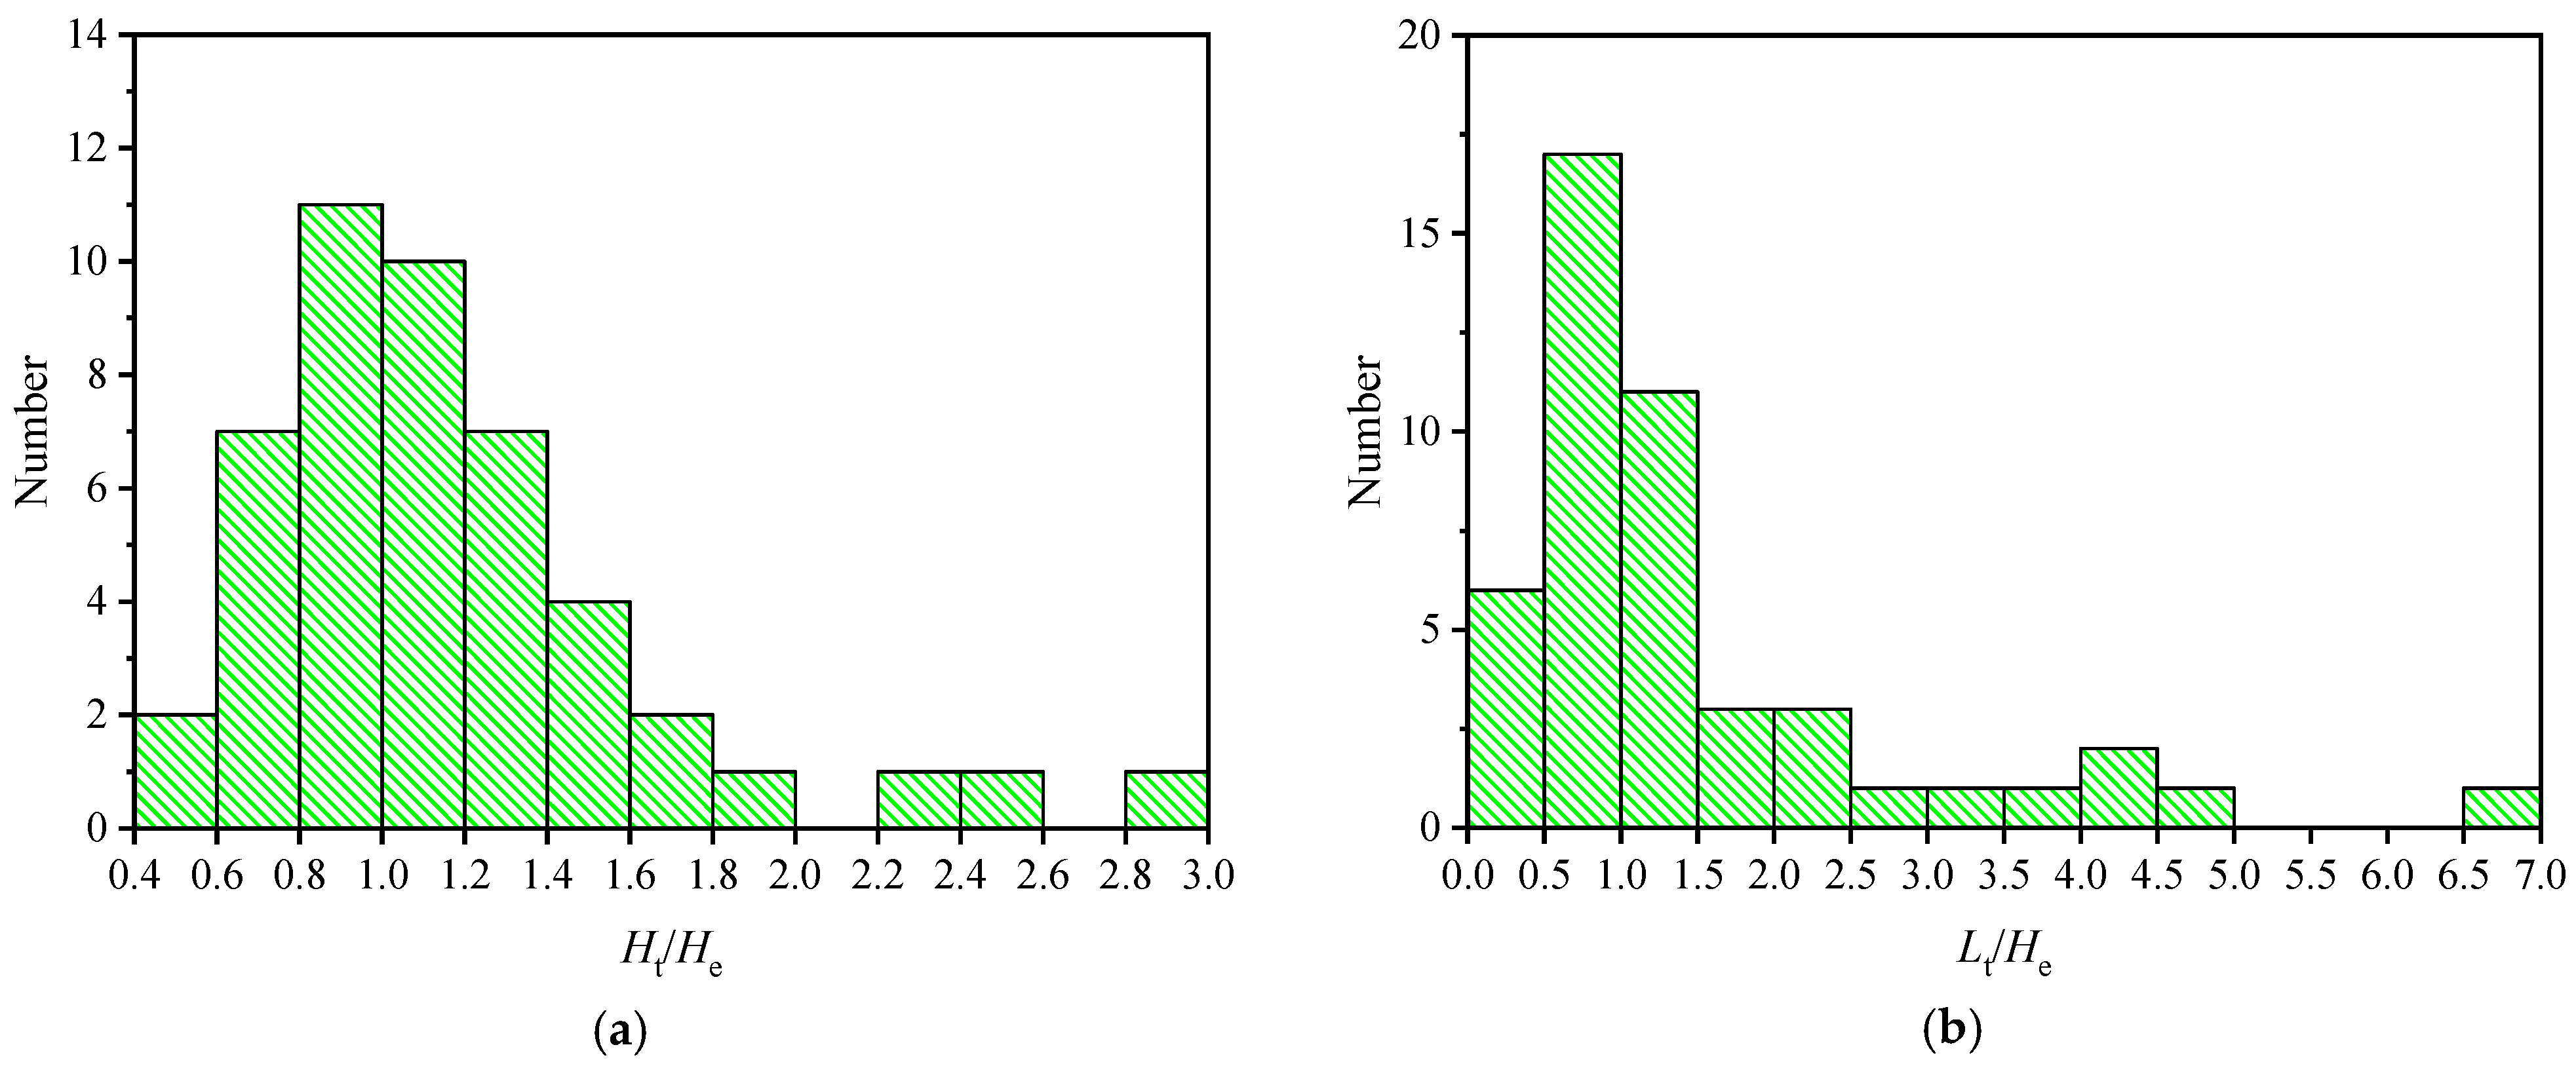
Figure 3 shows a histogram of the relative position between the tunnel and deep excavation. It is observed from Figure 3a that the value of Ht/He used to characterize the vertical position of the tunnel is in the range of 0.4–3.0, in which 0.8–1.0 accounts for the largest proportion, and the tunnels with Ht/He ≤ 1.0, 2.0, and 3.0 account for 42.6%, 93.6%, and 100%, respectively. It is observed from Figure 3b that the value of Lt/He used to characterize the horizontal position of the tunnel is in the range of 0–7.0, in which 0.5–1.0 accounts for the largest proportion, and the tunnels with Lt/He ≤ 1.0, 2.0, and 3.0 account for 48.9%, 78.7%, and 87.2%, respectively.
The above statistical results of Ht/He and Lt/He provide data support for the setting of adjacent tunnel positions in the following numerical simulations.
3. Numerical Simulation of the Effect of Deep Excavation on Adjacent Tunnels
3.1. FEM Numerical Model
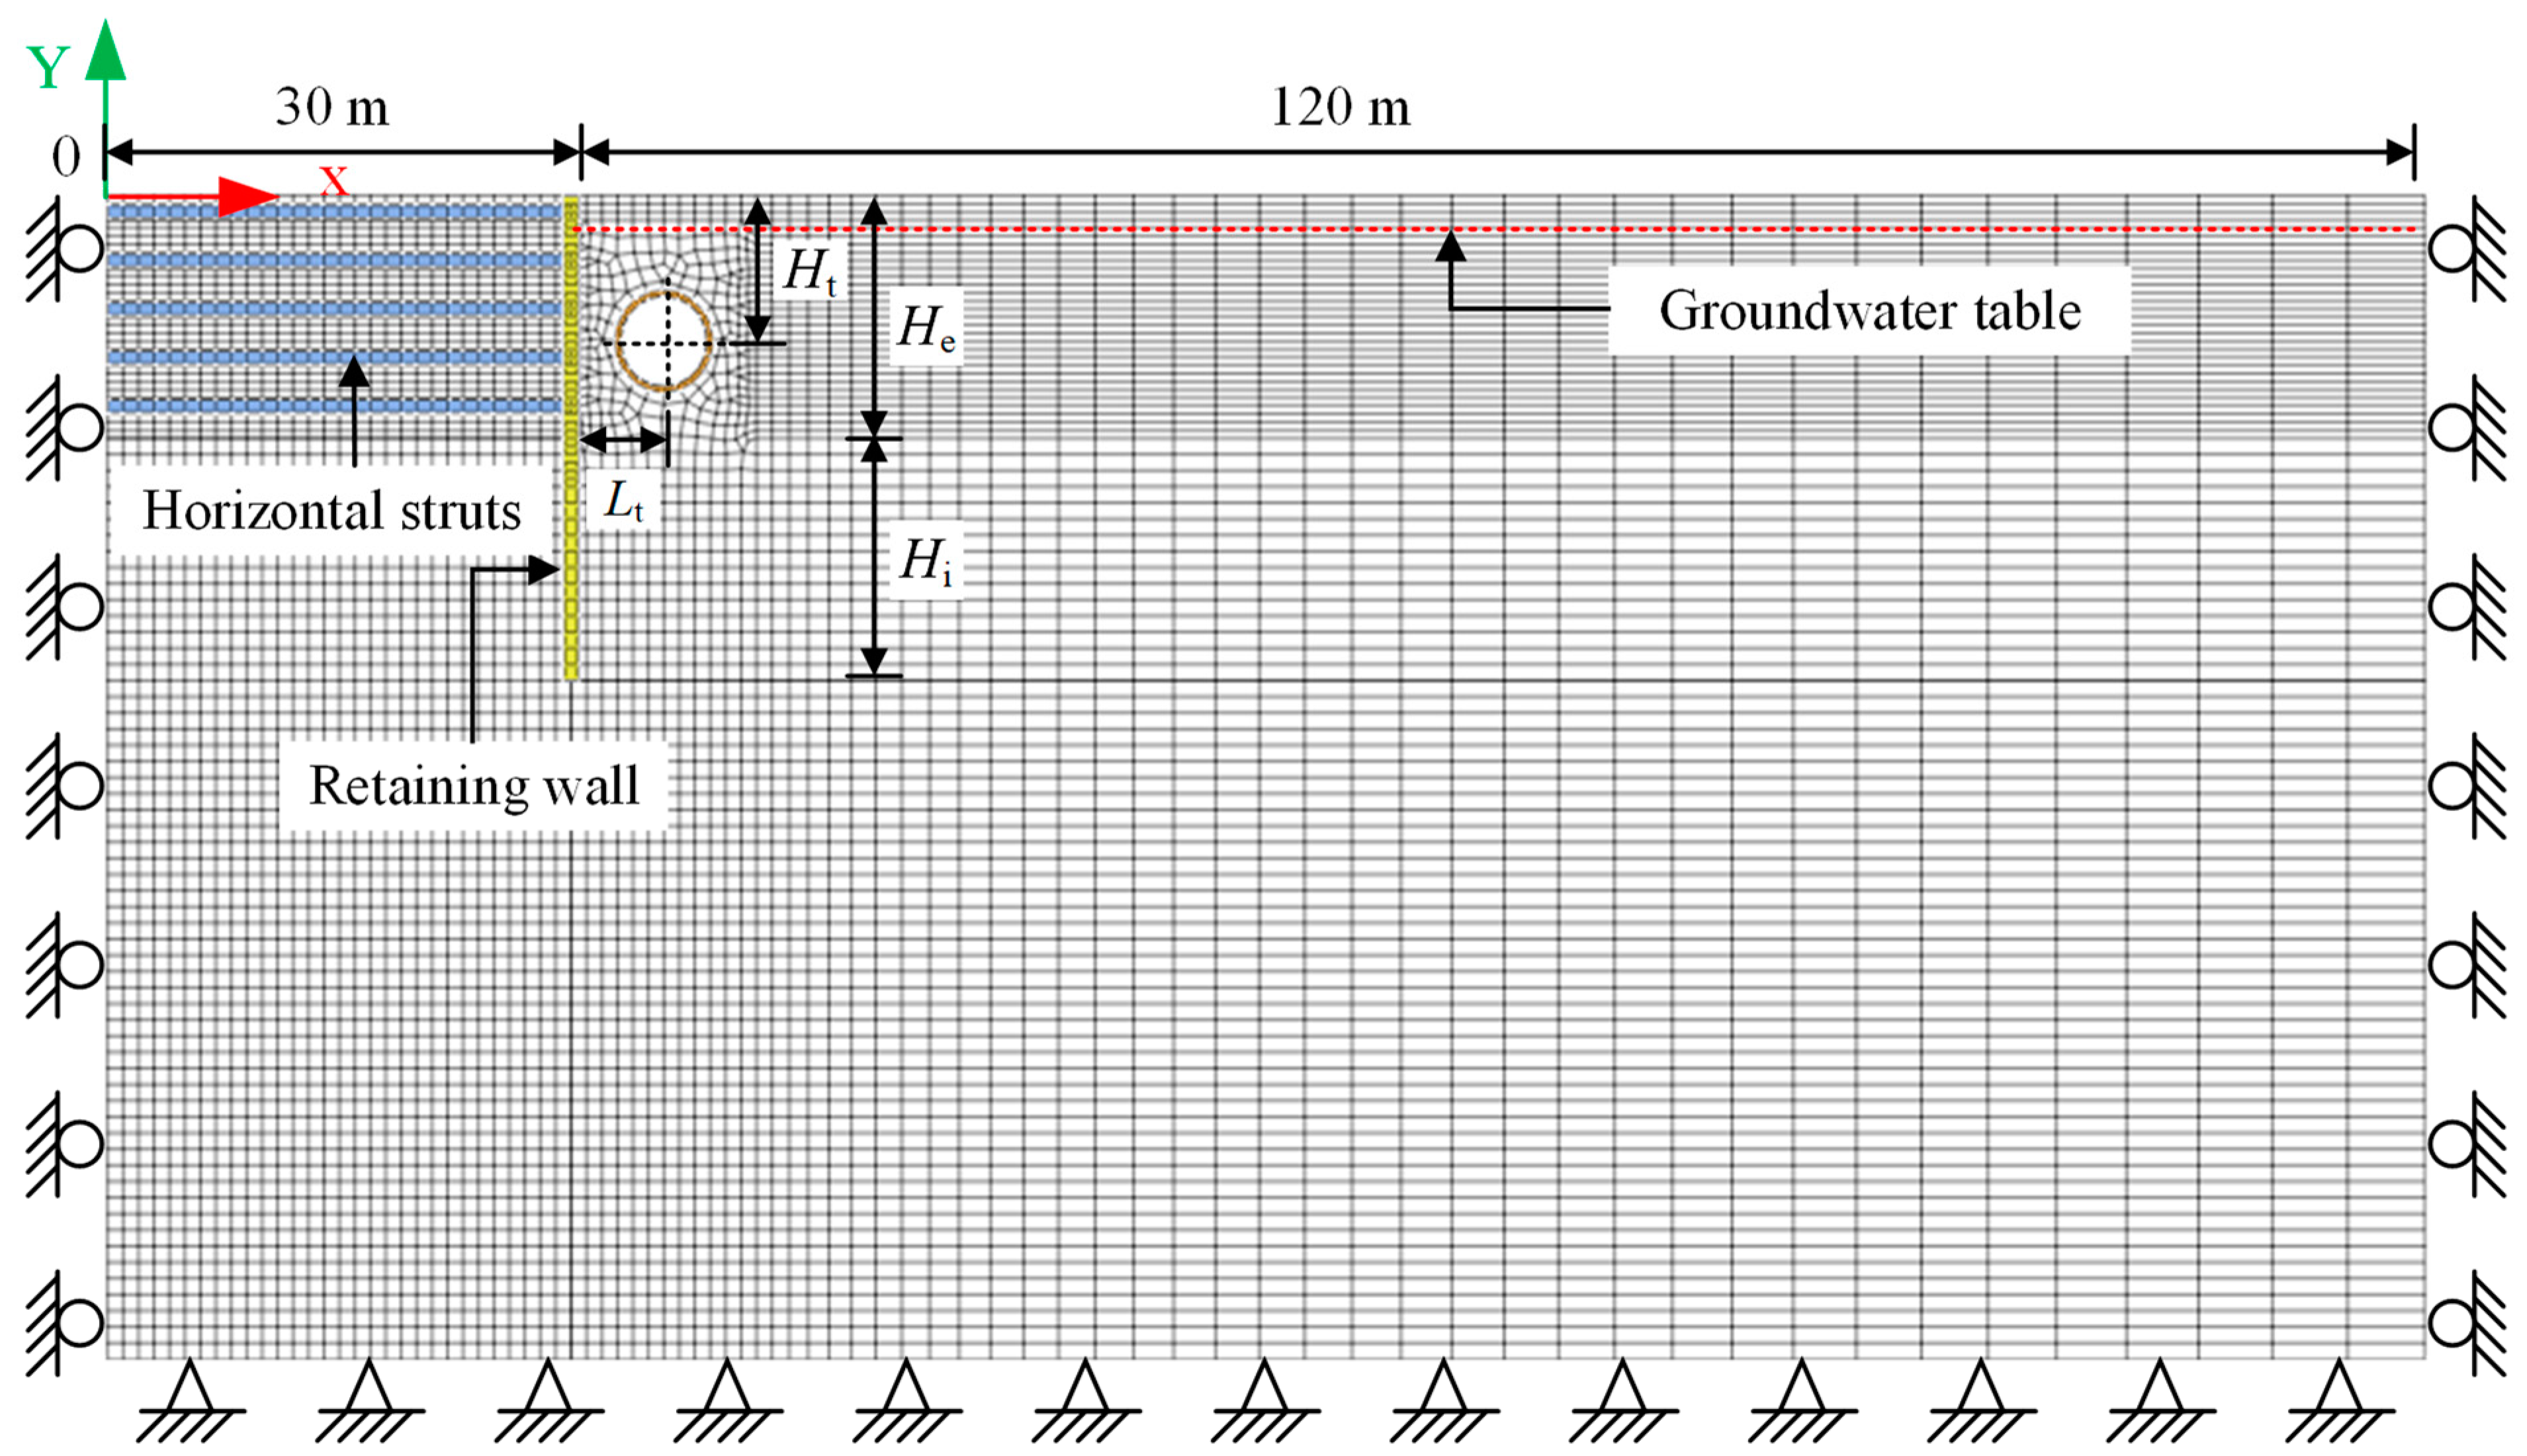
To determine the influenced zone of deep excavation on the adjacent tunnel, numerical simulations were conducted using the finite element code MIDAS. Theoretically, the effect of deep excavation on the adjacent tunnel is a 3D issue, and the excavation-induced tunnel displacement along its longitudinal axis appears as a single-peak curve, as shown in Figure 1a. Considering more than 700 simulation conditions are set in this study, and 3D numerical simulation takes a lot of time and cost; therefore, the section of tunnel with a single-peak displacement is selected for 2D analysis.
Figure 4 shows the 2D FEM model for the effect of deep excavation on the adjacent tunnel. The deep excavation is supported by a diaphragm wall and horizontal struts. The depth of deep excavation is He, which is analyzed as a variable, and the half-width of deep excavation is B = 30 m. The thickness of the retaining wall is set to t = 0.8 m, and the insertion depth of the retaining wall is set to Hi = He. The adjacent tunnel is a subway shield tunnel, which has a diameter of 6.0 m and a wall thickness of 0.3 m. The horizontal distance from the tunnel center to the deep excavation is Lt, and the buried depth of the tunnel center is Ht, which are also analyzed as variables. In the model, the horizontal distance from the right boundary to the retaining wall is 120 m, and the vertical distance from the bottom boundary to the base slab is 54 m, which can eliminate the boundary effect under different simulation conditions.
In the model, the soil is simulated using a plane strain element; the retaining wall, horizontal struts and existing tunnel are simulated using a beam element; and the contacts between the retaining wall soil and tunnel soil are simulated using an interface element. To increase the calculation efficiency and ensure calculation accuracy, the mapping mesh is used. The mesh size near the deep excavation and tunnel is 1 m, and that near the boundary is 5 m.
For displacement boundary conditions, the left and right boundaries are limited to horizontal displacement, the bottom boundary is limited to horizontal and vertical displacements, and the top boundary is kept free. For load boundary conditions, only gravity is considered, and no other external loads are considered. For hydraulic boundary conditions, the initial groundwater table is 1.5 m below the ground surface, and the pressure head on the groundwater line is 0.
3.2. Constitutive Model and Parameters of Material
3.2.1. Constitutive Model and Parameters of Soil
It is known from the statistics in actual projects that most of the collected case histories occurred in the soft soil represented by silty clay. Therefore, silty clay was chosen as the soil for numerical simulation, and it was assumed to be a single homogeneous layer to simulate the thick, soft ground.
3.2.2. Constitutive Model and Parameters of Retaining Wall, Horizontal Struts and Tunnel
The linear elastic constitutive model is used for the retaining wall, horizontal struts and adjacent tunnel made of reinforced concrete. The linear elastic model includes three parameters: γ (unit weight), E (elastic modulus), and ν (Poisson’s ratio). In this study, γ = 24.5 kN/m3, E = 30 GPa, and ν = 0.2 are adopted, respectively.
In the model, the tunnel is established as a uniform circle ignoring joints, but in fact, the tunnel is made up of segments assembled by blots, leaving longitudinal and transverse joints. Therefore, a parameter η, the effective stiffness ratio, is introduced to reflect the weakening effect of joints on tunnel stiffness, i.e., the equivalent stiffness of the tunnel is ηEI. Where EI is the bending stiffness of tunnel ignoring joints, and η ≤ 1. In this study, η = 0.75 is adopted, referring to some studies [33,34,35,36,37].
3.2.3. Constitutive Model and Parameters of Wall-Soil and Tunnel-Soil Interfaces
The interface model is used for the wall-soil and tunnel-soil interfaces. The interface model mainly includes two parameters: Kn (normal stiffness modulus) and Kt (shear stiffness modulus). These two parameters are determined through Equations (1) and (2):
where , , and ; is the Poisson’s ratio of soil, and it is set ; is the Poisson’s ratio of the interface, and it is set ; is the virtual thickness coefficient of the interface, and it is set ; is the strength reduction coefficient, and it is set .
3.3. Simulation Conditions
In numerical simulations, the factors of excavation depth (He), the maximum retaining wall deflection (δhm), and tunnel position (Ht, Lt) are considered as three variables to study the effect of deep excavation on the adjacent tunnel.
For the excavation depth, He = 18 m, 15 m, 12 m, and 9 m are adopted, totaling 4 conditions. It is known from the statistics that the number of deep excavations with He ≤ 18 m accounts for 81.0%. Therefore, it is considered that the values of He adopted in this study are representative of engineering.
For the maximum retaining wall deflection, δhm = 0.18%He, 0.3%He, and 0.7%He are adopted according to the technical code CCES 03–2016 [38], totaling 3 conditions. It reflects the different control levels of retaining wall deflection in construction.
For the tunnel position, the spacing between each tunnel is 3 m when Lt/ ≤ He and Ht ≤ He and that is 6 m when Lt > He and Ht > He, and the maximum value of Lt = 3.0 He and Ht = 3.0 He. It is known from the statistics that the tunnels with Lt/He ≤ 3.0 account for 87.2%, and tunnels with Ht/He ≤ 3.0 account for 100%. Therefore, the Lt and Ht adopted are widely representative in practical engineering. Since construction is not allowed within 3 m from the edge of the tunnel, and the buried depth of the tunnel crown should not be less than 1.0 times the tunnel diameter, the minimum value of Lt is 6 m, and the minimum value of Ht is 9 m.
After the above three factors were combined together, totaling 732 numerical models were established, as listed in Table 2.
3.4. Simulation Steps of the Construction Process
The simulation of the construction process was realized by activating and deactivating the element meshes and applying the displacement, load and hydraulic boundary conditions. The simulation steps were briefly described as follows: firstly, applying gravity to obtain the initial stress and displacement fields of the site. Secondly, the retaining wall of the deep excavation was installed. Then, the groundwater in the pit was lowered to 1 m below each expected excavation elevation, the corresponding soil layer was removed, and the horizontal struts were erected, and this cycle continued until the soil was excavated to the base slab.
After the first and second steps, the generated displacement of the site was reset to 0 to eliminate the influence of gravity and retaining wall construction, and only the influence of subsequent dewatering and excavation was considered. The stress-seepage coupling analysis was used to study the effects of subsequent dewatering and excavation on the adjacent tunnel. Specifically, the pore water pressure was obtained through seepage calculation; then, the obtained pore water pressure was used in the stress calculation.
4. Influenced Zone of Deep Excavation on Adjacent Tunnel Displacement
4.1. Influenced Zone of Deep Excavation under Different Simulation Conditions
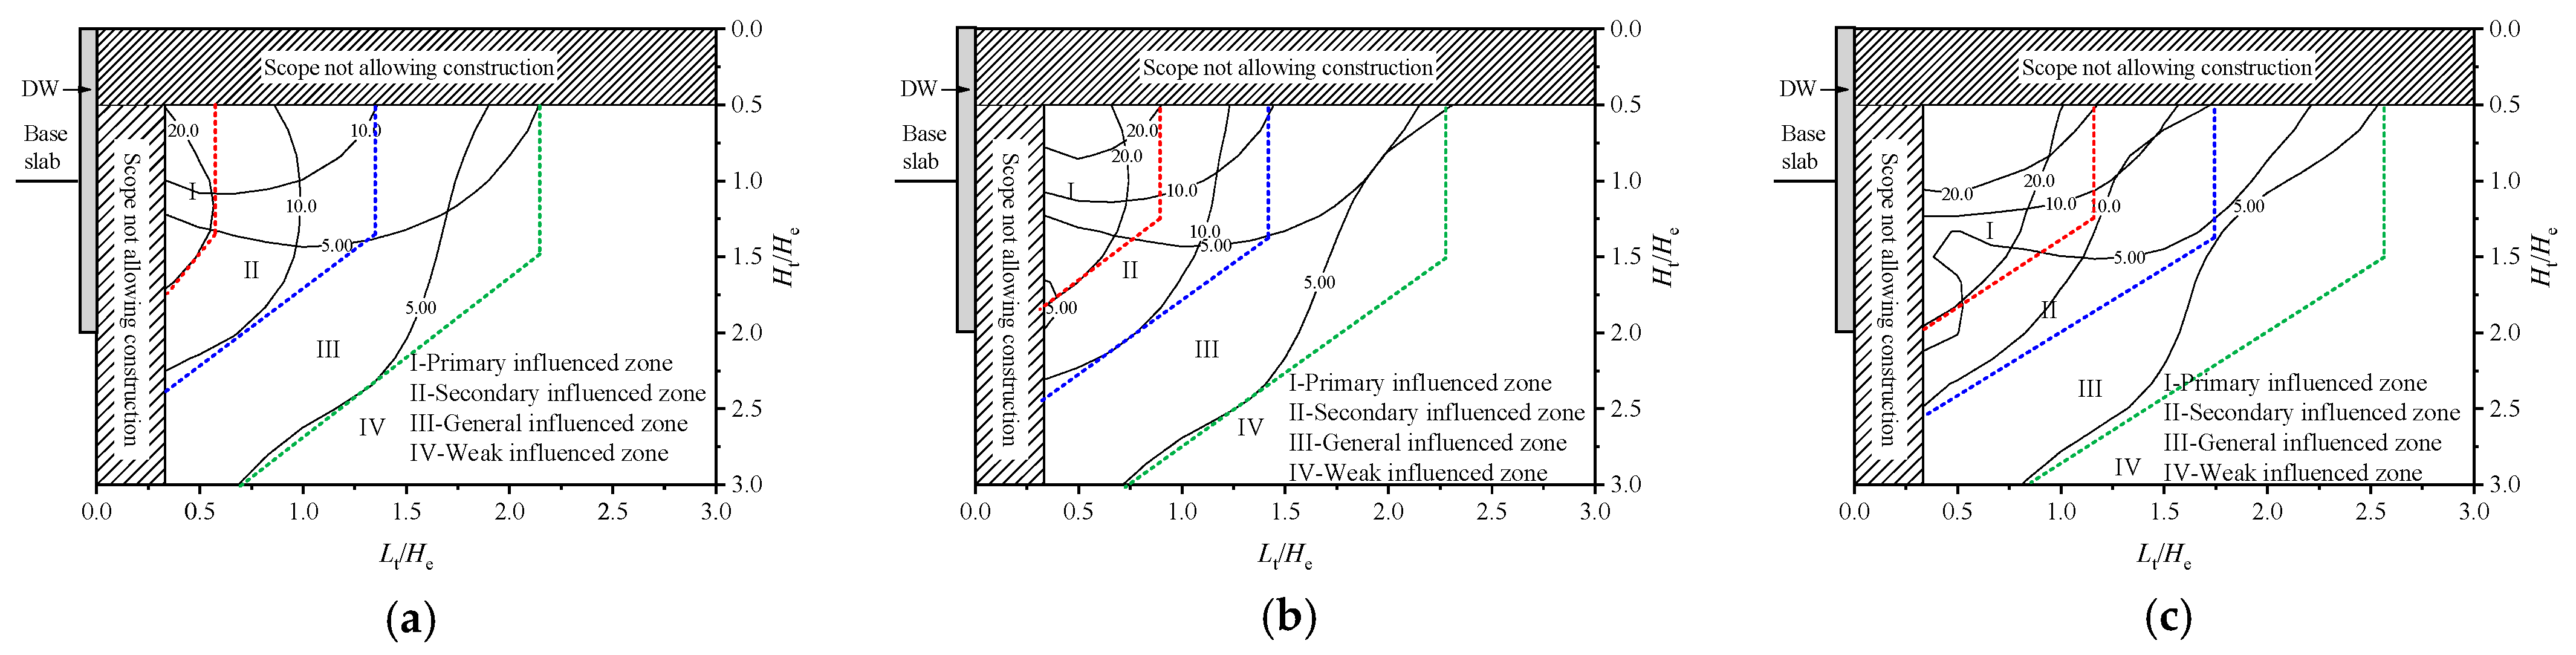
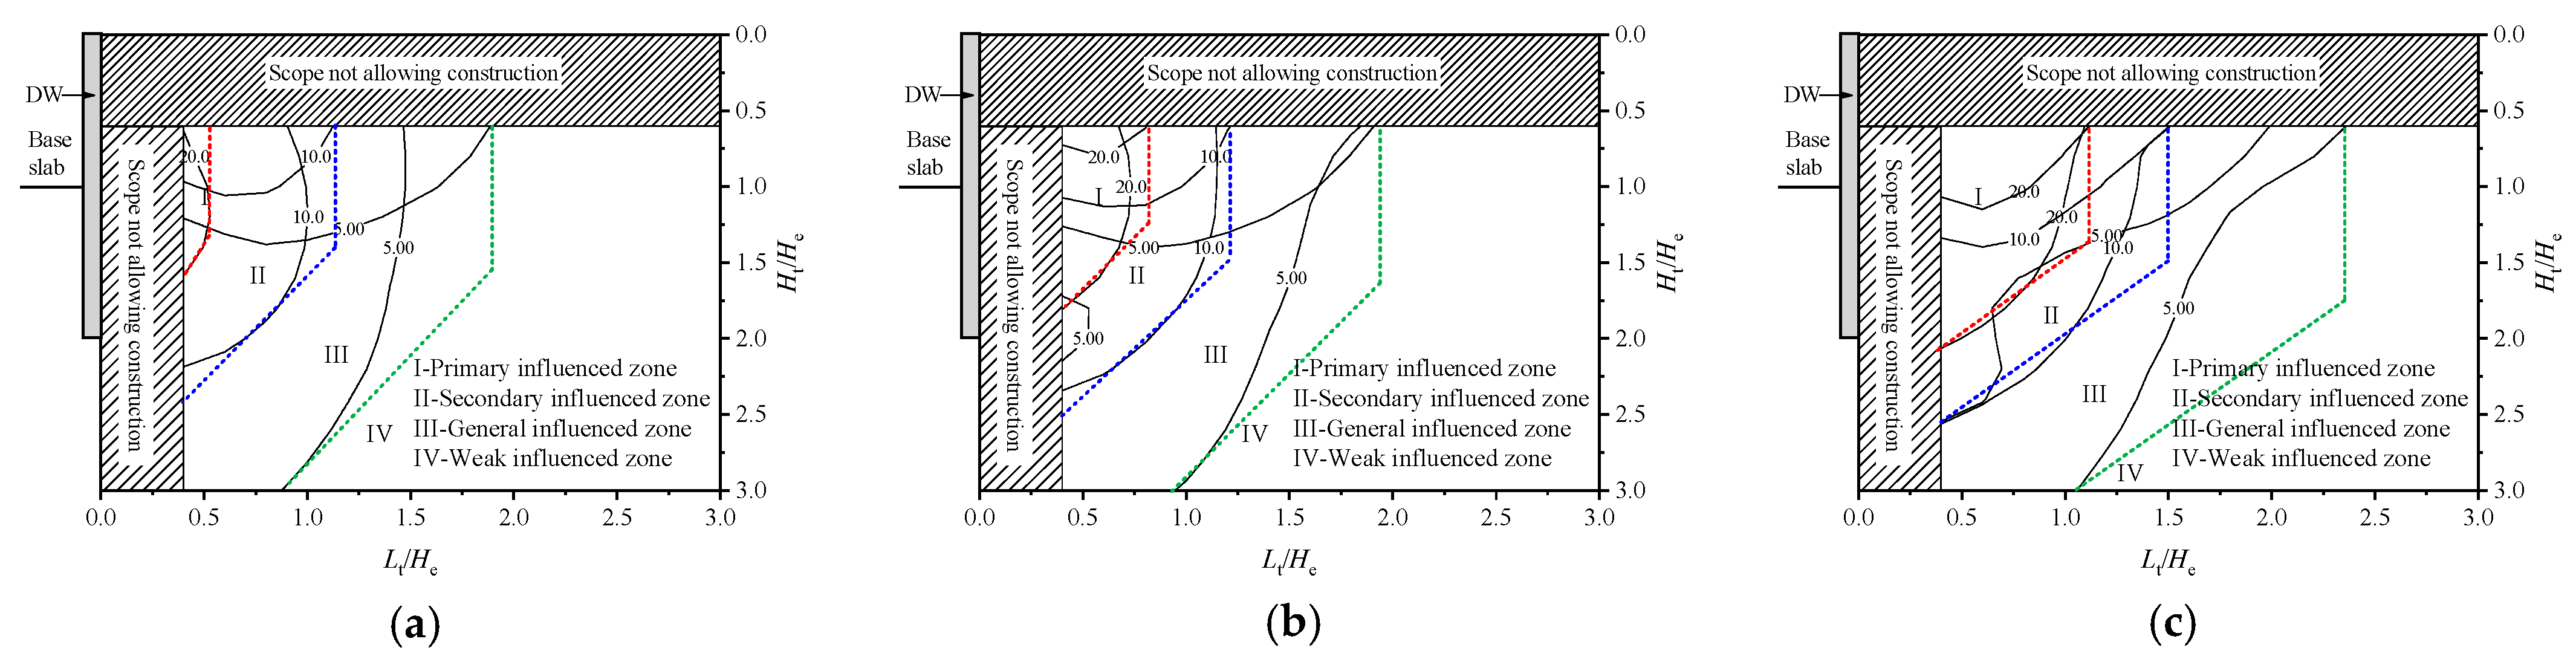
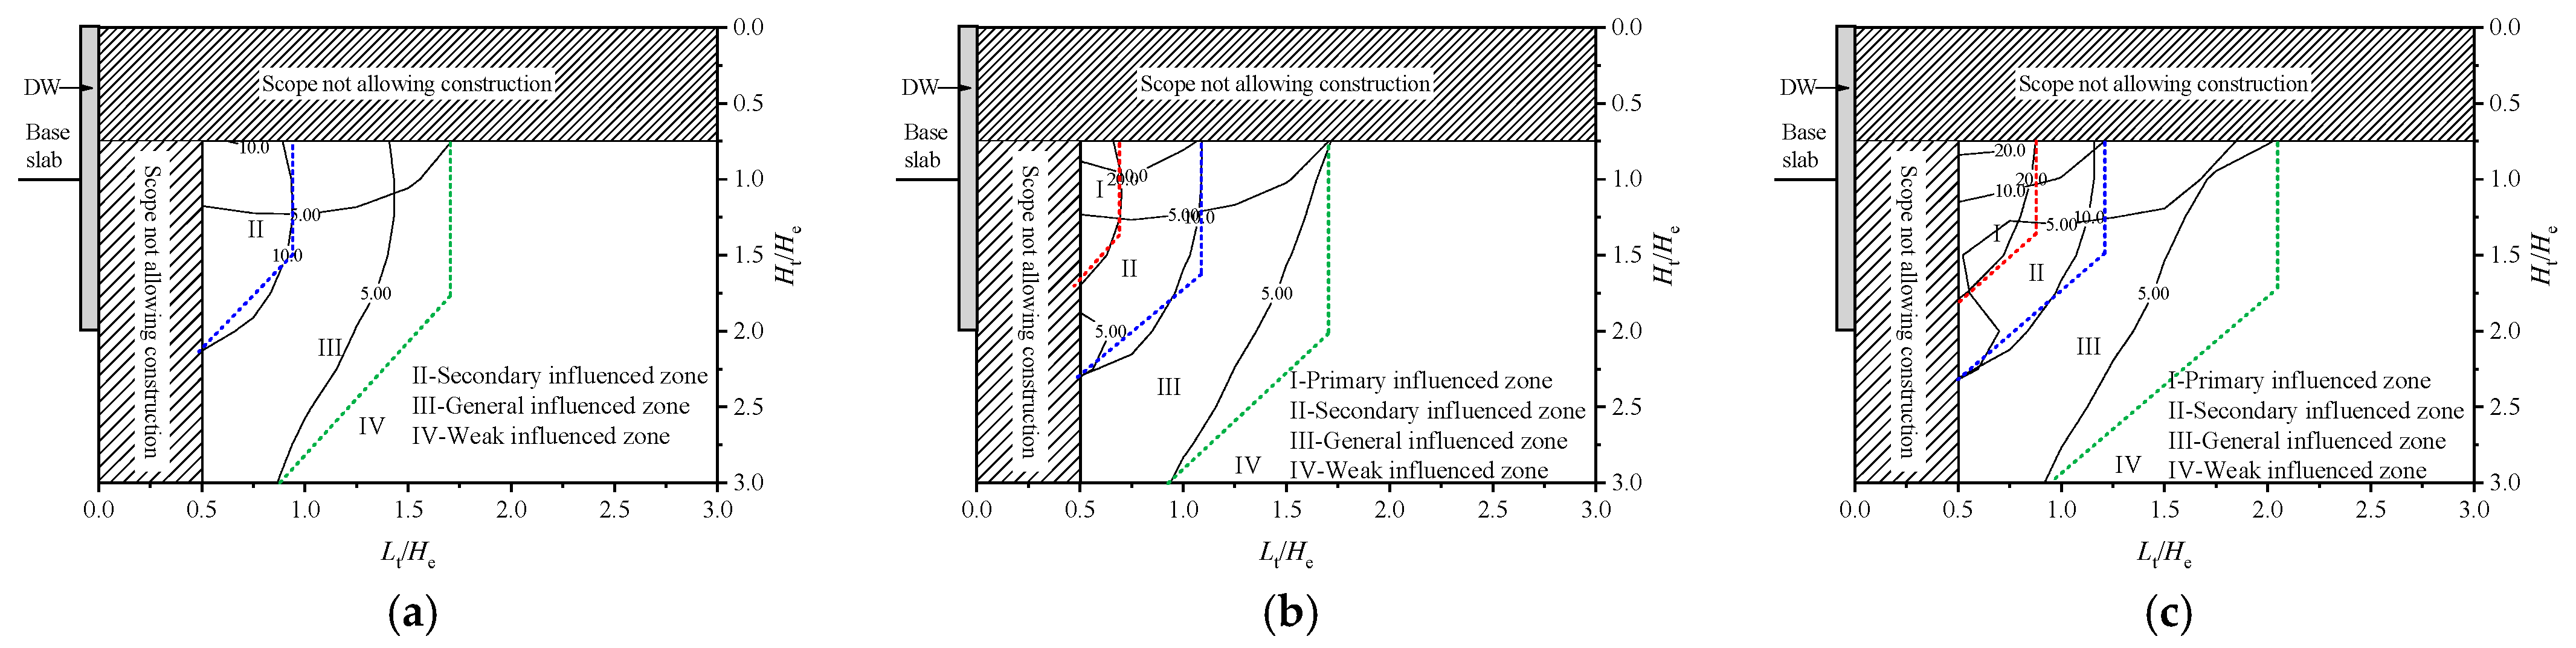
The determination method for the influenced zone of deep excavation on adjacent tunnel displacement references provided by Zheng et al. [27], and the specific process is not repeated here. Figure 5, Figure 6, Figure 7 and Figure 8 show the division results of the influenced zone of deep excavation under different simulation conditions. The range outside the pit is divided into: I (primary influenced zone), II (secondary influenced zone), III (general influenced zone), and IV (weak influenced zone), according to the three-level tunnel displacement control standards of 20 mm, 10 mm, and 5 m specified in the technical codes CJJ/T 202–2013 [39] and GB 50911–2013 [40].
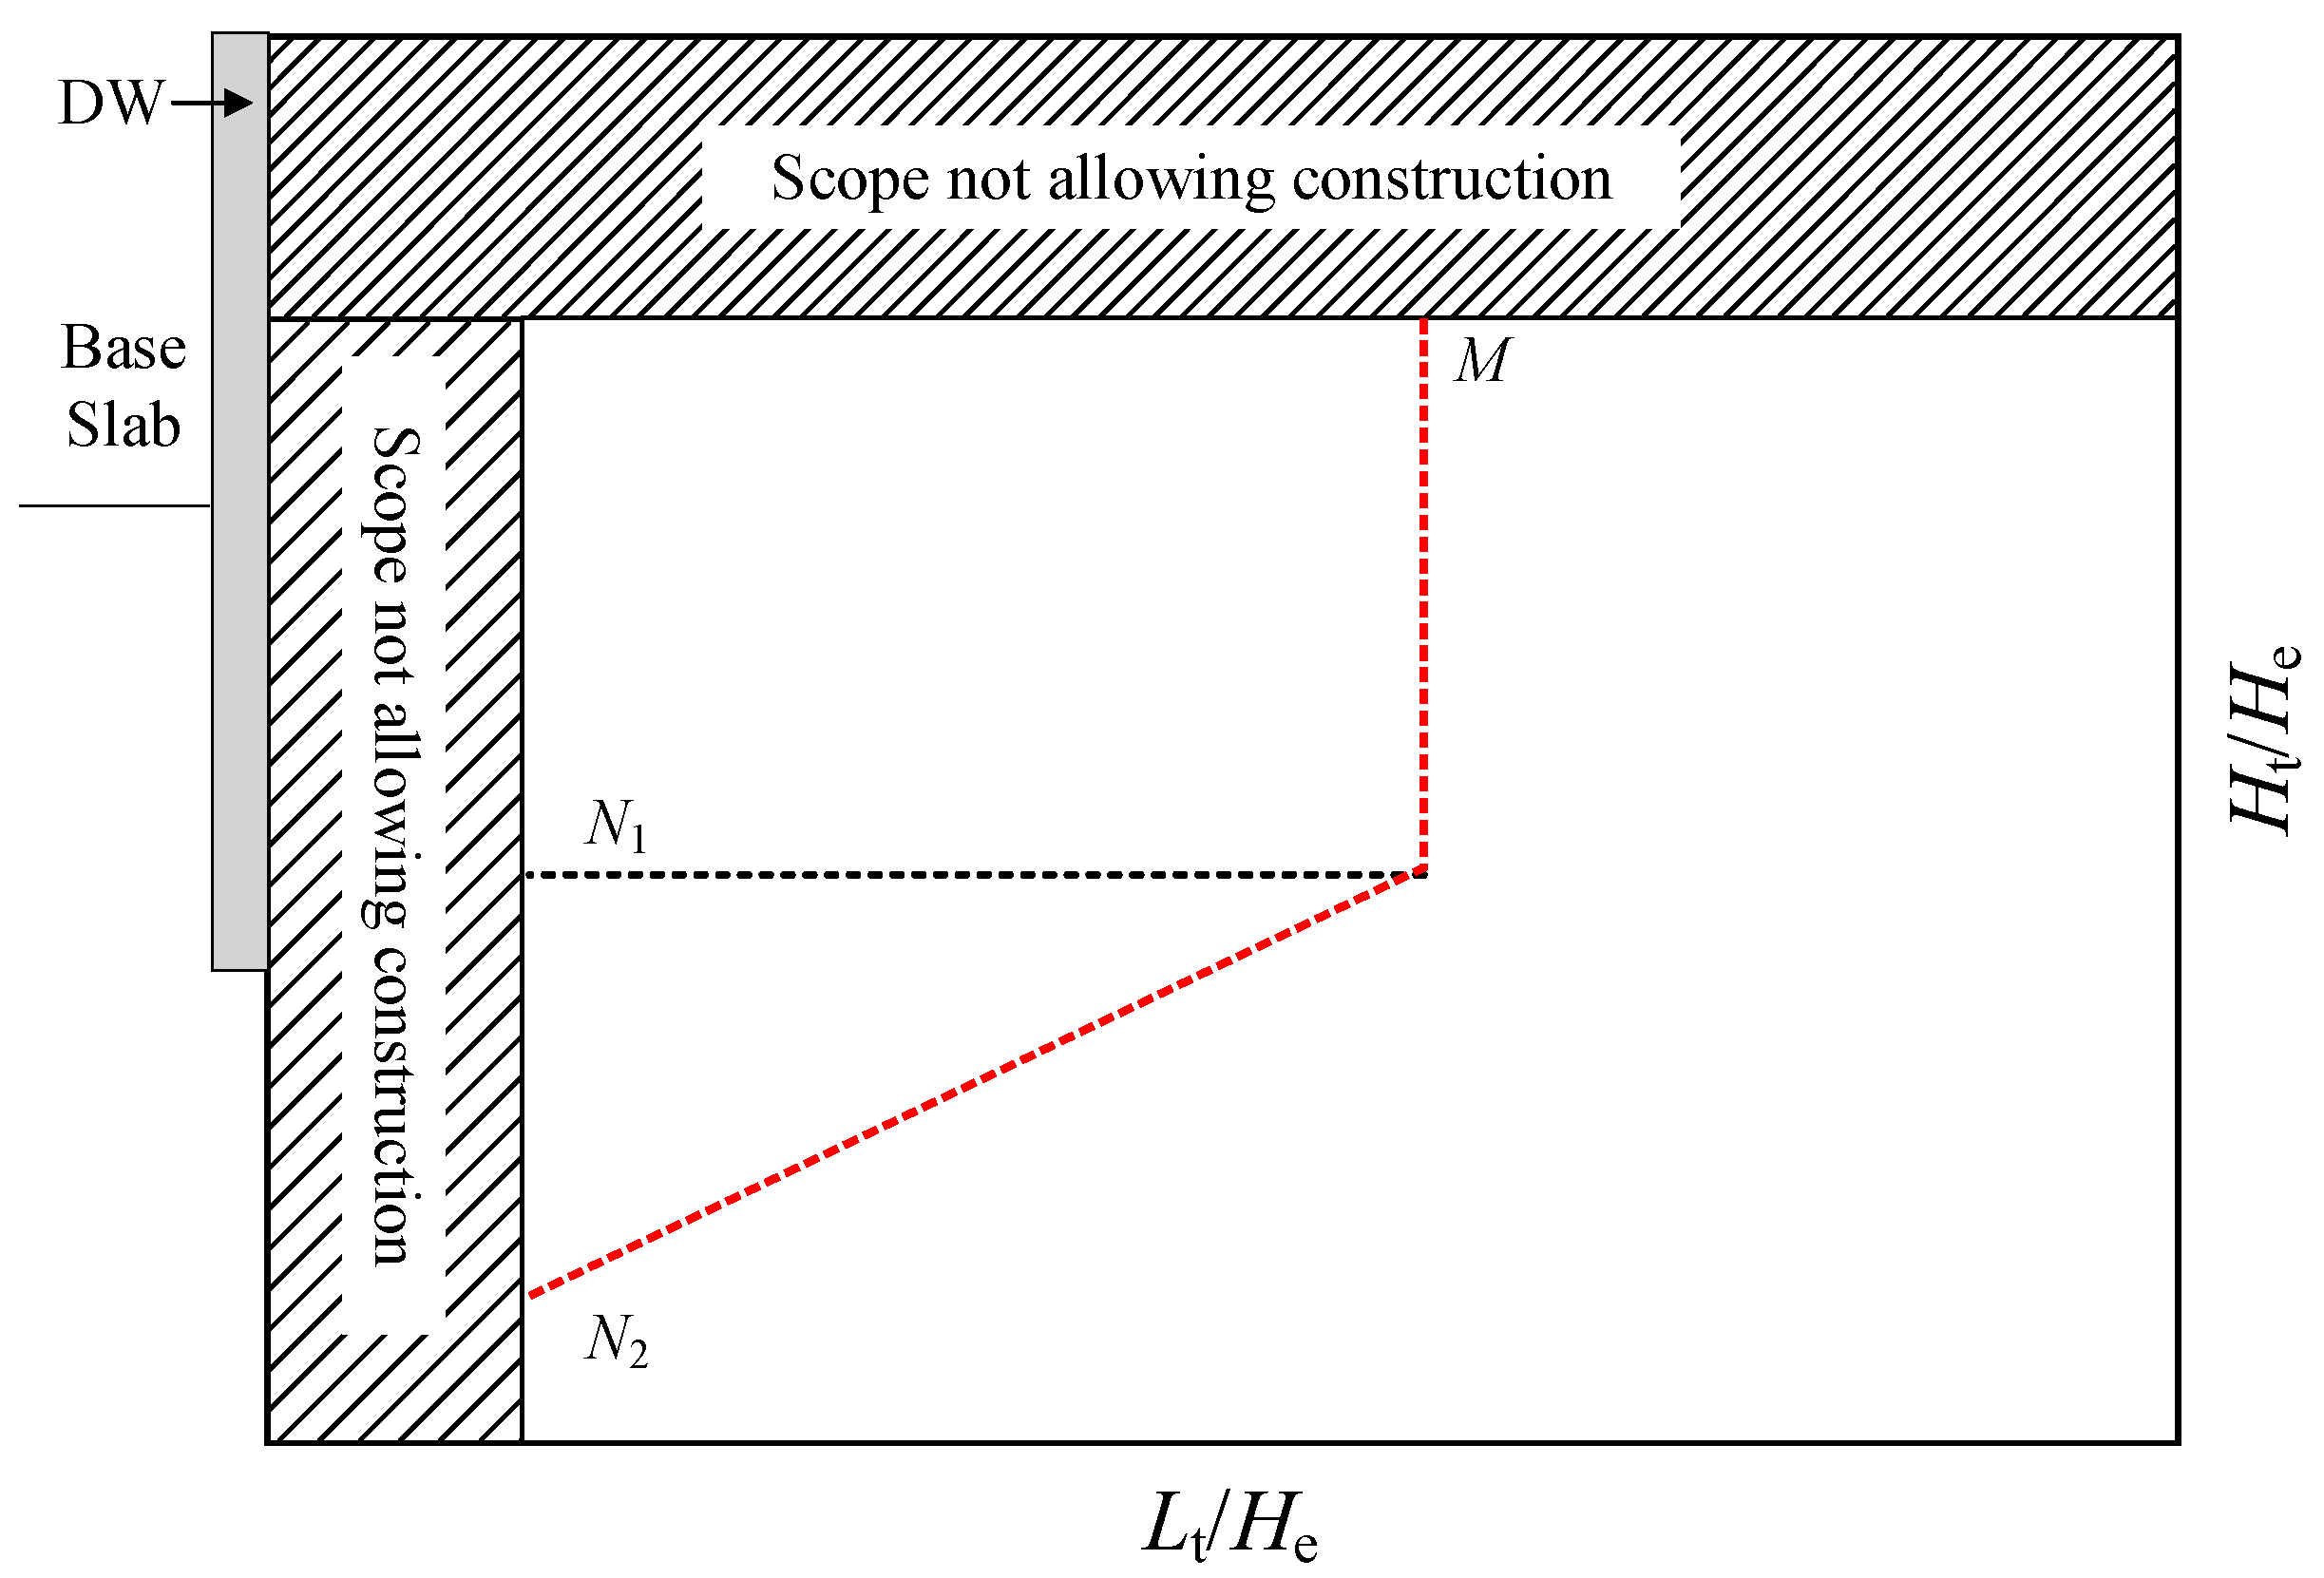
To quantitatively characterize the scope of the influenced zone, the shape of the influenced zone is simplified as a right trapezoid according to its features, the isoline of three-level tunnel displacement control standards is simplified as a polyline, and the coordinates of three points on the polylines are defined: M (width coefficient), N1 and N2 (depth coefficients), as shown in Figure 9. These three parameters reflect the influence potential of deep excavation on the tunnel displacement in horizontal and vertical directions, and the larger values of the above parameters, the greater the influence degree indicates. Through these three defined parameters, the scope of the influenced zones can be quickly determined.
Table 3 summarizes the determination parameters of the influenced zones under different simulation conditions. It is observed that the scope of the influenced zones is closely related to He and δhm, and the effects of these two factors on the M, N1, and N2 are analyzed in the following.
4.2. Effects of He and δhm on the Scope of Influenced Zone
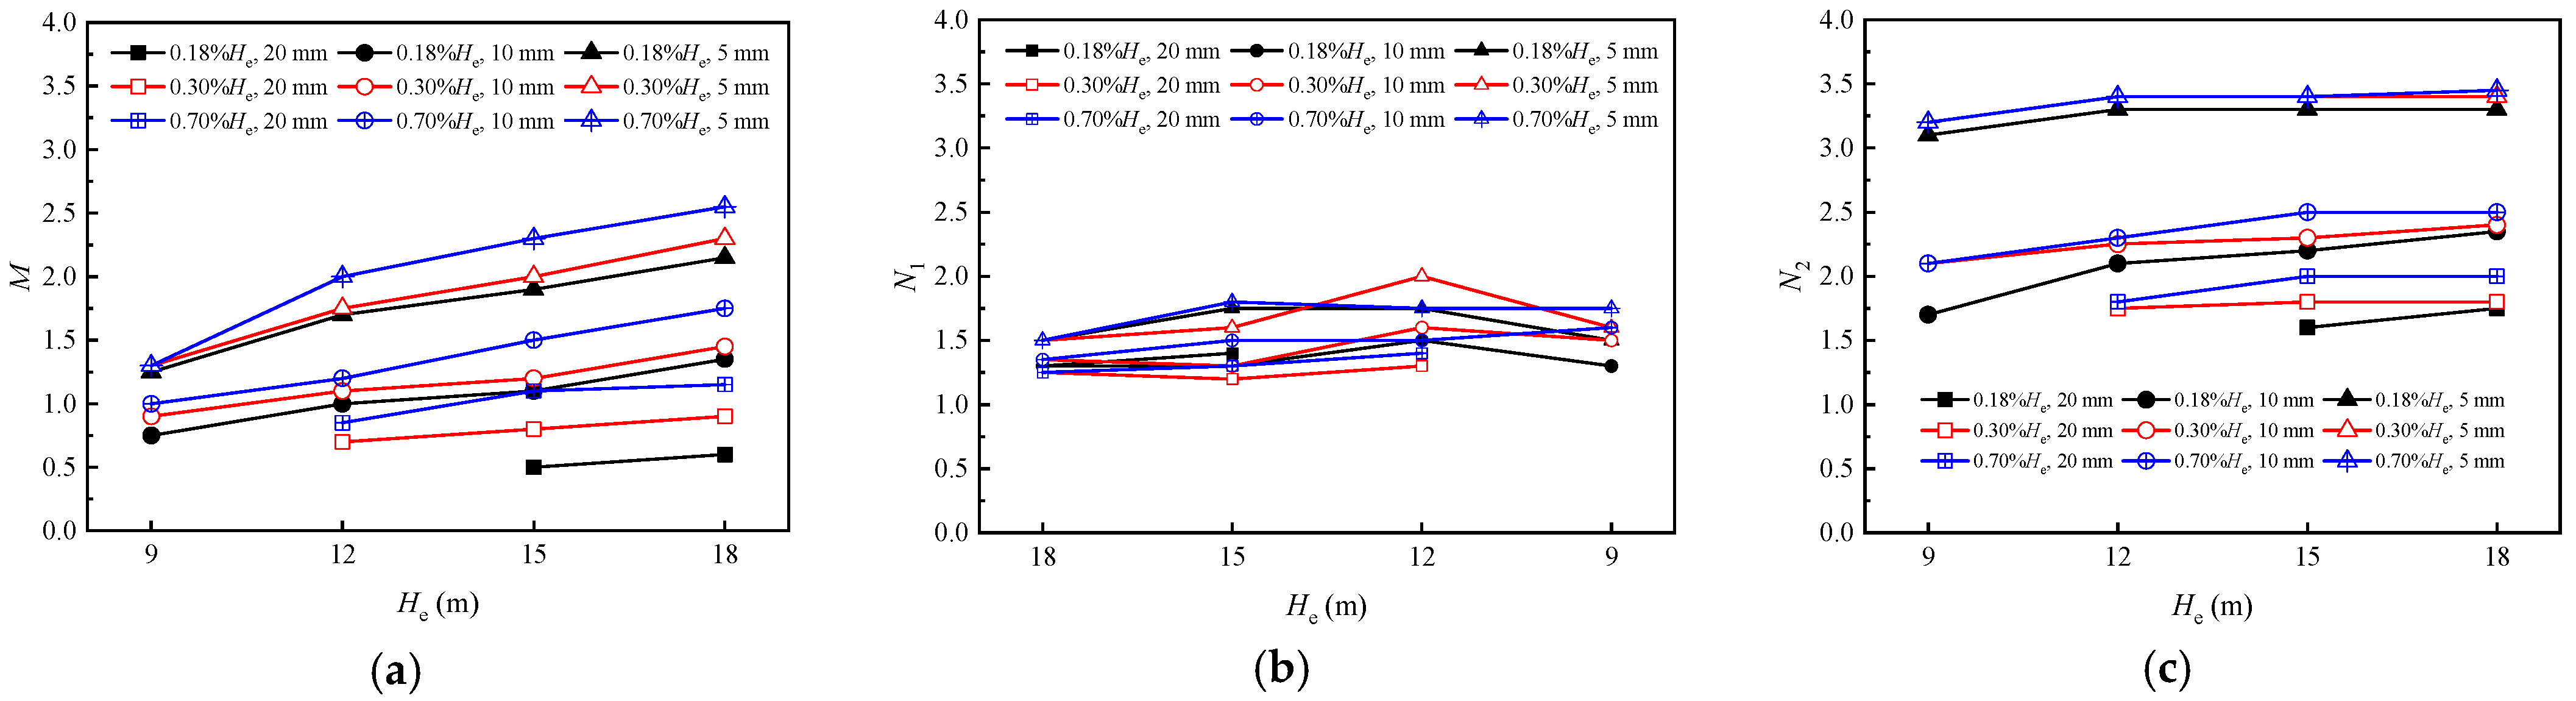
Figure 10 shows the effect of He on M, N1 and N2. It is observed from Figure 10a when the maximum retaining wall deflection and the tunnel displacement control standards are constant, M has a trend towards increasing linearly with He, i.e., the deeper of excavation, the wider the influenced zone obtained. It is observed from Figure 10b, He has no obvious effect on N1, and N1 varies between 1–2 with an average of about 1.5. It is observed from Figure 10c that when the maximum retaining wall deflection and the tunnel displacement control standards are constant, N2 has a trend towards increasing linearly with He, and this trend is more obvious when the tunnel displacement control standards are 20 mm and 10 mm.
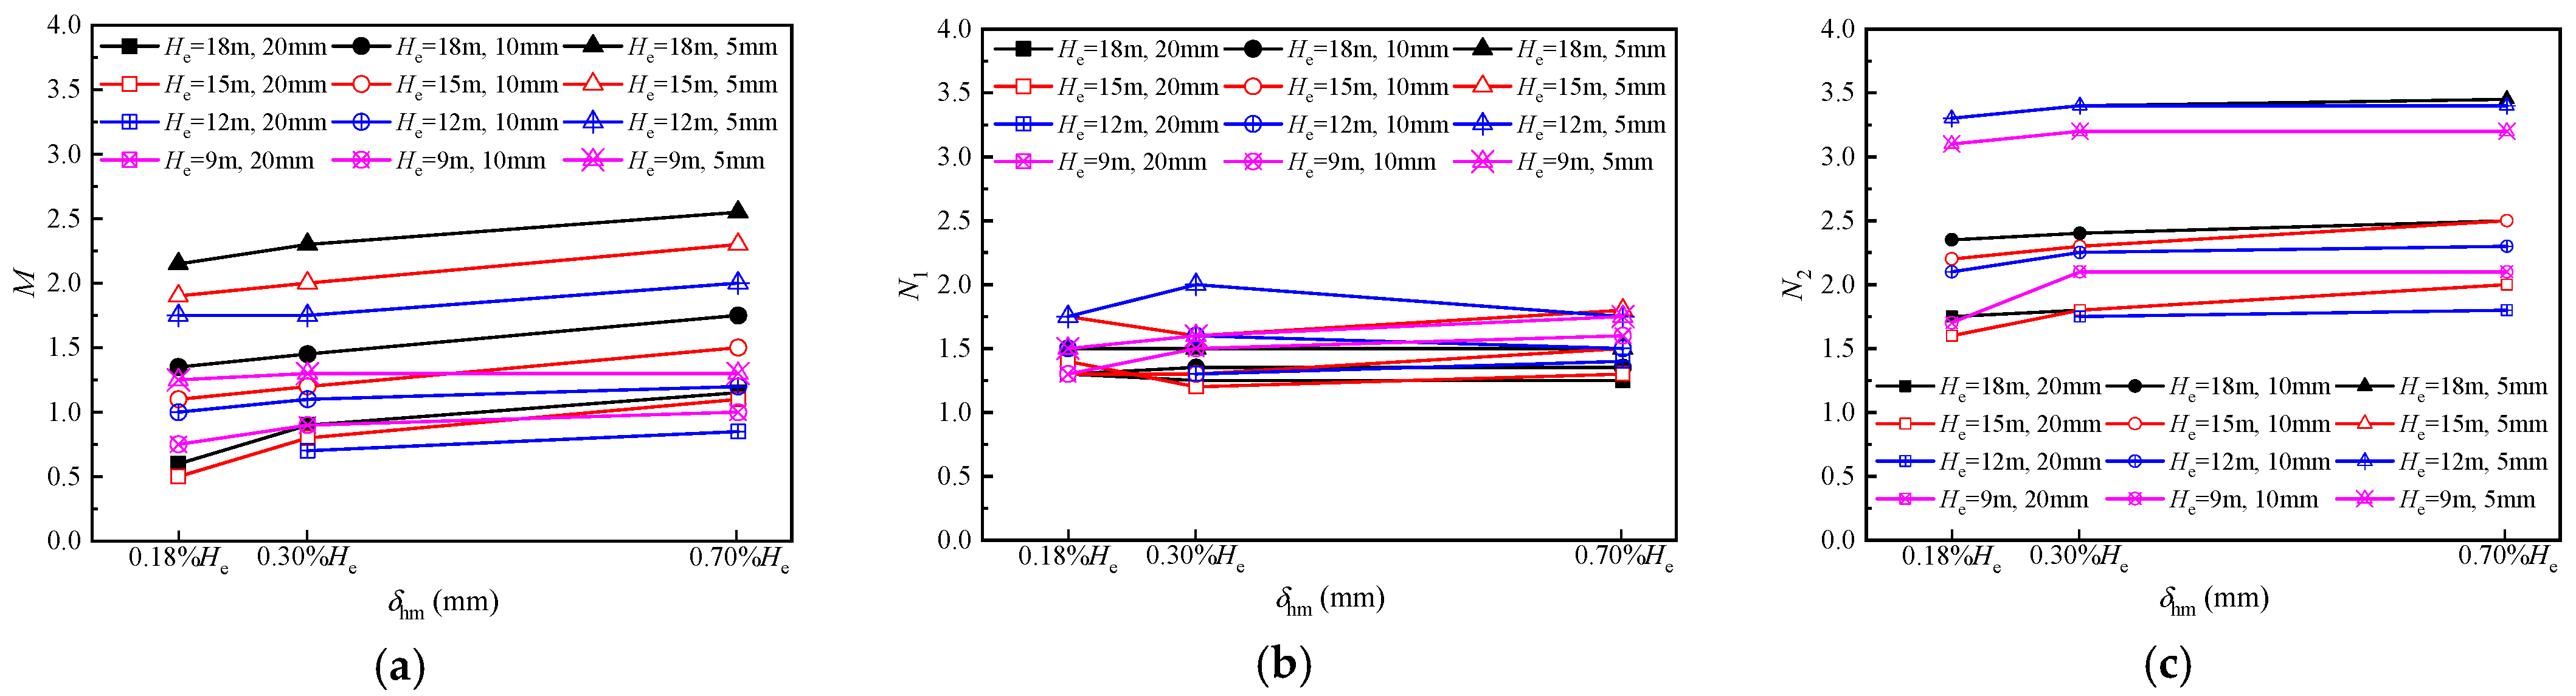
Figure 11 shows the effect of δhm on M, N1 and N2. It is observed from Figure 11a that when the excavation depth and the tunnel displacement control standards are constant, M a the trend towards increasing linearly with δhm, i.e., the deeper of excavation, the deeper the influenced zone obtained. It is observed from Figure 11b that the effect of δhm on N1 has no obvious rule, and N1 varies between 1–2 with an average of about 1.5. It is observed from Figure 11c that when the excavation depth and the tunnel displacement control standards are constant, N2 has a trend toward increasing linearly with δhm.
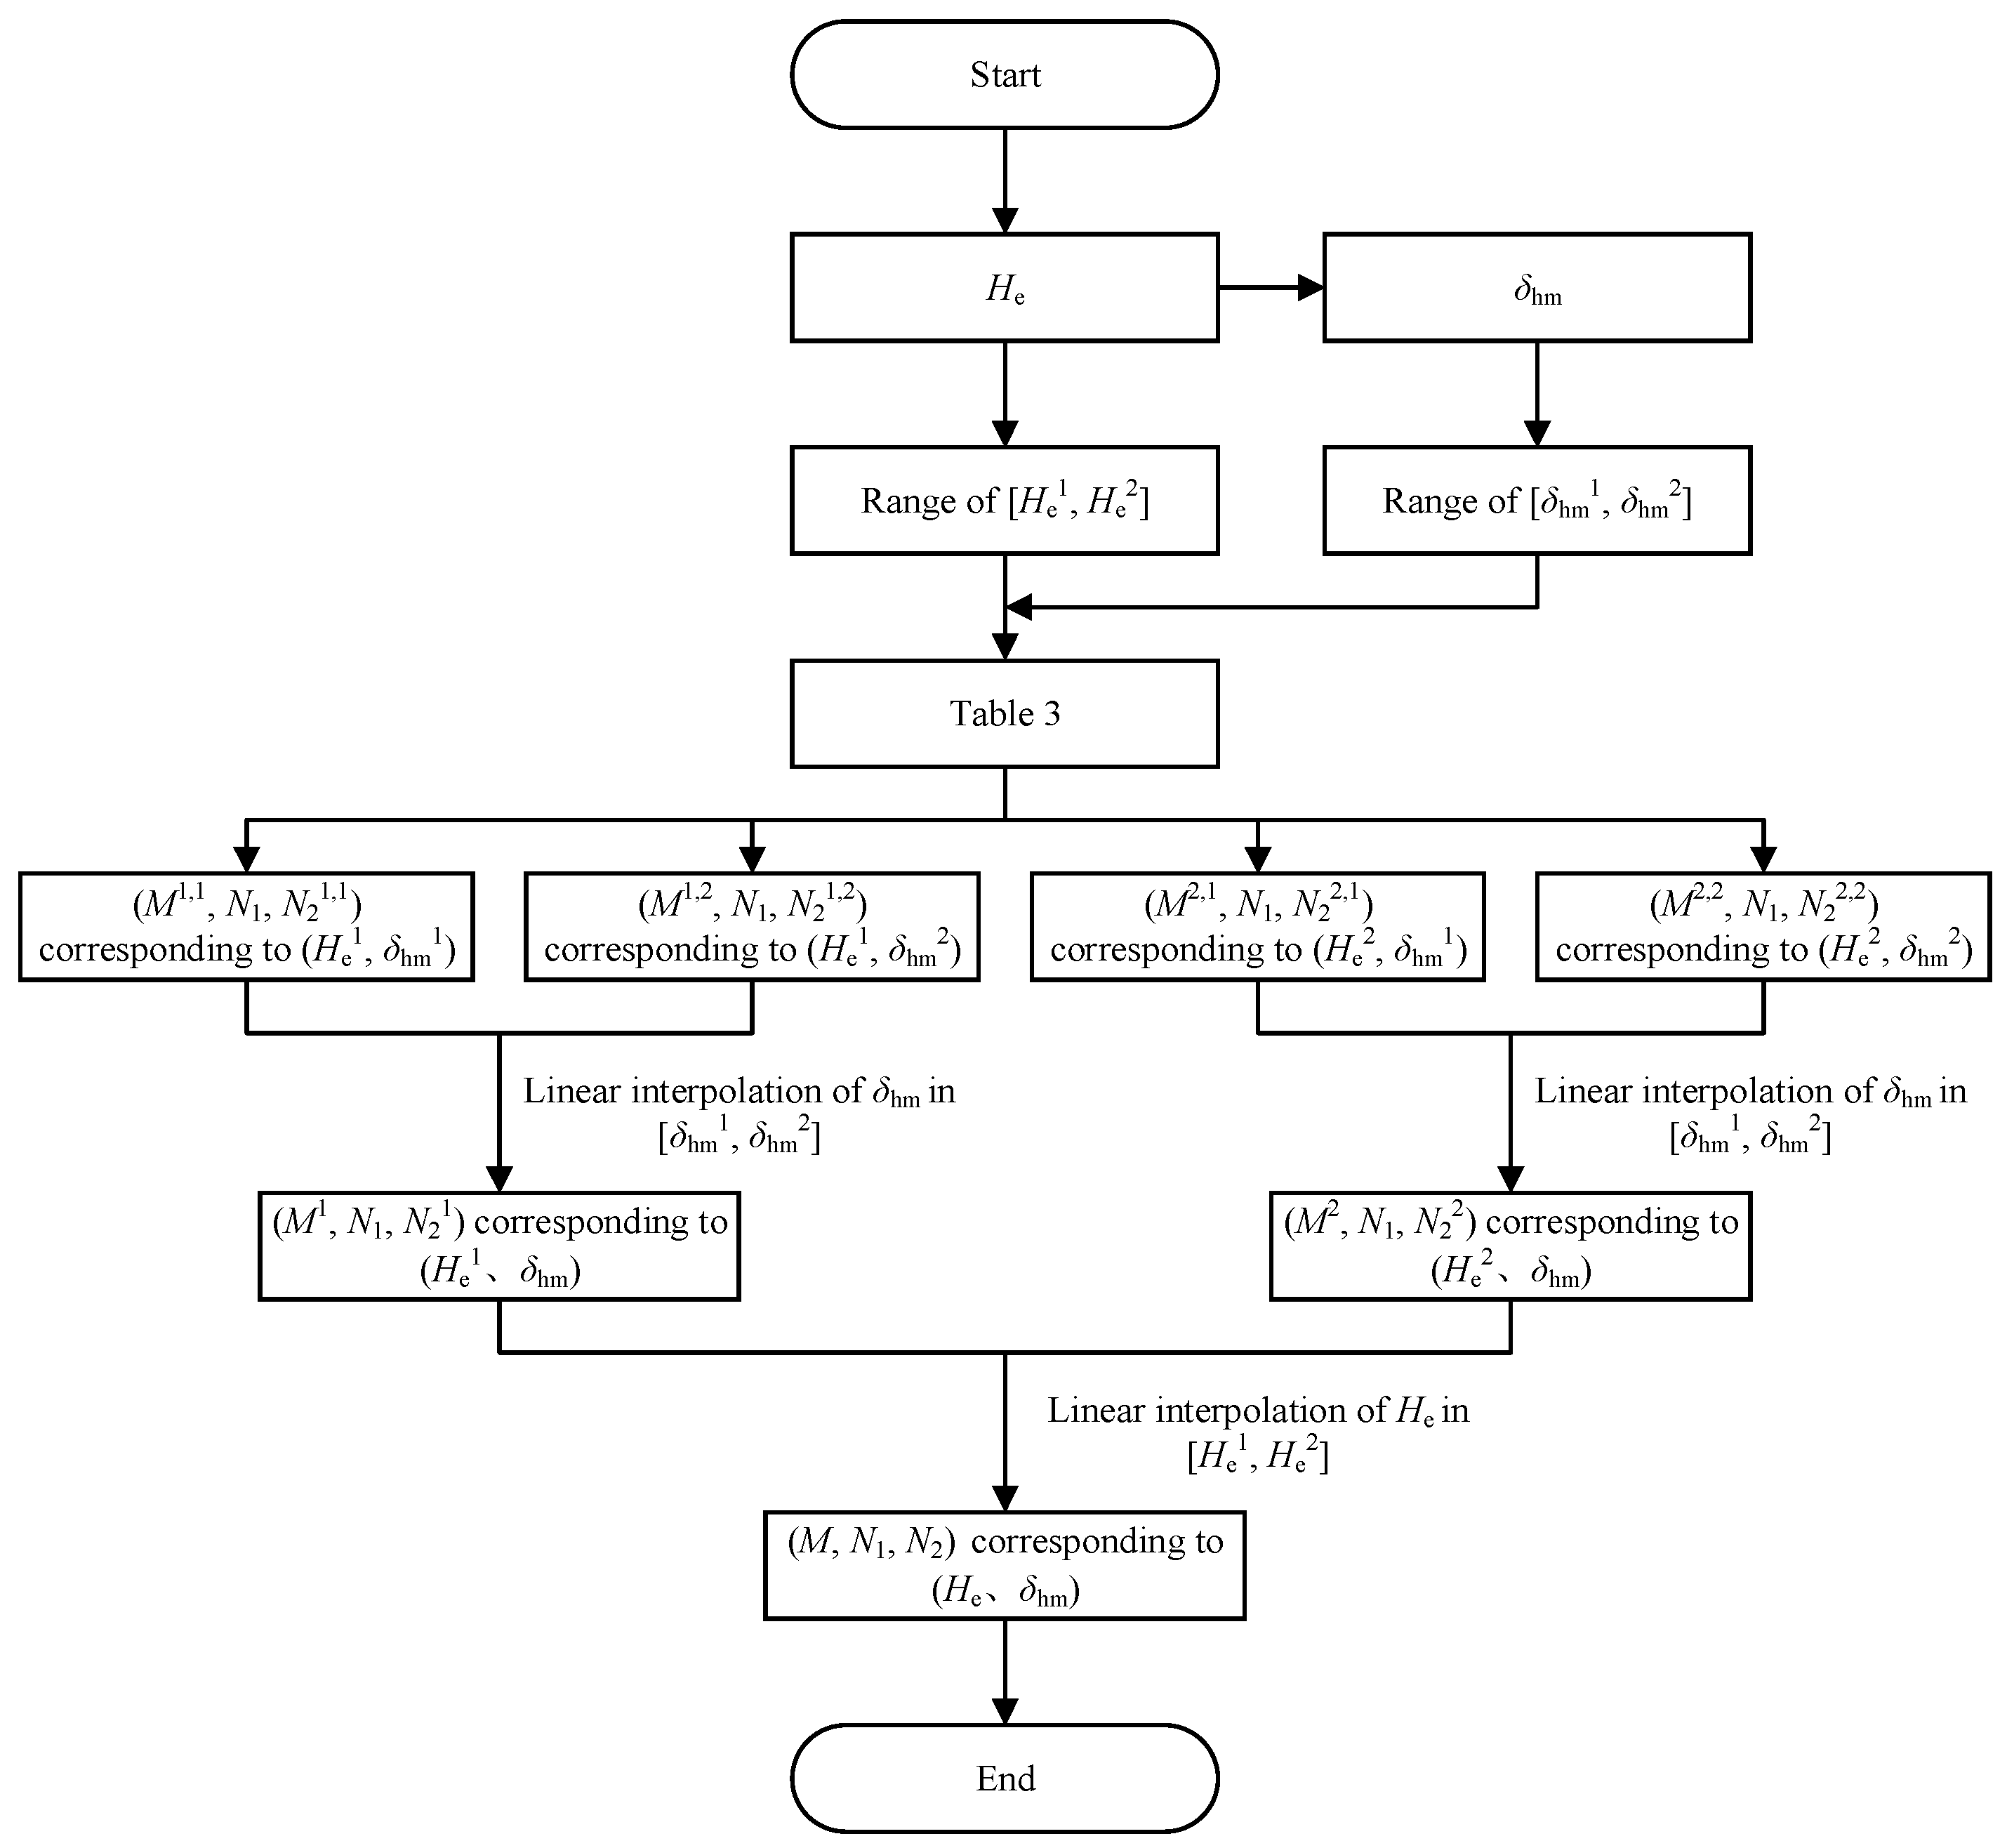
4.3. Prediction Method of Influenced Zone under any He and δhm Conditions
As described above, the determination parameters, M and N2, of the influenced zone have a linear relationship with He and δhm; N1 is less affected by He and δhm and varies between 1–2 with an average of about 1.5, so it can be taken a constant. Based on these conclusions, a method for predicting the scope of the influenced zone under any He and δhm conditions is proposed through linear interpolation, as shown in Figure 12.
The prediction process can be described as follows. First, the referenced depth range [He1, He2] is selected according to the actual excavation depth He, meanwhile the maximum retaining wall deflection δhm induced by excavation is estimated according to He, and the referenced displacement range [δhm1, δhm2] is selected. Second, according to Table 4, the determination parameters of the influenced zone: (M1,1, N1, and N21,1), (M1,2, N1, and N21,2), (M2,1, N1, and N22,1), and (M2,2, N1, and N22,2), corresponding to the conditions: (He1 and δhm1), (He1 and δhm2), (He2 and δhm1), and (He2 and δhm2) are determined, respectively. Then, through the linear interpolation of δhm in the range of [δhm1, δhm2], the determination parameters of the influenced zone: (M1, N1 and N21), (M2, N1 and N22) under the conditions: (He1 and δhm), and (He2, δhm) are determined, respectively. Finally, through the linear interpolation of He in the range of [He1 and He2], the determination parameters of the influenced zone (M, N1, and N2) under the conditions of (He and δhm) is determined. In these steps, the values of He1 and He2 are selected from 18 m, 15 m, 12 m, and 9 m, and the values of δhm1 and δhm2 are selected from 0.18%He, 0.3%He, and 0.7%He.
After the scope of the influenced zone of deep excavation is determined, the existing tunnel displacement induced by adjacent deep excavation can be simply predicted according to the actual influenced zone where it locates.
5. Verification of the Proposed Method
5.1. Verification by Comparing with the Results in Current Research
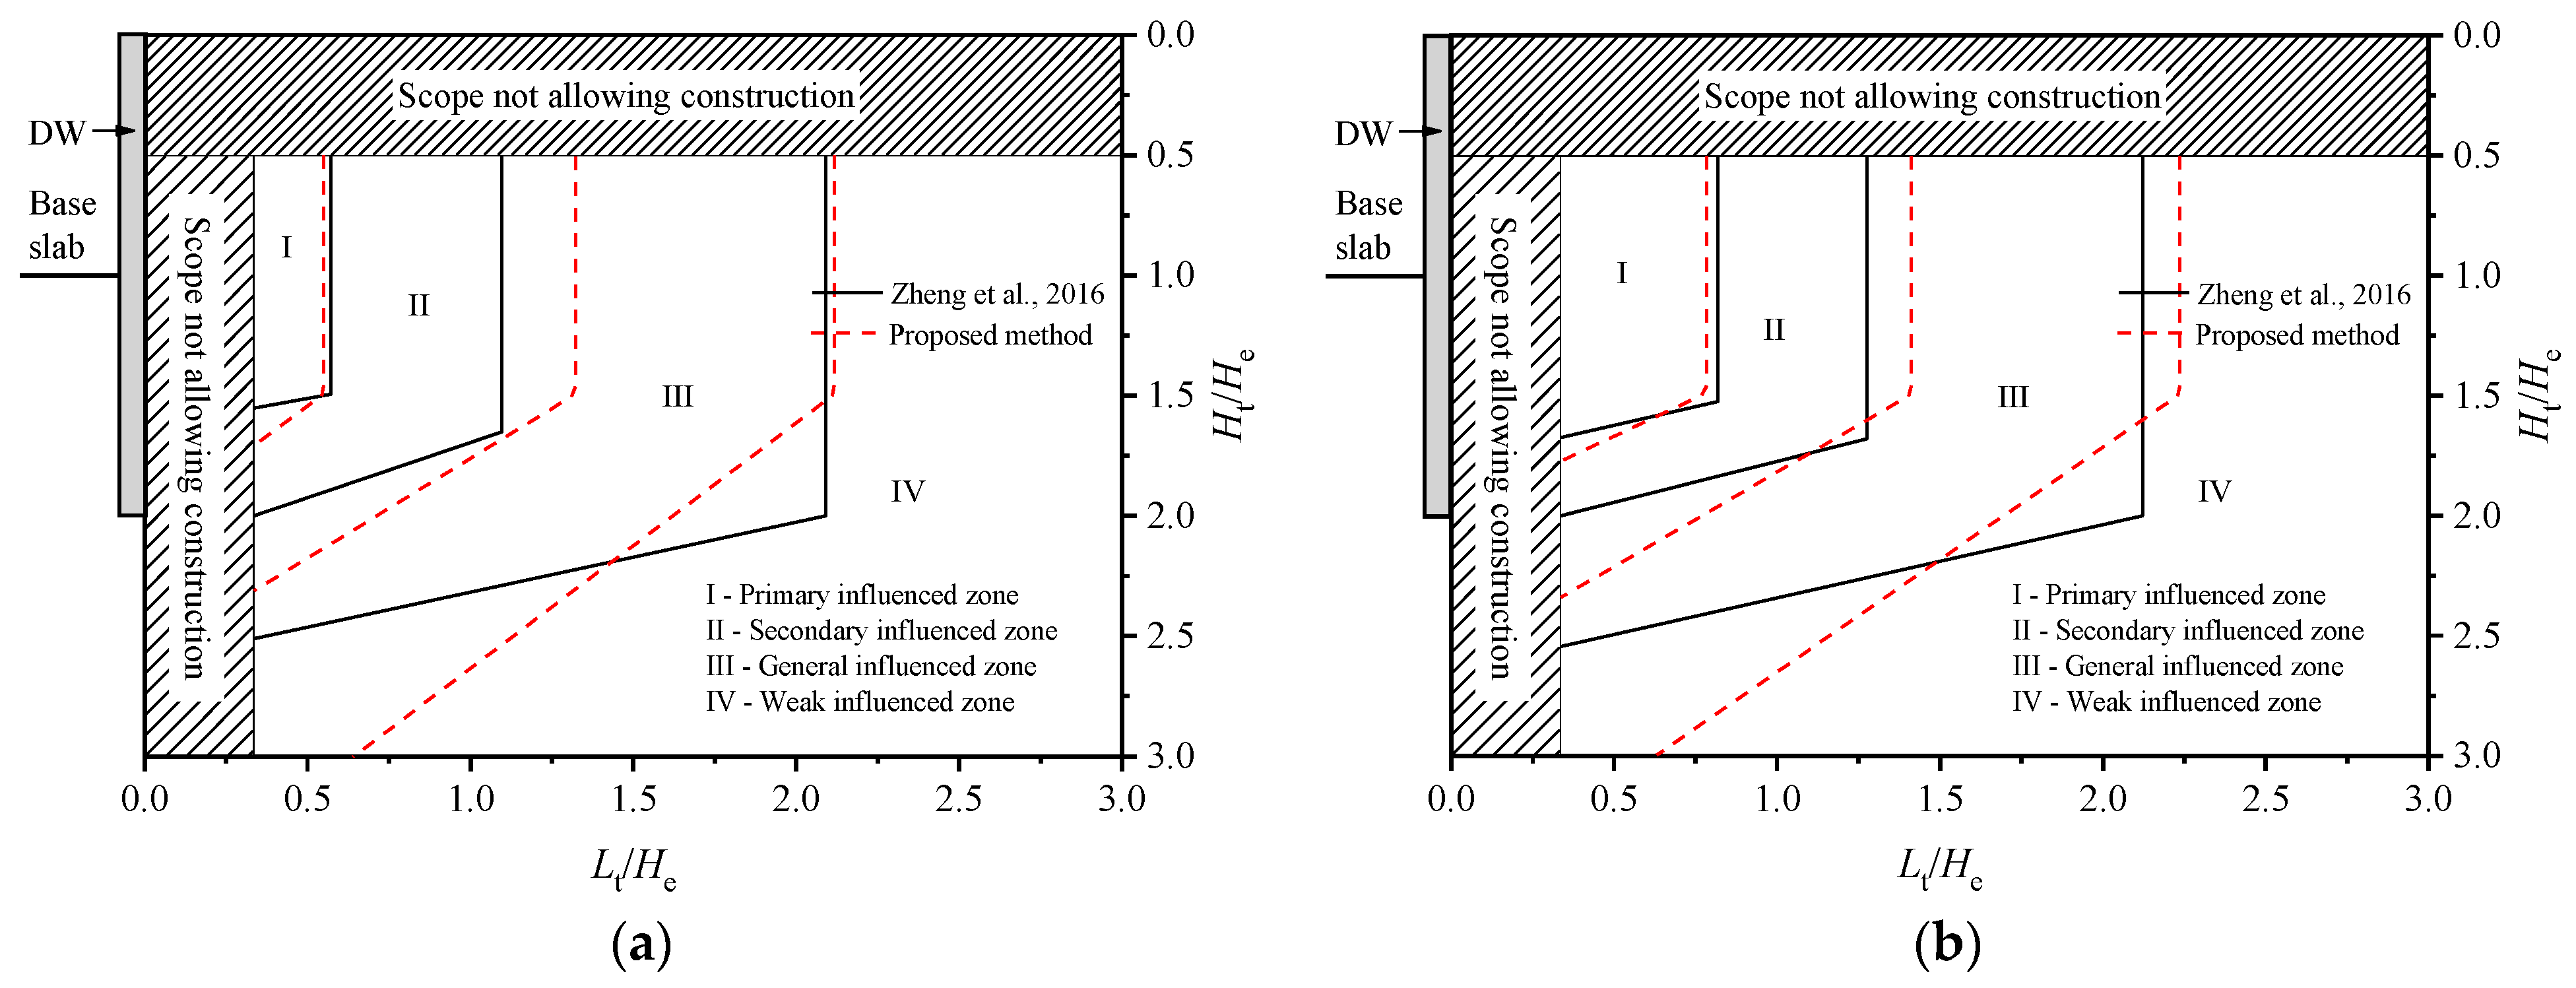
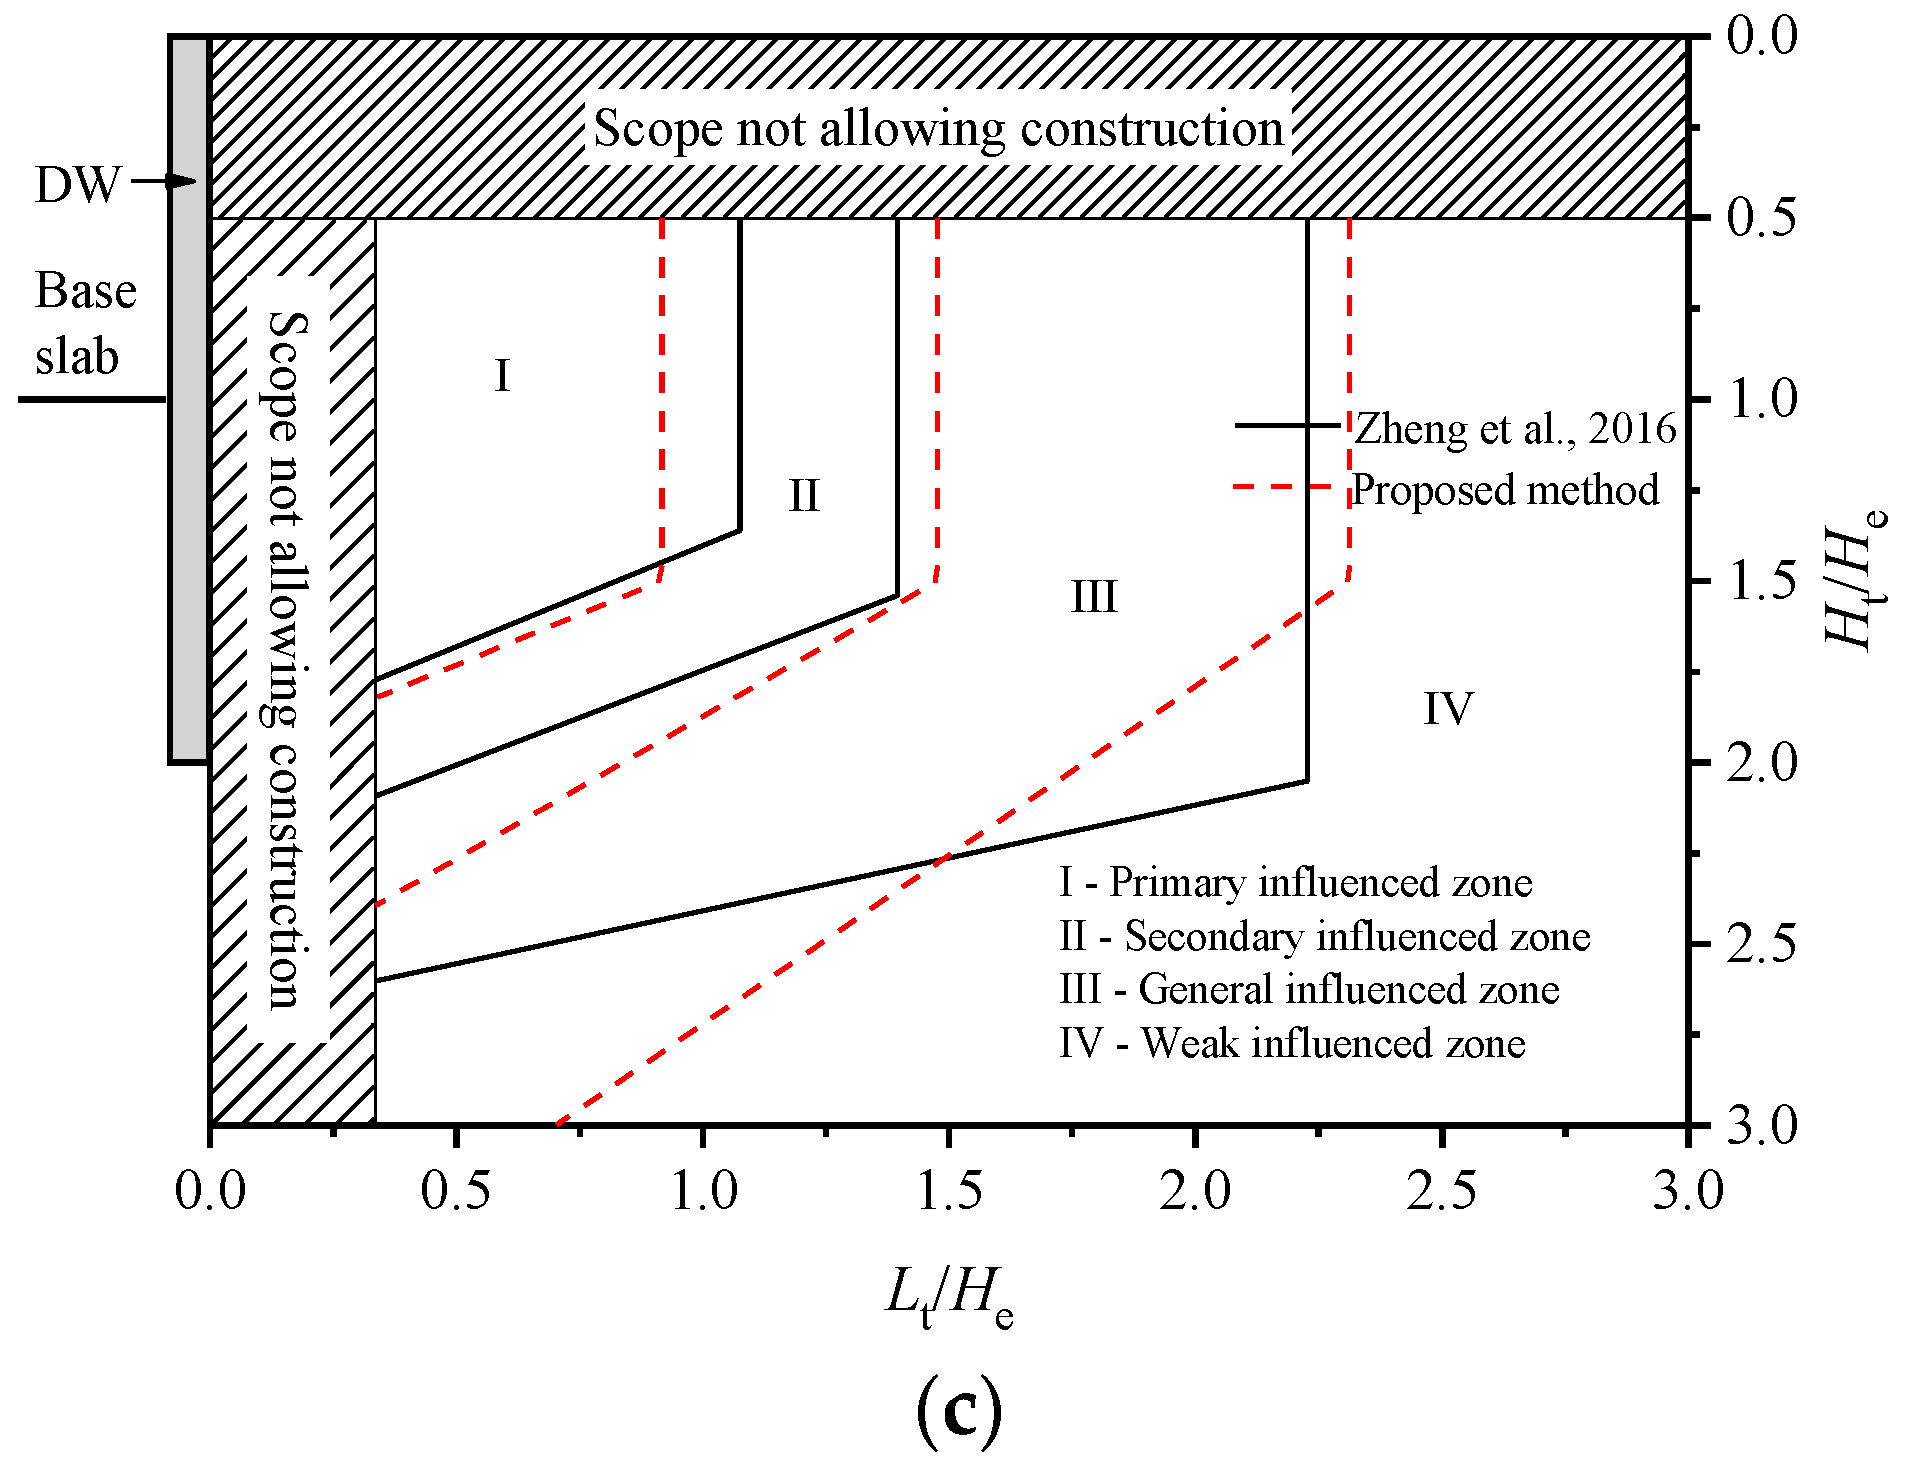
To verify the proposed method for predicting the influenced zone of deep excavation under any He and δhm conditions, the prediction results obtained from this method are compared with those in current research. Zheng et al. [27] gave the determination parameters of the influenced zone of deep excavation under the conditions of He = 18 m, δhm = 30 mm, 45 mm, and 60 mm, as shown in Table 4.
Under the same conditions (He = 18 m, δhm = 30 mm, 45 mm, and 60 mm), the determination parameters of the influenced zones of deep excavation corresponding to 3-level tunnel displacement control standards are also obtained using the proposed method, as listed in Table 5.
Figure 13 shows the division results of the influenced zone according to the determination parameters in Table 5 and Table 6. It is observed that the I (primary influenced zone) obtained by the proposed method agrees well with that obtained by Zheng et al. [27]. The II (secondary influenced zone) and III (general influenced zone) obtained by the proposed method are slightly larger than those obtained by Zheng et al. [27], which means that the influenced zone predicted by the proposed method is relatively safe. Therefore, it is considered that the proposed method for predicting the influenced zone of deep excavation has good reliability.
5.2. Verification by Comparing with the Results in Case Histories
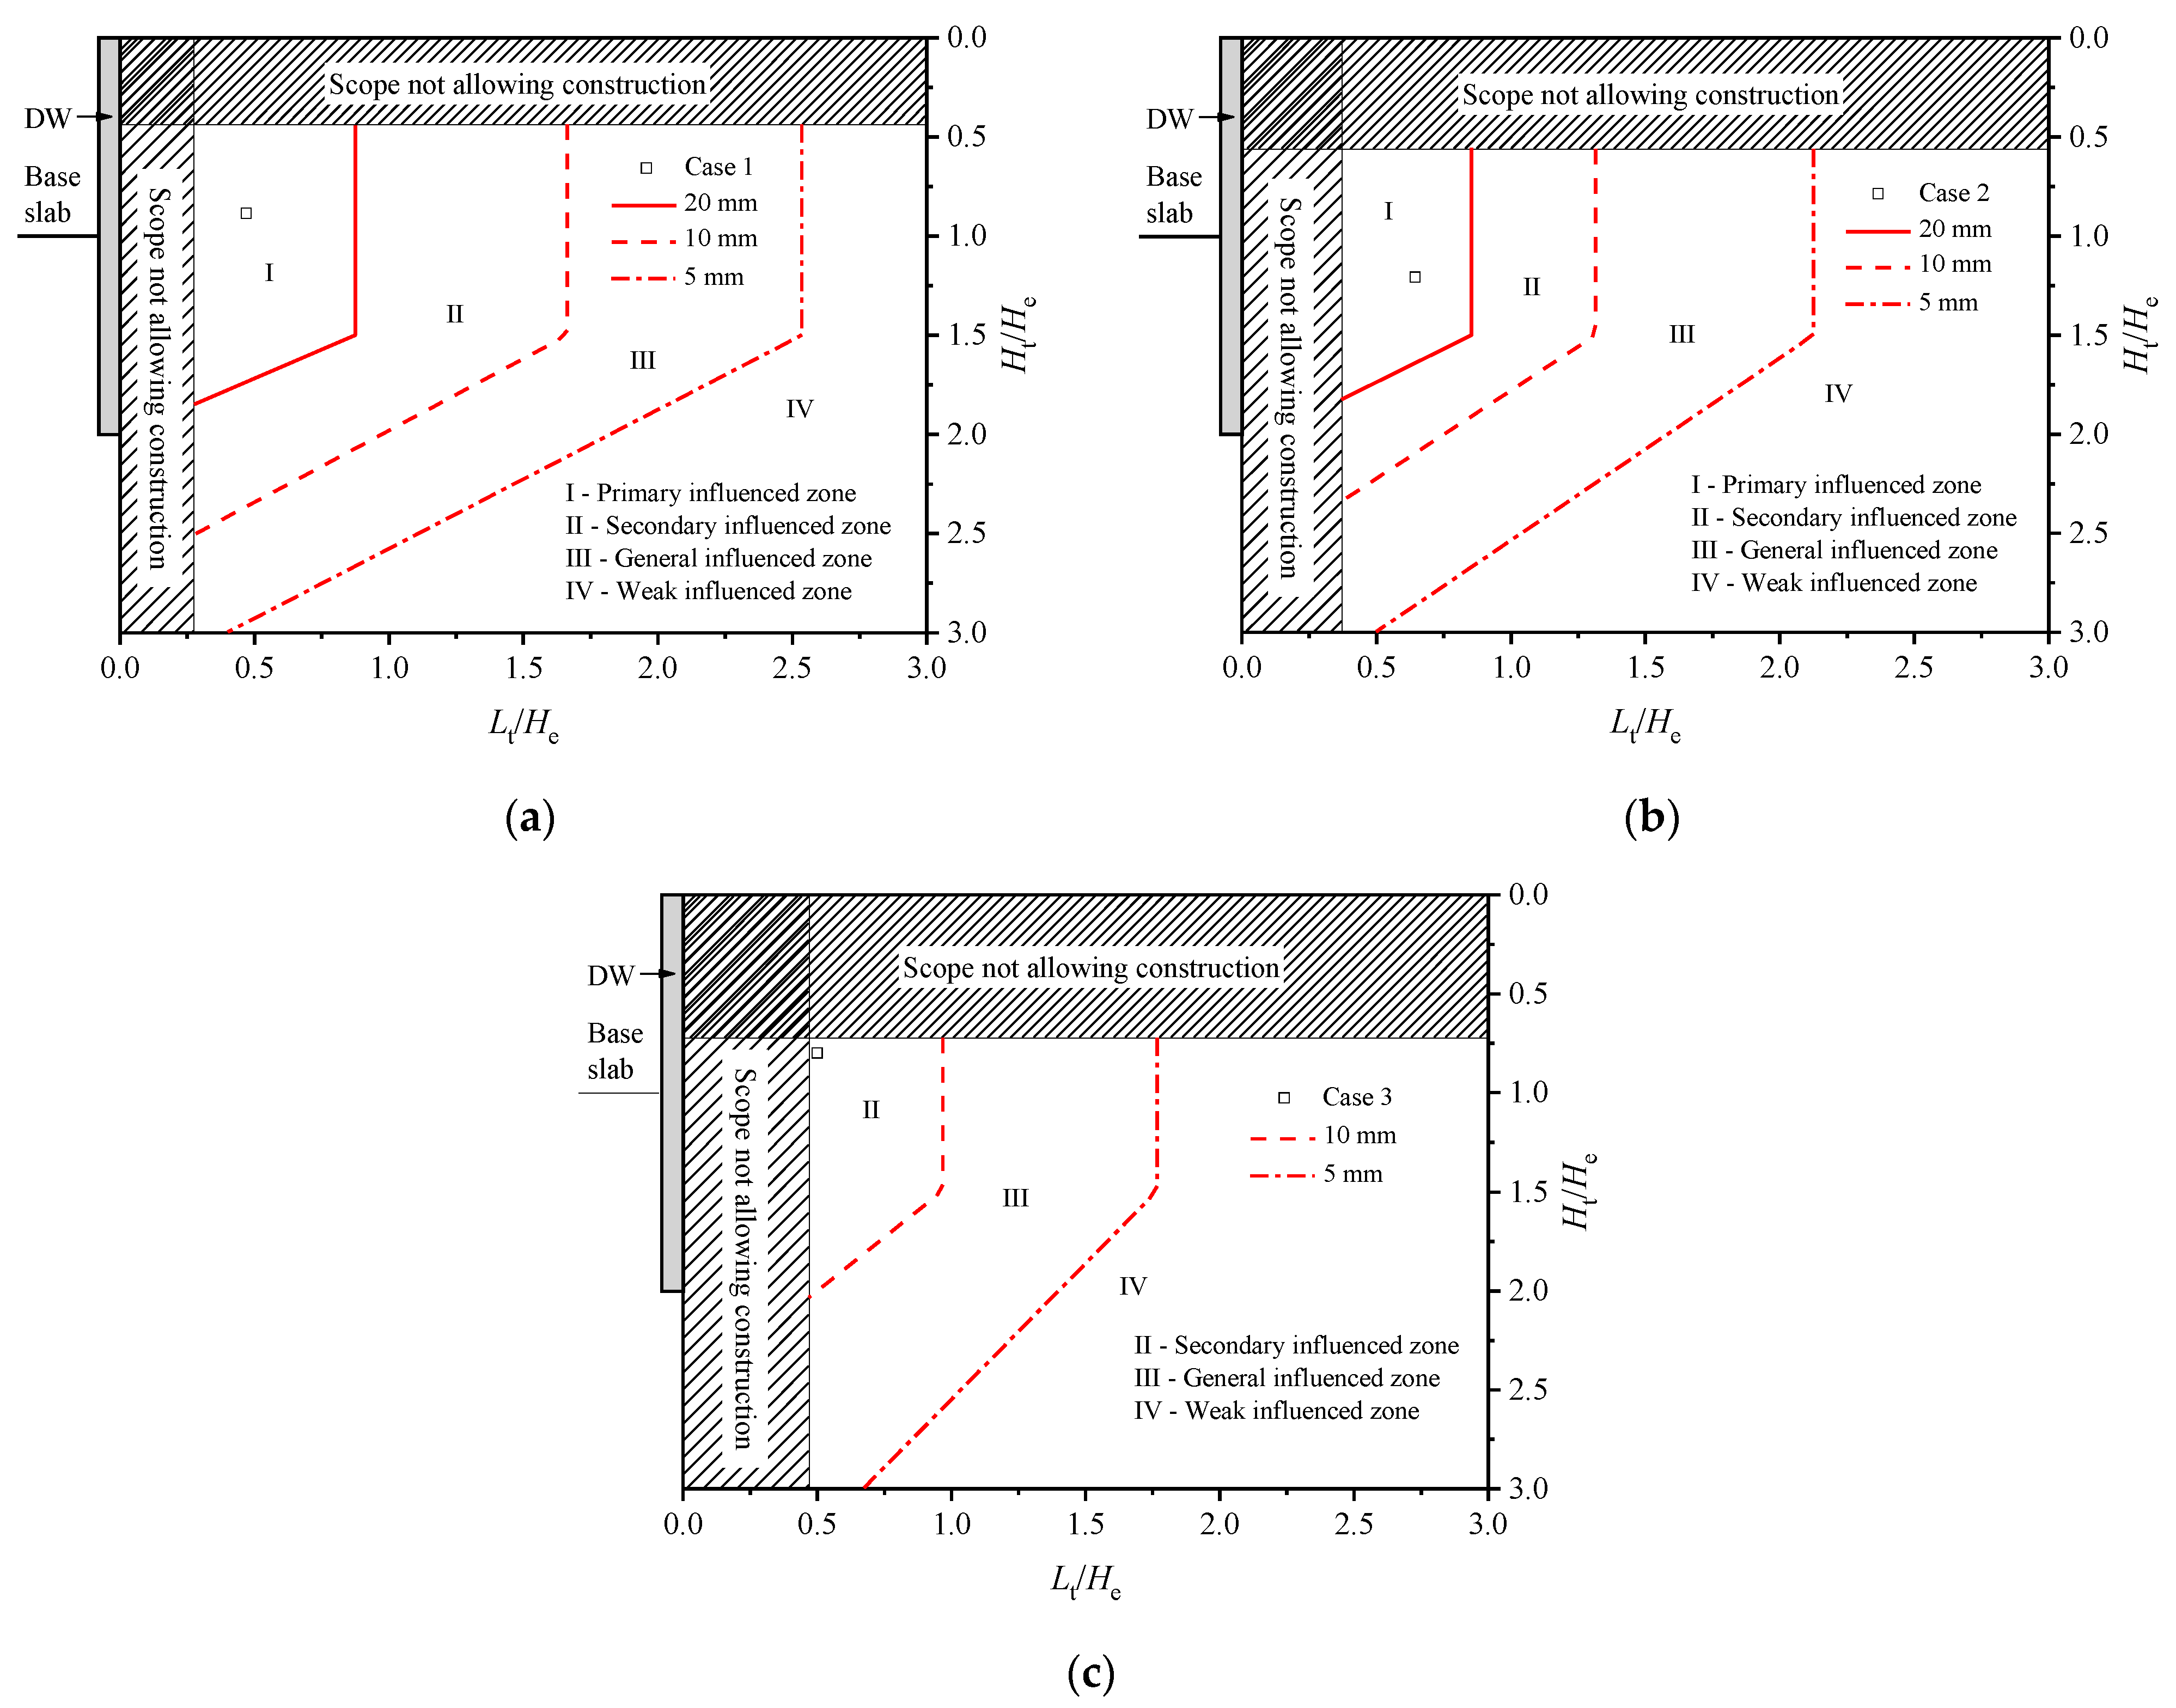
A total of 42 case histories were collected to study the effect of deep excavation on the adjacent tunnel [7]. Due to the limitation of field monitoring data, few case histories contain displacements of both deep excavation and existing tunnels. Therefore, only Cases 1–3 are chosen as representatives to verify the proposed method. In these 3 case histories, the strata are silty clay and muddy clay, which have similar properties to the soil conditions of silty clay adopted in this study. The supporting structures are the diaphragm wall and horizontal struts, which are consistent with the simulation conditions adopted in this study. The form of the existing tunnel is a subway shield tunnel with a diameter of 6.2 m, which is also basically consistent with the simulation conditions in this study. Therefore, it is reasonable to use them for verification.
In Case 1 [41], He = 21.1 m, δhm = 53 mm = 0.25%He, Ht = 17.5 m, and Lt = 10 m. According to the prediction process of the influenced zone in Figure 12, the referenced depth range [15 m, 18 m] and the referenced displacement range [0.18%He, 0.3%He] are chosen for calculation. Figure 14a shows the predicted influenced zone and the actual position of the tunnel in the influenced zone. It can be seen that the tunnel is in the primary influenced zone, i.e., the excavation-induced tunnel displacement may exceed 20 mm. It is reported that no protection measures are taken for the tunnel during the adjacent excavation, and the maximum horizontal displacement and settlement of the tunnel are 27 mm and 33 mm, respectively; after excavation is completed, both have exceeded the displacement control thresholds of 20 mm, which is consistent with the predicted results.
In Case 2 [42], He = 15.9 m, δhm = 54 mm = 0.34%He, Ht = 19.1 m, and Lt = 10.3 m. According to the prediction process of the influenced zone in Figure 12, the referenced depth range [15 m, 18 m] and the referenced displacement range [0.3%He, 0.7%He] are chosen for calculation. Figure 14b shows the predicted influenced zone and the actual position of the tunnel in the influenced zone. It can be seen that the tunnel is in the primary influenced zone, i.e., the excavation-induced tunnel displacement may exceed 20 mm. It is reported that no protection measures were taken for the tunnel during the adjacent excavation, and the maximum horizontal displacement and settlement of the tunnel were 50 mm and 33 mm, respectively, after excavation was completed; both exceeded the displacement control thresholds of 20 mm, which is consistent with the predicted results.
In Case 3 [43], He = 12.5 m, δhm = 14.2 mm = 0.11%He, Ht = 10.5 m, and Lt = 6.1 m. According to the prediction process of the influenced zone in Figure 12, the referenced depth range [12 m and 15 m] and the referenced displacement range [0.18%He and 0.3%He] are chosen for calculation. Figure 14c shows the predicted influenced zone and the actual position of the tunnel in the influenced zone. It can be seen that the tunnel is in the secondary influenced zone, i.e., the excavation-induced tunnel displacement may be 10–20 mm. It is reported that soil improvement and pre-consolidation by dewatering are adopted before the excavation, and zoned excavation is adopted during the excavation. The maximum horizontal displacement and settlement of the tunnel are 9 mm and 5 mm, respectively, after excavation is completed, which are slightly smaller than the predicted results.
From the above analysis, it is concluded that according to the proposed prediction method for the influenced zone and the relative position between the tunnel and deep excavation, the excavation-induced tunnel displacement can be predicted. When necessary, taking measures such as soil improvement, pre-consolidation, and zoned excavation can reduce the effect of deep excavation on the adjacent tunnel and keep the tunnel displacement within a reasonable range.
6. Application and Discussion of the Proposed Method
6.1. Project Introduction
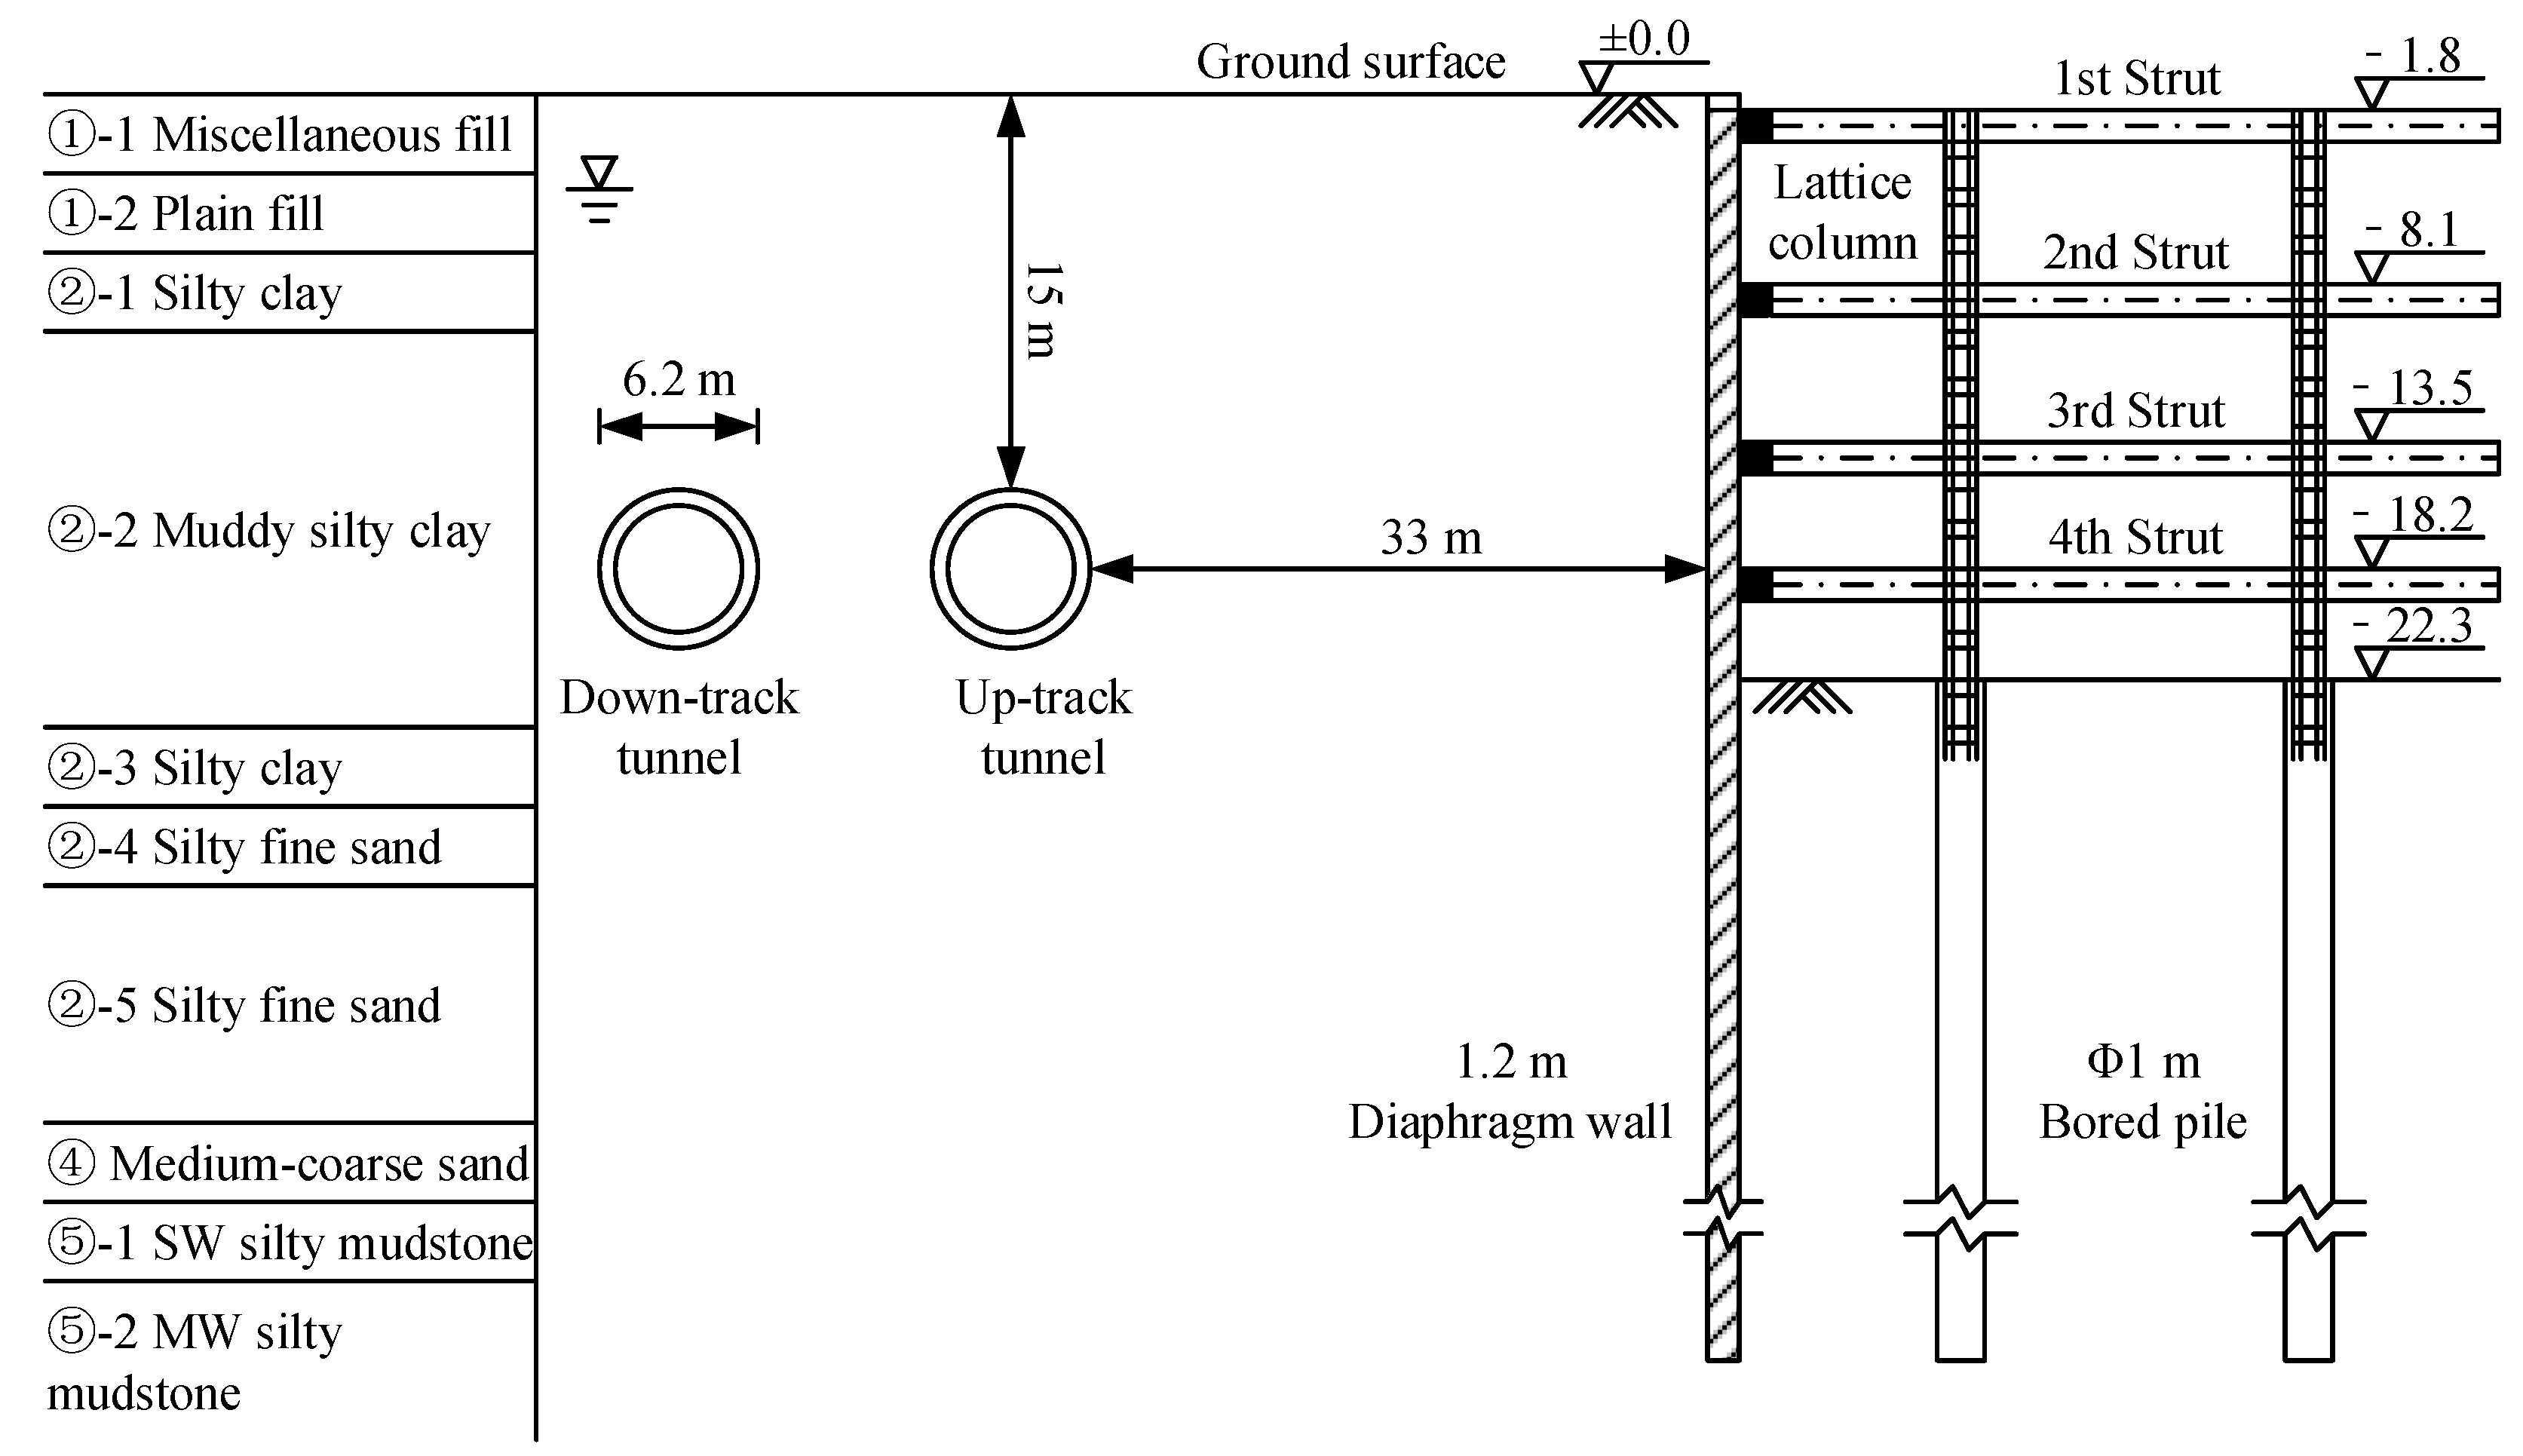
The project is in Nanjing, China, and it is a basement excavation of a commercial center with three super high-rise buildings. The total perimeter of the basement is about 930 m, the average excavation depth in the podium building area is 22.3 m, and the maximum excavation depth in the tower building area is 34 m. The supporting system of the basement consists of a diaphragm wall, horizontal reinforced concrete struts, and vertical steel lattice columns. On one side of the basement, there exist the down-track and up-track tunnels of Nanjing Metro Line 2. The outer diameter of the tunnels is 6.2 m, the average burial depth of the tunnel’s crown is 15 m, and the average horizontal spacing from the up-track tunnel to the basement is 33 m, as shown in Figure 15.
The construction site is located on the floodplain of the Yangtze River. Figure 15 shows the typical geological profile at the site, and the physical and mechanical parameters of each soil layer are listed in Table 6. It is found that the strata within the excavation depth and tunnel burial depth are mainly the ②–1 and ②–3 layers of silty clay and ②–2 layers of muddy, silty clay.
6.2. Prediction of Influenced Zone and Adjacent Tunnel Displacement
In this project, the strata type within the excavation depth and tunnel buried depth, the supporting structure forms of deep excavation, and the structure form and diameter of the tunnel are consistent with those in the numerical simulations. Therefore, the proposed method obtained from the numerical simulation can be used to predict the influenced zone of deep excavation and the adjacent tunnel displacement.
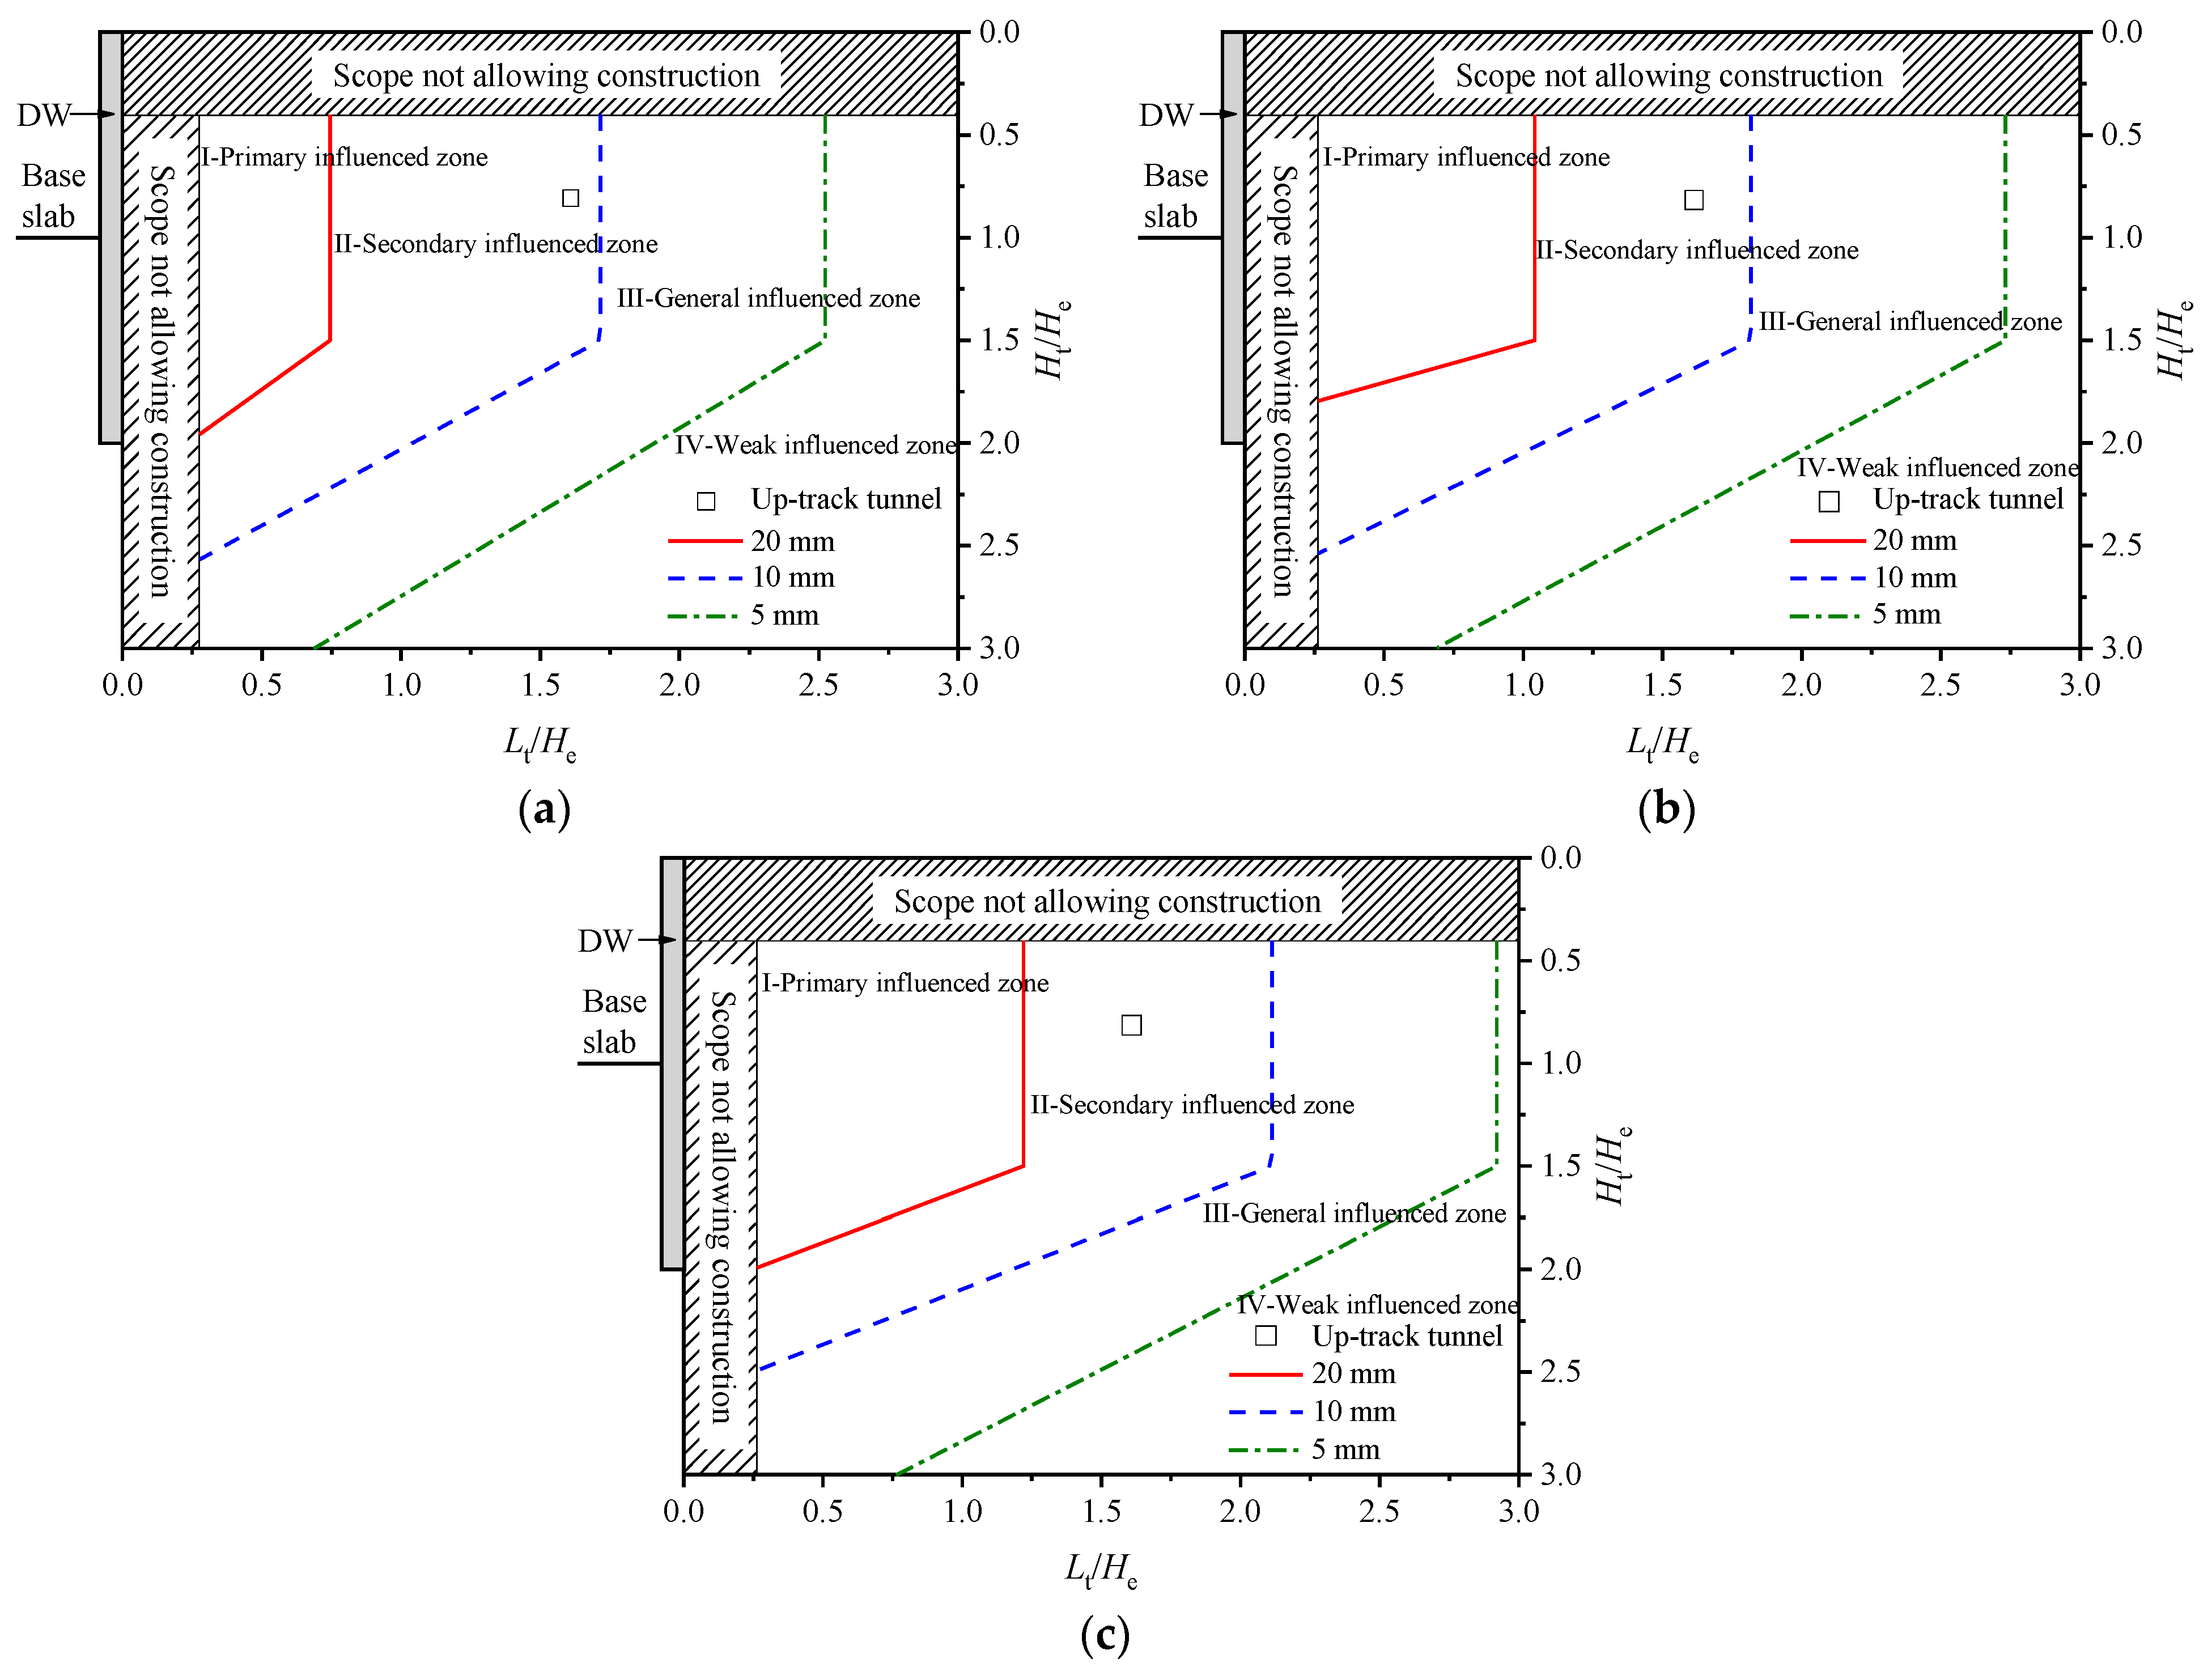
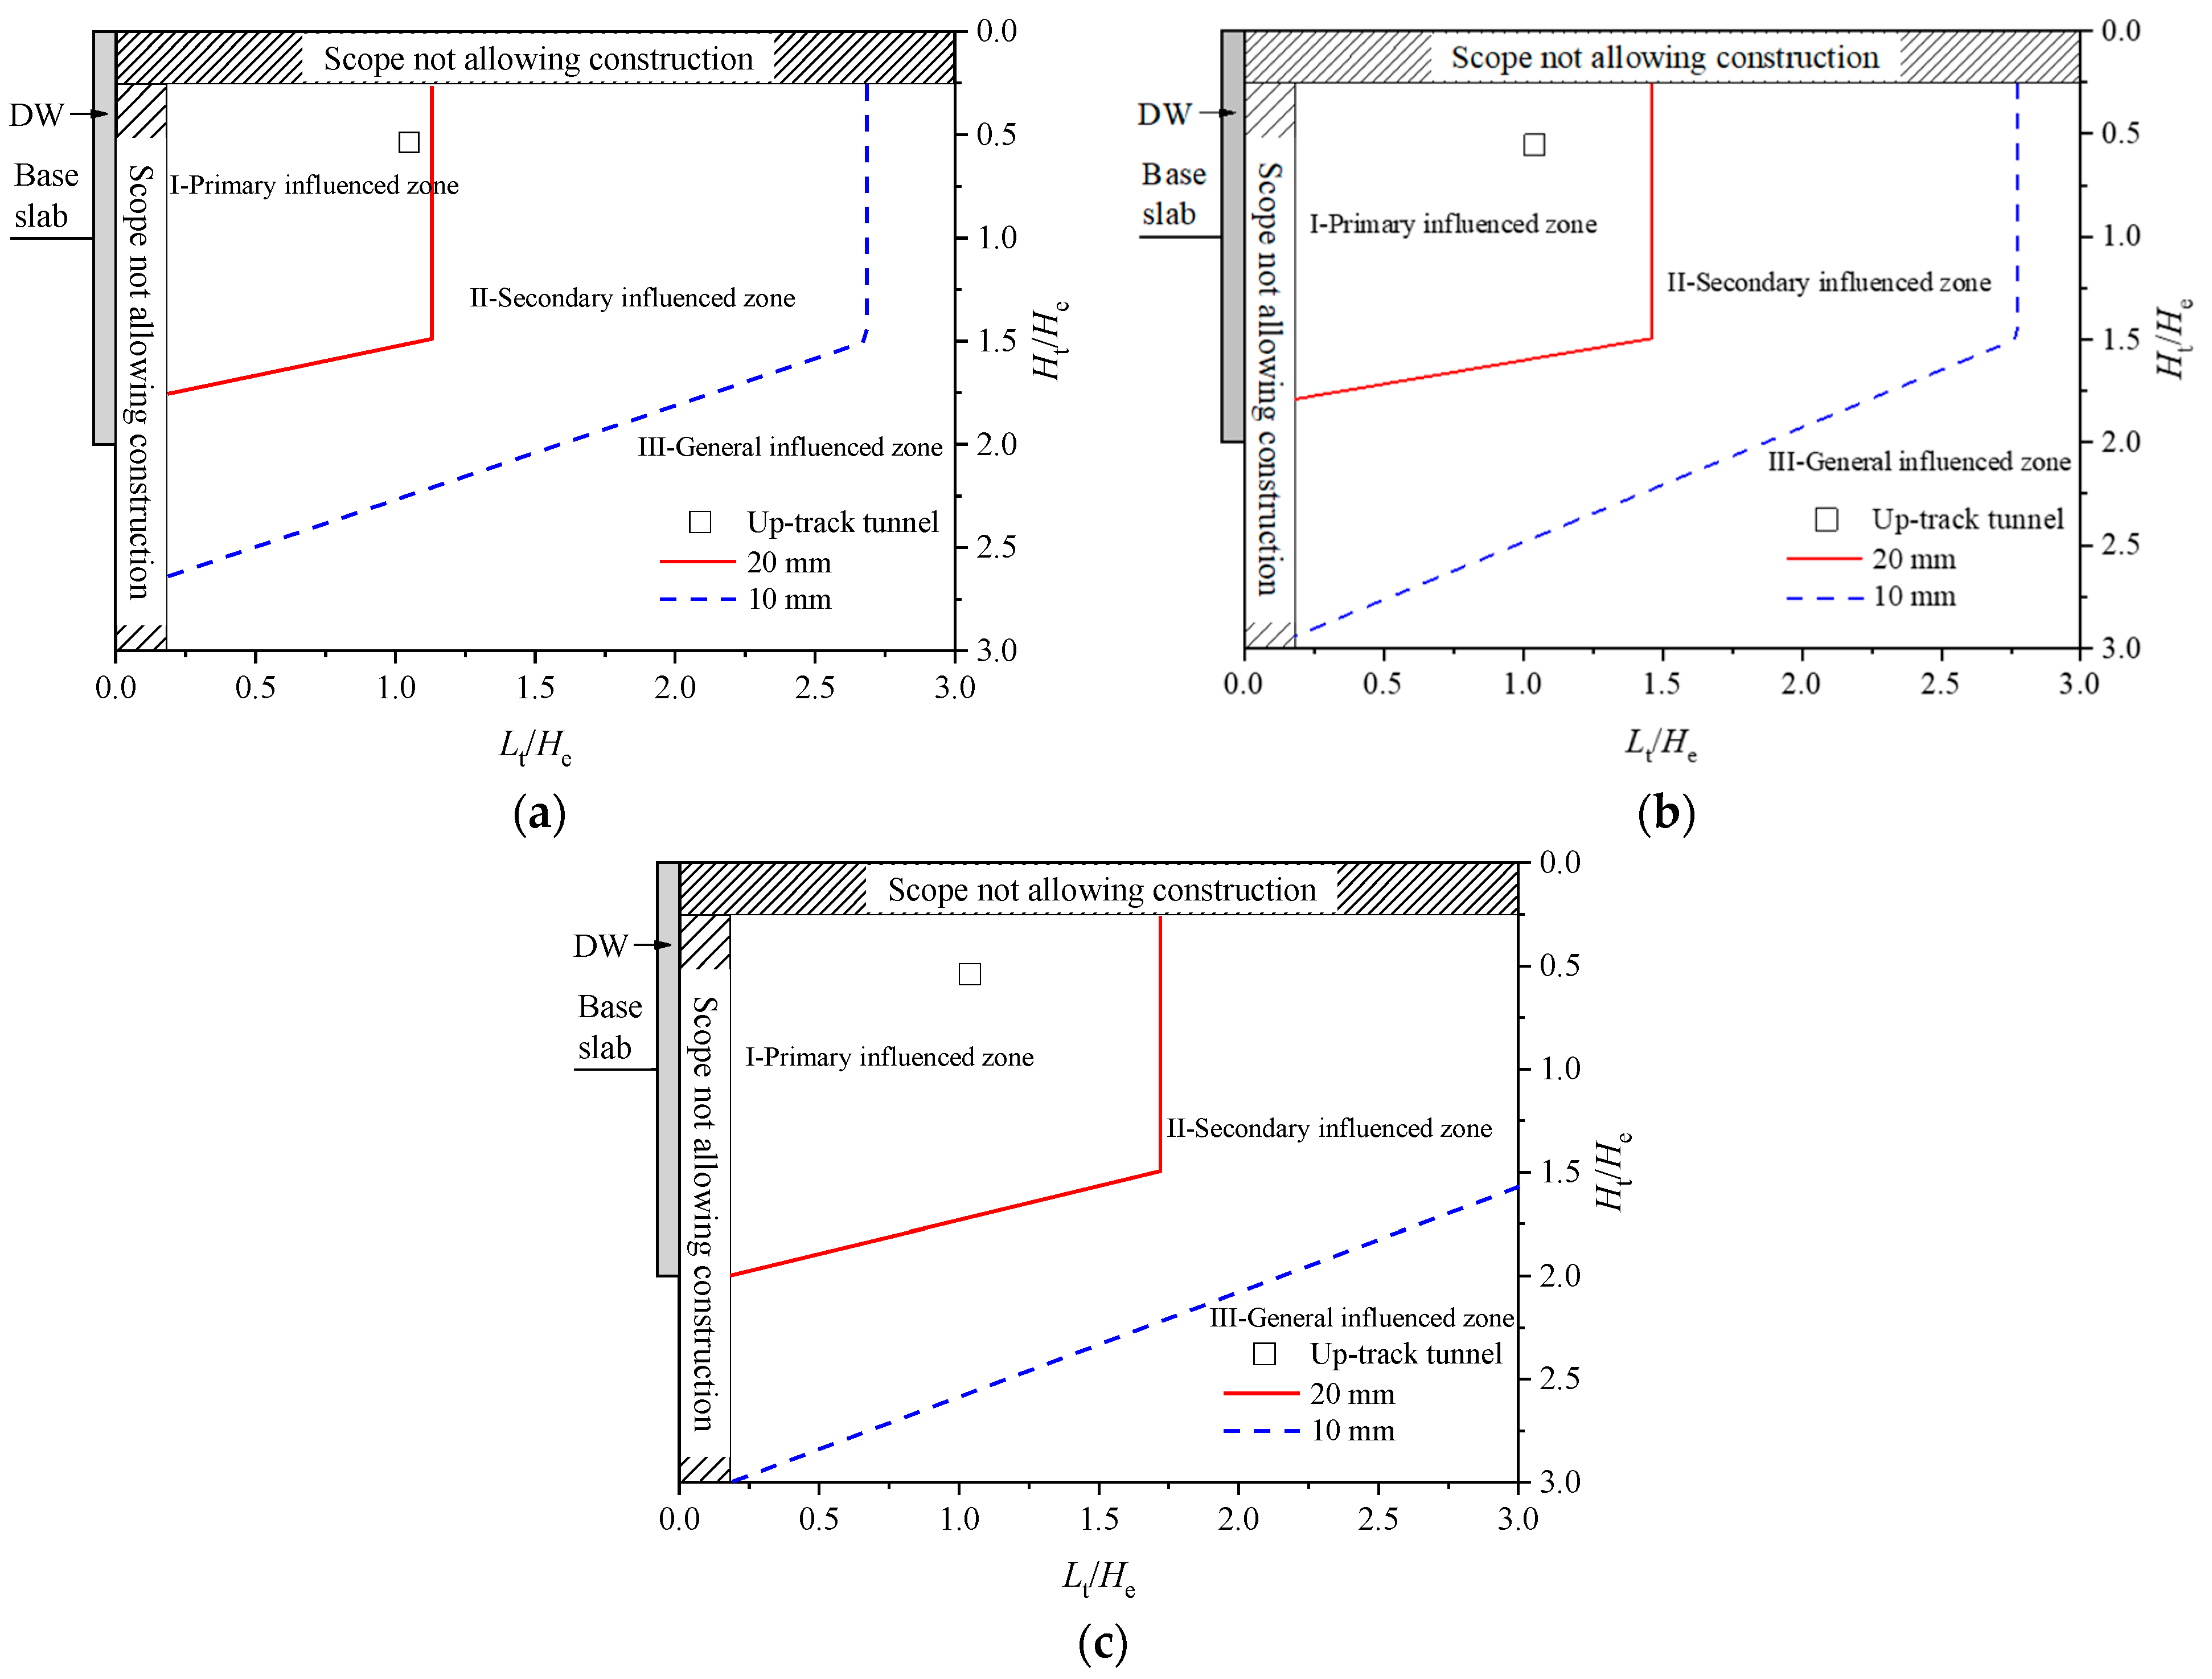
In this project, the average excavation depth in the podium building area is He = 22.3 m, and the vertical and horizontal positions of the up-track tunnel normalized by the excavation depth (He) are Ht/He = (15 + 6.2/2)/22.3 = 0.81 and Lt/He = (33 + 6.2/2)/22.3 = 1.62. To predict the influenced zone of deep excavation on adjacent tunnel displacement, it is assumed that the maximum retaining wall deflection is δhm = 0.18%He, 0.3%He, and 0.7%He, respectively. Then, according to the flow chart for predicting the influenced zone shown in Figure 12, the influenced zones of deep excavation were obtained, and the actual position of the tunnel was placed in the influenced zone, as shown in Figure 16.
It is observed that, under three conditions of δhm, the range outside the deep excavation can be divided into: I (primary influenced zone), II (secondary influenced zone), III (general influenced zone), and IV (weak influenced zone). With the increase of δhm, the scope of the influenced zone gradually expands, especially the scope of the primary influenced zone. The up-track tunnel is located in the secondary influenced zone, i.e., the displacement induced by deep excavation may be 10–20 mm.
Similarly, the average excavation depth in the tower building area is He = 34 m, the vertical and horizontal positions of the up-track tunnel normalized by the excavation depth are Ht/He = (15 + 6.2/2)/34 = 0.53 and Lt/He = (33 + 6.2/2)/34 = 1.06, respectively. According to the displacement control level of the retaining wall, it is assumed that the maximum retaining wall deflection is δhm = 0.18%He, 0.3%He, and 0.7%He, respectively. Then, according to the flow chart for predicting the influenced zone shown in Figure 12, the influenced zones of deep excavation were obtained, and the actual position of the tunnel was placed in the influenced zone, as shown in Figure 17.
It is observed that the scope of the influenced zone is further expanded compared with that in Figure 16. The range of 3He outside the pit can be divided into: I (primary influenced zone), II (secondary influenced zone), and III (general influenced zone). The tunnel position transferred from the secondary influenced zone to the primary influenced zone, i.e., the excavation-induced tunnel displacement may exceed 20 mm, and with the increase of δhm, the displacement gradually increases.
6.3. Evaluation and Control of Tunnel Displacement
The technical code CJJ/T 202–2013 [39] gives the early warning value of 10 mm and the control value of 20 mm for the horizontal and vertical displacements of the tunnel, respectively. The technical code GB 50911–2013 [40] gives the control range of 3–10 mm for the settlement of the tunnel and 3–5 mm for the heave and horizontal displacement of the tunnel. The above prediction results show that, excluding the existing tunnel displacement before construction, the excavation-induced tunnel displacement exceeds 10 mm in the podium building area and exceeds 20 mm in the tower building area, which has exceeded the thresholds in technical codes. To protect the tunnel from damage during basement excavation, some measures such as ground improvement, zoned excavation, and micro-disturbance grouting were taken, and field monitoring was adopted to monitor the tunnel and retaining wall displacement. Liu et al. [44] give more details about the construction and monitoring schemes.
The monitoring shows the maximum retaining wall deflection in the tower building area is 59.33 mm, which is about 0.17%He, and the maximum retaining wall deflection in the podium building area is 45.18 mm, which is about 0.20%He. The monitoring results of the retaining wall are close to the above assumption that the retaining wall deflection is δhm = 0.18%He. Therefore, the field monitoring results of tunnel displacement were used to verify the predicted results under the condition of δhm = 0.18%He.
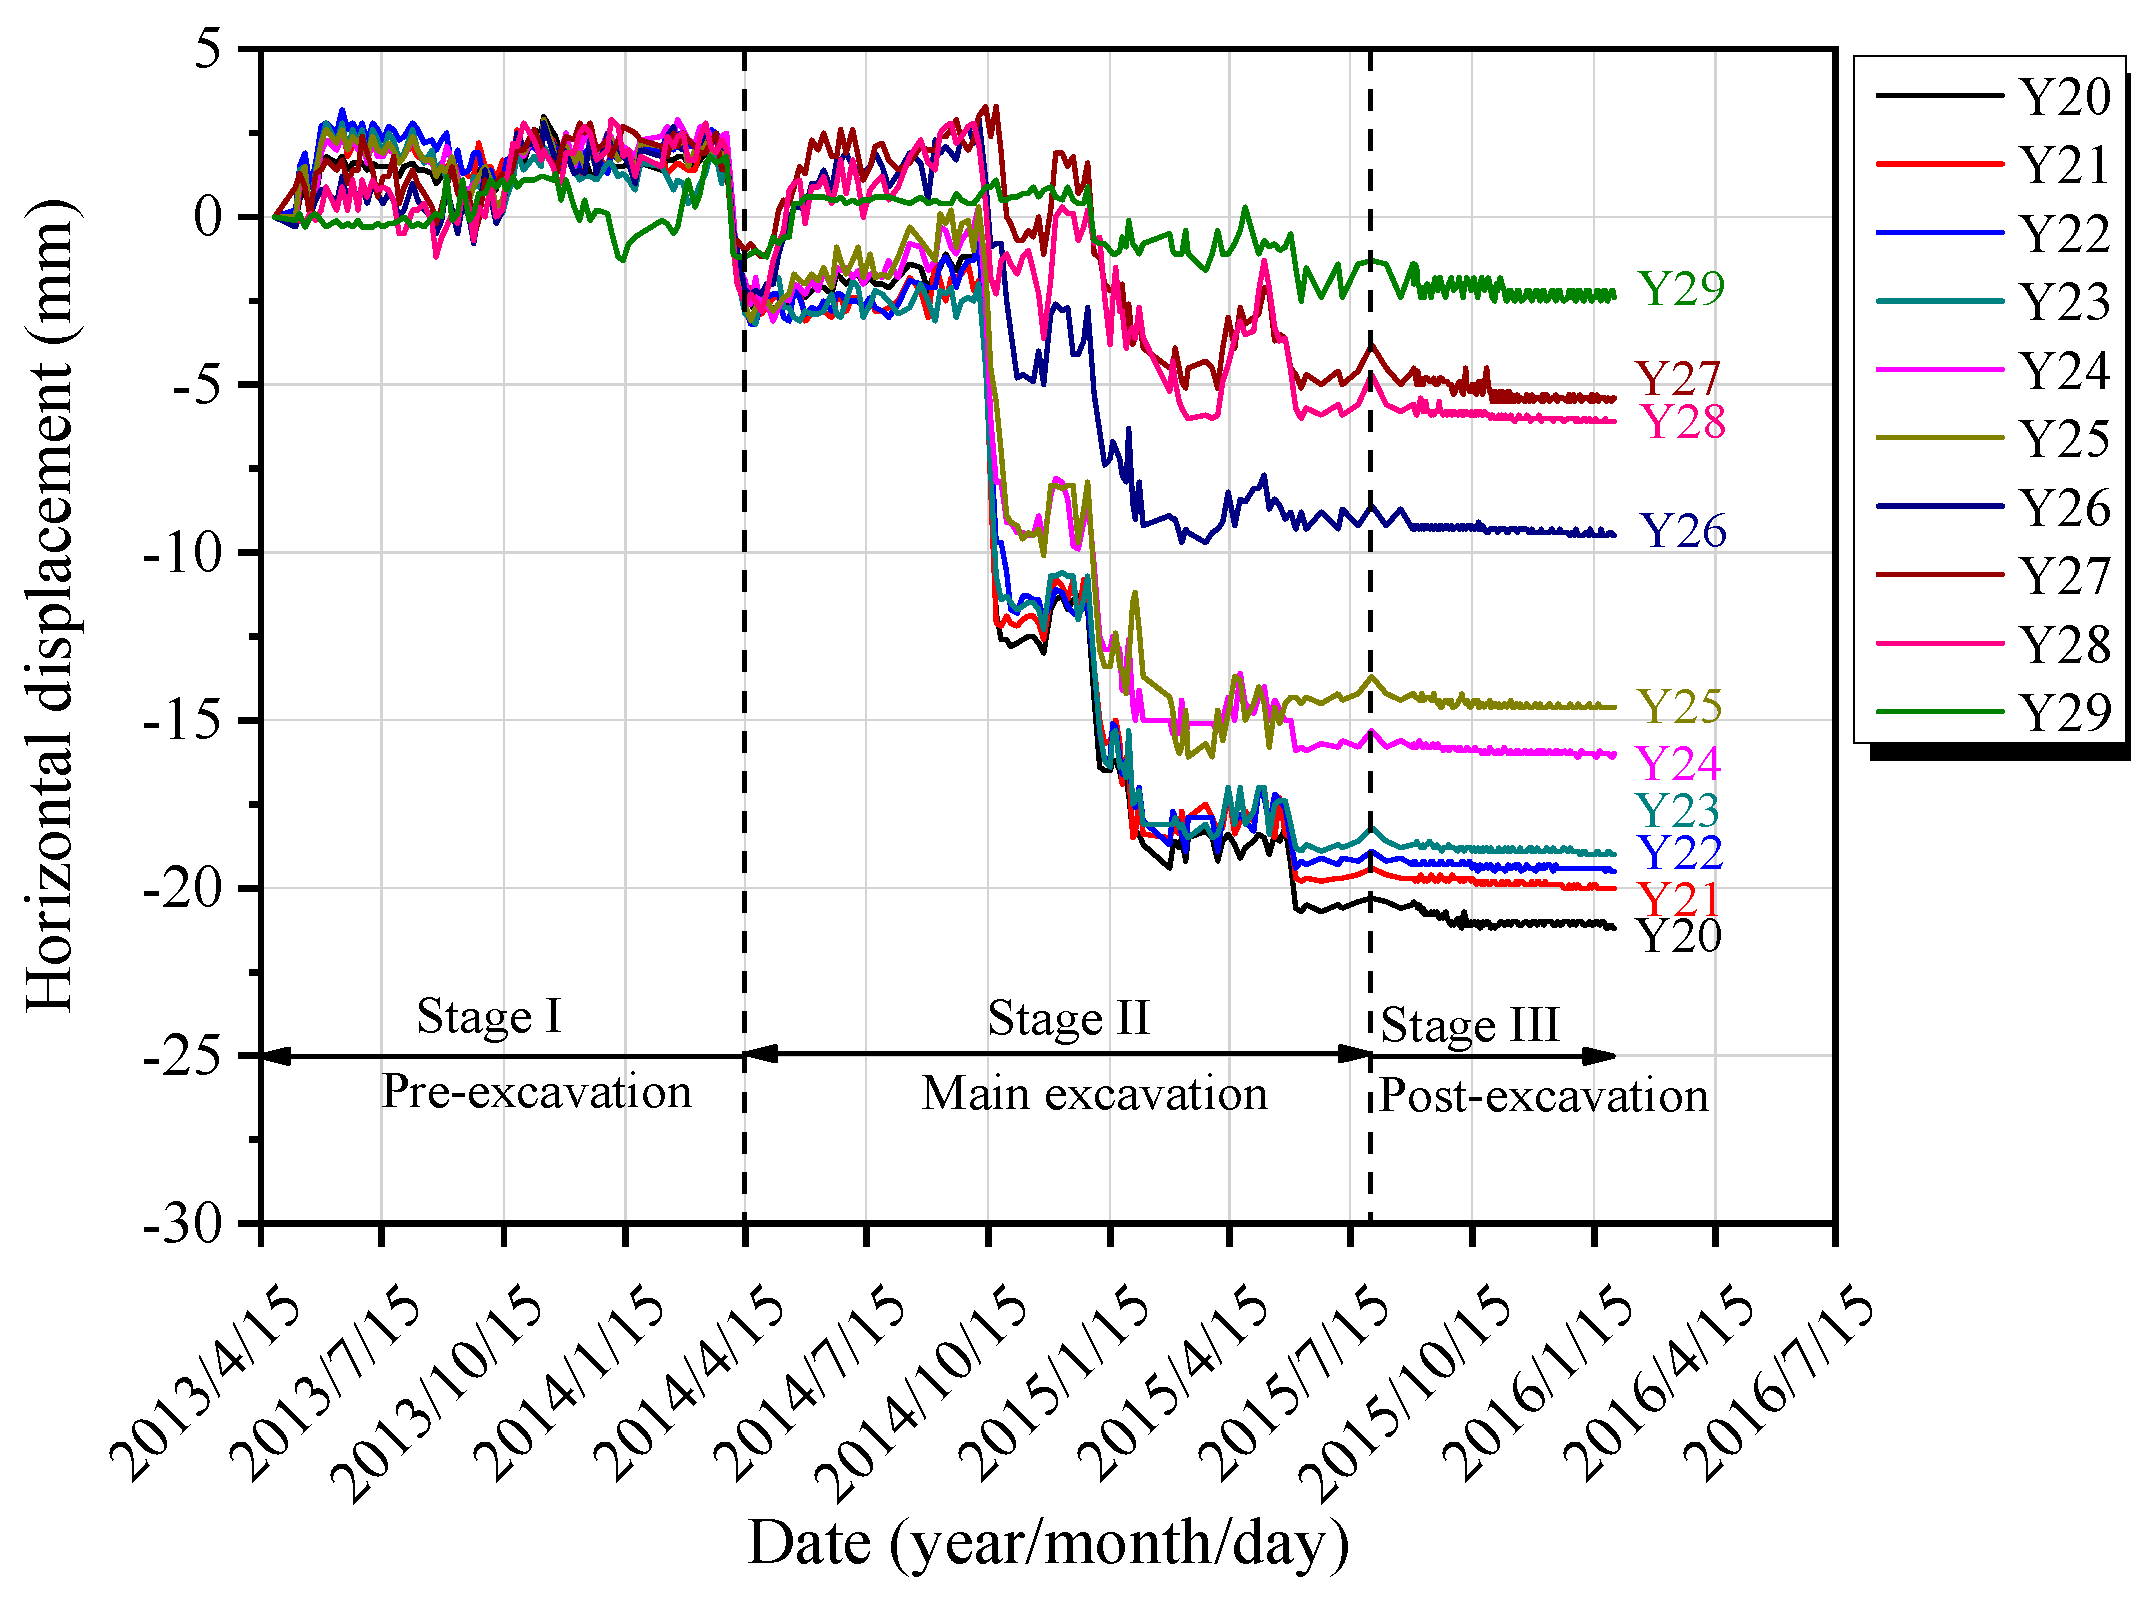
Figure 18 shows the horizontal displacement evolution curves of the up-track tunnel. Y20–Y29 are the monitoring sections along the longitudinal direction of the tunnel. If the tunnel is regarded as an initial state with no additional displacement before basement excavation, the maximum horizontal displacement of the tunnel induced by basement excavation is about 18 mm, which appears in the monitoring section Y20 corresponding to the tower building area.
Comparing the predicted and monitored results, it is observed that the monitored horizontal displacement of the up-track tunnel is slightly smaller than the predicted results, which indicates that the adopted control measures effectively reduced the scope of the influenced zone and the adjacent tunnel displacement.
6.4. Discussion of the Proposed Method
In this work, a simplified prediction method for the influenced zone of deep excavation and the adjacent tunnel displacement is proposed. Compared with the methods in the other literature, it expands their application scenarios. However, this study is based on the assumptions of thick, soft soil ignoring stratification, deep excavation supported by a diaphragm wall with an insertion ratio of 1.0, and a shield tunnel with a diameter of 6 m, etc. The reliability of the obtained conclusions under the other conditions needs to be further verified. In the future, more attention can be paid to the different geological conditions, supporting structure forms of deep excavation, and relative positions between deep excavation and tunnel.
7. Conclusions
Based on the statistics of 44 case histories, 732 FEM numerical simulations are conducted to determine the influenced zone of deep excavation under different conditions of excavation depth (He) and the maximum retaining wall deflection (δhm). On this basis, the effects of He and δhm on the scope of the influenced zone are studied, and a prediction method for the scope of the influenced zone under any He and δhm conditions is proposed. Then, the reliability of the proposed method is verified by comparing it with the current research and case histories. Finally, the proposed method is applied to an actual project, and the application effect is evaluated. The conclusions are as follows:
- The range outside the pit can be divided into: I (primary influenced zone), II (secondary influenced zone), III (general influenced zone), and IV (weak influenced zone), corresponding to the three-level tunnel displacement control standards of 20 mm, 10 mm, and 5 mm;
- The influenced zone can be simplified as a right-angled trapezoid shape, and the isoline of tunnel displacement can be simplified as a polyline. By defining the coordinates of three points on the polyline: width coefficient M, depth coefficients N1 and N2, the scope of the influenced zone can be quickly determined;
- M and N2 basically have a linear relationship with the He and δhm, but N1 is less affected by He and δhm, and it can be taken as a constant of 1.5. Based on these relationships and the division results of the influenced zone under different simulation conditions, the scope of the influenced zone under any He and δhm conditions can be determined by linear interpolation;
- In practice, using the proposed method to predict the influenced zone of deep excavation and the excavation-induced tunnel displacement and then taking some control measures, the effect of deep excavation on the adjacent tunnel can be reduced, and the tunnel displacement can be kept within a reasonable range.
Author Contributions
Conceptualization, B.L.; methodology, B.L.; software, B.L.; validation, B.L.; formal analysis, B.L.; investigation, B.L.; resources, C.S. and N.W.; data curation, D.Z.; writing—original draft preparation, B.L.; writing—review and editing, D.Z.; visualization, B.L.; supervision, D.Z.; project administration, C.S. and N.W.; funding acquisition, C.S. and N.W. All authors have read and agreed to the published version of the manuscript.
Funding
This work was supported by the National Natural Science Foundation of China (52208334), the Natural Science Foundation of Jiangsu Province (BK20220856), the China Postdoctoral Science Foundation (2021M690624), the Jiangsu Planned Projects for Postdoctoral Research Funds (2021K146B), and the Research Fund of Key Laboratory of Water Management and Water Security for Yellow River Basin, Ministry of Water Resources (2022-SYSJJ-07).
Institutional Review Board Statement
Not applicable.
Informed Consent Statement
Not applicable.
Data Availability Statement
The data presented in this study are available from the corresponding author upon request.
Acknowledgments
The authors thank all reviewers for their great help in this article.
Conflicts of Interest
The authors declare no conflict of interest.
References
- Chen, X.S. Research on combined construction technology for cross-subway tunnels in underground spaces. Engineering 2018, 4, 103–111. [Google Scholar] [CrossRef]
- Liu, B.; Fan, X.H.; Wang, Y.Y.; Zhang, J.B.; Fan, Z.B. Influences of excavation on adjacent existing metro tunnels: A review. Chin. J. Geo. Eng. 2021, 43, 253–258. [Google Scholar] [CrossRef]
- Meng, F.Y.; Chen, R.P.; Xu, Y.; Wu, K.; Wu, H.N.; Liu, Y. Contributions to responses of existing tunnel subjected to nearby excavation: A review. Tunn. Undergr. Space Technol. 2022, 119, 104195. [Google Scholar] [CrossRef]
- Vinoth, M.; MS, A. Behaviour of existing tunnel due to adjacent deep excavation—A review. Int. J. Geo. Eng. 2021, 16, 1132–1151. [Google Scholar] [CrossRef]
- Wei, G.; Zhao, C.L.; Cai, L.L. Mechanism of foundation pit excavation impact on existing nearby shield tunnel. Munic. Eng. Technol. 2013, 31, 141–146. [Google Scholar] [CrossRef]
- Wei, G.; Li, J.; Xuan, H.L.; Dong, L.Z.; Xu, Y.Y.; Zhang, S.M. Monitoring data analysis on the influence of large deep foundation pit excavation on nearby metro shield tunnel. J. Railw. Sci. Eng. 2018, 15, 718–726. [Google Scholar] [CrossRef]
- Liu, B.; Zhang, D.W.; Li, J.C. Prediction formula and its application of existing tunnel deformation induced by laterally adjacent deep excavation based on case statistics. Rock Soil Mech. 2022, 43, 501–512. [Google Scholar] [CrossRef]
- Zhang, Z.G.; Zhang, M.X.; Wang, W.D. Two-stage method for analyzing effects on adjacent metro tunnels due to foundation pit excavation. Rock Soil Mech. 2011, 32, 2085–2092. [Google Scholar] [CrossRef]
- Zhang, Z.G.; Huang, M.S.; Wang, W.D. Evaluation of deformation response for adjacent tunnels due to soil unloading in excavation engineering. Tunn. Undergr. Space Technol. 2013, 38, 244–253. [Google Scholar] [CrossRef]
- Mindlin, R.D. Force at a point in the interior of a semi-infinite solid. Physics 1936, 7, 195–202. [Google Scholar] [CrossRef]
- Liang, R.Z.; Xia, T.D.; Huang, M.S.; Lin, C.G. Simplified analytical method for evaluating the effects of adjacent excavation on shield tunnel considering the shearing effect. Comput. Geotech. 2017, 81, 167–187. [Google Scholar] [CrossRef]
- Liang, R.Z.; Wu, W.B.; Yu, F.; Jiang, G.S.; Liu, J.W. Simplified method for evaluating shield tunnel deformation due to adjacent excavation. Tunn. Undergr. Space Technol. 2018, 71, 94–105. [Google Scholar] [CrossRef]
- Zhou, Z.L.; Chen, S.G.; Tu, P.; Zhang, H.S. An analytic study on the deflection of subway tunnel due to adjacent excavation of foundation pit. J. Mod. Transp. 2015, 23, 287–297. [Google Scholar] [CrossRef] [Green Version]
- Huang, X.; Schweiger, H.F.; Huang, H.W. Influence of deep excavations on nearby existing tunnels. Int. J. Geomech. 2013, 13, 170–180. [Google Scholar] [CrossRef]
- Tan, Y.; Li, X.; Kang, Z.J.; Liu, J.X.; Zhu, Y.B. Zoned excavation of an oversized pit close to an existing metro line in stiff clay: Case study. J. Perform. Constr. Fac. 2015, 29, 04014158. [Google Scholar] [CrossRef]
- Chen, R.P.; Meng, F.Y.; Li, Z.C.; Ye, Y.H.; Ye, J.N. Investigation of response of metro tunnels due to adjacent large excavation and protective measures in soft soils. Tunn. Undergr. Space Technol. 2016, 58, 224–235. [Google Scholar] [CrossRef] [Green Version]
- Shi, C.H.; Cao, C.Y.; Lei, M.F.; Ai, H.J. Effects of lateral unloading on the mechanical and deformation performance of shield tunnel segment joints. Tunn. Undergr. Space Technol. 2016, 51, 175–188. [Google Scholar] [CrossRef]
- Li, M.G.; Chen, J.J.; Wang, J.H.; Zhu, Y.F. Comparative study of construction methods for deep excavations above shield tunnels. Tunn. Undergr. Space Technol. 2018, 71, 329–339. [Google Scholar] [CrossRef]
- Li, M.G.; Xiao, X.; Wang, J.H.; Chen, J.J. Numerical study on responses of an existing metro line to staged deep excavations. Tunn. Undergr. Space Technol. 2019, 85, 268–281. [Google Scholar] [CrossRef]
- Zheng, G.; Wang, F.J.; Du, Y.M.; Diao, Y.; Lei, Y.W.; Cheng, X.S. The efficiency of the ability of isolation piles to control the deformation of tunnels adjacent to excavations. Int. J. Civ. Eng. 2018, 16, 1475–1490. [Google Scholar] [CrossRef]
- Zhang, D.M.; Xie, X.C.; Li, Z.L.; Zhang, J. Simplified analysis method for predicting the influence of deep excavation on existing tunnels. Comput. Geotech. 2020, 121, 103477. [Google Scholar] [CrossRef]
- Bian, X.C.; Hu, H.Q.; Zhao, C.; Ye, J.N.; Chen, Y.M. Protective effect of partition excavations of a large-deep foundation pit on adjacent tunnels in soft soils: A case study. Bull. Eng. Geol. Environ. 2021, 80, 5693–5707. [Google Scholar] [CrossRef]
- Cheng, X.D.; Hong, T.Q.; Lu, Z.T.; Cheng, X.C. Characterization of underlying twin shield tunnels due to foundation-excavation unloading in soft soils: An experimental and numerical study. Appl. Sci. 2021, 11, 10938. [Google Scholar] [CrossRef]
- Ye, S.H.; Zhao, Z.F.; Wang, D.Q. Deformation analysis and safety assessment of existing metro tunnels affected by excavation of a foundation pit. Undergr. Space 2021, 6, 421–431. [Google Scholar] [CrossRef]
- Tanoli, A.Y.; Yan, B.; Xiong, Y.L.; Ye, G.L.; Khalid, U.; Xu, Z.H. Numerical analysis on zone-divided deep excavation in soft clays using a new small strain elasto–plastic constitutive model. Undergr. Space 2022, 7, 19–36. [Google Scholar] [CrossRef]
- Zhao, X.; Li, Z.W.; Dai, G.L.; Wang, H.X.; Yin, Z.W.; Cao, S.N. Numerical study on the deformation of tunnels by excavation of foundation pit adjacent to the subway. Appl. Sci. 2022, 12, 4530. [Google Scholar] [CrossRef]
- Zheng, G.; Du, Y.M.; Diao, Y.; Deng, X.; Zhu, G.P.; Zhang, L.M. Influenced zones for deformation of existing tunnels adjacent to excavations. Chin. J. Geot. Eng. 2016, 38, 599–612. [Google Scholar] [CrossRef]
- Kung, G.T.C.; Hsiao, E.C.L.; Juang, C.H. Evaluation of a simplified small-strain soil model for analysis of excavation-induced movements. Can. Geotech. J. 2007, 44, 726–736. [Google Scholar] [CrossRef]
- Benz, T.; Schwab, R.; Vermeer, P. Small-strain stiffness in geotechnical analyses. Bautechnik 2009, 86, 16–27. [Google Scholar] [CrossRef]
- Schweiger, H.F.; Vermeer, P.A.; Wehnert, M. On the design of deep excavations based on finite element analysis. Geomech. Tunn. 2009, 2, 333–344. [Google Scholar] [CrossRef]
- Ardakani, A.; Bayat, M.; Javanmard, M. Numerical modeling of soil nail walls considering mohr coulomb, hardening soil and hardening soil with small-strain stiffness effect models. Geomech. Eng. 2014, 6, 391–401. [Google Scholar] [CrossRef]
- Zheng, G.; Yang, X.Y.; Zhou, H.Z.; Du, Y.M.; Sun, J.Y.; Yu, X.X. A simplified prediction method for evaluating tunnel displacement induced by laterally adjacent excavations. Comput. Geotech. 2018, 95, 119–128. [Google Scholar] [CrossRef]
- Lee, K.M.; Ge, X.W. The equivalence of a jointed shield-driven tunnel lining to a continuous ring structure. Can. Geotech. J. 2001, 38, 461–483. [Google Scholar] [CrossRef]
- Ye, F.; Gou, C.F.; Sun, H.D.; Liu, Y.P.; Xia, Y.X.; Zhou, Z. Model test study on effective ratio of segment transverse bending rigidity of shield tunnel. Tunn. Undergr. Space Technol. 2014, 41, 193–205. [Google Scholar] [CrossRef]
- Zheng, G.; Lei, Y.W.; Cui, T.; Cheng, X.S.; Diao, Y.; Zhang, T.Q.; Sun, J.B. Experimental research on the transverse effective bending rigidity of shield tunnels. Adv. Civ. Eng. 2019, 2019, 2174562. [Google Scholar] [CrossRef] [Green Version]
- Tang, Y.F.; Chen, H.C.; Ye, Z.W.; Liu, T.J.; Yang, Y.B. Experimental study on the transverse effective bending rigidity of segmental lining structures. Adv. Civ. Eng. 2020, 2020, 8836505. [Google Scholar] [CrossRef]
- Huang, D.W.; Jiang, H.; Luo, W.J.; Xiong, H.; Tang, B.Z.; Xu, J.H. Algorithm for an effective ratio of the transverse bending rigidity based on the segment joint bending stiffness. Appl. Sci. 2022, 12, 1901. [Google Scholar] [CrossRef]
- CCES. CCES 03–2016; Guideline for Safety Assessment and Control Technology of Adjacent Structures Impacted by Deep Excavation and Tunneling in Soft Soils of Urban Area. China Architecture & Building Press: Beijing, China, 2016. [Google Scholar]
- MOHURD. CJJ/T 202–2013; Technical Code for Protection Structure of Urban Rail Transit. China Architecture & Building Press: Beijing, China, 2013. [Google Scholar]
- MOHURD. GB 50911–2013; Code for Monitoring Measurement of Urban Rail Transit Engineering. China Architecture & Building Press: Beijing, China, 2013. [Google Scholar]
- Chang, C.T.; Sun, C.W.; Duann, S.W.; Hwang, R.N. Response of a Taipei Rapid Transit System (TRTS) tunnel to adjacent excavation. Tunn. Undergr. Space Technol. 2001, 16, 151–158. [Google Scholar] [CrossRef]
- Hwang, R.N.; Duann, S.W.; Cheng, K.H.; Chen, C.H. Damages to metro tunnels due to adjacent Excavations. In Proceedings of TC302 symposium Osaka 2011: International Symposium on Backwards Problem in Geotechnical Engineering and Monitoring of Geo-Construction, Osaka, Janpan, 14–15 July 2011; pp. 83–88. [Google Scholar]
- Hu, Z.F.; Yue, Z.Q.; Zhou, J.; Tham, L.G. Design and construction of a deep excavation in soft soils adjacent to the shanghai metro tunnels. Can. Geotech. J. 2003, 40, 933–948. [Google Scholar] [CrossRef] [Green Version]
- Liu, B.; Zhang, D.W.; Yang, C.; Zhang, Q.B. Long-term performance of metro tunnels induced by adjacent large deep excavation and protective measures in Nanjing silty clay. Tunn. Undergr. Space Technol. 2020, 95, 103147. [Google Scholar] [CrossRef]
Figure 1.
Dimensions, relative positions and structural deformations of the deep excavation and tunnel: (a) Plane diagram; (b) Cross section diagram; (c) Deformation diagram.
Figure 1.
Dimensions, relative positions and structural deformations of the deep excavation and tunnel: (a) Plane diagram; (b) Cross section diagram; (c) Deformation diagram.

Figure 2.
Histogram of deep excavation depth He.

Figure 3.
Histogram of relative position between the tunnel and deep excavation: (a) Histogram of vertical tunnel position; (b) Histogram of tunnel horizontal position.
Figure 3.
Histogram of relative position between the tunnel and deep excavation: (a) Histogram of vertical tunnel position; (b) Histogram of tunnel horizontal position.

Figure 4.
2D FEM model for the effect of deep excavation on the adjacent tunnel.

Figure 5.
Influenced zone of deep excavation on adjacent tunnel displacement (He = 18 m): (a) δhm = 0.18%He; (b) δhm = 0.3%He; (c) δhm = 0.7%He.
Figure 5.
Influenced zone of deep excavation on adjacent tunnel displacement (He = 18 m): (a) δhm = 0.18%He; (b) δhm = 0.3%He; (c) δhm = 0.7%He.

Figure 6.
Influenced zone of deep excavation on adjacent tunnel displacement (He = 15 m): (a) δhm = 0.18%He; (b) δhm = 0.3%He; (c) δhm = 0.7%He.
Figure 6.
Influenced zone of deep excavation on adjacent tunnel displacement (He = 15 m): (a) δhm = 0.18%He; (b) δhm = 0.3%He; (c) δhm = 0.7%He.

Figure 7.
Influenced zone of deep excavation on adjacent tunnel displacement (He = 12 m): (a) δhm = 0.18%He; (b) δhm = 0.3%He; (c) δhm = 0.7%He.
Figure 7.
Influenced zone of deep excavation on adjacent tunnel displacement (He = 12 m): (a) δhm = 0.18%He; (b) δhm = 0.3%He; (c) δhm = 0.7%He.

Figure 8.
Influenced zone of deep excavation on adjacent tunnel displacement (He = 9 m): (a) δhm = 0.18%He; (b) δhm = 0.3%He; (c) δhm = 0.7%He.
Figure 8.
Influenced zone of deep excavation on adjacent tunnel displacement (He = 9 m): (a) δhm = 0.18%He; (b) δhm = 0.3%He; (c) δhm = 0.7%He.

Figure 9.
Schematic diagram of the influenced zone of deep excavation on adjacent tunnel displacement.
Figure 9.
Schematic diagram of the influenced zone of deep excavation on adjacent tunnel displacement.

Figure 10.
Effect of He on M, N1 and N2: (a) Effect of He on M; (b) Effect of He on N1; (c) Effect of He on N2.
Figure 10.
Effect of He on M, N1 and N2: (a) Effect of He on M; (b) Effect of He on N1; (c) Effect of He on N2.

Figure 11.
Effect of δhm on M, N1 and N2: (a) Effect of δhm on M; (b) Effect of δhm on N1; (c) Effect of δhm on N2.
Figure 11.
Effect of δhm on M, N1 and N2: (a) Effect of δhm on M; (b) Effect of δhm on N1; (c) Effect of δhm on N2.

Figure 12.
Flow chart for predicting the scope of the influenced zone of deep excavation under any He and δhm conditions.
Figure 12.
Flow chart for predicting the scope of the influenced zone of deep excavation under any He and δhm conditions.

Figure 13.
Comparison of the predicted influenced zone with the results in current research: (a) He = 18 m, δhm = 30 mm; (b) He = 18 m, δhm = 45 mm; (c) He = 18 m, δhm = 60 mm [27].
Figure 13.
Comparison of the predicted influenced zone with the results in current research: (a) He = 18 m, δhm = 30 mm; (b) He = 18 m, δhm = 45 mm; (c) He = 18 m, δhm = 60 mm [27].


Figure 14.
Comparison of predicted influenced zone with the results in case histories: (a) Comparing with Case 1; (b) Comparing with Case 2; (c) Comparing with Case 3.
Figure 14.
Comparison of predicted influenced zone with the results in case histories: (a) Comparing with Case 1; (b) Comparing with Case 2; (c) Comparing with Case 3.

Figure 15.
Cross section of the basement excavation and existing tunnels.

Figure 16.
Influenced zones of deep excavation in podium building area: (a) He = 22.3 m, δhm = 0.18%He; (b) He = 22.3 m, δhm = 0.3%He; (c) He = 22.3 m, δhm = 0.7%He.
Figure 16.
Influenced zones of deep excavation in podium building area: (a) He = 22.3 m, δhm = 0.18%He; (b) He = 22.3 m, δhm = 0.3%He; (c) He = 22.3 m, δhm = 0.7%He.

Figure 17.
Influenced zones of deep excavation in tower building area: (a) He = 34 m, δhm = 0.18%He; (b) He = 34 m, δhm = 0.3%He; (c) He = 34 m, δhm = 0.7%He.
Figure 17.
Influenced zones of deep excavation in tower building area: (a) He = 34 m, δhm = 0.18%He; (b) He = 34 m, δhm = 0.3%He; (c) He = 34 m, δhm = 0.7%He.

Figure 18.
Horizontal displacement evolution curves of the up-track tunnel.


| No. | Parameters | Definition | Values |
|---|---|---|---|
| 1 | unit weight | 19.8 kN/m3 | |
| 2 | void ratio | 0.6 | |
| 3 | effective cohesion | 14.0 kPa | |
| 4 | effective friction angle | 25.7° | |
| 5 | dilatancy angle | 0 | |
| 6 | secant stiffness in standard drained triaxial test | 7.2 MPa | |
| 7 | tangent stiffness for oedometer primary loading | 5.1 MPa | |
| 8 | triaxial unloading-reloading stiffness | 36.8 MPa | |
| 9 | power for the stress-level dependency of stiffness | 0.8 | |
| 10 | Poisson’s ratio for unloading-reloading | 0.2 | |
| 11 | reference stress for stiffness | 100 kPa | |
| 12 | failure ratio | 0.9 | |
| 13 | stress ratio of the effective horizontal stress to the effective vertical stress in a normally consolidated state | 0.57 | |
| 14 | initial shear stiffness | 99.3 MPa | |
| 15 | 0.20 × 10⁻³ |
Table 2.
Numerical simulation conditions.
| He (m) | δhm (m) | Ht (m) | Lt (m) | Number |
|---|---|---|---|---|
| 18 | 0.18%He, 0.3%He, 0.7%He | 9, 12, 15, 18, 24, 30, 36, 42, 48, 54 | 6, 9, 12, 15, 18, 24, 30, 36, 42, 48, 54 | 330 |
| 15 | 0.18%He, 0.3%He, 0.7%He | 9, 12, 15, 21, 27, 33, 39, 45 | 6, 9, 12, 15, 21, 27, 33, 39, 45 | 216 |
| 12 | 0.18%He, 0.3%He, 0.7%He | 9, 12, 18, 24, 30, 36 | 6, 9, 12, 18, 24, 30, 36 | 126 |
| 9 | 0.18%He, 0.3%He, 0.7%He | 9, 15, 21, 27 | 6, 9, 15, 21, 27 | 60 |
Table 3.
Determination parameters of influenced zones under different simulation conditions.
| He (m) | δhm (mm) | 20 mm | 10 mm | 5 mm | ||||||
|---|---|---|---|---|---|---|---|---|---|---|
| M | N1 | N2 | M | N1 | N2 | M | N1 | N2 | ||
| He = 18 m | 0.18%He | 0.60 | 1.30 | 1.75 | 1.35 | 1.30 | 2.35 | 2.15 | 1.50 | 3.30 |
| 0.3%He | 0.90 | 1.25 | 1.80 | 1.45 | 1.35 | 2.40 | 2.30 | 1.50 | 3.40 | |
| 0.7%He | 1.15 | 1.25 | 2.00 | 1.75 | 1.35 | 2.50 | 2.55 | 1.50 | 3.45 | |
| He = 15 m | 0.18%He | 0.50 | 1.40 | 1.60 | 1.10 | 1.30 | 2.20 | 1.90 | 1.75 | 3.30 |
| 0.3%He | 0.80 | 1.20 | 1.80 | 1.20 | 1.30 | 2.30 | 2.00 | 1.60 | 3.40 | |
| 0.7%He | 1.10 | 1.30 | 2.00 | 1.50 | 1.50 | 2.50 | 2.30 | 1.80 | 3.40 | |
| He = 12 m | 0.18%He | — | — | — | 1.00 | 1.50 | 2.10 | 1.75 | 1.75 | 3.30 |
| 0.3%He | 0.70 | 1.30 | 1.75 | 1.10 | 1.60 | 2.25 | 1.75 | 2.0 | 3.40 | |
| 0.7%He | 0.85 | 1.40 | 1.80 | 1.20 | 1.50 | 2.30 | 2.00 | 1.75 | 3.40 | |
| He = 9 m | 0.18%He | — | — | — | 0.75 | 1.30 | 1.70 | 1.250 | 1.50 | 3.10 |
| 0.3%He | — | — | — | 0.90 | 1.50 | 2.10 | 1.30 | 1.60 | 3.20 | |
| 0.7%He | — | — | — | 1.00 | 1.60 | 2.10 | 1.30 | 1.75 | 3.20 | |
Table 4.
Determination parameters of the influenced zones of deep excavation [27].
Table 4.
Determination parameters of the influenced zones of deep excavation [27].
| He (m) | δhm (mm) | 20 mm | 10 mm | 5 mm | ||||||
|---|---|---|---|---|---|---|---|---|---|---|
| M | N1 | N2 | M | N1 | N2 | M | N1 | N2 | ||
| 18 | 30 | 0.58 | 1.50 | 1.55 | 1.10 | 1.66 | 2.00 | 2.10 | 2.00 | 2.50 |
| 18 | 45 | 0.81 | 1.53 | 1.68 | 1.28 | 1.68 | 2.00 | 2.12 | 2.00 | 2.56 |
| 18 | 60 | 1.08 | 1.36 | 1.78 | 1.40 | 1.54 | 2.10 | 2.24 | 2.06 | 2.60 |
Table 5.
Determination parameters of the influenced zones of deep excavation obtained by the proposed method.
Table 5.
Determination parameters of the influenced zones of deep excavation obtained by the proposed method.
| He (m) | δhm (mm) | 20 mm | 10 mm | 5 mm | ||||||
|---|---|---|---|---|---|---|---|---|---|---|
| M | N1 | N2 | M | N1 | N2 | M | N1 | N2 | ||
| 18 | 30 | 0.57 | 1.50 | 1.74 | 1.34 | 1.50 | 2.34 | 2.13 | 1.50 | 3.29 |
| 18 | 45 | 0.78 | 1.50 | 1.78 | 1.41 | 1.50 | 2.38 | 2.24 | 1.50 | 3.36 |
| 18 | 60 | 0.92 | 1.50 | 1.82 | 1.47 | 1.50 | 2.41 | 2.32 | 1.50 | 3.40 |
Table 6.
Physical and mechanical parameters of strata at the site.
| Strata | ω (%) | e | γ (kN/m3) | c (kPa) | φ (°) | IP | Es (MPa) |
|---|---|---|---|---|---|---|---|
| ①-1 | — | — | 18.5 | 6 | 15 | — | — |
| ①-2 | 30.1 | 0.86 | 19.1 | 15 | 12 | 16.0 | 4.95 |
| ②-1 | 31.2 | 0.87 | 19.1 | 15 | 16 | 16.6 | 4.46 |
| ②-2 | 38.4 | 1.07 | 18.1 | 12 | 15 | 15.2 | 3.27 |
| ②-3 | 36.3 | 1.05 | 18.2 | 11 | 18 | 13.8 | 3.48 |
| ②-4 | 30.3 | 0.86 | 18.8 | 8.2 | 31 | — | 11.56 |
| ②-5 | 25.1 | 0.77 | 19 | 8.3 | 32 | — | 14.36 |
Note: w—water content, e—porosity ratio, γ—unit weight, c—cohesive force, φ—internal friction angle, IP—plasticity index, Es—compression modulus.
Disclaimer/Publisher’s Note: The statements, opinions and data contained in all publications are solely those of the individual author(s) and contributor(s) and not of MDPI and/or the editor(s). MDPI and/or the editor(s) disclaim responsibility for any injury to people or property resulting from any ideas, methods, instructions or products referred to in the content. |
© 2023 by the authors. Licensee MDPI, Basel, Switzerland. This article is an open access article distributed under the terms and conditions of the Creative Commons Attribution (CC BY) license (https://creativecommons.org/licenses/by/4.0/).
Share and Cite
MDPI and ACS Style
Liu, B.; Shao, C.; Wang, N.; Zhang, D. Influenced Zone of Deep Excavation and a Simplified Prediction Method for Adjacent Tunnel Displacement in Thick Soft Soil. Appl. Sci. 2023, 13, 4647. https://doi.org/10.3390/app13074647
AMA Style
Liu B, Shao C, Wang N, Zhang D. Influenced Zone of Deep Excavation and a Simplified Prediction Method for Adjacent Tunnel Displacement in Thick Soft Soil. Applied Sciences. 2023; 13(7):4647. https://doi.org/10.3390/app13074647
Chicago/Turabian StyleLiu, Bo, Chengmeng Shao, Ningning Wang, and Dingwen Zhang. 2023. "Influenced Zone of Deep Excavation and a Simplified Prediction Method for Adjacent Tunnel Displacement in Thick Soft Soil" Applied Sciences 13, no. 7: 4647. https://doi.org/10.3390/app13074647
Note that from the first issue of 2016, this journal uses article numbers instead of page numbers. See further details here.