Article

Mechanism of Time-Dependent Instability of Deep Soft-Rock Roadway and Crack-Filling Reinforcement Technology

1
School of Mining Engineering, Anhui University of Science and Technology, Huainan 232001, China
2
School of Mines, China University of Mining and Technology, Xuzhou 221116, China
*
Authors to whom correspondence should be addressed.
Appl. Sci. 2023, 13(7), 4641; https://doi.org/10.3390/app13074641
Submission received: 10 March 2023 / Revised: 1 April 2023 / Accepted: 3 April 2023 / Published: 6 April 2023
(This article belongs to the Special Issue Advanced Backfill Mining Technology)

Abstract

:
Soft broken surrounding rock exhibits obvious rheological properties and time-dependent weakening effects under the action of deep high-ground stress, leading to the increasingly prominent problem of sustained large deformation in deep roadways. In this study, with the II5 Rail Rise in Zhuxianzhuang Coal Mine as an example, the mechanism and control technology of time-dependent damage and instability in a deep soft-rock roadway were explored through a field observation and numerical simulation. The research results show that the range of the loose circle in the deep fractured surrounding rock can reach 3.0 m. The expansion of shallow and deep cracks causes the primary plastic deformation and secondary rheological deformation of the surrounding rock, with the rheological deformation rate increasing by 21.4% every 55 days on average, which ultimately induces the instability and failure of the surrounding rock. Based on the mechanism of roadway instability, a control technology of high-preload bolt + deep- and shallow-borehole crack filling was proposed. The technology reduces deformation and ensures the stability of the roadway surrounding rock by inhibiting the propagation of deep and shallow cracks and reinforcing the surrounding rock.

1. Introduction

Coal plays a dominant role in China’s energy mix [1]. As shallow coal resources are increasingly depleted, the mining of deep coal resources has become the new normal [2]. Extensive engineering practices and studies show that deep rock mass exhibits obvious brittle–ductile transformation and time-dependent deformation characteristics under the complex stress environment of “high ground stress, high ground temperature, high osmotic pressure and strong mining disturbance”. After roadway excavation, the plastic damage degree and range of the surrounding rock both increase, and the soft surrounding rock is prone to overall roof subsidence, rib bulge, and floor structural rheology. Statistics found that 90% of underground deep soft-rock roadways have been repaired at least once [3,4,5,6]. Considering the stability of the roadway surrounding rock, it is of great significance to analyze the time-dependent damage of deep soft-rock roadways and propose effective support measures.
The failure of rock mass during deep roadway excavation could be attributed to a broad range of performance malfunctions, from the plastic yielding of rock, the generation of macrocracks on the excavation boundary, gravity-driven rockfalls, or even complete stress-induced collapse [7,8]. In order to explore the instability mechanism and support control technology of deep soft-rock roadways in coal mines, scholars have conducted extensive research. Yang et al. posited that the high deviatoric stress induced by deep roadway excavation drove the surrounding rock into the post-peak-damage stage where tensile cracks developed and expanded in the surrounding rock, leading to rock mass breakage and dilatancy; in addition, the roadway cross-section shrank considerably due to the poor compressive capacity of the support system [9]. Wang et al. found that the surrounding rock of deep soft-rock roadways corresponded to various damage modes, and the plastic deformation and damage of the surrounding rock first appeared on the roadway side and then extended to other areas [10]. Through a simulation study, Yang et al. disclosed that the surrounding rock damage of deep soft-rock roadways first appeared on the surface; as the stress applied to the surface gradually decreased, the damage area expanded into the deep surrounding rock and finally led to a large area of stress relaxation [11]. Zhu et al. built a true three-dimensional similarity simulation test platform. With the aid of this platform, they found that the surrounding rock of deep roadways experienced secondary deformation, and the bearing capacity of the anchor bolts decreased rapidly after the deformation of the anchorage zone [12]. Tao et al. explored the damage characteristics of soft-rock roadways in strata with different inclined angles under high static stress and horizontal tectonic stress, and concluded that the maximum roof-to-floor displacement in 60°-inclined strata was greater than that in 45°-inclined strata [13]. Wang et al. revealed that a bolt and shotcrete support could only provide limited support strength in deep soft-rock roadways; moreover, bolts were generally arranged in seriously broken surrounding rock, which could hardly form a stable and effective bearing structure, leading to bearing capacity failure and serious deformation [14]. He et al. established a mechanical model of asymmetric floor heave for deep soft-rock roadways, and found that the stability of the roadway floor was correlated with the stress concentration coefficient of the roadway rib, the buried depth of the roadway and the cohesion and internal friction angle of the floor rock [15]. Li et al. believed that the ground stress, mining stress, and rock mass structure were the main factors affecting deep roadway deformation, and summarized the mechanism of roadway deformation and damage into the oblique pressure model, the roof bending model, the floor heave model, and the sidewall bulking model [16]. In the hope of solving the problems of serious roof subsidence and obvious floor heave in deep roadways, Zhao et al. proposed a compound support scheme of “shotcrete + grouting anchor bolt + anchor bolt + grouting anchor cable + anchor cable” and applied it on site. The application results showed that the scheme could effectively alleviate the deformation of deep soft-rock roadways [17]. Considering that the surrounding rock of deep roadways is fragile and vulnerable to weathering, Shen et al. put forward a support scheme of “full-length grouting + high preload anchor bolt and anchor cable”. After the application of this scheme, the roadway deformation in the on-site test section was reduced by 40–50% [18]. Yang et al. proposed a combined support scheme of “high-strength bolt, high-rigidity shotcrete layer for water plugging and deep-shallow borehole grouting reinforcement” to support soft-rock roadways under high stress and long-term immersion conditions. Numerical simulation and on-site tests suggested that the scheme could effectively control surrounding-rock deformation [19]. Ren et al. proposed a rock quality designation, i.e., Rock Quality Designation (RQD) (m), for long formations and applied it to a rock quality designation calculation of the grouting section. They found a negative exponential relationship between the RQD (m) and the unit grouting volume. Then, based on the fitting formula between the RQD (m) and the unit grouting volume, they obtained the grouting amounts at different depths according to the variation curve of rock quality designation with depth [20]. Through true triaxial tests, Zhu et al. concluded that the deformation and failure sequence of deep roadways in soft rock during excavation under high stress is “vault → sidewalls → arch springing → vault collapse → hance collapse” [21].
Previous research has been mainly focused on the causes of large deformation in deep roadways from the macro perspectives of stress, strain, the plastic zone, and the deformation mode, and the control measures proposed on this basis have certain limitations. In this study, based on an on-site observation and numerical simulation of Zhuxianzhuang Coal Mine, the time-dependent failure mechanism of surrounding rock in its deep roadway was revealed by exploring the loose circle, displacement, crack distribution, and damage evolution. Furthermore, the damage mechanism of deep soft-rock roadways was elaborated in depth by analyzing the engineering damage case. The research is expected to provide a theoretical basis for the selection of a reasonable roadway support mode and scheme under similar engineering conditions.

2. Engineering Overview

2.1. Mine Description

Zhuxianzhuang Coal Mine is located in Suzhou City, Anhui Province, China. The II5 Rail Rise of this mine is a roadway with straight walls and a semicircular arch (4.0 m width × 3.4 m height). The straight walls are 1.4 m in height and 450–678 m in buried depth (Figure 1a). The selected roadway, 600 m in buried depth, is located in sandy mudstone where internal cracks are developed and the range of the test loose circle exceeds 2.0 m. Therefore, the surrounding rock is weak, broken, and of poor integrity. The roof and floor are 2.5 m thick fine sandstone and 3.4 m thick mudstone, respectively. Figure 1c shows the comprehensive geological histogram. According to Figure 1c, initially, the II5 Rail Rise adopts the U29-type shed symmetrical support, in which the overlapping length of the beam legs is 400 mm; the tightening torque of nuts is not less than 300 mm; and the spacing of the sheds is 500 mm.

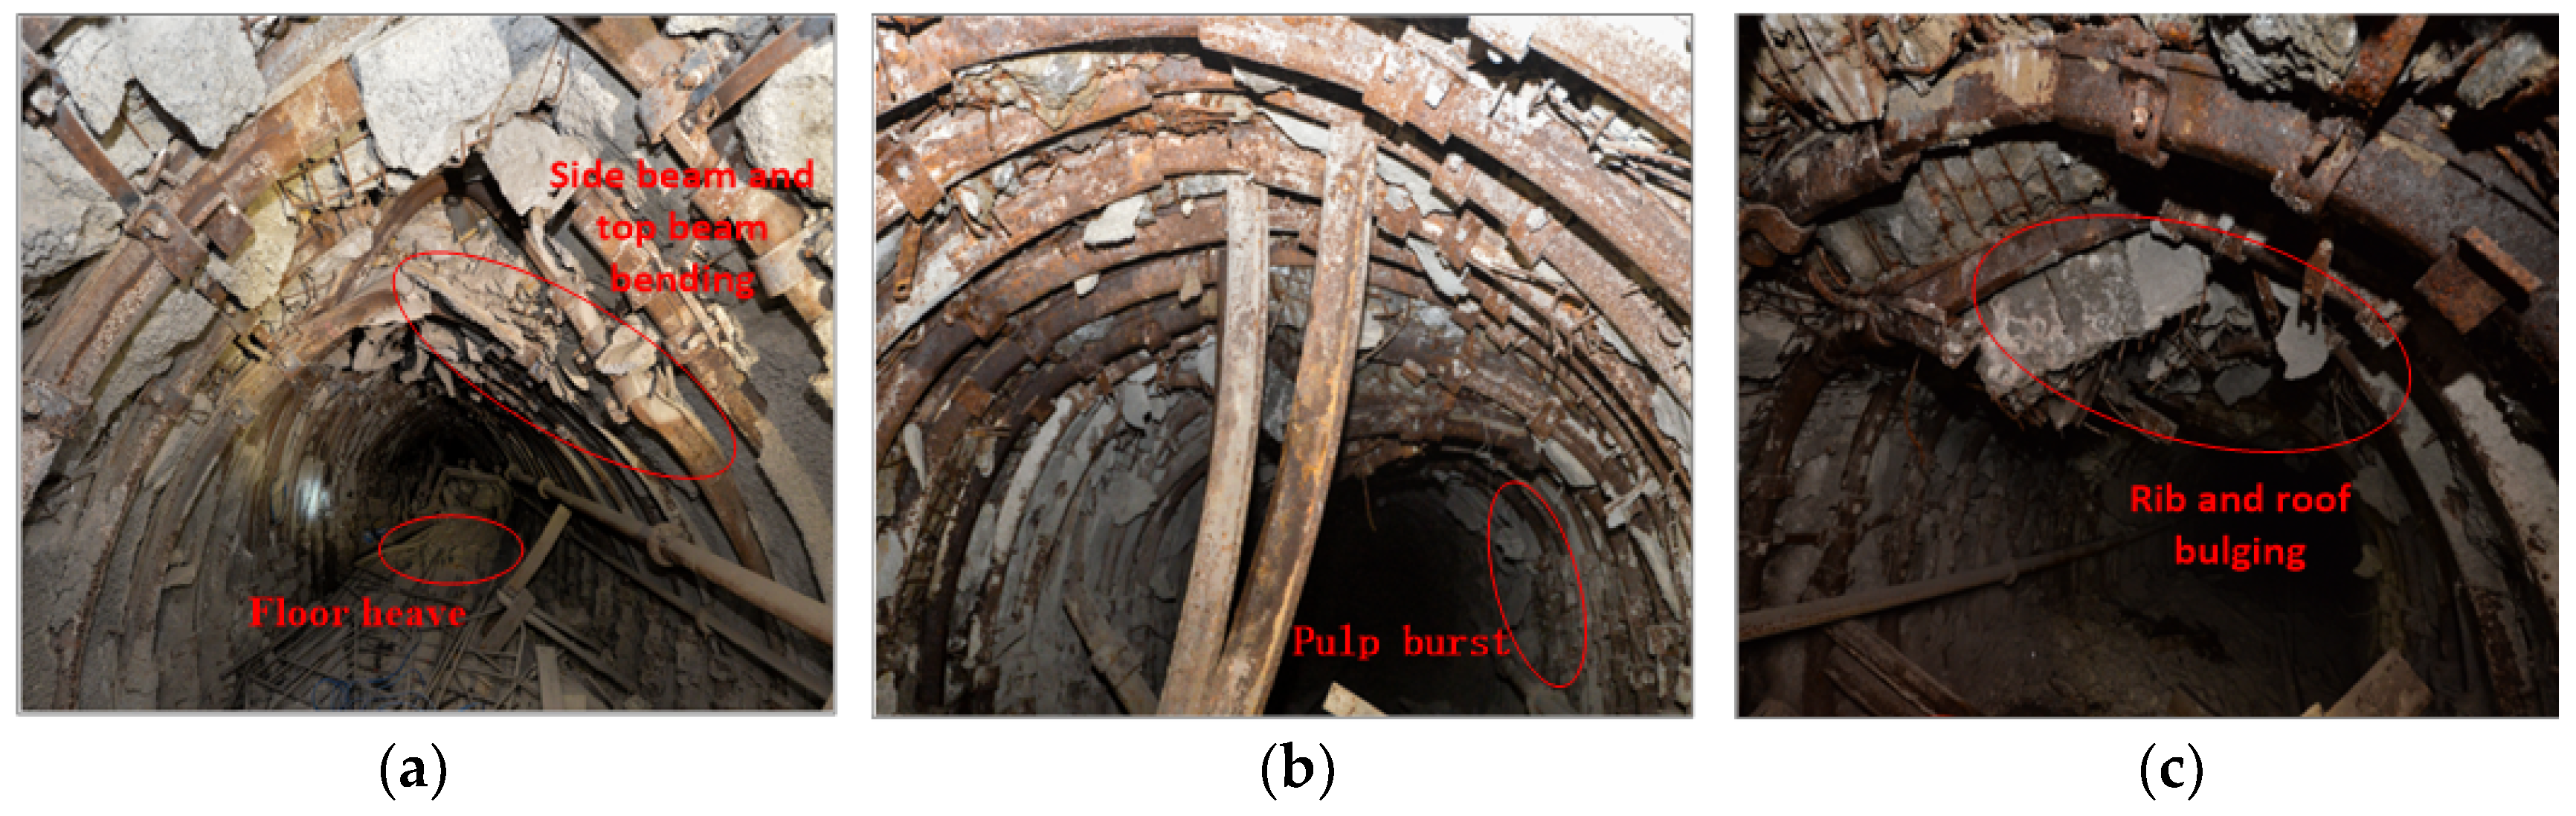
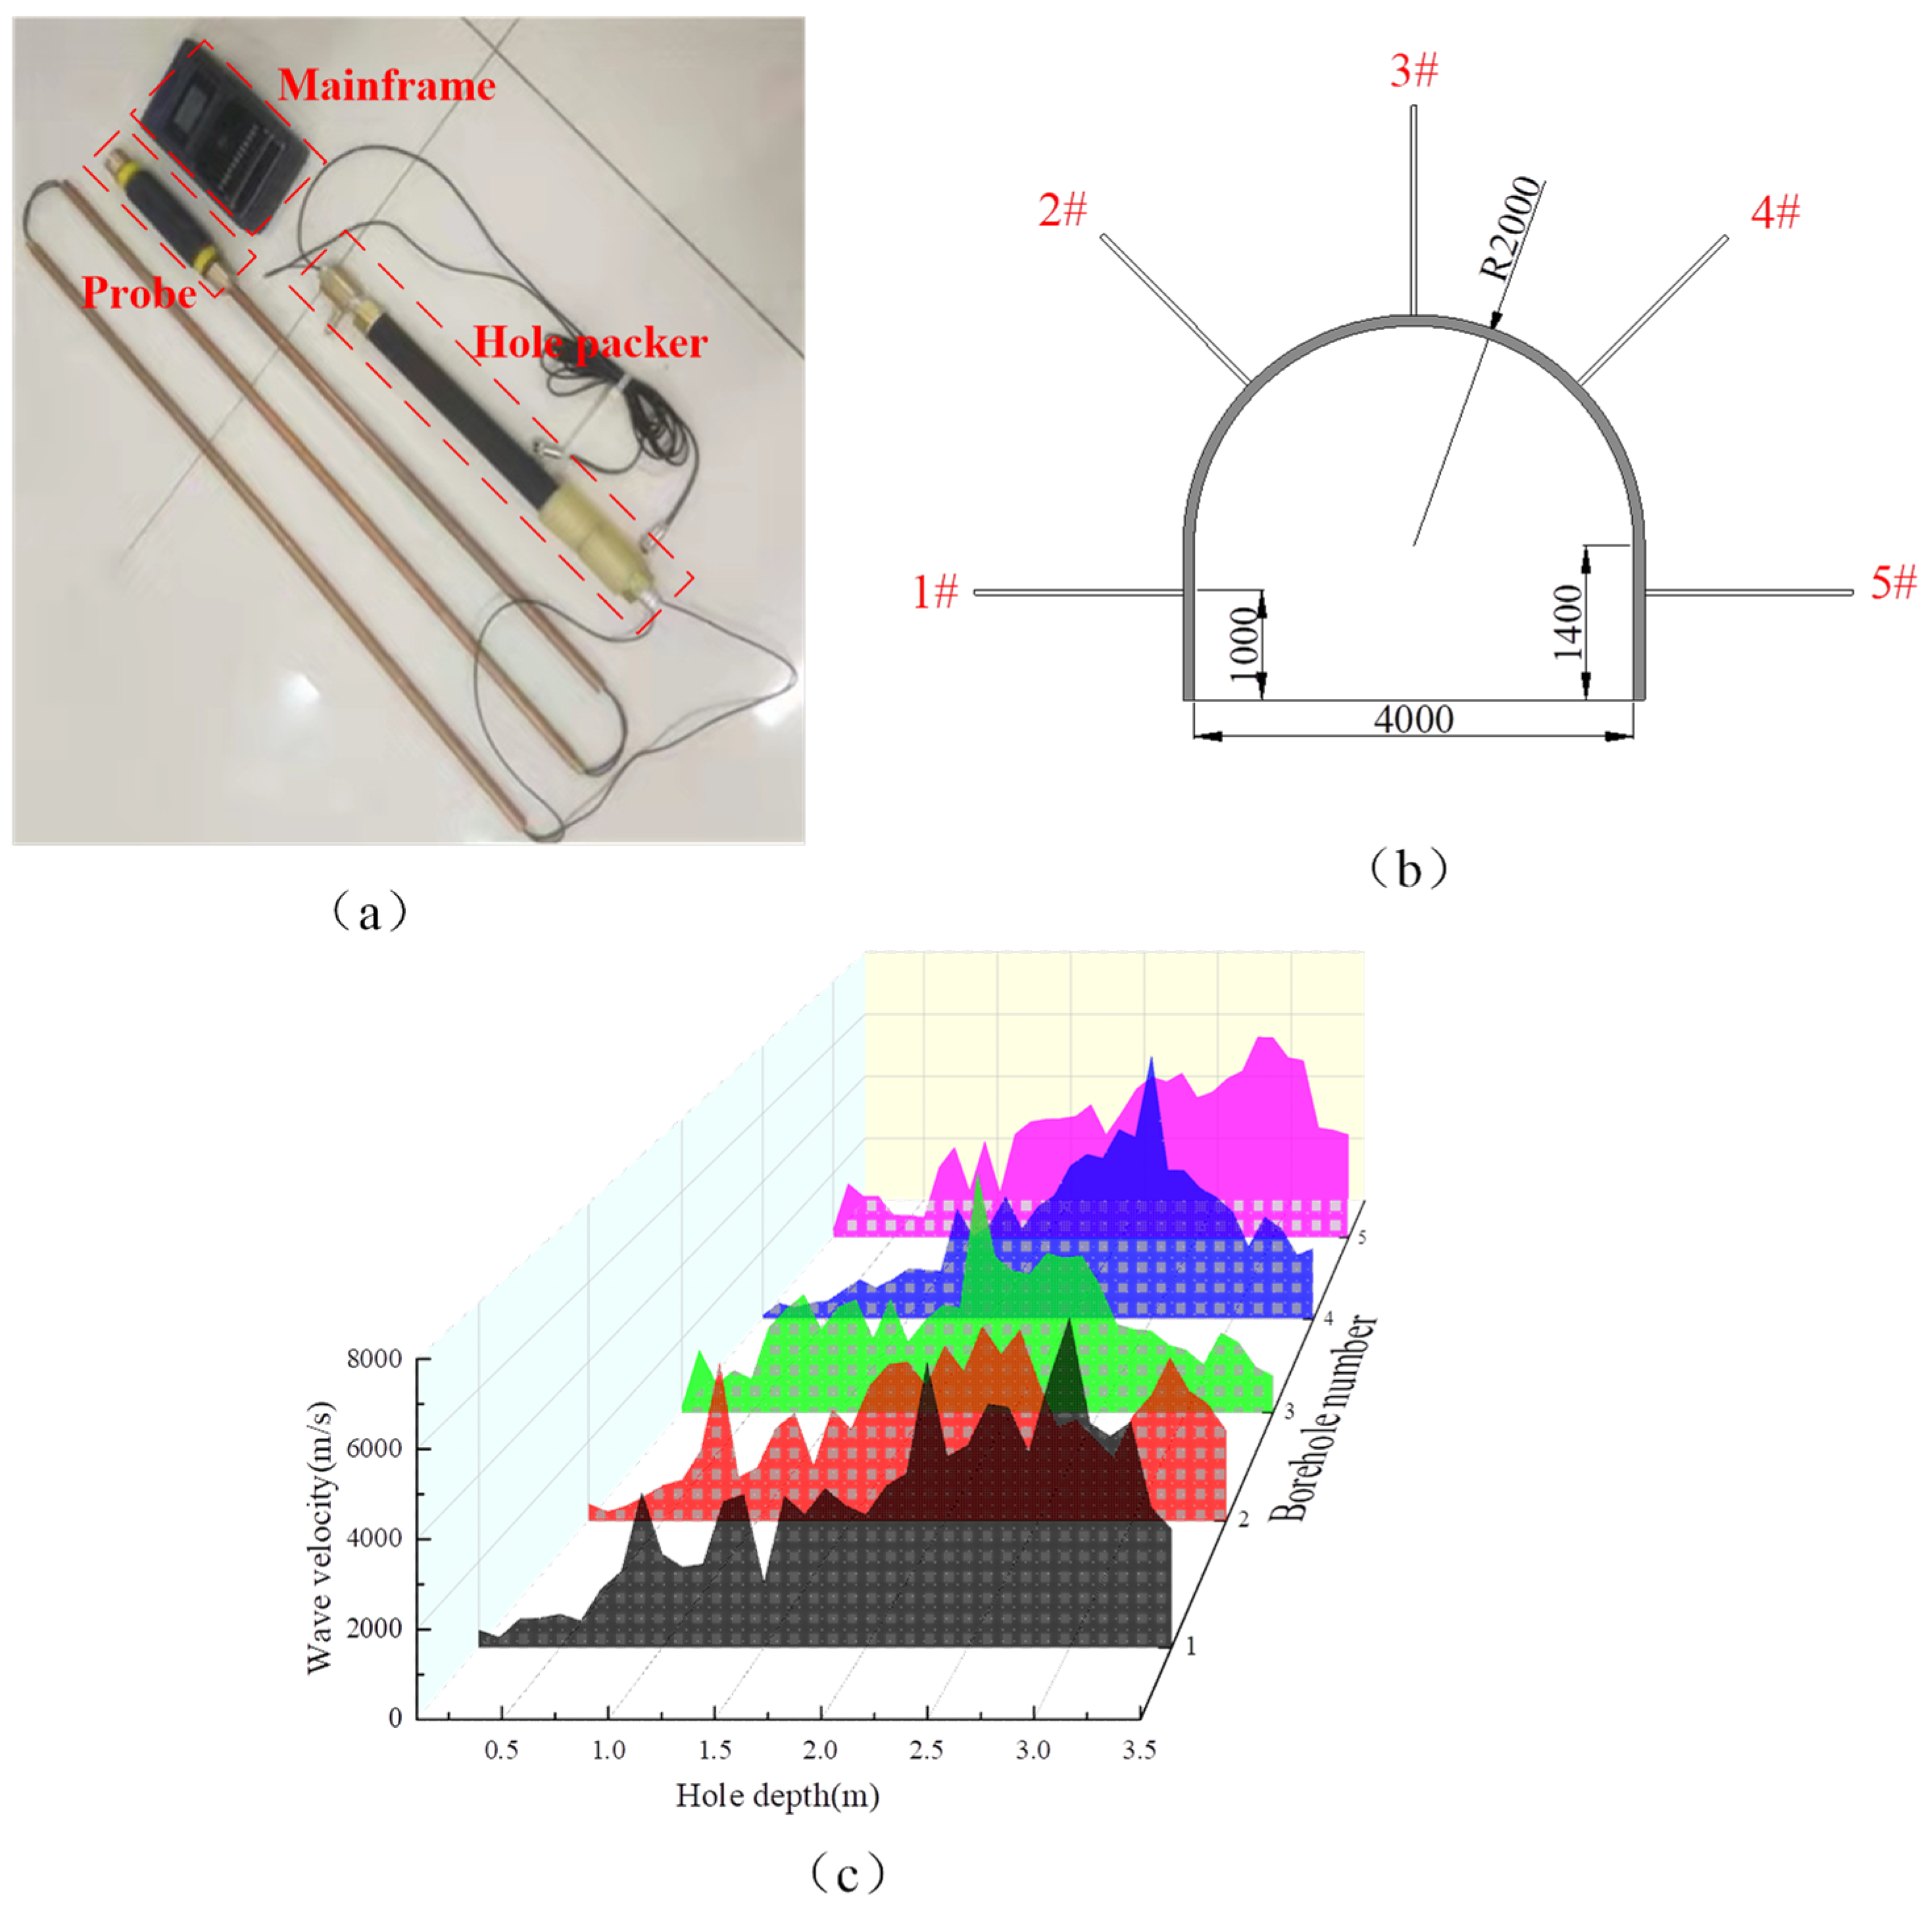
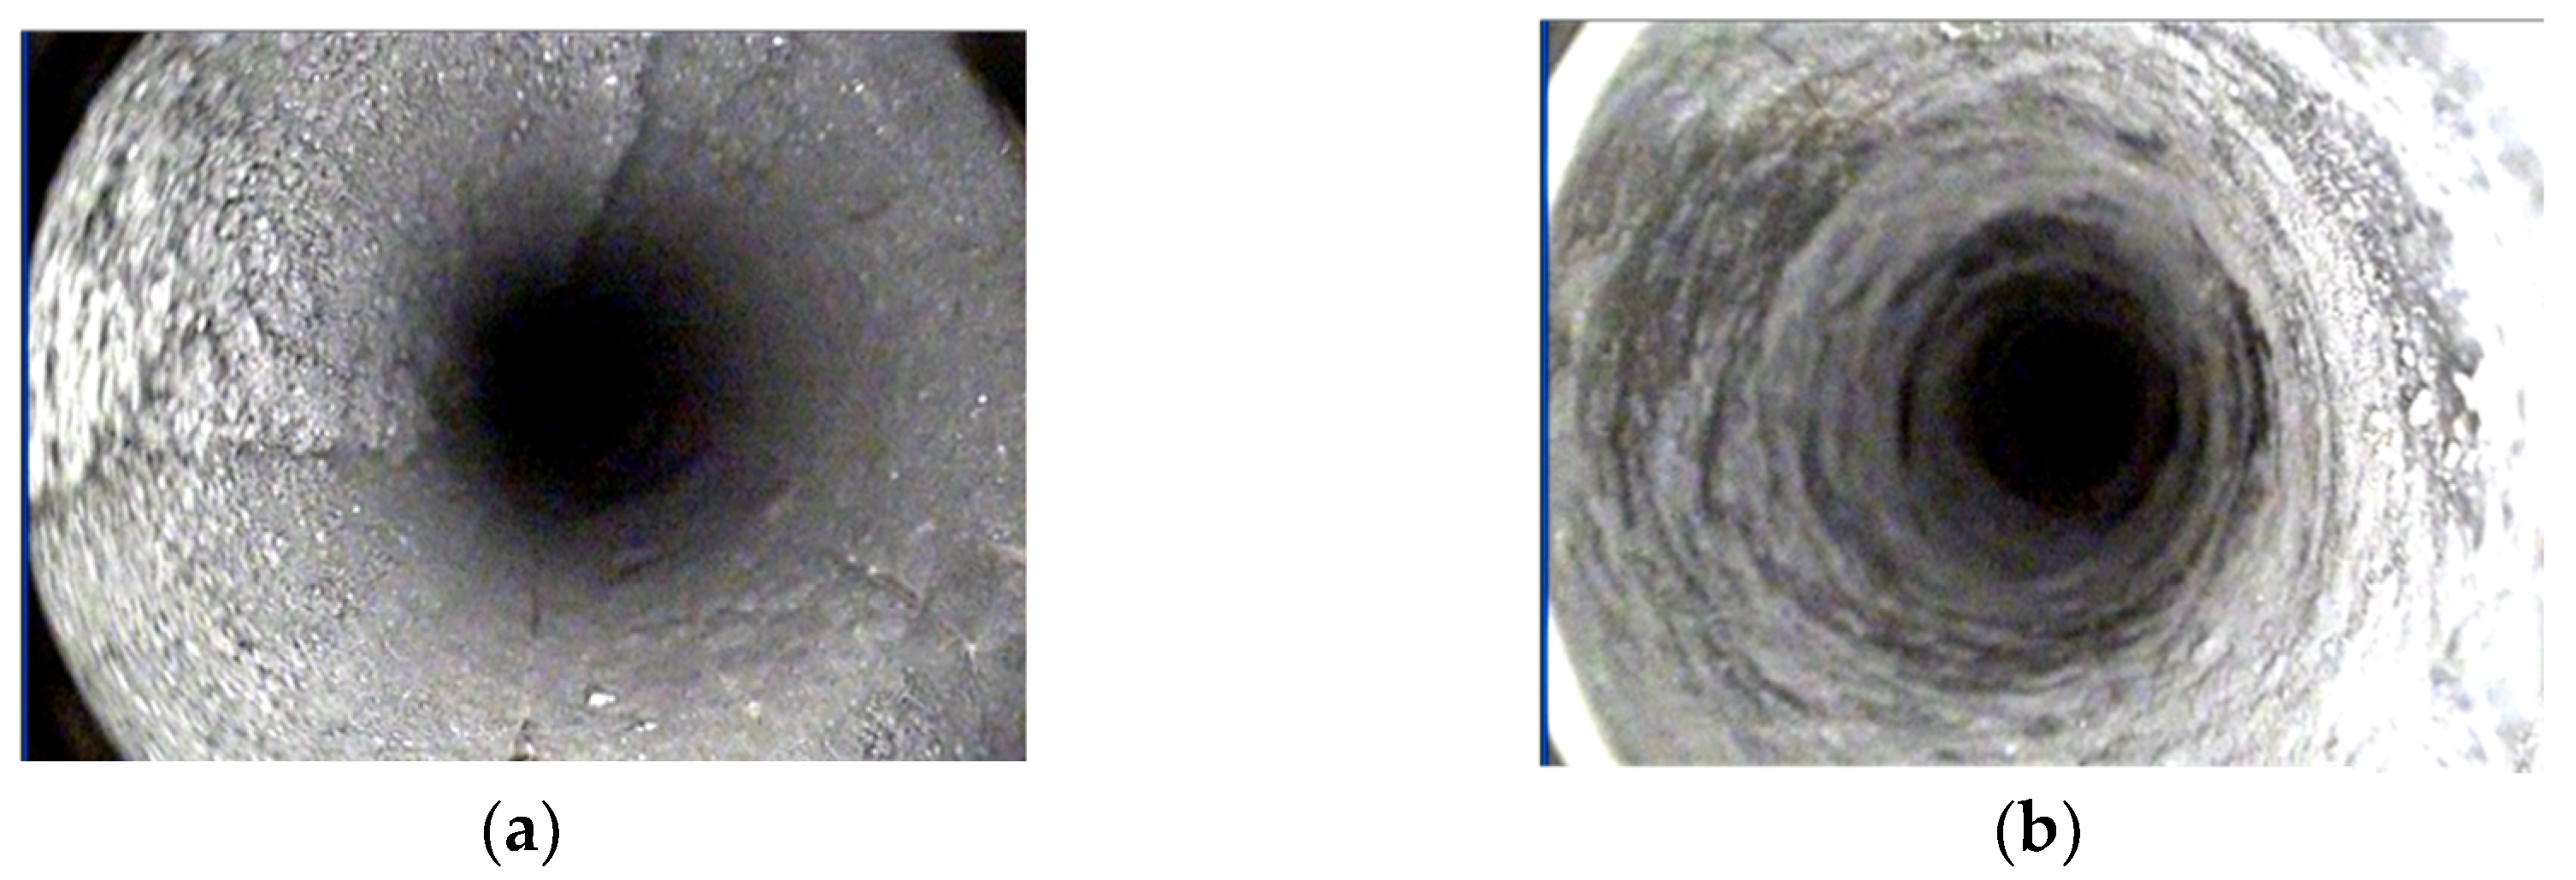
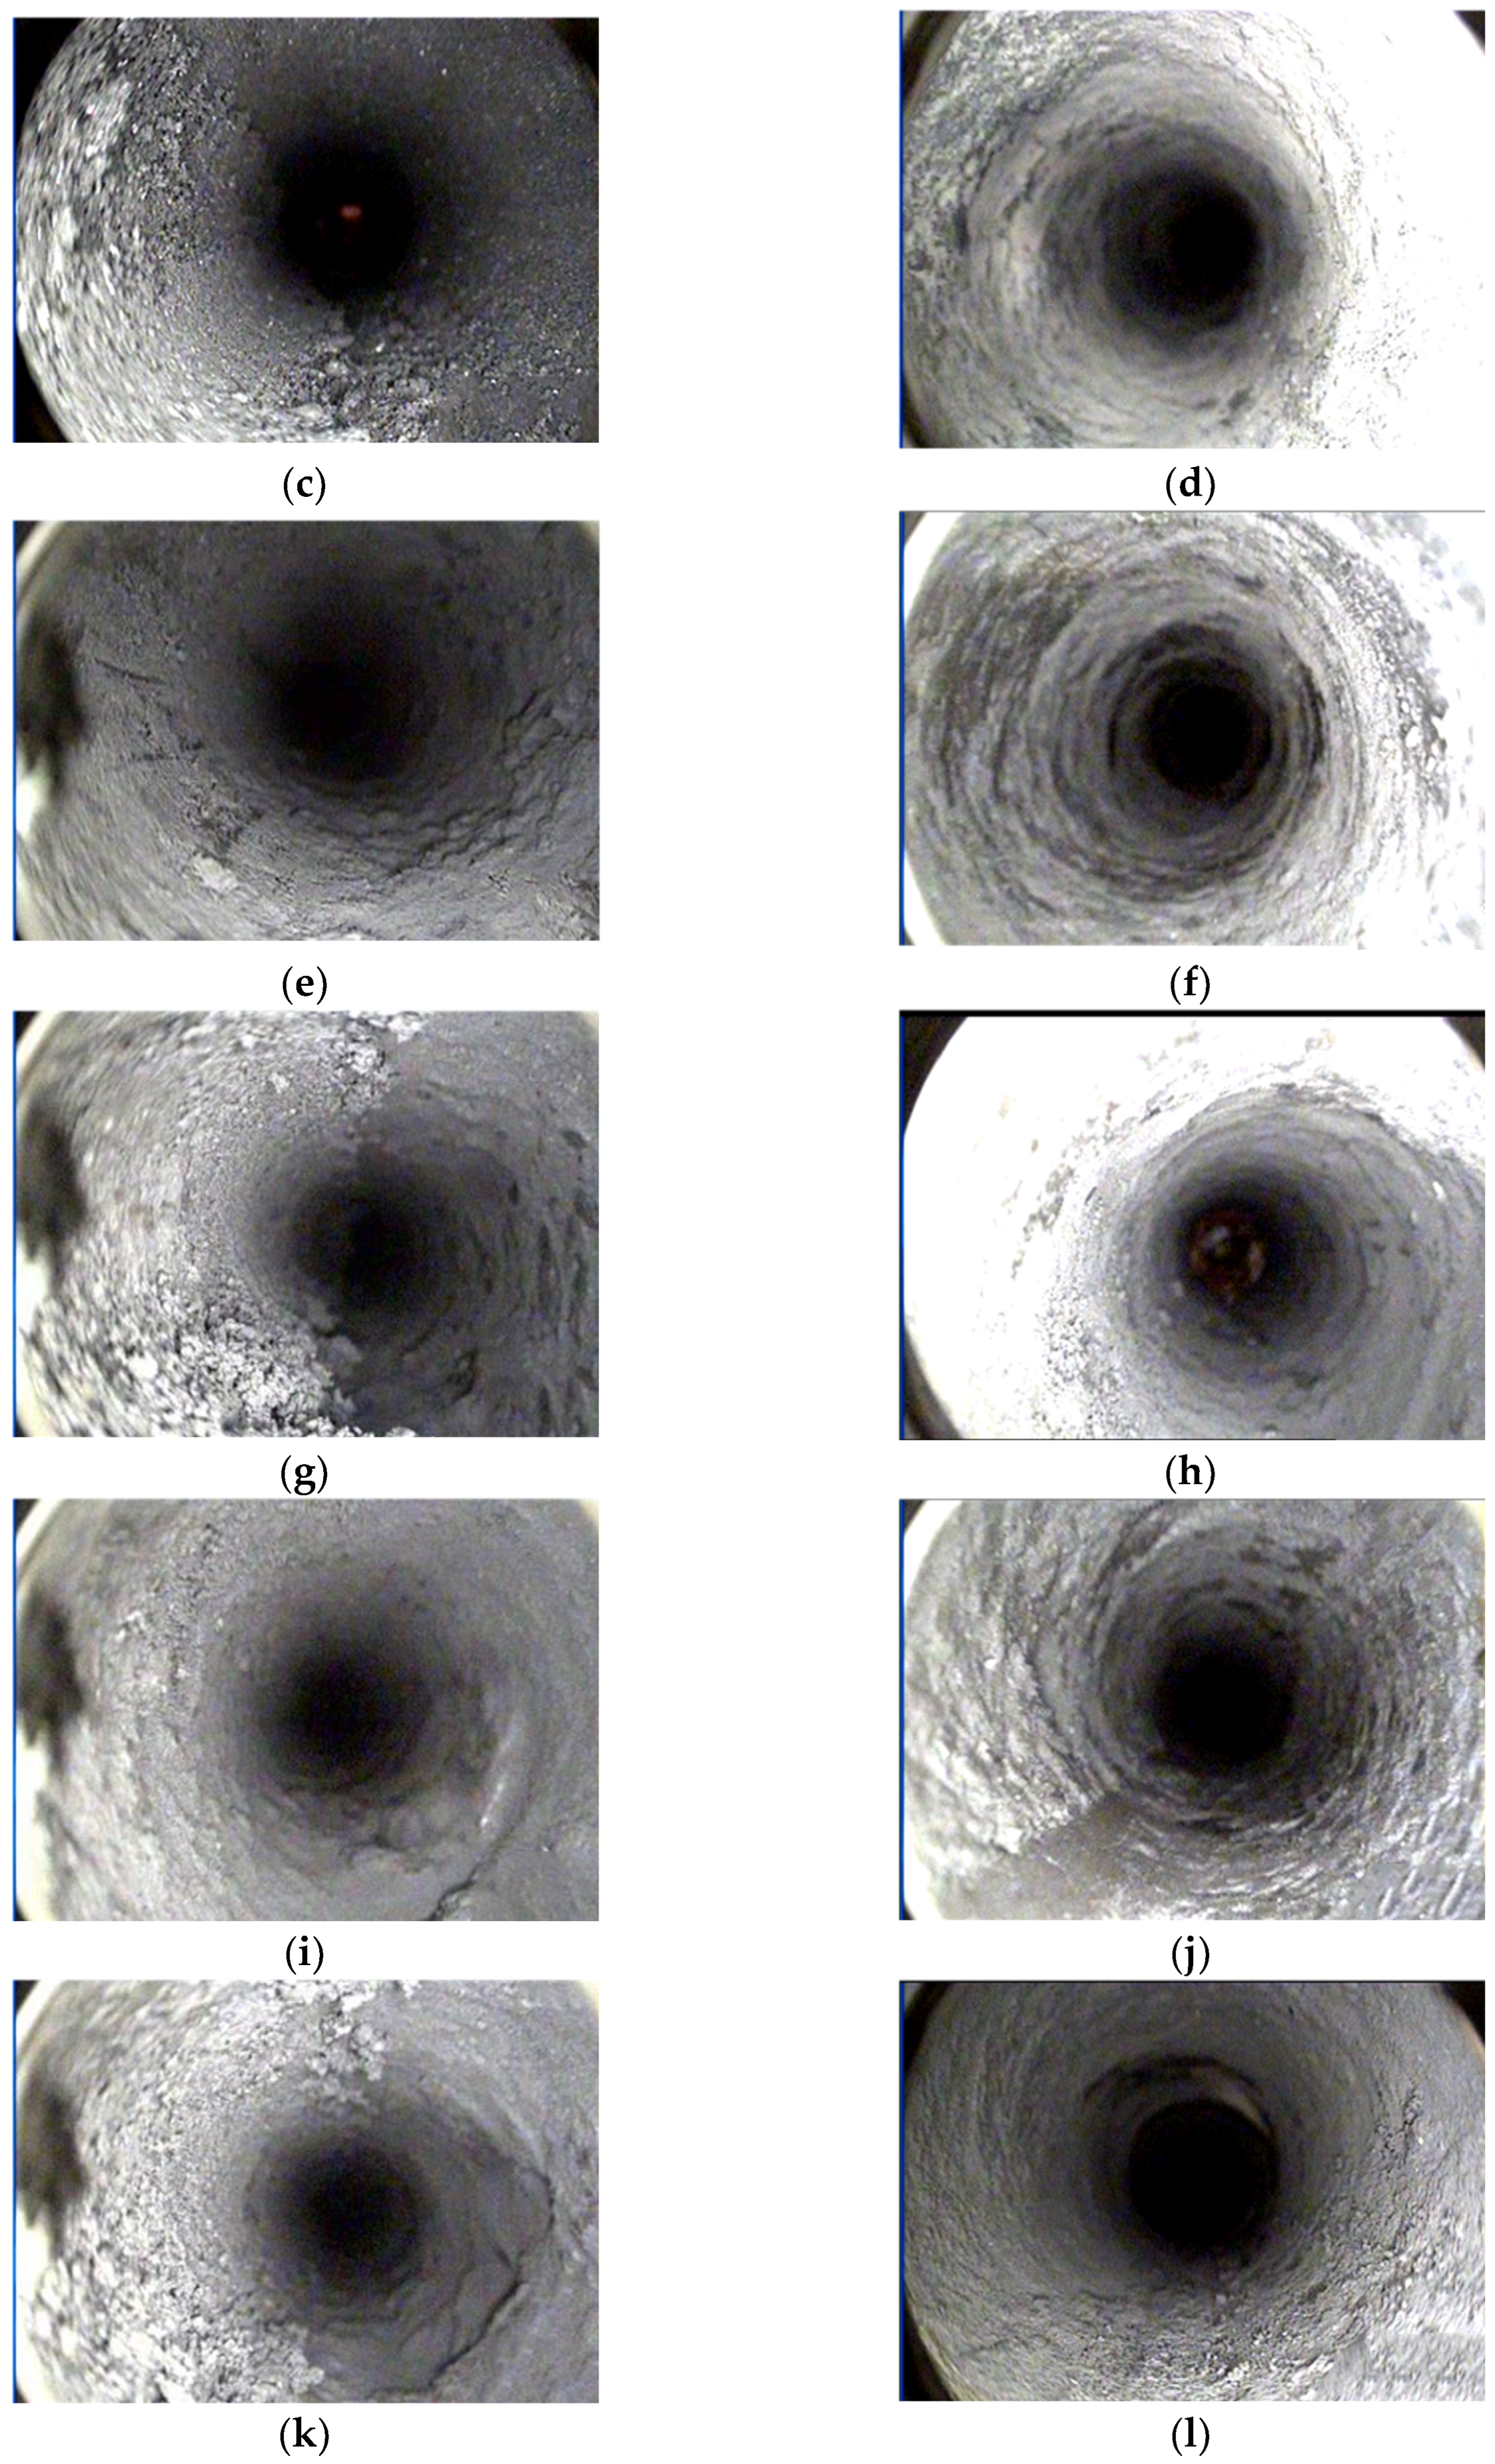
2.2. On-Site Observation of the Surrounding Rock Characteristics in the II5 Rail Rise

As can be observed from the photos of roadway damage in the test section given in Figure 2, the soft and broken surrounding rock of the roadway displays serious asymmetric deformation and support failure phenomena under the long-term action of deep high-ground stress, including floor heave, side-beam and top-beam bending, twisting, kneeling leg, pulp burst, rib and roof bulge, etc. The monitored data of the roadway surface displacement show that the rib-to-rib displacement is 1000–1500 mm and the floor heave is 800–1200 mm, which threatens the safety of coal mining.
The boundary of the loose circle was measured using the single-borehole method with the aid of the CT2 ultrasonic surrounding rock crack detector (Figure 3a). Considering the serious overall roadway damage, test boreholes were arranged in the full section of the tested roadway (Figure 3b). Boreholes 1#–5# were located at the left rib, the left 45° shoulder corner, the midpoint of the roof, the right 45° shoulder corner, and the right rib of the roadway, respectively. Since sound waves propagate more slowly in the fracture zone than in the original rock mass, the wave velocity fluctuated obviously at the periphery of the loose circle. Hence, the abrupt change point of the sound velocity was taken as the boundary of the loose circle. Figure 3c shows the relationship between the wave velocity and the borehole depth. It can be seen that with the increase in the borehole depth, the wave velocity curves of the five boreholes rose gradually, then reached their peaks at the critical points, and finally tended to stabilize. The test results show that the average sizes of the loose circle corresponding to boreholes 1#–5# were 3.0 m, 2.2 m, 1.8 m, 2.5 m, and 2.9 m, respectively. The large sizes of the loose circle at the roadway left rib (borehole 1#) and the right shoulder corner (borehole 4#) are indicative of serious breakage and internal crack development in the surrounding rock at these two positions. Therefore, the real range of the loose circle obtained in this test was about 3.0 m, and it was difficult to effectively control the deformation of the roadway surrounding rock with merely the shed support.

3. UDEC-Based Numerical Simulation on Discrete Element

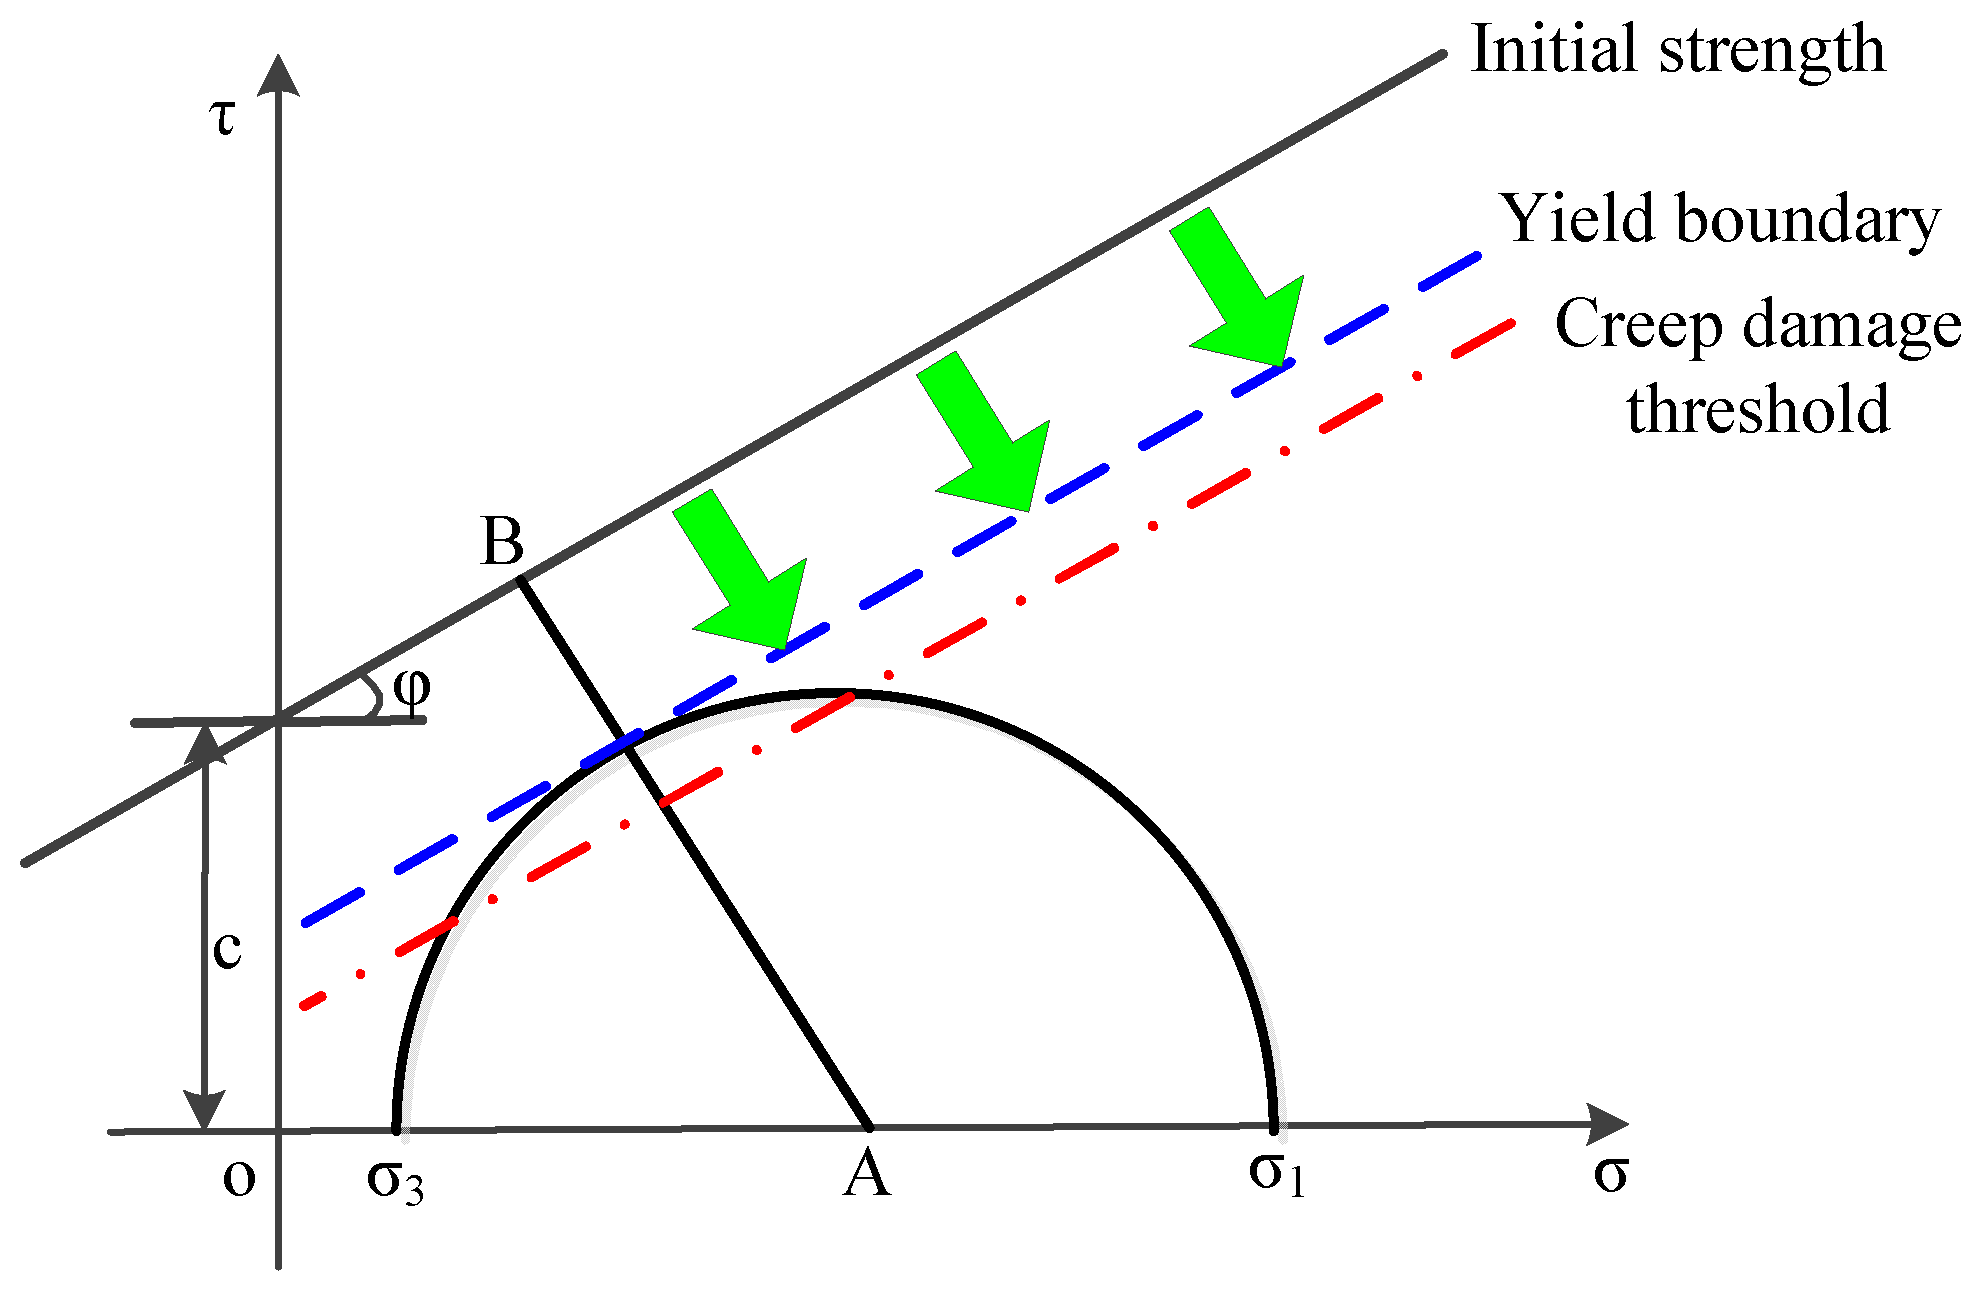
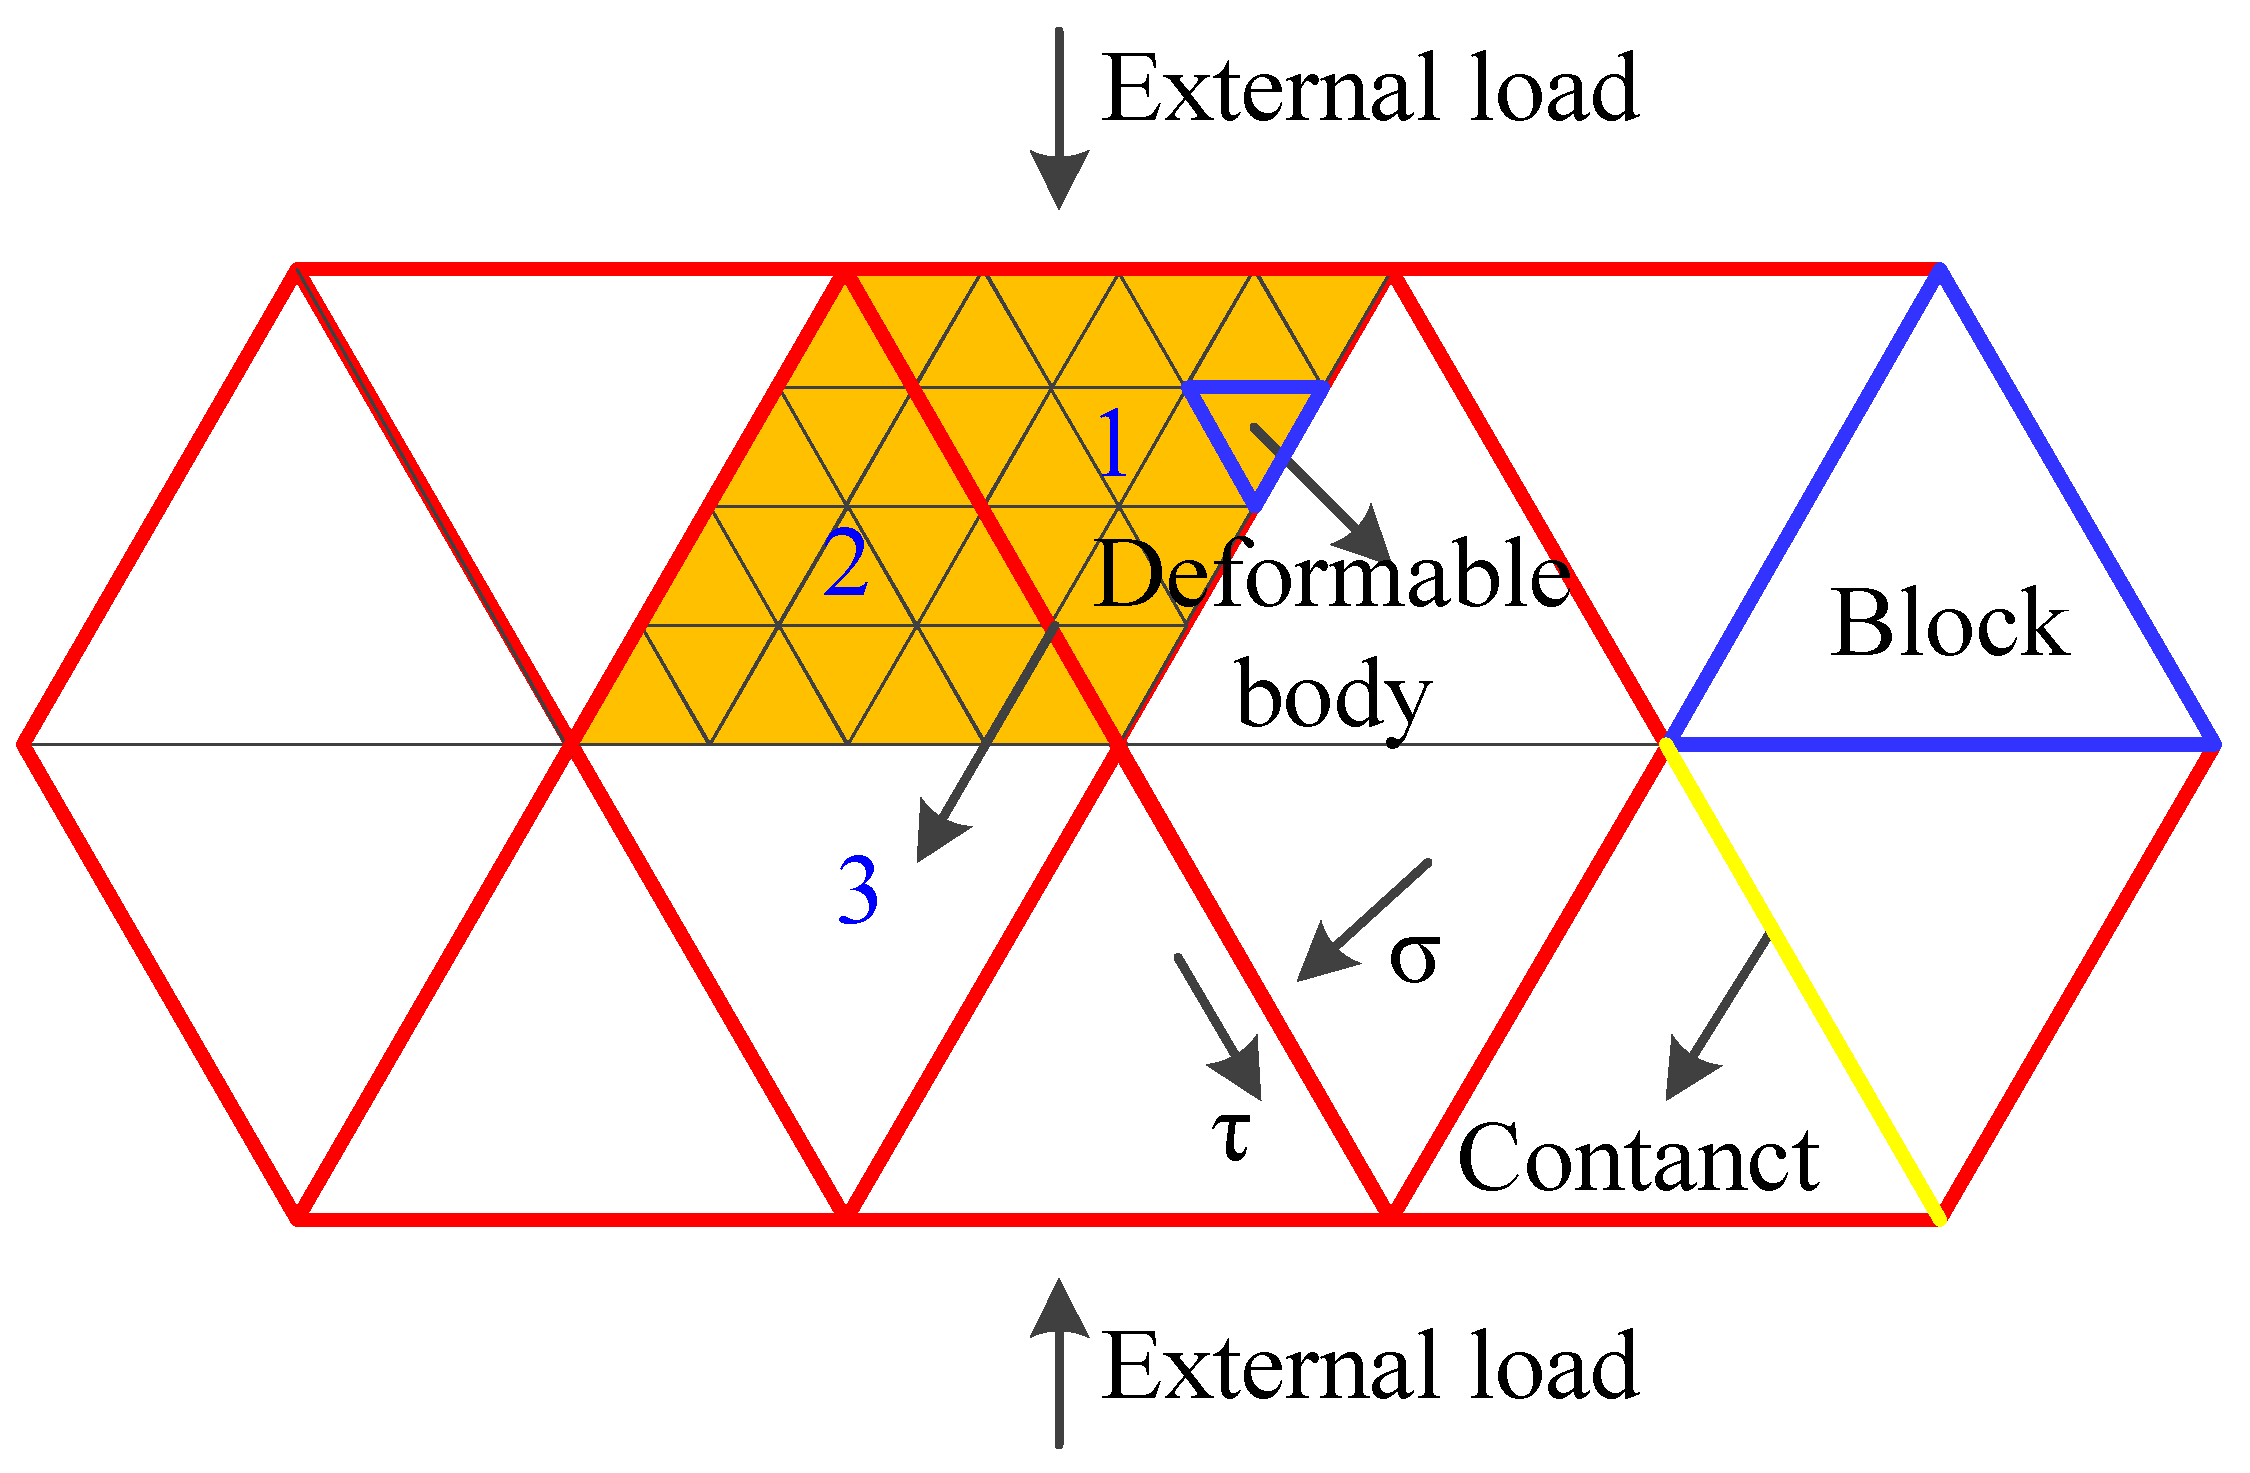
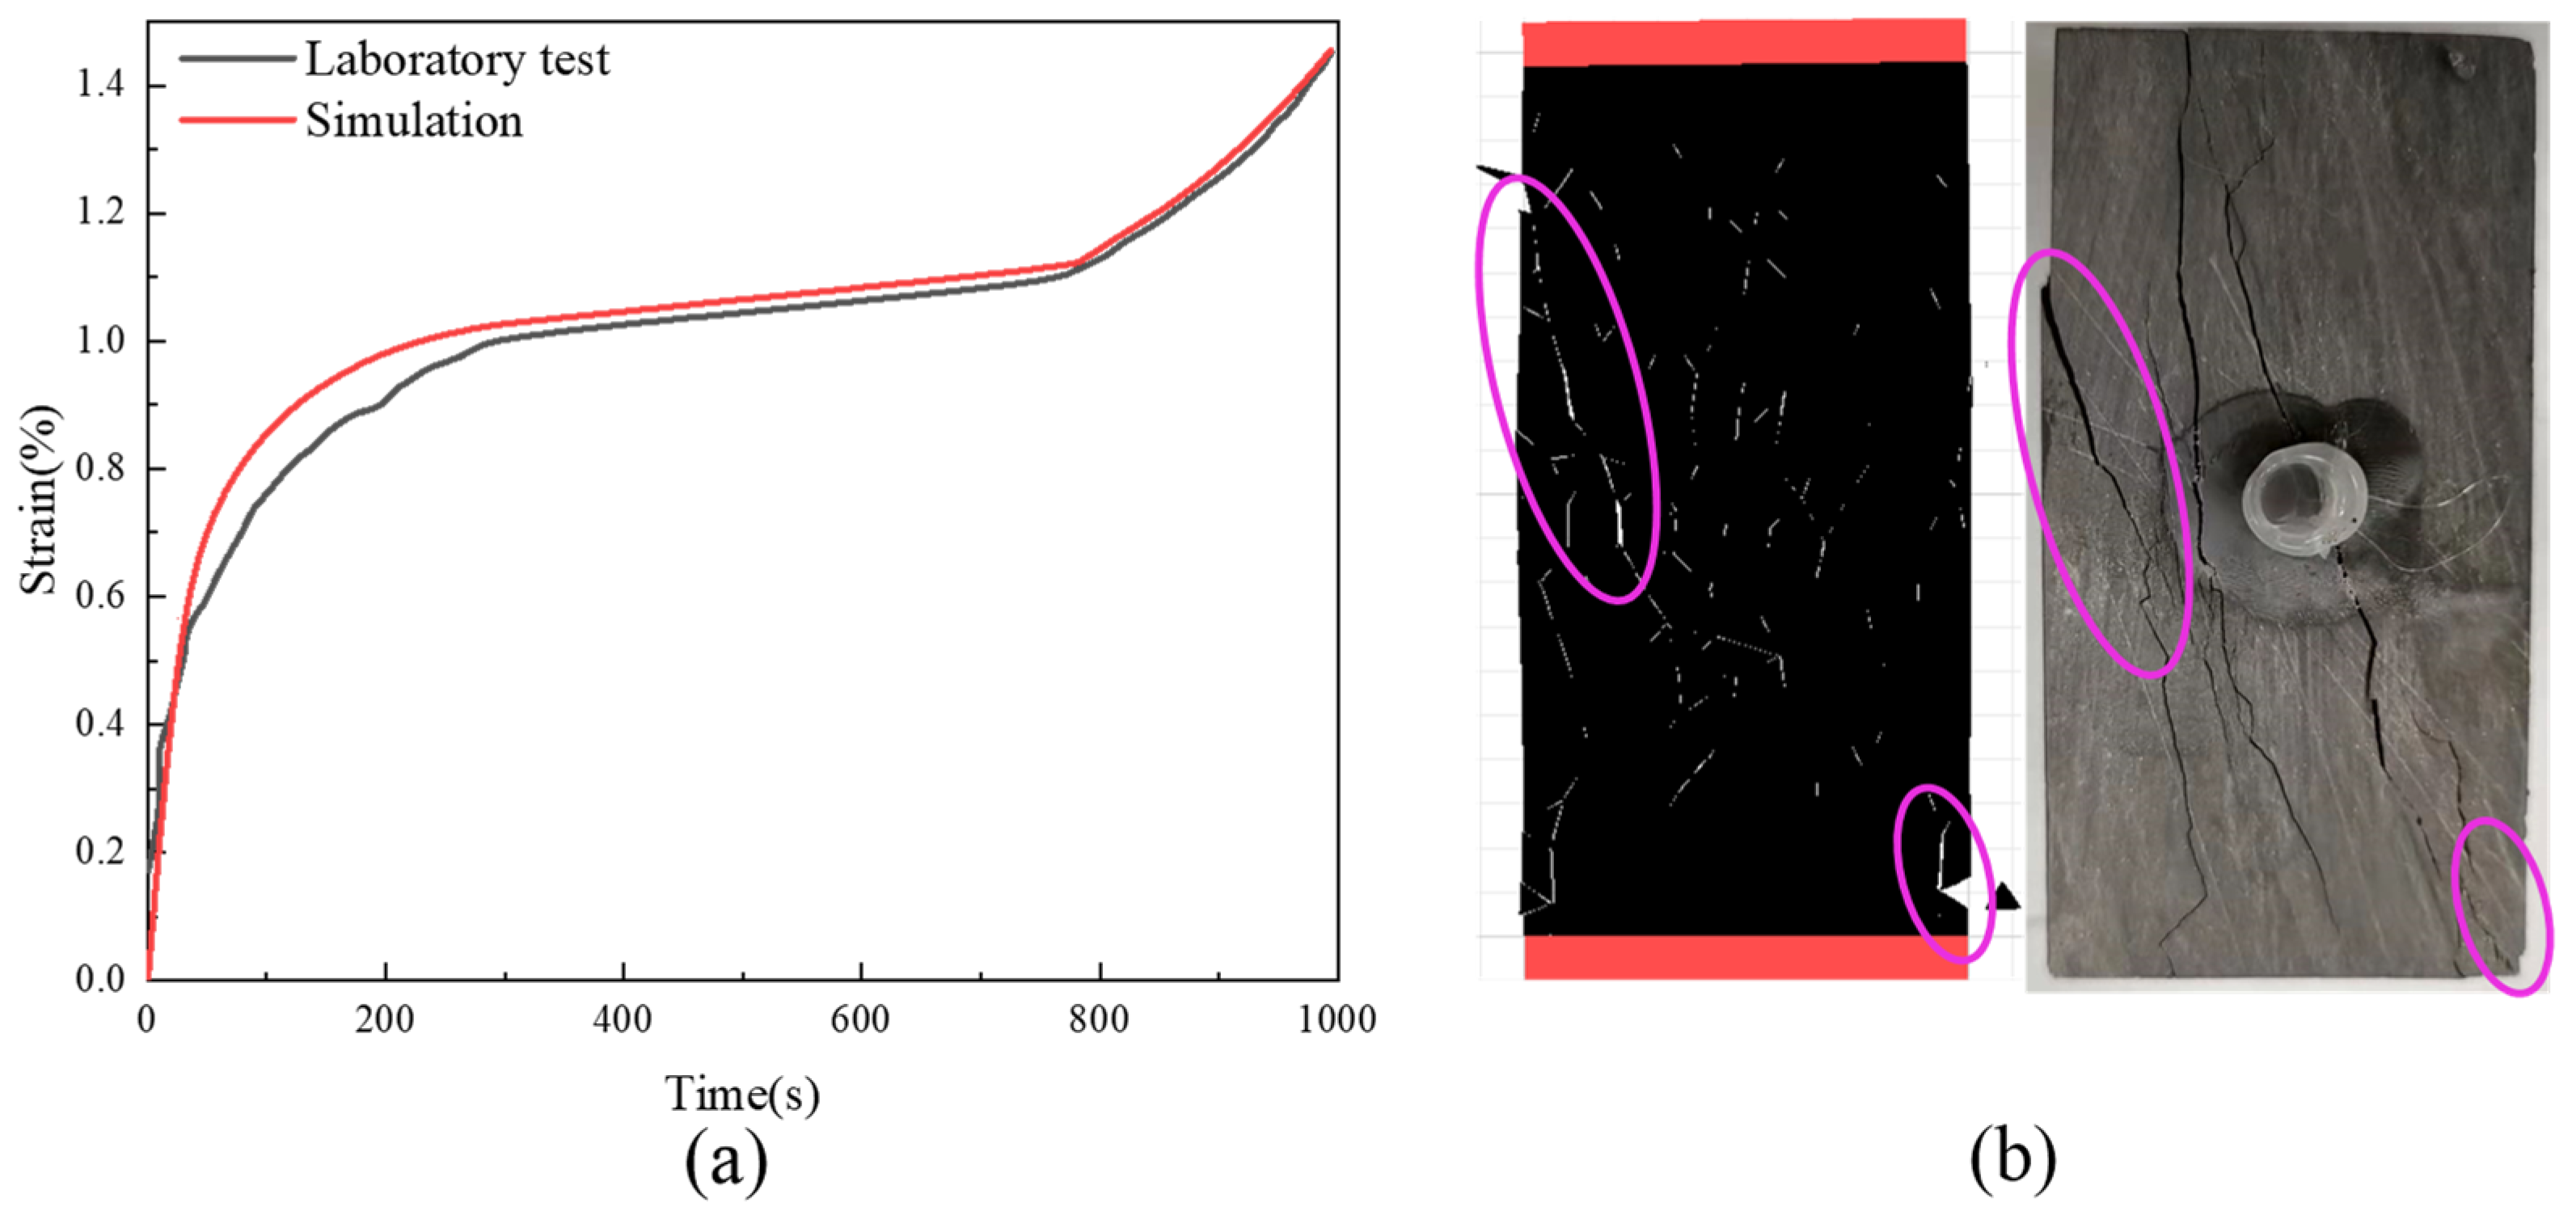
3.1. Rheological Model Based on Strength Attenuation of Contact Face

In the discrete element software Universal Distinct Element Code (UDEC), the deformation and damage of a rock block are jointly controlled by the block and the contact surface. UDEC merely provides a rheological model for the block, yet fails to offer a rheological model for the contact surface [22]. Based on the GBM-TtoF creep model developed by Wang et al. [23], in this study, a rheological model based on the strength attenuation of the contact surface was established. The ideas of these two models are basically consistent. That is, the relationship between the block strength variation with time is established first and then converted into the strength attenuation of the contact surface through the coefficient. A schematic diagram of the block strength attenuation of the two models is illustrated in Figure 4. The models assume that the crack damage threshold is equal to the rheological damage threshold. By lowering the position of the strength line, rock damage under a static load that is lower than the ultimate strength is described. The ultimate strength of rock is the distance of AB:
σ A B = c cot φ + 1 2 σ 1 + σ 3 sin φ
where c is the cohesion of rock; φ is the internal friction angle of rock; and σ 1 and σ 3 are the maximum and minimum principal stresses, respectively.
Through rheological tests, Aydan and Nawrocki disclosed that the time dependence of the cohesion is much stronger than that of the internal friction angle [24]. Therefore, when the internal friction angle is ignored, the time-dependent change in the strength line position can be transformed into the time-dependent attenuation of the cohesion.
According to the Mohr–Coulomb criterion, the maximum principal stress is:
σ 1 = 1 + sin φ 1 sin φ σ 3 + 2 c × cos φ 1 sin φ
For uniaxial compression, σ 3 is 0, and the uniaxial compressive strength of rock can be expressed as:
σ u c s = 2 c × cos φ 1 sin φ
where σ u c s is the short-term strength of rock.
Since the time-dependent change in the strength depends on the time-dependent change in cohesion, the long-term strength of rock σ l can be expressed as:
σ l = 2 c l × cos φ 1 sin φ
where c l is the rock cohesion under long-term strength.
Aydan proposed a relationship between the long-term strength σ l and the short-term strength σ u c s for rocks [25]:
σ l = σ u c s 1 F ln t / t 0
where F is an empirical constant; t is the rheological time; and t0 is the test time for short-term strength.
Equation (4) gives the relationship between the strength and the time. By substituting Equations (3) and (4) into Equation (5), the relationship between the cohesion and the time can be obtained:
c l = c 1 F ln t / t 0
Hence, the cohesion can be regarded as a function of time, and Equation (6) can be rewritten as [26]:
c t = c 1 F ln t / t 0
The law of the time-dependent attenuation of the block strength can be obtained according to Equation (7) and the rheological damage threshold:
c t = c 1 F ln t / t 0   σ 1 > σ d   c σ 1 σ d
c j t = c j 1 F ln t / t 0 × K σ 1 > σ d   c j     σ 1 σ d
The strength attenuation of blocks can be transformed into the strength attenuation of the contact surface through the conversion coefficient K. The conversion coefficient of the GBM-TtoF creep model is the defined damage coefficient, but the model in this study defines the conversion coefficient K based on the crack static fatigue failure mechanism [27] and software characteristics. The mechanism of the strength attenuation of the contact surface is illustrated in Figure 5. The contact surface between blocks 1 and 2 is called contact surface 3. Since the strength attenuation of contact surface 3 is jointly controlled by the strength attenuation of blocks 1 and 2, the strengths of the blocks can be applied to the strength of the contact surface through strength conversion. In fact, many deformable bodies exist in a block, and they also follow the law of strength attenuation. The stress states of deformable bodies in the block differed as a result of stress concentration. Therefore, we could monitor the stress states of deformable bodies inside the block using the FISH function and record the number of deformable bodies exceeding the rheological damage threshold; afterwards, through dividing this number by the total number of deformable bodies inside the block, the conversion coefficient K was obtained:
K = N d 1 + N d 2 N 1 + N 2
where N d 1 and N d 2 are the numbers of deformable bodies exceeding the rheological damage threshold in blocks 1 and 2, respectively; N 1 and N 2 are the total numbers of deformable bodies in blocks 1 and 2, respectively. Since the stress states of deformable bodies change constantly, the K value varied with time.
The empirical constant F in the attenuation mechanism of the contact surface (Equation (9)) was to be determined using laboratory tests. According to the laboratory tests, the long-term strength and short-term strengths of sandy mudstone were 10.8 MPa and 12.1 MPa, respectively; the time of accelerated rheology was 28,500 s; and the time of the uniaxial compression test was 120 s. The data are substituted into Equation (5):
F = 1 σ l / σ u c s ln t / t 0 = 1 0.893 5.47 = 0.0196
Aydan disclosed that for various types of rock, the empirical constant F usually ranges from 0.0186 to 0.0583 [25]. The F value obtained in this study was within such a range, indicating the reasonability of the data. Therefore, the strength attenuation relationship of the contact surface of the researched object is:
c j t = c j 1 0.0196 ln t / 120 × K σ 1 > σ d   c j         σ 1 σ d

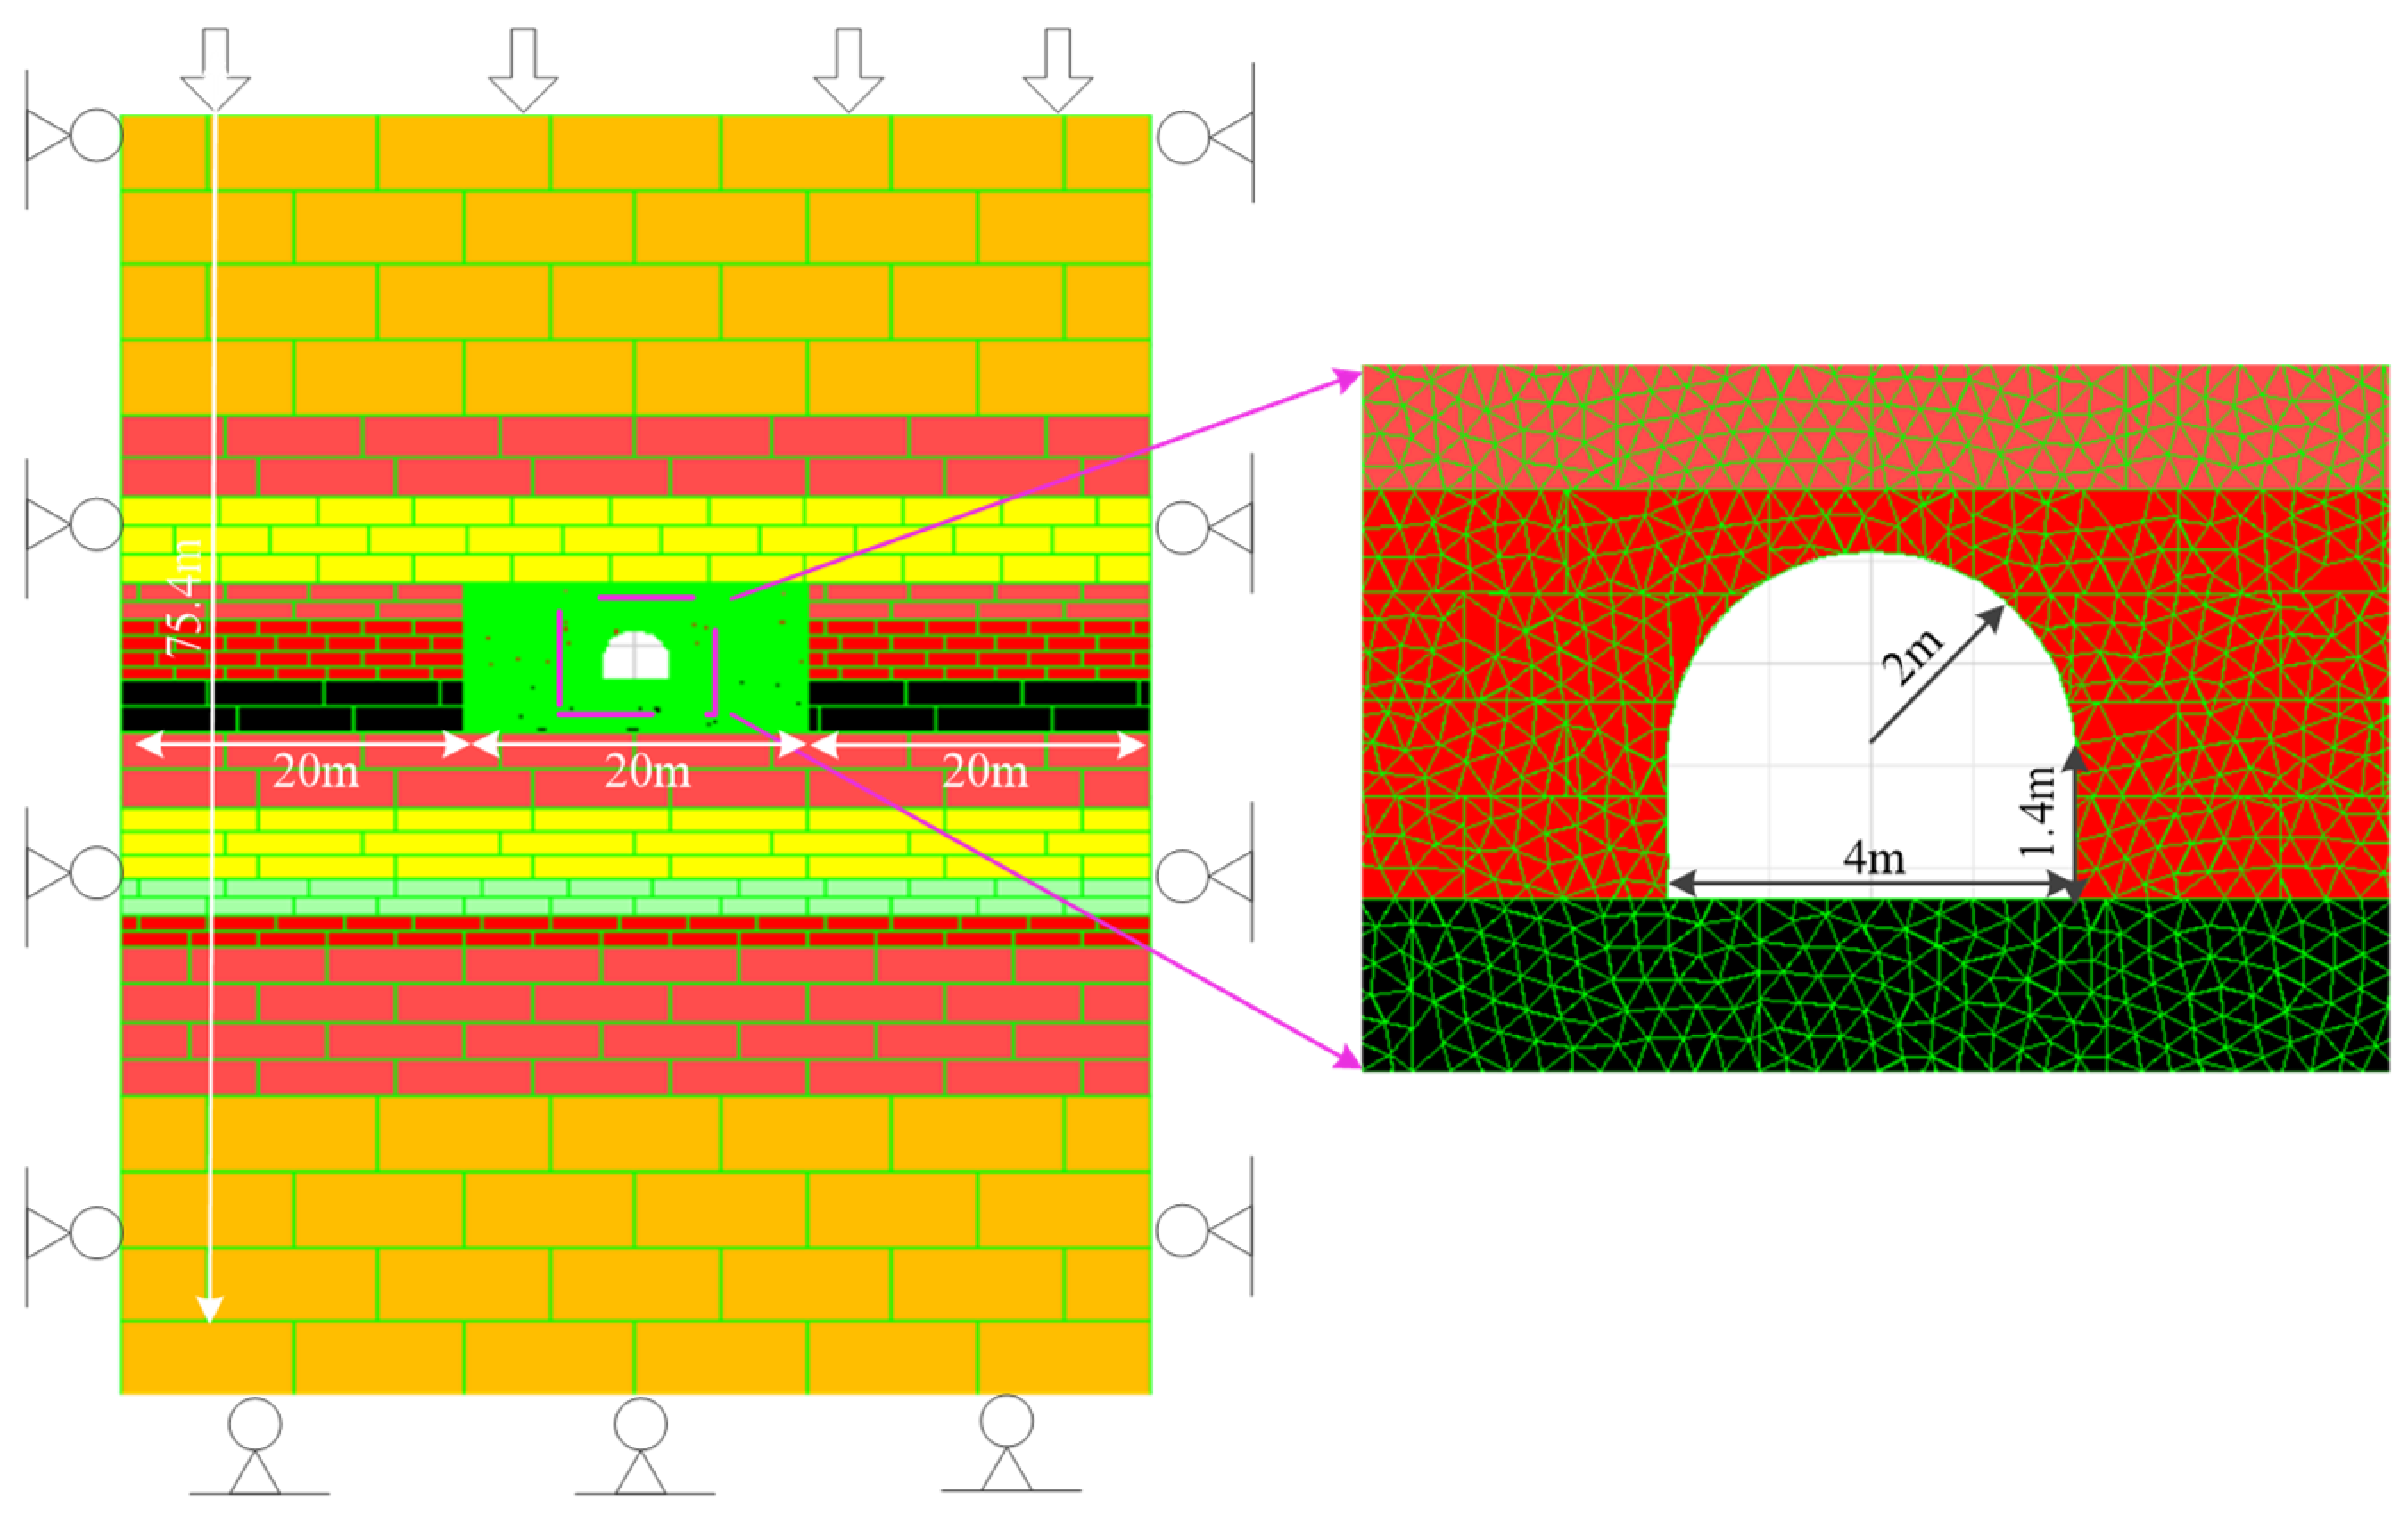
3.2. Model Establishment and Parameter Calibration

The numerical calculation engineering model, which is established based on the lithology and rock strata thickness in the geological histogram, involves five types of rocks, i.e., fine sandstone, medium-grained sandstone, sandy mudstone, mudstone, and coal. Before the model’s establishment, the parameters of each type of rock were calibrated based on the parameters of laboratory uniaxial compression and uniaxial rheological tests.
Since the roadway was arranged in sandy mudstone, sandy mudstone was subject to long-term rheological parameter calibration while other rock strata only required short-time parameter calibration. The model was established using the UDEC Trigon method. For the method of short-term parameter calibration, one can refer to Gao et al. [28] and Wu et al. [29]. Table 1 gives the calibrated short-term parameters of the blocks and joints of other rock strata. Figure 6 contrasts the simulation curves with the laboratory test curves of other rock strata. Table 2 compares the errors between the calibrated parameters and target parameters of other strata. According to the curves and statistical data in the table, the parameters were well matched, with the errors of both elastic modulus and compressive strength being within 10%.
During rheological parameter calibration, the block used the CVISC rheological model, and the contact surface used the strength attenuation model. The basic calibration steps included: the parameter calibration of single blocks, the parameter combined calibration of the contact surface block, and the completion of parameter calibration. Table 3 shows the calibrated rheological parameters of sandy mudstone. Figure 7 contrasts the rheological simulation and test results of sandy mudstone. It can be found that these two results share basically the same macroscopic crack distribution characteristics. The simulation results are more accurate in capturing the fracturing damage at the upper left and lower right corners of the sample, and they well describe the three stages of the rheology of sandy mudstone. The simulation results of accelerated rheology time and final deformation are basically consistent with the test results.
The above calibration results show that the calibrated parameters can be used in the engineering-scale numerical calculation model to study the time-dependent damage of on-site roadways.
Based on the above calibrated rock stratum parameters and the geological conditions of the mine, a model of the II5 Rail Rise in Zhuxianzhuang Coal Mine was established. The model is 60 m long, 75.4 m high, and the roadway cross-section is in the shape of a semicircular arch (4.0 m × 3.4 m, wide and high) and straight walls (1.4 m high) (Figure 8). The models and parameters for each rock stratum were consistent with the calibrated values. To improve the calculation efficiency, triangular block division was carried out only in the area whose four sides were 8 m above the roof, 8 m below the floor, and 8 cm away from the left and right sides of the roadway center, respectively. The horizontal displacement constraint was set on the left and right boundaries of the model, and the vertical displacement constraint was set on the floor boundary of the model. A 20 m long area was reserved on the left and right sides of the model to avoid the boundary effect. A 1.885 MPa equivalent load of overlying strata was applied to the upper boundary of the model. Based on the roadway buried depth, the vertical stress was 15 MPa and the vertical stress gradient was 0.025 MPa/m. According to the recorded data, the lateral pressure coefficient of Zhuxianzhuang Coal Mine is 1.6. Therefore, the horizontal stress was 27.016 MPa and the horizontal stress gradient was 0.04 MPa/m in the model. The simulation procedure was as follows: (1) a model based on the geological histogram was established, and calibrated parameters were assigned to each rock stratum; (2) the initial state of gravity-induced ground stress was calculated; (3) the II5 Rail Rise was excavated and supported; (4) the parameters of the roadway support were changed. Finally, the deformation and crack evolution of the roadway surrounding rock under different support parameters were analyzed.

4. Numerical Simulation of Damage Mechanism under the Original Support of II5 Rail Rise

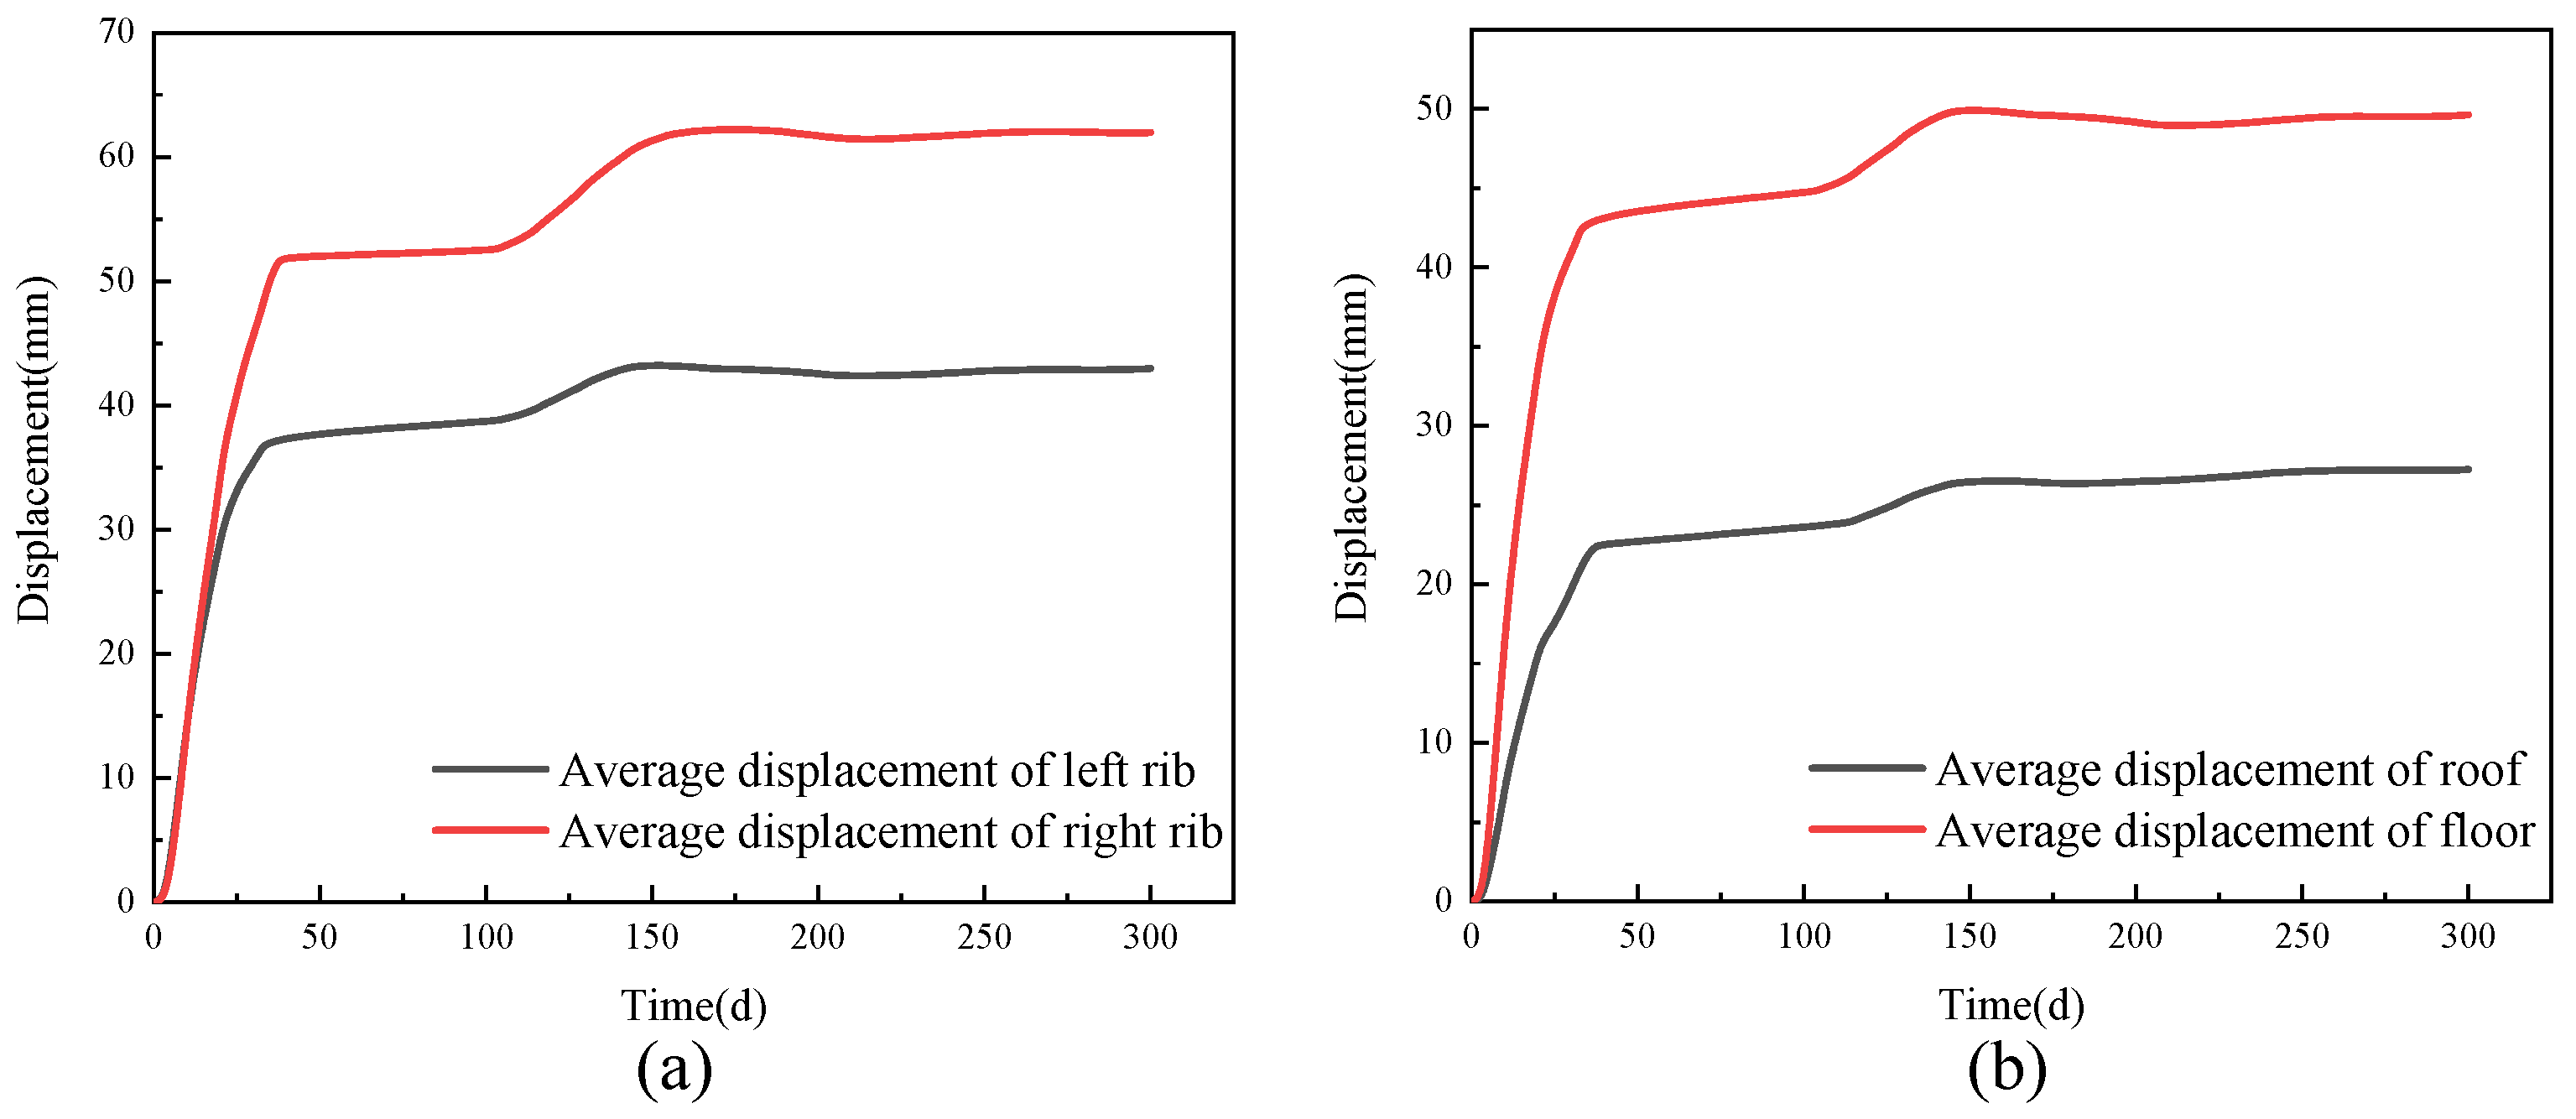
4.1. Displacement Evolution Law of Roadway Surrounding Rock

To analyze the deformation characteristics of the roadway surrounding rock, the horizontal displacement and vertical displacement of the roadway were analyzed through the displacement nephogram and measuring point data. With reference to the analysis results, twelve measuring points were set on the roadway surface to measure the displacement of the ribs, the roof, and the floor. The locations of the measuring points are given in Figure 9.
Figure 10 shows the horizontal displacement nephograms of the roadway under the original support. After the completion of the roadway excavation (the 1st day), the horizontal displacement was small, and the displacement of two ribs was within 2 mm. Within a short time (the 5th day), the roadway cross-section displayed overall shrinkage, with the displacement being within 20 mm. The two ribs started to present asymmetric deformation, and the displacements of the left and right ribs were 17 mm and 13 mm, respectively. On the 50th day, the roadway cross-section kept shrinking overall, and the asymmetric deformation of the two ribs further expanded. The displacement of most of the left rib was 90 mm, the displacement of the bulge position at the bottom corner was up to 130 mm, and the displacement of the right rib was 70 mm. From the 50th day to the 250th day, the two ribs continued to deform, and the influence area of roadway deformation continued to expand. On the 250th day, the maximum displacement of the left rib reached 410 mm, while that of the right rib reached 250 mm. On the 300th day, the overall displacements of the left and right ribs reached 447 mm and 341 mm, respectively, displaying serious roadway section shrinkage and deformation.
Figure 11 gives the average deformation amount and rate of the two ribs. The average deformation data of the two ribs were taken from the average values of the measured data. The displacement of the left rib was significantly greater than that of the right rib, showing asymmetric deformation. Both ribs presented obvious rheological characteristics. The deformation rate was derived from the displacement curve. The deformation rate of the left rib was significantly greater than that of the right rib. The maximum deformation rates of the left and right ribs appeared on the 18th day: 5.5 mm/d and 5.0 mm/d, respectively. In the secondary deformation stage, the deformation rate increased in fluctuations. With the displacement rate of the left rib as an example, there were four obvious increases: on the 135th day (1.8 mm/d), the 197th day (2.1 mm/d), the 237th day (2.5 mm/d), and the 300th day (3.3 mm/d), respectively, and this displacement tended to keep rising. The time intervals of the four accelerations were 62 days, 40 days, and 63 days, respectively (average value: 55 days); the deformation accelerated by 16.7%, 19.0%, and 28.6%, respectively (average value: 21.4%). These statistics indicate that in the absence of further control measures, the deformation of the roadway surrounding rock accelerated by 21.4% every 55 days on average after it entered into the accelerated deformation stage.

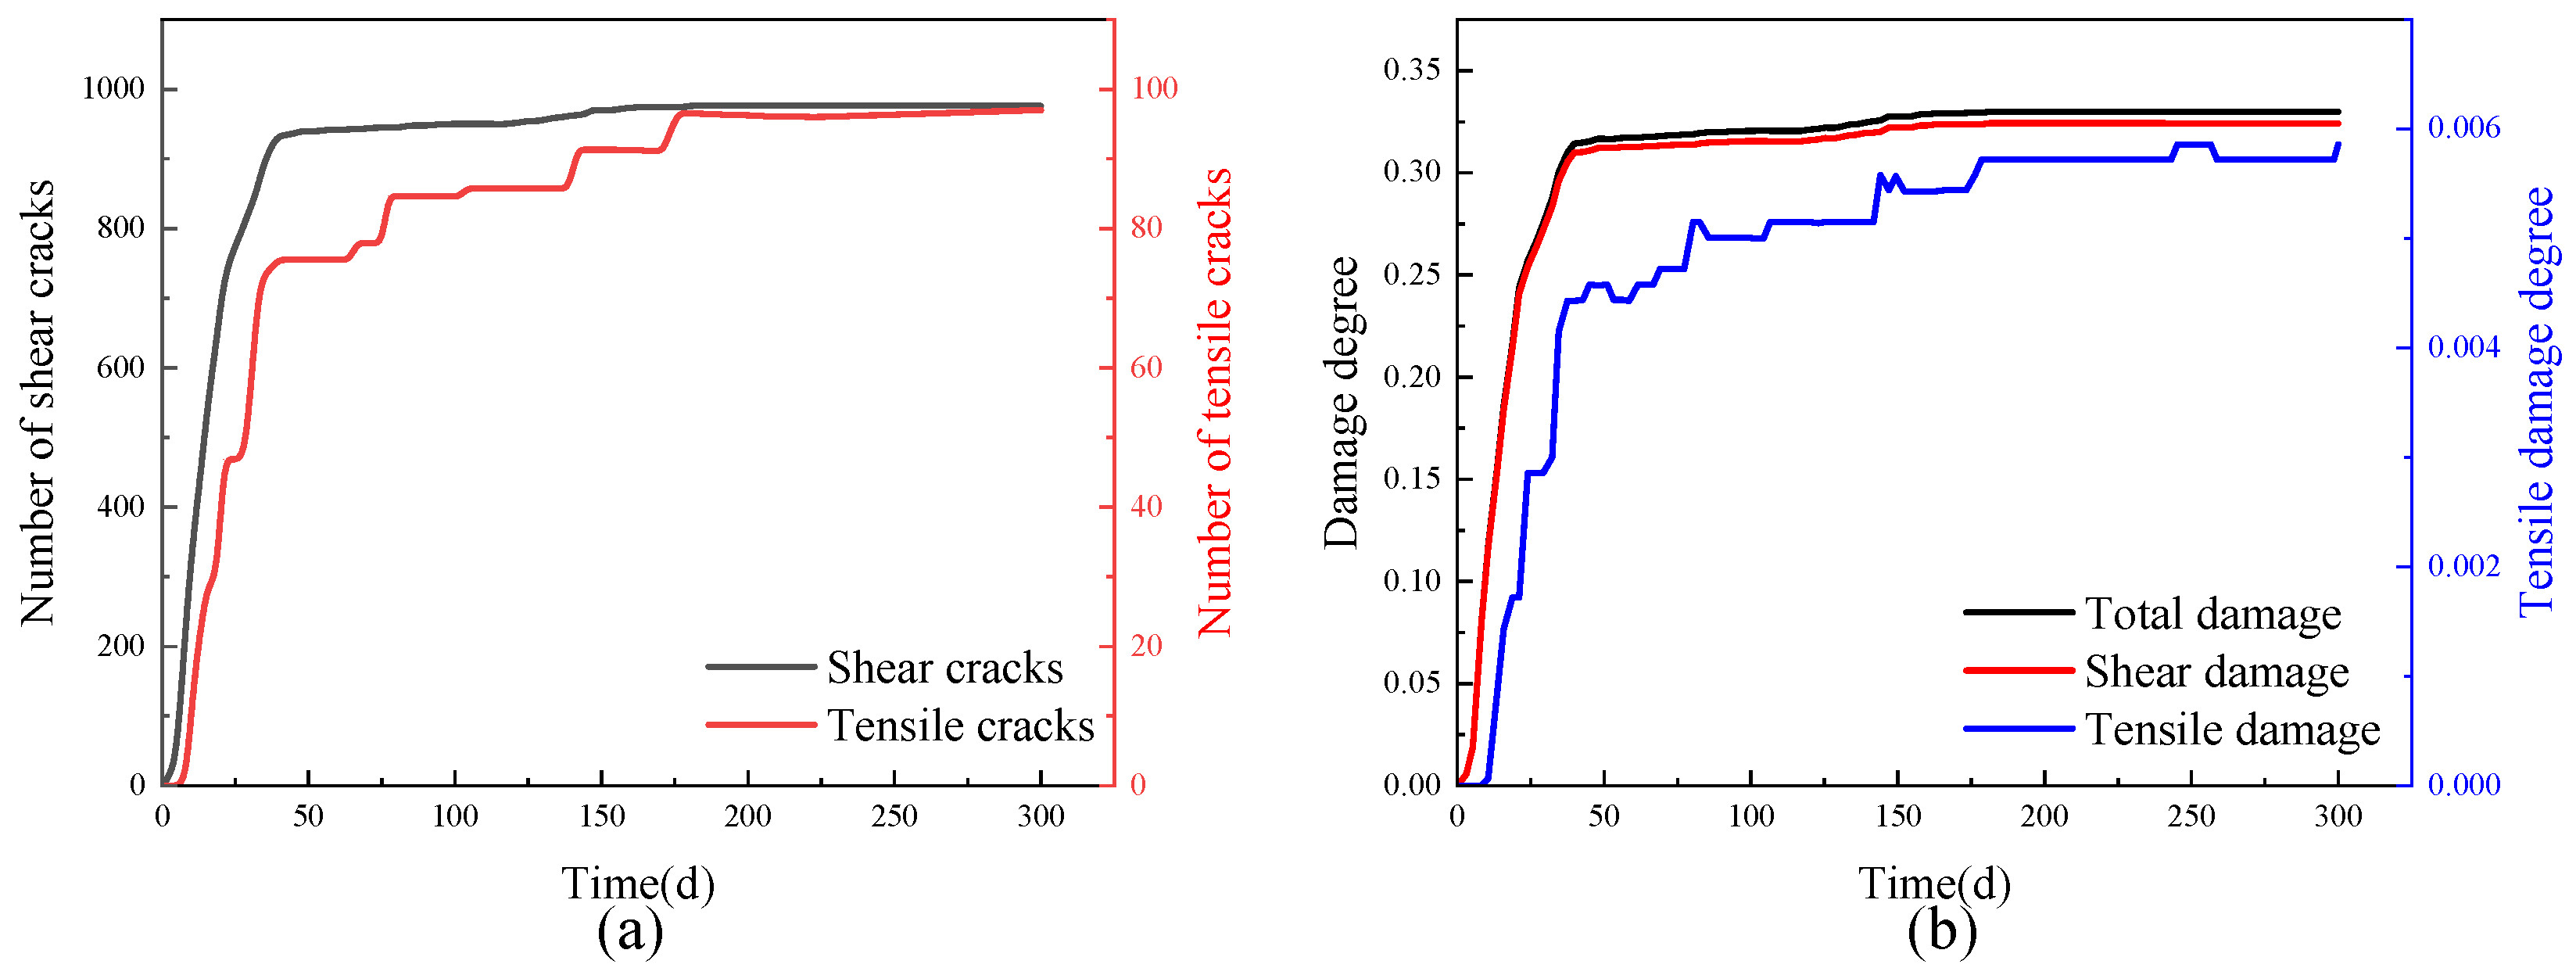
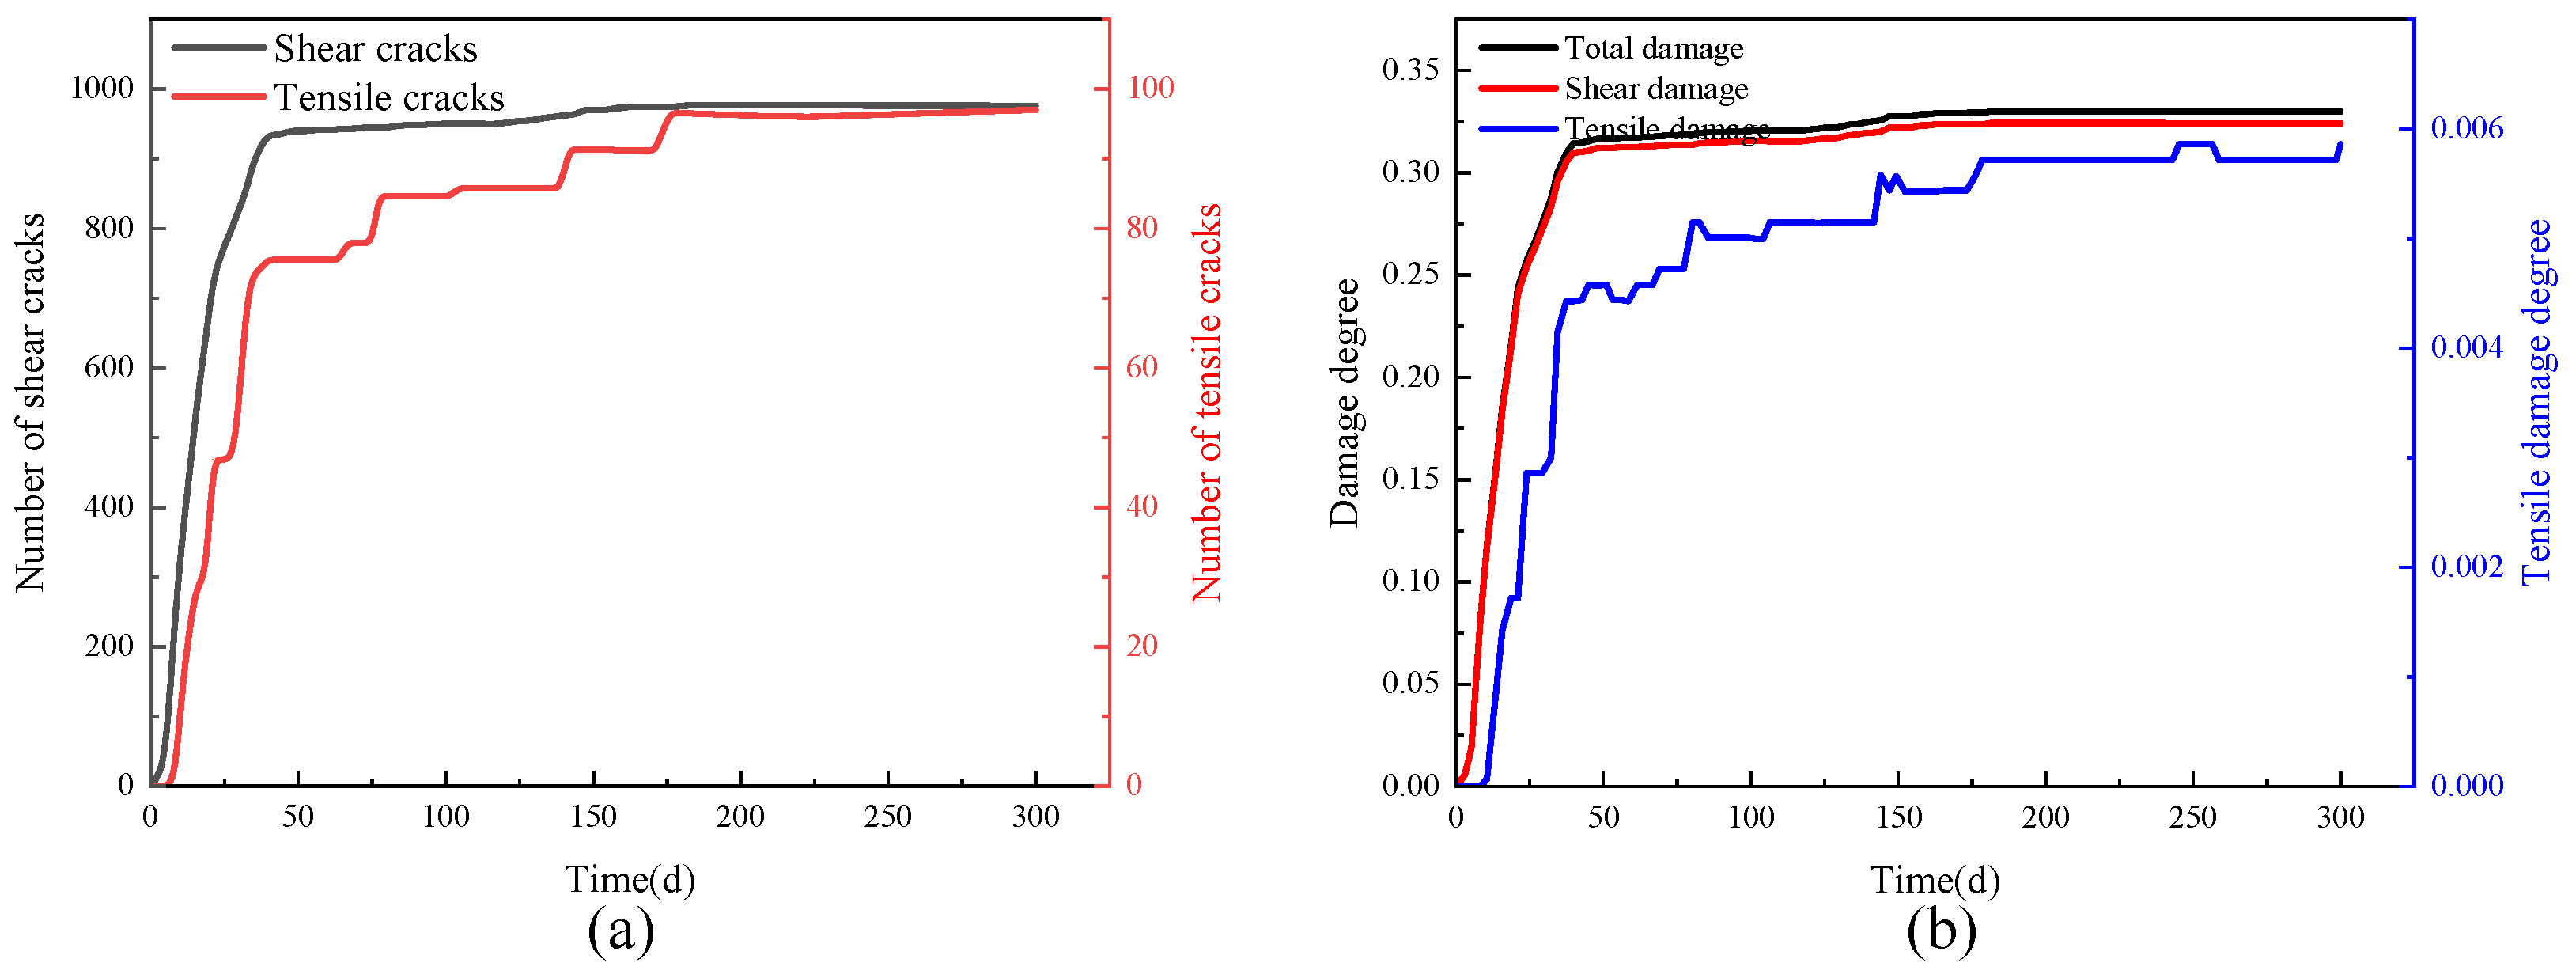
4.2. Crack Evolution Law of Roadway Surrounding Rock

According to Figure 12, in the initial stage (e.g., on the 5th day), there were few cracks around the roadway surrounding rock, with merely shear cracks distributed on the surrounding rock surface, and the cracks at the roof and shoulder corners were more significant than those at the roadway ribs and floor. These cracks were mainly caused by the instantaneous deformation of the roadway. On the 50th day, shallow cracks in the ribs extended to the deep area; tensile cracks appeared on the floor; and the roadway section shrank overall, accompanied by rib bulge on the fault side (left rib) and floor heave. With the passage of time, the total number of cracks and the number of tensile cracks at the roadway left rib, the floor, and the shoulder corner increased continuously. On the 200th day, the deep cracks began to expand, and the left rib had been transformed from a straight wall shape to an arc shape. On the 300th day, the roadway presented obvious asymmetric damage. Cracks at the left and right ribs extended to a depth of 3 m and 2.5 m into the ribs, respectively. Severe tensile damage occurred at the roof on the left side where the blocks extruded upward, and the floor on the left side deformed more significantly than that on the right side. Massive tensile cracks were also distributed at the roof shoulder corners, resulting in slight separation at the junction of sandy mudstone and fine sandstone, the stripping of blocks in the middle of the roof, as well as the protruding and falling of blocks at the shoulder corners. Figure 13 contrasts the on-site damage characteristics with the simulated damage characteristics of the roadway. Clearly, these two are basically consistent.
Figure 14 shows the evolutions of the number of cracks and damage degree over time in the monitored area. In the simulation, the total length of the contact surface of the surrounding rock in the monitored area was counted using FISH. The shear crack length and tensile crack length generated during the rheological process were monitored, and the damage degree of the test sample was defined by the ratio of the crack length to the total length of the contact surface. The development of shear cracks, the total damage, and the shear damage displayed obvious rheological characteristics. With reference to the development of shear cracks and tensile cracks, the whole process can be divided into three stages. In Stage I (0–40th day), i.e., the decelerated deformation stage of rheology, massive shear cracks were generated. The damage of the surrounding rock was mainly caused by shear damage. The shear damage curve and total damage curve coincided greatly. In Stage II (40th–125th day), i.e., the constant-rate deformation stage of rheology, shear cracks increased at a constant rate first; then, as the cracks expanded to the deep area, the shear cracks grew faster, and the number and damage of tensile cracks jumped. In Stage III (125th–300th day), i.e., the accelerated deformation stage of rheology, the number of shear cracks and the corresponding damage continued to increase at basically the same rate as that in Stage II, and the number of tensile cracks and the corresponding damage rose notably, causing obvious roadway destruction. On the 300th day, the number of cracks totaled 2002, including 1765 shear cracks (accounting for 88.2%) and 237 tensile cracks (accounting for 11.8%). It can be seen that the cracks in the surrounding rock were mainly shear ones. The cumulative number of shear cracks in Stages I and II is 1331, accounting for 75.4% of the total number of shear cracks. In Stage III, the number of new shear cracks is 434, accounting for 24.6% of the total number of shear cracks. In Stages I and II, the cumulative number of tensile cracks was 83, accounting for 35% of the total number of tensile cracks. In Stage III, 154 new tensile cracks occurred, accounting for 65% of the total number of tensile cracks. Shear cracks mainly appeared before Stage III, while tensile cracks mainly grew in Stage III.

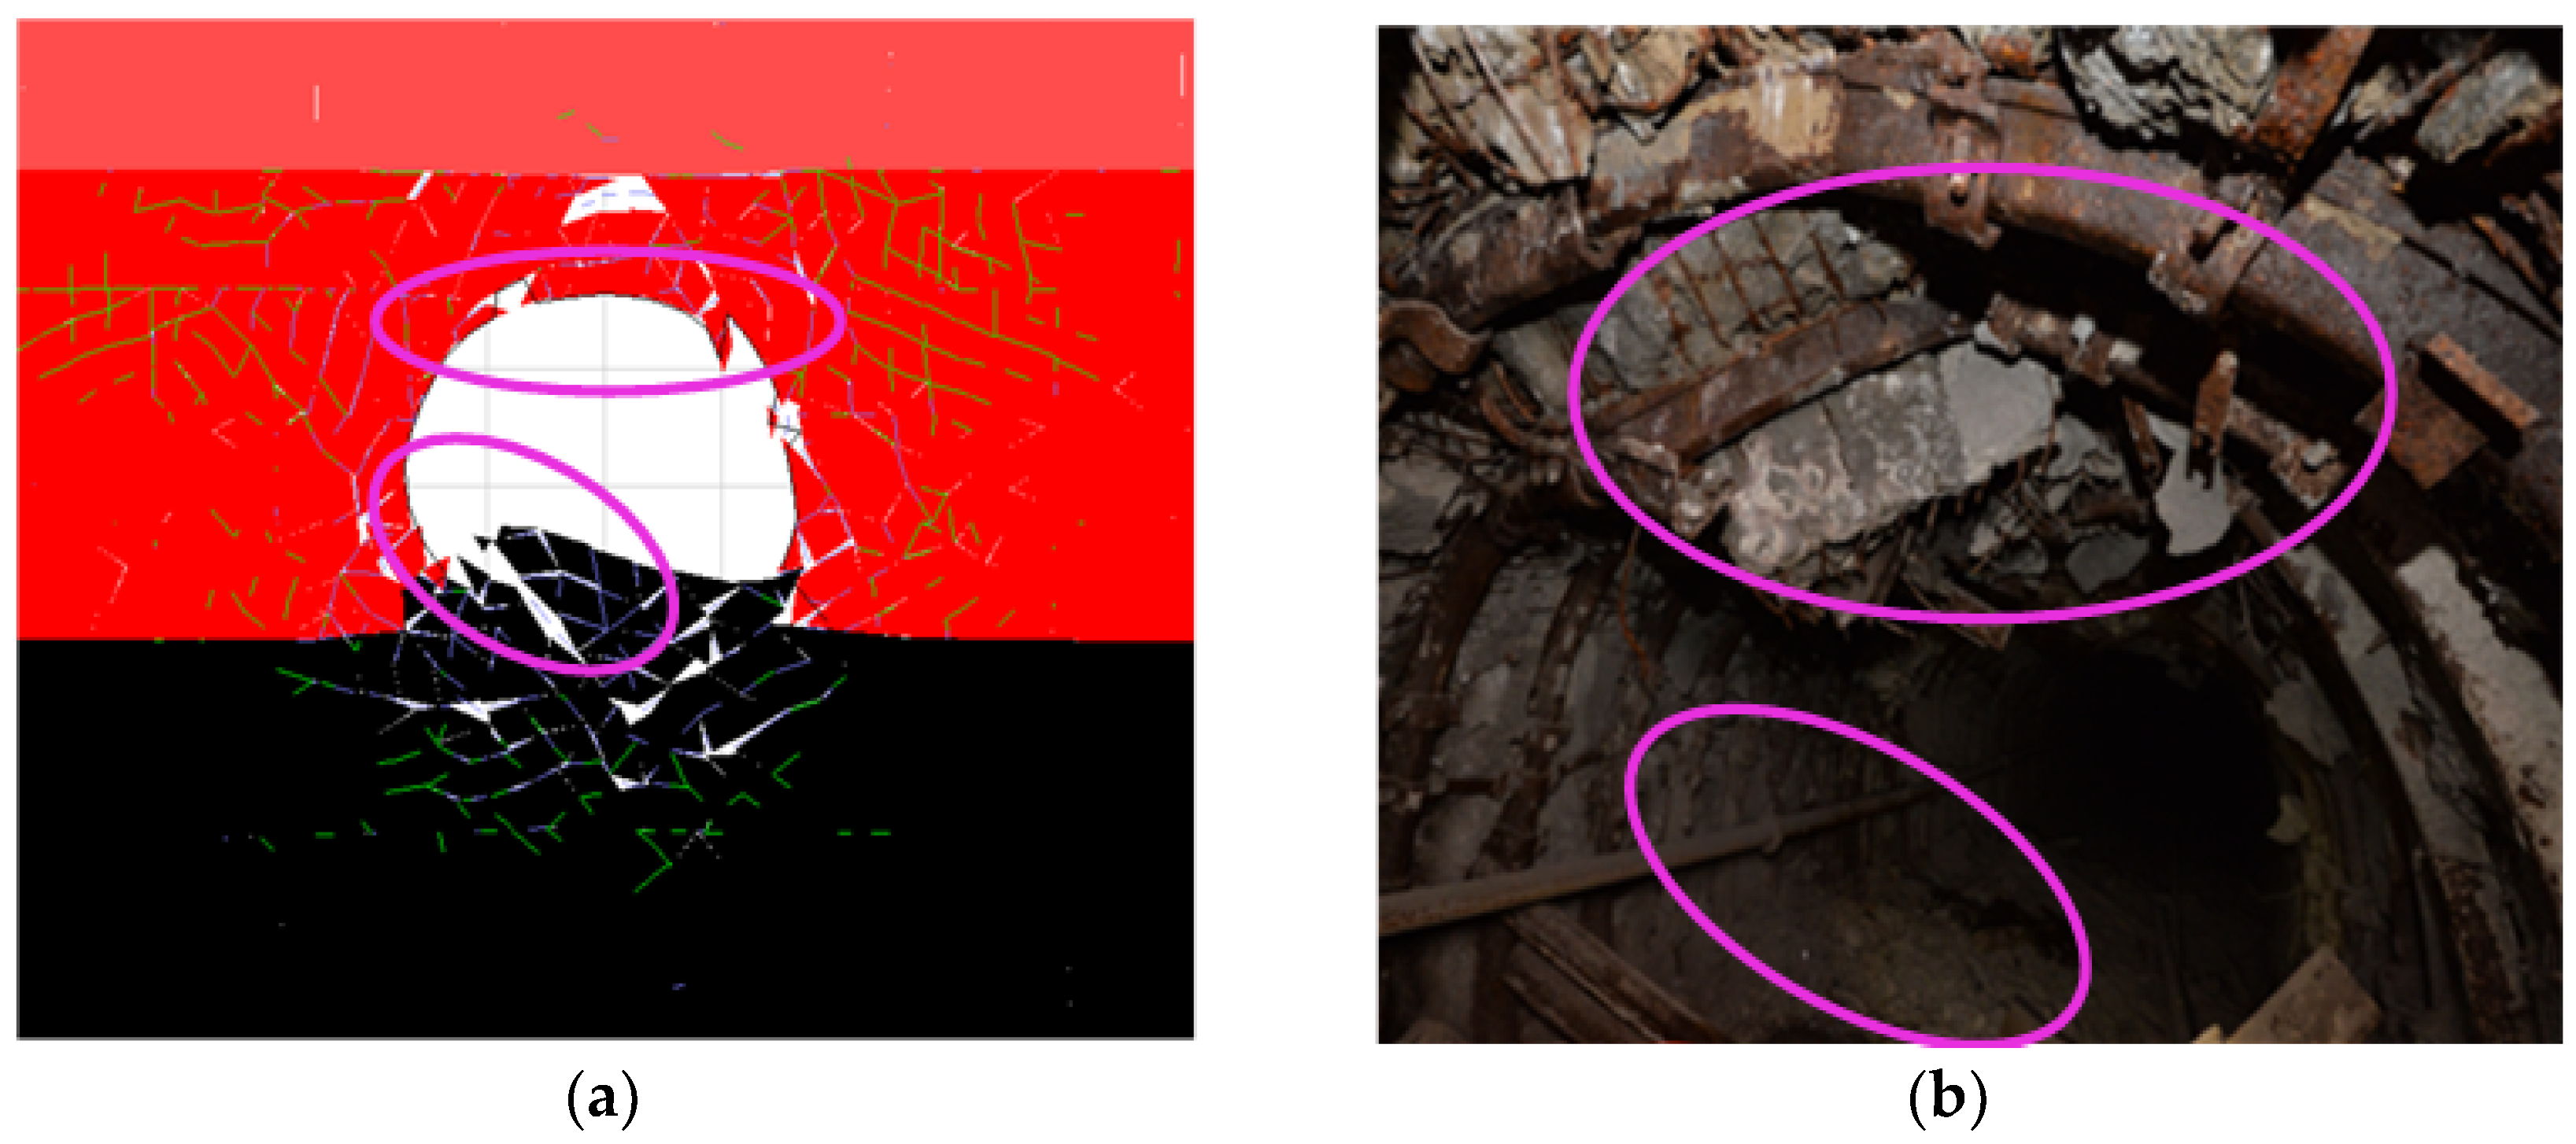
4.3. Damage Mechanism of II5 Rail Rise

The II5 Rail Rise has stayed in a high stress environment for a long time, and the roadway surrounding rock has engineering soft-rock properties. As described in the on-site observation and numerical simulation, the cracks in the roadway surrounding rock were relatively developed, and the deformation process of the roadway belonged to secondary deformation. The primary deformation was mild plastic deformation, while the secondary deformation was severe rheological deformation. The whole deformation process was characterized by a high rate, long time, large deformation, and asymmetry. According to the overall damage characteristics of the roadway, shear cracks caused the overall shrinkage of the roadway section, the bulging deformation of ribs, and the slight floor heave of the floor, while tensile cracks further broke the surrounding rock and led to severe roadway deformation. The expansion and development of shallow cracks caused the primary plastic deformation of the roadway, and the delayed initiation of deep cracks caused the secondary rheological deformation. The deformation of the left rib could reach 700 mm. Despite the slight deformation of the right rib, the cracks were relatively developed within the range of 5 m, and there was a threat of further deformation. Before the rapid development of tensile cracks, the roadway deformed, but the surrounding rock remained relatively complete, and the roadway cross-section basically maintained the shape of straight walls and a semicircular arch. After the rapid increase in tensile cracks, the fragmentation of the surrounding rock increased, and the cross-sectional shape became a circular arc. The shed support, which belonged to passive support, could hardly effectively control the expansion of internal cracks in the surrounding rock. In the process of rheology, the strength of the rock weakened continuously, and the massive expansion of the internal cracks aggravated the roadway deformation, resulting in serious roadway damage and shed support failure.

5. Discussion

According to the above analysis, the deformation and damage of the II5 Rail Rise mainly resulted from high stress, low rock strength, and the continuous development of deep and shallow cracks. This conclusion is consistent with the research results in the literature [30]. They believe that the damage process of crack initiation, crack propagation, and rock separation in the surrounding rock develops gradually from the shallow to the deep, and ultimately leads to the instability of the surrounding rock. Furthermore, they proposed a combined support scheme of a “bolt-cable-mesh-steel ladder”. As the stress environment of the roadway hardly changes, the control technology shall be aimed at rock strength improvement and crack reduction. High-preload anchor bolts can well improve the rock strength and limit the development of internal cracks in the rock, and crack filling can improve the occurrence environment of the surrounding rock, raise the rock strength, and improve the stress state of the support body. For this roadway, a control technology of high-preload bolt + deep- and shallow-borehole crack filling was proposed. Its reinforcement principle is as follows: (1) The high-preload bolt support can inhibit the development of shallow cracks and improve the bearing capacity of the shallow surrounding rock. (2) The shallow-borehole low-pressure crack filling seals the shallow cracks as the slurry is thrust into or penetrates the cracks, further reducing the fragmentation degree of the shallow surrounding rock and cementing the surrounding rock surface into a stone body with high bearing capacity. This not only ensures the integrity and bearing capacity of the shallow surrounding rock, but also endows the broken surrounding rock with the ability to withstand high pressure. (3) The deep-borehole high-pressure crack filling in the deep surrounding rock enhances the permeability of the injected slurry in the deep surrounding rock and lowers the crack density of the deep surrounding rock, thus realizing the replacement between the slurry and the cracks. Finally, a homogeneous continuous high-strength reinforcement body is formed. The reinforcement body can provide effective anchor points for anchor bolts in the shallow surrounding rock and anchor cables in the deep surrounding rock, hence achieving active support and expanding the bearing range of the support system. Compared to the control technology proposed in the literature [30], this technology adds deep- and shallow-borehole crack filling, which has a stronger inhibitory effect on crack propagation.
Based on the above control ideas, anchor bolts were simulated using the Rockbolts element and anchor cables were simulated using the Cable element in the established engineering model. The surrounding rock control effect of the high-preload anchor bolt + deep- and shallow-borehole crack-filling control technology was briefly calculated and analyzed.
Figure 15a exhibits the average deformation of the two ribs of the controlled roadway. Although the displacement of the right rib was greater than that of the left rib, their deformations differed by merely 20 mm after stabilization. Both ribs experienced secondary deformation and displayed obvious rheological deformation properties during the secondary deformation. The amount and duration of the decelerated deformation of the right rib were greater than those of the left rib in the secondary deformation, but the final stabilized deformation amounts of both ribs were relatively small. Figure 15b presents the average deformation of the roof and floor of the controlled roadway. Although the roof and floor experienced secondary deformation, the deformation amounts were both less than 10 mm. The roof and floor entered the stabilized deformation period on the 150th day, during which the displacement rate fluctuated at around 0.01 mm/d, with slight surrounding rock deformation. After the roadway was controlled by high-preload bolt + deep and shallow crack filling, the displacement amount and rate of the roadway further decreased. This technology effectively restrains the rheology of the deep surrounding rock and ensures the long-term stability of the roadway. Different parts of the roadway completed the main deformation on around the 50th day. The deformation adjustment period was from the 50th day to the 150th day, and the stabilized deformation period started after the 150th day. The roadway deformation was limited, and no severe deformation trend was found on the 300th day.
As can be observed from Figure 16, in the initial stage, only a few shear cracks caused by instantaneous deformation appeared in the roadway surrounding rock. On the 300th day, the anchor bolts at the shoulder corners and the bottom corners of the ribs bent slightly without breakage. The ribs shared consistent damage characteristics, and only a few cracks were distributed on the roadway surface, while almost no cracks appeared in the deep surrounding rock. On the roadway floor, there were merely tensile cracks on the surface; the central block of the roof no longer moved, and the surrounding rock of the roof was relatively integrated.
As can be observed form Figure 17, on the 300th day, the total number of cracks in the surrounding rock was 1073, including 976 shear cracks (accounting for 91%) and 97 tensile cracks (accounting for 9%). Compared with those in the original support method, the total number of cracks decreased by 46.4%; the number of shear cracks fell by 44.7%; and the number of tensile cracks declined by 37%. In the primary deformation stage, the cumulative number of shear cracks was 950, accounting for 97% of the total number of shear cracks. In the secondary deformation stage, 26 new shear cracks appeared, accounting for 3% of the total number of shear cracks. The cumulative number of tensile cracks in the primary deformation stage was 86, accounting for 89% of the total number of tensile cracks, and 11 new tensile cracks occurred in the secondary deformation stage, accounting for 11% of the total number of tensile cracks. Both shear and tensile cracks mainly appeared in the primary deformation stage. According to the overall roadway damage characteristics, after the support optimization, the shear cracks exerted smaller damage to the roadway surrounding rock, while the tensile cracks did not cause bolt breakage or floor bulge due to their small number. In the primary deformation stage, the total damage was 31.5%, and it increased to 32.9% in the secondary deformation stage. It can be seen that the control technology of high-preload bolt + deep and shallow crack filling could well inhibit the shallow crack propagation and the rheological deformation of the deep surrounding rock and prevent secondary damage to the roadway.
Based on the reinforcement idea of this control technology, the following support scheme was adopted on site: the arch roof bolts were Φ22 mm × 2800 mm thread steel anchor bolts with a row spacing of 700 mm × 800 mm between arches; the high preload applied by the anchor bolts was no less than 90 kN; the reinforcing anchor cables were Φ22 mm × 6300 mm with a row spacing 2450 mm × 1600 mm; the rib bolts adopted were Φ22 mm × 2800 mm thread steel anchor bolts, three bolts for each rib, with a row spacing of 600 mm × 800 mm; the high preload applied by the anchor bolts was no less than 90 kN; and the floor bolts were Φ22 mm × 2200 mm ordinary thread steel anchor bolts with a row spacing of 1000 mm × 800 mm. Six grouted anchor cables were arranged in the full section with a spacing of 1250 mm × 2400 mm. Two grouted anchor bolts were constructed at the rib with a row spacing of 700 mm × 2400 mm, of which the lower anchor bolt was inclined by 45°. Three grouted anchor bolts were constructed at the bottom with a row spacing of 1000 mm × 2400 mm.
After the above support scheme was applied on site, multiple groups of observation stations were arranged in the roadway to observe the data such as the roadway surface displacement, and the roadway surrounding rock was drilled for observation.
Figure 18 shows the monitored results of roadway surrounding rock surface displacement. It can be seen that from the 25th day to the 30th day after the support, the roadway deformation slowed down. The two groups of observation stations found that the maximum subsidence of the roof was 143.5 mm, the maximum displacement of the two ribs was 232 mm, and the maximum floor heave was 110.5 mm on average. Therefore, the roadway deformation was effectively controlled by this support scheme overall to ensure the safety and stability of the roadway.
Figure 19 displays that the surrounding rock conditions were rather poor before crack filling. There were many radial and circumferential cracks in the shallow rock mass. Despite the small number of visible cracks in the deep rock mass, the rock mass was relatively loose. After the deep- and shallow-borehole crack-filling reinforcement, within the range of 3.0–6.0 m deep, the cracks of the roadway surrounding rock were no longer well developed, and the deep surrounding rock maintained good integrity. Within the filling range of 0–3.0 m anchor bolts, the cracks on the left and right ribs were basically sporadically developed. Although there were a few radial cracks, most of the cracks were filled with slurry. According to the results of borehole observation, cracks were basically symmetrically distributed on the left and right ribs; cracks were mainly developed in the shallow area, and the roof stability was well controlled, which played a positive role in maintaining the overall stability of the roadway surrounding rock.

6. Conclusions

With respect to time-dependent damage and large deformation and instability in deep roadways, an engineering-scale model was established to simulate and analyze the evolution law of deformation, the number of cracks, and the damage degree of surrounding rock in deep roadways using UDEC. The following conclusions were obtained:
(1) A strength attenuation of the contact surface during the rheological process was achieved based on the function between the cohesion and the time and the proportional relationship in the number of yielding deformation bodies in the model. The developed strength-attenuation-based rheological model can well describe the entire process of rock rheology.
(2) The results of engineering-scale simulation analysis revealed that the expansion of shallow and deep cracks caused the primary plastic deformation and secondary rheological deformation of the surrounding rock. During the rheological process, massive internal cracks in the rock expanded to intensify the deformation of the roadway. After the surrounding rock entered the accelerated deformation stage, the rheological deformation rate increased by 21.4% every 55 days on average in the absence of further control measures, which ultimately induced severe roadway damage.
(3) Based on the mechanism of time-dependent instability of deep soft-rock roadways, a control technology of high-preload bolt + deep- and shallow-borehole crack filling was proposed. Both the simulation results and the on-site observation data indicate that this technology can notably suppress crack propagation and the surrounding rock rheology, effectively control roadway deformation, and ensure the safety and stability of the roadway.
In view of its effective application in the deep soft broken surrounding rock, it can be considered that this technology can provide a reference for designing support measures for deep and shallow fractured surrounding rock of roadways. Considering that water can reduce the effectiveness of the bolt support and crack filling, further research is needed to determine whether this technology is applicable to water-rich roadways.

Author Contributions

Conceptualization, B.W. and J.C.; methodology, C.L.; investigation, T.W.; writing—original draft preparation, B.W.; writing—review and editing, C.L., T.W. and W.S.; supervision, J.C. and X.W.; funding acquisition, B.W., J.C., T.W. and W.S. All authors have read and agreed to the published version of the manuscript.

Funding

This research was funded by the National Natural Science Foundation of China (52204079, 52174105, 52104117, and 52204081) and the Scientific Research Foundation for High-level Talents of Anhui University of Science and Technology (2023yjrc28).

Institutional Review Board Statement

Not applicable.

Informed Consent Statement

Not applicable.

Data Availability Statement

The data presented in this study are available on request from the corresponding author. The data are not publicly available due to privacy.

Acknowledgments

The authors are grateful to Huaibei Mining Group Co. Ltd.

Conflicts of Interest

The authors declare no conflict of interest.

References

  1. Yuan, L. Research progress of mining response and disaster prevention and control in deep coal mines. J. China Coal Soc. 2021, 46, 716–725. [Google Scholar] [CrossRef]
  2. Zhang, J.; Li, Q.; Zhang, Y.; Cao, Z.; Wang, X. Definition of deep coal mining and response analysis. J. China Coal Soc. 2019, 44, 1314–1325. [Google Scholar] [CrossRef]
  3. Brantut, N.; Heap, M.; Meredith, P.; Baud, P. Time-dependent cracking and brittle creep in crustal rocks: A review. J. Struct. Geol. 2013, 52, 17–43. [Google Scholar] [CrossRef]
  4. Huang, Q.; Wang, X.; Chen, X.; Qin, D.; Chang, Z. Evolution of Interior and Exterior Bearing Structures of the Deep-Soft-Rock Roadway: From Theory to Field Test in the Pingdingshan Mining Area. Energies 2020, 13, 4357. [Google Scholar] [CrossRef]
  5. Zhao, C.; Li, Y.; Liu, G.; Huang, S. Study on surrounding rock support technology of deep soft rock roadway. Coal Sci. Technol. 2022, 50, 76–84. [Google Scholar] [CrossRef]
  6. Jiang, P.; Kang, H.; Wang, Z.; Liu, Q.; Yang, J.; Gao, F.; Wang, X.; Zhang, Q.; Zheng, Y.; Wang, H. Principle, technology and application of soft rock roadway strata control means of “rock bolting, U-shaped yielding steel arches and back filling”synergy in 1000 m deep coal mines. J. China Coal Soc. 2020, 45, 1020–1035. [Google Scholar] [CrossRef]
  7. Shahriyar, H.; Ali, S.; Alain, R. The damage-failure criteria for numerical stability analysis of underground excavations: A review. Tunn. Undergr. Sp. Tech. 2021, 107, 103633. [Google Scholar] [CrossRef]
  8. Bonini, M.; Lancellotta, G.; Barla, G. State of stress in tunnel lining in squeezing rock conditions. Rock Mech. Rock Eng. 2013, 46, 405–411. [Google Scholar] [CrossRef]
  9. Yang, X.; Wang, E.; Wang, Y.; Gao, Y.; Wang, P. A Study of the Large Deformation Mechanism and Control Techniques for Deep Soft Rock Roadways. Sustainability 2018, 10, 1100. [Google Scholar] [CrossRef] [Green Version]
  10. Wang, X.; Zhang, Y.; Zhang, Q.; Wei, Y.; Liu, W.; Jiang, T. Space-Time Evolution Characteristics of Deformation and Failure of Surrounding Rock in Deep Soft Rock Roadway. Sustainability 2022, 14, 12587. [Google Scholar] [CrossRef]
  11. Yang, S.; Chen, M.; Jing, H.; Chen, K.; Meng, B. A case study on large deformation failure mechanism of deep soft rock roadway in Xin’An coal mine, China. Eng. Geol. 2017, 217, 89–101. [Google Scholar] [CrossRef]
  12. Zhu, Q.; Li, T.; Zhang, H.; Ran, J.; Li, H.; Du, Y.; Li, W. True 3D geomechanical model test for research on rheological deformation and failure characteristics of deep soft rock roadways. Tunn. Undergr. Sp. Tech. 2022, 128, 104653. [Google Scholar] [CrossRef]
  13. Tao, Z.; Zhu, C.; Zheng, X.; Wang, D.; Liu, Y.; He, M.; Wang, Y. Failure mechanisms of soft rock roadways in steeply inclined layered rock formations. Geomat. Nat. Hazards Risk 2018, 9, 1186–1206. [Google Scholar] [CrossRef] [Green Version]
  14. Wang, Q.; Pan, R.; Jiang, B.; Li, S.; He, M.; Sun, H.; Wang, L.; Qin, Q.; Yu, H.; Luan, Y. Study on failure mechanism of roadway with soft rock in deep coal mine and confined concrete support system. Eng. Fail. Anal. 2017, 81, 155–177. [Google Scholar] [CrossRef]
  15. He, F.; Zhai, W.; Xu, X.; Song, J.; Li, L.; Lv, K. Study on Mechanism and Control Technology of Asymmetric Floor Heave in a Deep Soft Rock Main Roadway. Geofluids 2022, 2022, 114900. [Google Scholar] [CrossRef]
  16. Li, G.; Ma, F.; Guo, J.; Zhao, H.; Liu, G. Study on deformation failure mechanism and support technology of deep soft rock roadway. Eng. Geol. 2020, 264, 105262. [Google Scholar] [CrossRef]
  17. Zhao, C.; Li, Y.; Liu, G.; Meng, X. Mechanism analysis and control technology of surrounding rock failure in deep soft rock roadway. Eng. Fail. Anal. 2020, 115, 104611. [Google Scholar] [CrossRef]
  18. Shen, B. Coal mine roadway stability in soft rock: A case study. Rock Mech. Rock Eng. 2014, 47, 2225–2238. [Google Scholar] [CrossRef]
  19. Yang, R.; Li, Y.; Guo, D.; Yao, L.; Yang, T.; Li, T. Failure mechanism and control technology of water-immersed roadway in high-stress and soft rock in a deep mine. Int. J. Min. Sci. Technol. 2017, 27, 245–252. [Google Scholar] [CrossRef]
  20. Ren, S.; Zhao, Y.; Liao, J.; Liu, Q.; Li, Y. Lugeon Test and Grouting Application Research Based on RQD of Grouting Sections. Sustainability 2022, 14, 12748. [Google Scholar] [CrossRef]
  21. Zhu, Q.; Li, T.; Zhang, S. Failure and stability analysis of deep soft rock roadways based on true triaxial geomechanical model tests. Eng. Fail. Anal. 2022, 137, 106255. [Google Scholar] [CrossRef]
  22. Itasca Consulting Group Inc. UDEC (Universal Distinct Element Code), Version 6.0; Itasca Consulting Group Inc.: Itasca, MN, USA, 2014. [Google Scholar]
  23. Wang, M.; Cai, M. A grain-based time-to-failure creep model for brittle rocks. Comput. Geotechnol. 2020, 119, 103344. [Google Scholar] [CrossRef]
  24. Aydan, O.; Nawrocki, P. Rate-dependent deformability and strength characteristics of rocks. In Proceedings of the 2nd International Symposium on the Geotechnics of Hard Soils–Soft Rocks, Naples, Italy, 12–14 October 1998. [Google Scholar]
  25. Aydan, O.; Ulusay, R. Geomechanical evaluation of derinkuyu antique underground city and its implications in geoengineering. Rock Mech. Rock Eng. 2013, 46, 731–754. [Google Scholar] [CrossRef]
  26. Aydan, O.; Takashi, I.; Ugur, O.; Kwasniewski, M.; Shariar, K.; Okuno, T.; Ozgenoglu, A.; Malan, D.; Okada, T. ISRM suggested methods for determining the creep characteristics of rock. Rock Mech. Rock Eng. 2013, 47, 275–290. [Google Scholar] [CrossRef] [Green Version]
  27. Barton, N. Review of a new shear-strength criterion for rock joints. Eng. Geol. 1973, 7, 287–332. [Google Scholar] [CrossRef]
  28. Gao, F.; Stead, D. The application of a modified Voronoi logic to brittle fracture modelling at the laboratory and field scale. Int. J. Rock Mech. Min. 2014, 68, 1–14. [Google Scholar] [CrossRef]
  29. Wu, B.; Wang, X.; Bai, J.; Wu, W.; Zhu, X.; Li, G. Study on crack evolution mechanism of roadside backfill body in gob-side entry retaining based on UDEC trigon model. Rock Mech. Rock Eng. 2019, 52, 3385–3399. [Google Scholar] [CrossRef]
  30. Zang, C.; Chen, M.; Zhang, G.; Wang, K.; Gu, D. Research on the failure process and stability control technology in a deep roadway: Numerical simulation and field test. Energy Sci. Eng. 2020, 8, 2297–2310. [Google Scholar] [CrossRef] [Green Version]
Figure 1. Basic information of the roadway. (a) Layout plan of the II5 Rail Rise; (b) Initial support of the roadway; (c) Geological histogram.
Applsci 13 04641 g001
Figure 2. Roadway damage in test section. (a) Floor heave and side-beam and top-beam bending; (b) Pulp burst; (c) Rib and roof bulging.
Applsci 13 04641 g002
Figure 3. Surrounding rock loose circle test. (a) CT2 mine ultrasonic surrounding rock crack detector; (b) test borehole arrangement; (c) test results.
Applsci 13 04641 g003
Figure 4. Schematic diagram of block strength attenuation.
Applsci 13 04641 g004
Figure 5. Mechanism of contact strength attenuation.
Applsci 13 04641 g005
Figure 6. Comparison of uniaxial compression simulation curves and laboratory test curves. (a) coal; (b) mudstone; (c) medium-grained sandstone; (d) fine sandstone.
Applsci 13 04641 g006
Figure 7. Rheological parameter calibration. (a) matching between simulated and test curves; (b) matching between simulation and test damage results.
Applsci 13 04641 g007
Figure 8. Numerical calculation model of Ⅱ5 Rail Rise.
Applsci 13 04641 g008
Figure 9. Layout of displacement measuring points.
Applsci 13 04641 g009
Figure 10. Horizontal displacement nephograms of roadway on different days. (a) 1st d; (b) 5th d; (c) 50th d; (d) 200th d; (e) 250th d; (f) 300th d.
Applsci 13 04641 g010
Figure 11. Average displacement and displacement rate of two ribs of roadway. (a) average displacement; (b) average displacement rate.
Applsci 13 04641 g011
Figure 12. Distribution characteristics of cracks in roadway surrounding rock with the passage of time. (a) 1st d; (b) 5th d; (c) 50th d; (d) 200th d; (e) 250th d; (f) 300th d.
Applsci 13 04641 g012
Figure 13. Comparison between on-site damage characteristics and simulated damage characteristics of the roadway. (a) simulated damage characteristics; (b) on-site damage characteristics.
Applsci 13 04641 g013
Figure 14. Evolutions of number of cracks and damage degree with time in the surrounding rock. (a) number of cracks; (b) damage degree.
Applsci 13 04641 g014
Figure 15. Average displacement of two ribs, roof, and floor of the roadway. (a) ribs; (b) roof and floor.
Applsci 13 04641 g015
Figure 16. Crack distribution of the improved support. (a) 5th d; (b) 300th d.
Applsci 13 04641 g016
Figure 17. Evolutions of number of cracks and damage degree with time after support optimization. (a) number of cracks; (b) damage degree.
Applsci 13 04641 g017
Figure 18. Roadway surface displacement monitoring. (a) station 1; (b) station 2.
Applsci 13 04641 g018
Figure 19. Comparison of borehole observation results before and after crack filling. (a) roof 1.0 m; (b) roof 1.0 m (filling); (c) roof 5.0 m; (d) roof 5.0 m (filling); (e) left rib 1.0 m; (f) left rib 1.0 m (filling); (g) left rib 5.0 m; (h) left rib 5.0 m (filling); (i) right rib 1.0 m; (j) right rib 1.0 m (filling); (k) right rib 5.0 m; (l) right rib 5.0 m (filling).
Applsci 13 04641 g019aApplsci 13 04641 g019b
Table 1. Short-term parameters of other strata.
LithologyBlock ParameterContact Parameter
Density (kg/m−3)Elastic
Modulus (Gpa)
Normal Stiffness (GPa/m)Tangential Stiffness (GPa/m)Cohesion
(MPa)
Friction (°)Tensile Strength (MPa)
Coal14002.1256.9102.82.9231.0
Mudstone24613.1396.3158.54.3251.5
Medium-grained sandstone25353.9477.2190.97.2262.7
Fine sandstone26894.4549.7219.98.2303.3
Table 2. Comparison between calibrated parameters and target parameters.
LithologyElastic Modulus (GPa)Compressive Strength (MPa)
TargetCalibratedError (%)TargetCalibratedError (%)
Coal2.11.99.59.79.70.0
Mudstone3.13.03.214.714.32.7
Medium-grained sandstone3.94.02.627.527.01.8
Fine sandstone4.44.40.034.133.42.1
Table 3. Rheological simulation parameters of sandy mudstone.
ParameterMeaning of ParameterValue
Block parameter
KVBulk modulus (GPa)1.2
cInitial cohesion (MPa)3.5
ρDensity (kg/m3)1800
φFriction (°)30
σtTensile strength (MPa)1.3
GmMaxwell shear modulus (Pa)5.97 × 10⁸
ηm Maxwell viscosity coefficient (Pa·s)2.9 × 10¹³
Gk Kelvin shear modulus (Pa)7.7 × 10⁸
ηk Kelvin viscosity coefficient (Pa·s)6.7 × 10¹⁰
Contact parameter
knNormal stiffness (Pa/m)2.56 × 1012
ksTangential stiffness (Pa/m)1.02 × 1012
φjFriction (°)30
cjInitial cohesion (MPa)3.2
σtjTensile strength (MPa)1.2
Rheological setting
Δ t c r Rheological timestep time (s)0.005
FEmpirical time constant0.0196
Disclaimer/Publisher’s Note: The statements, opinions and data contained in all publications are solely those of the individual author(s) and contributor(s) and not of MDPI and/or the editor(s). MDPI and/or the editor(s) disclaim responsibility for any injury to people or property resulting from any ideas, methods, instructions or products referred to in the content.

