Article

Classification Technique of Algae Using Hyperspectral Images of Algae Culture Media

1
Department of Civil & Environmental Engineering, Myongji University, Yongin 17058, Republic of Korea
2
Department of Civil & Environmental Engineering, Dankook University, Yongin 16890, Republic of Korea
3
Nakdong River Basin Environmental Office, Changwon 51439, Republic of Korea
4
Department of Civil and Environmental Engineering, Nakdong River Basin Environmental Research Center, Inje University, Gimhae 50834, Republic of Korea
*
Author to whom correspondence should be addressed.
Appl. Sci. 2023, 13(7), 4631; https://doi.org/10.3390/app13074631
Submission received: 8 February 2023 / Revised: 1 April 2023 / Accepted: 5 April 2023 / Published: 6 April 2023
(This article belongs to the Section Environmental Sciences)

Abstract

:
Increases in algal growth have been reported in rivers, reservoirs, and other water resources worldwide, including Korea. Algal overgrowth can result in algal bloom, which has several negative impacts, such as ecosystem degradation and economic losses. Mitigation measures employed in Korea include an algal warning system and survey-based water quality forecast systems. However, these methods are time-consuming and require sample collection from the site. On the other hand, remote sensing techniques that use chlorophyll a are unable to distinguish between different types of algal species. In this paper, we aimed to identify a classification technique based on remote sensing methods that can be used to distinguish between blue-green algae and green algae. We acquired and prepared an algal culture solution and used a hyperspectral sensor to obtain an algae spectrum. Thereafter, we measured the absorption and emission spectra of blue-green and green algae and distinguished them using the instantaneous slope change of the spectrum. The absorption spectra for green algae showed two peaks at 417–437 nm and 661–673 nm, whereas those of blue-green algae showed three peaks at 449–529 nm, 433–437 nm, and 669–677 nm. The results of this study could form a basis for developing mitigation measures for algal overgrowth.

1. Introduction

The overgrowth of algae has been frequently observed in rivers and lakes of Korea owing to abnormal weather conditions and climate change. The growth and death of these algae is greatly influenced by solar radiation, water temperature, nutrients, and residence time. However, domestic rivers and lakes are rich in nutrients, and hence, the occurrence of algae is mainly affected by the seasons. From spring to summer, green algae and blue-green algae grow rapidly and show a maximum growth rate in midsummer [1]. The growth rate of green algae and blue-green algae significantly increases between summer and autumn. During midsummer, green algae and blue-green algae dominate rivers and reservoirs, causing algae bloom to occur, and the dominant species change according to the proliferation of diatom increases in winter [2]. One of the problems caused by the large-scale occurrence of blue-green algae in the summer across the globe, including Korea, is the generation of odors and toxic substances [3]. In addition to the odor, blue-green algae have air bubbles in their cells; consequently, when their specific gravity is less than that of water, they float to the surface and form scum on the surface of the water, which further results in aesthetic displeasure [4]. Due to the construction of eight large-scale reservoirs for flood control in Korea, the river environment, including water quality characteristics, has been greatly affected by changes in hydraulic characteristics, such as water depth, flow velocity, and residence time, as well as changes in river topography [5]. As a result, water quality has been significantly impacted, leading to the occurrence of harmful algal blooms and the manifestation of characteristics of stagnant water bodies [6].
Algae in rivers are mainly classified into green algae, blue-green algae, and diatoms, and exist mixed with the river, which makes it difficult to distinguish them. Algae have very small cells (<1–10 um), and blue-green algae form filaments or colonies, so taxonomic knowledge, time, and effort are required to identify species under a microscope [7].
In Korea, the current status of algae growth is identified through the constant monitoring of blue-green algae in accordance with the Water Quality and Ecosystem Conservation Act. Algal warning systems and water quality forecast systems have also been implemented in the country. The issuance criteria for the algae warning system are based on the number of harmful blue-green algae cells and the system for the water quality forecast is based on the concentration of harmful blue-green algae cells and Chlorophyll a [8]. Currently, the algae survey method used in Korea is performed once or twice a week, and the analysis includes sample collection from the water body, laboratory analysis, algae identification, and cell count microscopy. These steps can take days to several weeks [9]. The limitations of this survey method make it difficult to immediately classify and quantify algae species in the field, which also makes it difficult to respond immediately when algal bloom occurs [10].
Recently, remote sensing has been actively used to conduct research on algae. Previous studies have identified the parameters that cause changes in the absorption characteristics of algae; these parameters include Chlorophyll a, a pigment of green algae, and Phycocyanin, a pigment of blue-green algae [11]. Thus, algal concentration can be determined by measuring Chlorophyll a, Phycocyanin, and Tripton for the spectral absorption and scattering coefficients of algae [12]. Based on this, a model for predicting Chlorophyll a and Phycocyanin contained in algae is being developed using satellite images. Furthermore, the use of UAVs (unmanned aerial vehicle) is being investigated to overcome the differences in field-measured data that are attributed to temporal and spatial limitations [13]. However, as all algae that perform photosynthesis contain Chlorophyll a, which is used to evaluate algal biomass, and these methods have limited use in species classification as blue-green algae, green algae, and diatoms all contain Chlorophyll a [14]. In this study, we aimed to extract the specific wavelength ranges of green algae and blue-green algae in the summer season using a hyperspectral sensor, select the maximum absorption wavelength range of the algae, and qualitatively analyze it. The results will be utilized as fundamental data for remote sensing research.

2. Experiment Method

Commercially available algae culture mediums (two types each of green algae and blue-green algae) were purchased (Korean Collection for Type Cultures, Jeollabuk-do, Jeongeup, Republic of Korea) and used as samples in this study. A sample was prepared by diluting the BG11 of the algae culture medium, and a hyperspectral image was acquired using a hyperspectral sensor through the prepared sample.

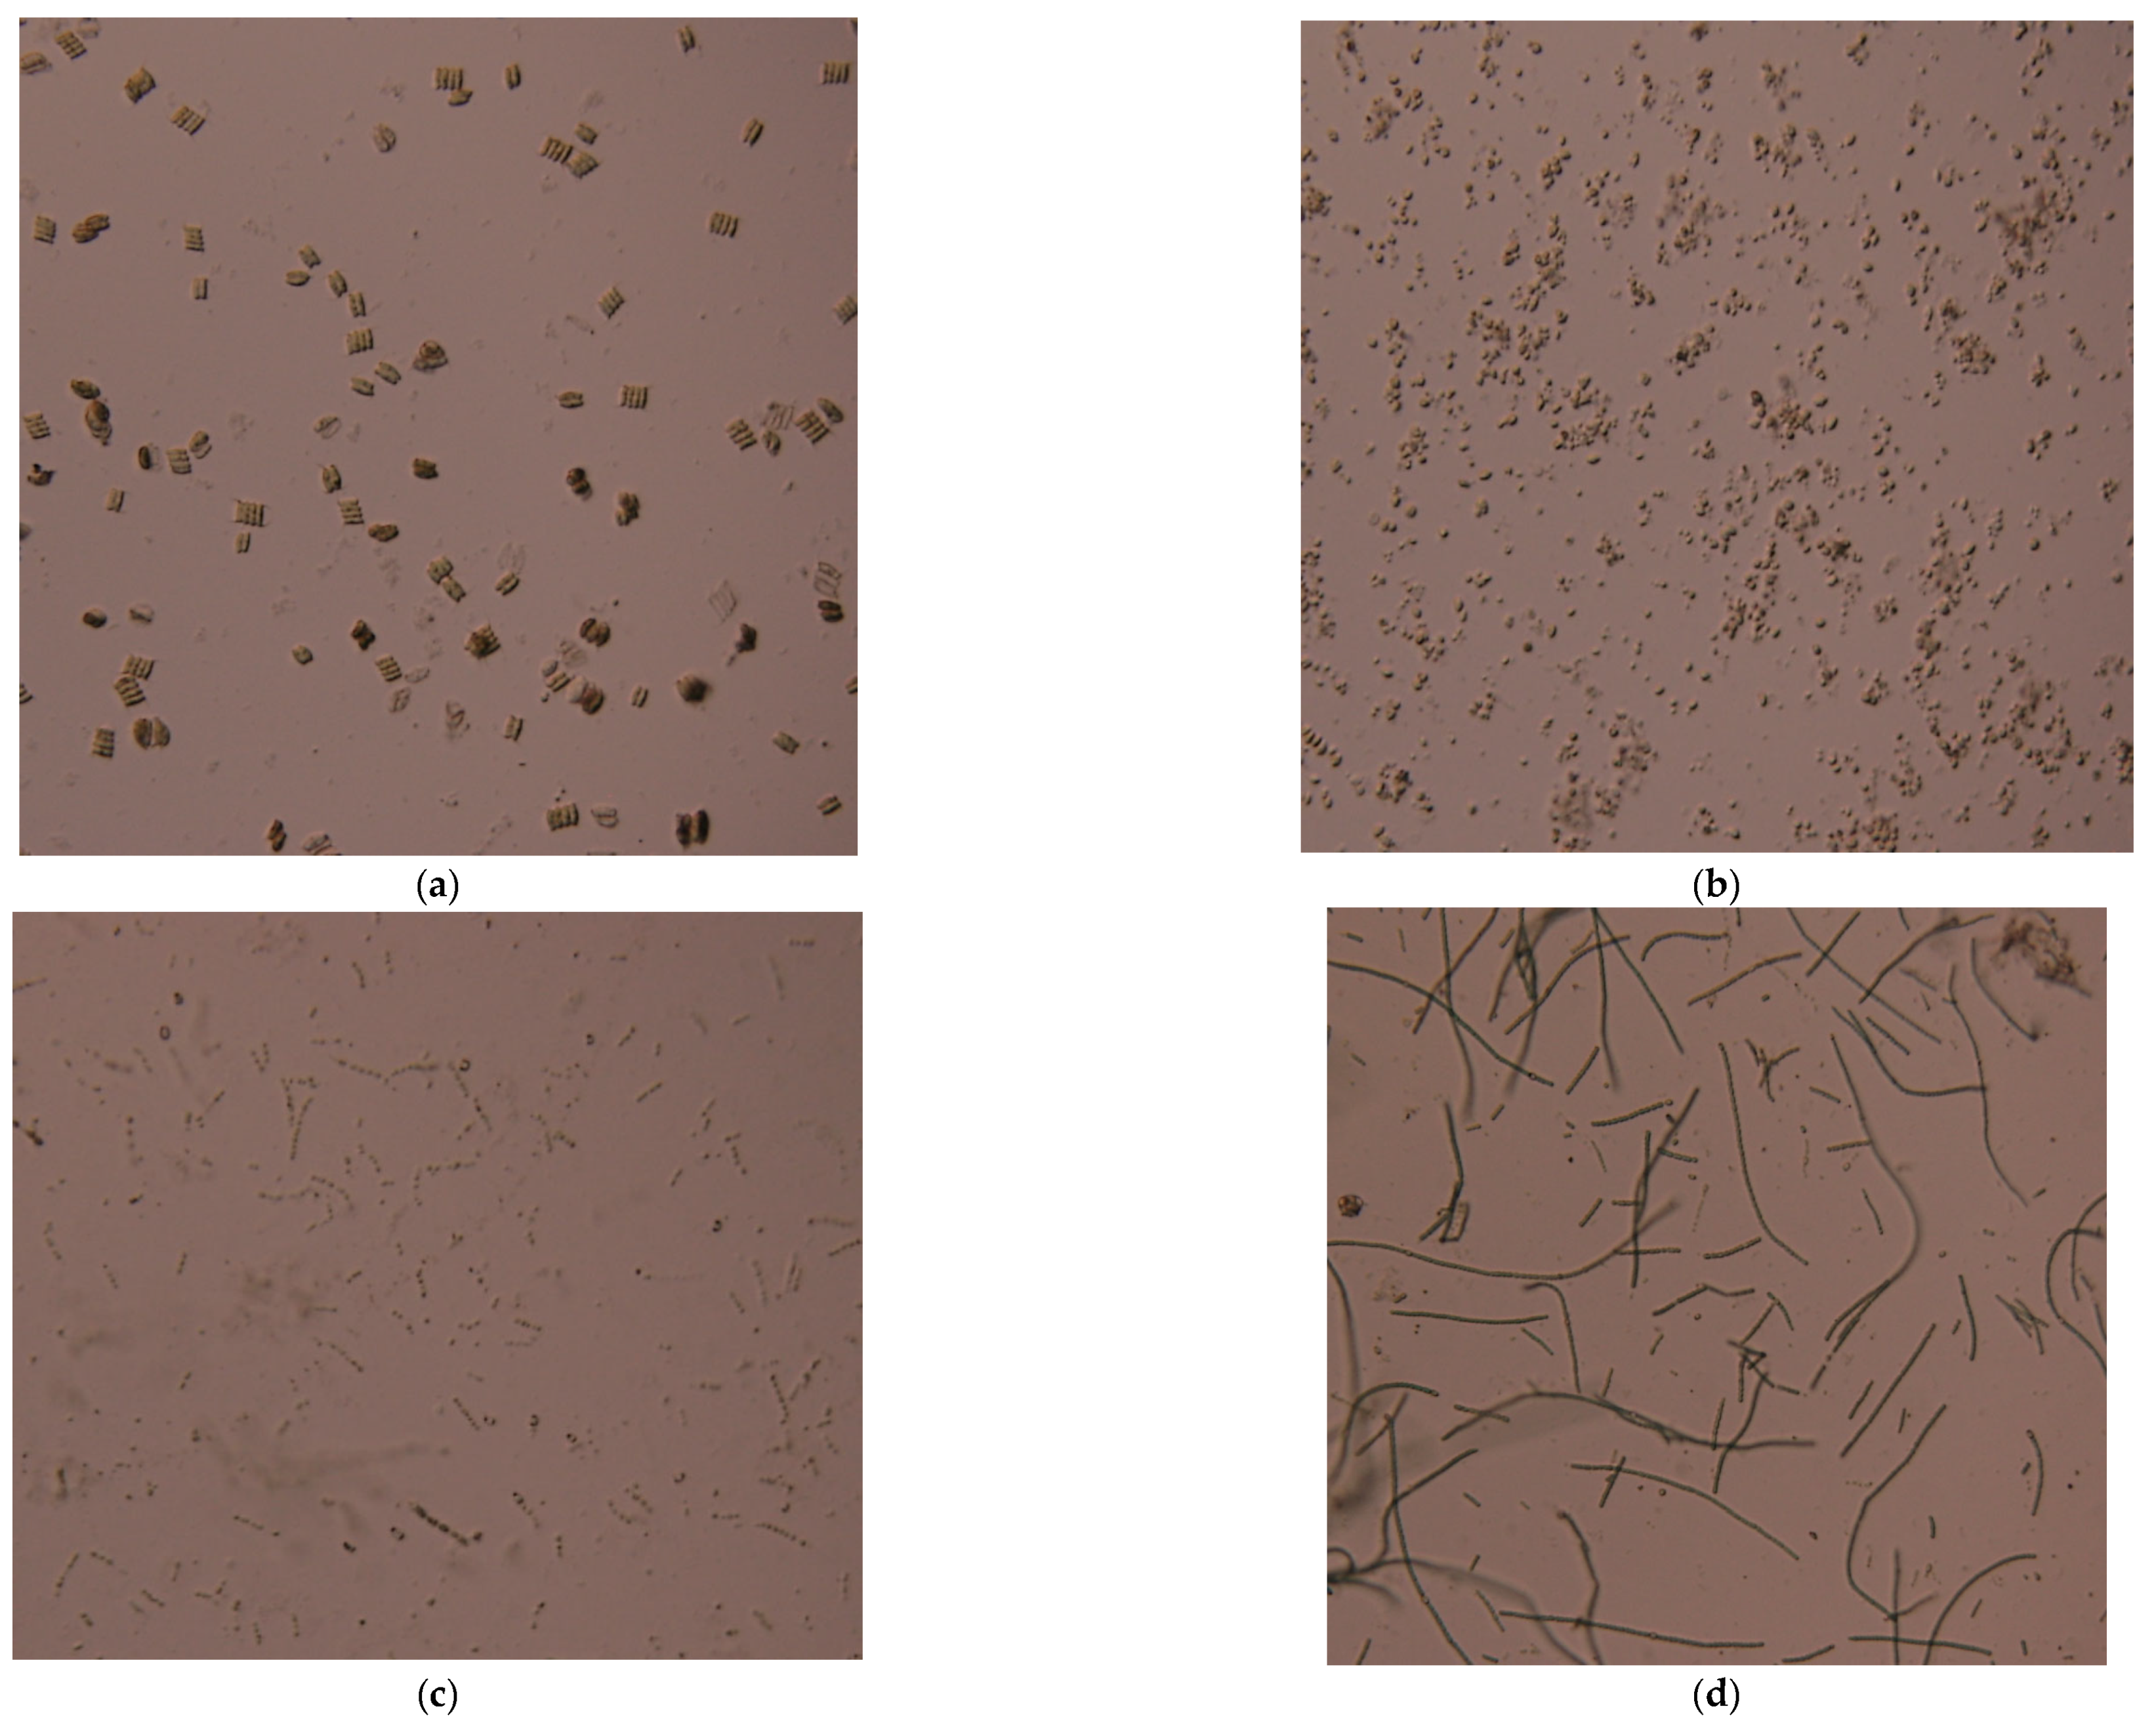
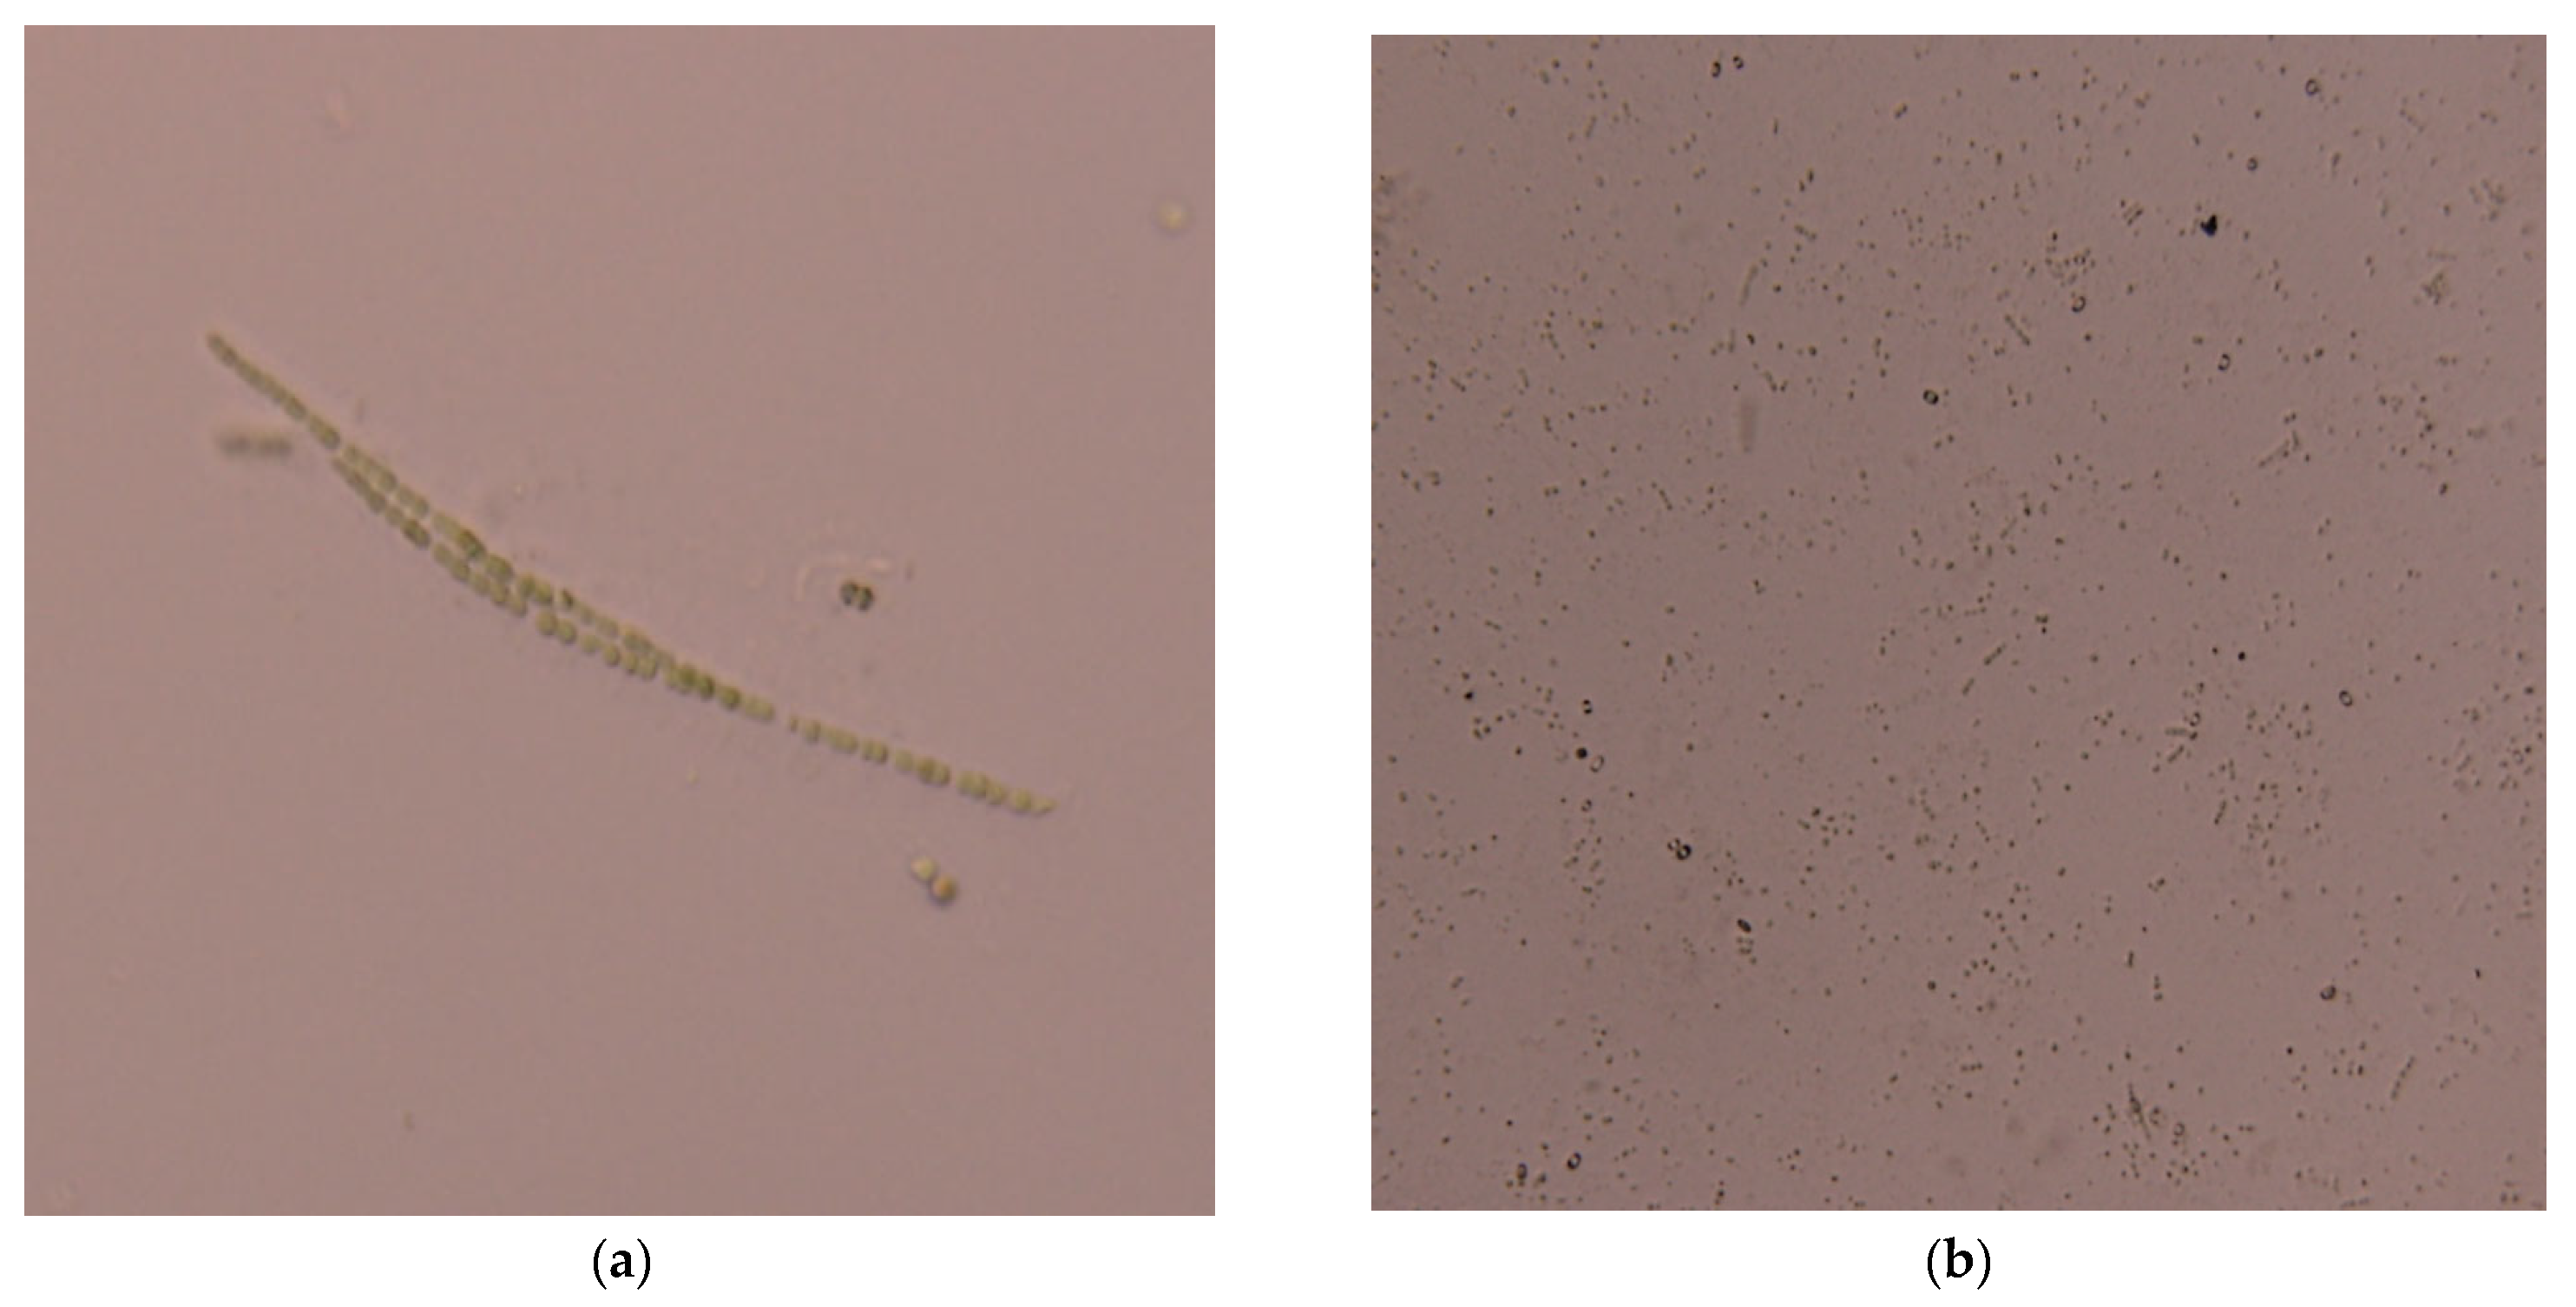
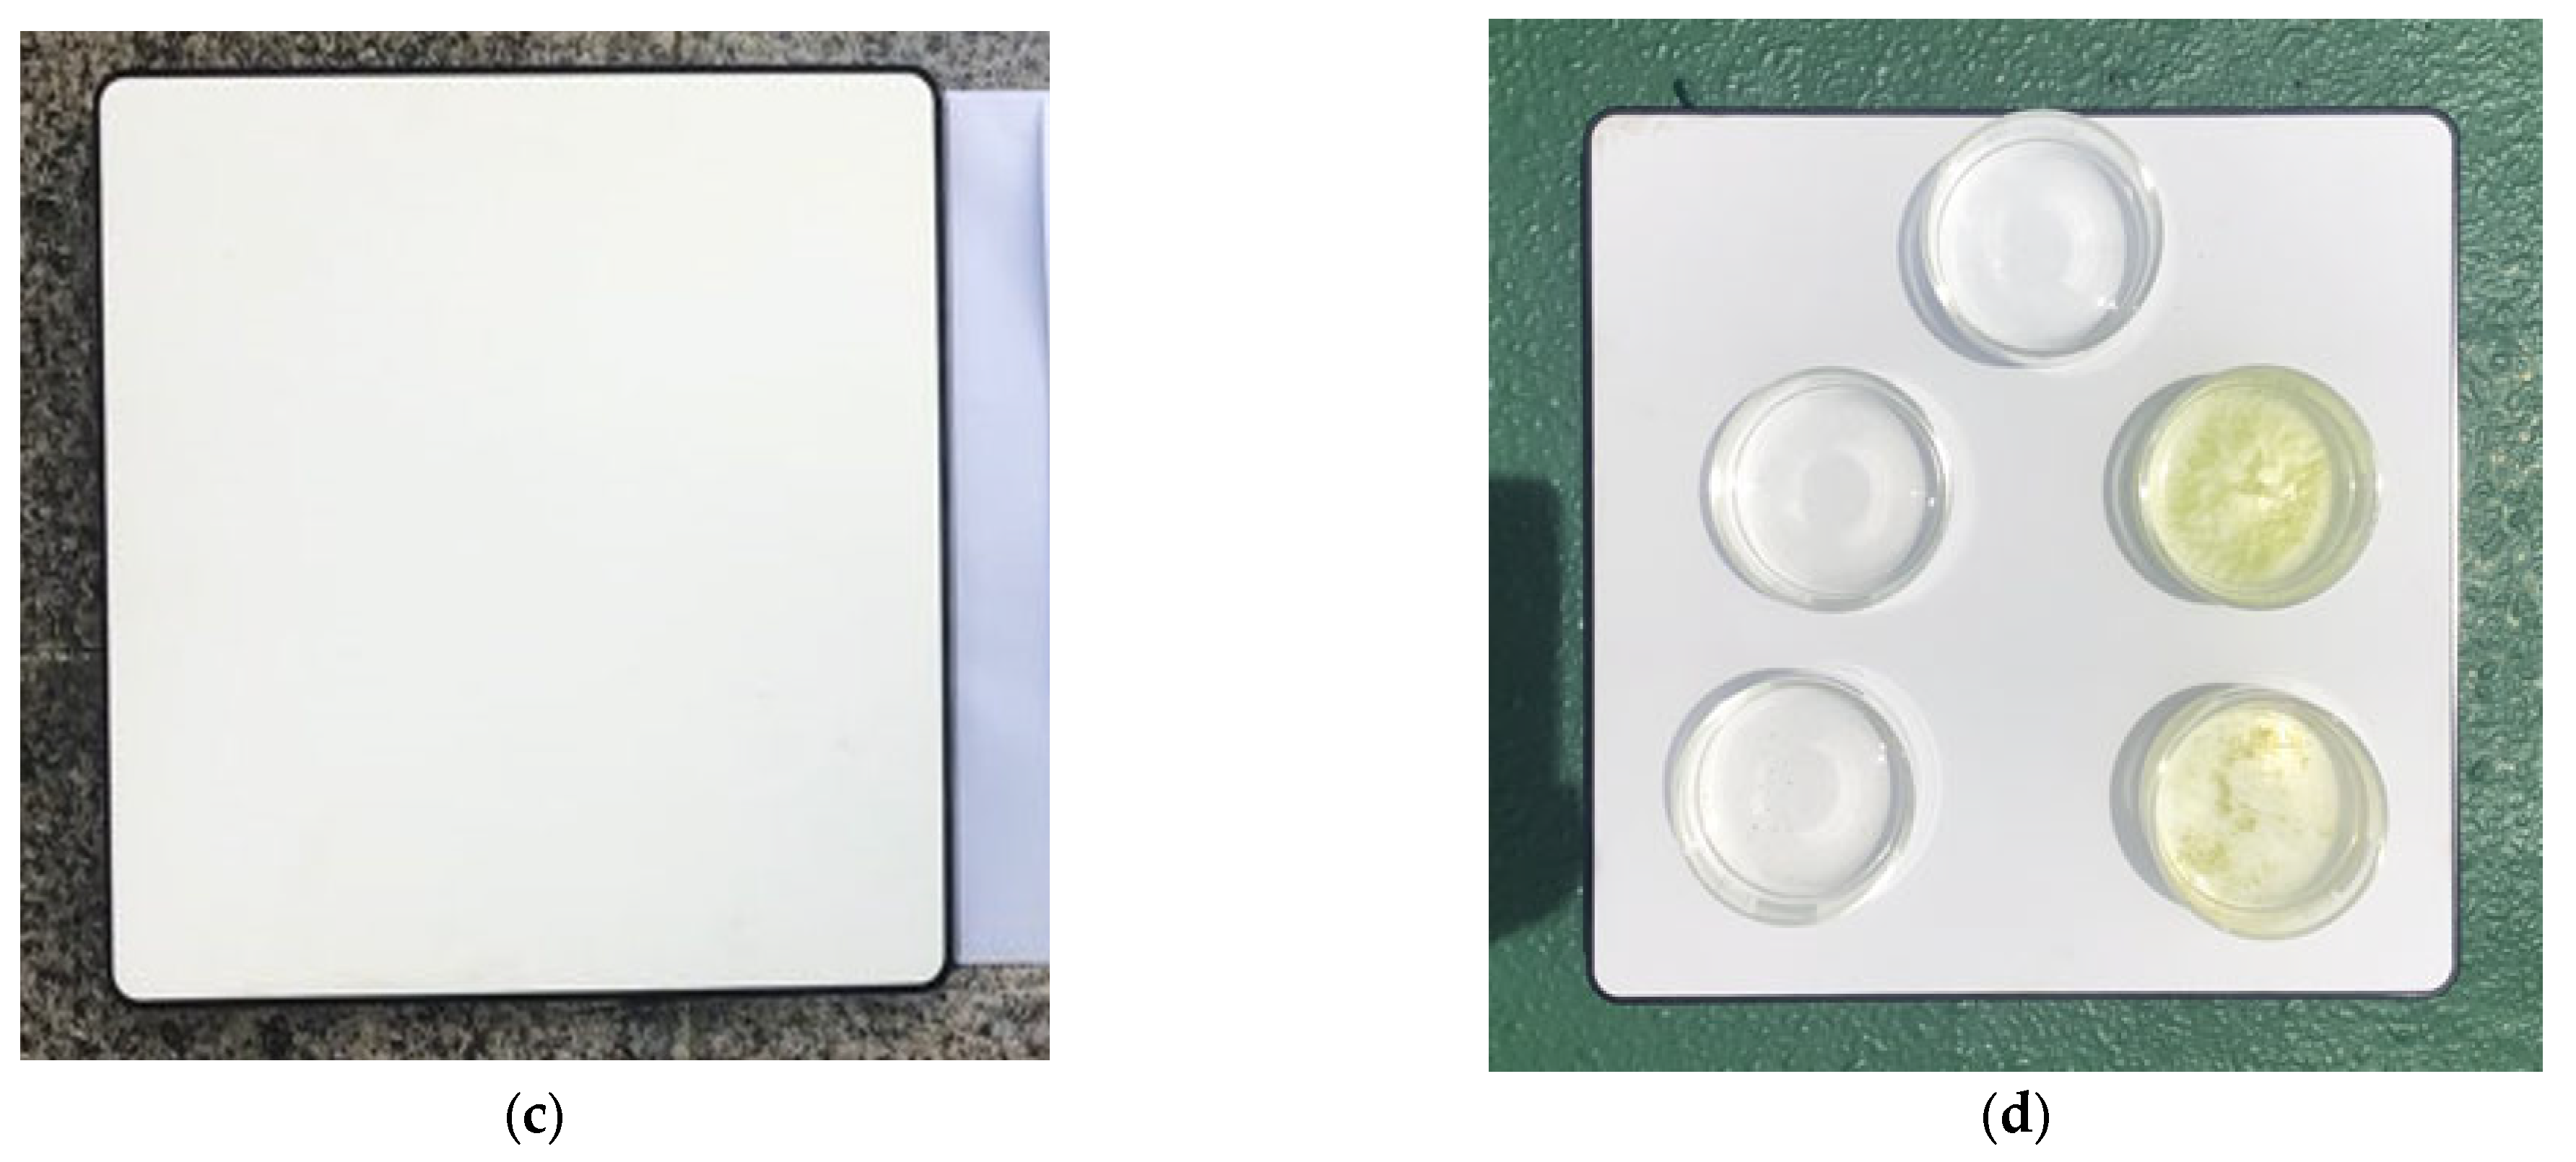
2.1. Preparation of Research Samples

Two types of green algae (Scenedemus communis and Scenedemus communis sp.) and two types of blue-green algae (Anabaena sp. and Anabaena flosaquae) (Figure 1) were purchased and used in the present study. Green algae are single-celled and have a uniform concentration in the beaker, while blue-green algae form clusters, so there is a limitation in that the concentration varies each time a pixel is selected for the analysis of hyperspectral images, as it does not have a uniform concentration in the beaker. To overcome this limitation, a ultrasonic disruptor (Sonics Vibra cell/Sonic & Materials INC (VCX750)) was used to break up the clusters of blue-green algae and create single cells [9,10,11] (Figure 2 and Figure 3).
A total of 24 diluted samples, including 5 different concentrations and additional seed samples for each algae species, were prepared using BG11 used for algae culture in the raw material of blue-green algae from which green algae and colonies were eradicated (Table 1).

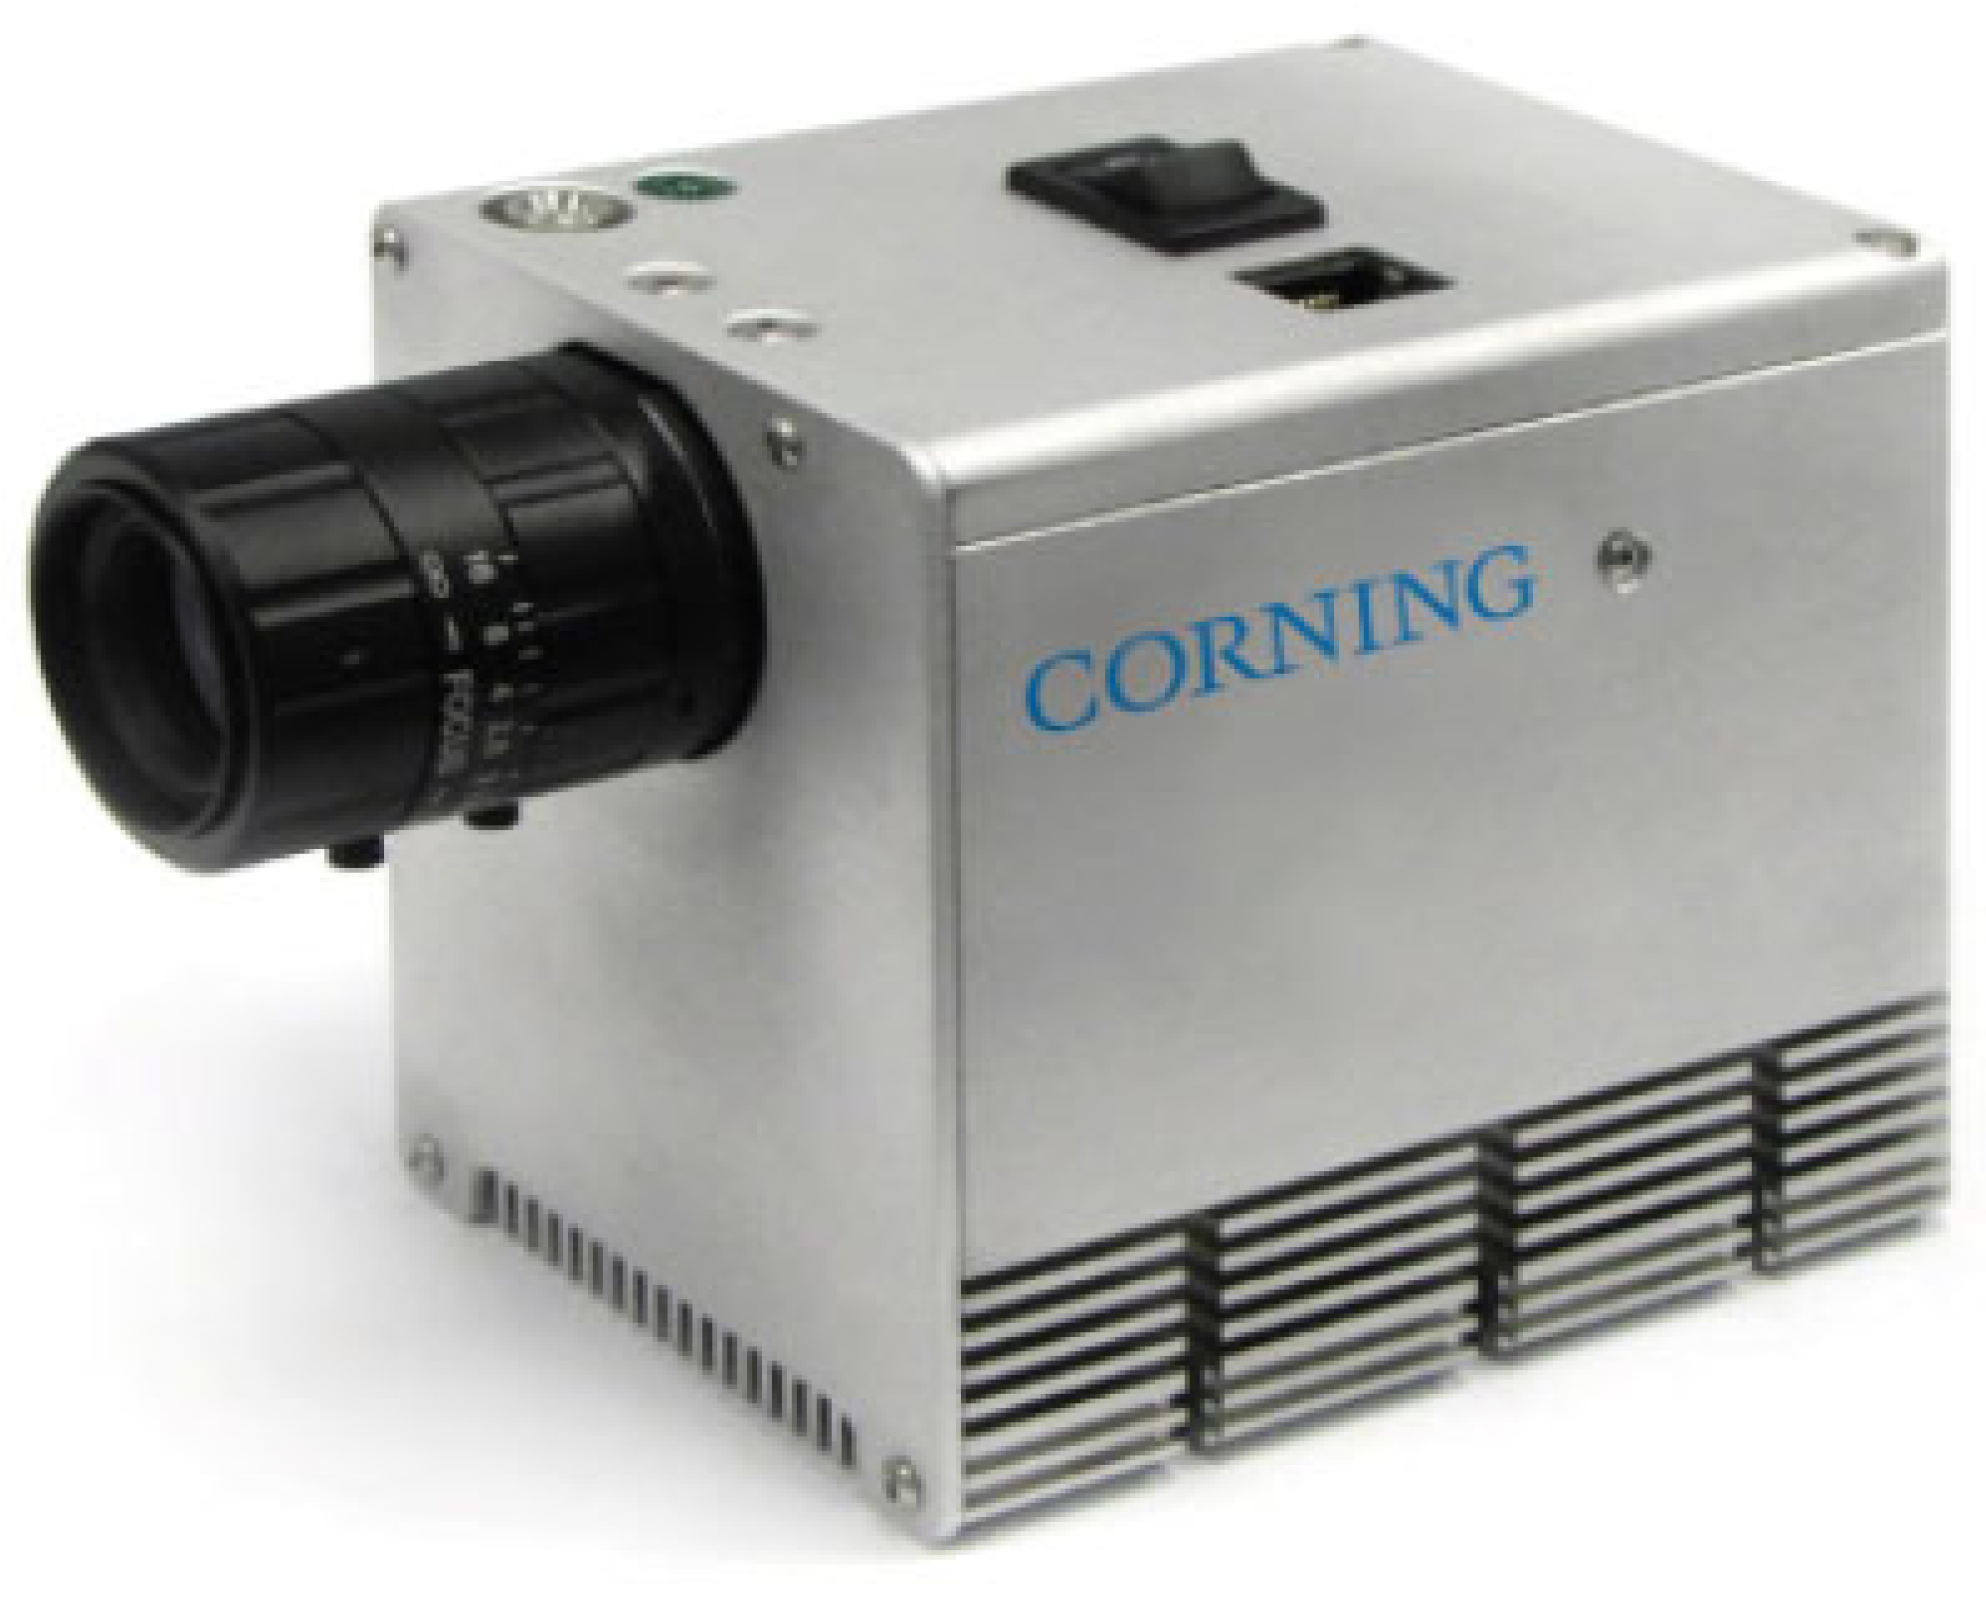
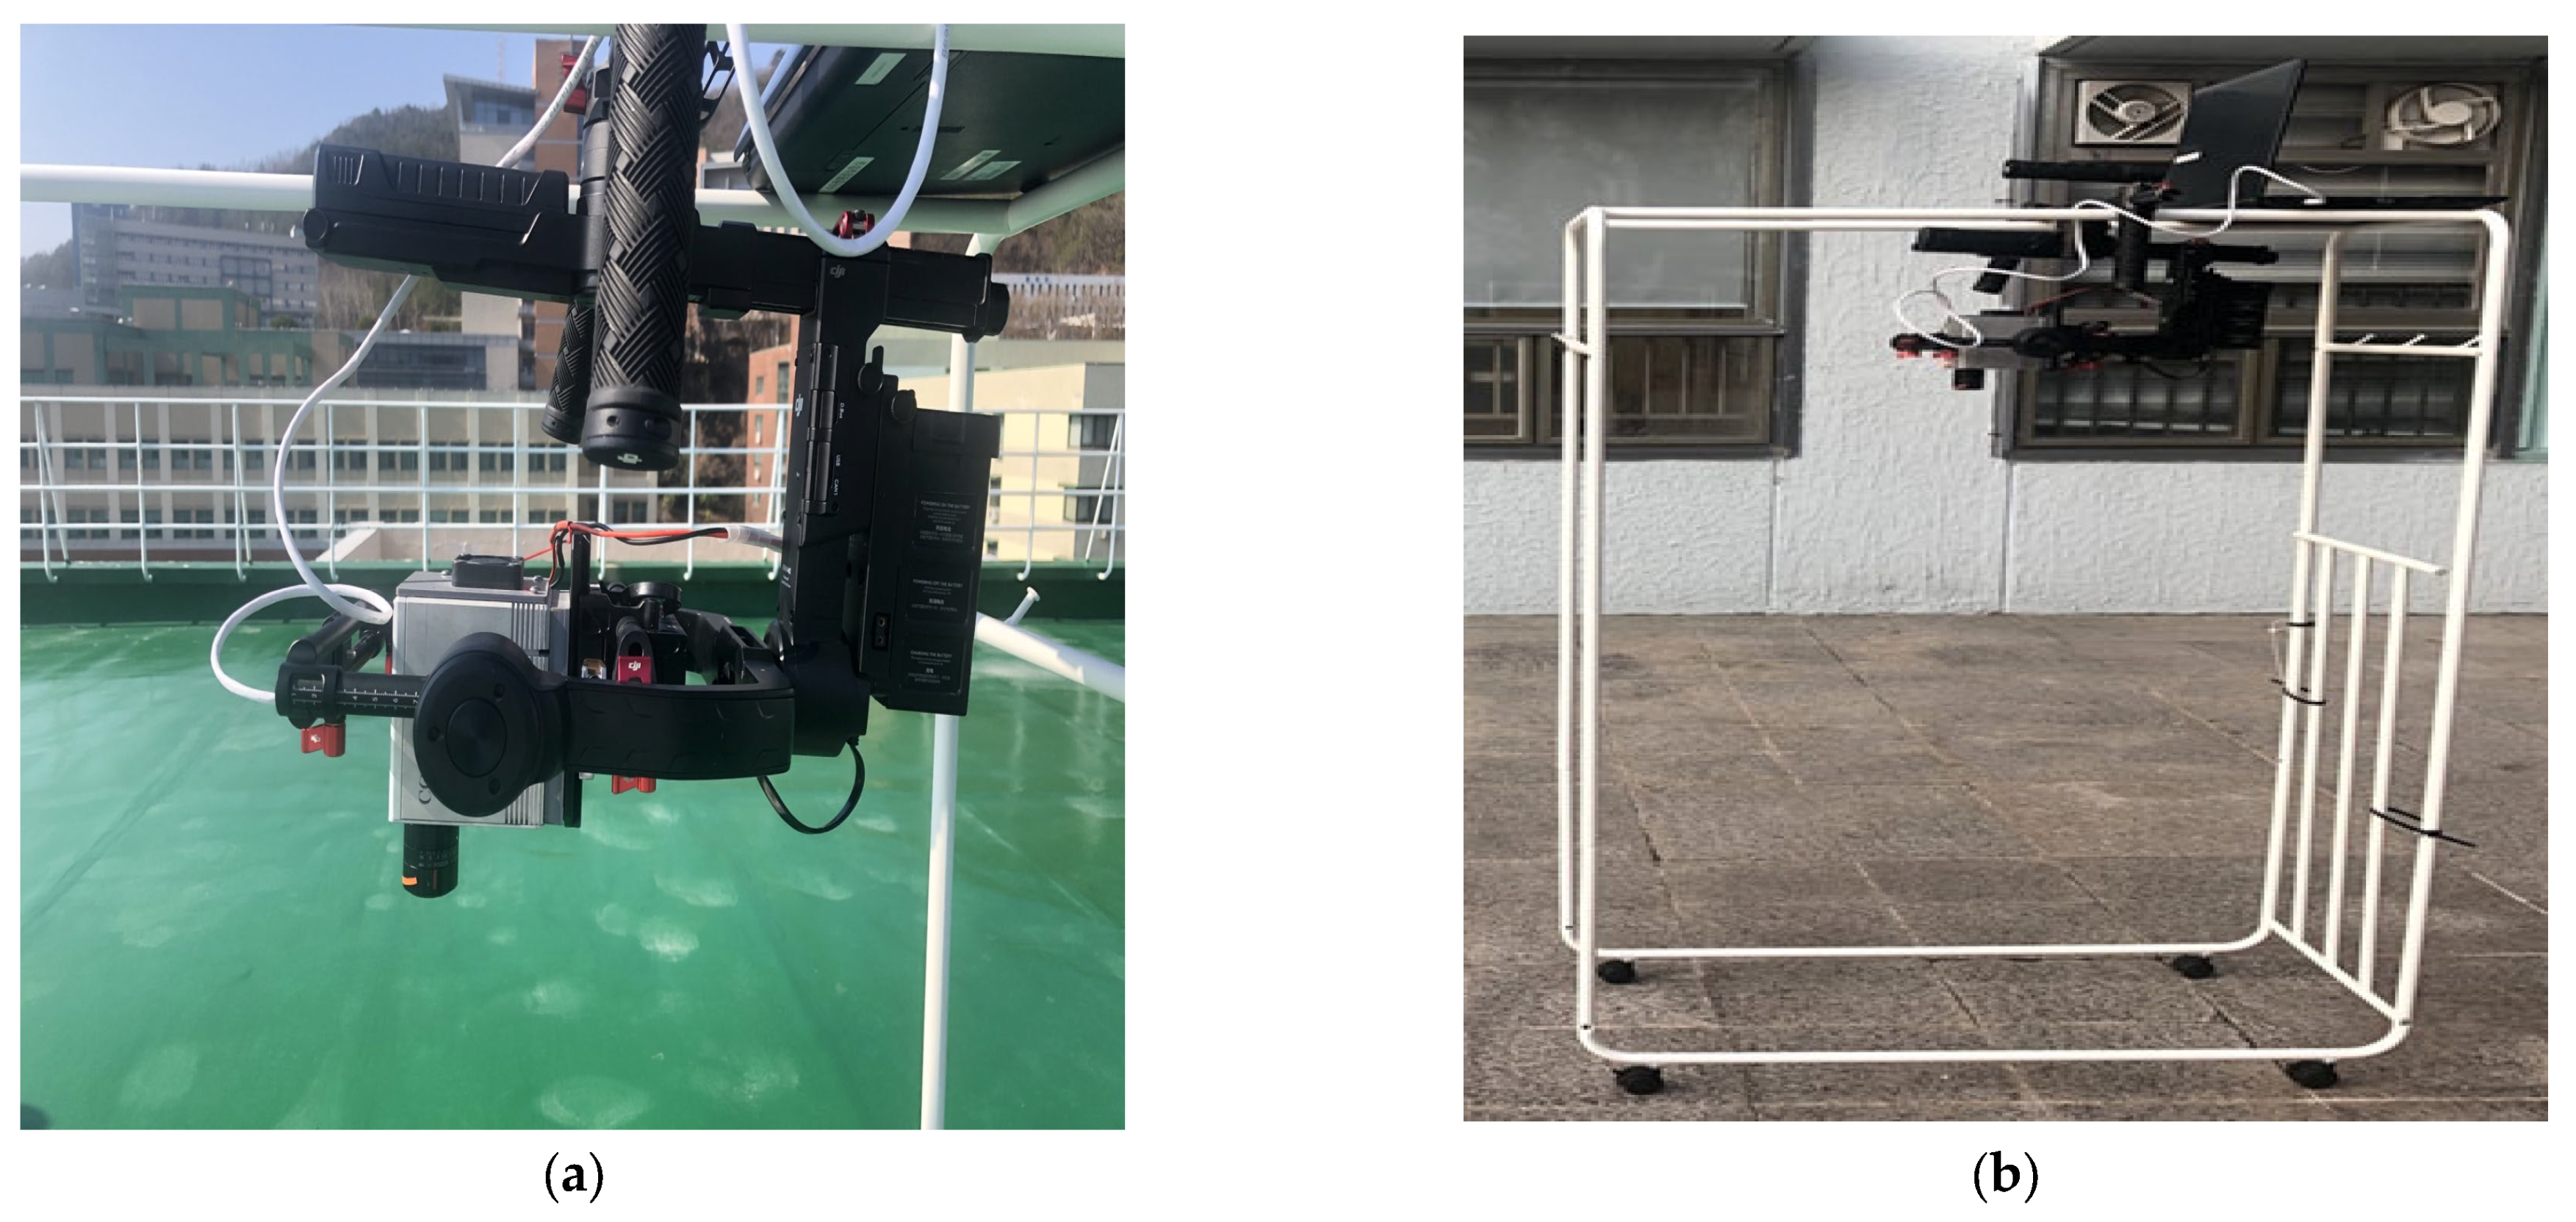
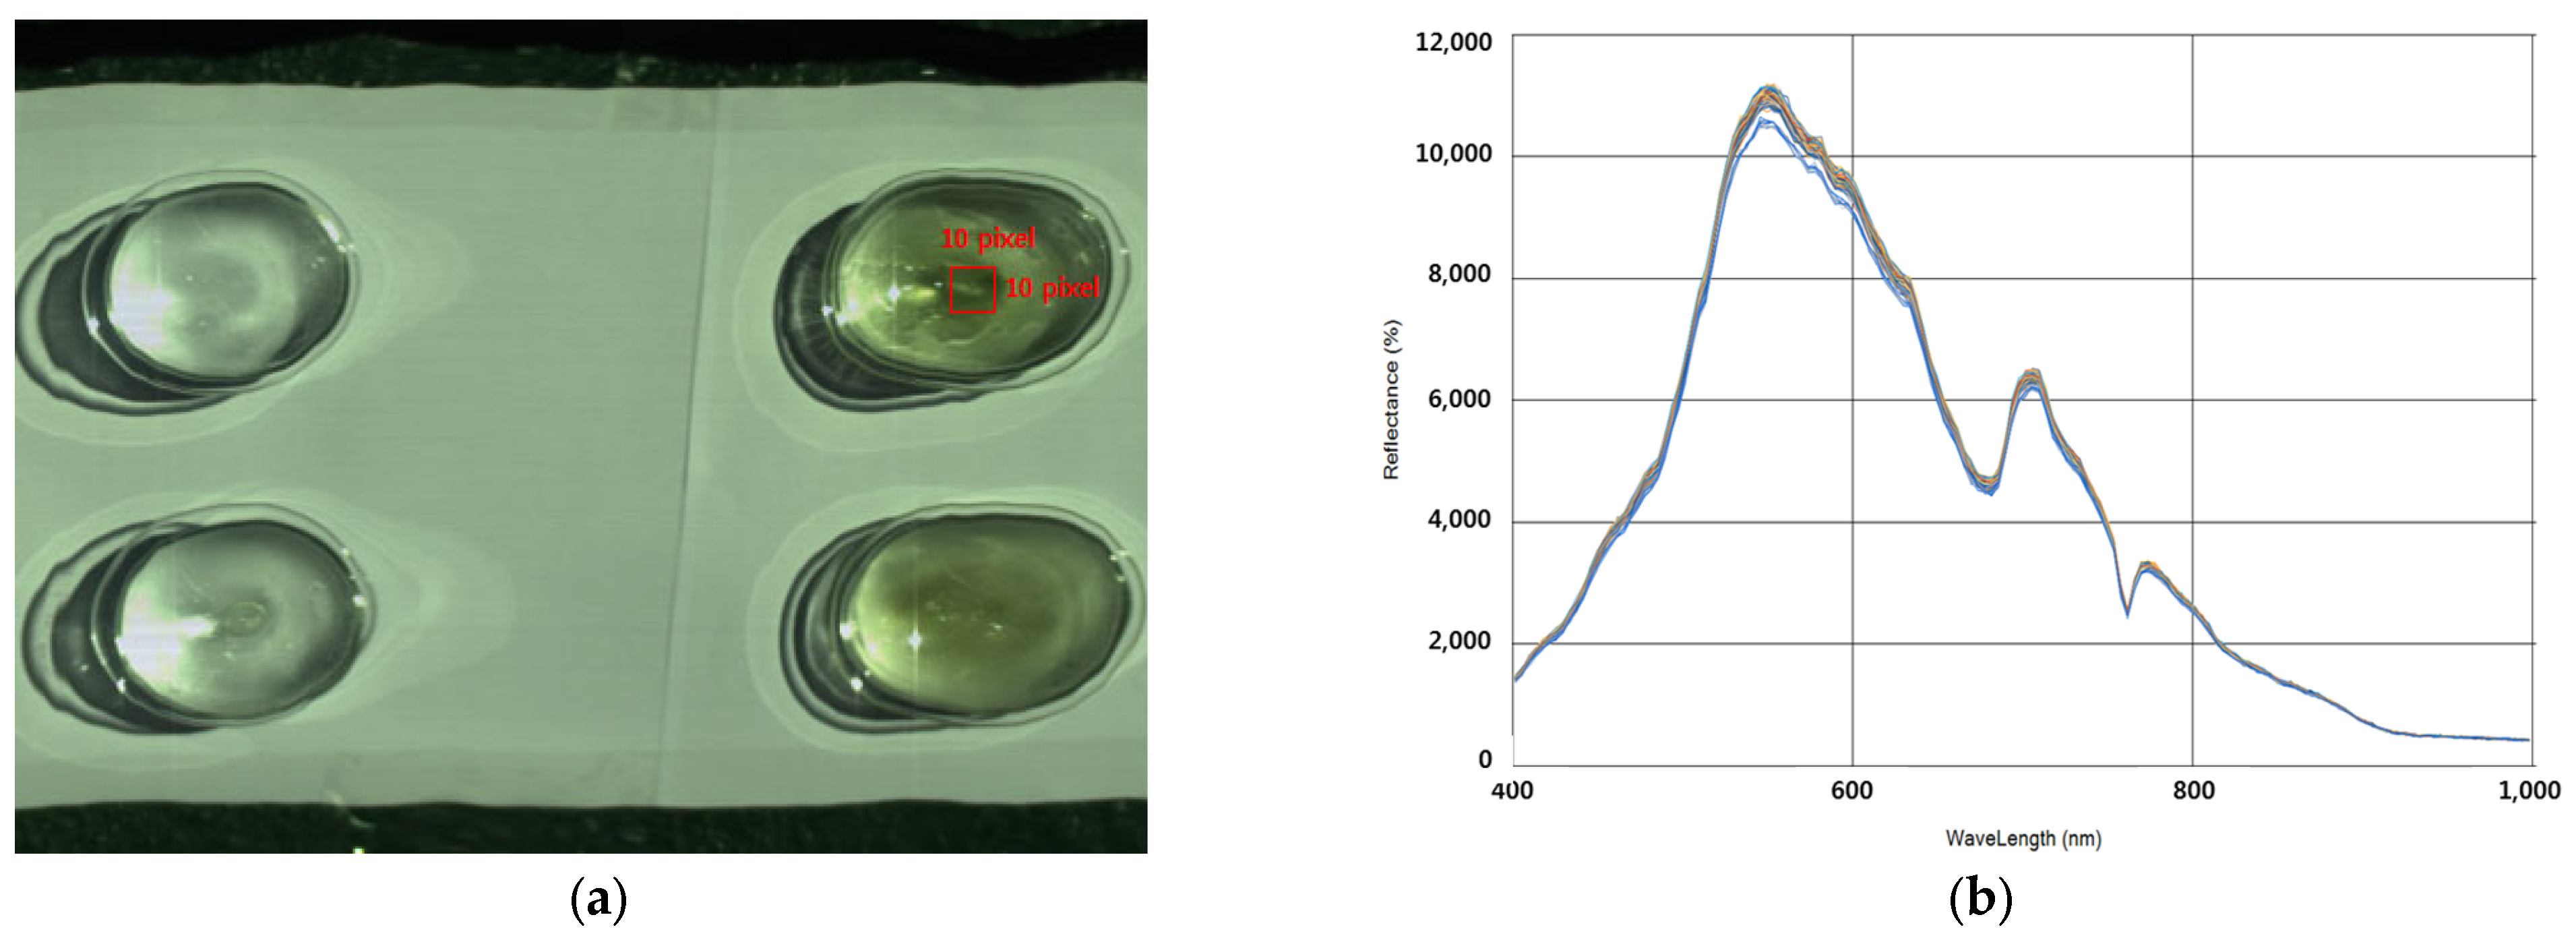
2.2. Hyperspectral Image Acquisition Method

The hyperspectral sensor used in this study was Corning’s Micro HSI 410SHARK model, Figure 4), and this sensor covers visibility with NIR (visNIR) wavelengths in the 400–1000 nm wavelength range and can measure a total of 150 bands at 4 nm intervals [15].
The Micro 410Shark model uses a line-scanning method. Hence, when acquiring a hyperspectral image of a fixed sample, the shot must be obtained while moving the sensor. To minimize shaking when filming on a moving table, the gimbal was fixed, a hyperspectral sensor was installed, and filming was performed. To perform radiation correction when acquiring hyperspectral images, 500 mL of the sample was placed on a white plate with 99% reflectance and a crystallizing dish and photographed by placing it on the white plate (Figure 5).

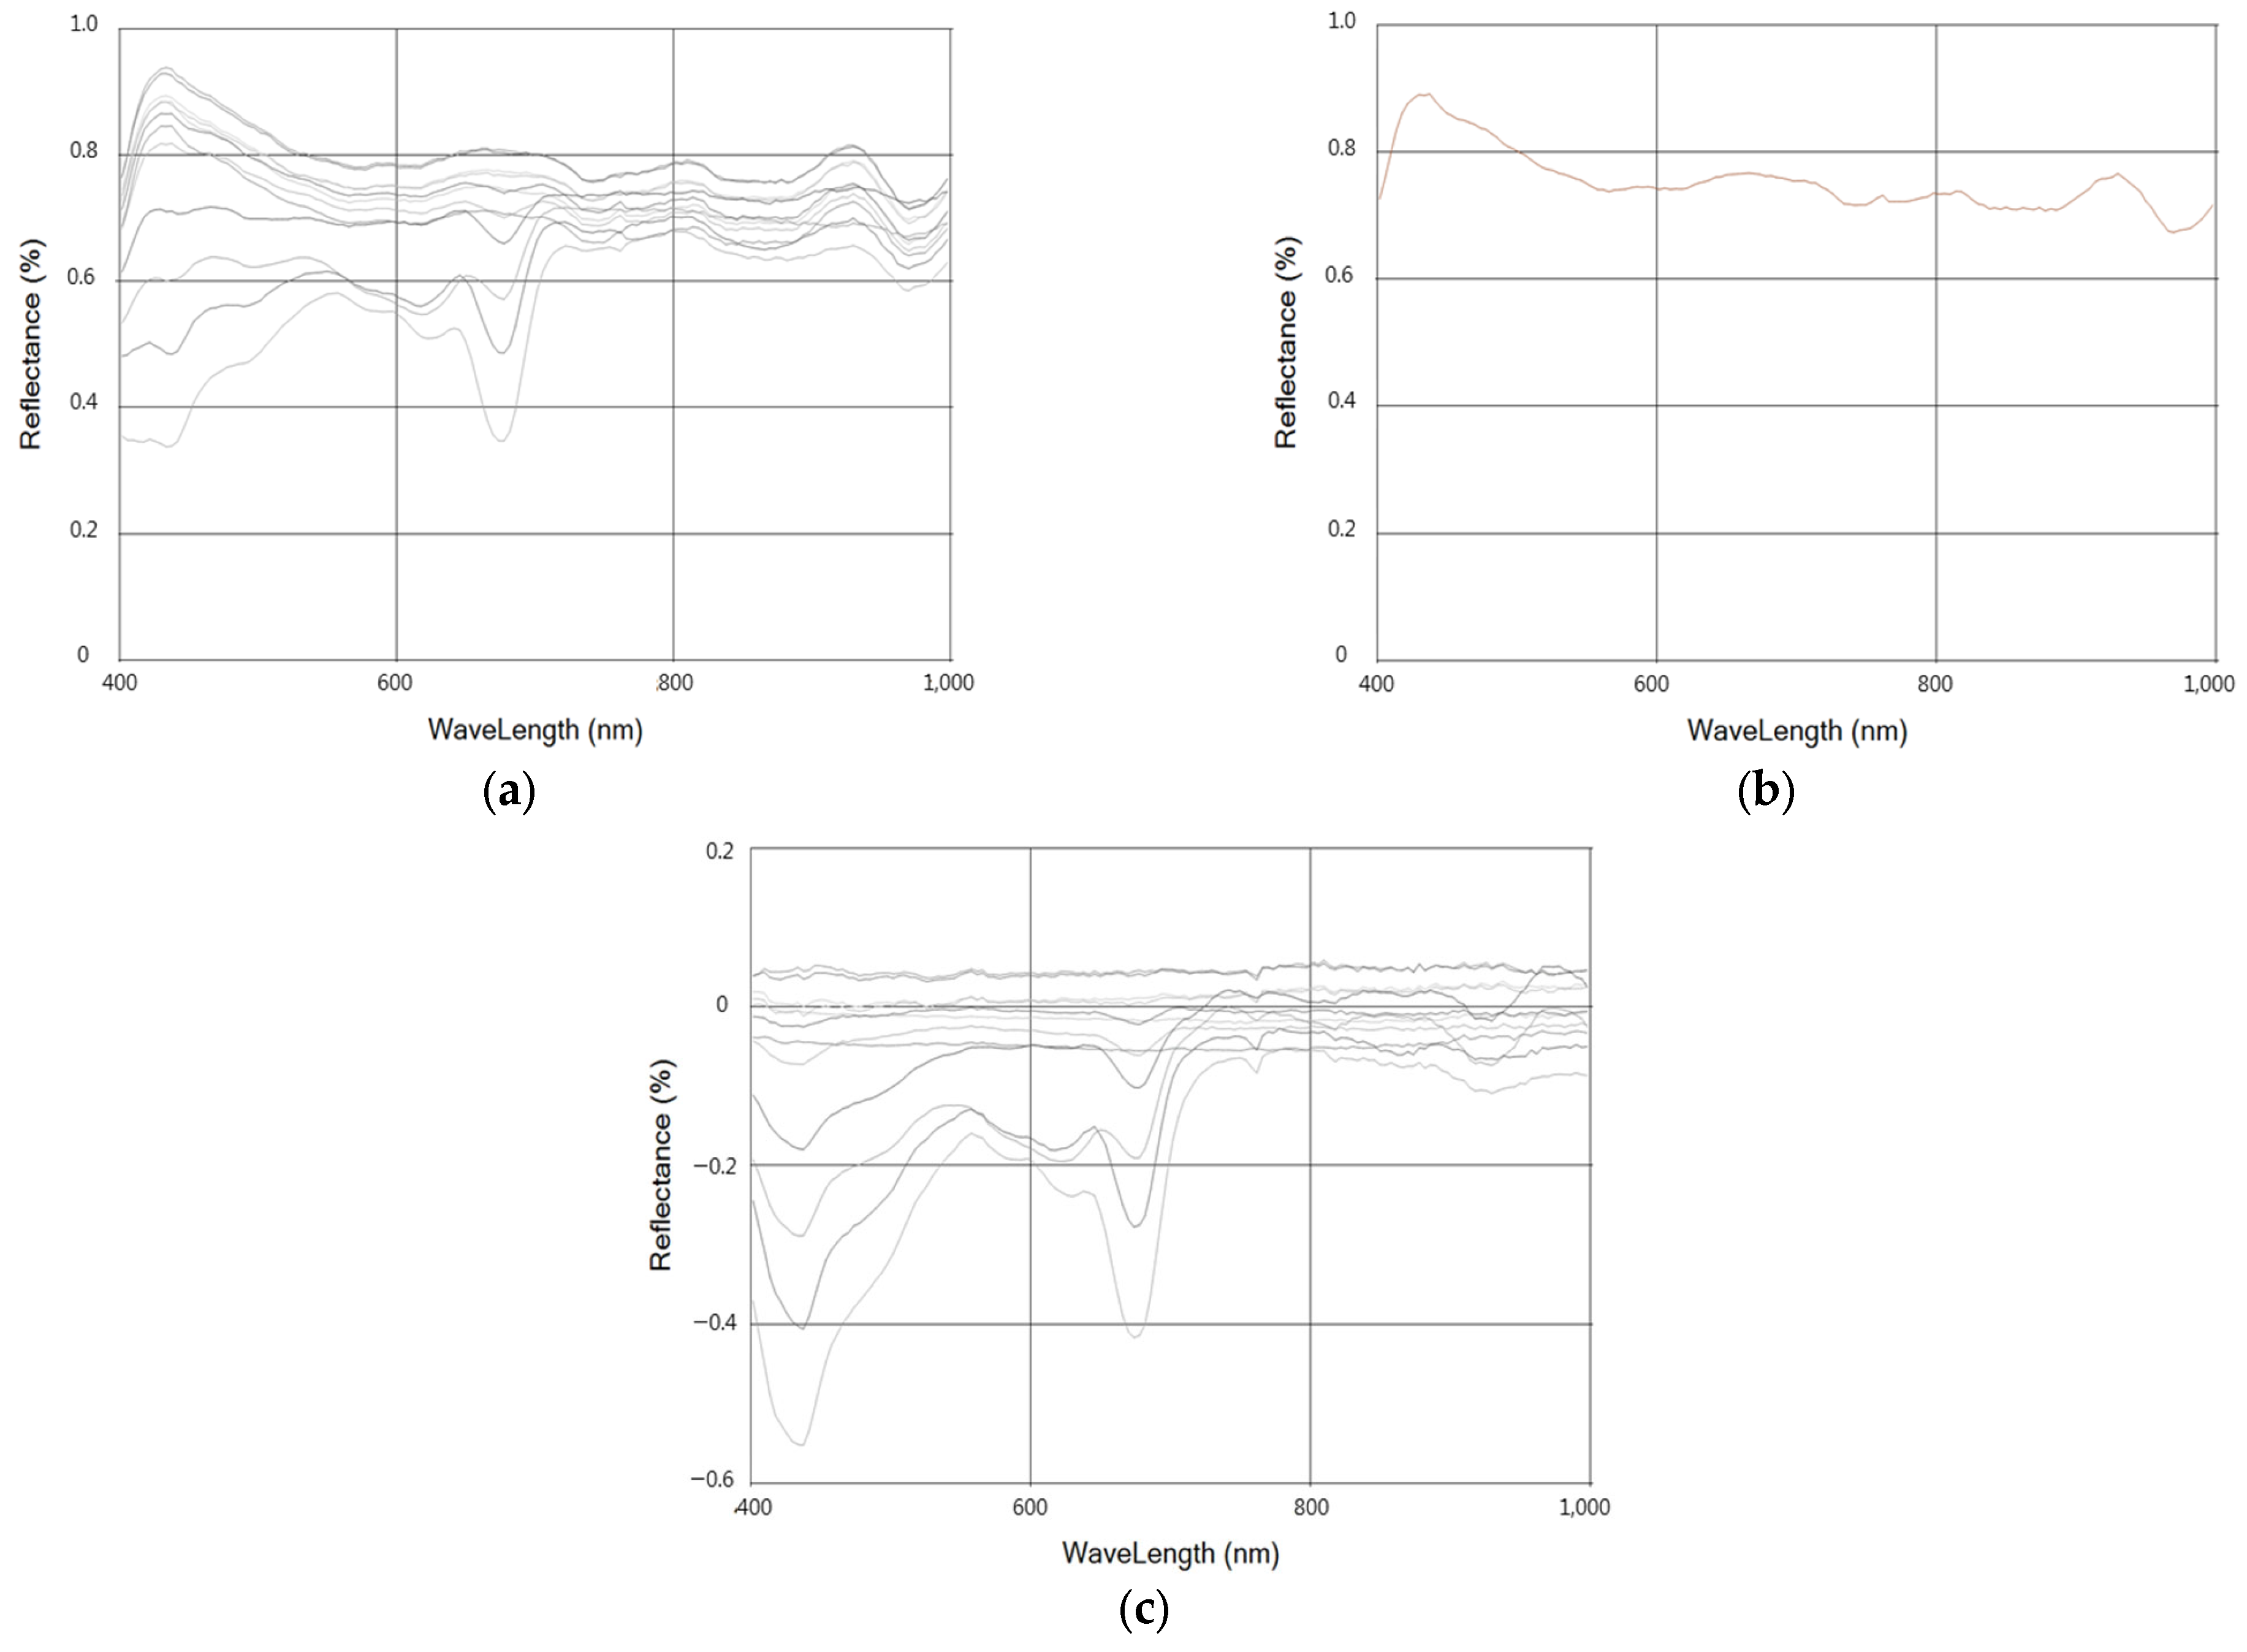
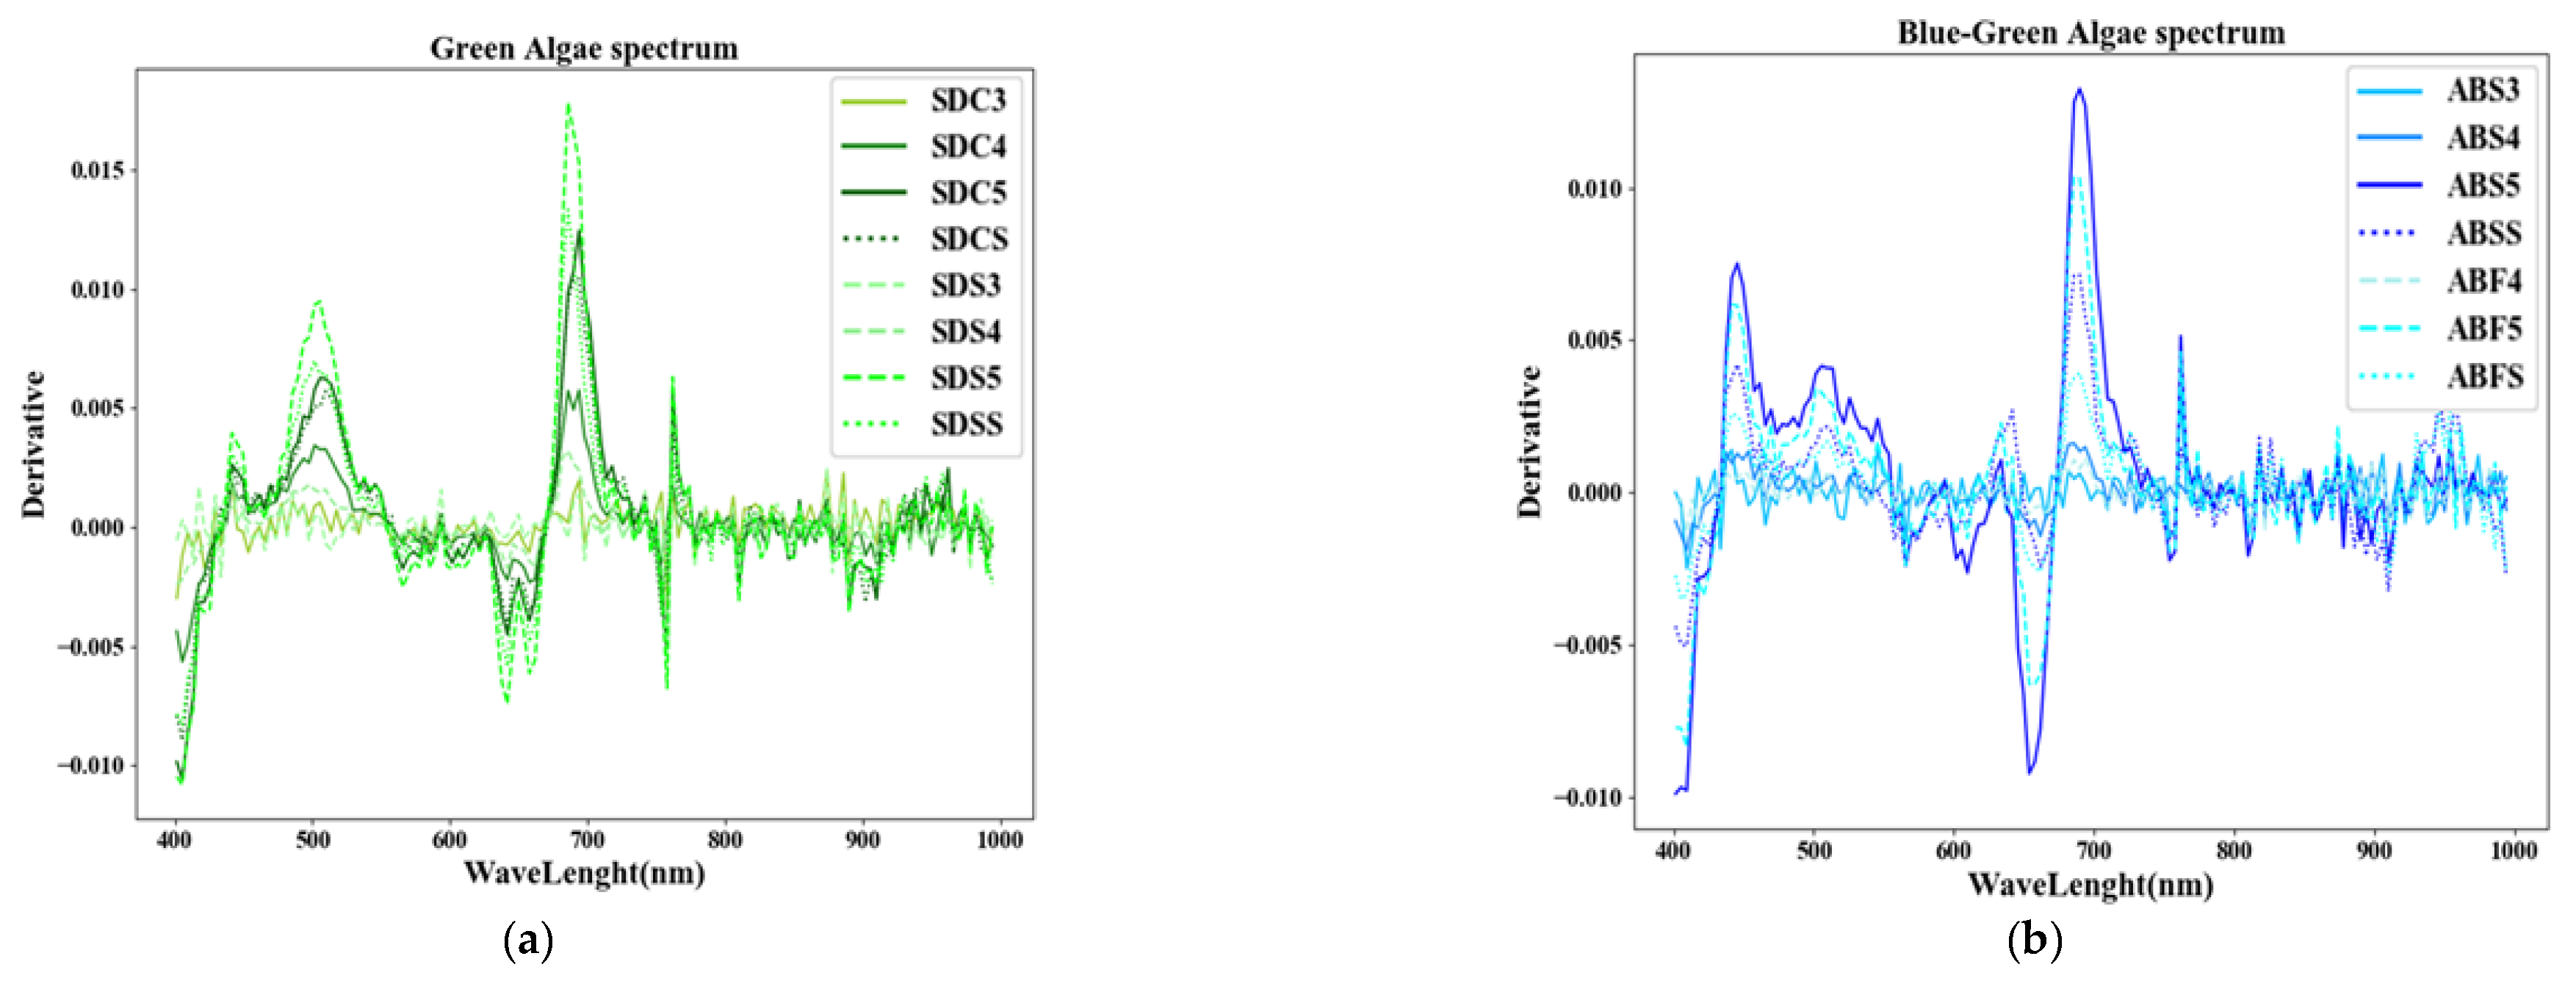
2.3. Algae Spectral Information Extraction Method

A total of 100 spectra (Figure 6b) were extracted from the captured hyperspectral images in the ROI (region of interest), sized 10 × 10 (Figure 6a), for each sample. These 100 spectra extracted for each sample were averaged using post-processing and normalized into one spectral spectrum.
The hyperspectral images taken for each sample were saved as radiance, or the intensity of light having a unit of W/m2/sr that has gone through the non-uniformity correction (NUC) process adopted by the hyperspectral sensor (microHSI) itself [16]. In this study, since hyperspectral images were acquired outdoors; radiation correction was performed through a white plate with 99% reflectance to obtain algae spectral information by utilizing reflectivity, which has radiance characteristics that are not affected by the intensity of the light source; and the reflectance was obtained through reflectance Equation (1), derived from the radiance of spectral information.
Reflectance λ = Radiance λ Reflectance λ × 100 = Radiance λ Radiance w h i t e   p l a t e λ
To extract the unique spectrum of algae that have undergone radiation correction, Gwon’s (2020) method for separating hazardous chemical properties was applied to algae. To exclude the effect of radiance due to conditions other than the characteristics of algae, the algae’s unique spectrum was separated by removing the reflectance value of BG11, which is the base of the algae culture medium. This is shown in Equation (2).
Reflectance a l g a e   λ = Reflectance o b j e c t   λ Reflectance b a s e   λ
where Reflectance a l g a e   λ represents the unique spectrum of algae, Reflectance o b j e c t   λ represents the spectrum of algae culture medium, and Reflectance b a s e   λ represents the spectrum of BG11, and each result is shown in Figure 7.
The extracted spectra of green algae and blue-green algae were normalized through a normalization process, and the green and blue-green algae species were classified and grouped in order to extract the wavelength band with the maximum absorption wavelength peak value, and the absorption wavelength band of green and blue-green algae was analyzed. However, since water tends to absorb light, it was difficult to perform analysis using only the minimum wavelength band, so the trend of the slope change was analyzed by applying the differential to calculate the slope for each wavelength band. The equation for calculating the slope is as follows (Equation (3)):
dy / dx   =   d n o m a l i z e d   r e f l e c t a n c e / d e a v e l e n g t h

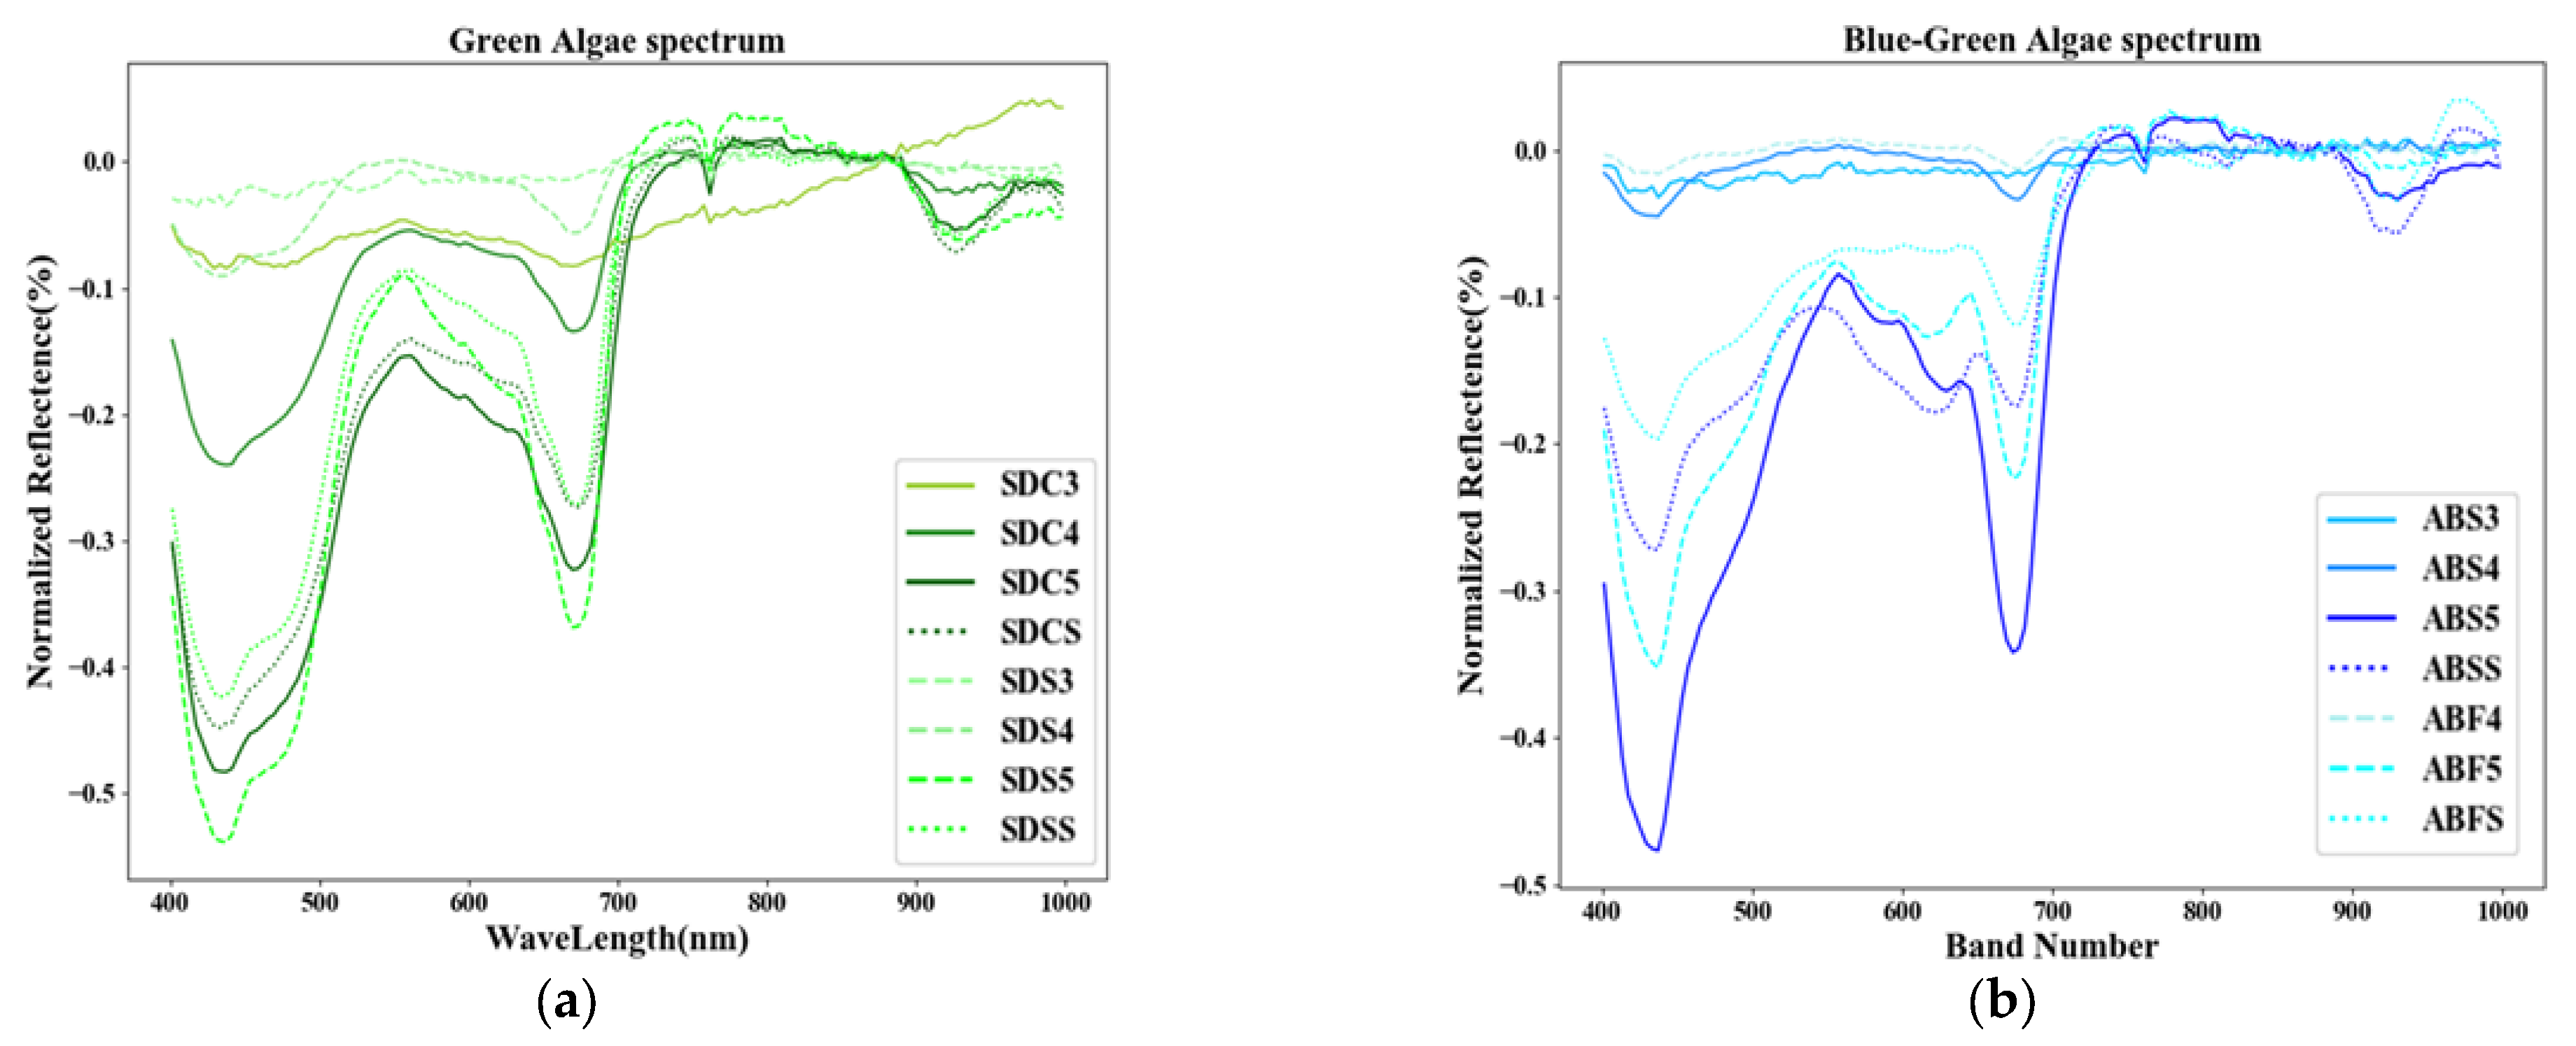
3. Results and Discussion

The samples of the cultured algae revealed that the number of cells was different for each alga. The samples of green algae, namely SDC1, SDC2, SDS1, and SDS2, and those of blue-green algae, namely ABS1, ABS2, ABF1, ABF2, and ABF3, were practically free of algae cells, as these samples were diluted in BG11 (Table 2.). Samples with an algae cell count of 1000 cell/mL or less were excluded from the present study, and analysis was conducted using the spectra of only green and blue-green algae.
Rundquist (1996) suggested that chlorophyll reaches a maximum at a wavelength of 441 nm [17]. Our study results showed a similar trend for both green and blue-green algae. All concentrations of green algae had maximum absorption in the wavelength range between 417 and 437 nm, and the second maximum absorption was obtained between 661–673 nm (Table 3.). Blue-green algae had maximum absorption between 433–437 nm at all concentrations, and the second maximum absorption was found between 669–677 nm. Gitelson (1999) [18], Schalles (2000) [19], and Vincent (2004) [20] proposed that the absorption in the wavelength range of 450–500 nm may be due to Chl-a, carotenoids, and dissolved organic matter [21]. In this study, the algae spectrum was extracted by subtracting the sample spectrum for algae cultivation from the algae culture media spectrum. As a result, green algae showed an increasing trend between 449~529 nm due to the influence of Chl-a, rather than carotenoids and dissolved organic matter. Moreover, for blue-green algae samples, an additional third absorption peak was obtained between 601 and 633 nm (Table 4 and Figure 8).
For the analysis of the elongated 449–529 nm wavelength band identified in the spectral spectrum unique to green algae and the third absorption peak wavelength band additionally identified in the spectral spectrum unique to blue-green algae, the overall instantaneous slope was obtained by applying differentiation to the full wave spectrum. It was confirmed that the wavelength range of 417–437 nm, which has the maximum absorption wavelength of both green and blue-green algae, changes to a positive value. It was also confirmed that 661–677 nm, which has the second maximum absorption wavelength, has a negative slope value. Furthermore, in the wavelength range of elongated 449–529 nm, both green and blue-green algae tended to have positive values, so it was determined to be difficult to identify algal species in the 449–529 nm wavelength range. However, in the third wavelength range of 613–633 nm where the absorption peak appears only in blue-green algae, green algae were confirmed to have a positive value while blue-green algae had a negative value. This is similar to the range suggested by Rowan (1989) who reported that phycocyanin is strongly absorbed at approximately 620 nm [22]. Based on this, green algae and blue-green algae were classified into the third wavelength band (Figure 9 and Table 5).

4. Conclusions

This study aimed to distinguish between green algae and blue-green algae in rivers in Korea using hyperspectral imaging. Blue-green algae formed colonies, which made it challenging to obtain accurate hyperspectral images. To overcome this problem, algal colonies were disrupted using an ultrasonic disruptor before imaging single algal cells. Radiation correction was performed, and the unique spectral characteristics of algae were extracted. The absorption peak values of green algae were in the wavelength range of 417–437 nm and 661–673 nm, with a tendency to elongate in the 449–529 nm range. Blue-green algae had absorption peaks across three wavelength bands, including the range of green algae, and an additional peak at 601–633 nm. Differential analysis showed that green algae had a negative value, while blue-green algae had a positive value in the third peak. By analyzing the third absorption peak, the species of blue-green and green algae can be identified, and their ratio can be determined through future concentration analyses. In this study, we measured two types of green algae and blue-green algae, but we believe that a more accurate classification of algal species can be achieved by adding the analysis of three or more types of algae, such as brown algae, through future research. We intend to conduct mapping research on river algal species classification by applying the results obtained through future research to remote sensing techniques.

Author Contributions

Conceptualization, G.S.K.; formal analysis, G.S.K. and E.J.O.; investigation, G.S.K.; methodology, Y.G.; project administration, G.S.K., E.J.O. and Y.G.; resources, J.H.K.; supervision, E.J.O.; validation, G.S.K.; visualization, G.S.K. and Y.G.; writing—original draft, G.S.K. and Y.G.; writing—review and editing, J.H.K., D.K. and Y.D.K. All authors have read and agreed to the published version of the manuscript.

Funding

This research was performed with the support (22DPIW-C153746-04) of the Ministry of Environment and the Korea Agency for Infrastructure Technology Advancement.

Institutional Review Board Statement

Not applicable.

Informed Consent Statement

Not applicable.

Data Availability Statement

Not applicable.

Acknowledgments

The authors gratefully acknowledge the graduate students of Myongji University, Dankook University, and Inje University.

Conflicts of Interest

The authors declare no conflict of interest.

References

  1. Ministry of Environment (MOE). 2020 Algae (Green Algae) Occurrence and Response Annual Report; Ministry of Environment (MOE): Sejong City, Republic of Korea, 2020; pp. 3–7.
  2. Back, S.C.; Park, J.K.; Park, J.H. Spatial Disrtibution Mapping of Cyanobacteria in Daecheong Reservoir Using the Satellite Imagery. J. Korean Soc. Agric. Eng. 2016, 58, 53–63. [Google Scholar]
  3. Noh, S.Y.; Park, H.K.; Choi, H.L.; Lee, J.A. Effect of Change for Cyanobacteria Growth Pattern in Chudong Station of Lake Daechung. J. Korea Soc. Water Qual. 2014, 30, 377–385. [Google Scholar] [CrossRef] [Green Version]
  4. Kim, B.C.; Kim, K.E.; Pyo, D.J.; Park, H.D.; Heo, W.M. Toxic Cyanobacterial Blooms in Korean Lakes. J. Korean Soc. Water Environ. 1995, 11, 231–237. [Google Scholar]
  5. Jung, W.S.; Kim, Y.D. Effect of abrupt topographical characteristic change on water quality in a river. KSCE J. Civ. Eng. 2019, 23, 3250–3263. [Google Scholar] [CrossRef]
  6. Jung, W.S.; Kim, S.E.; Kim, Y.D. Analysis of influential factors of cyanobacteria in the mainstream of Nakdong river using random forest. J. Wetl. Res. 2021, 23, 27–34. [Google Scholar]
  7. Ki, J.S. Divergence analysis of 16S rRNA and rpoB gene sequences revealed from the harmful cyanobacterium Microcystis aeruginosa. Korean J. Microbiol. 2010, 46, 296–302. [Google Scholar]
  8. Ha, R.; Nam, G.B.; Park, S.H.; Kang, T.G.; Lee, H. A study on comparison of phycocyanin extraction methods for hyperspectral remote sensing of cyanobacteria in turbid onland waters. J. Korean Soc. Water Environ. 2016, 32, 520–527. [Google Scholar] [CrossRef]
  9. Randolph, K.; Wilson, J.; Tedesco, L.; Li, L.; Pascual, D.L.; Soyeux, E. Hyperspectral remote sensing of cyanobacteria in turbid productive water using optically active pigments, chlorophyll a and phycocyanin. Remote Sense. Environ. 2008, 112, 4009–4019. [Google Scholar] [CrossRef]
  10. Park, H.K.; Shin, R.Y.; Lee, H.; Lee, K.L.; Cheon, S.U. Spatio-temporal characteristics of cyanobacterial communities in the middle-downstream of Nakdong River and Lake Dukdong. J. Korean Soc. Water Environ. 2015, 31, 286–294. [Google Scholar] [CrossRef] [Green Version]
  11. Sarada, R.; Pillai, M.G.; Ravishankar, G.A. Phycocyanin from Spirulina sp: Influence of processing of biomass on phycocyanin yield, analysis of efficacy of extraction methods and stability studies on phycocyanin. Process Biochem. 1999, 34, 795–801. [Google Scholar] [CrossRef]
  12. Dekker, A.G. Detection of Optical Water Quality Parameters for Eutrophic Waters by High Resolution Remote Sensing. Ph.D. Thesis, Institute for Environmental Studies, Amsterdam, The Netherlands, 1993. [Google Scholar]
  13. Park, J.R.; Hwang, T.M.; Kim, E.J. A plan for creating a river green algae map using UAV(Korean). Water Future 2017, 50, 11–15. [Google Scholar]
  14. Jung, S.S.; Kim, J.H.; Kim, H.S.; Song, J.H.; Lee, B.G.; Beak, H.J. ANALYSIS of Correlation Raw Drinking Water Quality Characteristics and Toxic Blue-Green Algae Occurrence; Research Institute of Public Health and Environment (RIPHE): Brownfield, ME, USA, 2014; Volume 27, pp. 78–110. (In Korean) [Google Scholar]
  15. Corning. Corning microHSI 410 SHARK: Integrated, Coherent, Airborne Hyperspectral Imaging System. 2017. Available online: https://www.corning.com/microsites/coc/oem/documents/hyperspectral-imaging/Corning-MicroHSI-410-SHARK-Brochure.pdf (accessed on 2 May 2020).
  16. Gwon, Y.H.; Kim, D.S.; You, H.J. A standardized procedure on building spectral library for hazardous chemicals mixed in river flow using hyperspectral image. J. Korea Water Resour. Assoc. 2020, 53, 845–859. [Google Scholar]
  17. Rundquist, D.C.; Han, L.; Schalles, J.F.; Peake, J.S. Remote measurement of algal chlorophyll in surface waters: The case for the first derivative of reflectance near 690 nm. Photogramm. Eng. Remote Sens. 1996, 62, 195–200. [Google Scholar]
  18. Gitelson, A.A.; Schelles, J.F.; Rundquist, D.C.; Schiebe, F.R.; Yacobi, Y. Comparative reflectance properties of algal cultures with manipulated densities. J. Appl. Phycol. 1999, 11, 345–354. [Google Scholar] [CrossRef]
  19. Schalles, J.F.; Yacobi, Y.Z. Remote detection and seasonal patterns of phycocynin, carotenoid and chlorophyll pigments in eutrophic waters. Ergeb. Limnol. 2000, 55, 153–168. [Google Scholar]
  20. Vincent, R.K.; Qin, X.; Mckay, R.M.; Miner, J.; Czajkowski, K.; Savino, J.; Bridgeman, T. Phycocyanin detection from Landsat TM data for mapping cyanobacterial blooms in Lake Erie. Remote Sens. Environ. 2004, 89, 381–392. [Google Scholar] [CrossRef]
  21. Li, L.; Sengpiel, R.E.; Pascual, D.L.; Tedesco, L.P.; Wilson, J.S.; Soyeux, E. Using hyperspectral remote sensing to estimate chlorophyll-a and phycocyanin in a mesotrophic reservoir. Int. J. Remote Sens. 2010, 31, 4147–4162. [Google Scholar] [CrossRef]
  22. Rowan, K.S. Photosynthetic Pigments of Algae; Cambridge University Press: Cambridge, UK, 1989. [Google Scholar]
Figure 1. Algae samples in the culture medium.
Applsci 13 04631 g001
Figure 2. Algae microscope images ((a) Scenedemus communis, (b) Scenedemus sp., (a,b) microscopic images of green algae, (c) Anabaena flos-aquae, (d) Anabaena sp., (c,d) microscopic images of blue-green algae).
Applsci 13 04631 g002
Figure 3. Blue-green algae microscope image ((a) before blue-green algae eradication—non-disrupted blue-green algae; (b) after blue-green algae eradication—blue-green algae after the disruption of clusters).
Applsci 13 04631 g003
Figure 4. Micro HSI 410Shark model (Corning, NY, USA).
Applsci 13 04631 g004
Figure 5. Hyperspectral image acquisition equipment ((a) HSI and gimbal setting—method for correcting the shake of the HSI; (b) hyperspectral system—device configuration for imaging algal samples; (c) white plate (99.9%)—white reference plate used for radiation correction; (d) sample setting—algal samples for collecting hyperspectral data.)
Applsci 13 04631 g005aApplsci 13 04631 g005b
Figure 6. Hyperspectral image extraction method ((a) region of interest—pixel range setting; (b) hyperspectral system—100 spectra for each pixel).
Applsci 13 04631 g006
Figure 7. Algae spectral spectrum ((a) algae spectrum—radiometrically calibrated algae spectra, (b) BG11 spectrum—radiometrically calibrated BG11 spectra, (c) algae spectrum—BG11 spectrum—resultant spectrum of algae with specific spectral features extracted by subtracting the radiometrically calibrated BG11 spectra from the radiometrically calibrated algae spectra).
Applsci 13 04631 g007
Figure 8. Graph of algae spectrum from 400 to 1000 nm. ((a) green algae spectrum—this graph shows the absorption spectrum of the green algae sample used in this study, ranging from 400 to 1000 nm; (b) blue-green algae spectrum—this graph depicts the absorption spectrum of the blue-green algae sample used in this study, ranging from 400 to 1000 nm).
Applsci 13 04631 g008
Figure 9. Graph of derivative algae result. ((a) Green algae derivative spectrum—derivative spectrum results of green algae in the 400–1000 nm range; (b) blue-green algae derivative spectrum—the results of the derivative spectrum for blue-green algae in the 400–1000 nm range).
Applsci 13 04631 g009
Table 1. Algae culture media sample case.
Types of AlgaeAlgae NamesSample CaseConcentration
Green algaeScenedemus communisSDC 1Stock solution × 105
SDC 2Stock solution × 104
SDC 3Stock solution × 103
SDC 4Stock solution × 102
SDC 5Stock solution × 101
SDC SSeed
Scenedemus sp.SDS 1Stock solution × 105
SDS 2Stock solution × 104
SDS 3Stock solution × 103
SDS 4Stock solution × 102
SDS 5Stock solution × 101
SDS SSeed
Blue-Green AlgaeAnabaena flos-aquaeABF 1Stock solution × 105
ABF 2Stock solution × 104
ABF 3Stock solution × 103
ABF 4Stock solution × 102
ABF 5Stock solution × 101
ABF SSeed
Anabaena sp.ABS 1Stock solution × 105
ABS 2Stock solution × 104
ABS 3Stock solution × 103
ABS 4Stock solution × 102
ABS 5Stock solution × 101
ABS SSeed
BG11 Medium-BG11-
Table 2. Results of cell count for algal samples used in the study (SDC; Scenadesmus communis stock solution; SDS; Scenadesmus sp. stock solution; ABS; Anabaena flos-aquae stock solution; ABS; Anabaena sp. stock solution; numbered in descending order of concentration).
Types of Algal SampleScenadesmus communis
(Cells/mL)
Scenadesmus sp.
(Cells/mL)
Anabaena flos-aquae
(Cells/mL)
Anabaena sp.
(Cells/mL)
Stock solution × 1040000
Stock solution × 1036334003670
Stock solution × 10236001433166712,267
Stock solution × 10111,93360,36728,133282,433
Stock solution130,3001,306,100237,000952,067
Seed87,983207,737201,080371,613
Table 3. Absorption wavelength range of selected green algae.
Wavelength Range of SelectedSDC 3SDC 4SDC 5SDC SSDS 3SDS 4SDS 5SDS S
1st Wavelength
(nm)
429.48
(Band 8)
437.48
(Band 10)
437.48
(Band 10)
433.48
(Band 9)
417.46
(Band 5)
433.48
(Band 9)
437.48
(Band 10)
433.48
(Band 9)
2nd Wavelength
(nm)
669.74
(Band 68)
669.74
(Band 68)
669.74
(Band 68)
673.75
(Band 69)
661.73
(Band 66)
669.74
(Band 68)
669.74
(Band 68)
673.75
(Band 69)
Table 4. Absorption wavelength range of selected blue-green algae.
Wavelength Range of SelectedABS 3ABS 4ABS 5ABS SABF 4ABF 5ABF S
1st Wavelength
(nm)
437.48
(Band 10)
437.48
(Band 10)
437.48
(Band 10)
433.48
(Band 10)
437.48
(Band 10)
437.48
(Band 10)
437.48
(Band 10)
2nd Wavelength
(nm)
669.74
(Band 68)
677.75
(Band 70)
673.75
(Band 69)
673.75
(Band 69)
677.75
(Band 70)
673.75
(Band 69)
677.75
(Band 70)
3rd Wavelength
(nm)
613.68
(Band 54)
633.70
(Band 59)
629.70
(Band 58)
621.69
(Band 56)
601.67
(Band 51)
617.68
(Band 55)
625.69
(Band 57)
Table 5. Selected spectrum peak values of algae.
Types of AlgaePeak 1Peak 2Peak 3Peak 4Peak 5
Green
Algae
441.49
(Band 11)
505.56
(Band 27)
652.69
(Band 57)
641.71
(Band 61)
757.84
(Band 90)
Blue-Green
Algae
441.49
(Band 11)
501.56
(Band 26)
633.70
(Band 59)
657.73
(Band 65)
753.84
(Band 89)
Disclaimer/Publisher’s Note: The statements, opinions and data contained in all publications are solely those of the individual author(s) and contributor(s) and not of MDPI and/or the editor(s). MDPI and/or the editor(s) disclaim responsibility for any injury to people or property resulting from any ideas, methods, instructions or products referred to in the content.

