Article

Carbon Storage Potential and Carbon Dioxide Emissions from Mineral-Fertilized and Manured Soil

by
Tomasz Sosulski
1,
Amit Kumar Srivastava
2,
Hella Ellen Ahrends
3,
Bożena Smreczak
4 and
Magdalena Szymańska
1,*
1
Division of Agricultural and Environmental Chemistry, Institute of Agriculture, Warsaw University of Life Sciences-SGGW, Nowoursynowska 159, 02-776 Warsaw, Poland
2
Institute of Crop Science and Resource Conservation, University of Bonn, Katzenburgweg 5, D-53115 Bonn, Germany
3
Department of Agricultural Sciences, University of Helsinki, P.O. Box 28, Koetilantie 5, FI-00014 Helsinki, Finland
4
Department of Soil Science, Erosion and Land Conservation, Institute of Soil Science and Plant Cultivation—State Research Institute, Czartoryskich 8, 24-100 Puławy, Poland
*
Author to whom correspondence should be addressed.
Appl. Sci. 2023, 13(7), 4620; https://doi.org/10.3390/app13074620
Submission received: 11 March 2023 / Revised: 30 March 2023 / Accepted: 4 April 2023 / Published: 6 April 2023
(This article belongs to the Special Issue Sustainable Agriculture and Soil Conservation II)

Abstract

:
Two important goals of sustainable agriculture are food production and preserving and improving soil health. The soil organic carbon content is considered an indicator of soil health. The evaluation of the methods to increase the soil organic carbon content in long-term experiments is usually carried out without considering its environmental effects, (e.g., CO2–C soil emission). This study hypothesized that sandy soils have a low carbon storage potential, and that the carbon accumulation in the soil is accompanied by increased CO2–C emissions into the atmosphere. The study was carried out as a long-term fertilization experiment in Central Poland using a rye monoculture. The changes in the soil organic carbon content (SOC), CO2–C emissions from soil, and plant yields were examined for two soil treatments: one treated only with mineral fertilizers (CaNPK) and one annually fertilized with manure (Ca + M). Over the 91 years of the experiment, the SOC content of the manure-fertilized treatment increased almost two-fold, reaching 10.625 g C kg−1 in the topsoil, while the content of the SOC in the soil fertilized with CaNPK did not change (5.685 g C kg−1 in the topsoil). Unlike mineral fertilization, soil manuring reduced the plant yields by approximately 15.5–28.3% and increased the CO2–C emissions from arable land. The CO2–C emissions of the manured soil (5365.0 and 5159.2 kg CO2–C ha−1 in the first and second year of the study, respectively) were significantly higher (by 1431.9–2174.2 kg CO2–C ha−1) than those in the soils that only received mineral fertilizers (3933.1 and 2975.0 kg CO2–C ha−1 in the first and second year of the study, respectively). The results from this experiment suggest that only long-term fertilization with manure might increase the carbon storage in the sandy soil, but it is also associated with higher CO2–C emissions into the atmosphere. The replacement of mineral fertilizers with manure, predicted as a result of rising mineral fertilizer prices, will make it challenging to achieve the ambitious European goal of carbon neutrality in agriculture. The increase in CO2–C emissions due to manure fertilization of loamy sand soil in Central Poland also suggests the need to research the emissivity of organic farming.

1. Introduction

Soil organic carbon shapes the soil properties and, importantly, contributes to the sequestration of atmospheric CO2–C in terrestrial ecosystems [1]. Several studies have shown that an improvement in the soil productivity is achieved through an increase in the content of the organic fraction in the soil [2,3]. The effect of fertilization on the soil organic carbon (SOC) content has been thoroughly addressed in scientific literature. Organic and inorganic fertilization leads to a direct and indirect increase in the total content of organic carbon and its fractions in soil [4,5,6,7]. Sosulski and Korc [8] reported that, after 40 years of soil manuring, the organic carbon content in the soil increased by 48.8%. These results corresponded with the data obtained by Meena et al. [9], who reported that manure increased the content of humins, humic, fulvic acids, and dissolved organic carbon (DOC) in the soil. In contrast to soil manuring, long-term mineral fertilization did not enhance the soil carbon content [2]. However, Sosulski and Korc [8] found that among the nutrients applied in mineral fertilizers, nitrogen and potassium increased the content of the SOC in sandy soil by 20% and 15%, respectively.
Soil contains a significant portion of the world’s carbon stock and is one of the major sources of atmospheric CO2 [10,11,12]. Therefore, agriculture is considered both a sink and a source of CO2 [13]. Globally, 25–29% of anthropogenic CO2–C emissions originate from cultivated soils [14,15]. Soil CO2–C emissions result from a multi-factorial interaction between the soil’s properties and the intensity of the plant growth and soil tillage [16,17,18,19]. Song and Zhang [20] reported that the relationship between soil CO2–C emissions and the soil temperature and soil moisture were linear. Adviento-Borbe et al. [21] noted that CO2–C soil emissions are better correlated with the air temperature and soil moisture than with the content of NO3- in the soil. However, Sosulski et al. [22], researching loamy sand soil under drought conditions, found that CO2–C soil emissions were more strongly correlated with the NO3- contents than with the air temperature and soil moisture. N-fertilizers are generally assumed to increase autotrophic and heterotrophic respiration [18]. Dhadli and Brar [17] reported that an increase in the dosage of the mineral nitrogen fertilization increased CO2–C soil emissions to a lower extent than an additional dosage of manure. Salehi et al. [23] also measured higher CO2C soil emission levels in a mineral–organic fertilization system than under exclusive mineral fertilization. According to the literature data, intensive mineral and organic treatment may, thus, have an utterly divergent effect on CO2–C soil emissions. A high dosage of N-fertilization can mitigate CO2–C emissions from the soil [20,24], whereas high dosages of different types of manure can increase CO2–C soil emissions [25].
The potential for organic carbon accumulation in agricultural soils continues to be of interest to researchers and European policymakers [26,27,28]. As discussed above, mineral and organic fertilization may have different effects on the SOC content and CO2 release from soils. Although short-term research provides reliable results [29], long-term fertilization experiments form the most suitable and well-established frameworks for evaluating the impact of mineral and organic fertilization on CO2–C soil emissions and carbon storage potentials in the soil [30]. The importance of long-term fertilization experiments was recently addressed in the literature by Johnston and Poulton [31] through the example of the world’s oldest experiments in Rothamsted (England). The value of such experiments (as well as their cost) increases with their duration. Such experiments allow for assessing the impact of the agricultural processes and selecting the optimal farming practices. Moreover, they are the source of long-term data sets that can be used to develop mathematical models which could be used, for example, to predict the impact of a range of agricultural practices on climate change. Therefore, this study uses the data from the fertilization experiment located in Skierniewice, Central Poland, where the amount and type of fertilization have been constant for 91 years. The long history of the trial allows for a reliable assessment of the long-term processes, such as the fertilization effects on the carbon accumulation in the soil. This study hypothesized that sandy soils have a low carbon storage potential, and the carbon accumulation in the soil is accompanied by an increase in CO2–C emissions into the atmosphere. This study aimed to assess the carbon accumulation in the soils and the CO2–C soil emissions in two fertilization systems (inorganic/organic).

2. Materials and Methods

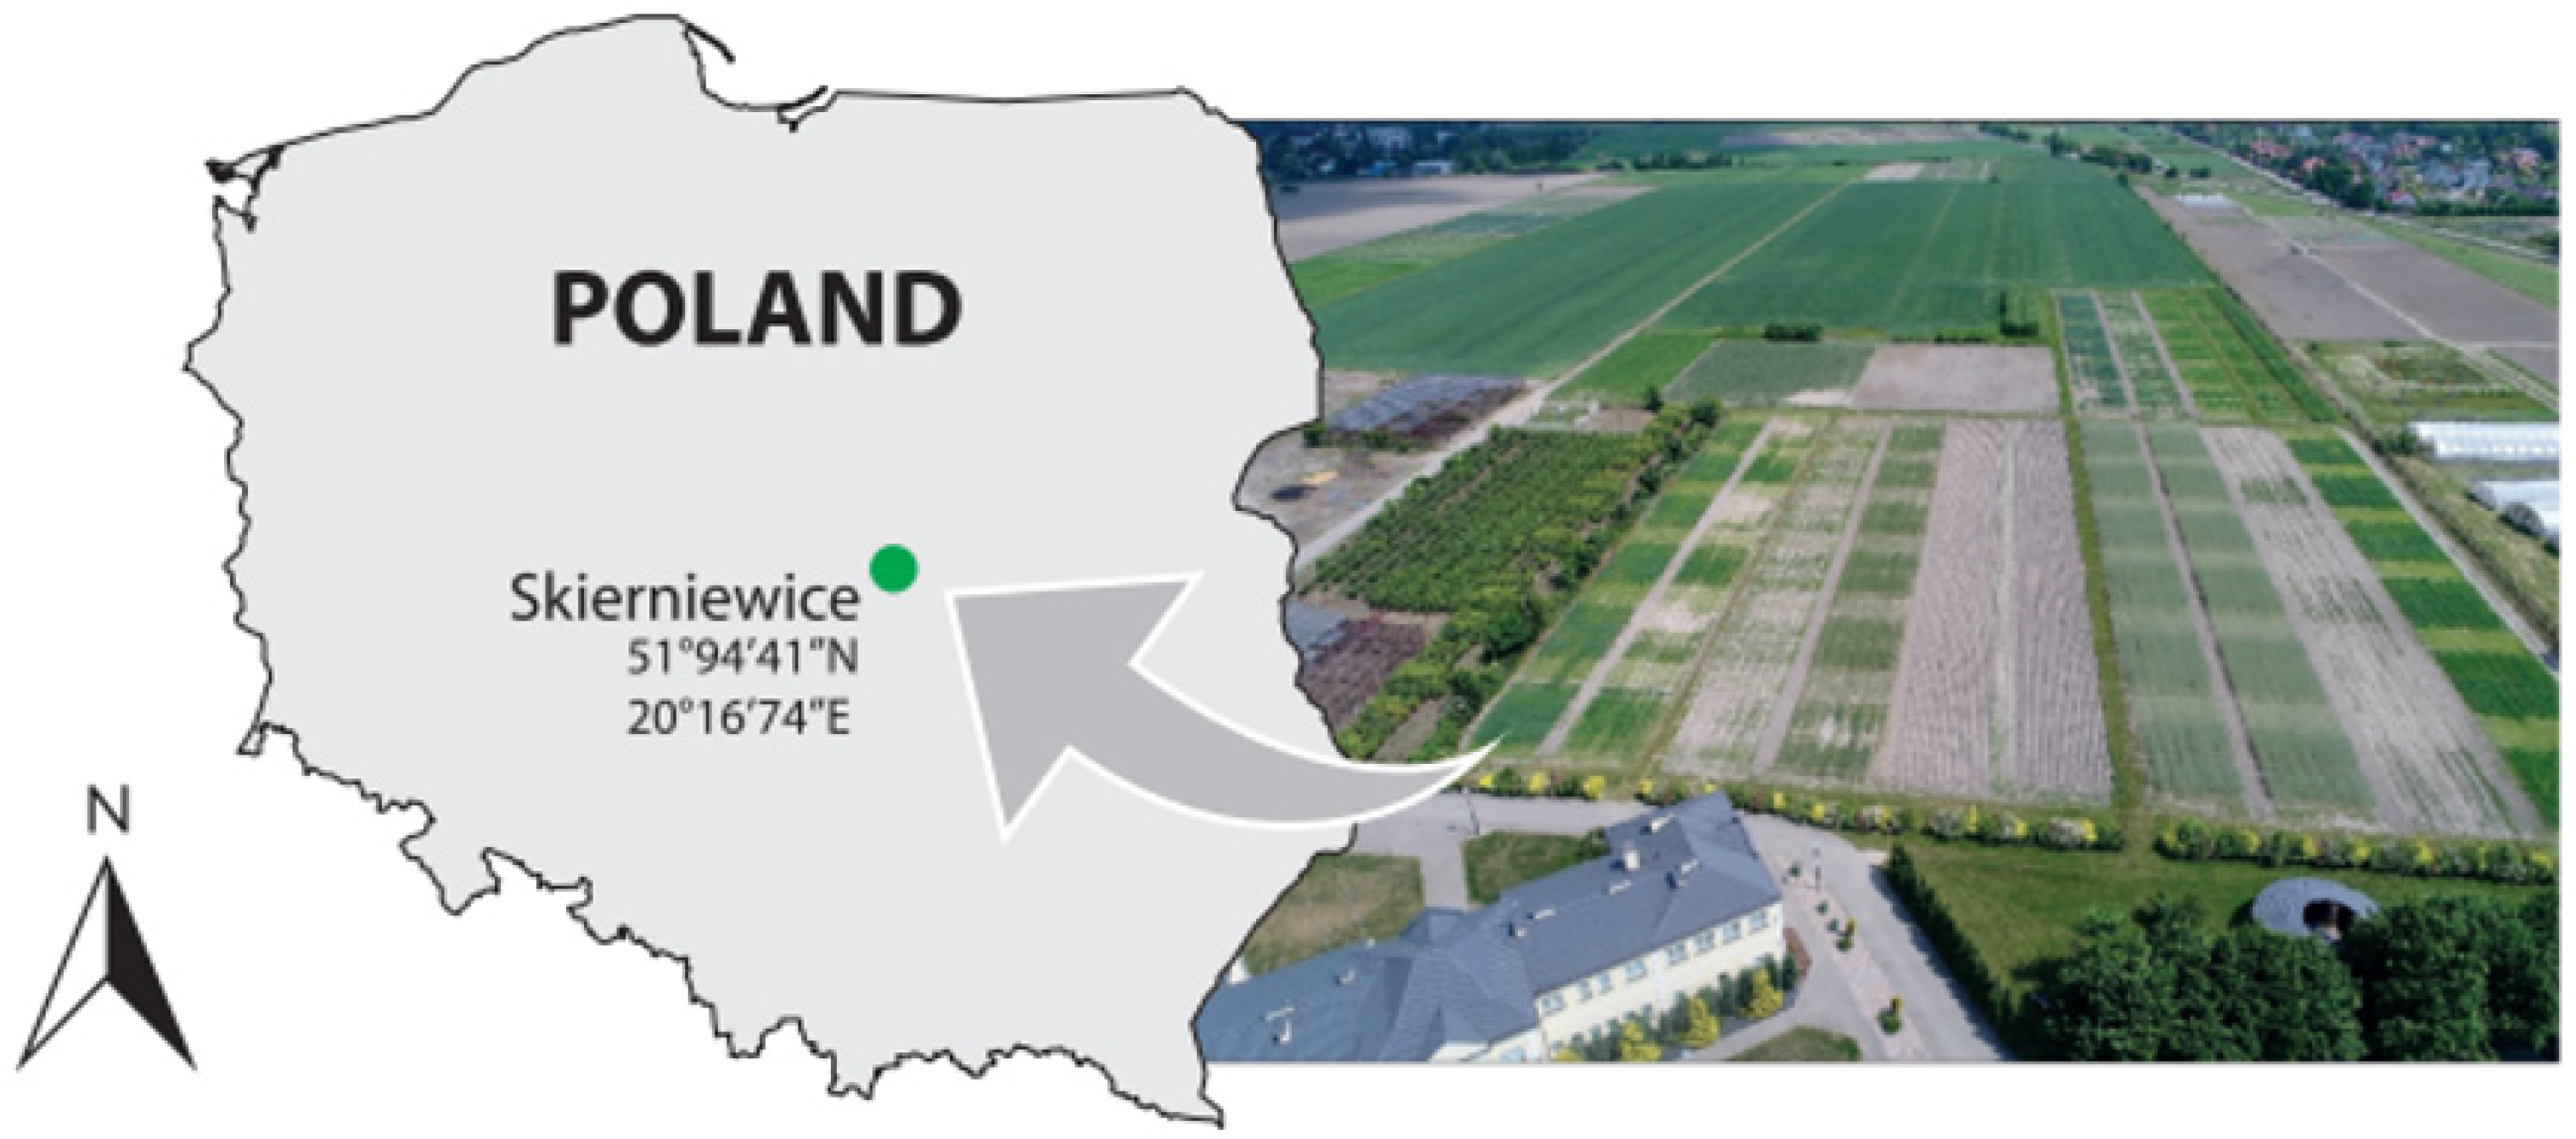
2.1. Long-Term Experiment

This study was conducted at the Prof. Marian Górski Experimental Station of the Institute of Agriculture in Skierniewice (51°94′41″ N, 20°16′74″ E, altitude 123.0 m), Central Poland (Figure 1). The first results of the soil organic carbon (SOC) and total nitrogen (TN) content in the soil of this experiment were dated September 1931. This study was conducted after 90 (the 1st year of the study) and 91 (the 2nd year of the study) years of a rye cultivation in monoculture. The experiment was conducted in a randomized complete block design with five replications. The plot area was 36 m2 (12 m × 3 m) each. This study used a subset of available treatments: mineral (CaNPK) and organic (Ca + M) fertilization (where M–manure). The mineral fertilizers were applied on the soil surface in the following dosages: 90 kg N (as NH4NO3), 26 kg P (as Ca(H2PO4)2), and 91 kg K ha−1 (as KCl, 50%) on the CaNPK treatment. Cattle manure containing 5.0 g N, 1.29 g P, and 4.56 g K kg−1 fresh matter was applied in a dosage of 20 t ha−1 annually, with the amount of nutrients in the manure approximating those supplied by the mineral fertilizers. Soil liming (1.43 t Ca ha−1) was applied as calcium carbonate once every four years in both experimental treatments. In the experiment, the rye was cultivated using a traditional plow system. Phosphate and potassium fertilizers (on CaNPK treatment) and manure (on Ca + M treatment) were applied before plowing (in the last week of August). Nitrogen fertilizers for the CaNPK treatment were applied in the spring before the vegetation started (in the third week of April). The experimental settings, such as the fertilizer type, remained unchanged for 91 years. The soil reference group can be described as Albic Gleyic Luvisols (EndoLoamic Ochric) [32], dominated by loamy sandy textures. In the soil samples taken in September 1931, the SOC and TN content were 5.68 g kg−1 and 0.58 g kg−1, respectively, and the C:N ratio was 9.8.

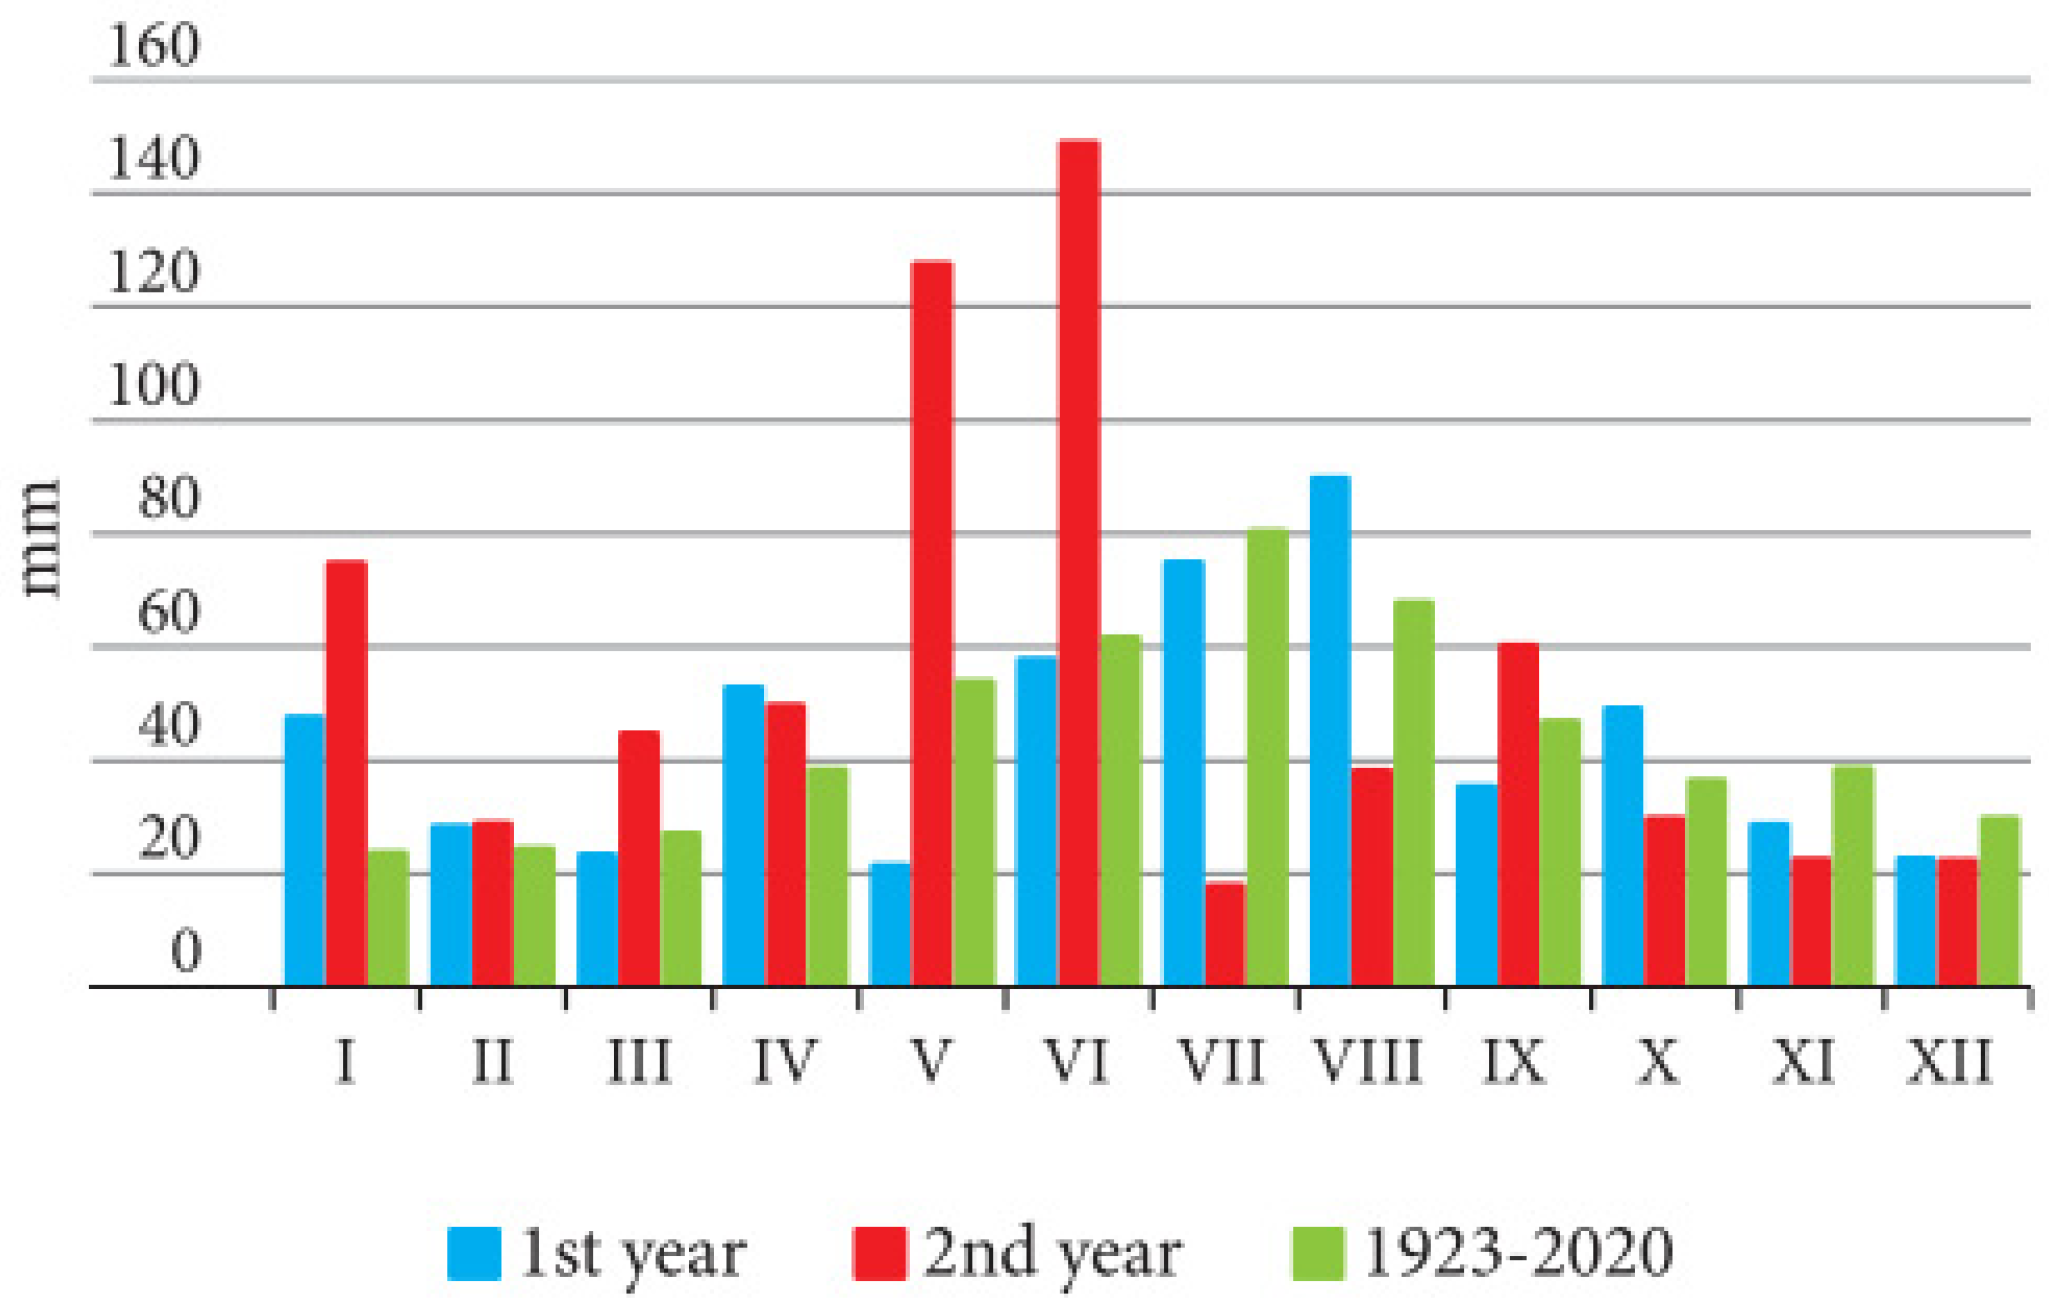
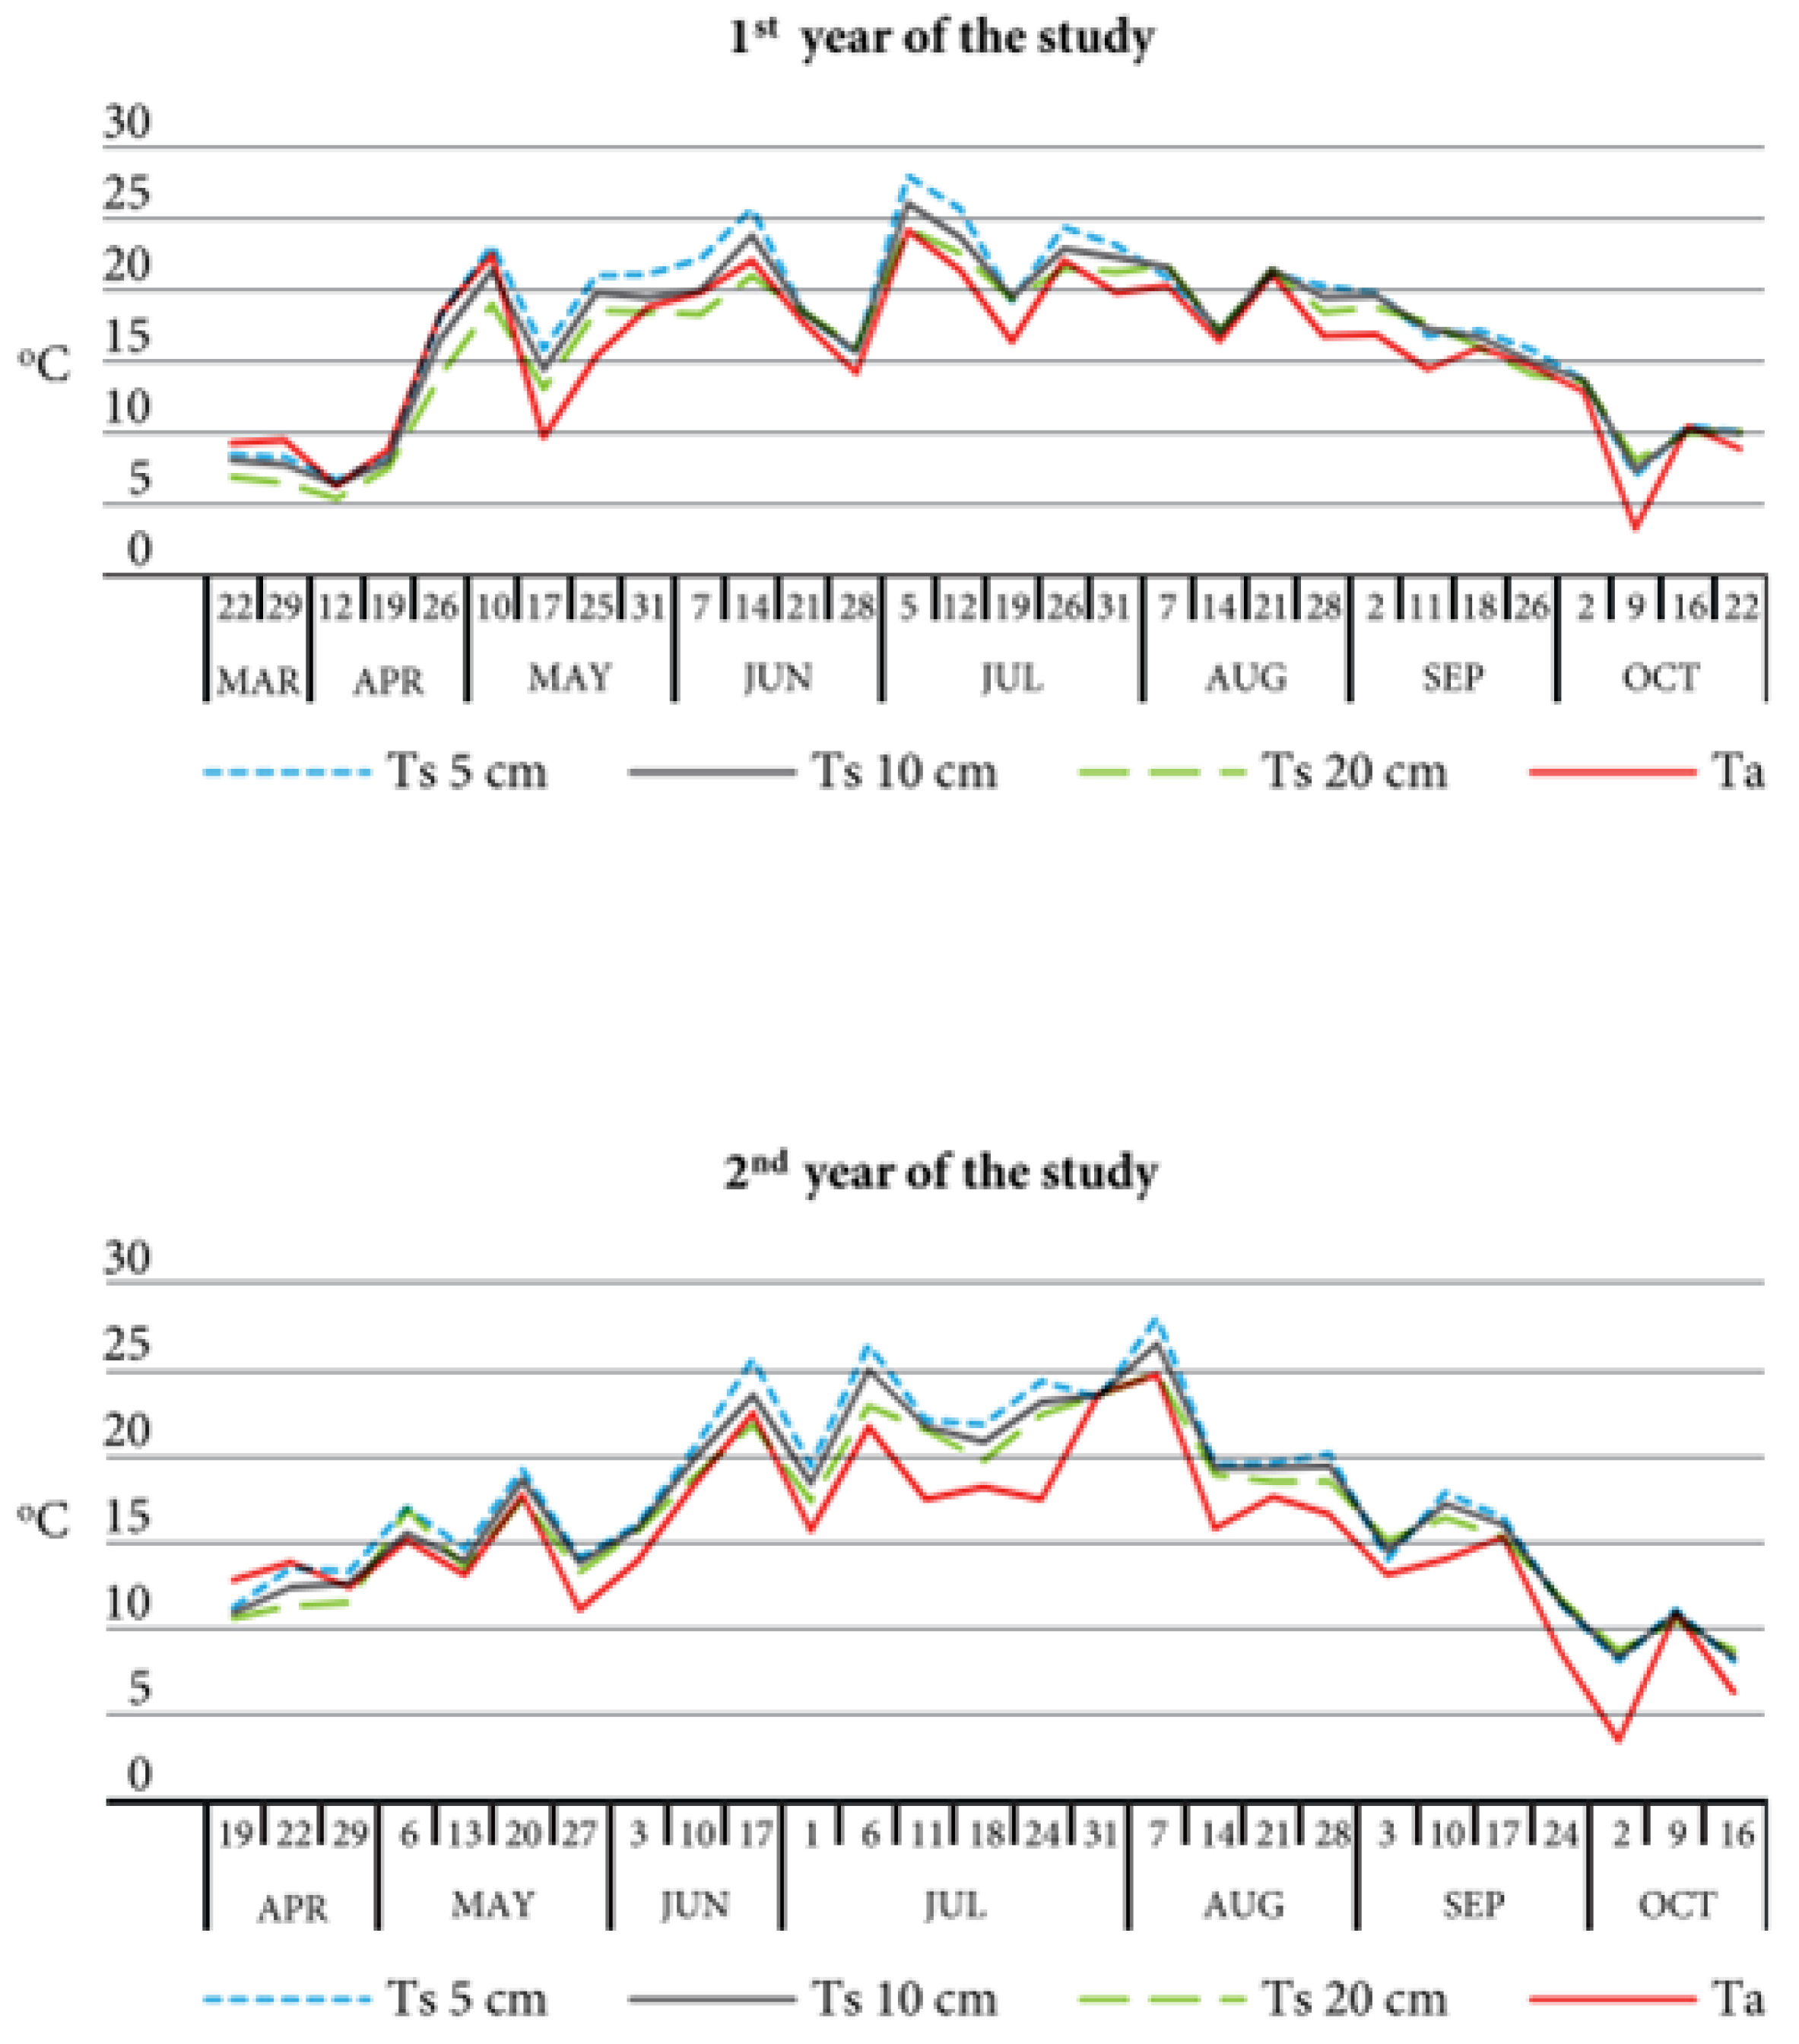
2.2. Atmospheric Conditions

The atmospheric and soil temperatures at a depth of 5, 10, and 20 cm, and the precipitation were measured during the study period by the experimental field’s meteorological station.
The total precipitation in the 1st year (the 90th year of experimentation) of the study (529.5 mm) was similar to the average multi-annual (1923-202) total precipitation (536.6 mm), and the 2nd year (the 91st year of experimentation) (663.0 mm) was higher (Figure 2). In the 2nd year of the study, there was heavy rainfall in May and June. The average air temperature in the 1st year of the study was 8.8 °C and the 2nd year was 8.5 °C. In most instances, the average daily soil temperature values at a depth of 5, 10, and 20 cm slightly exceeded the respective air temperature values (Figure 3).

2.3. Measurement of CO2–C Soil Emissions

The CO2–C soil emissions were measured in situ using a portable FTIR spectrometer model Alpha (Bruker, Germany). The CO2–C soil emissions were estimated from the increase in CO2–C over 10 min in the chamber (ø = 29.5 cm, h = 20 cm), according to the equation given by Hutchinson and Livingston [33] and expressed in kg as CO2–C ha−1 d−1. In the 1st year of the study, the measurements were conducted on 30 days between March 22 and October 22, and in the 2nd year, on 27 days between April 19 and October 16 in all five replications. The soil CO2–C emissions were measured on each measurement day at a randomly selected location in each experimental plot. The measurement times were between 11:00 am and 1 pm to eliminate the diurnal variability. A plastic chamber was plunged 5 cm into the soil to seal the chamber–soil interface. The measurement of the CO2–C content in the chamber’s sealed atmosphere occurred automatically just after the chamber was placed on the soil surface and after 10 min of exposure to the soil surface. Before each CO2–C emission measurement, the chamber was ventilated for 10 min with atmospheric air. The cumulative CO2–C soil emissions i.e., (kg CO2–C ha−1) were calculated using the method proposed by Bosco et al. [34].

2.4. Plant Yields and Soil Analysis

The yields of the rye grain and straw were measured individually for each replicate and treatment in both years of the study using the classic harvester (Wintersteiger AG, Ried im Innkreis, Austria).
In both years of the study, soil samples were taken in the spring and autumn from three soil horizons: Ap (0–25 cm), E (25–45 cm), and Bt (<46 cm) using a Stihl auger (BT 120C, Waiblingen, Germany) at three randomly selected locations in each of the five plots, replicating the fertilizer treatments. The soil samples were taken by moving diagonally across the plots. The three individual soil samples were mixed, constituting a representative sample for each plot. The soil samples from the three soil horizons (Ap, E, Bt) were collected individually. The air-dried soil samples were sieved through a 2 mm mesh and stored at 5 °C in labeled bags for future analyses. In the soil samples taken in the autumn, the SOC was measured using a TOC-5000 A analyzer (Shimadzu, Kyoto, Japan). In the same soil samples, the TN was measured using a Vapodest model (Gerhardt, Bonn, Germany) VAP 30 analyzer. For the soil samples collected in the spring and autumn each year, the dissolved organic carbon content (DOC) was measured using a TOC5000 A analyzer after the fresh soil extraction for 10 min in 0.01 M CaCl2 [35]. The soil pH was determined in 1M KCl using a pH meter Schott type CG 842 (Mainz, Germany).

2.5. Statistical Analysis

The statistical analysis was conducted using the Statistica PL 13.3 software (Tulsa, OK, USA). The analysis of variance (ANOVA) was carried out to determine the significant statistical differences (p < 0.05) between the content of the SOC, TN, and DOC in the soil fertilized with CaNPK and Ca + M in each soil horizon. The homogeneous groups for the studied parameters were determined using Tukey’s (HSD) multiple comparison test. The data were tested for a normal distribution with a Shapiro–Wilk test. The Kruskal–Wallis test (p < 0.05) was used to test for differences in the CO2 soil emissions. The Spearman rank correlation coefficients were set at p < 0.05.

3. Results

3.1. Soil Carbon and Nitrogen Contents and pH Values

Irrespective of the experimental fertilization, the soil pH in the horizons of the studied soils was similar. In both the mineral and organic fertilization treatments, the organic carbon and total nitrogen contents were higher in the topsoil (Ap, 0–25 cm) than in the deeper E (26–45 cm) and Bt soil horizons (<45 cm) (Table 1). After 91 years of static experimental fertilization, the average SOC content found in the Ap, E, and Bt soil horizons in the Ca + M treatment (only manure) was higher by 86.9%, 30.0%, and 55.9%, respectively, than in the CaNPK treatment (only mineral fertilizers). The differences in the total nitrogen content in both soils reached 70.9%, 7.1%, and 35.2%, respectively. As a consequence of the content of the SOC and TN in the soil horizons, the C:N ratio was in a range of 8.7:1–11.3:1 and was higher in the Ap and Bt soil horizons than in the E horizon of the studied soils. The long-term effect of fertilization was an almost a two-fold increase in the content of the SOC and TN in the manure-treated soil (Ca + M). There were insignificant changes in the content of these elements in the mineral-fertilized soil (CaNPK).

3.2. Dissolved Organic Carbon Content

Depending on the season and year of the soil sampling, the content of the DOC in the CaNPK treatment ranged between 3.24 and 5.17 mg C kg−1 in the Ap soil horizons, between 3.29 and 4.38 mg C kg−1 in the E soil horizons, and between 4.06 and 9.44 mg C kg−1 in the Bt soil horizons (Table 2). The content of the DOC in the Ca + M treatment ranged between 5.88 and 16.81 mg C kg−1 in the Ap soil horizons, between 4.89 and 13.01 mg C kg−1 in the E soil horizons, and between 5.51 and 13.46 mg C kg−1 in the Bt soil horizons. The distribution of the content of the DOC in the horizons of the studied soils varied with the season (spring versus autumn) and the observation year. However, the DOC in the soil horizons of the Ca + M treatment was always higher than the CaNPK treatment. The differences between the treatments varied between 30.7 and 225.1% and were highest in the autumn of the 1st year and the spring of the 2nd year.

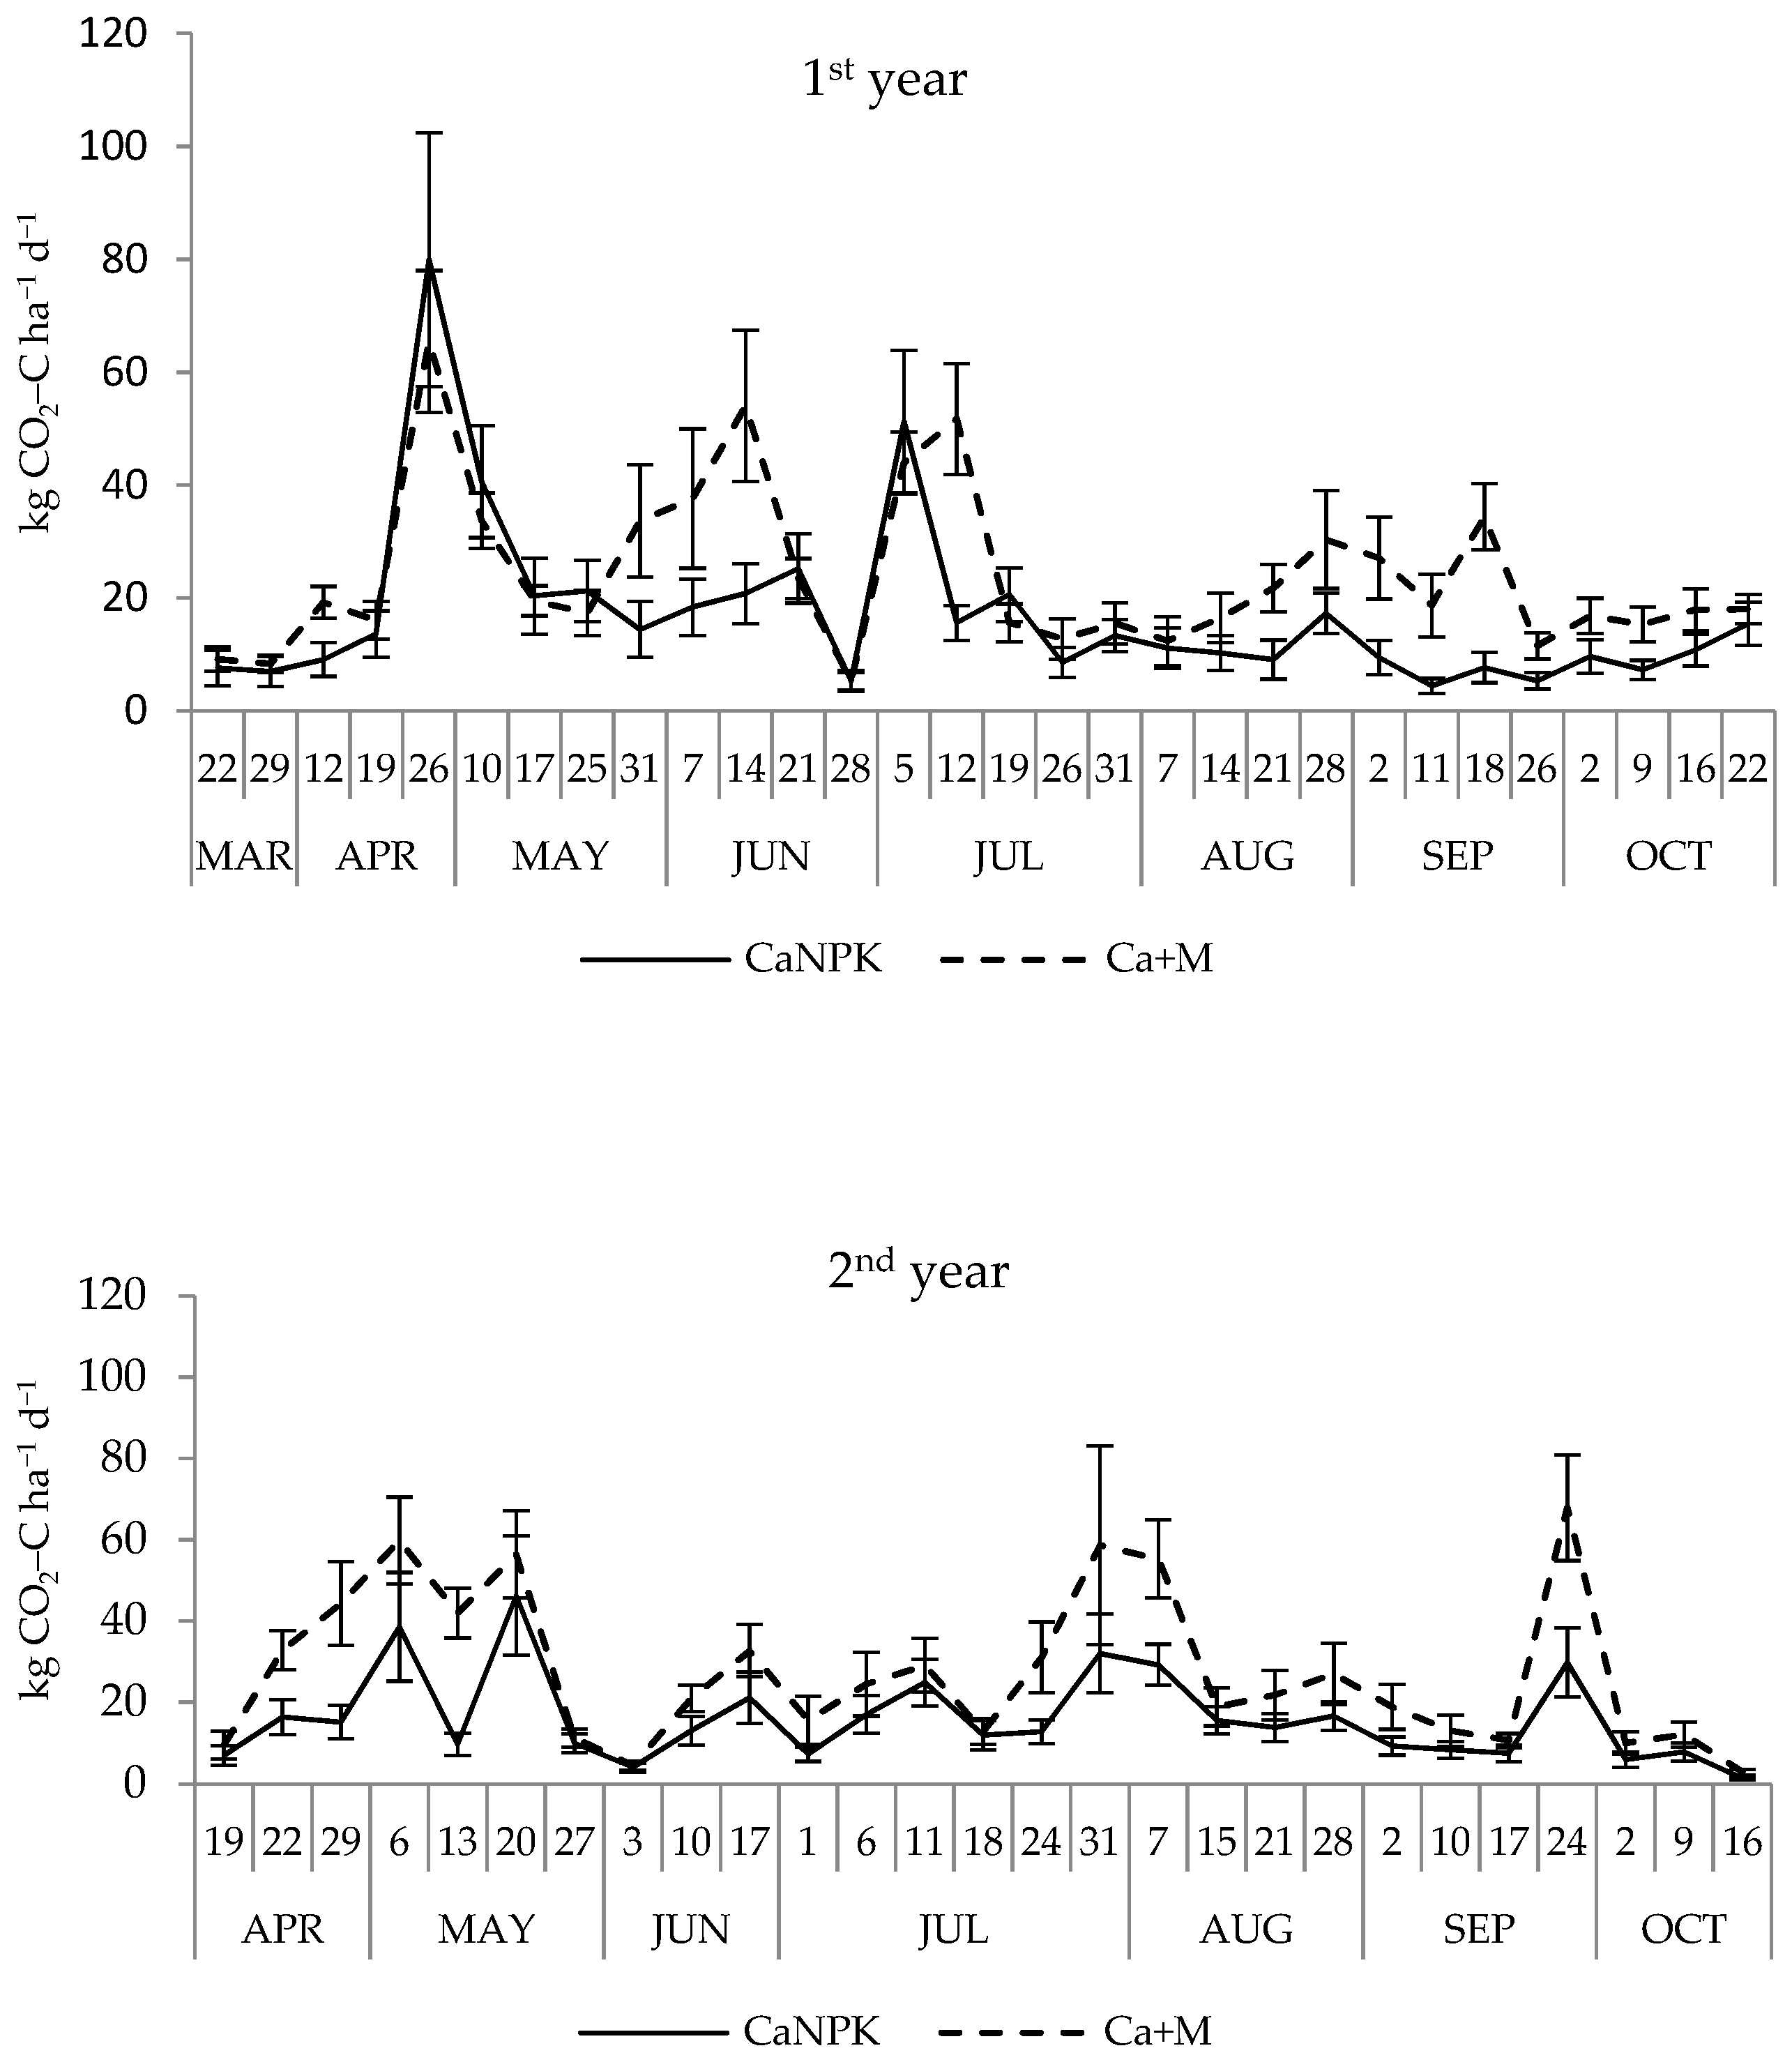
3.3. CO2–C Soil Emissions

The daily and cumulative CO2–C soil emissions are presented in Table 3. The average daily CO2–C soil emissions ranged between 0.93 and 108.58 kg CO2–C ha−1 and between 1.85 and 100.64 kg CO2–C ha−1 for the CaNPK and the Ca + M treatments, respectively. Consequently, the mean cumulative CO2–C soil emissions recorded in the Ca + M treatment exceeded the CO2–C soil emissions from the CaNPK treatment by 36.4% and 73.1% in the first and second year, respectively. In both years, the differences were statistically significant (Table 3).
The seasonal variation in the CO2–C soil emission values is presented in Figure 4. Irrespective of the soil fertilization, in both years, the soil CO2–C fluxes recorded at the beginning and the end of the growing period were comparatively low. On almost all the measurement days, the CO2–C soil emissions recorded in the Ca + M soil exceeded the records for the CaNPK soil. This pattern was more evident in the second testing year than in the first (Figure 4).

3.4. Relationship between CO2–C Soil Emissions and Environmental Factors

In the first year of the study, the soil CO2–C emissions were positively correlated with the precipitation (Spearman’s rank correlation coefficient rs 0.3), and in the second year (above-average rainfall in May and June), the soil CO2–C emissions were negatively correlated with the precipitation (rs−0.14). In both years, the CO2–C soil fluxes were positively correlated with the air temperature (rs 0.44).
In the first year of the study, CO2–C soil emissions were more strongly correlated with the content of the SOC in the E soil horizon (26–45 cm) than with its content in the Ap (0–25 cm) and Bt (<45 cm) soil horizons (Table 4). In the second year, the cumulative CO2–C soil emissions were more strongly correlated with the SOC content in the Ap horizon than with its content in the E and Bt soil horizons.
In both years, the cumulative CO2 soil emissions were positively correlated with the content of the DOC across the soil horizons (Table 4). The cumulative CO2–C soil emissions recorded in the first year were more closely related to the content of the DOC found in spring in the Ap and Bt soil horizons than with its content found in the autumn in the E, Ap, and E soil horizons and the spring in the E soil horizon. In the second year, the cumulative CO2–C soil emissions were positively and more strongly correlated with the content of the DOC measured in the spring in the Bt soil horizon than with its content in the E soil horizon in the spring; its content found in the autumn in the Ap, E, and Bt soil horizons; or its content found in the Ap soil horizon in the spring.

3.5. Plant Yields

The grain and straw yields of the rye cultivated in the long-term experiment are presented in Table 5. The rye grain yields obtained in the CaNPK treatment were significantly higher than those measured in the Ca + M treatment and exceeded them by 15.5% and 28.3% in the first and second years, respectively. The rye straw yield obtained in the CaNPK treatment was significantly higher (23.6%) than the straw yield obtained in the Ca + M treatment, but only in the first year.

4. Discussion

4.1. Soil Organic Carbon

Long-term differentiated mineral and organic fertilization led to significantly different contents of the SOC and TN in the soils from the two treatments investigated in this study. After 91 years of organic fertilization with manure, the content of the SOC in the Ca + M (10.625 g C kg−1) of the Ap horizon exceeded that of the treatment supplemented with mineral fertilizers (CaNPK) by 86.9% (5.685 g C kg−1) (Table 1). This implies that, during the 91 years of manure supply, the accumulation of the SOC in the Ap, E, and Bt horizons of a loamy sand soil increased on average by approximately 54.9, 5.2, and 11.7 mg C kg−1 y−1, respectively, when using the mineral-fertilized soil as a reference (CaNPK). The historical data (showing that in the soil samples taken in 1931, the carbon content was 5.68 g kg−1) allowed for a realistic estimate of the carbon sequestration in both soils. The topsoil (Ap) of the long-term manured (Ca + M) loamy, sandy soil accumulated approximately 200 kg C ha−1 y−1, whereas for the mineral fertilization system (CaNPK), it remained almost constant. This means that plant residues remaining in the soil fertilized only with mineral fertilizers might have kept the content of the SOC in the soil at a relatively constant level. Nitrogen supplied annually with mineral fertilizers can intensify the mineralization processes of the soil organic matter, thus not promoting carbon accumulation in the soil of the CaNPK treatment. The obtained results corresponded with the data from several long-term European experiments. Körschens et al. [36] analyzed the data from 20 long-term European experiments in different soil, climatic, and agro-technical conditions. The sites varied in average annual temperatures (from 8.1 to 15.38 °C), annual precipitation (from 450 to 1400 mm), and soil clay content (from 3 to 31%). Predominately, the content of the SOC in the manured soils was higher than in the mineral-treated soils. At similar dosages of manure applied in those experiments, the differences ranged between 5.6 and 100%. In only three sites (Vienna, Austria, and Bad Salzungen and Rauischholzh, Germany), the content of the SOC in the manured soils was similar or even lower than in the mineral-treated soils. Further analysis of the data from the oldest European long-term experiment showed that the soil texture was the key factor regulating the soil carbon sequestration. The soil’s accumulation of carbon originating from manure ranged between 11% and 25% in sandy soil (such as that at the research site in this study) and loamy soil, respectively [37]. In our study, manure increased the content of the SOC not only in the topsoil layer but in the complete soil profile up to a depth of 60 cm (Table 1). The SOC contents in the E and Bt soil horizons in the Ca + M treatment were 30.0% and 55.9% higher, respectively, than for the CaNPK treatment. A similar effect of soil manuring was obtained by Liu et al. [38]. Don et al. [39] reported that fresh organic carbon was effectively translocated into the subsoil, and subsoil organic carbon formed more than 30% of the total stock of the organic carbon in the soil. This was confirmed by Sosulski et al. [40], who found a higher DOC leaching from topsoil-manured soil than from mineral-fertilized soil.
The differentiated fertilization led to significant differences in the content of the DOC in the soil (Table 2). The total amount and distribution of the DOC among the soil horizons varied with the date of the soil sampling and were not related to the distribution of the total organic carbon content in the soil profile. Irrespective of the dates of the soil sampling, the content of the DOC in the horizons of the manured soil was higher than in the corresponding horizons of the CaNPK-treated soil. Gregorich et al. [41] also reported that, in comparison to non-fertilized and ammonium nitrate-fertilized soil, manuring increased the content of the DOC in the soil. In the cited study, the content of the DOC sharply increased after the manure application and decreased during the season. Liu et al. [38] reported that the DOC concentration in the soil increased linearly with the total organic carbon increase in the soil profile up to 60 cm deep after soil manuring. In our study, the content of the DOC in the Ap soil horizon was higher in the autumn (after manuring) than in the spring, but only in the first year of the study. In the second year of the study, intensive DOC leaching from the topsoil during winter might have increased its content in the deeper soil layers in the spring. A higher content of water-extractable organic carbon in the manured soil than in the mineral-treated soil was also found by Marinari et al. [42]. The absence of such evident differences in the content of the DOC in the horizons of the CaNPK soil on the subsequent dates of soil sampling confirmed the opinion common in the literature that mineral fertilization does not increase the content or dynamics of the DOC in the soil [41].

4.2. CO2–C Soil Emission

Regardless of the soil fertilization, our study showed a very high temporal variability of the daily CO2–C soil emissions (Table 3), which was typical for gas emissions from the soil [21,25,43,44]. The average daily CO2–C emissions from the soil measured in the Ca + M treatment was 41.7% and 72.1% higher than in the CaNPK treatment in the first and second year of the study, respectively. In the first year, higher CO2–C emissions from the Ca + M than from CaNPK-treated soil were observed in mid-April, between the end of May and mid-June, and from the beginning of August until the end of the study period (Figure 4). In the second year, on almost all the measurement dates, the CO2–C emissions from the Ca + M-treated soil were higher than those from soil that only received mineral fertilizer. In both years, the differences were statistically significant (Table 3). Higher CO2–C emissions from the manured soils than from the mineral-fertilized soils might indicate a higher importance of heterotrophic CO2–C emissions resulting from the decomposition of organic matter by soil microbes (bacteria, fungi). Soil heterotrophic CO2–C emissions are considered one of the most significant components of carbon cycling, affecting the soils’ limited importance in carbon sequestering [37,45]. The scientific literature thoroughly addressed the effect of mineral and organic fertilization on soil CO2–C emissions. The relationship between CO2–C soil emissions and the different mineral fertilization strategies was analyzed by Ding et al. [24]. In their study, the CO2–C soil emissions in the NPK treatment were 73.9%, and the NP (no potassium) treatment was 57.3% higher than the NIL treatment (non-fertilized soil). In comparison to the NIL treatment, the CO2–C soil emissions in the PK (no nitrogen) and NK (no phosphorus) treatments were only 10.1% and 5.5% higher, respectively. N-fertilization increased plant growth and the soil microbial activity affecting higher CO2–C soil emissions [46]. Sainju et al. [18] reported that CO2–C soil emissions increased by approximately 14% after nitrogen fertilizer application at a dosage of 150 kg N ha−1. On the contrary, a very low increase in CO2–C soil emissions after an NPK application was recorded by Zhang et al. [47]. However, Alluvione et al. [48] and Zhai et al. [49] reported that the mineral fertilization did not have an effect on the CO2–C soil emissions. However, at a rate of 300 kg N ha−1, CO2–C soil emissions declined due to a lower enzyme activity in the soil [50]. A decrease in CO2–C soil emissions by 10% was recorded after an N-fertilizer application in the study by Ding et al. [14]. Similar data were obtained by Song and Zhang [20]. In summary, most studies showed a significant effect of the fertilization on CO2–C soil emissions. The differences between the study results illustrate the need for further studies on the efficiency of the available fertilization strategies to reduce emissions and mitigate climate change.
There is scientific evidence that manure affects CO2–C soil emissions [47,49,51]. CO2–C soil emissions increased sharply following the manure application [41]. In our study, manure was applied in autumn before the rye sowing (Ca + M). Compared to the CaNPK treatment, an evident increase in CO2–C soil emissions due to manuring was mainly observed in the autumn of the first year. Ding et al. [24] stated that at an annual mineralization rate of 24–36%, manure increased CO2–C soil emissions by 16% compared to mineral fertilization. Ray et al. [25] and Gregorich et al. [41] reported that, regardless of the type of manure, the CO2–C soil emission rate increased with the manure dosages. In this study, the cumulative soil CO2–C emissions for the Ca + M treatment were much higher than for the CaNPK treatment (Table 1). High soil CO2–C emissions after the manure application were also recorded by Ding et al. [24]. The amount of CO2–C released from the manured soil was more than two times higher than that from the non-treated soil. The data from this study showed that the difference in the CO2–C soil emissions between the soils that received manure and those that received mineral fertilizers was higher in the year characterized by above-average precipitation. Long-term fertilization with manure significantly increased the content of the SOC (Table 1) and was generally associated with improved physical soil properties [52]. Such improvements in the structure probably resulted in a higher aeration of the manured soil compared to the soils fertilized with mineral nutrients, which was particularly important during the periods of water excess in the soil. A higher soil aeration and porosity increased CO2–C soil emissions [53]. This was a likely explanation for the finding that the cumulative CO2–C soil emissions in the Ca + M treatment were similar during the observation years, whereas the cumulative CO2–C soil emissions in the CaNPK treatment in the first year was 32.2% higher than in the second year (wet year). Adviento-Borbe et al. [21] showed that CO2–C emissions depend on the soil water content. The optimal soil moisture for CO2–C soil emissions was 60–70% of the water-filled pore space (WFPS). A soil moisture level below 50% WFPS did not affect the CO2–C soil emissions [24,54]. When the water filled more than 70% of the pore space, CO2 soil emissions were reduced to a minimum level. Therefore, in the study by Alluvione et al. [48], Feiziene et al. [46], and most likely in this study, a decrease in CO2–C soil emissions at a high soil water level could be observed.
The amount of CO2–C released from the soil was related to the crop biomass production and changes in the SOC content. According to Li et al. [55], the soil carbon storage was the key factor driving CO2–C soil emissions. In the scientific literature, the SOC content was considered one of the most important drivers, along with the soil/air temperature, soil moisture, type of soil tillage, soil texture, crop residue management, and fertilization [11,56]. A very strong correlation between the CO2–C soil emissions and the content of the SOC was described by Dhadli and Brar [17]. In this study, the cumulative CO2–C soil emissions were strongly and positively correlated with the content of the SOC in the soil profile up to a depth of 60 cm (Table 4). In the first year of the study, however, the cumulative CO2–C soil emissions were correlated more strongly with the soil carbon content in the E soil horizon than with its content in the Ap horizon. This might be explained by the multi-factor influence of the atmospheric and soil conditions in this year of the study. According to Gregorich et al. [41], the content of the SOC in the topsoil was not a good predictor of CO2–C soil emissions in drier seasons. Corresponding to this, in the year with higher precipitation (second year), the cumulative CO2–C soil emissions were more strongly correlated with the SOC content in the topsoil than in the deeper soil horizons.
Most of the CO2–C released from the soil came from decomposing short-lived organic matter [57]. According to Gregorich et al. [41], a higher DOC content in the soil improved the biological activity, and thus affected the soil CO2–C emissions. A lower CO2–C release from the CaNPK–treated soil was associated with a lower availability of the readily biodegradable carbon compound content in the soil [58]. In our study, the cumulative CO2–C soil emissions were positively correlated with the content of the DOC in the soil horizons up to 60 cm deep (Table 4). In the first year, the cumulative CO2–C soil emissions showed the highest correlations with the content of the DOC in the Ap and Bt soil horizons measured in the spring. In the second year, they was positive and most strongly correlated with the content of the DOC found in the Bt soil horizon in the spring. The positive correlation between the cumulative CO2–C soil emissions and the content of both the SOC and DOC in E and Bt observed in this study confirmed that carbon dioxide was also formed in the deeper soil layers [59].
Several studies showed that high soil CO2–C emissions coincided with intensive plant growth [16,21,22]. In our study, relatively high CO2–C soil emissions occurred throughout the intensive rye growth (exponential biomass growth during the first stages of crop development) in April and May of the year, with an annual temperature and precipitation similar to the corresponding multi-year average (first year) (Figure 2). Therefore, the share of the combined amount of CO2–C released in both months reached 47% and 33% of the total cumulative soil CO2–C emissions observed that year in the CaNPK and Ca + M treatments, respectively (Figure 4). Lee et al. [60] found higher CO2–C soil emissions in the spring than the autumn, coinciding with the increasing soil temperature and soil moisture. In the second year of the study, extremely low CO2–C soil emissions were recorded at the end of April. That year, the share of CO2–C released from the CaNPK and Ca + M treatments in May and June reached 51% and 52% of the total cumulative CO2–C soil emissions, respectively.
The distribution of the CO2–C emissions during the year, observed in our experiment, could also result from changes in the weather conditions, i.e., air temperature. The CO2–C soil emissions were positively correlated with the air temperature. The relationship between the CO2–C soil emissions and the soil/air temperature was analyzed in numerous studies [14,20,60,61]. Higher CO2–C soil emissions in the summer and lower CO2 emissions in the winter–spring period were described by Pareja-Sánchez et al. [16], Bogužas et al. [62], and Behnke et al. [63]. Sainju et al. [18] reported that, irrespective of the climate conditions, the CO2–C soil emissions were linearly correlated with both the soil and air temperature. The temperatures positively enhanced the mineralization of the organic compounds [64].

5. Conclusions

Compared to the mineral fertilization, the multi-year organic fertilization of loamy sandy soils increased the organic carbon content in the topsoil by approx. 86.9% and 30.0–55.9% in the deeper soil horizons. However, using exclusive manure fertilization, about 15.5–28.3% lower grain yields were obtained than with mineral fertilization. Thus, soil manuring proportionally reduced the photosynthetic CO2 assimilation compared to mineral fertilization. Moreover, CO2–C soil emissions from the long-term manured soils can significantly exceed that of the soils receiving mineral fertilizers. The CO2–C soil emission measurements showed that between 2975.0 and 3933.1 kg CO2–C ha−1 were released into the atmosphere in the mineral fertilization system, and between 5149.2 and 5365.0 kg CO2–C ha−1 were released in the organic fertilization system. The long-term effect of the fertilization was an almost two-fold increase in the content of the SOC and TN in the manure-treated soil (Ca + M). Insignificant changes were noted in the content of these elements in the mineral-fertilized soil (CaNPK). The results from this experiment suggest that only long-term fertilization with manure might increase the carbon accumulation in the sandy soil. However, it consequentially causes an undesirable increase in CO2 emissions into the atmosphere and a decrease in plant yields. Therefore, the organic fertilization of sandy soils with a low carbon accumulation potential, although it certainly improves the soil health (increases the SOC content), may hinder the achievement of climate-neutral agriculture and interferes with the productive function of the soil as a result of reducing plant yields.

Author Contributions

Conceptualization, T.S.; methodology, T.S. and M.S.; validation, T.S. and M.S.; formal analysis, T.S., H.E.A., A.K.S., B.S. and M.S.; investigation, T.S. and M.S.; data curation, M.S.; writing—original draft preparation, T.S. and M.S.; writing—review and editing, H.E.A., A.K.S. and B.S.; visualization, T.S. and M.S.; supervision, M.S.; project administration, T.S.; funding acquisition, T.S. All authors have read and agreed to the published version of the manuscript.

Funding

This research was funded by the National Science Centre, Poland, grant number NN 305 060640, and by Warsaw University of Life Sciences within the System of Financial Support for Scientists and Research Teams, No. 853-2-80-45-700500-S22004.

Institutional Review Board Statement

Not applicable.

Informed Consent Statement

Not applicable.

Data Availability Statement

The data described in this study are available on request from the corresponding authors.

Acknowledgments

Special thanks to the staff of the Division of Agricultural and Environmental Chemistry of Warsaw University of Life Sciences for their professional support in the field and laboratory measurements and the staff of the Experimental Station in Skierniewice for their general support for the conducted research.

Conflicts of Interest

The authors declare no conflict of interest.

References

  1. Paustian, K.; Larson, E.; Kent, J.; Marx, E.; Swan, A. Soil C sequestration as a biological negative emission strategy. Front. Clim. 2019, 1, 8. [Google Scholar] [CrossRef]
  2. Min, D.H.; Islam, K.R.; Vough, L.R.; Weil, R.R. Dairy manure effects on soil quality properties and carbon sequestration in alfalfa orchard grass systems. Commun. Soil Sci. Plant Anal. 2003, 34, 781–799. [Google Scholar] [CrossRef]
  3. Laik, R.; Kumara, B.H.; Pramanick, B.; Singh, S.K.; Nidhi; Alhomrani, M.; Gaber, A.; Hossain, A. Labile Soil Organic Matter Pools Are Influenced by 45 Years of Applied Farmyard Manure and Mineral Nitrogen in the Wheat—Pearl Millet Cropping System in the Sub-Tropical Condition. Agronomy 2021, 11, 2190. [Google Scholar] [CrossRef]
  4. Ma, Q.; Wen, Y.; Wang, D.; Sun, X.; Hill, P.W.; Macdonald, A.; Chadwick, D.R.; Wu, L.; Jones, D.L. Farmyard manure applications stimulate soil carbon and nitrogen cycling by boosting microbial biomass rather than changing its community composition. Soil Biol. Biochem. 2020, 144, 107760. [Google Scholar] [CrossRef]
  5. Lentz, R.D.; Lehrsch, G. Manure and Fertilizer effects on carbon balance and organic and inorganic carbon losses for an irrigated corn field. Soil Sci. Soc. Am. J. 2014, 73, 987–1002. [Google Scholar] [CrossRef] [Green Version]
  6. Datta, S.P.; Rattan, R.K.; Chandra, S. Labile soil organic carbon, soil fertility, and crop productivity as influence by manure and mineral fertilizers in the tropics. J. Plant Nutr. Soil Sci. 2010, 173, 715–726. [Google Scholar] [CrossRef]
  7. Sleutel, S.; De Neve, S.; Németh, T.; Tóth, T.; Hofman, G. Effect of manure and fertilizer application on the distribution of organic carbon in different soil fractions in long-term field experiments. Eur. J. Agron. 2006, 25, 280–288. [Google Scholar] [CrossRef]
  8. Sosulski, T.; Korc, M. Effects of different mineral and organic fertilization on the content of nitrogen and carbon in soil organic matter fractions. Ecol. Chem. Eng. 2011, 18, 601–609. [Google Scholar]
  9. Meena, S.C.; Singh, D.P.; Meena, S.R. Effect of long term application of fertilizer and manure on establish relationship between soil organic carbon fractions with yield of maize and wheat crops under maize-wheat sequence in Heplustepts. Int. J. Curr. Microbiol. Appl. Sci. 2017, 6, 600–606. [Google Scholar]
  10. Wu, L.F.; Li, B.; Qin, Y.; Gregorich, E. Soil CO2 emission and carbon budget of a wheat/maiz annual double-cropped system in response to tillage and residue management in the North China Plain. Int. J. Agric. Sustain. 2017, 15, 253–263. [Google Scholar] [CrossRef]
  11. Abdalla, K.; Chivenge, P.; Cias, P.; Chaplot, V. No-tillage lessens soil CO2 emissions the most under arid and sandy soil condition: Results from a meta-analysis. Biogeoscience 2016, 13, 3619–3633. [Google Scholar] [CrossRef] [Green Version]
  12. Qiu, Q.; Wu, L.; Ouyang, Z.; Li, B.; Xu, Y.; Wu, S.; Gregorich, E.G. Effects of plant-derived dissolved organic matter (DOM) on soil CO2 and N2O emissions and soil carbon and nitrogen sequestrations. Appl. Soil Ecol. 2015, 96, 122–130. [Google Scholar] [CrossRef]
  13. Bilandžija, D.; Stuparić, R.; Galić, M.; Zgorelec, Ž.; Leto, J.; Bilandžija, N. Carbon Balance of Miscanthus Biomass from Rhizomes and Seedlings. Agronomy 2022, 12, 1426. [Google Scholar] [CrossRef]
  14. Ding, W.; Meng, L.; Yin, Y.; Cai, Z.; Zheng, X. CO2 emissions in an intensively cultivated loam as affected by long-term application of organic manure and nitrogen fertilizer. Soil Biol. Biochem. 2007, 39, 669–679. [Google Scholar] [CrossRef]
  15. Paustian, K.; Six, J.; Elliott, E.T.; Hunt, H.W. Management options for reducing CO2 emissions from agricultural soils. Biogeochemistry 2000, 48, 147–163. [Google Scholar] [CrossRef]
  16. Pareja-Sánchez, E.; Cantero-Martinez, C.; Alvaro-Fuentes, J.; Plaza-Bonilla, D. Tillage and nitrogen fertilization in irrigated maize: Key practices to reduce soil CO2 and CH4 emission. Soil Tillage Res. 2019, 191, 29–36. [Google Scholar] [CrossRef]
  17. Dhadli, H.S.; Brar, B.S. Effect of long-term different application of inorganic fertilizers and manure on soil CO2 emissions. Plant Soil Environ. 2016, 62, 195–201. [Google Scholar] [CrossRef] [Green Version]
  18. Sainju, U.; Jabro, J.D.; William, B.S. Soil carbon dioxide emissions and carbon content as affected by irrigation, tillage, cropping system and nitrogen fertilization. J. Environ. Qual. 2008, 37, 98–106. [Google Scholar] [CrossRef] [Green Version]
  19. Pramanick, B.; Kumar, M.; Naik, B.M.; Kumar, M.; Singh, S.K.; Maitra, S.; Naik, B.S.S.S.; Rajput, V.D.; Minkina, T. Long-Term Conservation Tillage and Precision Nutrient Management in Maize–Wheat Cropping System: Effect on Soil Properties, Crop Production, and Economics. Agronomy 2022, 12, 2766. [Google Scholar] [CrossRef]
  20. Song, C.; Zhang, J. Effects of soil moisture, temperature, and nitrogen fertilization on soil respiration and nitrous oxide emission during maize growth period in northeast China. Acta Agric. Scand. B Soil Plant Sci. 2009, 59, 97–106. [Google Scholar] [CrossRef]
  21. Adviento-Borbe, M.A.A.; Haddix, M.L.; Binder, D.L.; Walters, D.T.; Dobermann, A. Soil greenhouse gas fluxes and global warming potential in four high-yielding maize systems. Glob. Chang. Biol. 2007, 13, 1972–1988. [Google Scholar] [CrossRef]
  22. Sosulski, T.; Szymańska, M.; Szara, E. CO2 emissions from soil under fodder maize cultivation. Agronomy 2020, 10, 1087. [Google Scholar] [CrossRef]
  23. Salehi, A.; Seyfollah, S.; Sourki, A.A. Organic and inorganic fertilizer effect on soil CO2 flux, microbial biomass and growth of Nigella sativa L. Int. Agrophys. 2017, 31, 103–116. [Google Scholar] [CrossRef]
  24. Ding, W.; Cai, Y.; Cai, Z.; Yagi, K.; Zheng, X. Soil respiration under maize crops: Effect of water, temperature and nitrogen fertilization. Soil Sci. Soc. Am. J. 2007, 71, 944–951. [Google Scholar] [CrossRef]
  25. Ray, R.; Griffin, R.W.; Elhassan, A.; Awal, R.; Woldesenbert, S.; Risch, E. Soil CO2 emission in response to organic amendments, temperature, and rainfall. Sci. Rep. 2020, 10, 58. [Google Scholar] [CrossRef] [Green Version]
  26. Walker, W.S.; Gorelik, S.R.; Cook-Patton, S.C.; Griscom, B.W. The global potential for increased storage of carbon on land. Proc. Natl. Acad. Sci. USA 2022, 119, 23. [Google Scholar] [CrossRef]
  27. Zomer, R.J.; Bossio, D.A.; Sommer, R.; Verchot, L.V. Global Sequestration Potential of Increased Organic Carbon in Cropland Soils. Sci. Rep. 2017, 7, 15554. [Google Scholar] [CrossRef] [Green Version]
  28. Andrés, P.; Doblas-Miranda, E.; Rovira, P.; Bonmatí, A.; Ribas, À.; Mattana, S.; Romanyà, J. Agricultural Potential in Carbon Sequestration. Humus Content of Land Used for Agriculture and CO2 Storage; Study Requested by the AGRI Committee; European Parliament, Policy Department for Structural and Cohesion Policies Directorate-General for Internal Policies: Brussels, Belgium, 2022; p. 699.655. Available online: https://www.europarl.europa.eu/RegData/etudes/STUD/2022/699655/IPOL_STU(2022)699655_EN.pdf (accessed on 2 February 2023).
  29. Calamai, A.; Chiaramonti, D.; Casini, D.; Masoni, A.; Palchetti, E. Short-Term Effects of Organic Amendments on Soil Properties and Maize (Zea maize L.) Growth. Agriculture 2020, 10, 158. [Google Scholar] [CrossRef]
  30. Sosulski, T.; Szymańska, M.; Szara, E.; Sulewski, P. Soil Respiration under 90 Year-Old Rye Monoculture and Crop Rotation in the Climate Conditions of Central Poland. Agronomy 2021, 11, 21. [Google Scholar] [CrossRef]
  31. Johnston, A.E.; Poulton, P.R. The importance of long-term experiments in agriculture: Their management to ensure continued crop production and soil fertility; the Rothamsted experience. Eur. J. Soil Sci. 2018, 69, 113–125. [Google Scholar] [CrossRef] [Green Version]
  32. IUSS Working Group WRB. World Reference Base for Soil Resources. In International Soil Classification System for Naming Soils and Creating Legends for Soil Maps, 4th ed.; International Union of Soil Sciences (IUSS): Vienna, Austria, 2022. [Google Scholar]
  33. Hutchinson, G.L.; Livingston, G.P. Use of chamber systems to measure trace gas fluxes. In Agricultural Ecosystem Effects on Trace Gases and Global Climate Change; ASA Special Publication No. 55; Rolston, D.E., Duxbury, J.M., Harper, L.A., Mosier, A.R., Eds.; American Society of Agronomy, Crop Science Society of America and Soil Science Society of America: Madison, WI, USA, 1993; pp. 63–78. [Google Scholar]
  34. Bosco, S.; Volpi, I.; Antichi, D.; Ragaglini, G.; Frasconi, C. Greenhouse Gas Emissions from Soil Cultivated with Vegetables in Crop Rotation under Integrated, Organic and Organic Conservation Management in a Mediterranean Environment. Agronomy 2019, 9, 446. [Google Scholar] [CrossRef] [Green Version]
  35. Zsolnay, A. Dissolved humus in soil waters. In Humic Substances in Terrestrial Ecosystems; Piccolo, A., Ed.; Elsevier: Amsterdam, The Netherlands, 1996; Chapter 4; pp. 171–223. [Google Scholar]
  36. Körschens, M.; Albert, E.; Armbruster, M.; Barkusky, D.; Baumecker, M.; Behle-Schalk, L.; Bischoff, M.; Čergan, Z.; Ellmer, F.; Herbst, F.; et al. Effect of mineral and organic fertilization on crop yield, nitrogen uptake, carbon and nitrogen balances, as well as soil organic carbon content and dynamics: Results from 20 European long-term field experiments of the twenty-first century. Arch. Agron. Soil Sci. 2012, 59, 1017–1040. [Google Scholar] [CrossRef]
  37. Körschens, M. The importance of long-term field experiments for soil science and environmental research—A review. Plant Soil Environ. 2006, 52, 1–8. [Google Scholar]
  38. Liu, W.; Yan, C.; Mei, X.; Zhang, Y.; Fan, T. Long-term effect of manure and fertilizer on soil organic carbon pools in dryland farming in Northwest China. PLoS ONE 2013, 8, e56536. [Google Scholar] [CrossRef] [Green Version]
  39. Don, A.; Scholten, T.; Shulze, E.D. Conversion of cropland into grassland: Implication for soil organic carbon stocks in two soils with different texture. J. Plant. Nutr. Soil Sci. 2009, 172, 53–62. [Google Scholar] [CrossRef]
  40. Sosulski, T.; Szara, E.; Stępień, W.; Szymańska, M.; Borawska-Komenda, M. Carbon and nitrogen leaching in long-term experiments and DOC/N-NO3- ratio in drainage water as an indicator of denitrification potential in different fertilization and crop rotation systems. Fresenius Environ. Bull. 2016, 25, 2813–2824. [Google Scholar]
  41. Gregorich, E.G.; Rochette, P.; McGuire, S.; Liang, B.C.; Lesserd, R. Soluble organic carbon and carbon dioxide fluxes in maize fields. J. Environ. Qual. 1998, 27, 209–214. [Google Scholar] [CrossRef]
  42. Marinari, S.; Liburdi, K.; Fliessbach, A.; Kalbitz, K. Effects of organic management on water-extractable organic matter and C mineralization in European arable soil. Soil Till. Res. 2010, 106, 211–217. [Google Scholar] [CrossRef]
  43. Abdalla, M.; Hastings, A.; Helmy, M.; Prescher, A.; Osborne, B.; Lanigan, G.; Forristal, D.; Killi, D.; Maratha, P.; Williams, M.; et al. Assessing the combined use of reduced tillage and cover crops for mitigating greenhouse gas emissions from arable ecosystem. Geoderma 2014, 223–225, 9–20. [Google Scholar] [CrossRef]
  44. Drury, C.F.; Yang, X.M.; Reynolds, W.D.; McLaughlin, N.B. Nitrous oxide and carbon dioxide emissions from monoculture and rotation cropping of corn, soybean and winter wheat. Can. J. Soil Sci. 2007, 88, 163–174. [Google Scholar] [CrossRef]
  45. Tang, X.; Du, J.; Shi, Y.; Lei, N.; Chen, G.; Cao, L.; Pei, H. Global patterns of soil heterotrophic respiration—A meta-analysis of available dataset. Catena 2020, 191, 104574. [Google Scholar] [CrossRef]
  46. Feiziene, D.; Feiza, V.; Kadziene, G.; Vaideliene, A.; Povilaitis, V.; Deveikyte, I. CO2 fluxes and drivers as affected by soil type, tillage and fertilization. Acta Agric. Scand. B Soil Plant Sci. 2011, 62, 311–328. [Google Scholar]
  47. Zhang, X.B.; Wu, L.; Sun, N.; Ding, X.; Li, J.; Wang, B.; Li, D. Soil CO2 and N2O emissions in maize growing season under different fertilizer regimes in upland red soil region of South China. J. Integr. Agric. 2014, 13, 604–614. [Google Scholar] [CrossRef]
  48. Alluvione, F.; Hall, V.; Orson, A.D.; Del Grosso, S.J. Nitrogen, Tillage, and crop rotation effects on carbon dioxide and methane fluxes from irrigated cropping systems. J. Environ. Qual. 2009, 38, 2023–2033. [Google Scholar] [CrossRef] [PubMed]
  49. Zhai, L.; Liu, H.; Zhang, J.; Huang, J.; Wang, B. Long-term application of organic manure and mineral fertilizer on N2O and CO2 emissions in a red soil from cultivated maize-wheat rotation in China. Agric. Sci. China 2011, 10, 1748–1757. [Google Scholar] [CrossRef]
  50. DeForest, J.L.; Zak, D.R.; Pregitzer, K.S.; Burton, A.J. Atmospheric nitrate decomposition, microbial community composition, and enzyme activity in Northern Hardwood Forests. Soil Sci. Soc. Am. J. 2004, 68, 132–138. [Google Scholar] [CrossRef] [Green Version]
  51. Verdi, L.; Mancini, M.; Napoli, M.; Violi, R.; Pardini, A.; Orlandini, S.; Marta, A.D. Soil carbon emissions from maize under different fertilization methods in an extremely dry summer in Italy. Ital. J. Agrometeorol. 2019, 2, 3–10. [Google Scholar]
  52. Zhao, Y.; Wang, P.; Li, J.; Chen, Y.; Ying, X.; Liu, S. The effects of two organic manures on soil properties and crop yields on a temperate calcareous soil under a wheat-maize cropping system. Eur. J. Agron. 2009, 31, 36–42. [Google Scholar] [CrossRef]
  53. Buragiené, S.; Šarauskis, E.; Romaneckas, K.; Sasnauskienė, J.; Masilionytè, L.; Kriaičiė, Z. Experimental analysis of CO2 emissions from agricultural soils subjected to five different tillage systems in Lithuania. Sci. Total Environ. 2015, 514, 1–9. [Google Scholar] [CrossRef]
  54. Amos, B.; Arkebauer, T.J.; Doran, J.W. Soil surface fluxes of greenhouse gases in an irrigated maize-based agroecosystem. Soil Sci. Soc. Am. J. 2005, 69, 387–395. [Google Scholar] [CrossRef] [Green Version]
  55. Li, W.; Wang, J.; Li, X.; Wang, S.; Liu, W.; Shi, W.; Cao, W. Nitrogen fertilizer regulates soil respiration by altering the organic carbon storage in root and topsoil in alpine meadow of the north-eastern Qinghai-Tibet Plateau. Sci. Rep. 2019, 9, 13735. [Google Scholar] [CrossRef] [Green Version]
  56. Oertel, C.; Matschullat, J.; Zurba, K.; Zimmermann, F.; Erasmi, S. Greenhouse gas emissions from soils—A review. Geochemistry 2016, 76, 327–352. [Google Scholar] [CrossRef] [Green Version]
  57. Trumbore, S. Age of soil organic matter and soil respiration: Radiocarbon constrains on belowground C dynamics. Ecol. Appl. Ecol. Soc. Am. 2000, 10, 399–411. [Google Scholar] [CrossRef]
  58. Fiedler, S.R.; Leinweber, P.; Jurasinski, G.; Eckhardt, K.U.; Glatzel, S. Tillage-induced short-term soil organic matter turnover and respiration. Soil 2016, 2, 475–486. [Google Scholar] [CrossRef] [Green Version]
  59. Luo, Y.Q.; Zhou, X.H. Processes of CO2 transport from soil to the atmosphere. In Soil Respiration and the Environment; Elsevier Inc.: Amsterdam, The Netherlands, 2006; pp. 61–76. [Google Scholar]
  60. Lee, J.; McKnight, J.S.; Skinner, L.; Sherfy, A.; Tyler, D.; English, B. Soil Carbon Dioxide Respiration in Switchgrass Fields: Assessing Annual, Seasonal and Daily Flux Patterns. Soil Syst. 2018, 2, 13. [Google Scholar] [CrossRef] [Green Version]
  61. Li, L.J.; You, M.Y.; Shi, H.A.; Ding, X.L.; Qiao, Y.F.; Han, X.Z. Soil CO2 emissions from a cultivated Mollisol: Effects of organic amendments, soil temperature, and moisture. Eur. J. Soil Biol. 2013, 55, 83–90. [Google Scholar] [CrossRef]
  62. Bogužas, V.; Sinkevičienė, A.; Romaneckas, K.; Steponavičienė, V.; Skinulienė, L.; Butkevičienė, L.M. The impact of tillage intensity and meteorological conditions on soil temperature, moisture content and CO2 efflux in maize and spring barley cultivation. Zemdirbyste 2018, 105, 307–314. [Google Scholar] [CrossRef] [Green Version]
  63. Behnke, G.D.; Zuber, S.M.; Pittelkow, C.M.; Nafziger, E.D.; Villamil, M.B. Long-term crop rotation and tillage effects on soil greenhouse gas emissions and crop production in Illinois, USA. Agric. Ecosyst. Environ. 2018, 261, 62–70. [Google Scholar] [CrossRef]
  64. Hossain, M.B.; Rahmann, M.M.; Biswas, J.C.; Miah, M.M.U.; Akhter, S.A.; Maniruzzaman, M.; Choudhury, A.K.; Ahmed, F.; Shiragi, M.H.K.; Kalra, N. Carbon mineralization and carbon dioxide emission from organic matter added soil under different temperature regimes. Int. J. Recycl. Org. Waste Agric. 2017, 6, 311–319. [Google Scholar] [CrossRef] [Green Version]
Figure 1. Location of the experimental station in Poland.
Applsci 13 04620 g001
Figure 2. Cumulative precipitation in 1st and 2nd year of the study and the multi-annual period (1923–2020).
Applsci 13 04620 g002
Figure 3. The air (Ta) and soil temperature (Ts) at a depth of 5, 10, and 20 cm on the test dates.
Applsci 13 04620 g003
Figure 4. Daily CO2–C soil emissions under the CaNPK and Ca + M treatments over the measurement period.
Applsci 13 04620 g004
Table 1. The average (1st and 2nd year) content of the soil organic carbon (SOC), total nitrogen (TN) C:N ratio and soil pH.
TreatmentSoil HorizonsSOCTNC:NpH
g C kg−1g N kg−1
CaNPKAp (0–25 cm)5.685 d ± 0.0800.561 c ± 0.00410.1:16.8
E (25–45 cm)1.565 a ± 0.0410.181 a ± 0.0018.7:16.2
Bt (<45 cm)1.880 b ± 0.0400.193 a ± 0.0049.8:16.6
Ca + MAp (0–25 cm)10.625 e ± 0.3190.959 d ± 0.02911.1:16.7
E (25–45 cm)2.035 b ± 0.0160.194 a ± 0.00210.5:16.3
Bt (<45 cm)2.930 c ± 0.0990.261 b ± 0.01111.3:16.4
Mean value ± standard deviation (SD). The means followed by different letters in the column are significantly different (p < 0.05).
Table 2. Content of the dissolved organic carbon (DOC) in the soil (mg C kg−1) in the spring and autumn of the 1st and 2nd year.
TreatmentSoil Horizons1st Year2nd Year
SpringAutumnSpringAutumn
CaNPKAp (0–25 cm)4.50 a ± 0.245.17 b ± 0.163.24 a ± 0.345.00 ab ± 0.84
E (26–45 cm)4.18 a ± 0.383.29 a ± 0.184.38 a ± 0.434.25 a ± 0.29
Bt (<45cm)6.72 b ± 0.455.94 b ± 0.319.44 c ± 0.734.06 a ± 0.53
Ca + MAp (0–25 cm)5.88 b ± 0.5816.81 e ± 0.606.89 b ± 0.046.58 d ± 0.49
E (26–45 cm)6.82 b ± 0.638.21 c ± 0.6813.01 d ± 1.924.89 ab ± 0.32
Bt (<45cm)9.37 c ± 0.569.52 d ± 0.3013.46 d ± 1.415.51 c ± 0.59
Mean value ± standard deviation (SD). The means followed by different letters in the column are significantly different (p < 0.05).
Table 3. Daily and cumulative CO2–C emissions from the soil in the CaNPK and Ca + M treatments under a rye monoculture over the measurement period.
Treatment 1st Year2nd Year
CO2–C Soil Emissions
DailyCumulativeDailyCumulative
kg CO2–C ha−1
CaNPKMean ± SD17.00 ± 16.393933.1 ± 356.616.01 ± 11.892975.0 ± 153.1
Median11.96 a3806.212.03 a2981.3
Min–Max3.00–108.583519.3–4333.90.93–64.232773.2–3199.6
Ca + MMean ± SD24.09 ± 15.375365.0 ± 113.927.56 ± 19.835149.2 ± 89.3
Median19.39 b5369.021.85 b5149.2
Min–Max3.57–81.475212.0–5524.31.85–100.645062.1–5264.2
Different letters (a, b) in the column indicate significant differences (p < 0.05). SD—standard deviation.
Table 4. Correlation coefficients describing the relationship between the cumulative CO2–C soil emissions and the soil organic content and dissolved organic carbon soil content in the Ap, E, and Bt soil horizons in the spring and autumn.
Year Soil Organic CarbonSpringAutumn
Dissolved Organic Carbon
ApEBtApEBtApEBt
1stCO2–C soil emission0.79 *0.90 *0.71 *0.94 *0.64 *0.86 *0.75 *0.75 *0.78 *
2nd0.81 *0.74 *0.66 *0.63 *0.70 *0.79 *0.68 *0.67 *0.66 *
* p < 0.05. Soil horizons: Ap (0–25 cm), E (26–45 cm), and Bt (<45cm).
Table 5. Rye grain and straw yields.
Crop PartTreatment1st Year Yields (t ha−1)2nd Year Yields (t ha−1)
GrainCaNPK2.76 b ± 0.173.04 b ± 0.21
Ca + M2.39 a ± 0.232.37 a ± 0.20
StrawCaNPK2.94 A ± 0.092.31 B ± 0.11
Ca + M2.83 A ± 0.271.87 A ± 0.08
Mean value ± standard deviation (SD). The means followed by different letters in the column (separately for crop part: grain (a, b) and straw (A, B)) are significantly different (p < 0.05).
Disclaimer/Publisher’s Note: The statements, opinions and data contained in all publications are solely those of the individual author(s) and contributor(s) and not of MDPI and/or the editor(s). MDPI and/or the editor(s) disclaim responsibility for any injury to people or property resulting from any ideas, methods, instructions or products referred to in the content.

