Article

Investigation of Microseismic Characteristics of Rock Burst Based on Fractal Theory

1
BGRIMM Technology Group, Beijing 100160, China
2
National Centre for International Research on Green Metal Mining, Beijing 102628, China
3
School of Energy and Mining Engineering, China University of Mining and Technology Beijing, Beijing 100083, China
*
Author to whom correspondence should be addressed.
Appl. Sci. 2023, 13(7), 4613; https://doi.org/10.3390/app13074613
Submission received: 27 February 2023 / Revised: 3 April 2023 / Accepted: 3 April 2023 / Published: 5 April 2023

Abstract

:
Microseismic monitoring is a common monitoring tool in the mining production process; for supervising a huge amount of microseismic data, effective analysis tools are necessary. In this study, the monitoring results of microseismic events at the Maoping lead-zinc mine in Yiliang County, Yunnan Province, and the spatiotemporal distribution characteristics of microseismic events are analyzed. We analyze the temporal characteristics of microseismic events using fractal theory, combining the change in fractal dimension with the rock burst incubation process. We also construct an observation area model for event anomalies based on the spatial distribution characteristics of microseismic events. The results show that the growth of the fractal dimension is consistent with the trend of the incubation process before rock burst, and the larger the fractal dimension, the higher the rock burst risk. The observation model, based on the density of microseismic events, can effectively refine the rock burst discrimination range and facilitate subsequent observations. An effective and feasible method of microseismic analysis is provided.

1. Introduction

As mining moves to deeper levels, fugitive conditions in deep rock differ significantly from those in shallow areas, increasing the risk of rock explosion hazards. To prevent these hazards, various methods have been proposed and implemented in mines. Current rock burst early warning monitoring methods mainly include drilling and cutting parameters, borehole stress, electromagnetic emission, acoustic emission, charging method, microseismic (MS) monitoring, and active or passive seismic velocity lamination [1,2,3,4,5,6,7,8,9,10,11,12]. Among these, microseismic monitoring methods are widely used [13,14,15,16,17,18,19]. For different monitoring results and on-site rock burst conditions, more scientific and systematic theories are required to process and analyze the spatiotemporal distribution characteristics of the monitored microseismic events.
Research on the temporal characteristics of microseismic methods has achieved effective results through continuous innovation. Based on the monitoring results, advanced theories, such as geometric theory and convolutional neural networks, are effective means of analyzing the temporal distribution characteristics of microseismic monitoring events [20,21]. Previous studies have found that the number of rock-mass fractures obeys three-dimensional fractal distribution [22]. The initial value of a two-dimensional fractal distribution has a linear relationship with the initial value of a three-dimensional fractal distribution. Fractal dimension, as the quantitative characterization and basic parameter of the theory, is one of the important principles of fractal theory. The size–frequency distributions for islands, earthquakes, fragments, ore deposits, and oil fields often satisfy this relation [23,24,25]. Multi-scale materials, such as concrete and rocks, have self-similarity whose distributions have a power-law form [26,27,28,29,30]. Higher porosity samples give different fractal dimensions for upper and lower fracture surfaces [31]. The permeability has an exponential relationship with the fractal dimension of fracture center and fracture length [32]. It was found in laboratory research that acoustic emission count rates during failure for all loading steps exhibit fractal features [33,34,35]. The results of engineering research indicated that the energy distribution of microseismic events during the development of immediate rock bursts has a fractal structure [36].
By analyzing the spatial and temporal distribution characteristics of microseismic events, we can predict potential rock burst hazards. We developed a simplified two-dimensional (2D) finite element model based on microseismic and piezometer monitoring results and geological conditions of a porous rock mass [37]. The statistical analysis and numerical calculation of tunnel rock bursts also allowed for the analysis of the spatial and temporal distribution of MS events during the construction process, thereby discussing the size effect of rock burst risk [38]. Subsequently, the spatial and temporal evolution of MS events was analyzed by numerical simulations, and the spatial relationship between the potential damage zone and maximum principal stress direction was verified [39].
Studies have explored the spatiotemporal analysis of microseismic activity and its correlation with mine explosions by analyzing source parameters. These studies have shown that two clusters have different dynamic characteristics [40,41]. From a microfracture perspective, macrofractures can be identified based on a three-dimensional (3D) fracture model, which is implemented using unsupervised machine learning algorithms and microfracture coordinates and can identify microfractures in 3D space combined with the formation of macrofractures [42]. Elastoplastic mechanics and damage mechanics are the general theories for modeling and are used as the basis for establishing an elastic–plastic brittle abrupt rock burst model for structural surface coal rocks and to analyze the microseismic (MS) and electromagnetic radiation (EMR) characteristics of coal rocks during the evolution of impact ground pressure [43]. These methods have limited the analytical treatment of the temporal distribution of microseismicity and field utility for the spatial distribution pattern, and no real-time monitoring and analysis of the spatial distribution pattern of microseismicity has been performed. In addition, the spatiotemporal energy evolution characteristics of strong acoustic emission events on the crack surface during the complete fracture of tuffs reveal the processes of microcrack generation, extension, and interpenetration in rock specimens [44].
While some methods have discussed the spatial evolution of microseismic events from a mechanistic perspective, they have limitations for field guidance due to the insufficient analysis of microseismic characteristics. To address this issue, an MS multi-parameter indicator system was developed, with critical values estimated for each indicator. This system, along with the r-value scoring method, provides a comprehensive analysis of the weights of each indicator [45,46]. These studies focused on the analysis of the results and lacked an analysis of the microseismic spatial and temporal patterns of the actual working conditions. From the present point of view, both the analysis of spatiotemporal characteristics of microseismic events and the processing of analysis results lack convenient and intuitive analysis methods and site-appropriate model construction. In this study, fractal theory was used to analyze the temporal characteristics of microseismic events in the Maoping mine and validate them according to their actual site, establish an observation model through the spatial distribution characteristics of detected microseismic events, refine the study of microseismic event points, and analyze the characteristic pattern of rock bursts at the site through the relationship between the accumulation of microseismic events and energy. From field validation, this study is of great significance for the analysis of monitoring results and provides some guidance for the research and judgment of subsequent mining and rock burst warnings.

2. Mining Conditions and Methods

2.1. Mining Conditions
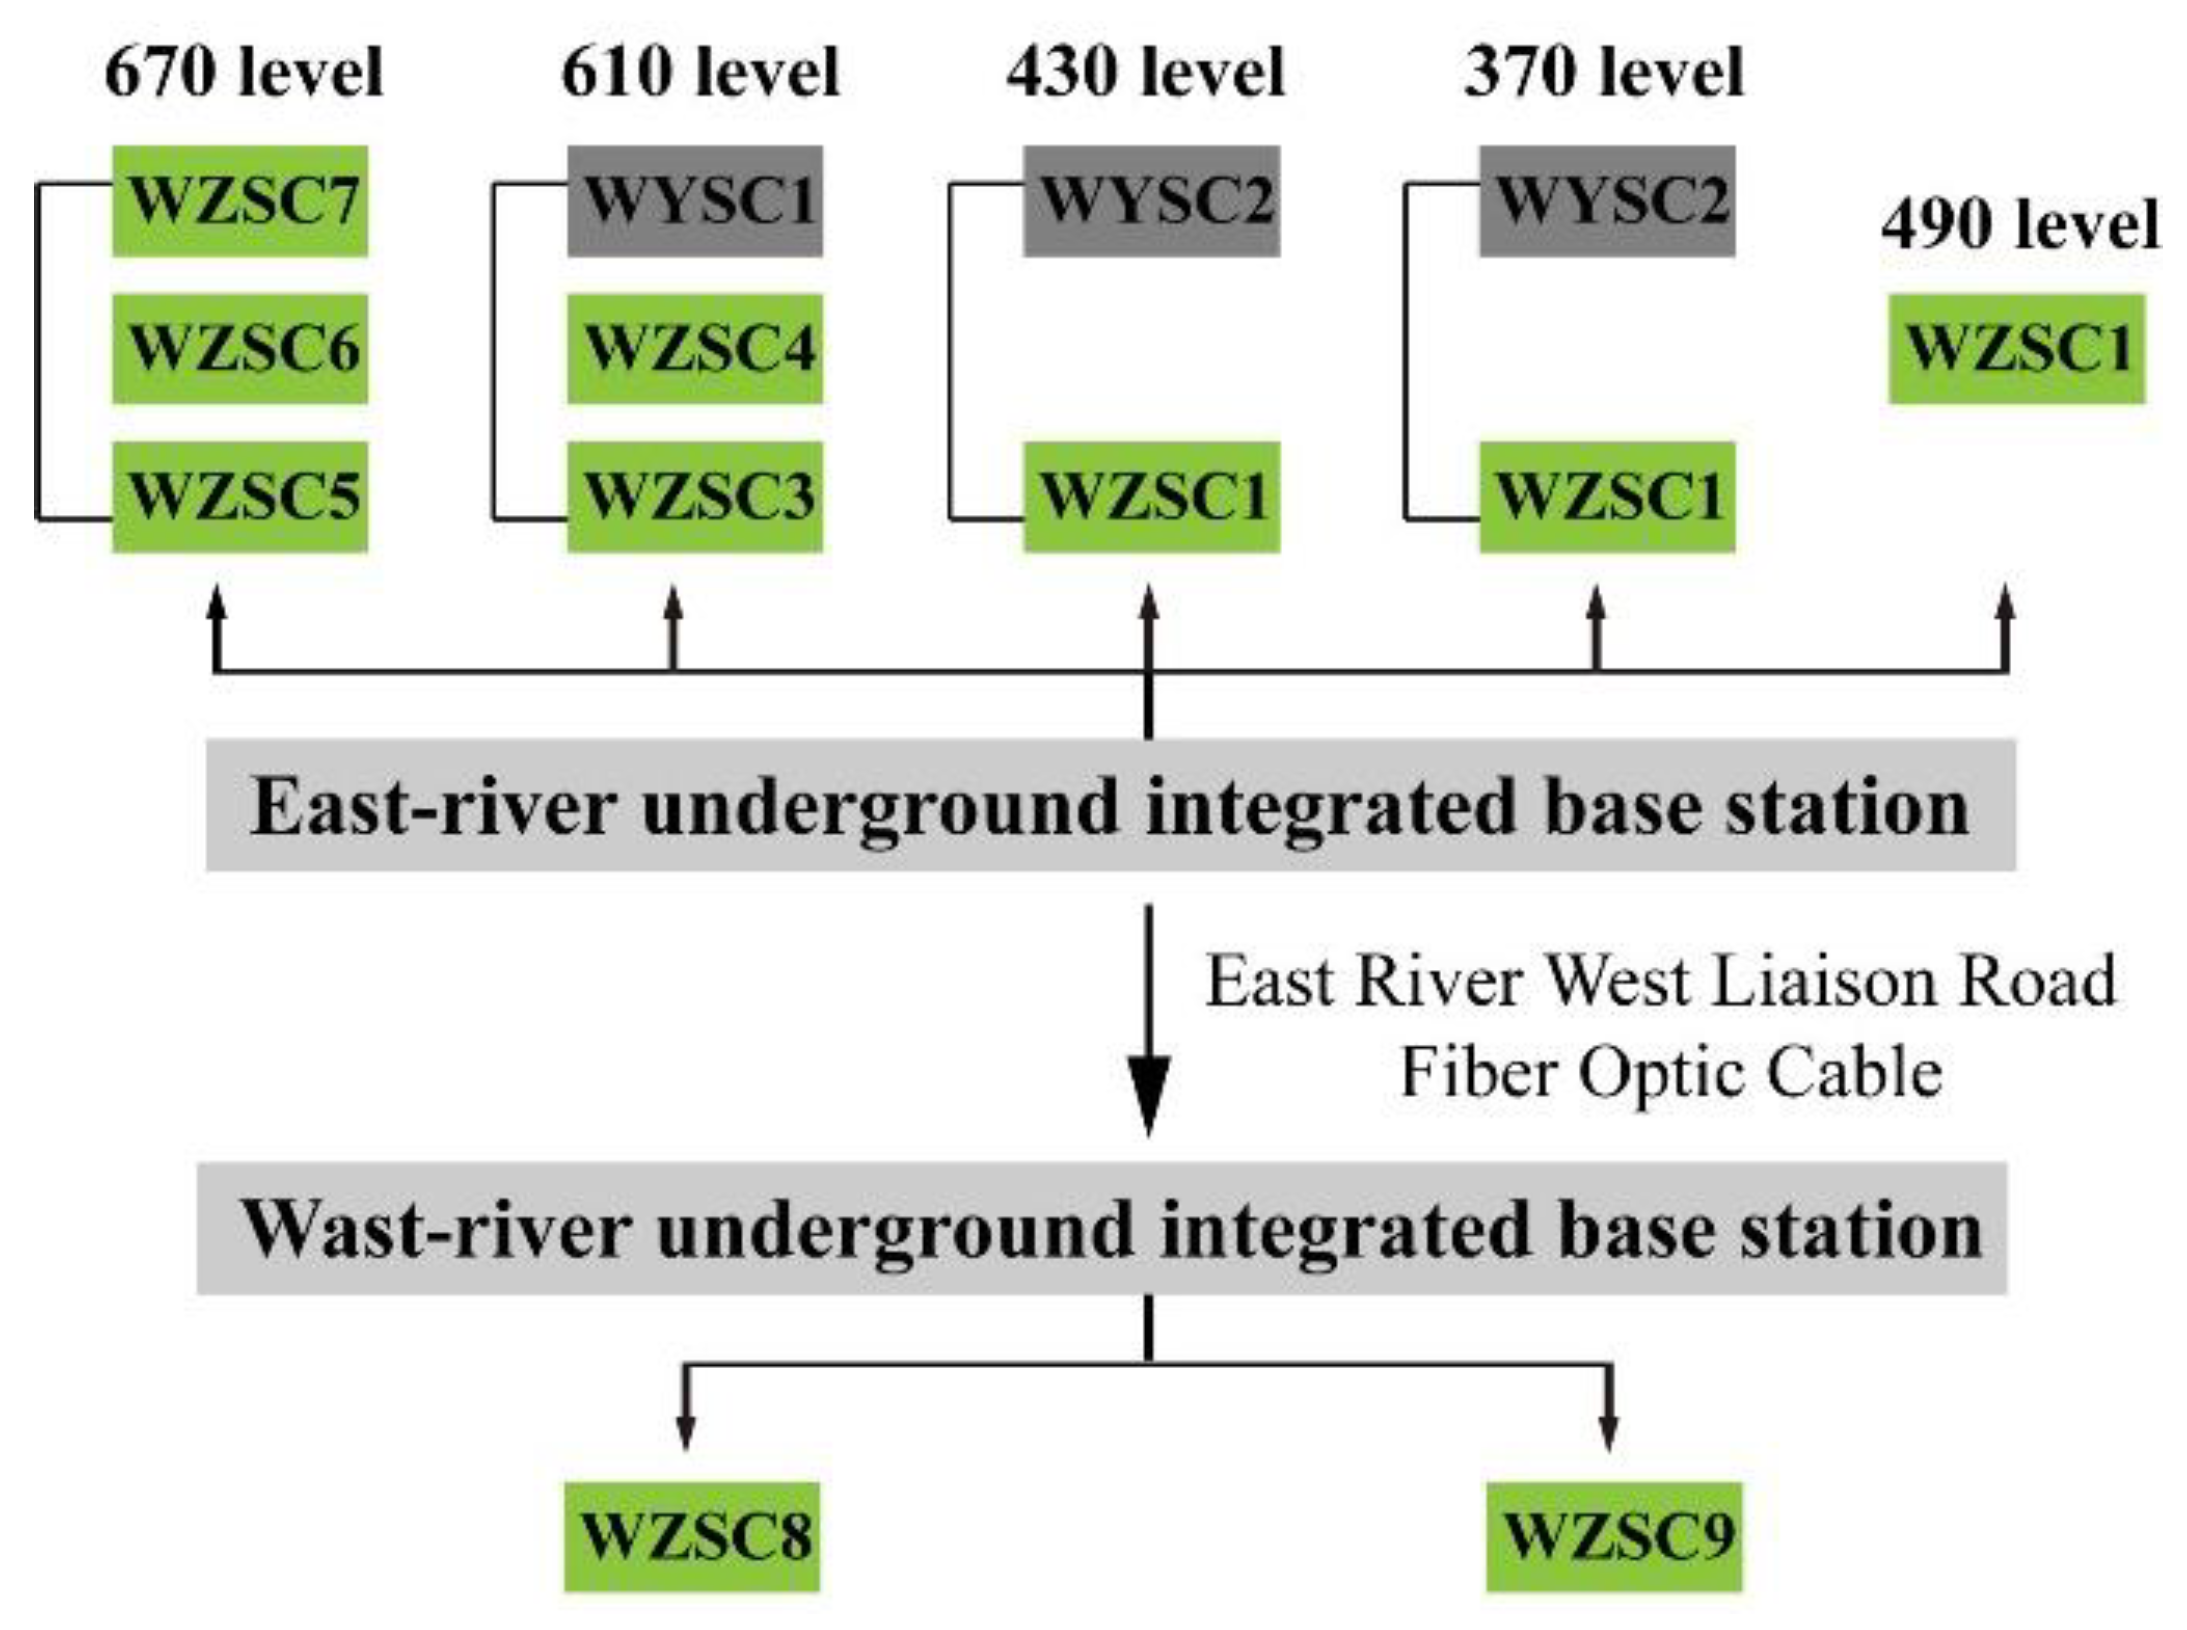
The Maoping lead-zinc mine is located in the northeastern part of Yunnan Province, under the jurisdiction of Yiliang County, Zhaotong City. The geographical coordinates are from 103°59′ to 104°04′ east longitude and 27°28′ to 27°32′ north latitude. The area of the mine is approximately 45 square kilometers, and its distribution area is 0.4 square kilometers. The strata exposed in the mining area include the Upper Devonian Zaig Formation (D33), Carboniferous Fengning Formation (C1), Weining Formation (C2), Lower Permian Formation (P1), and Quaternary Formation (Q). Except for the Carboniferous Fenning Formation Wanshushan Group and Lower Permian Liangshan Group, which are coal-bearing clastic rock systems, all others are carbonates.
In the main mining zone, the bottom plate of the I mining zone is dark gray tuff and dolomite with shale, and the top plate is medium to fine crystalline dolomite, with a small amount of shale. The orebody is 144 m long, with a tendency of 110 m downward from the middle section at an elevation of 896 m. A layer measuring 16 m in thickness, with an average grade of 4.52% Pb and 10.13% Zn, contains 102,936 tons of proven Pb-Zn metal. This accounts for 46.3% of the total reserves in the mine area. The I ore zone consists of thick, greyish-white, coarse-crystalline limestone from the Middle Carboniferous period.

2.2. IMS System

The typical network composition and structure of the IMS microseismic monitoring system are shown in Figure 1. Microseismic sensors first receive various microseismic signals from the ground, transmit the analog signals to the collector for preprocessing, such as digital-to-analog conversion and data over-waves, and then send the digital microseismic signals to the modem. Finally, the modem transmits the microseismic signals of the underground sensors to the surface monitoring center computer through a fiber-optic cable for automatic recording and processing.

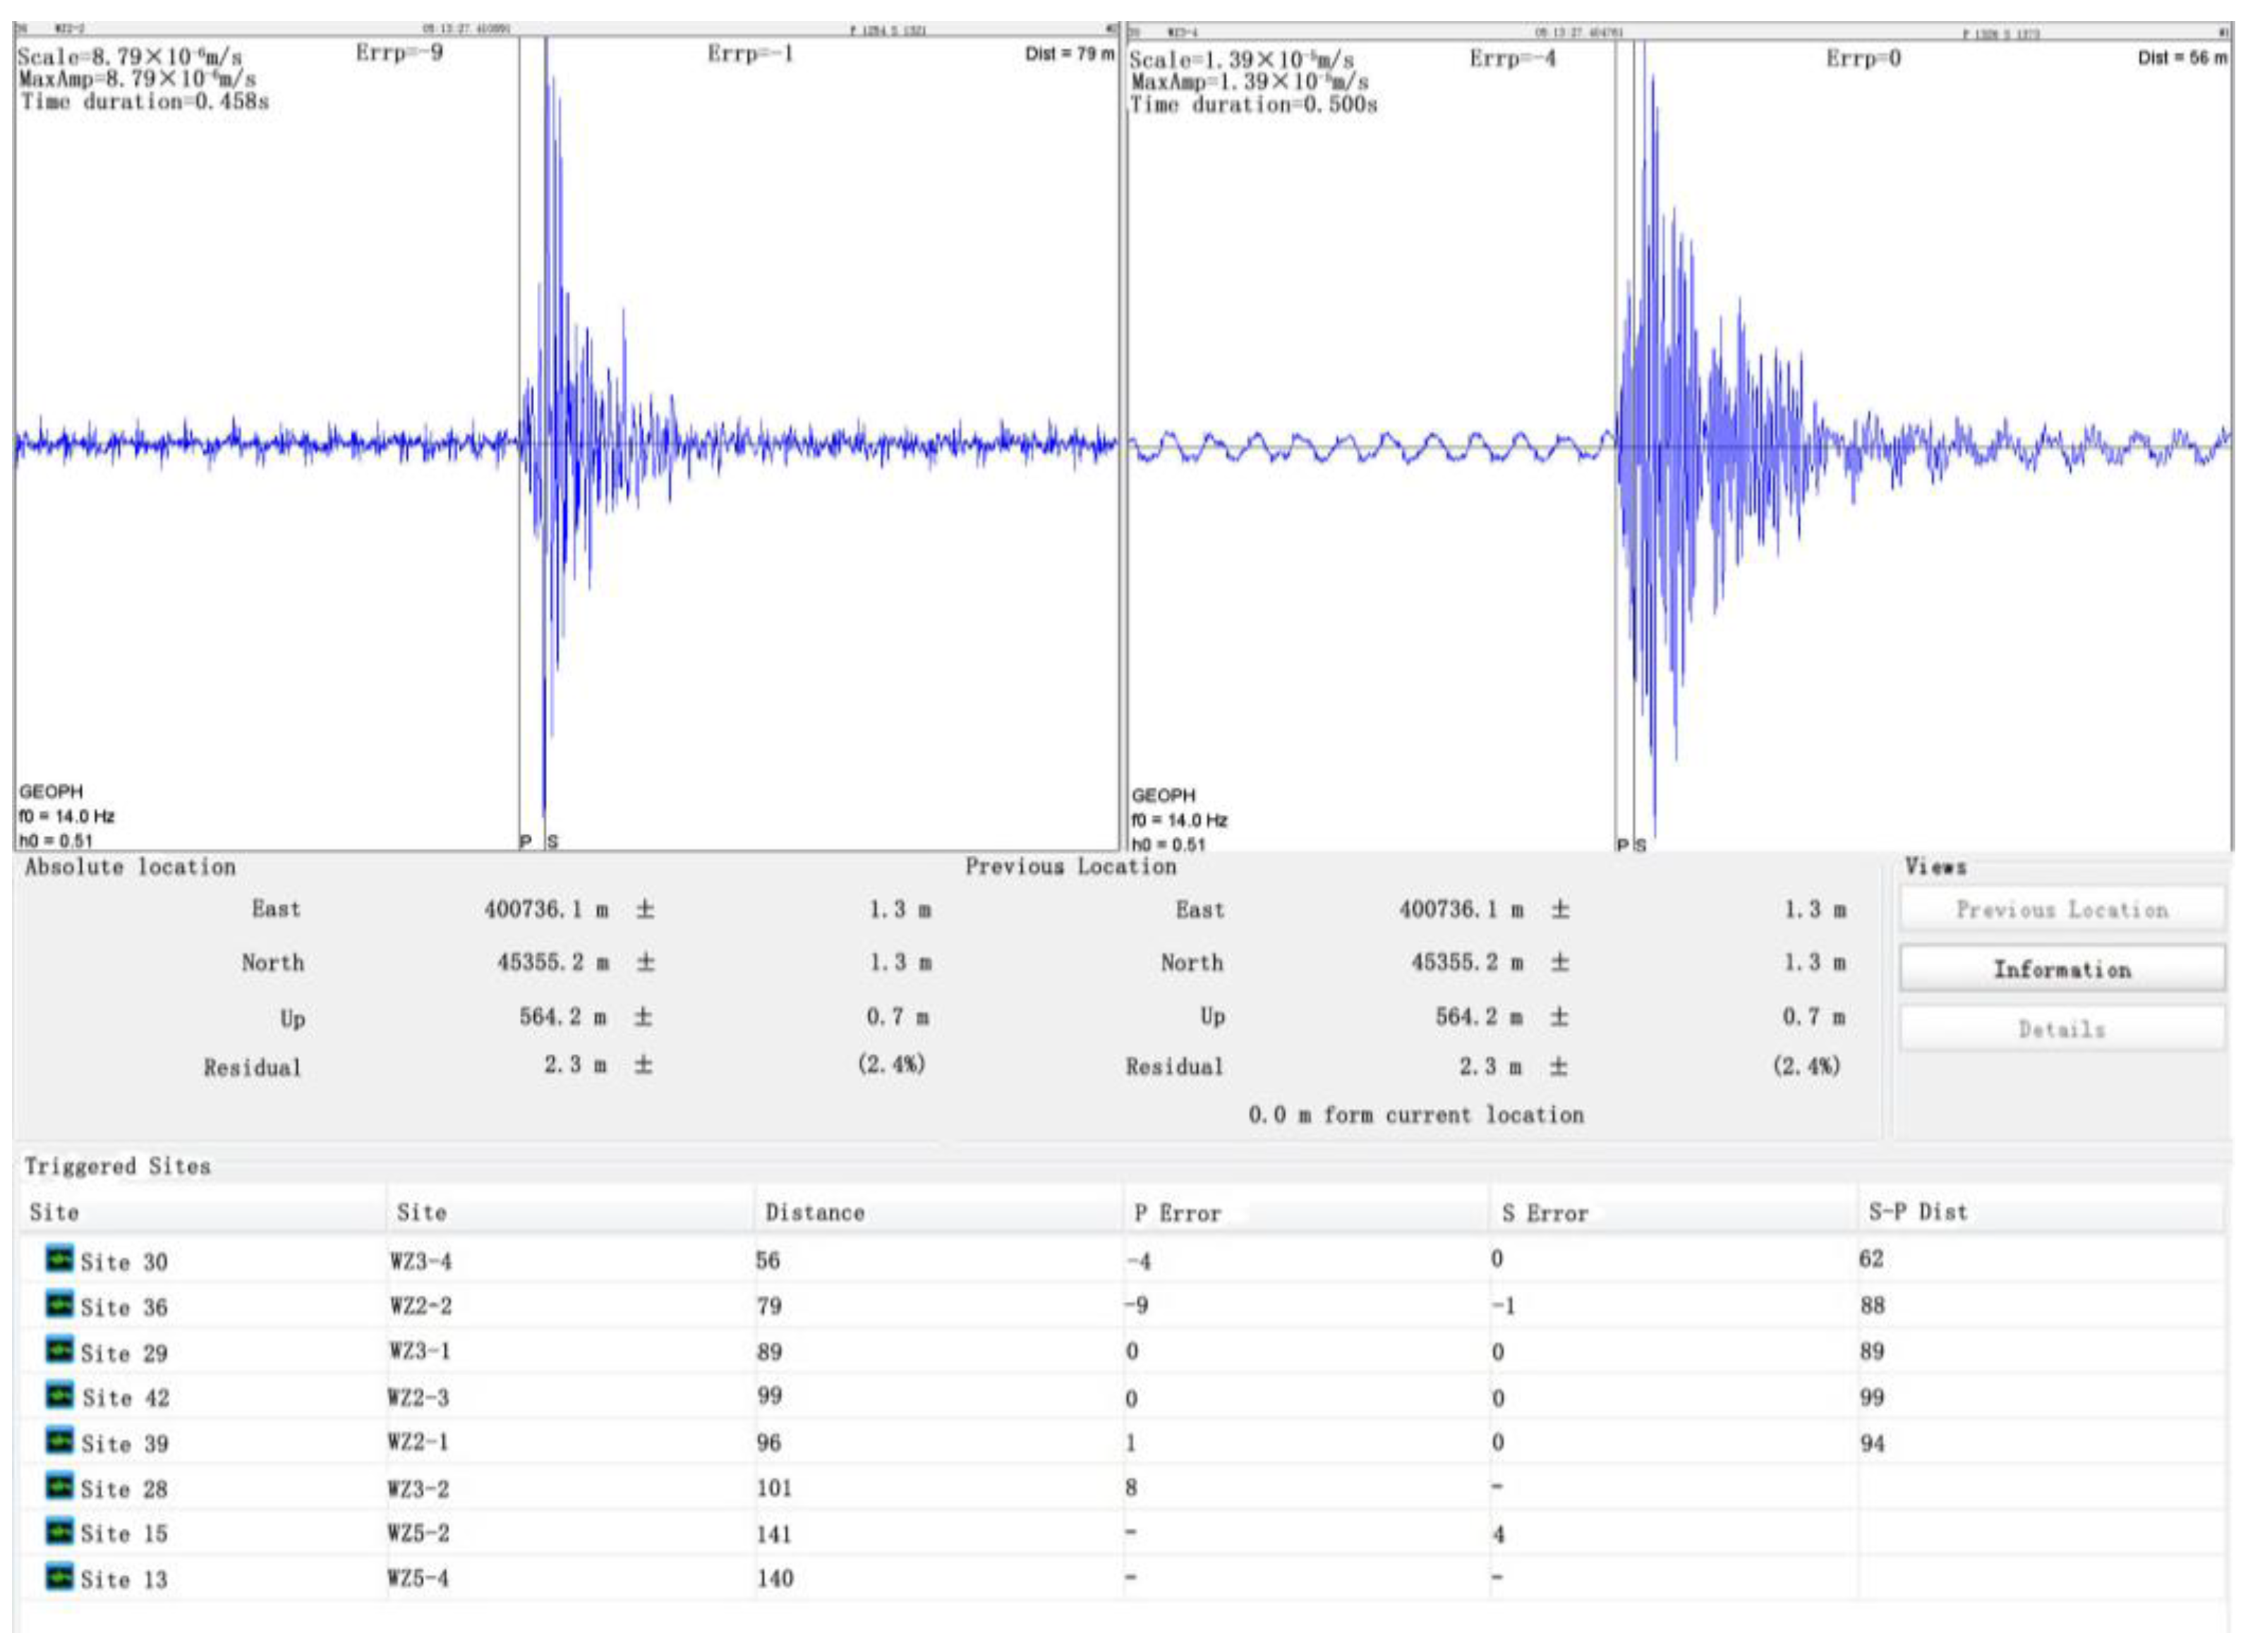
2.3. Analysis of Station Network Accuracy and System Wave Speed

Set the seismic event source as unknown.
x = t 0 , x 0 , y 0 , z 0 t
where t 0 is the time of the seismic event x 0 , and y 0 and z 0 are the 3D coordinates of the seismic event.
The optimization of sensor station locations depends on the covariance matrix C x of x .
C x = k ( A A T ) 1
where k is a constant, and the value of A is expressed as
A = 1 T 1 x 0 T 1 y 0 T 1 z 0 1 T n x 0 T n y 0 T n z 0
where T i (i = 1, …, n) is the calculated seismic arrival time and n is the number of sensor viewing stations.
Covariance can be interpreted graphically using a confidence ellipsoid, and the eigenvalues of the covariance matrix form the length of the main axis of the ellipse. Solving for station optimization involves solving for a station arrangement that minimizes the ellipsoid volume. Because the product of the smallest volume of this ellipsoid is proportional, the optimized station location should minimize the following equation for all seismic events recorded by the monitoring network:
o b j = min ( i = 1 n e p h ( h i ) λ x 0 ( h i ) λ y 0 ( h i ) z 0 ( h i ) λ t 0 ( h i ) )
where n e is the number of seismic events, located in the region where the seismic activity will be monitored; P h ( h i ) is the relative importance of the event, whose source is h i = x i , y i , z i T , which can be the probability function of an event occurring adjacent to that location; and λ x 0 ( h i ) is the eigenvalue of C x .
According to the geological conditions of the Maoping mine, the mine velocity model recommended by the IMS microseismic monitoring system (Vp = 5500 m/s, Vs = 3500 m/s) was used to carry out the system positioning error analysis. Comparing the calibration blast coordinates to the microseismic positioning coordinates revealed a significant spatial positioning error of approximately 20 m. This error requires the use of Trace software to correct for wave velocity. The results of the calibration of the blast waveform and positioning are shown in Figure 2. The positioning calibration procedures are listed in Table 1.

2.4. Early Warning Analysis

To identify the critical warning parameters, the number of microseismic events and the microseismic energy were selected as the warning indicators, and a fixed monitoring area was selected for analysis and warning, according to the station network, to eliminate the influence of lithology and production. However, if the monitoring range is large or the mining methods in the monitoring area differ greatly, lithology correction indicators need to be introduced.
When selecting the early warning analysis steps, the statistics regarding the duration of microseismic events and their energy indicators for early warning, generally according to the mine downhole resting arrangement, must be considered, along with safety management that facilitates shift handover. Real-time analysis of the processed waveform data was performed by counting the cumulative number of microseismic events E i and the cumulative microseismic energy N i within a time step.
In order to eliminate the abnormal increase or decrease in the number of microseismic events and their energy due to the system failure, the correction should be made according to the number of stations (measurement points) in the network, and the corrected cumulative microseismic event number E i = k E i , the cumulative microseismic event energy N i = k N i , and the correction criteria are as follows: (a) when the number of normal operating stations is greater than or equal to 4 and less than or equal to 1/2 of the total number of stations, the number of microseismic events and the energy correction factor k are taken as 1.2. The number of microseismic events and the energy correction factor k are 1.2; (b) when the number of normal operating stations is greater than two and less than four, the number of microseismic events and energy correction factor k are taken as 1.5. The discriminant Equation (5) is satisfied.
E i + 1 E i 1 N i + 1 N i 2

3. Fractal Theory

3.1. Calculation Formula

Fractals are geometric objects that may repeat their geometry at smaller (or larger) scales owing to the inherent self-similarity of the object. This theory has been widely applied in the public sphere and is very helpful for processing microseismic data [47,48]. The fractal dimension is an important theory in fractal geometry and is a central tool used to describe the complex structure of fractal geometries. They are widely used in engineering applications. The process of change in this system exhibits characteristics of continuity and can quantitatively describe the self-similarity, irregularity, and degree of fragmentation of fractal structures. In particular, the similarity and counting box dimensions are frequently used to describe these structures.
Because the distribution pattern of microseismic events is self-similar, fractal theory was used to study the time statistics and calculation method of microseismic events, and the concept of fractal dimension was applied to quantitatively analyze the characteristics of microseismic distribution over time in the Maoping I# orebody.
For dimension similarity, if a graph is composed of N similar graphs 1 / r times its original graph, or its (length, area, and volume) measurements increase to the original N = r D . Taking log on both sides, we obtained log ( N ) = D log ( r ) . The fractal dimension is defined as:
D = log ( N ) log ( r )
where D is the similarity fraction dimension, which can be either an integer or a fraction. Usually, the similarity fraction dimension in two-dimensional space is between one and two, and the similarity fraction dimension in three-dimensional space is between one and three. The proposed similar fractional dimension provides a new direction for the study of complex forms and enables people to find order in disorder. A large number of experts and scholars have used the fractional dimension to solve many scientific problems. For example, the degree of geometric irregularities present along a coastline can be measured using the fractal dimension as a criterion [49].
The fractal dimension is calculated by dividing the fractal form into small compartments, and the fractal dimension is calculated from the relationship between the number of intersecting boxes and the unit of division, and the segment N can be regarded as the total number of compartments where the curve intersects the box, i.e., the relationship between N and r can be expressed as
ln N ( ε ) = D ln ( ε ) + A
where ε is the multiple of shrinkage: N ( ε ) is the total number of points where the curve and the box intersect; D is the fractal dimension; and A is a constant term. Therefore, ln N ( ε ) and ln ( ε ) are related linearly.

3.2. Calculation Process

The distribution range of similar microseismics compared with the actual working conditions must be accurately delineated and an ellipsoidal model established. The long axis length is X, the middle axis is Y, and the short axis is Z. Based on the model parameter scaling, a sub-model is established with time t n as the variable, and its model parameters are ( X t n , Y t n , Z t n ). The number of microseismic events within each model is counted, and the relevant index is calculated according to Equation (8).
μ ( X t n ) = S t n S * 2
where S * is the total number of microseismic events within the model range, and S t n denotes the number of microseismic events within the submodels constructed at different time periods, n = 1 , 2 , n , the correlation index is calculated in the range of the space–time domain μ ( X t n ) .
Linear fitting of the set of data points ( log X t n , log S t n ) is performed using the least-squares method, as shown in Equation (9):
k = lim x n log μ ( X t n ) log X t n
When k satisfies self-similarity, the microseismic time fractal dimension D f of the null domain can be derived, as shown in Equation (10).
D f = k
Based on the above, the calculation process is simplified as follows: the rock burst incubation and occurrence process based on the real-time monitoring by the microseismic system, the total number of microseismic events within the total time course T , and the number of microseismic event even pairs within the t time course are counted based on the instantaneous-type rock burst conception and occurrence process recorded by the microseismic monitor. The correlation index c ( t ) within the time course t is calculated using Equation (8).
c ( t ) = 2 N ( t ) N ( N 1 )
With lg t as the horizontal coordinate and lg c ( t ) as the vertical coordinate, a right-angle coordinate system is established, and a linear fit is performed. Slope D t is the similarity dimension of the microseismic time distribution.
D t = lim t T lg c ( t ) lg ( t )
If the fitted straight line has a good linear correlation, it indicates that the rock microsystem fractures are generated in time with a fractal distribution relationship. The value of the slope D t is the similar fractal dimension of the temporal distribution of microseismic events. Therefore, the temporal fractal dimension can be calculated using the linear slope method, where the slope value represents the temporal fractal dimension of the microseismic events. This method enables the calculation of the fractal dimension using microseismic events obtained from the monitoring process.

4. Study Case

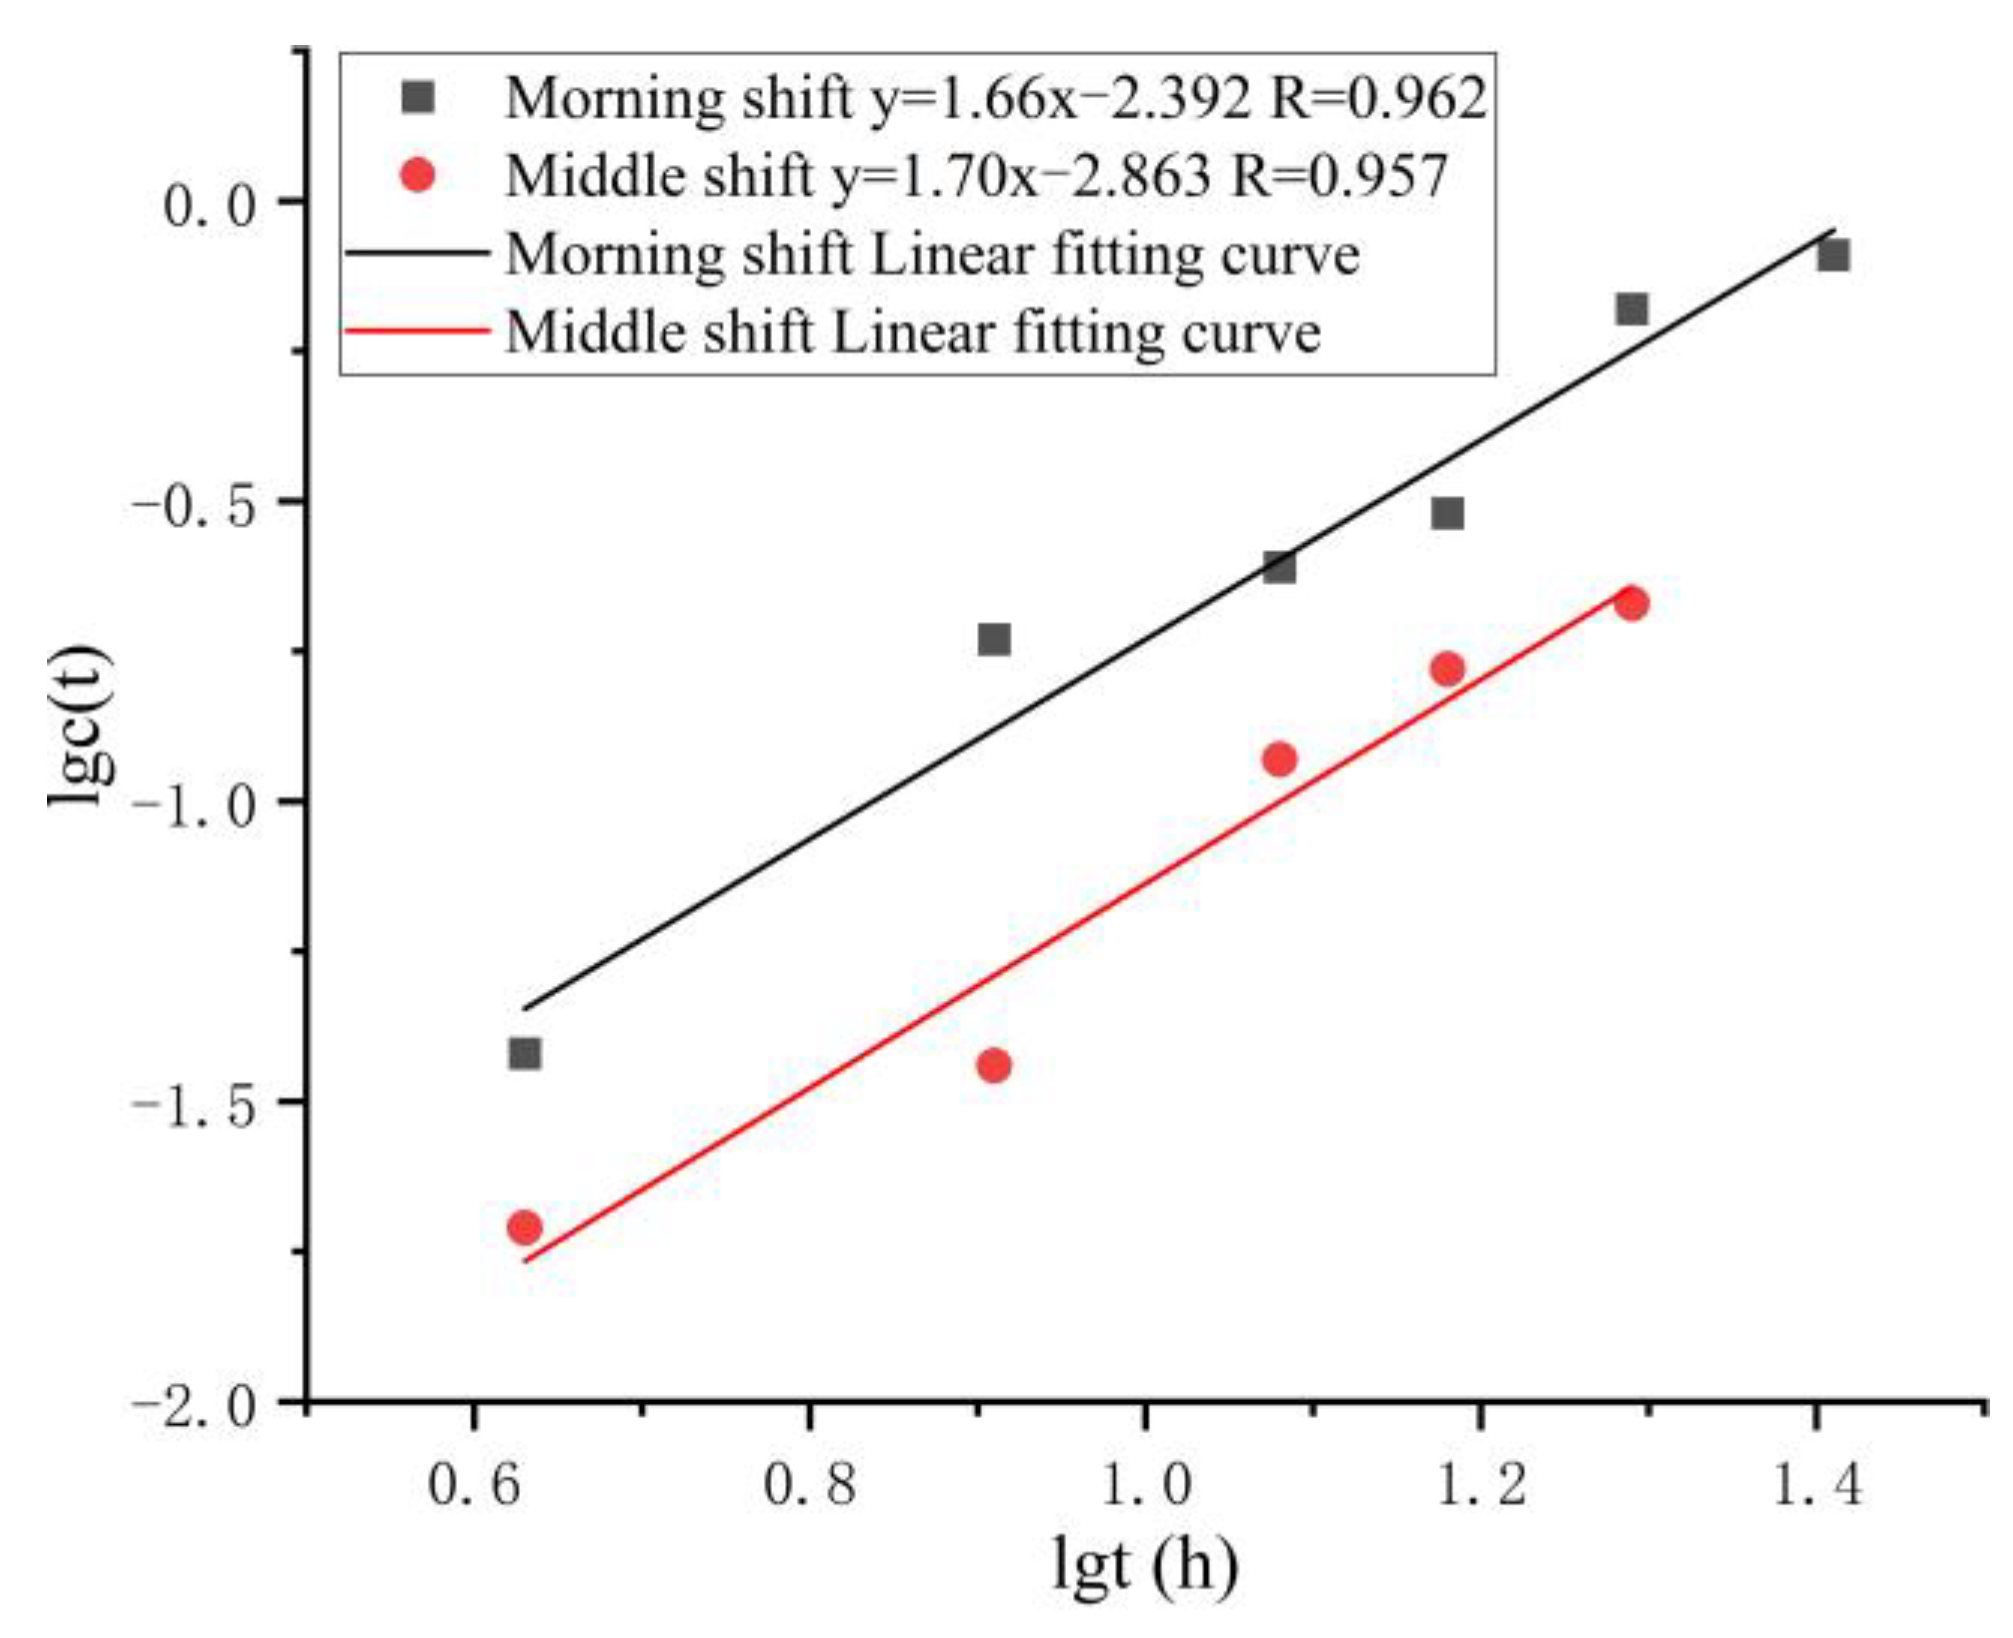
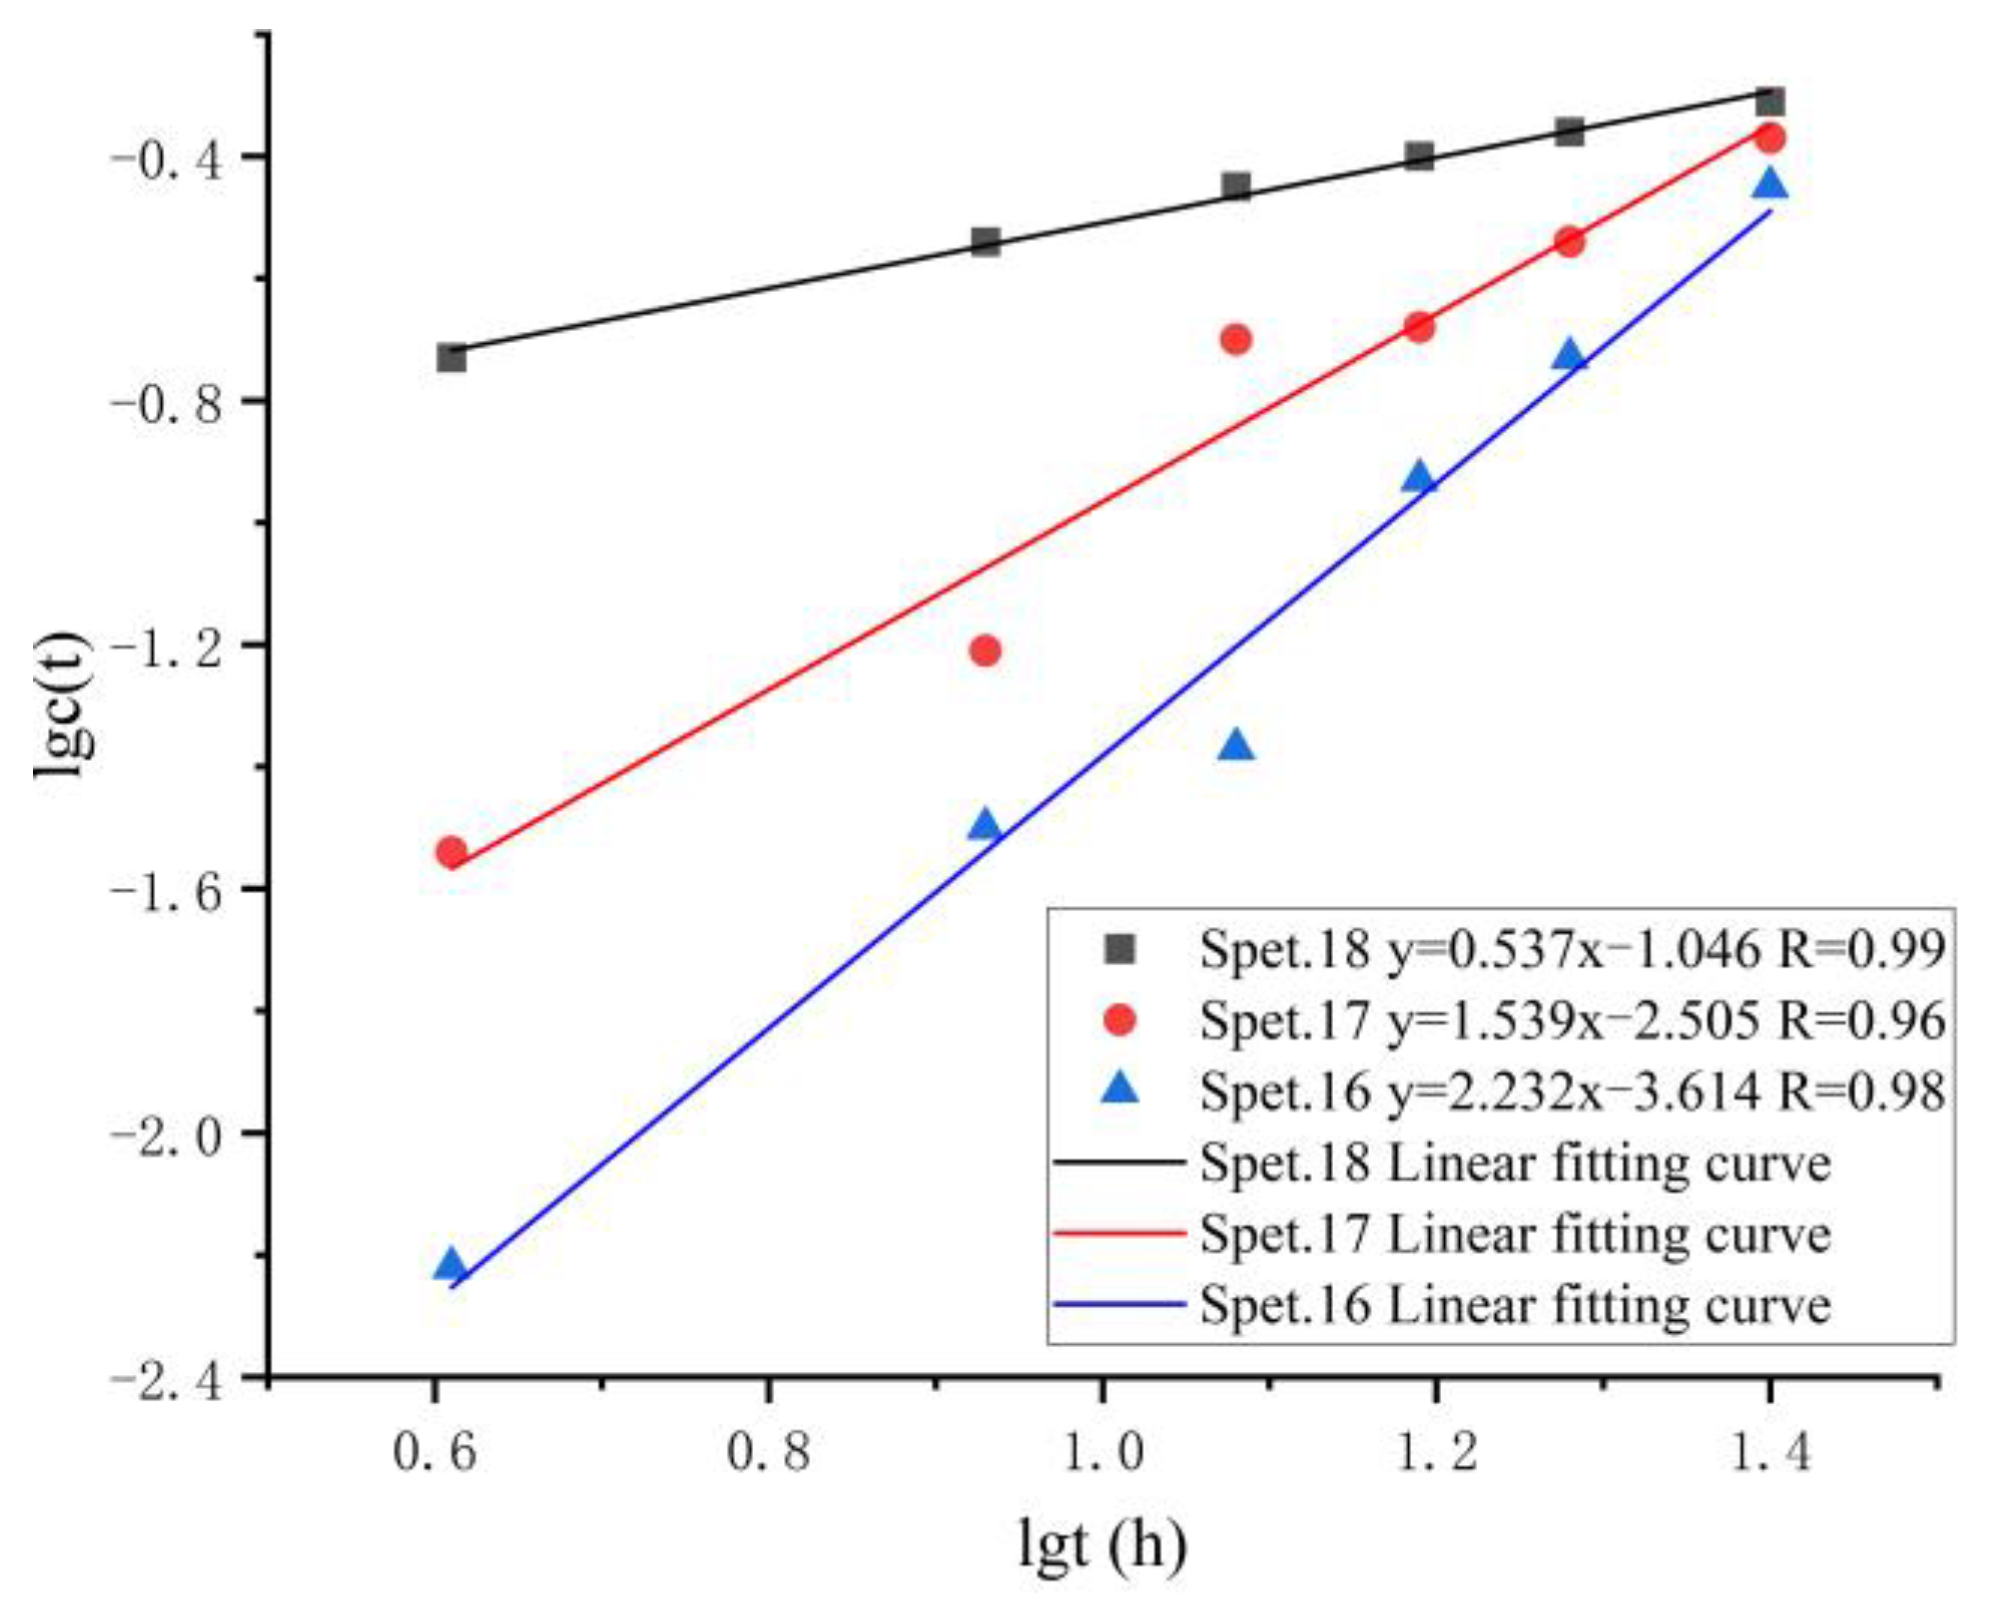
4.1. Example of Calculations Based on Temporal Fractal Dimension

As shown in Figure 3, the microseismic events in orebody I# were mainly distributed between 13:00 and 16:00 in the morning shift and 18:00 and 21:00 in the middle shift, intercepting these two periods for curve fitting.
The lg c ( t ) was calculated from the distribution of microseismic events over time. Using the microseismic event time range lg t t as the horizontal coordinate (here, t was chosen as 0 to 4, 8, 12, 16, 20, 24) and lg c ( t ) as the vertical coordinate for linear fitting, the relationship between lg t lg c ( t ) for the morning and mid-shift, as shown in Figure 4, had a self-similarity coefficient in the range of 0.955–0.985, indicating a good linear correlation. On this basis, as shown in Figure 5, the distribution of the microseismic time for the subsequent three days was counted, and a fitting analysis was performed.
From the above analysis, it can be concluded that microseismic events exhibit fractal properties over time, as shown in Figure 6. To analyze this further, we took five time periods from each of the three days from September 16 to 18. The slope D t of lg t lg c ( t ) , the fractal dimension of microseismic events in time, decreased in the process of rock burst gestation to 0.537 on September 18, indicating partial gestation of rock burst during a three-day monitoring period. The magnitude of the temporal fractal dimension was found to be unrelated to the September 16 increase, which corresponded to the accelerated accumulation of microseismic events over time. However, the decrease in the time fractal dimension on September 18 corresponded to a decreasing trend in the number of microseismic events over time. Hence, a larger fractal dimension during the rock burst process indicates a more intense rock burst and a higher risk of occurrence.
The resulting temporal fractal dimensional values can effectively express grade changes in the rock burst incubation process and more intuitively reflect the distribution characteristics of microseismic time points in a specific time period.

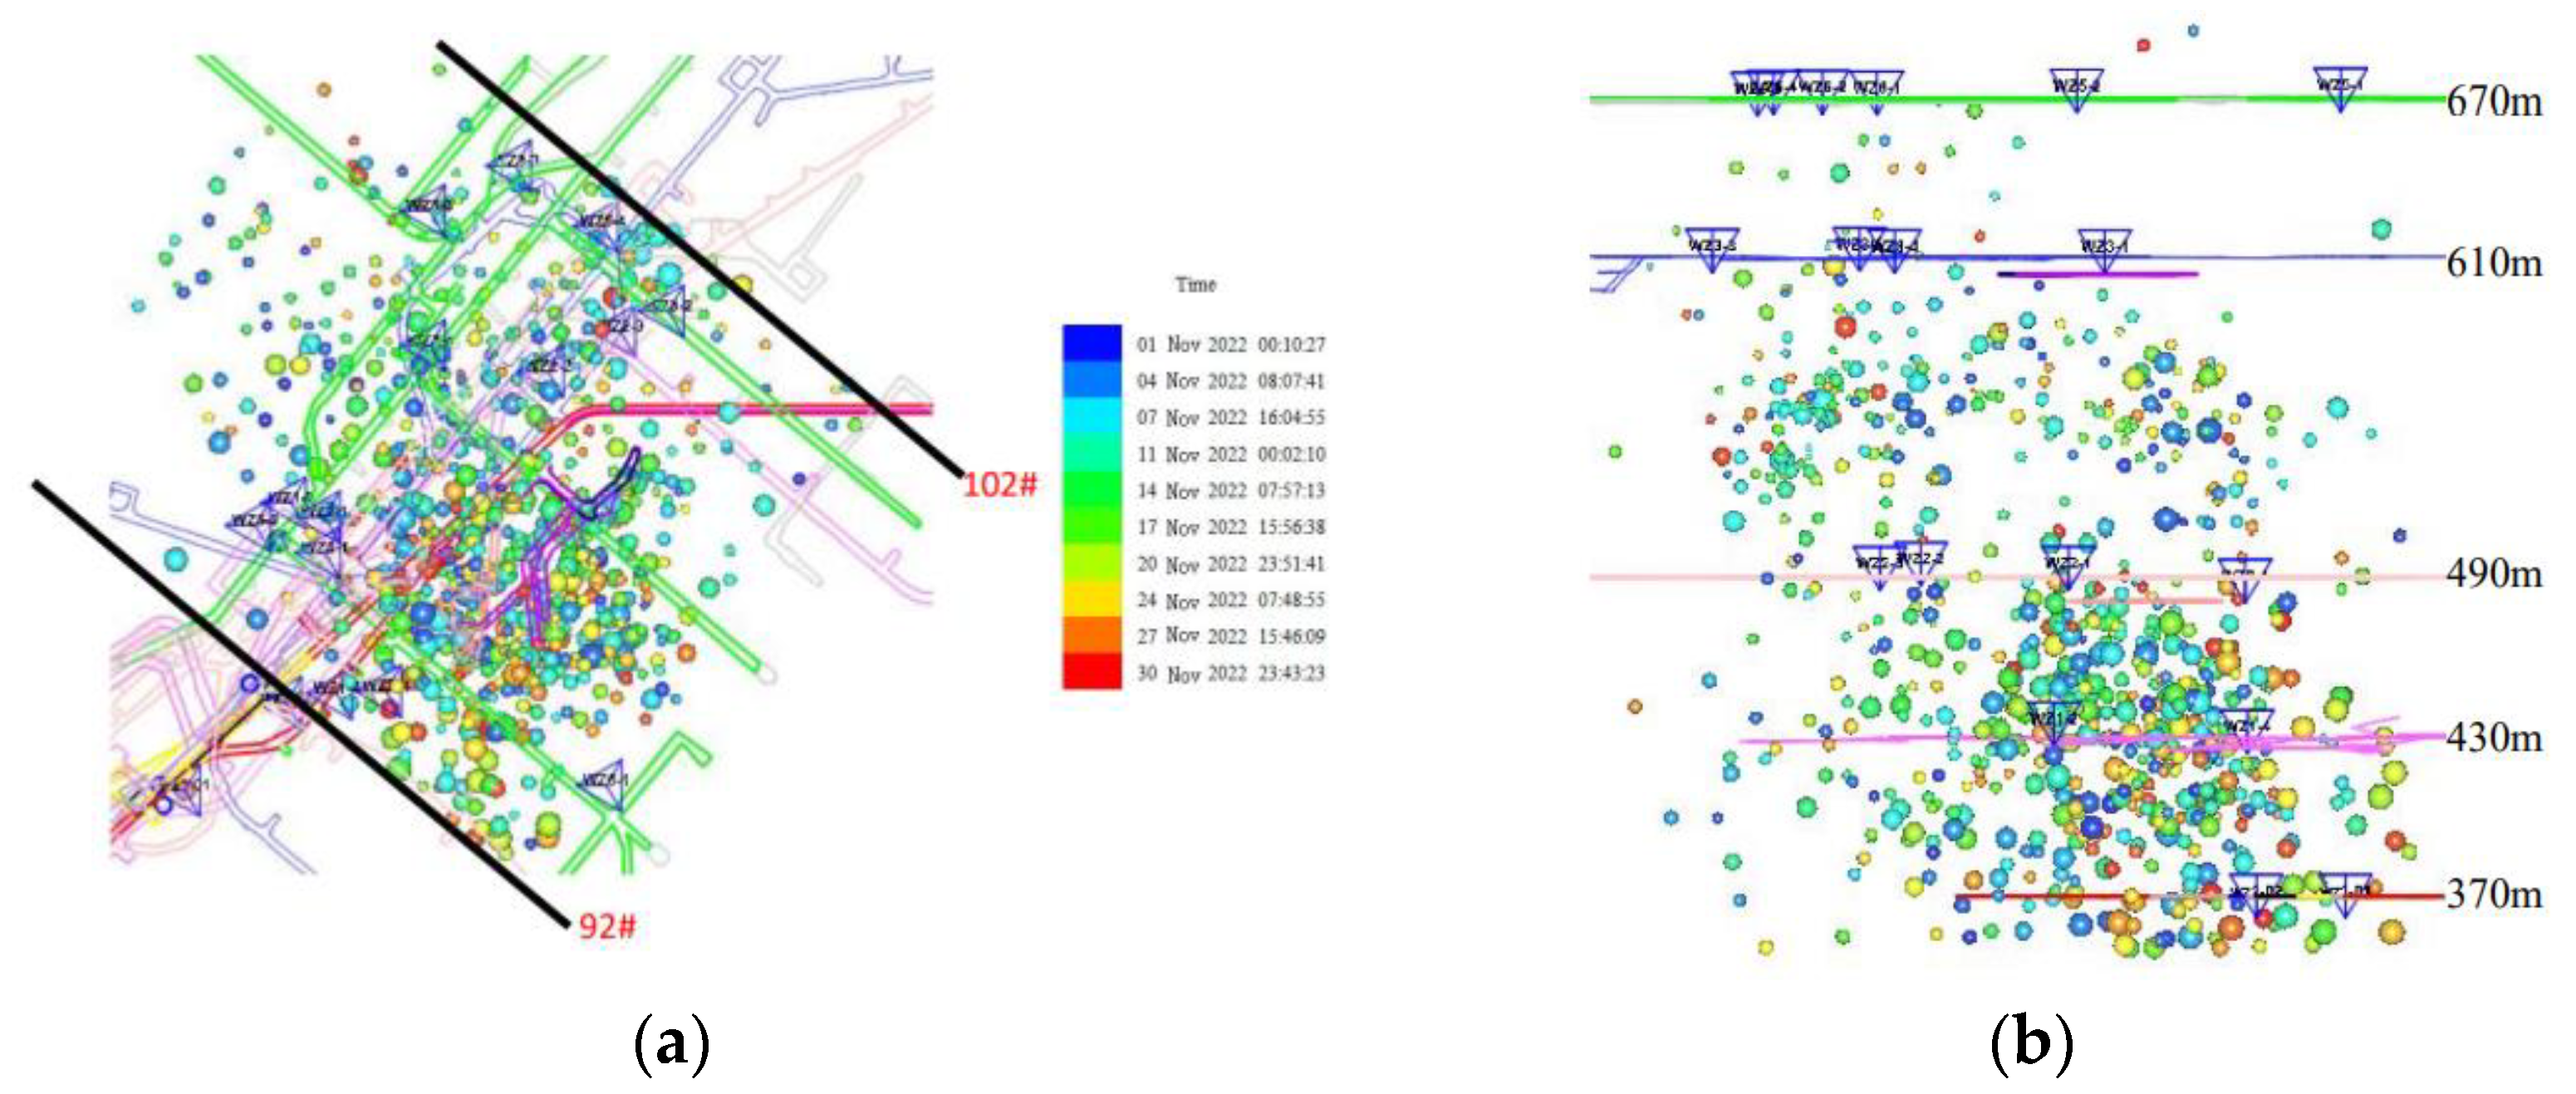
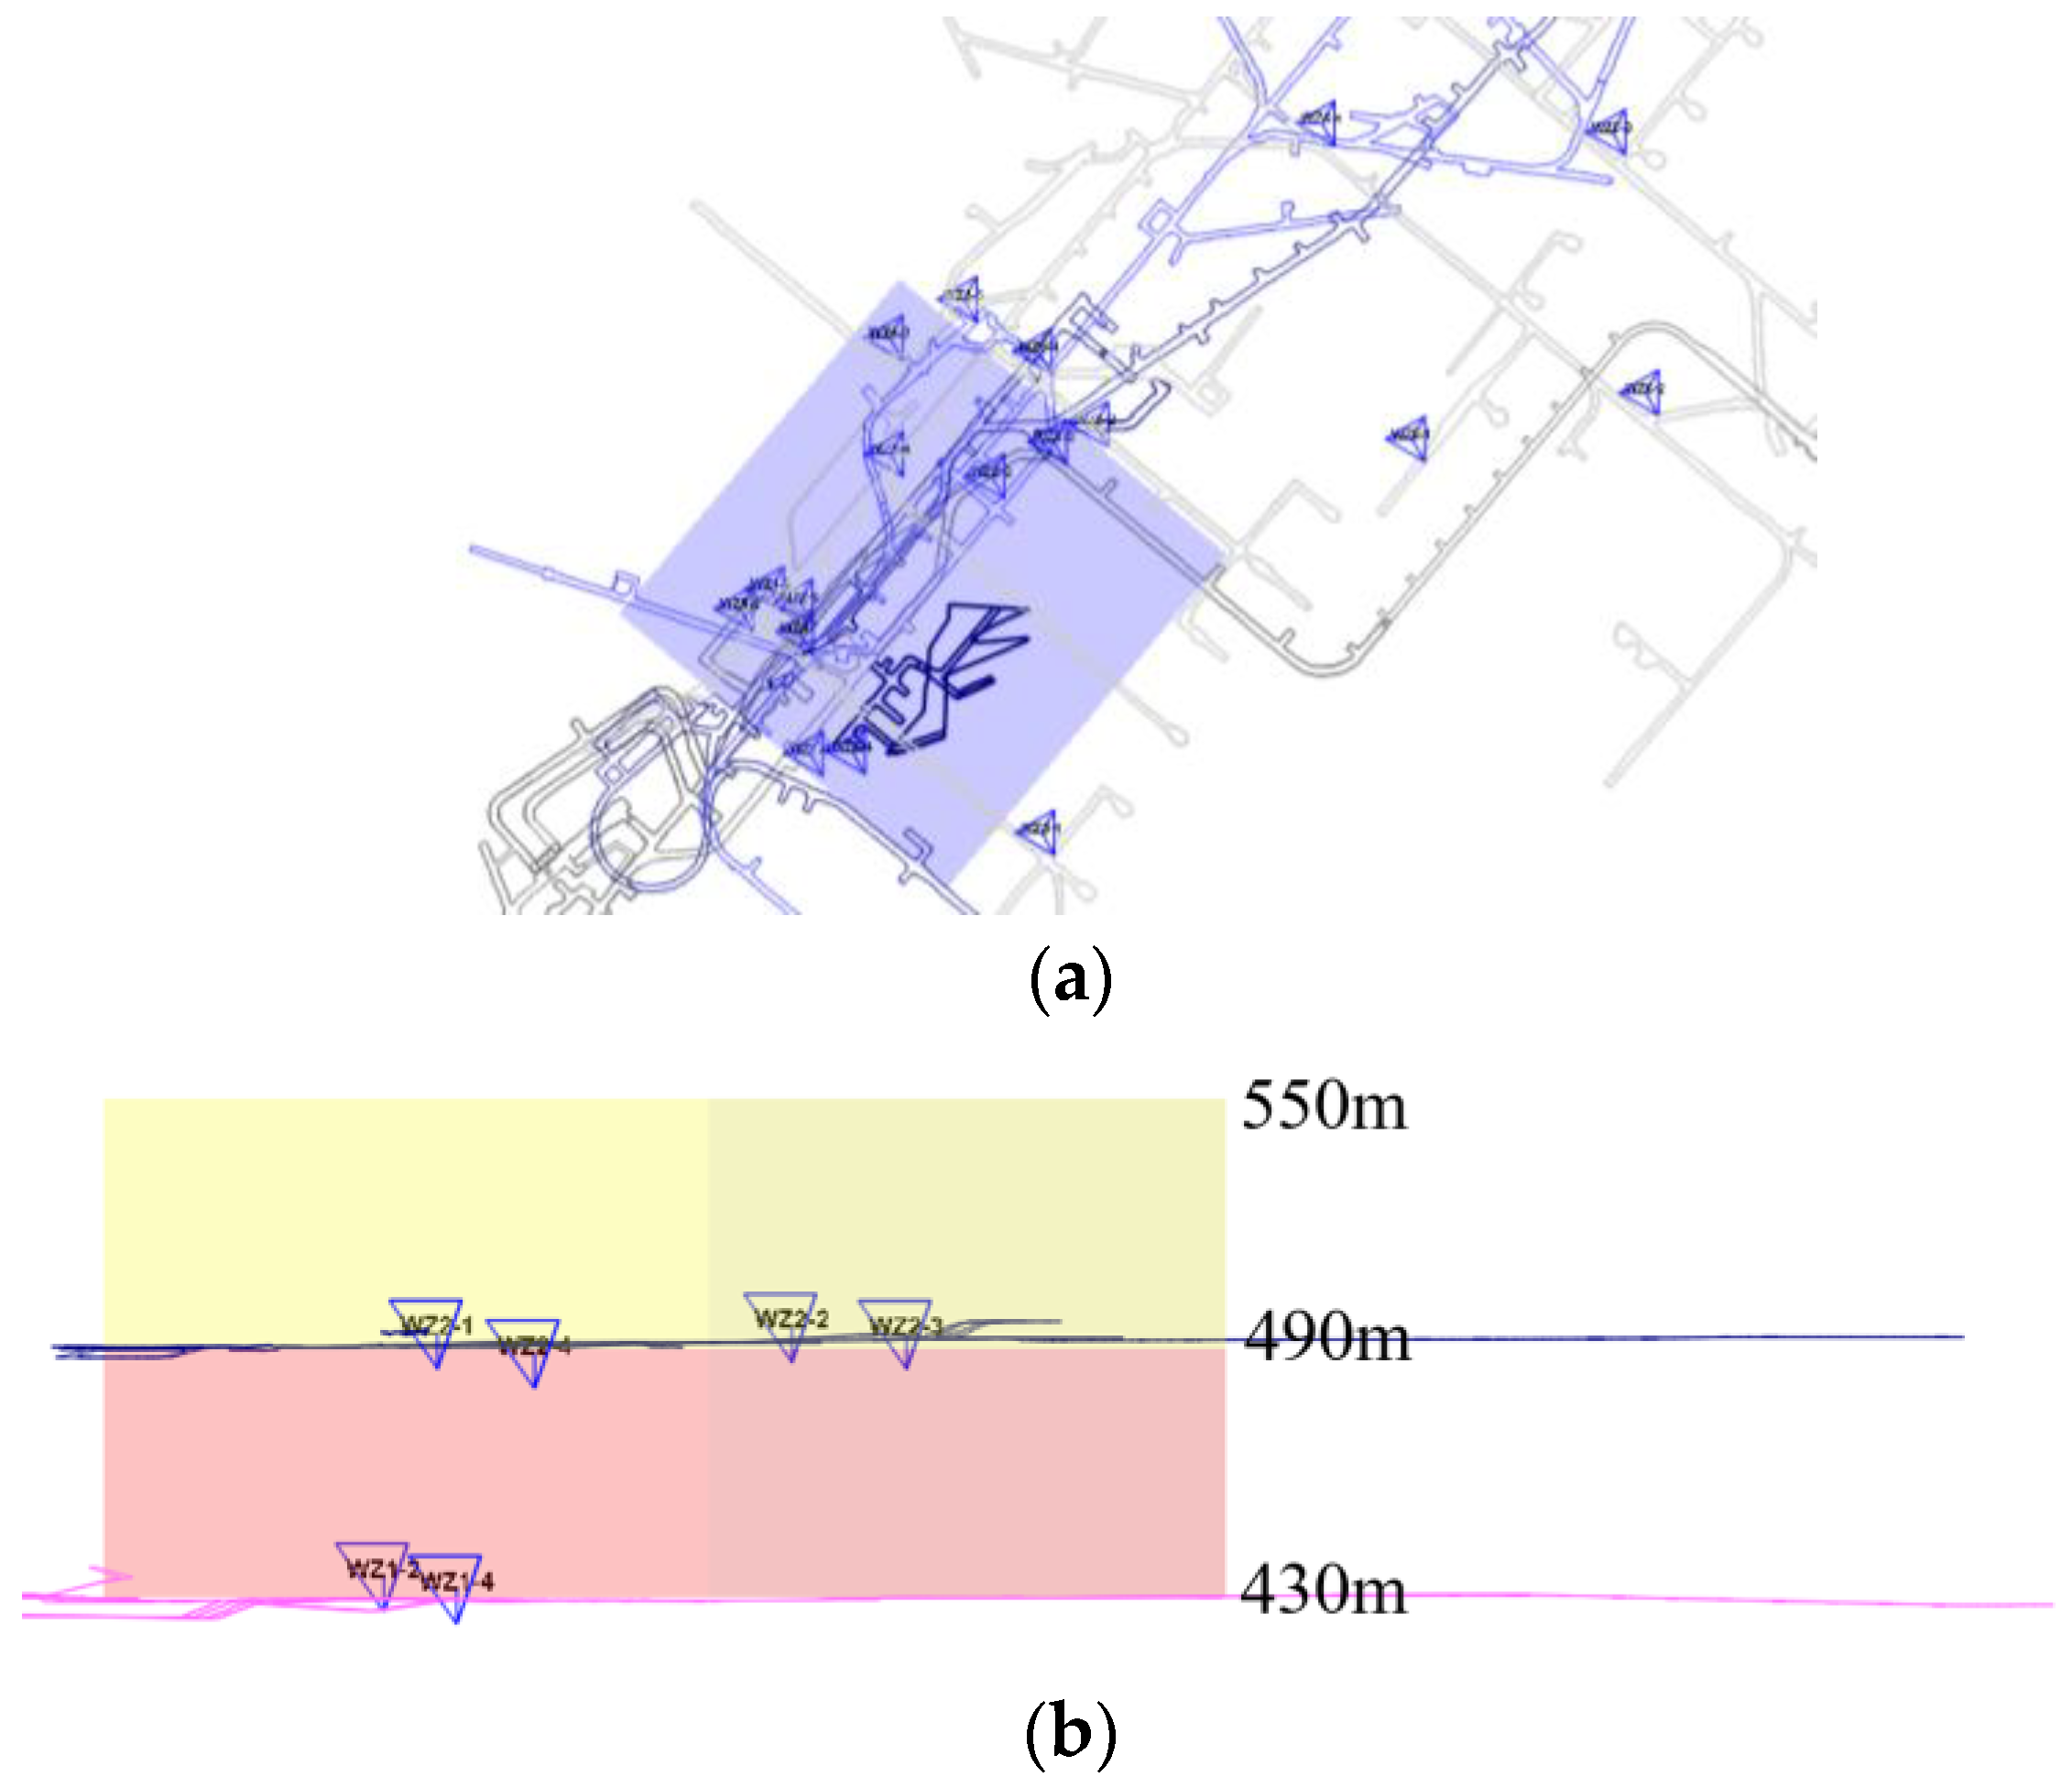
4.2. Spatial Distribution Pattern of Microseismic Events

In essence, the breeding process of rock explosions is the damage evolution process of microfractures inside the rock (body). Microseismic and rock microfractures have a close relationship; they can objectively represent the microfracture evolution process, reflecting, continuously and in real time, the generation and expansion of microfractures inside the rock, and they are an effective tool to study the damage evolution of the rock body. It can be seen that the damage evolution process of rock bursts can be reflected by the spatial distribution of micro-rupture activities.
The magnitude of the earthquake is represented by the size of the microseismic event sphere, and the color indicates the time of the event. As shown in Figure 7, in the I# mineral zone area in the plane, the microseismic events were mainly concentrated between lines 92# and 102#; in terms of elevation, they were mainly concentrated between 490 m~350 m.
According to the first mining stratification of the I-8# orebody in the middle section of 430 m, the degree of rock fragmentation and roof collapse damage in the deep area is more serious than that in the upper section; the microseismic events around the I-8# orebody increased abnormally, and the intensity of the microseismic activities increased significantly. We established an analysis model to monitor and analyze ground pressure activity patterns of the I-8# orebody at depths ranging from 430 m to 550 m. The study focuses on various roadways within the mining area, such as slope roads, exit roads, and approach roads, located in the influence area. The model was based on a 430 m elevation and 120 m increase, and the final size of the analysis model was 194 × 190 × 120 m. The model was refined into two models according to the middle section, as shown in Figure 8.
According to the results of the model analysis, the microseismic events between 430–490 m were mainly distributed around the I-8# orebody between lines 94#–98#, while the microseismic events between 490–550 m are mainly distributed between lines 92#–102#. The microseismic events in the aforementioned area were primarily induced by mining operations in the middle section between 490 m and 430 m. Therefore, ground pressure manifestations, such as rock ruptures in the quarry, should be closely monitored and strengthened in this area.

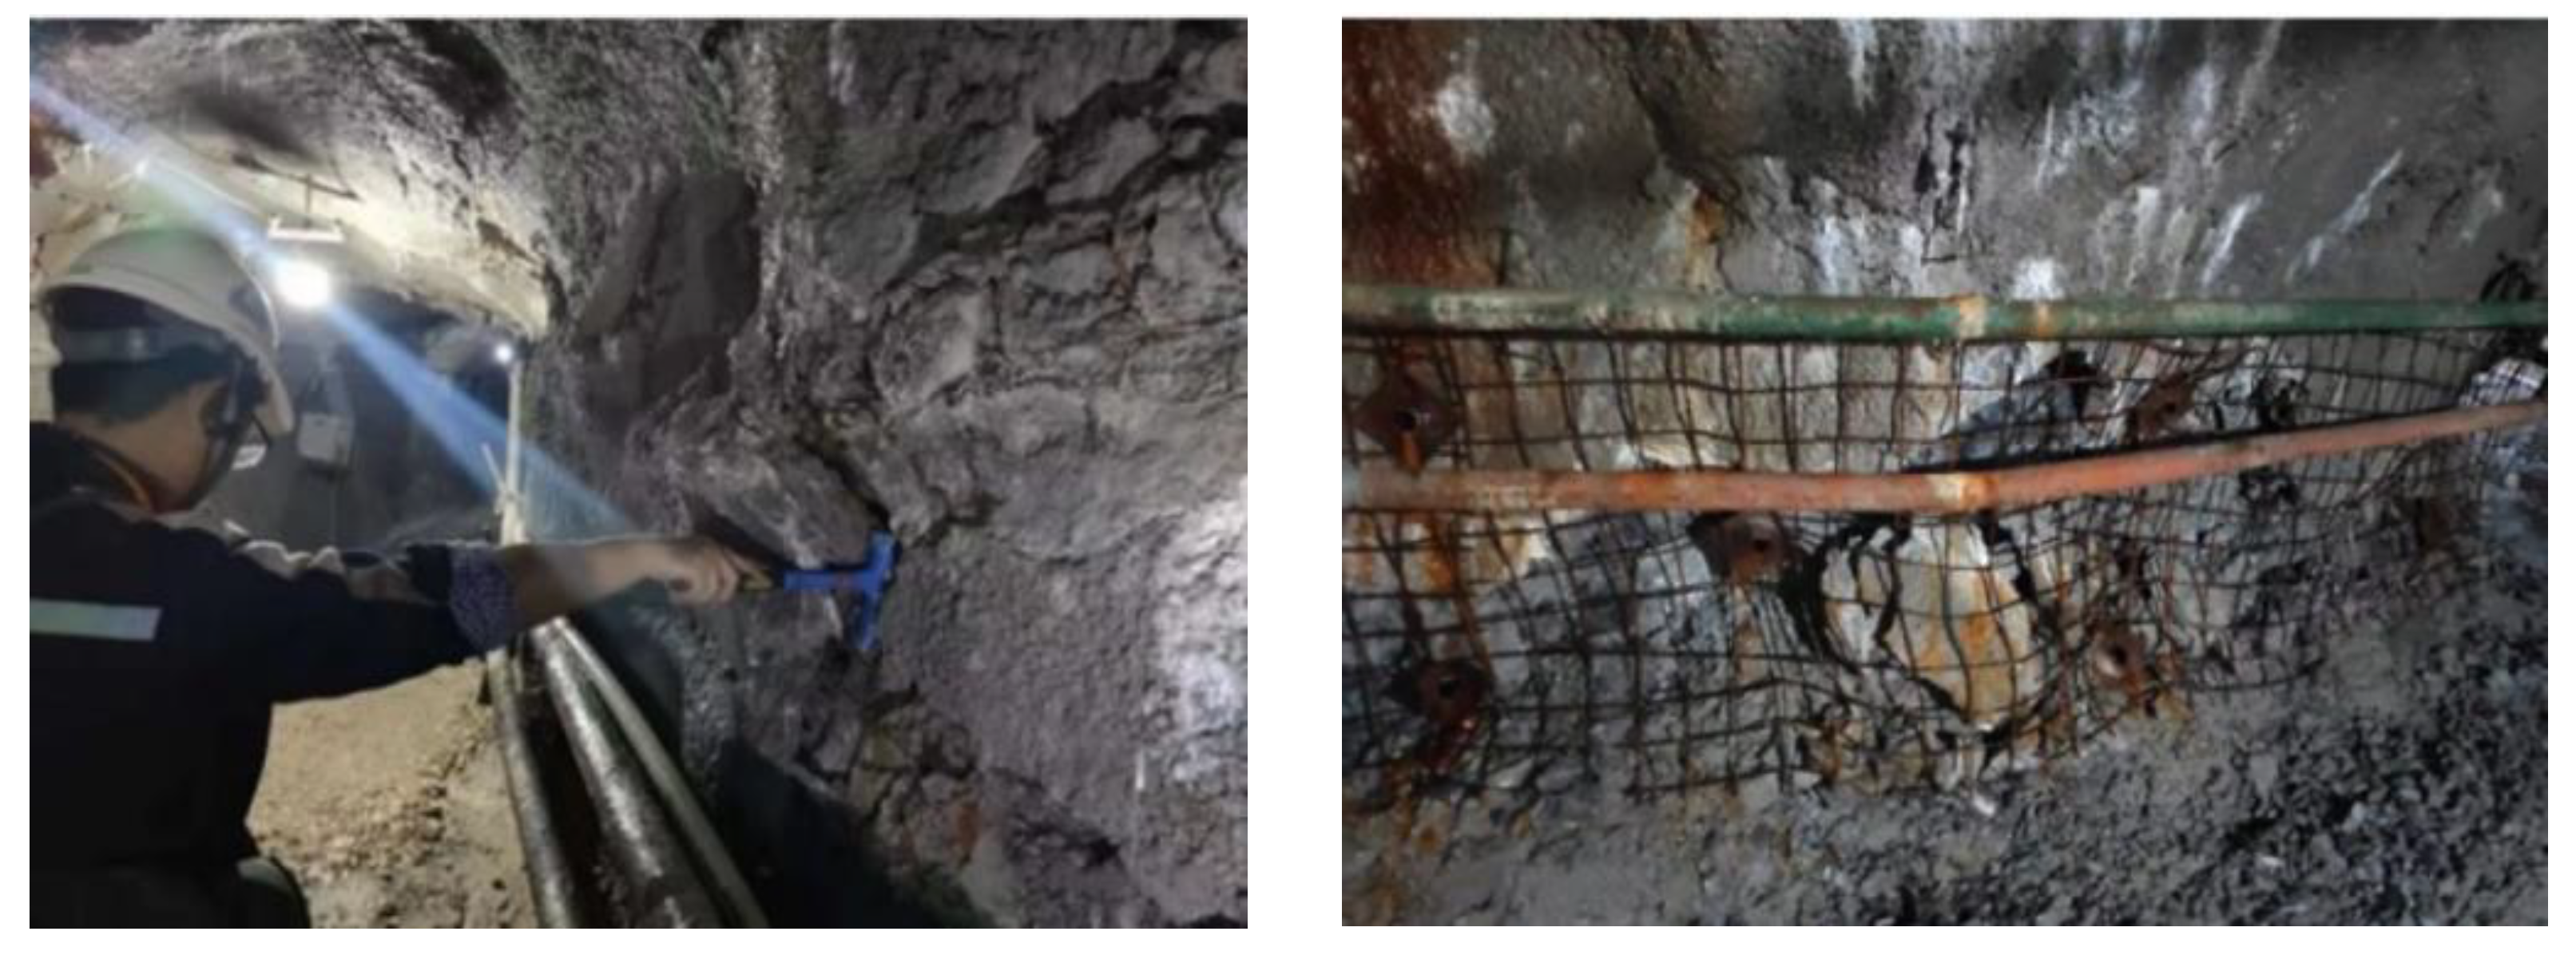
4.3. Actual Working Conditions on Site

According to the actual feedback from the site, the Maoping mine has experienced several smaller ground pressure (or rock burst) events at the top of the mining working face roadway. When subjected to high stresses at depth, whether inherent or caused by mining activity, rock fractures can occur within the support structure. This can result in a reduced bearing capacity of the rock body and detachment of supporting structures, such as pipe slit anchors, from the fractured rock mass. The prolonged action leads to the damage of the 433 m quasi-slope path of the I-8# orebody belonging to this type, as shown in Figure 9. With an increase in mining depth and the superposition of deep high-pressure water, this characteristic of deep fractured rock bodies becomes more prominent.
According to the early warning method, 28 sets of data were counted with 8 h as the step time, and the ratio of the accumulated microseismic events to the accumulated energy and the time period before and after the statistical step time are shown in the table. It can be seen that there are four sets of data simultaneously meeting the early warning index of ground pressure risk, accounting for 14% of all data, especially within 5 days before the rock burst phenomenon. The data meeting the early warning condition are concentrated, comprising 75% of the total early warning data, indicating that this time period has a higher ground pressure risk than other time periods. This is consistent with the predictions of the fractal dimension and spatial distribution pattern analysis.

5. Discussion

The Maoping mine is located in a deep area, where ground pressure phenomena are common. To prevent ground pressure disasters, it is necessary to strengthen the monitoring of concentrated microseismic events and conduct regular underground inspections. If deformation damage, such as roadway collapse, is detected in the top plate, appropriate protective measures, such as closure or support, should be taken promptly. Therefore, the analysis of microseismic monitoring results for rock burst warnings plays a non-negligible role. The spatial and temporal distribution patterns of microseismic events can help us observe their abnormal locations and provide early warnings. The process of microseismic events can be represented more intuitively using the fractal dimension.
The results of the above analysis show that studying the spatiotemporal characteristics of microseismicity is of great significance for predicting rock burst hazards and providing guidance in the field. From the perspective of Section 4.1, with the continuous advancement in mining activities, the microseismic events in the area of concern continue to increase, and the time fractal dimension shows a steady growth phase. When the energy in the volume of the surrounding rock before the rock explosion exceeds the energy storage capacity of the surrounding rock body, the damage in the surrounding rock accelerates. At this time, the number of microseismic events further increases, the time fractal dimension rapidly increases, the time fractal dimension rapidly increases, and the time fractal dimension is rapidly reduced owing to the stabilization of the surrounding rock after the rock explosion. It can be seen that the fractal dimension is a concise and efficient generalization for the analysis of the microseismic time evolution law. Studying the spatial distribution of microseismic events can visually reflect the area of microseismic event anomalies to further refine the study area and provide early warning, prevention, and control of the rock burst phenomenon.
In view of the above analysis methods of the spatial and temporal distribution law, further research is needed. (1) The use of fractal theory to study the law of temporal distribution is consistent with field reality, but the index is single, and more methods of microseismic temporal distribution law need to be explored for comprehensive analysis, and the refinement and comprehensive analysis of this law is necessary. (2) It is necessary to further summarize the spatial distribution law of microseismic events and to analyze the relationship between the dense area of microseismic events and the occurrence of rock burst phenomena. The next step is to promote the rapid identification of early warnings. (3) In the future, it is necessary to analyze the microseismic results from a graphical point of view, achieve accurate and intelligent identification, establish a microseismic image identification and analysis system, automatically generate reports, and continuously correct and improve them in the field.

6. Conclusions

In this study, we analyzed the characteristic relationship between the number of microseimic events and time by monitoring their temporal occurrence. We also used fractal theory to investigate the results. To verify the feasibility of the early warning method, we analyzed the spatial distribution characteristics of microseismic events and established an observation model in the field. The results of the study are as follows:
(1)
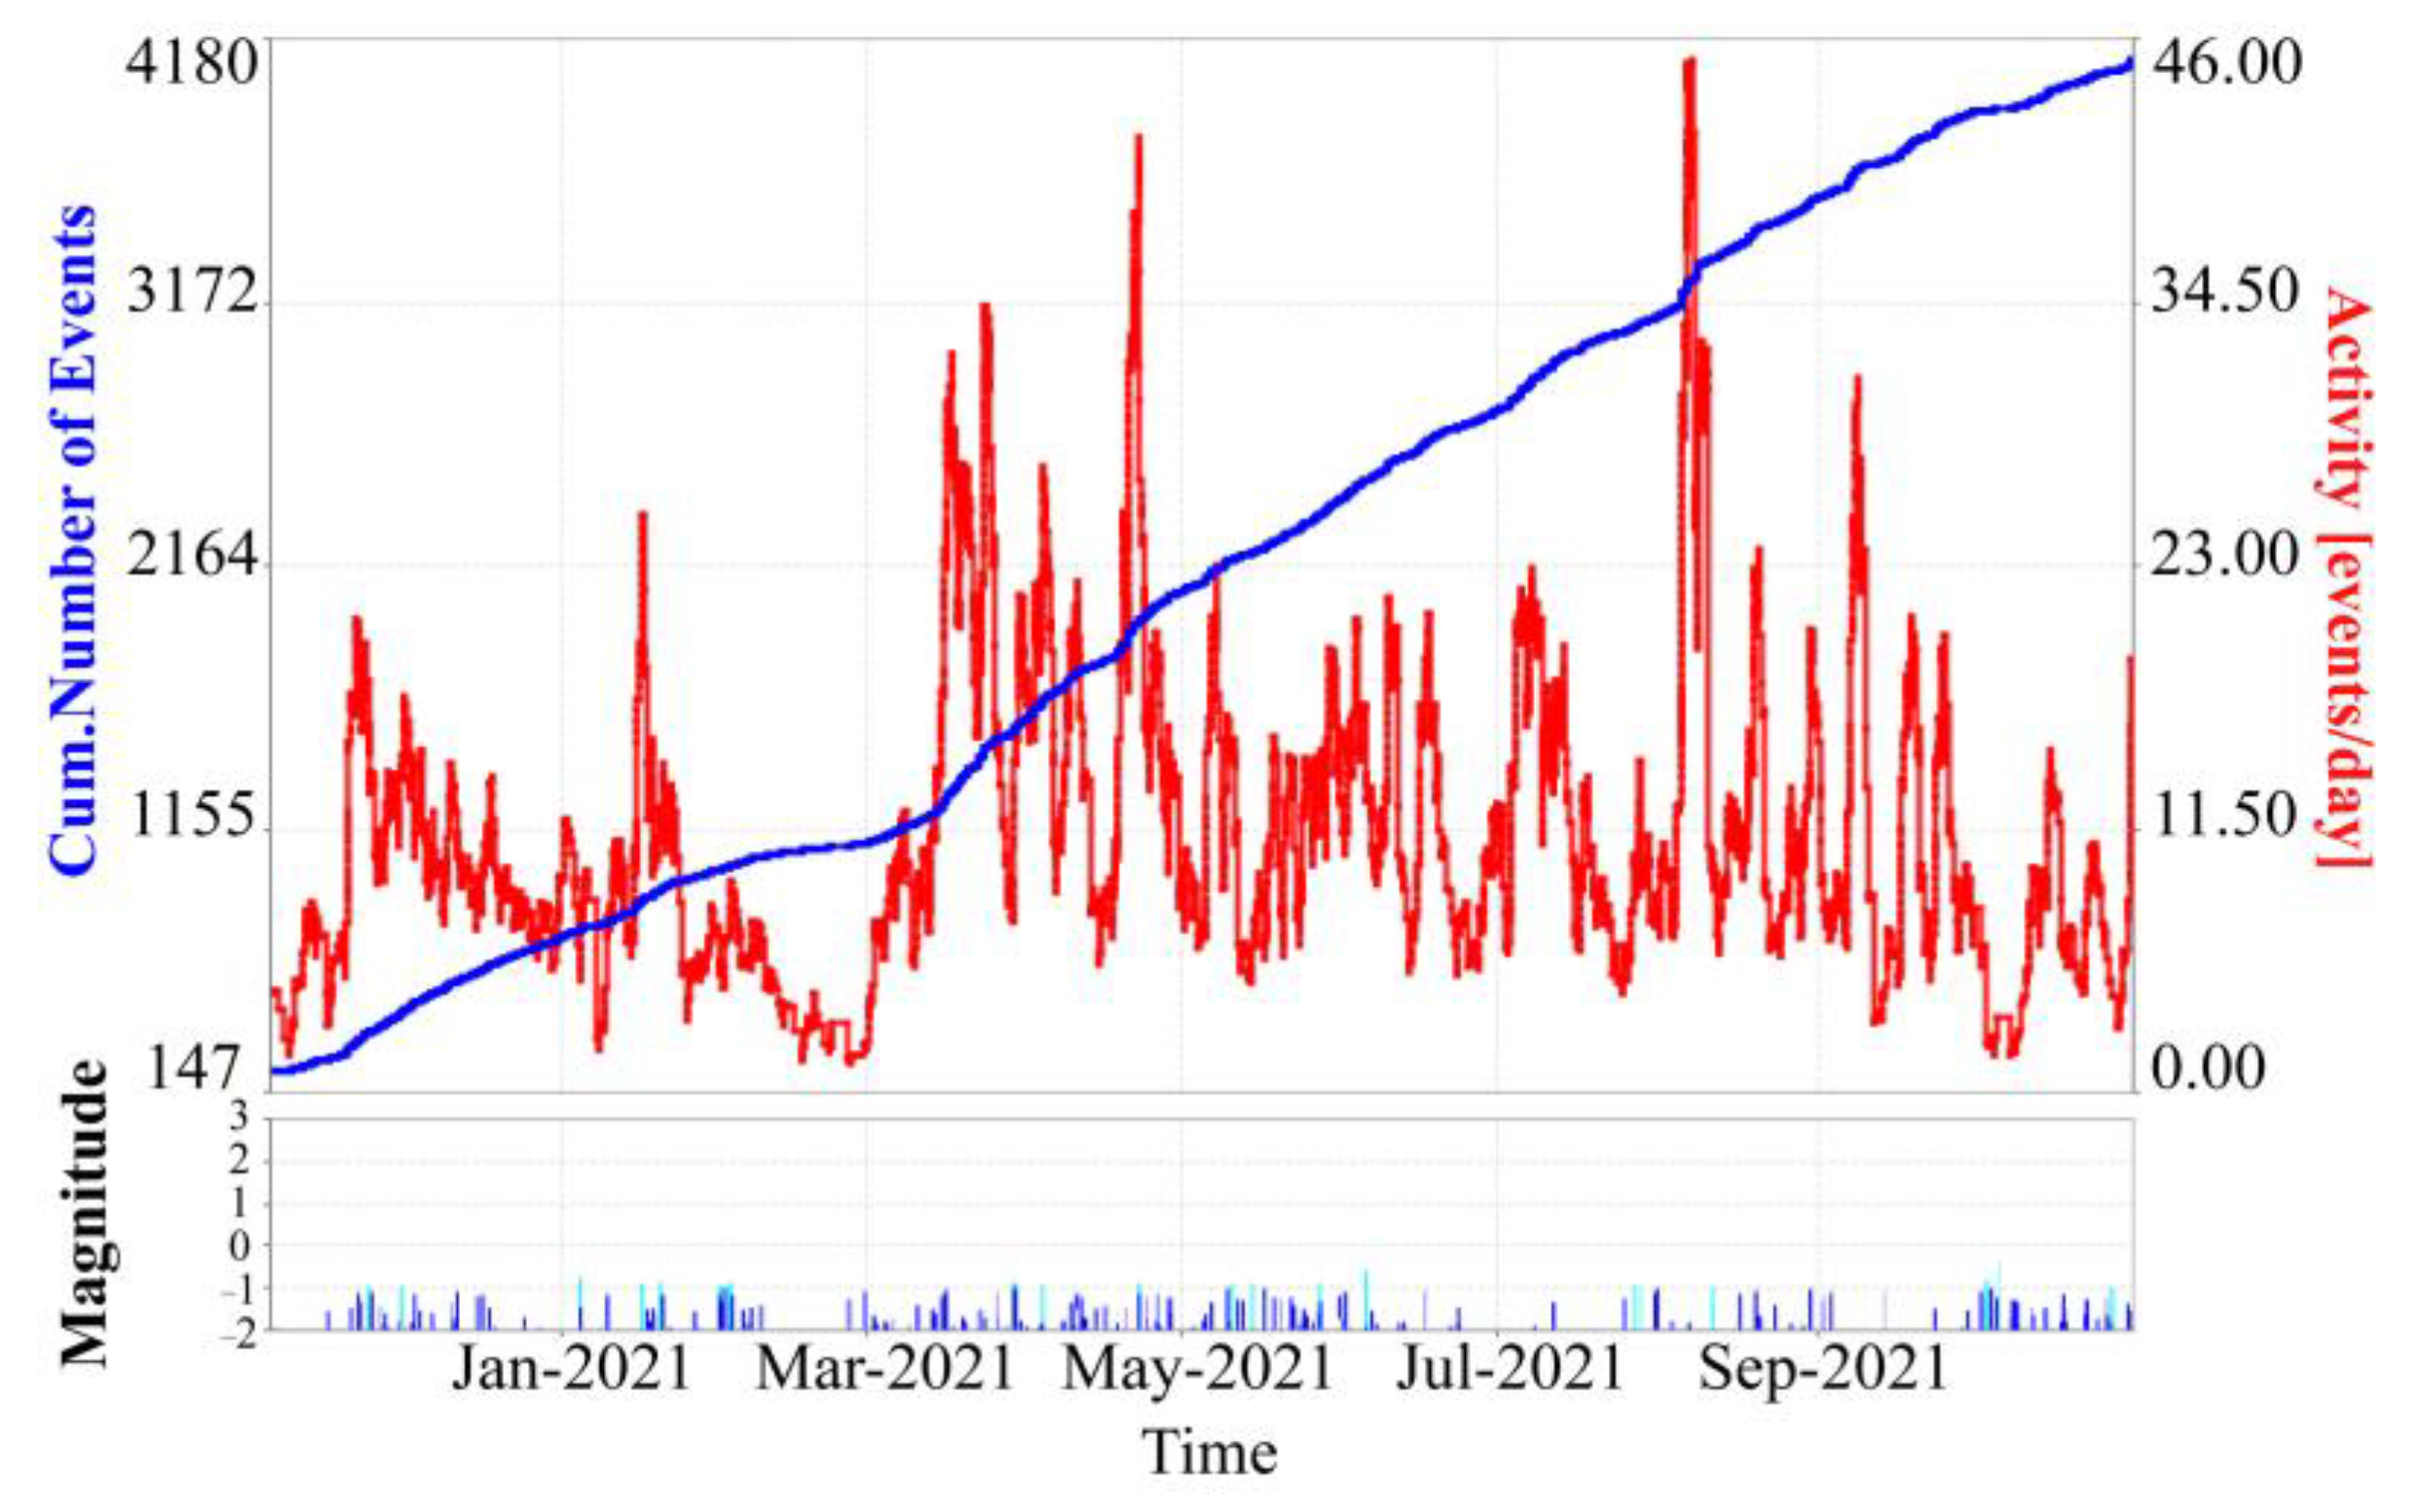
The temporal fractal dimension is consistent with the distribution of microseismic events over time, which is related to the accelerated accumulation of events. The growth of the fractal dimension of the rock burst incubation process was consistent over time, and a large amount of microseismic time data can be simplified using the fractal dimension to facilitate field judgment.
(2)
Based on the spatial distribution characteristics of the microseismic time used to build the observation model, the location of microseismic events can be visualized, and the occurrence of rock bursts can be predicted through the density of events for study and judgment. The refined model can highlight the key area that require attention and facilitate long-term observations.
(3)
The reliability of the early warning method was verified in the field, proving that this study is significant for subsequent rock burst monitoring and safe operation of the Maoping mine.

Author Contributions

Conceptualization, P.W. and Z.Z.; data curation, D.Z. and Z.C.; resources, P.W., D.Z. and Z.C.; visualization, P.W.; writing–original draft, Z.C. and Z.Z. All authors have read and agreed to the published version of the manuscript.

Funding

This research was funded by the Youth Science and Technology Innovation Fund, BGRIMM Technology Group (Grant No. 04-2228), and the National Key Research and Development Program of China (Grant No. 2017YFC0602904).

Institutional Review Board Statement

Not applicable.

Informed Consent Statement

Not applicable.

Data Availability Statement

The data used to support the findings of this study are available from the corresponding author upon request.

Acknowledgments

We thank Yongshun Cai, Feng Shi, Cong Cao, Baokun Zhou, and Changfeng Li for their assistance in improving this manuscript.

Conflicts of Interest

The authors declare no conflict of interest.

References

  1. Wang, C.; Gao, A.; Shi, F.; Hou, X.; Ni, P.; Ba, D. Three-dimensional reconstruction and growth factor model for rock cracks under uniaxial cyclic loading/unloading by X-ray CT. Geotech. Test J. 2019, 42, 117–135. [Google Scholar] [CrossRef]
  2. Liu, X.; Zhang, H.; Wang, X.; Zhang, C.; Xie, H.; Yang, S.; Lu, W. Acoustic emission characteristics of graded loading intact and holey rock samples during the damage and failure process. Appl. Sci. 2019, 9, 1595. [Google Scholar] [CrossRef] [Green Version]
  3. Michlmayr, G.; Cohen, D.; Or, D. Sources and characteristics of acoustic emissions from mechanically stressed geologic granular media—A review. Earth Sci. Rev. 2012, 112, 97–114. [Google Scholar] [CrossRef]
  4. Cai, W.; Dou, L.; Cao, A.; Gong, S.; Li, Z. Application of seismic velocity tomography in underground coal mines: A case study of Yima mining area, Henan, China. Appl. Geophys. 2014, 109, 140–149. [Google Scholar] [CrossRef]
  5. Liu, S.J.; Wang, Z.Q.; Zhang, Y.J.; Kou, M.M.; Bi, J. The phase-field simulations of blasting failure in granites. Int. J. Impact Eng. 2022, 167, 104274. [Google Scholar] [CrossRef]
  6. He, X.; Chen, W.; Nie, B.; Mitri, H. Electromagnetic emission theory and its application to dynamic phenomena in coal-rock. Int. J. Rock Mech. Min. Sci. 2011, 48, 1352–1358. [Google Scholar] [CrossRef]
  7. Cai, W.; Dou, L.; Gong, S.; Li, Z.; Yuan, S. Quantitative analysis of seismic velocity tomography in rock burst hazard assessment. Nat. Hazards 2015, 75, 2453–2465. [Google Scholar] [CrossRef]
  8. Hosseini, N.; Oraee, K.; Shahriar, K.; Goshtasbi, K. Studying the stress redistribution around the longwall mining panel using passive seismic velocity tomography and geostatistical estimation. Arab. J. Geosci. 2013, 6, 1407–1416. [Google Scholar] [CrossRef]
  9. Cao, A.; Dou, L.; Cai, W.; Gong, S.; Liu, S.; Zhao, Y. Tomographic imaging of high seismic activities in underground island longwall face. Arab. J. Geosci. 2016, 9, 232. [Google Scholar] [CrossRef]
  10. Gharehdash, S.; Sainsbury, B.A.L.; Barzegar, M.; Palymskiy, I.B.; Fomin, P.A. Field scale modelling of explosion- generated crack densities in granitic rocks using dualSupport smoothed particle hydrodynamics (DS-SPH). Rock Mech. Rock Eng. 2021, 54, 4419–4454. [Google Scholar] [CrossRef]
  11. Zhang, S.; Ma, T.; Tang, C.; Jia, P.; Wang, Y. Microseismic Monitoring and Experimental Study on Mechanism of Delayed Rockburst in Deep-Buried Tunnels. Rock Mech. Rock Eng. 2020, 53, 2771–2788. [Google Scholar] [CrossRef]
  12. Li, X.; Liu, K.; Sha, Y.; Yang, J.; Song, R. Numerical investigation on rock fragmentation under decoupled charge blasting. Comput. Geotech. 2023, 157, 105312. [Google Scholar] [CrossRef]
  13. Zhao, T.B.; Guo, W.Y.; Yu, F.H.; Tan, Y.L.; Huang, B.; Hu, S.C. Numerical investigation of influences of drilling arrangements on the mechanical behavior and energy evolution of coal models. Adv. Civ. Eng. 2018, 2018, 3817397. [Google Scholar] [CrossRef] [Green Version]
  14. Qiu, L.; Song, D.; Li, Z.; Liu, B.; Liu, J. Research on AE and EMR response law of the driving face passing through the fault. Saf. Sci. 2019, 117, 184–193. [Google Scholar] [CrossRef]
  15. Zhang, Z.Z.; Gao, F.; Shang, X.J. Rock burst proneness prediction by acoustic emission test during rock deformation. J. Cent. South Univ. 2014, 21, 373–380. [Google Scholar] [CrossRef]
  16. Wang, E.; He, X.; Wei, J.; Nie, B.; Song, D. Electromagnetic emission graded warning model and its applications against coal rock dynamic collapses. Int. J. Rock Mech. Min. Sci. 2011, 48, 556–564. [Google Scholar] [CrossRef]
  17. Ge, M. Efficient mine microseismic monitoring. Int. J. Coal. Geol. 2005, 64, 44–56. [Google Scholar] [CrossRef]
  18. He, M.C.; Miao, J.L.; Feng, J.L. Rock burst process of limestone and its acoustic emission characteristics under true-triaxial unloading conditions. Int. J. Rock Mech. Min. Sci. 2010, 47, 286–298. [Google Scholar] [CrossRef]
  19. Cai, W.; Dou, L.; Zhang, M.; Cao, W.; Shi, J.Q.; Feng, L. A fuzzy comprehensive evaluation methodology for rock burst forecasting using microseismic monitoring. Tunn. Undergr. Space Technol. 2018, 80, 232–245. [Google Scholar] [CrossRef]
  20. Hu, J.H.; Ren, Q.F.; Yang, D.J.; Ma, S.W.; Shang, J.L.; Ding, X.T.; Luo, Z.Q. Cross-scale characteristics of backfill material using NMR and fractal theory, T. Nonferr. Meral. Soc. 2020, 30, 1347–1363. [Google Scholar] [CrossRef]
  21. Zhao, F.; Hu, J.; Yang, Y.; Xiao, H.; Ma, F. Cross-Scale Study on Lime Modified Phosphogypsum Cemented Backfill by Fractal Theory. Minerals 2022, 12, 403. [Google Scholar] [CrossRef]
  22. Zhao, Y.S.; Feng, Z.C.; Yang, D.; Liang, W.G.; Feng, Z.J. Three-dimensional fractal distribution of the number of rock-mass fracture surfaces and its simulation technology. Comput. Geotech. 2015, 65, 136–146. [Google Scholar] [CrossRef]
  23. Turcotte, D.L. Fractals and Chaos in Geology and Geophysics. Phys. Today 1993, 46, 68. [Google Scholar] [CrossRef]
  24. Yamamoto, H.; Kojima, K.; Tosaka, H. Fractal clustering of rock fractures and its modelling using cascade process. Int. J. Rock. Mech. Min. 1993, 31, 81–86. [Google Scholar] [CrossRef]
  25. Bak, P.; Tang, C. Earthquakes as a self-organised critical phenomenon. J. Geophys. Res. 1989, 95, 15635–15637. [Google Scholar] [CrossRef] [Green Version]
  26. Barton, C.A.; Zoback, M.D. Self-similar distribution and properties of macroscopic fractures at depth in crystalline rock in the Cajon Pass scientific drill hole. J. Geophys. Res. 1992, 97, 5181–5200. [Google Scholar] [CrossRef]
  27. Pasternak, E.; Dyskin, A.V. Discrete self-similarity of multiscale materials and systems. Universality of scaling exponents. Int. J. Eng. Sci. 2020, 149, 103244. [Google Scholar] [CrossRef]
  28. Herrmann, H.J.; Roux, S. Statistical Models for the Fracture of Disordered Media; Elsevier, Inc.: North Holland, The Netherlands, 1990. [Google Scholar] [CrossRef]
  29. Carpinteri, A. Scaling laws and renormalization groups for strength and toughness of disordered materials. Int. J. Solids Struct. 1994, 31, 291–302. [Google Scholar] [CrossRef]
  30. Sadovskiy, M.A. Distribution of preferential sizes in solids. Trans. USSR Acad. Sci. Earth Sci. Ser. 1983, 269, 8–11. [Google Scholar]
  31. Babadagli, T.; Develi, K. Fractal characteristics of rocks fractured under tension. Theor. Appl. Fract. Mec. 2003, 39, 73–88. [Google Scholar] [CrossRef]
  32. Lv, W.F.; Yan, G.L.; Liu, Y.D.; Liu, X.F.; Du, D.X.; Wang, R. Effect of fractal fractures on permeability in three-dimensional digital rocks. Fractals 2019, 27, 1940015. [Google Scholar] [CrossRef]
  33. Li, D.X.; Wang, E.Y.; Kong, X.G.; Wang, X.R.; Zhang, C.; Jia, H.S.; Wang, H.; Qian, J.F. Fractal characteristics of acoustic emissions from coal under multi-stage true-triaxial compression. J. Geophys. Eng. 2018, 15, 2021–2032. [Google Scholar] [CrossRef] [Green Version]
  34. Yuan, R.F.; Li, Y.H. Fractal analysis on the spatial distribution of acoustic emission in the failure process of rock specimens. Int. J. Min. Met. Mater. 2009, 16, 19–24. [Google Scholar] [CrossRef]
  35. Zhang, Z.B.; Wang, E.Y.; Li, N. Fractal characteristics of acoustic emission events based on single-link cluster method during uniaxial loading of rock. Chaos. Soliton. Fract. 2017, 104, 298–306. [Google Scholar] [CrossRef]
  36. Feng, X.T.; Yu, Y.; Feng, G.L.; Xiao, Y.X.; Chen, B.R.; Jiang, Q. Fractal behaviour of the microseismic energy associated with immediate rockbursts in deep, hard rock tunnels. Tunn. Undergr. Space Tech. 2016, 51, 98–107. [Google Scholar] [CrossRef]
  37. Liu, X.Z.; Tang, C.A.; Li, L.C.; Lv, P.F.; Sun, R. Microseismic monitoring and stability analysis of the right bank slope at Dagangshan hydropower station after the initial impoundment. Int. J. Rock Mech. Min. Sci. 2018, 108, 128–141. [Google Scholar] [CrossRef]
  38. Zhang, H.; Chen, L.; Chen, S.; Sun, J.; Yang, J. The Spatiotemporal Distribution Law of Microseismic Events and Rockburst Characteristics of the Deeply Buried Tunnel Group. Energies 2018, 11, 3257. [Google Scholar] [CrossRef] [Green Version]
  39. Hu, L.; Feng, X.T.; Xiao, Y.X.; Feng, G.L.; Li, S.J.; Pan, P.Z.; Yao, Z.B. Characteristics of the microseismicity resulting from the construction of a deeply-buried shaft. Tunn. Undergr. Space Tech. 2019, 85, 114–127. [Google Scholar] [CrossRef]
  40. De Santis, F.; Contrucci, I.; Kinscher, J. Impact of Geological Heterogeneities on Induced-Seismicity in a Deep Sublevel Stoping Mine. Pure Appl. Geophys. 2019, 176, 697–717. [Google Scholar] [CrossRef]
  41. Liu, L.; Chen, Z.Q.; Wang, L.G. Rock burst laws in deep mines based on combined model of membership function and dominance-based rough set. J. Cent. South Univ. 2015, 22, 3591–3597. [Google Scholar] [CrossRef]
  42. Wang, C.L.; Hou, X.L.; Liu, Y.B. Three-Dimensional Crack Recognition by Unsupervised Machine Learning. Rock Mech. Rock Eng. 2021, 54, 893–903. [Google Scholar] [CrossRef]
  43. Li, X.L.; Chen, S.J.; Li, Z.H. Rockburst mechanism in coal rock with structural surface and the microseismic (MS) and electromagnetic radiation (EMR) response. Eng. Fail. Anal. 2021, 124, 105396. [Google Scholar] [CrossRef]
  44. Wang, C.L.; Zhou, B.K.; Li, C.F. Experimental investigation on the spatio-temporal-energy evolution pattern of limestone fracture using acoustic emission monitoring. J. Appl. Geophys. 2022, 206, 104787. [Google Scholar] [CrossRef]
  45. Dou, L.M.; Cai, W.; Cao, A.Y.; Guo, W.H. Comprehensive early warning of rock burst utilizing microseismic multi-parameter indices. Int. J. Rock Mech. Min. Sci. 2018, 28, 767–774. [Google Scholar] [CrossRef]
  46. Chen, S.J.; Xia, Z.G.; Feng, F. Numerical study on strength and failure characteristics of rock samples with different hole defects. B. Eng. Geol. Environ. 2020, 80, 1523–1540. [Google Scholar] [CrossRef]
  47. Husain, A.; Nanda, M.N.; Chowdary, M.S.; Sajid, M. Fractals: An Eclectic Survey, Part I. Fractal Fract. 2022, 6, 89. [Google Scholar] [CrossRef]
  48. Husain, A.; Nanda, M.N.; Chowdary, M.S.; Sajid, M. Fractals: An Eclectic Survey, Part II. Fractal Fract. 2022, 6, 379. [Google Scholar] [CrossRef]
  49. Husain, A.; Reddy, J.; Bisht, D.; Sajid, M. Fractal dimension of coastline of Australia. Sci. Rep. 2021, 11, 6304. [Google Scholar] [CrossRef]
Figure 1. Structure diagram of microseismic monitoring system. Green and gray represent drilling and measurement points.
Applsci 13 04613 g001
Figure 2. Calibration blast waveform and positioning results.
Applsci 13 04613 g002
Figure 3. Daily hourly distribution of microseismic events.
Applsci 13 04613 g003
Figure 4. Daily hourly fractal fit of microseismic events.
Applsci 13 04613 g004
Figure 5. Distribution of microseismic event accumulation and activity time.
Applsci 13 04613 g005
Figure 6. Temporal fractal fitting of microseismic events during rock burst.
Applsci 13 04613 g006
Figure 7. Spatial distribution of microseismic events in the I# mineral belt area: (a) top view; (b) east view. Different colored balls indicate different monitored dates; triangles indicate sensor locations; 370 m, 430 m, 490 m, 610 m, 670 m. indicate different mining levels.
Applsci 13 04613 g007
Figure 8. Focused analysis area model diagram: (a) top view; (b) north view. The shading in (a) indicates the analysis area, the different colors in (b) indicate different analysis areas.
Applsci 13 04613 g008
Figure 9. Deformation damage of quasi-ramp support in I-8# orebody.
Applsci 13 04613 g009
Table 1. Calibration of blasting information and positioning results.
No.Blasting LocationsBlasting TimeBlasting Actual CoordinatesSystem Positioning CoordinatesError Difference
XYZXYZΔXΔYΔZDistance
1#I-6#610m
Backwind Lane
April 1 10:25:04400,821.98145,408.17618.475400,813.945,415.5625.8−8.17.37.313.1
2#I-7#13 Layered entry intersectionMarch 20 14:33:27400,953.81745,693.627635.7400,946.545,689.5636.2−7.3−4.10.58.4
3#II-1#670 Mid-Section 4 layered openingApril 23 13:17:43400,934.545,777.8658.7400,937.145,772.3659.62.6−5.50.96.1
4#II-1#670 Mid-Section 4 layered openingApril 22 14:45:04400,933.745,776.4658.7400,935.245,777.1659.51.50.70.81.8
Average positioning error/m7.4
Disclaimer/Publisher’s Note: The statements, opinions and data contained in all publications are solely those of the individual author(s) and contributor(s) and not of MDPI and/or the editor(s). MDPI and/or the editor(s) disclaim responsibility for any injury to people or property resulting from any ideas, methods, instructions or products referred to in the content.

