1. Introduction
More than two years after initial reports of the outbreak of a new coronavirus SARS-CoV-2 causing COVID-19 in Wuhan, China, the spread of the virus induced a global pandemic to an extent only experienced during the outbreak of the Spanish flu. Regarding the spread of the virus and the development of the pandemic, a clear distinction between the first wave in early 2020 and subsequent waves can be made. Whereas the infection hit an immunologically naïve population during the first wave, pre-existing immunity, particularly after a vaccine became available in late 2020, helped mitigate COVID-19 disease severity in subsequent waves. Although later waves displayed a higher maximum amount of daily new infections, this did not directly translate into a higher disease burden or higher number of COVID-19-associated deaths.
Thus, even though the number of (daily) new infections can be easily communicated, it has drawbacks. First, new infections are difficult to correctly determine, as their detection is heavily influenced by the testing frequency and capacity and weekend and holiday effects, and likely still only a fraction of the actual number of infections is detected [
1,
2]. Second, it may be misleading to assess the severity of the pandemic based on new infections, as they account for neither how many persons in a given population are at risk to develop a severe disease nor the rate of pre-existing immunity due to vaccination or prior infection or changes in disease severity of COVID-19 caused by virus variants. Finally, even more sophisticated metrics determined from the number of new infections, such as the R-value, have their own set of problems such as time lag, non-standardised estimation procedures, and inability to provide meaningful information for local outbreaks [
3]. For these reasons alone, it is essential to take into consideration additional disease-specific parameters when analysing the pandemic situation (see, e.g., [
4]). Moreover, even if the aforementioned problems and inconsistencies were resolved, the new infections, as well as any metric computed therefrom (including the methods proposed in [
5,
6,
7,
8]), can only measure the spread of COVID-19, but not directly its impact, i.e., the constraints posed on the healthcare system. This aspect has become increasingly important for lawmakers when they tried to determine which measures were appropriate in response to another wave of COVID-19 infections in early 2022 under vastly different circumstances from previous waves due to the spread of the Omicron variant of SARS-CoV-2 [
9] as well as the progress of the vaccination and booster vaccination campaigns. A more accurate metric for these constraints would be either the number of hospitalised patients due to a COVID-19 infection or the reported deaths linked to a COVID-19 infection, even though the accuracy of the latter is still heavily discussed [
10]. However, using only these metrics as basis for political decision-making not only ignores the current dynamics of the spread of the pandemic but may lead to delayed decisions, as data, particularly on deaths, are naturally lagging infection data by days or even weeks.
Several metrics based on both infection data and hospitalisation data were proposed in the academic literature. Ref. [
11] defined and computed a pandemic vulnerability index (“PVI”) which takes into account new infections, hospital bed and ventilation capacity, as well as environmental and demographic information. However, the PVI is designed to compare the pandemic situation between individual U.S. counties at the same point in time and cannot be used to assess the overall severity of the pandemic situation. Ref. [
12] developed a similar index based on more sophisticated statistical and machine-learning methods. Ref. [
13] proposed the hospital occupancy mortality rate, ratio of total deaths to hospital occupancy, and ratio of hospital occupancy to cases as three individual metrics to assess the severity of the pandemic situation, but the authors did not include the disease spread in their metric. Likewise, the metrics proposed by [
14], the health sufficiency indicator and the hospital potential occupancy ratio, can be used exclusively to assess the capacity of hospitals to deal with a given pandemic situation. Hence, the academic literature has not yet presented a severity index which can be continuously monitored and compared over time while simultaneously capturing the pandemic’s spread and impact on the healthcare system.
In this study, we develop an alternative metric to fill this gap, namely the “COVID-IndeX” (COVIX), which can be used to assess the severity of the pandemic situation in comparison to a specified reference day that allowed us to take into account both infection and hospitalisation data. Unlike other indices presented in the academic literature, we illustrate that the COVIX is suitable to consistently assess the severity of the pandemic situation despite changing determinants of the pandemic.
The remainder of this paper is structured as follows: In
Section 2 we describe the methodology employed in our research. Specifically, we first introduce a hospitals beds model that relates daily new infections, daily hospitalisation rates, and daily hospital bed occupancy in the context of the COVID-19 pandemic (
Section 2.1), before motivating and defining the severity index COVIX, which is based on this hospital beds model (
Section 2.2). Our methodology is applied on data from the German federal state of Bavaria in
Section 3, and the results of this application are discussed in
Section 4. We conclude our research and provide a brief outlook on potential future research in
Section 5.
2. Methodology
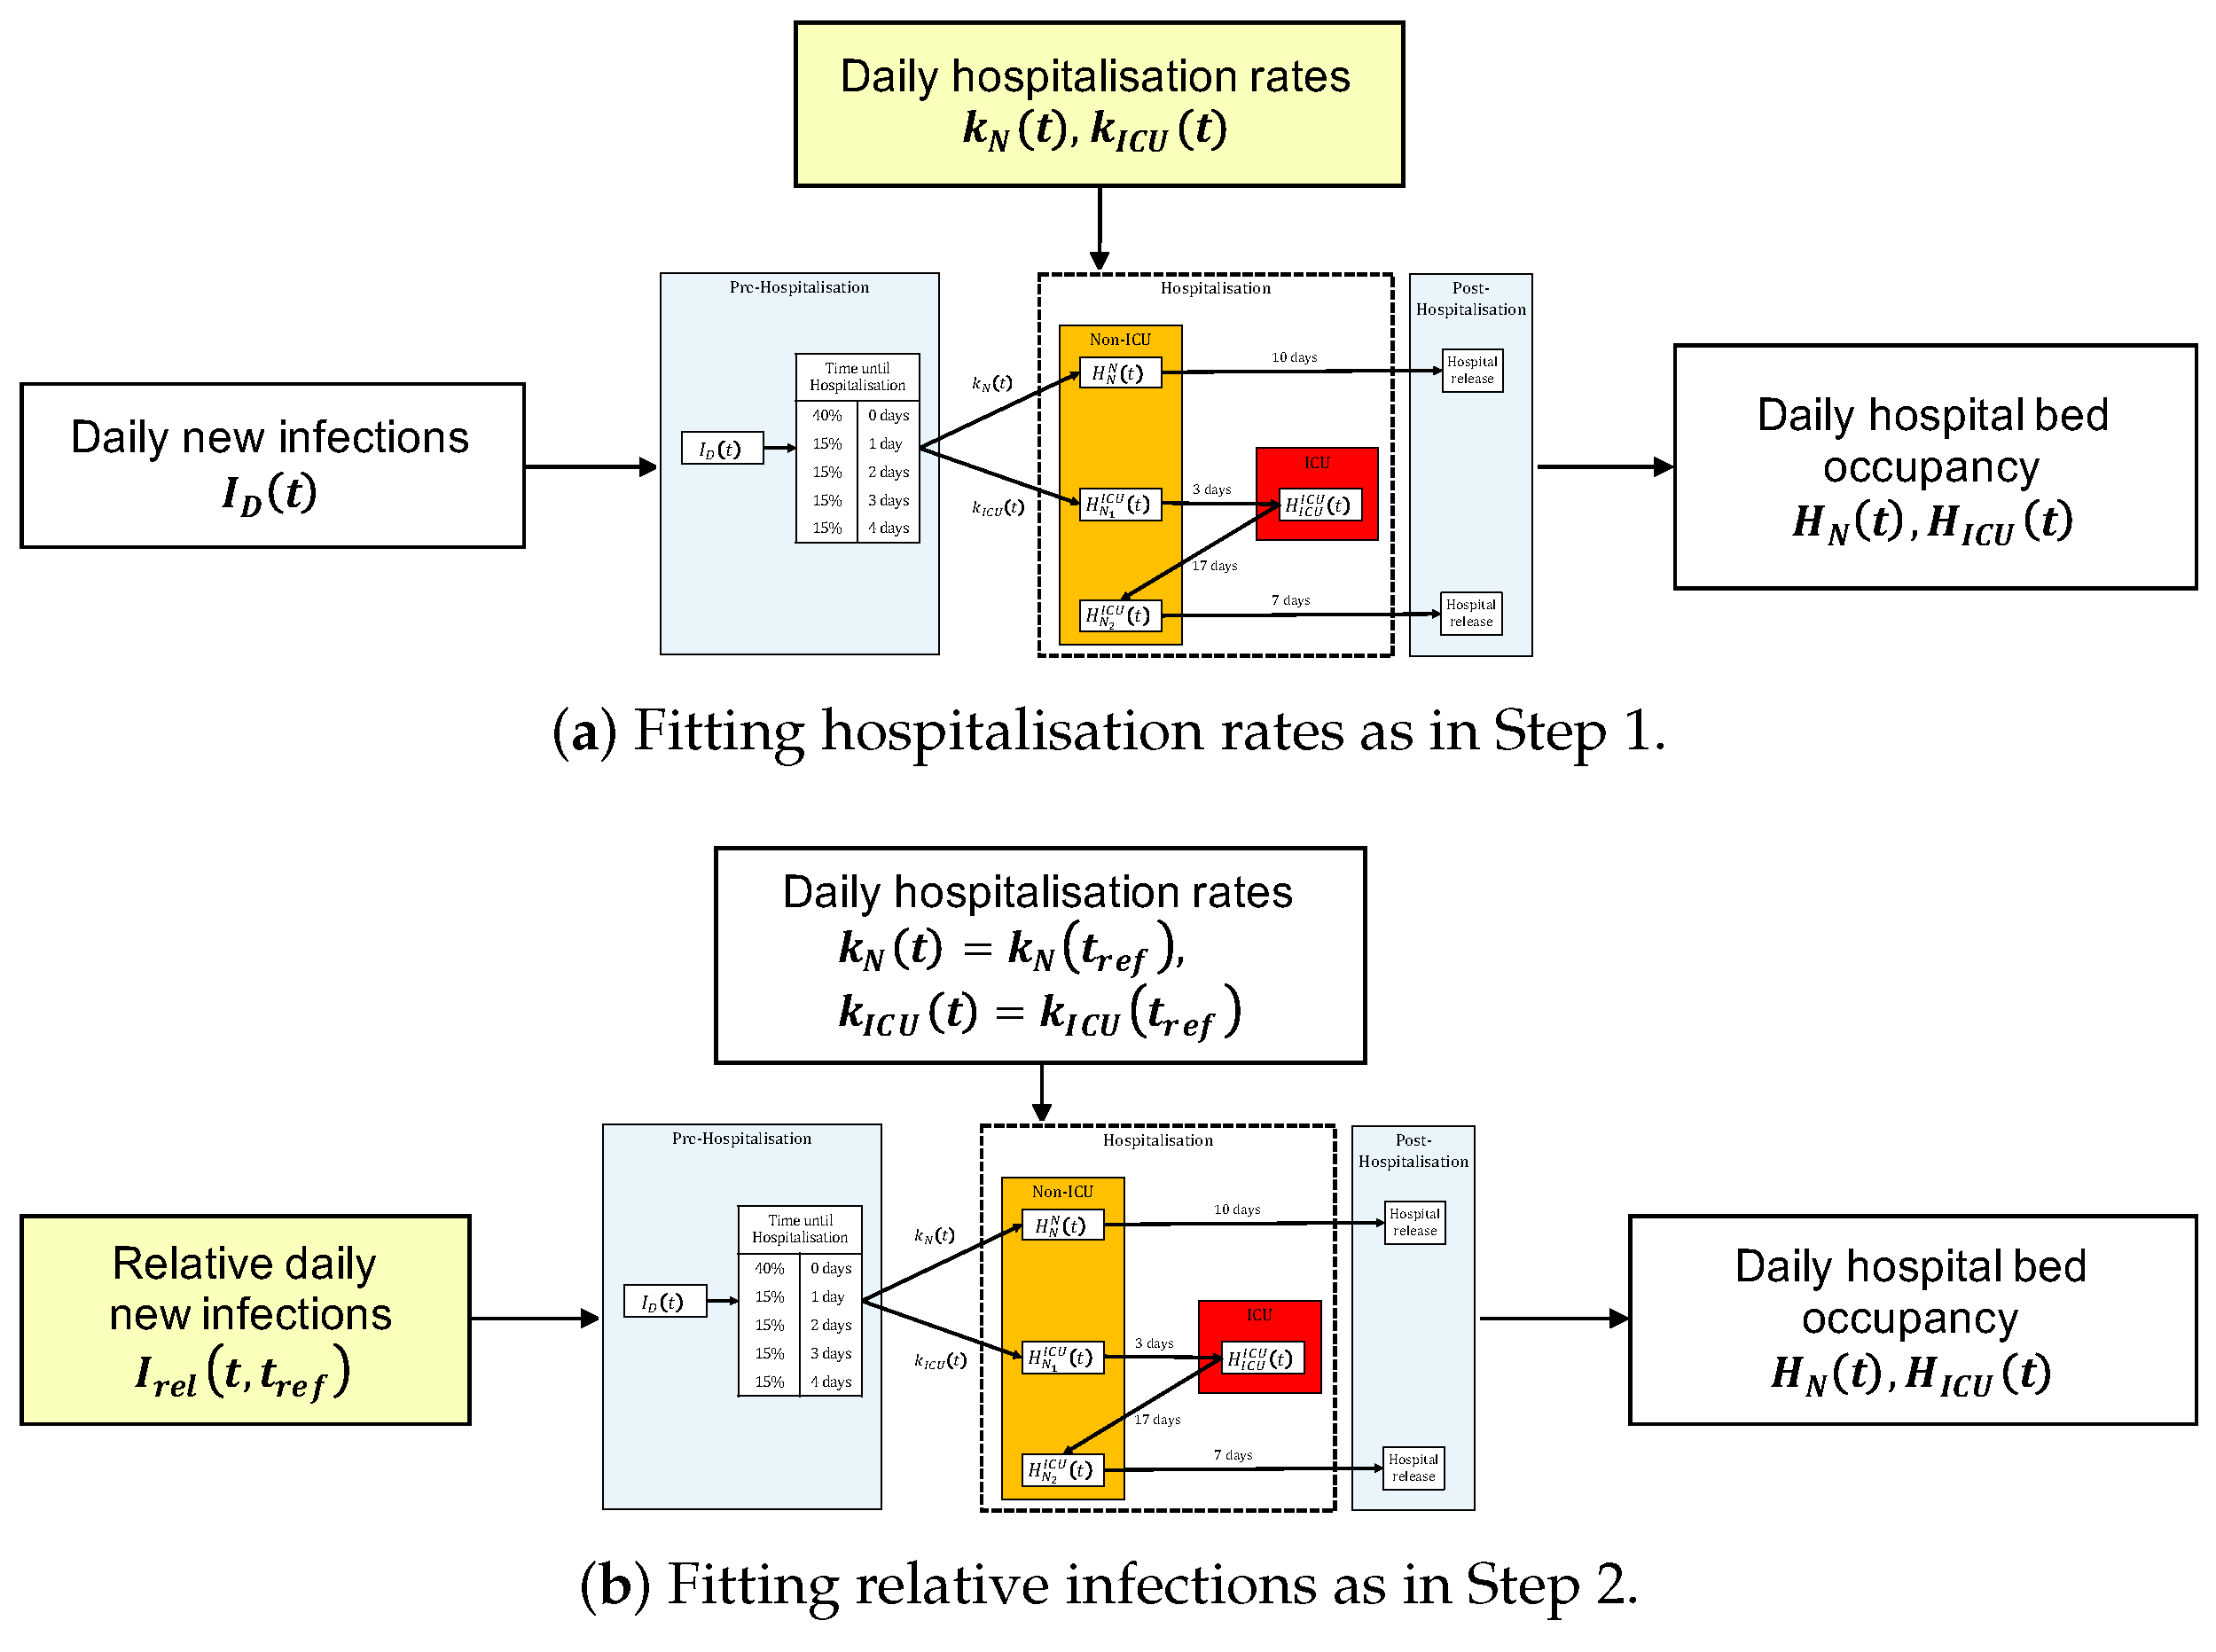
In this section, we explain the methodology used in computing COVIX. At the core of the construction of COVIX is the hospital beds model, which relates to three quantities: daily new infections, hospitalisation rates, and hospital bed occupancy.
2.1. Hospital Beds Model
Our hospital beds model groups every individual infected with COVID-19 into one of three groups, depending on the course of their disease:
- (i)
Asymptomatic or mild disease course of COVID-19 without hospitalisation;
- (ii)
Moderately severe disease course with hospitalisation in a non-intensive care unit (non-ICU);
- (iii)
Severe disease course with the necessity for treatment in an intensive care unit with or without mechanical ventilation (ICU).
At each distinct time point
t, a proportion
of the (daily) new infected individuals
experiences a moderately severe course of the disease (i.e., course (ii)). Similarly, a proportion
of the newly infected individuals
experiences a severe course of the disease (i.e., course (iii)). The remaining proportion
of
experiences an asymptomatic or mild course of the disease and does not enter the hospital system. For both courses (ii) and (iii),
of the patients are hospitalised immediately upon testing positive for COVID-19 and
are hospitalised with a delay of
or 4 days, respectively. This mechanism allows for slight mitigation of the regular drop that is observed in the detected number of infections over the weekend. After entering the hospital, a hospitalised patient with course (ii) of the disease stays in the non-ICU (state
) for 10 days until being discharged. Every patient with course (iii) of the disease initially stays in non-ICU (state
) for 3 days, then in ICU (state
) for 17 days, and finally in non-ICU (state
) for 7 days until being discharged. In our study, the time delay until hospitalisation as well as the duration of stay in non-ICU and ICU were determined based on the combination of data provided by the Robert Koch-Institut (RKI) [
15] and empirical observations by hospital staff during early stages of the COVID-19 pandemic. Due to limited data availability, we made the simplifying assumption that these quantities remain constant throughout the pandemic. This has the upside that changes in the number of hospitalized patients can be directly linked to changes in either the number of new infections or the hospitalisation rates. Further, as we do not have data on the average duration of a hospital stay until a patient’s death, we did not differentiate between the length of hospitalisation in case of death or recovery. Instead, we assumed that the average duration of stay accounts for both options alike and specifically did not differentiate between these two types of hospital discharges.
At any time
t, the total number of patients in non-ICU (
) and ICU (
) can be obtained by summing over the corresponding states (see
Figure 1 for a schematic illustration of the model).
2.2. Construction of the COVIX Index
For a given observation period, the construction of COVIX can be divided into three steps: the estimation of the hospitalisation rates
and
at a reference date
the adjustment of the historically detected new infections according to their relevance for hospitalisations in comparison to a reference date
and normalisation to scale the COVIX to a standardised value of
at
. To improve the clarity of presentation, we only describe the objective of the fitting procedures in Step 1 and Step 2. A mathematical description of the fitting procedures as well as its implementation in Python can be found in the
supplementary material to this work.
Step 1: Using the hospital beds model from
Section 2.1 and data on new infections and hospitalisations, we obtain a least-squares estimate for the hospitalisation rates. By performing this estimation on a moving-window basis, we ensure that varying determinants, such as changes in testing frequency, age structure of the infected individuals, vaccination rate, as well as the circulating viral variant, are reflected in the estimate of the hospitalisation rates (see
Figure 2a).
Step 2: We keep the hospitalisation rates constant and at the level estimated in Step 1 on the reference date
throughout the whole observation period, i.e., we set
and
for all time points
t in the observation period. Given this parameter choice and the observed hospital bed occupancy, we estimate the new infections that are implied by our model. Thus, the resulting estimates for the new infections are obtained relative to the hospitalisation rates that were observed on the reference date
and the estimates are accordingly called “relative” new infections
(see
Figure 2b). In particular, we can view the relative new infections
as an adjustment of the new infections
, which accounts for changes in the hospitalisation rates at time
t in comparison to
Step 3: The COVIX at time point
t with respect to
is finally defined by normalising the relative new infections as the following. (Note that the hospital beds model is not a perfect representation of reality. Therefore, the calibration of the relative infections may yield
That is why we normalise by
instead of
to ensure a consistent interpretation of COVIX.)
Figure 2.
A conceptual comparison of the two quantities fitted in the construction of COVIX. In both (a,b), the yellow-coloured quantity is fitted, whereas the white-colored quantities are given.
Figure 2.
A conceptual comparison of the two quantities fitted in the construction of COVIX. In both (a,b), the yellow-coloured quantity is fitted, whereas the white-colored quantities are given.
As opposed to Step 1, where we take the new infections and hospitalisation data as given and estimate the hospitalisation rates implied by the hospital beds model, in Step 2, we take the hospitalisation rates and hospitalisation data as given and estimate (relative) new infections implied by the hospital beds model. This creates a new time series of daily relative infections over the whole observation period. During the calibration of the relative infections, we keep the hospitalisation rates constant at and throughout the whole observation period. Thus, the relative new infections are adjusted to the same relevance for the hospital system at time t as the new infections at the reference date As this adjustment is done for every time point in the observation period, we can now take any two time points and assess whether the pandemic situation at is more severe than at (i.e., if ) or less severe (i.e., if ). It is important to emphasize that the nominal value of the “relative” (daily) new infections is only meaningful in comparison to , as by construction changes with the choice of different reference dates Hence, the normalisation in Step 3 is required for improved interpretability.
3. Results
In this section, we illustrate the methodology presented in
Section 2 on infections and hospitalisation data from the German federal state of Bavaria.
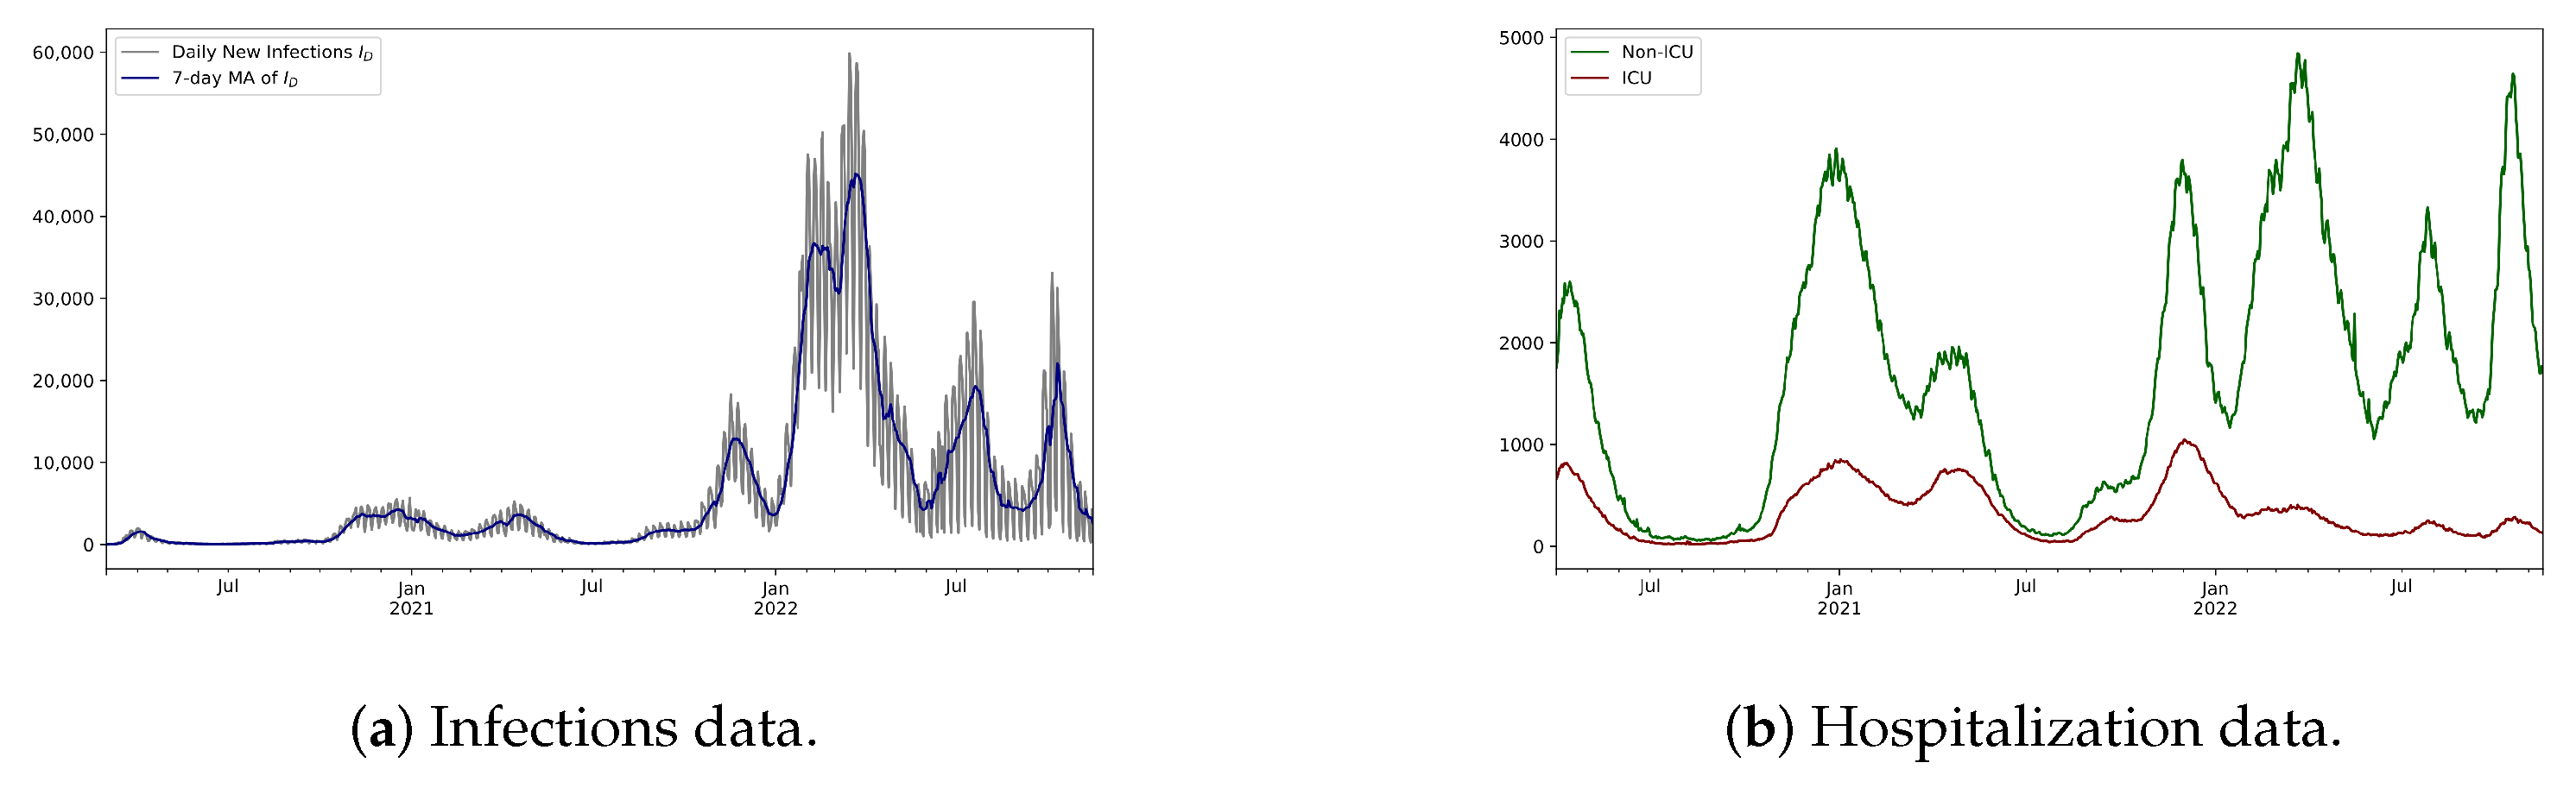
We use the infections data from the publicly available database of the German Robert Koch-Institut (RKI) [
16] (see
Figure 3a). We used daily new infections data from 1 March 2020 to 15 November 2022. The hospitalisation data were aggregated from the “Sonderlage” module of the IVENA eHealth system (IVENA) for Mittelfranken [
17,
18,
19] and Munich [
20,
21,
22]. For our analysis, we used data on daily hospital bed occupancy from 1 April 2020 to 15 November 2022 (see
Figure 3b).
Matching the underlying data, we choose an observation period from 1 April 2022 to 15 November 2022 and subsequently go through the three steps in the construction of COVIX.
Step 1: Estimation of Hospitalisation Rates and
Step 2: Estimation of Relative Infections
Given the estimates for the hospitalisation rates in
Figure 4, we chose two reference dates,
= 21 December 2020, from the week when COVID-19-associated deaths reached their peak in Bavaria and Germany [
23], as well as
= 31 January 2022, as a more recent reference date when the prevalence of the Omicron sub-types first reached
of the evaluated samples in Germany [
24], and compute the corresponding relative infections
.
For = 21 December 2020, the relative new infections are mostly close to or lower than the new infections , except for a short period in early 2020. Noticeably, from October 2021 onward, we observe that is significantly lower than This implies that new infections from October 2021 onward overstate their additional burden to the hospital system in comparison to . In contrast, for = 31 January 2022, the relative new infections are significantly larger than the new infections over the whole course of the pandemic, except for time points close to and after . This implies that the new infections over the course of the pandemic understate their additional burden on the healthcare system in comparison to
The obvious main difference between the relative new infections
computed with respect to
= 21 December 2020 and
= 31 January 2022 is the order of magnitude of
This can be explained by the difference in the hospitalisation rates at the two different reference dates: From 21 December 2020 to 31 January 2022, the estimate for
decreased from
to
i.e., by a factor of
, while the estimate for
decreased from
to
i.e., by a factor of
. Under the assumption of constant hospitalisation rates as on the reference date, the relative infections
are estimated such that the hospital beds model best explains the observed hospital bed occupancy. Hence, variations in the actual hospitalisation rates on different reference dates lead to similar variations in the computed relative infections
as observed in
Figure 5.
For both cases, = 21 December 2020 and = 31 January 2022, six major peaks of the relative new infections can be identified: April 2020, December 2020, April 2021, December 2021, March 2022, and October 2022. For both reference dates, the peak in December 2021 is the largest, closely followed by March 2022 and December 2020, whereas April 2020, July 2022, and April 2021 follow afterward. Thus, comparing the values of over the pandemic leads to a consistent assessment of the severity of the pandemic situation.
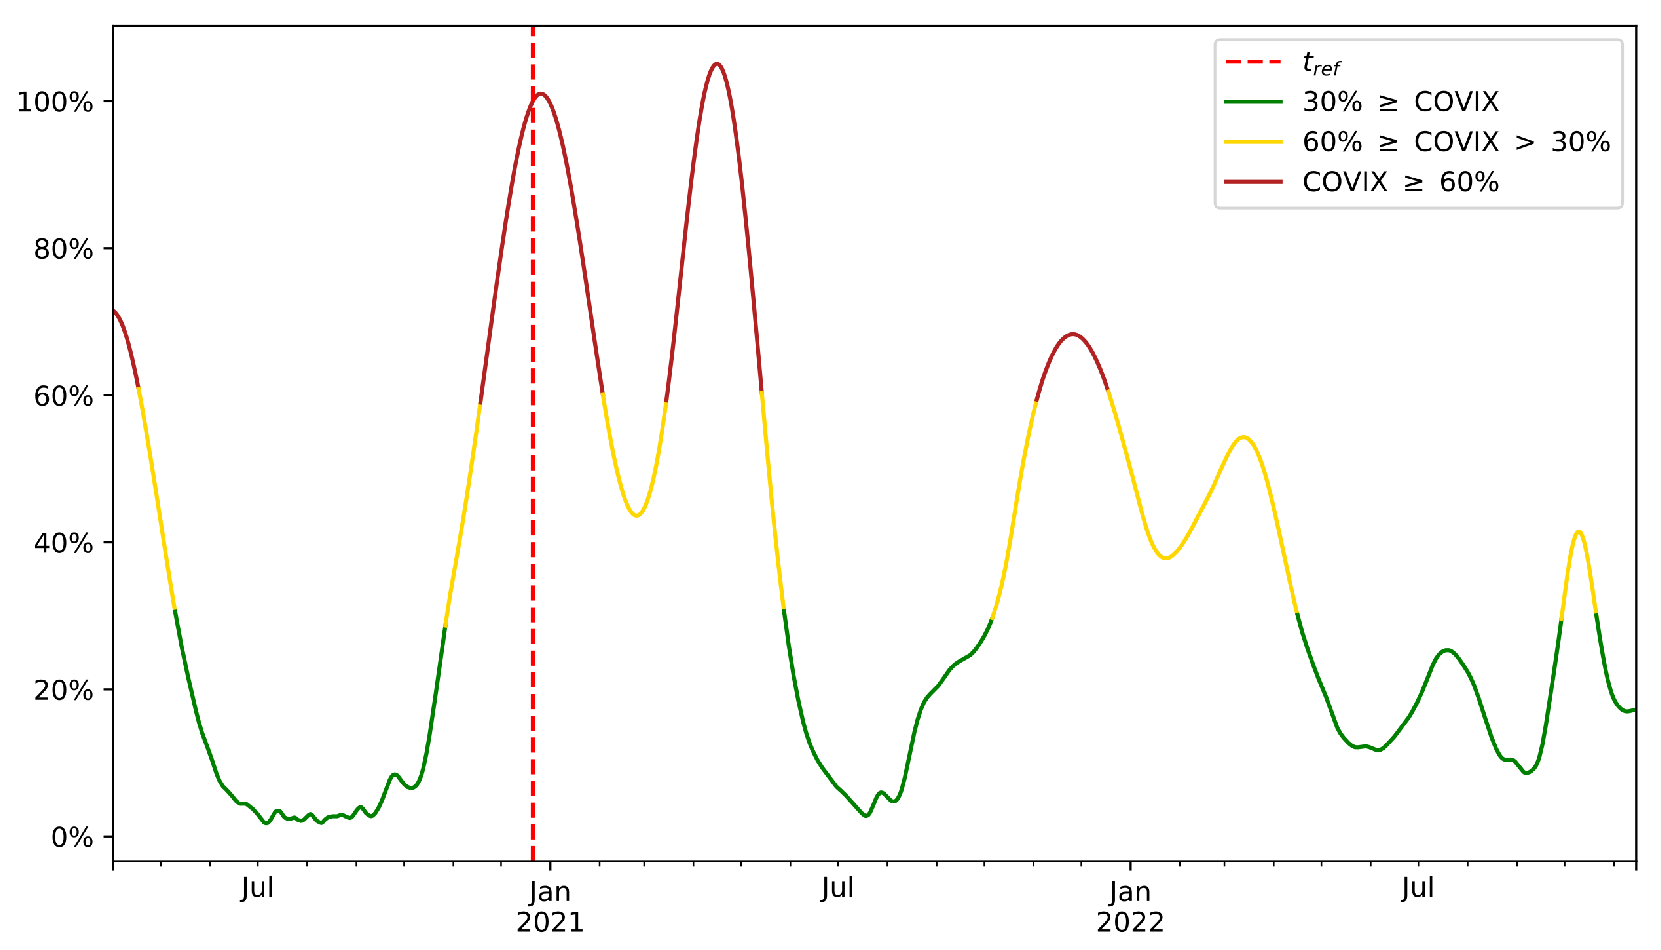
Step 3: Normalisation with respect to
For ease of presentation, we continue our analysis with = 21 December 2020 only, when deaths due to COVID-19 had reached their peak level in Bavaria and Germany. At this time point, the original SARS-CoV-2 EU-1 strain was still dominant in Germany and the vaccination campaign had not yet started.
The COVIX is a normalised version of the relative infections
and therefore the implications from
Figure 6 are the same as from
Figure 5a,b. However, the COVIX allows us to express these implications in percentage points, which makes the COVIX more accessible as a metric for assessing the severity of the pandemic situation. For example, according to the COVIX with reference date
= 21 December 2020, we can argue that the pandemic situation at
t = 15 November 2022 is approximately
as severe as it was at
.
4. Discussion
Figure 4 illustrates that both hospitalisation rates
and
changed significantly over the course of the pandemic. This makes it especially difficult to assess the severity of the pandemic situation based solely on the new infections
alone, as the same number of new infections at different time points lead to significantly different constraints imposed on the hospital system. In particular, the impact of changing determinants of the pandemic (e.g., age structure of infected individuals, testing frequency, pre-existing immunity, viral variant) is implicitly reflected in the changes of the estimated hospitalisation rates. Moreover, the COVIX displays the same qualitative behaviour as the relative new infections, as all other things being equal, the COVIX increases (decreases) when daily new infections, hospitalisation rates, or both increase (decrease). Further, from a historic perspective, high COVIX values correspond to high observed hospital bed occupancy and therefore correctly identify periods of high added burden to the healthcare system due to COVID-19 patients. Hence, when continuously monitored over time, COVIX serves as an effective tool in assessing the severity of the pandemic.
Although these are compelling strengths of COVIX, we would also like to discuss some weaknesses of our methodology. The intention of COVIX is to project changes in hospitalisation rates and new infections into a single severity index. On the one hand, this projection provides an unambiguous answer to when the pandemic situation improves or worsens—even when hospitalisation rates and new infections change in opposite directions. On the other hand, this dilutes granular information that could be extracted from tracking both of these metrics individually. Note, however, that analogous trade-offs need to be made by any such severity index with a similar objective. Furthermore, it is challenging to extrapolate the values of COVIX into the future. For a fixed reference date
COVIX is proportional to the (relative) new infections
and therefore its forecasts encounter similar challenges as forecasts of new infections
(see, e.g., [
25,
26]).
As suggested by the colour scheme in
Figure 6, we propose to use the COVIX as an early-warning mechanism, which follows a traffic light system. Specifically, we propose the following approach:
- (i)
In collaboration with medical practitioners, epidemiologists, and public officials, identify a historic reference date , which represents a threshold moment with respect to the dynamics and consequences of the pandemic that should not be overstepped (e.g., could correspond to a hospital overload).
- (ii)
In collaboration with medical practitioners, epidemiologists, and public officials, identify two additional reference dates and which define the following traffic lights at a given time t:
Red—:
Major preventive measures have to be taken to prevent overstepping the severity at .
Yellow—:
All authors have read and agreed to the published version of the manuscript. Minor preventive measures have to be taken to prevent overstepping the severity at .
Green—:
No preventive measures have to be taken to prevent overstepping the severity at .
- (iii)
For each traffic light, define a set of measures to be taken, depending on the traffic light displayed by the COVIX.
- (iv)
Compute and monitor the daily, act according to the methodologies defined in (iii), and update the reference dates and measures when necessary.
We did not determine the colouring in
Figure 6 using specific reference dates
and
. Instead, we used equivalent, fixed threshold values of
and
. These specific threshold values for the COVIX are arbitrary and carry little meaning on their own, as they have completely different implications for the COVIX computed with respect to different reference dates
. Hence, both
as well as
and
(or the corresponding threshold values) should be chosen according to a sound medical, epidemiological, and administrative rationale. In contrast to other traffic light systems, such as the “COVID-19 Protection Framework” [
27] implemented by the New Zealand government or the system implemented by the European Centre for Disease Prevention and Control [
28], the above approach would yield a fully transparent choice of preventive measures that are only guided by a single factor, rather than relying on multiple factors that may display conflicting signals. An alternative application of our methodology would be the assessment of the effectiveness of disease preventive measures as indicated by changes in the COVIX. Similar studies have been conducted in, e.g., [
29,
30,
31], but have largely focussed on the impact of measures on the pandemic’s spread and associated deaths, rather than the pandemic’s overall impact on the healthcare system. As COVIX additionally captures this impact, it is ideally suited to complement the already existing analyses in this regard. Moreover, as a severity index, COVIX can either signal an increase or decrease in the severity of the COVID-19 pandemic. Thus, it could also be used as a risk measure for companies whose cash flows depend on the current state of the pandemic. Finally, it should be noted that the proposed concepts and applications are not limited to the COVID-19 pandemic, but can also be applied to any other pandemic as long as the corresponding data are available.
5. Conclusions
In this paper, we introduced a model that relates three quantities: (daily) new infections, hospitalisation rates, and hospital bed occupancy. Based on this model, we have presented the concept of relative infections, which allows for an accurate comparison of the pandemic situation at different time points of the pandemic, by taking into account both infections data and hospitalisation data. Based on this relative infection activity, we defined the COVIX, an index that shows the severity of the pandemic situation compared to a suitable reference date. This reference date is variable and can be set according to the goal of the analysis or relative to which parameter or countermeasures one wants to use to analyse the current situation. Moreover, the COVIX can be tracked over time and potentially serve as an effective tool for managing countermeasures in the COVID-19 and any future pandemic. Considering the COVIX in retrospect, it correctly indicated the most critical periods in early April 2020 and the most critical periods starting in October 2020 and November 2021. It also identified the waning pandemic threat in May 2020 and 2021 and indicates that the severity of the pandemic will remain controlled with the appearance of the Omicron variant at the end of 2021 despite an infection incidence that has not been seen before.
To further test and challenge our methodology, future studies should compute and compare COVIX on data from different regions or with varying levels of granularity. In particular, the results of such a study could be used to evaluate the effectiveness of prevention measures taken by policy-makers. Moreover, it would be interesting to extend our methodology by incorporating more disease-specific information into the hospital beds model, such as seasonality effects, data on patient ages, or data on vaccinations. We leave these points open for future research.


