

Force Analysis of Circular Diaphragm Wall Based on Circular Cylindrical Shell Theory
Abstract
:1. Introduction
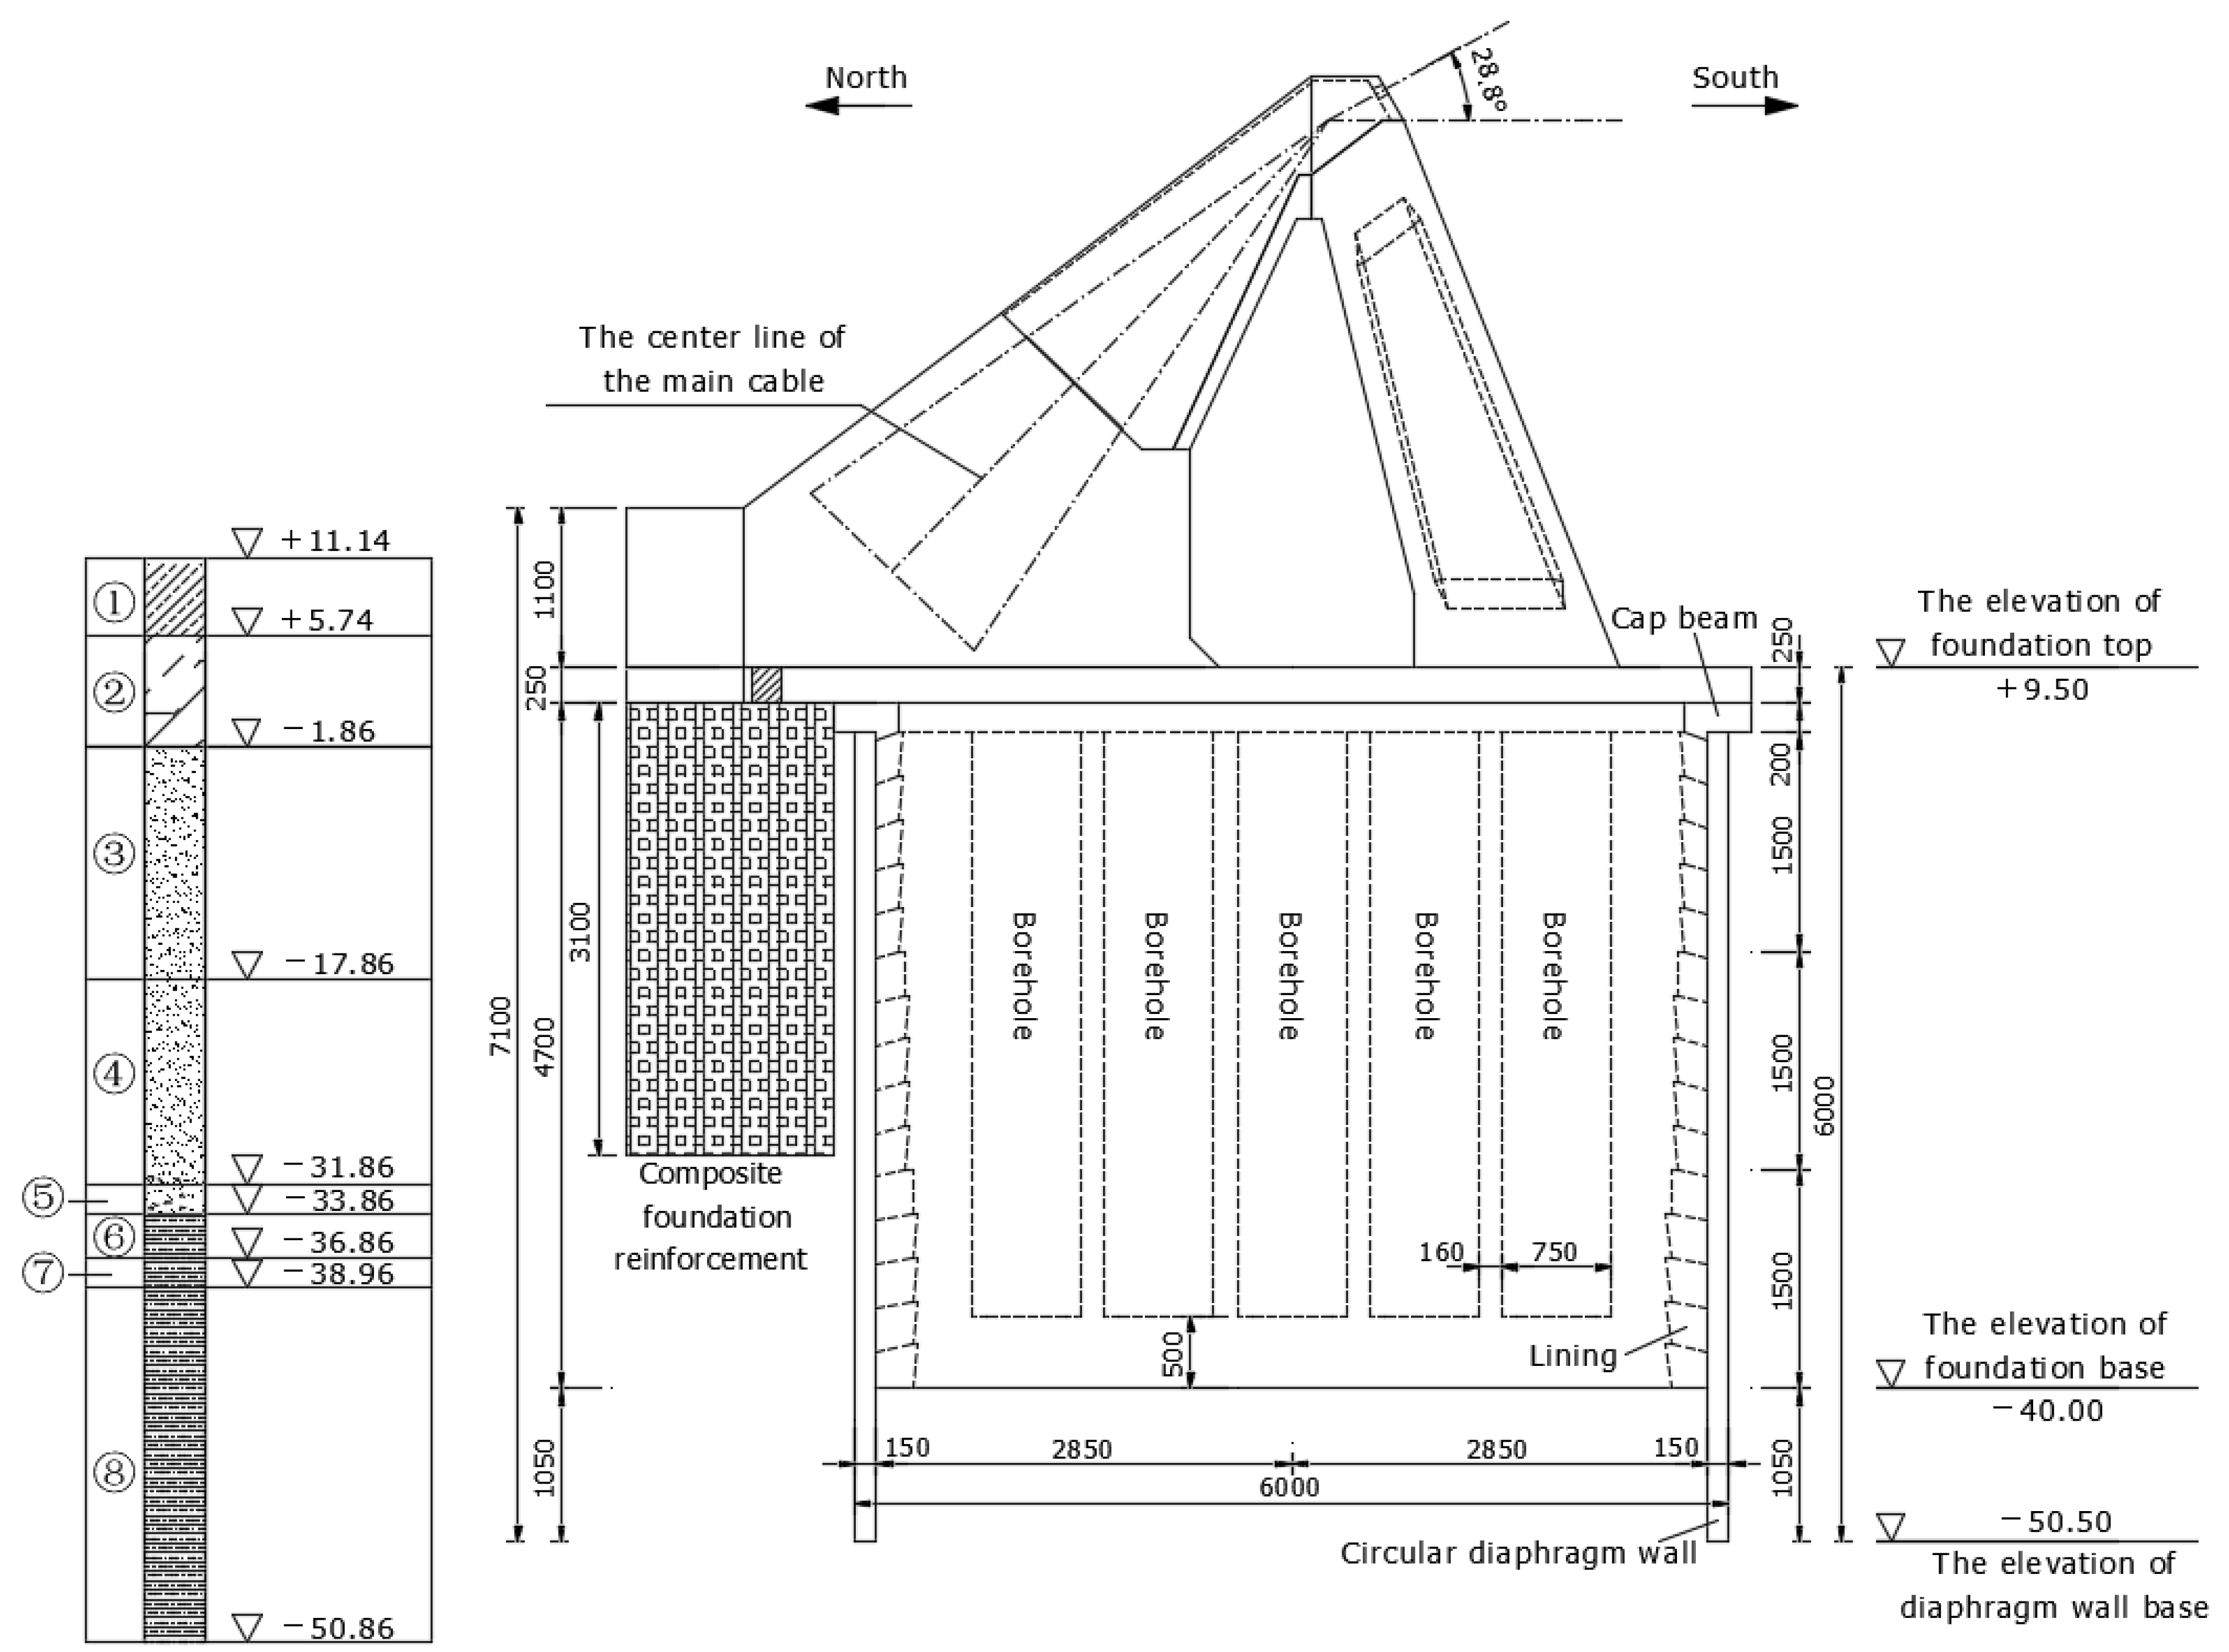
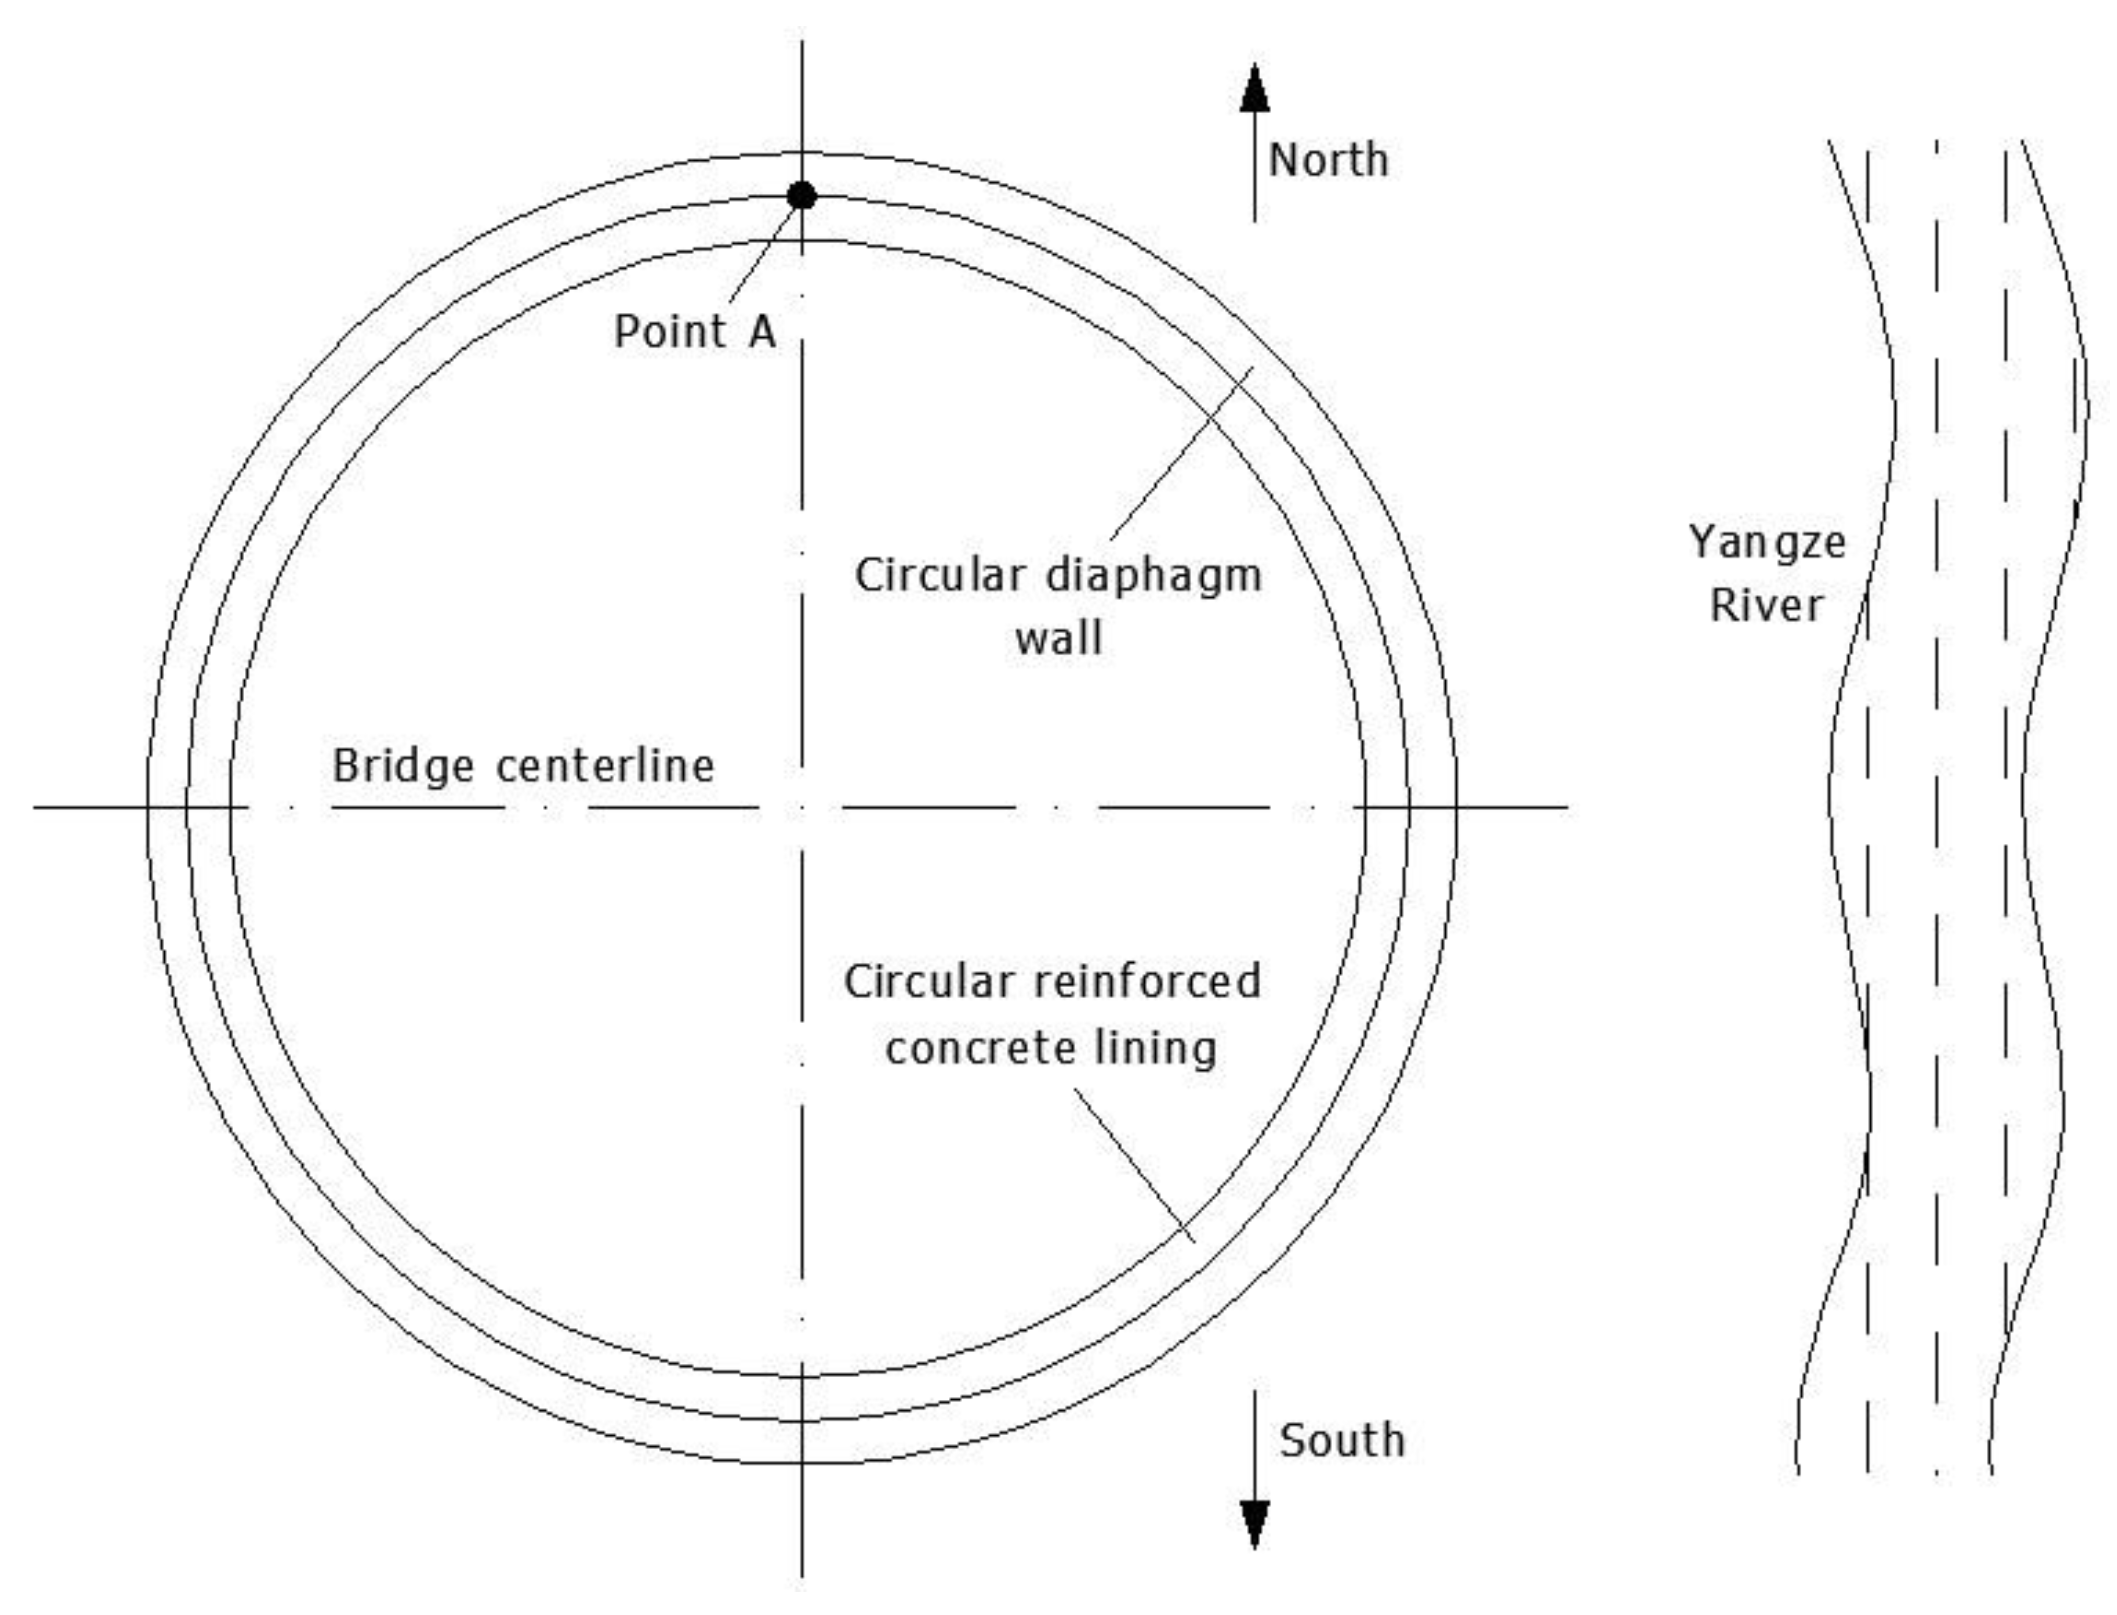
2. Project Profile
3. Force Analysis of Circular Diaphragm Wall
3.1. Horizontal Supporting Force of the Cap Beam
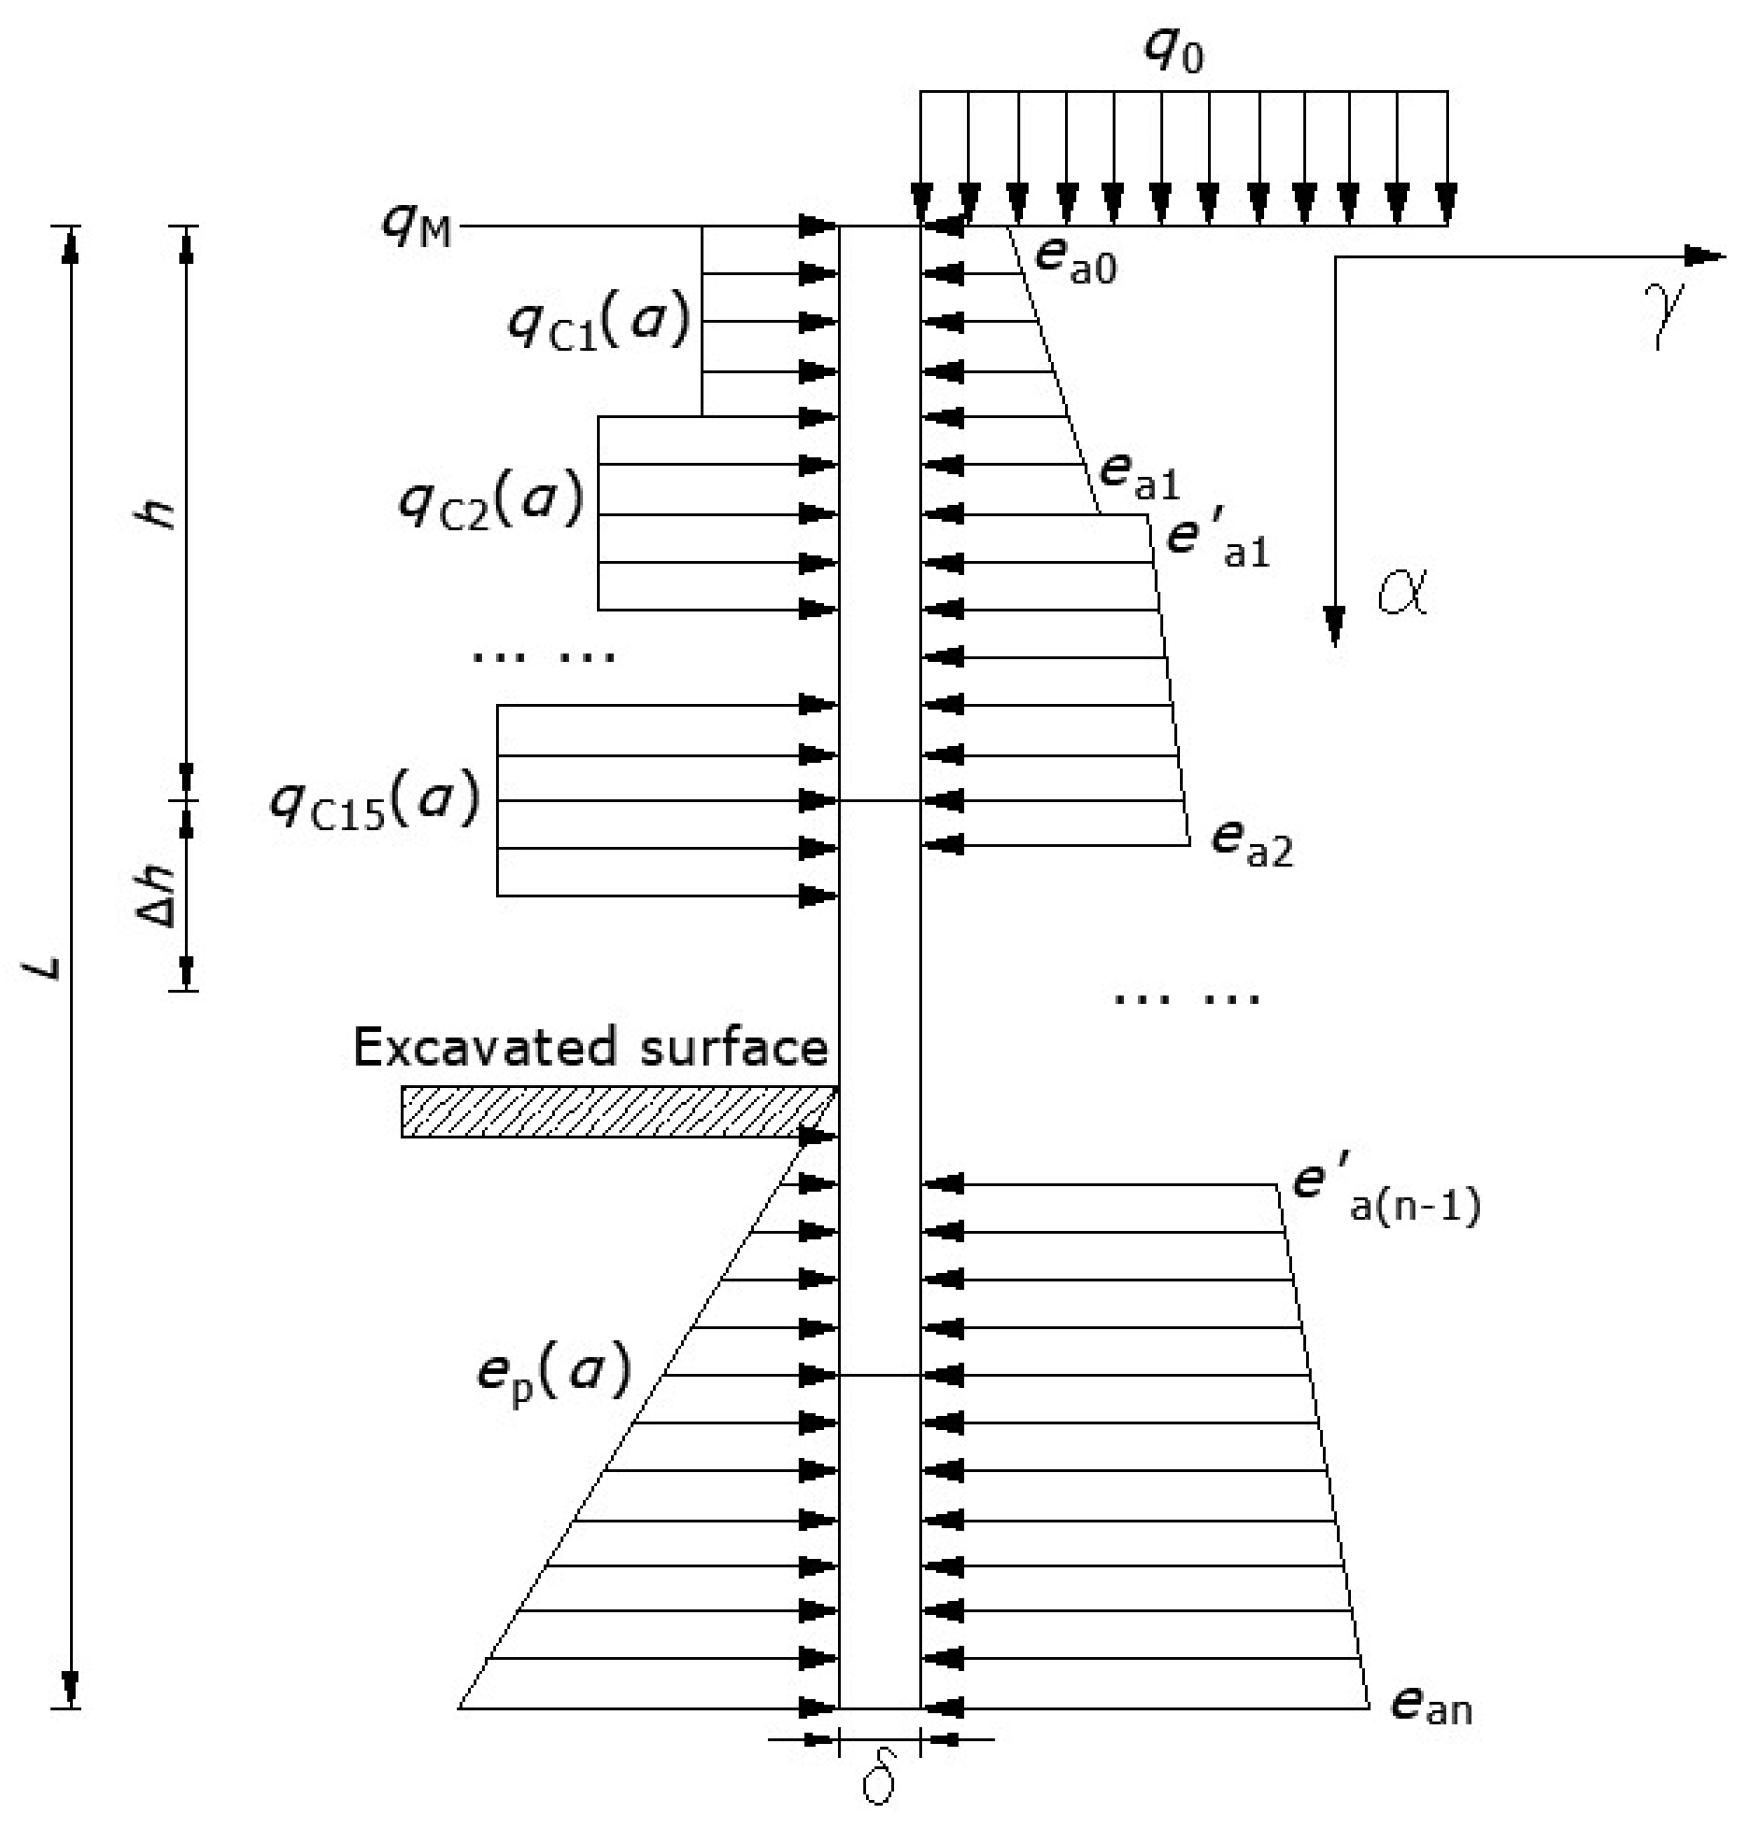
3.2. Horizontal Supporting Force of the Lining
3.3. Horizontal Subgrade Reaction on the Pit-Facing Surface
3.4. Horizontal Earth Pressure on the Pit-Back Surface
4. Circular Cylindrical Shell Theory Calculation Method (CCSTCM)
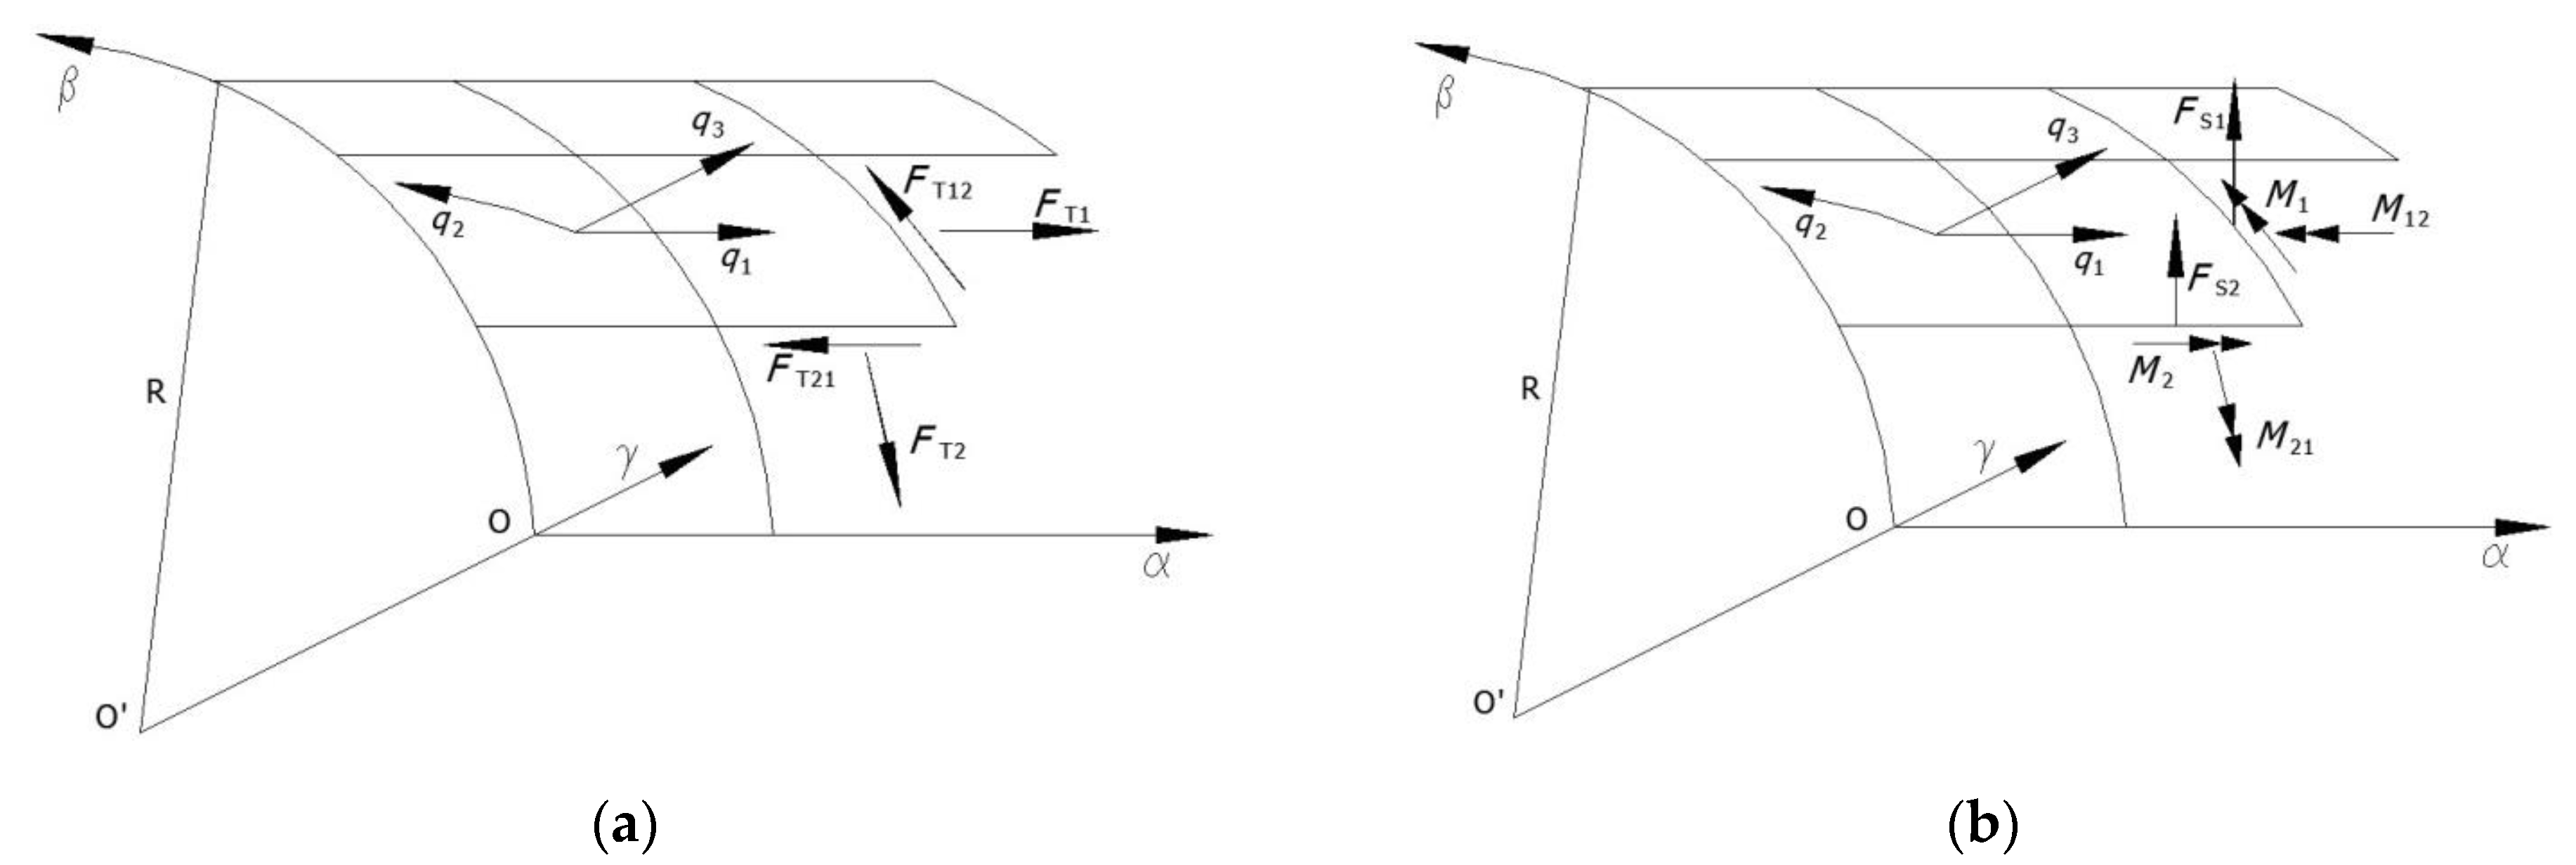
4.1. Internal Force Expressions of Cylindrical Shell
4.2. Internal Force Expressions of Circular Cylindrical Shell
4.3. Internal Force Expressions of Circular Cylindrical Shell under Normal Loads
4.4. Solving Steps
5. Finite Element Numerical Simulation Method (FENSM)
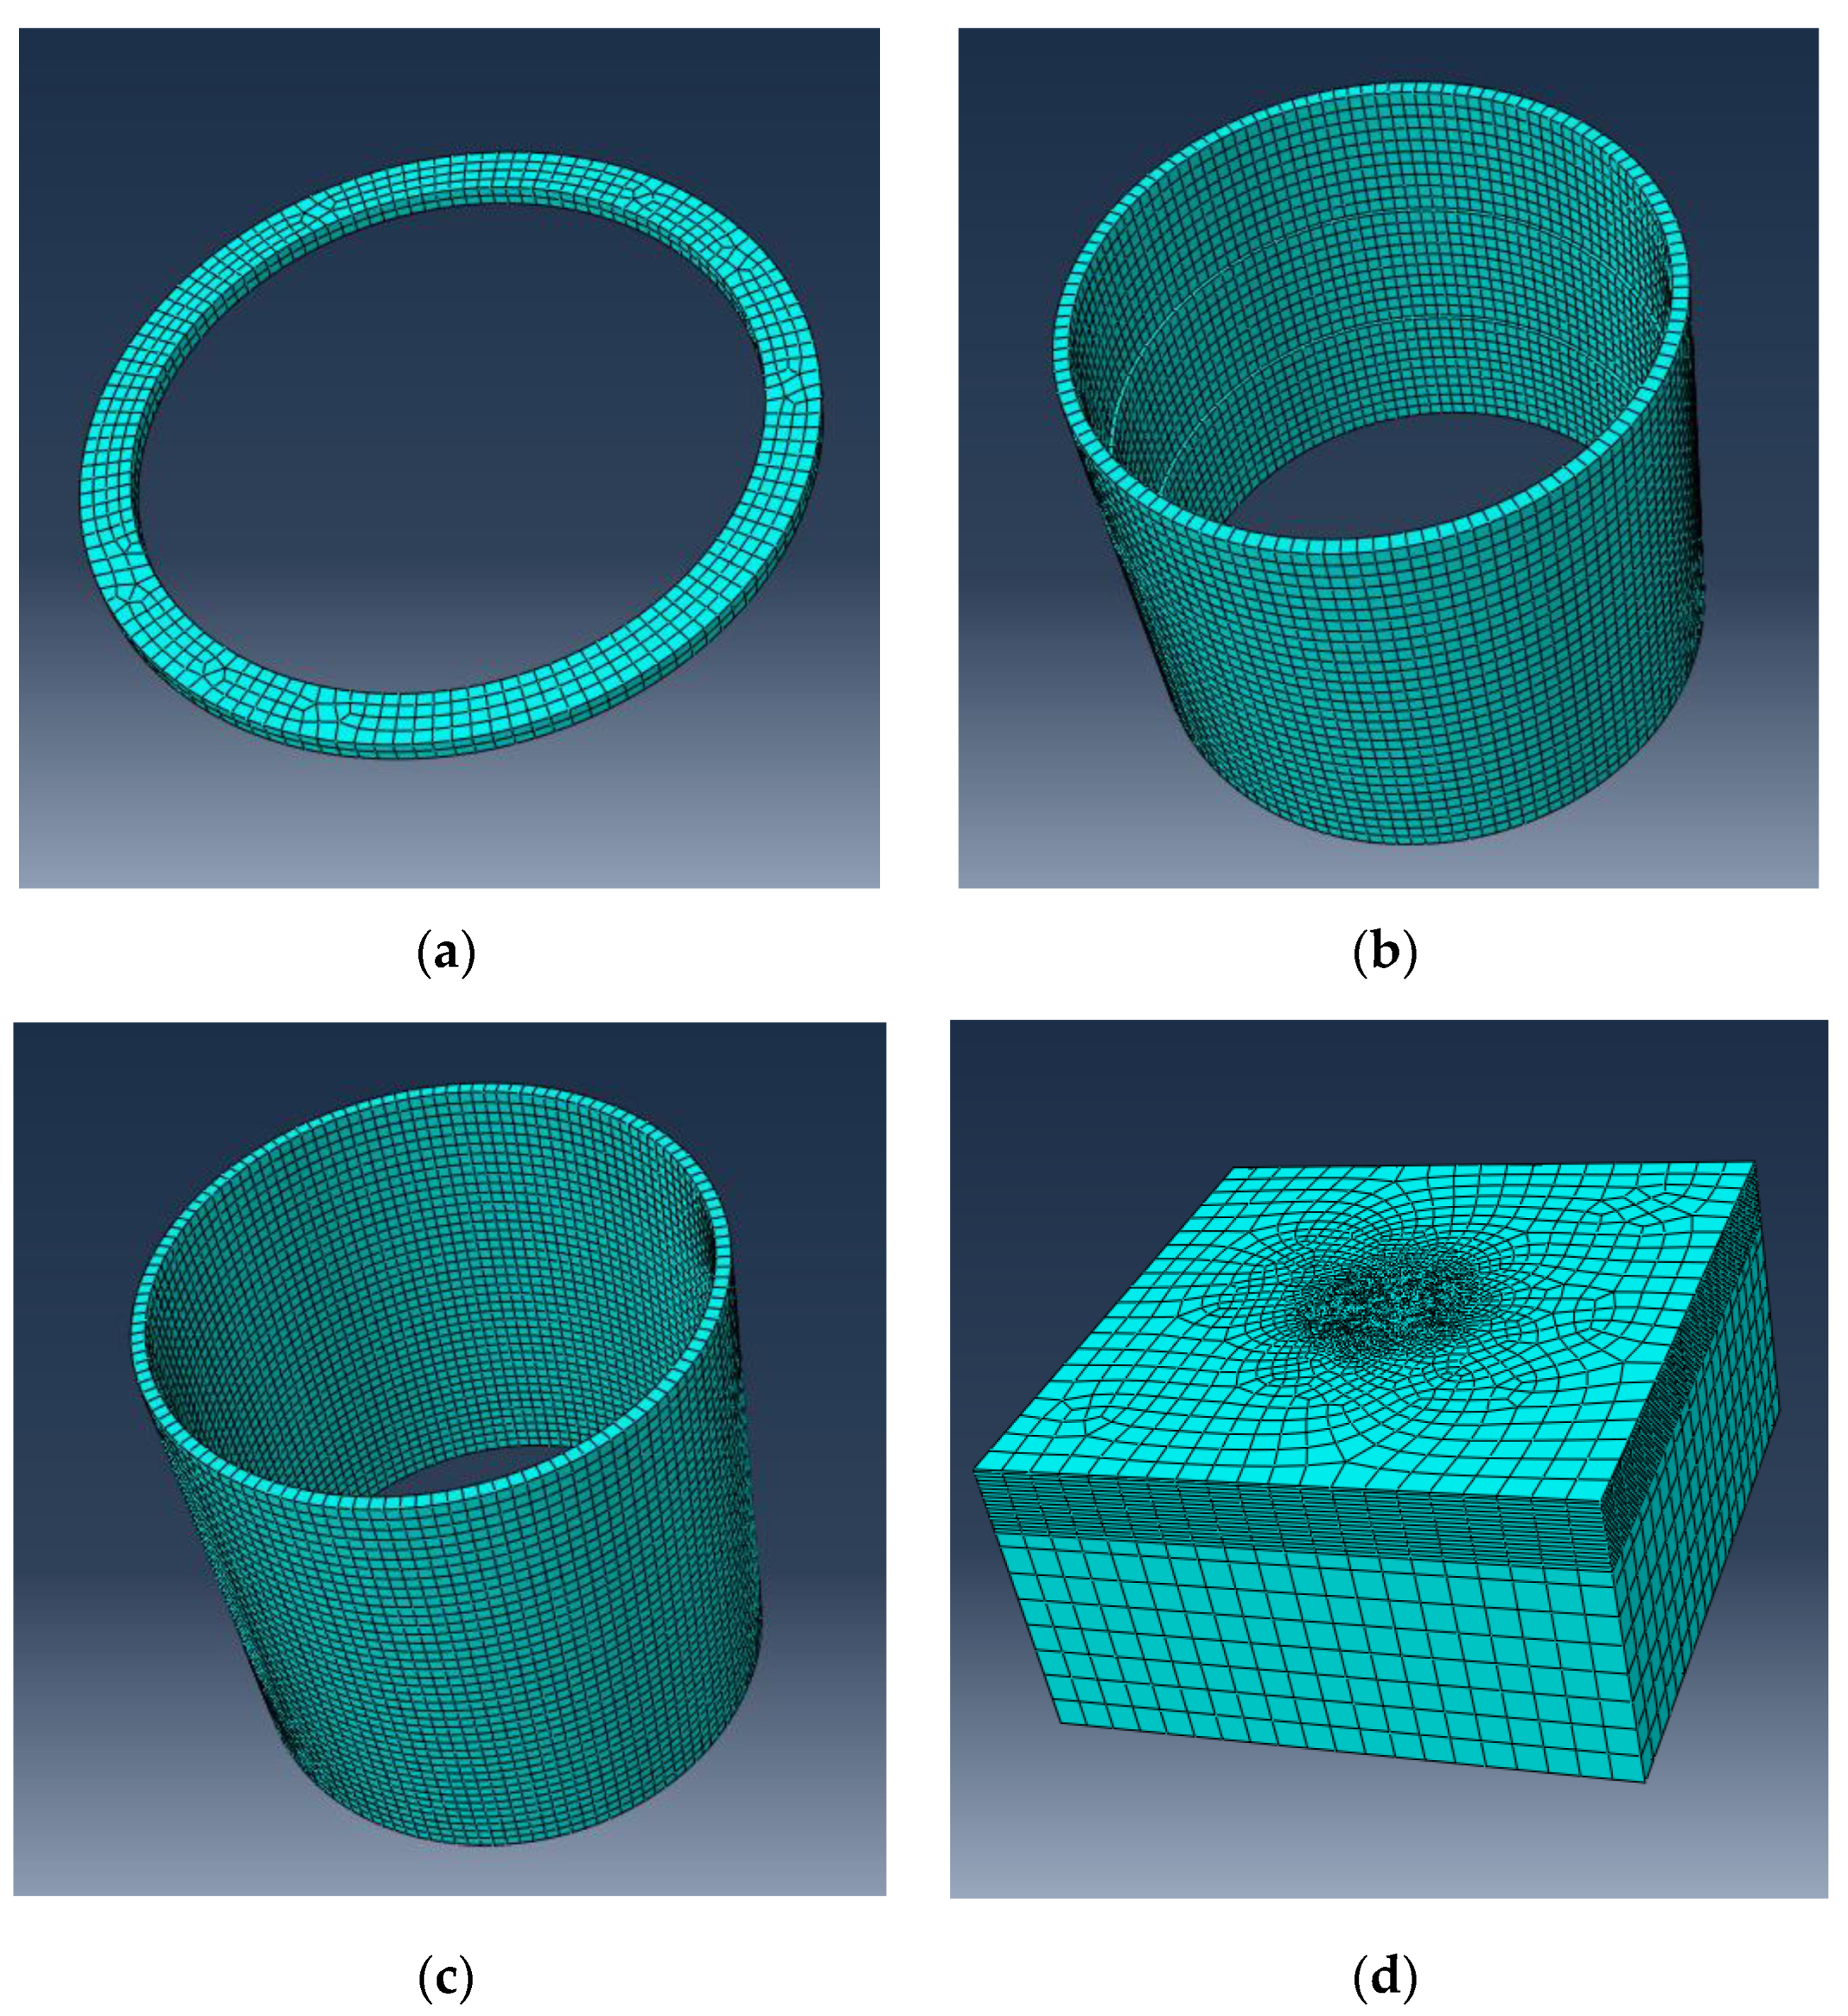
5.1. Establishment of Mesh Model
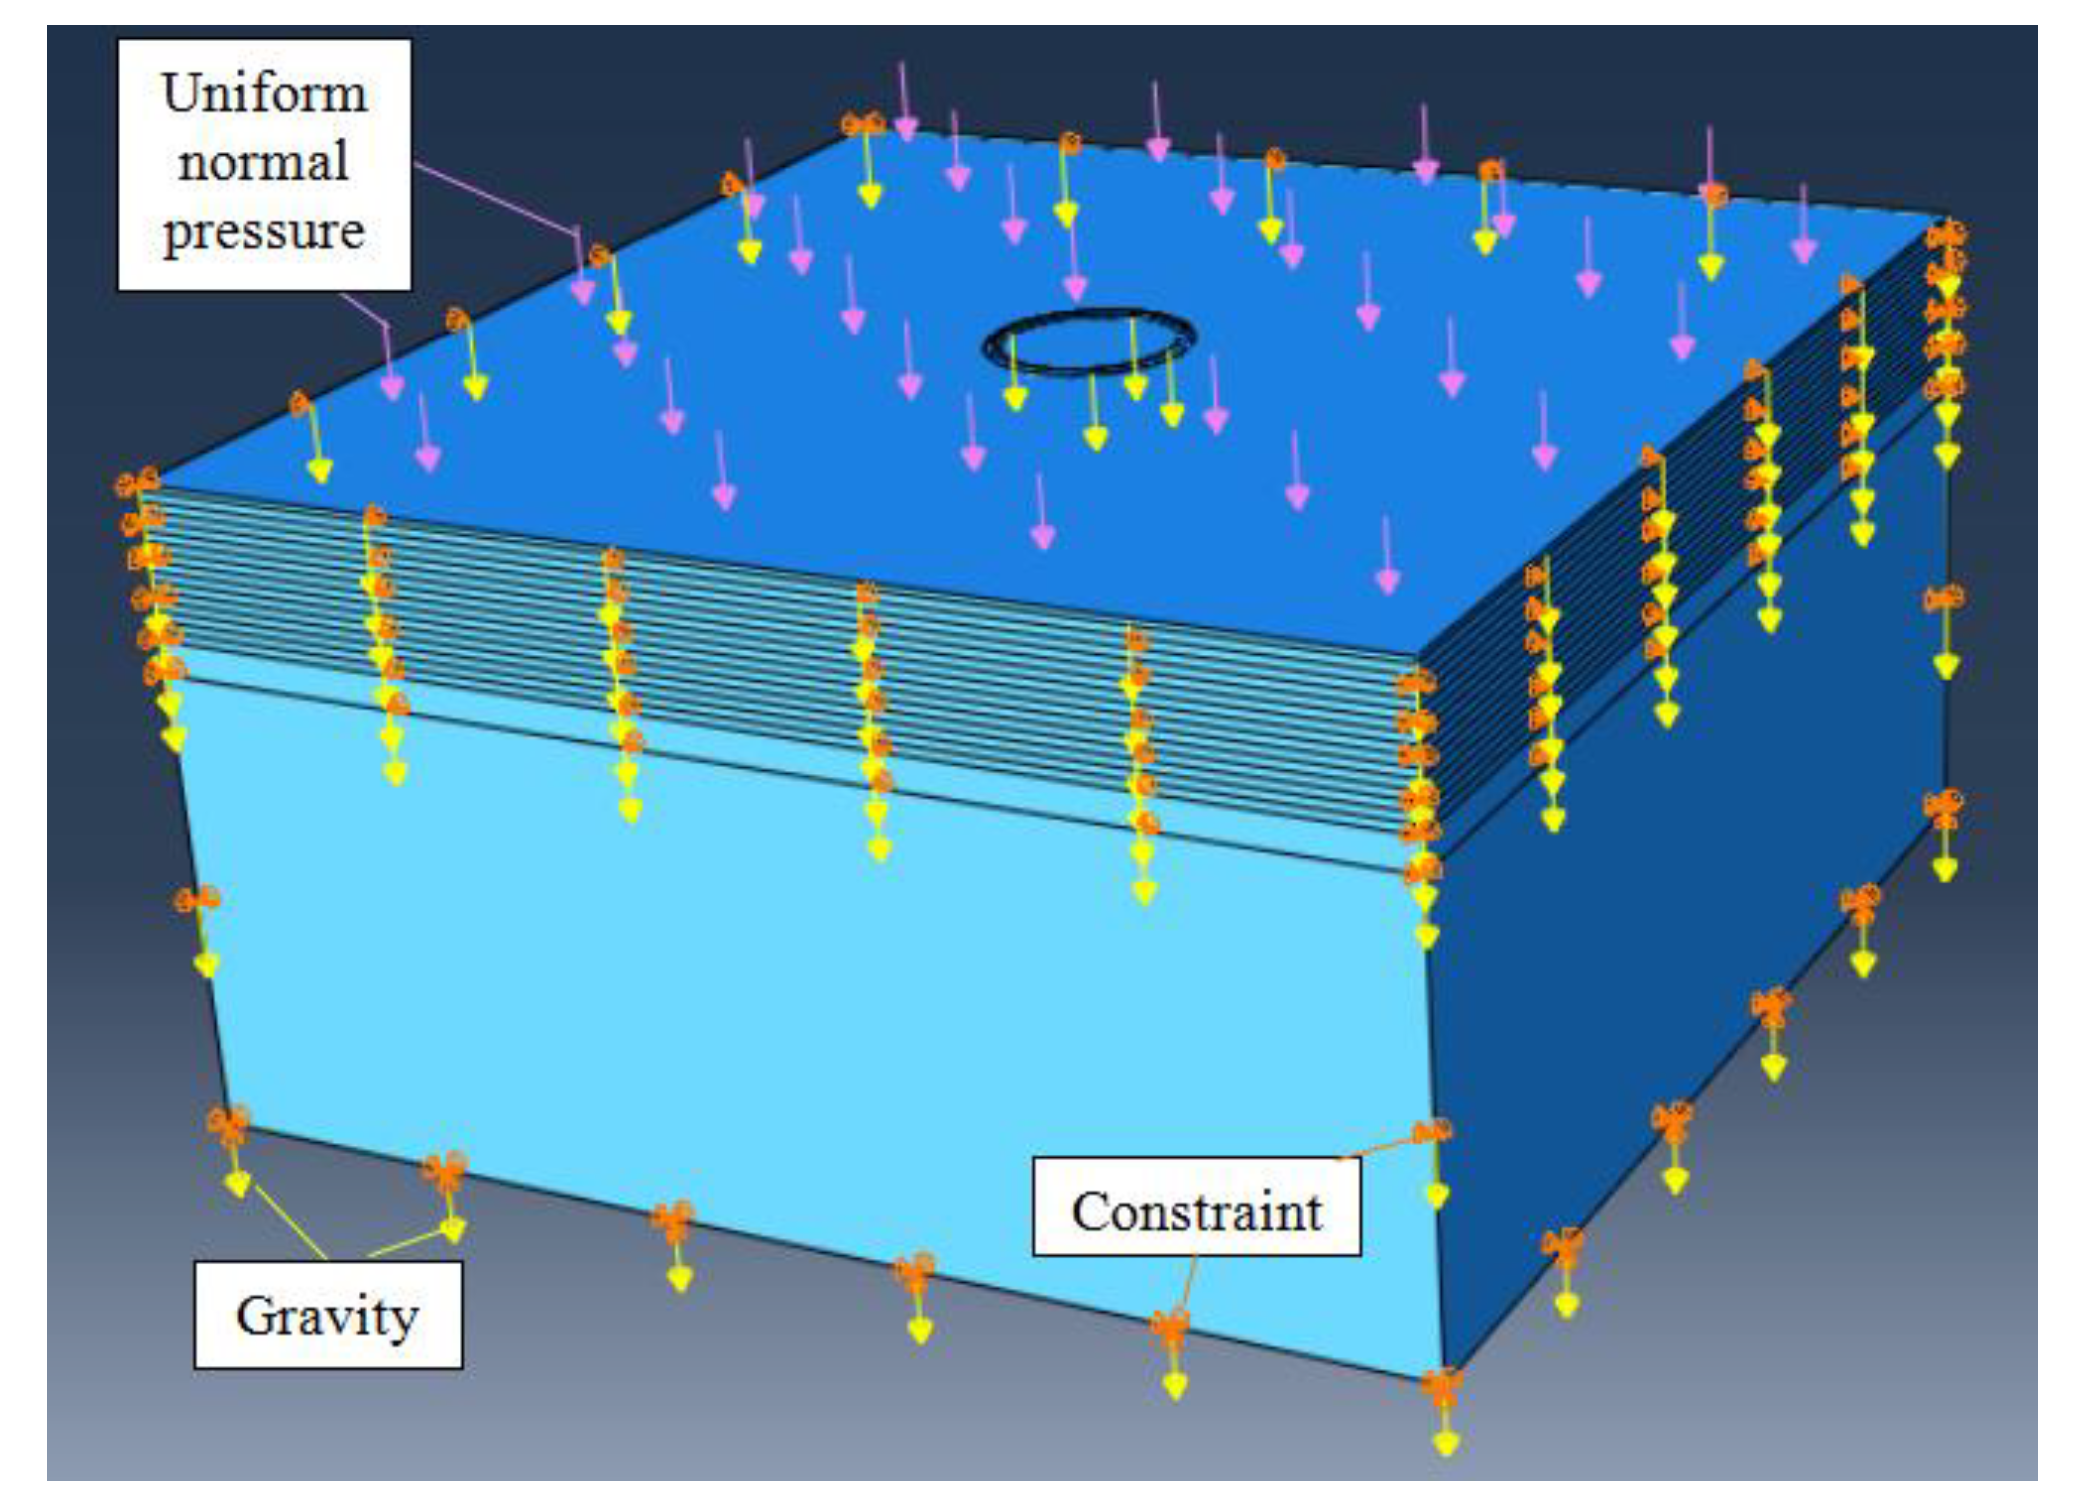
5.2. Application of Boundary Conditions and Loads
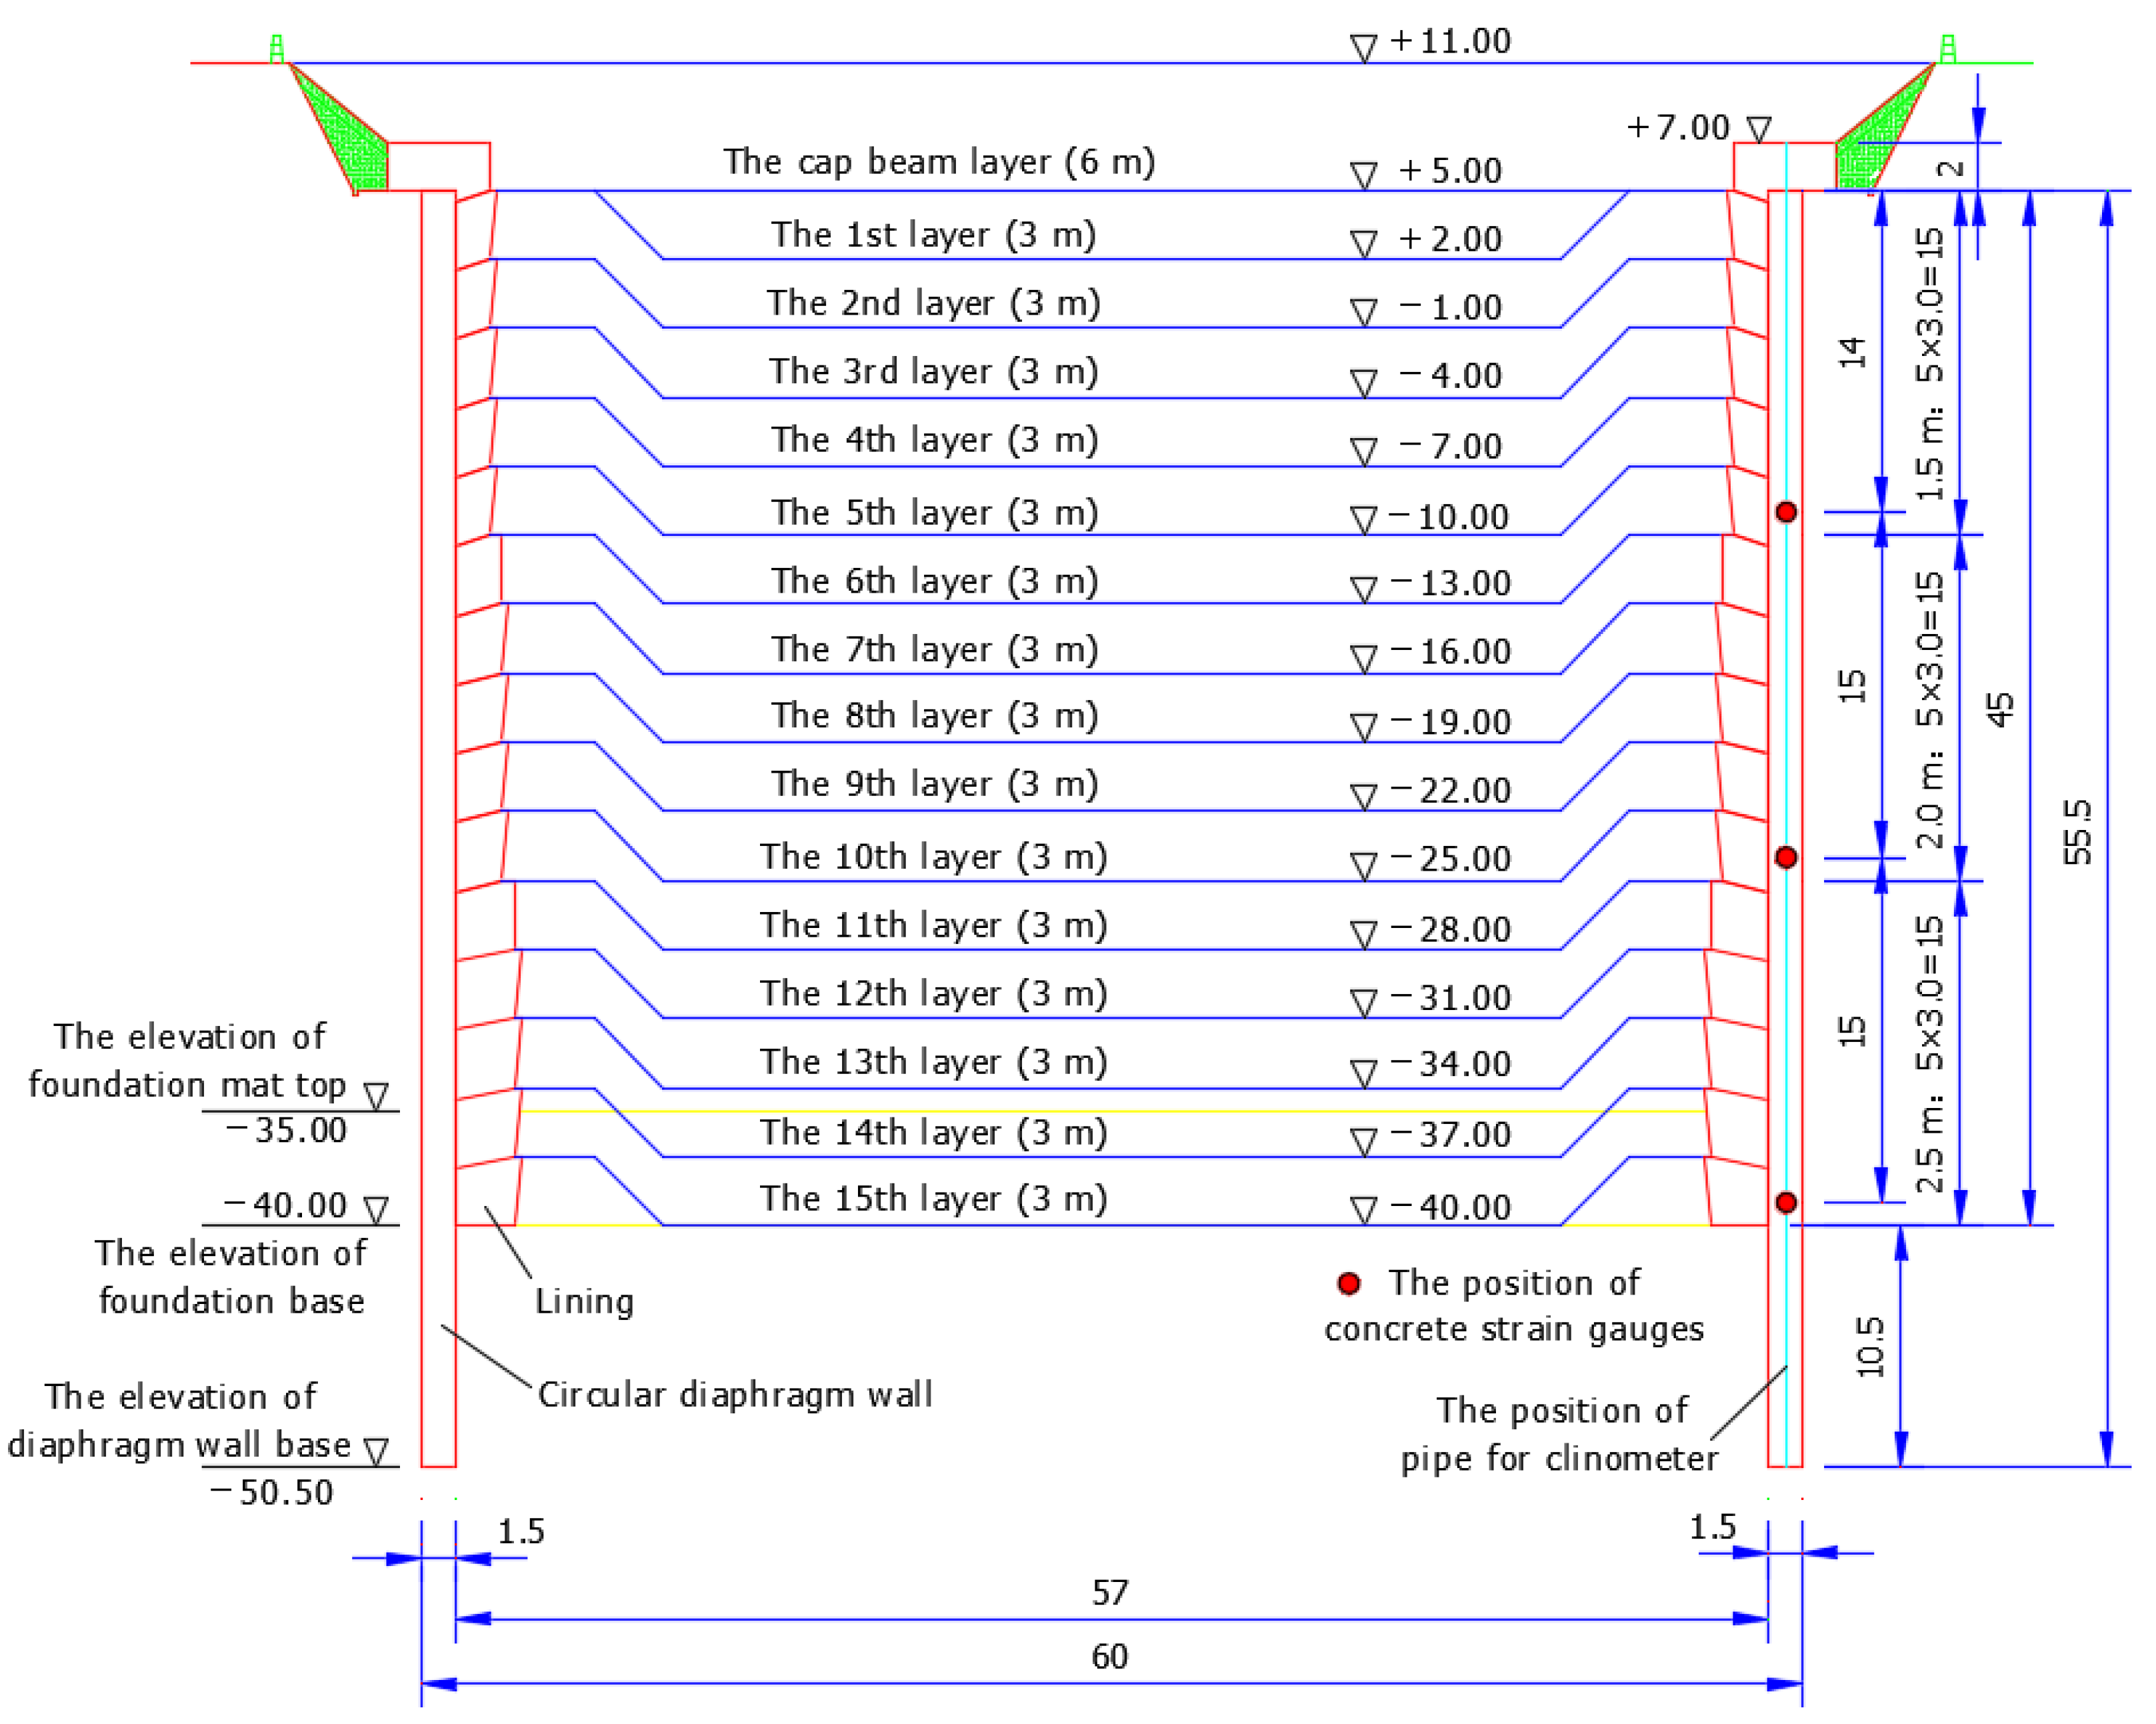
5.3. Simulation of Construction Process
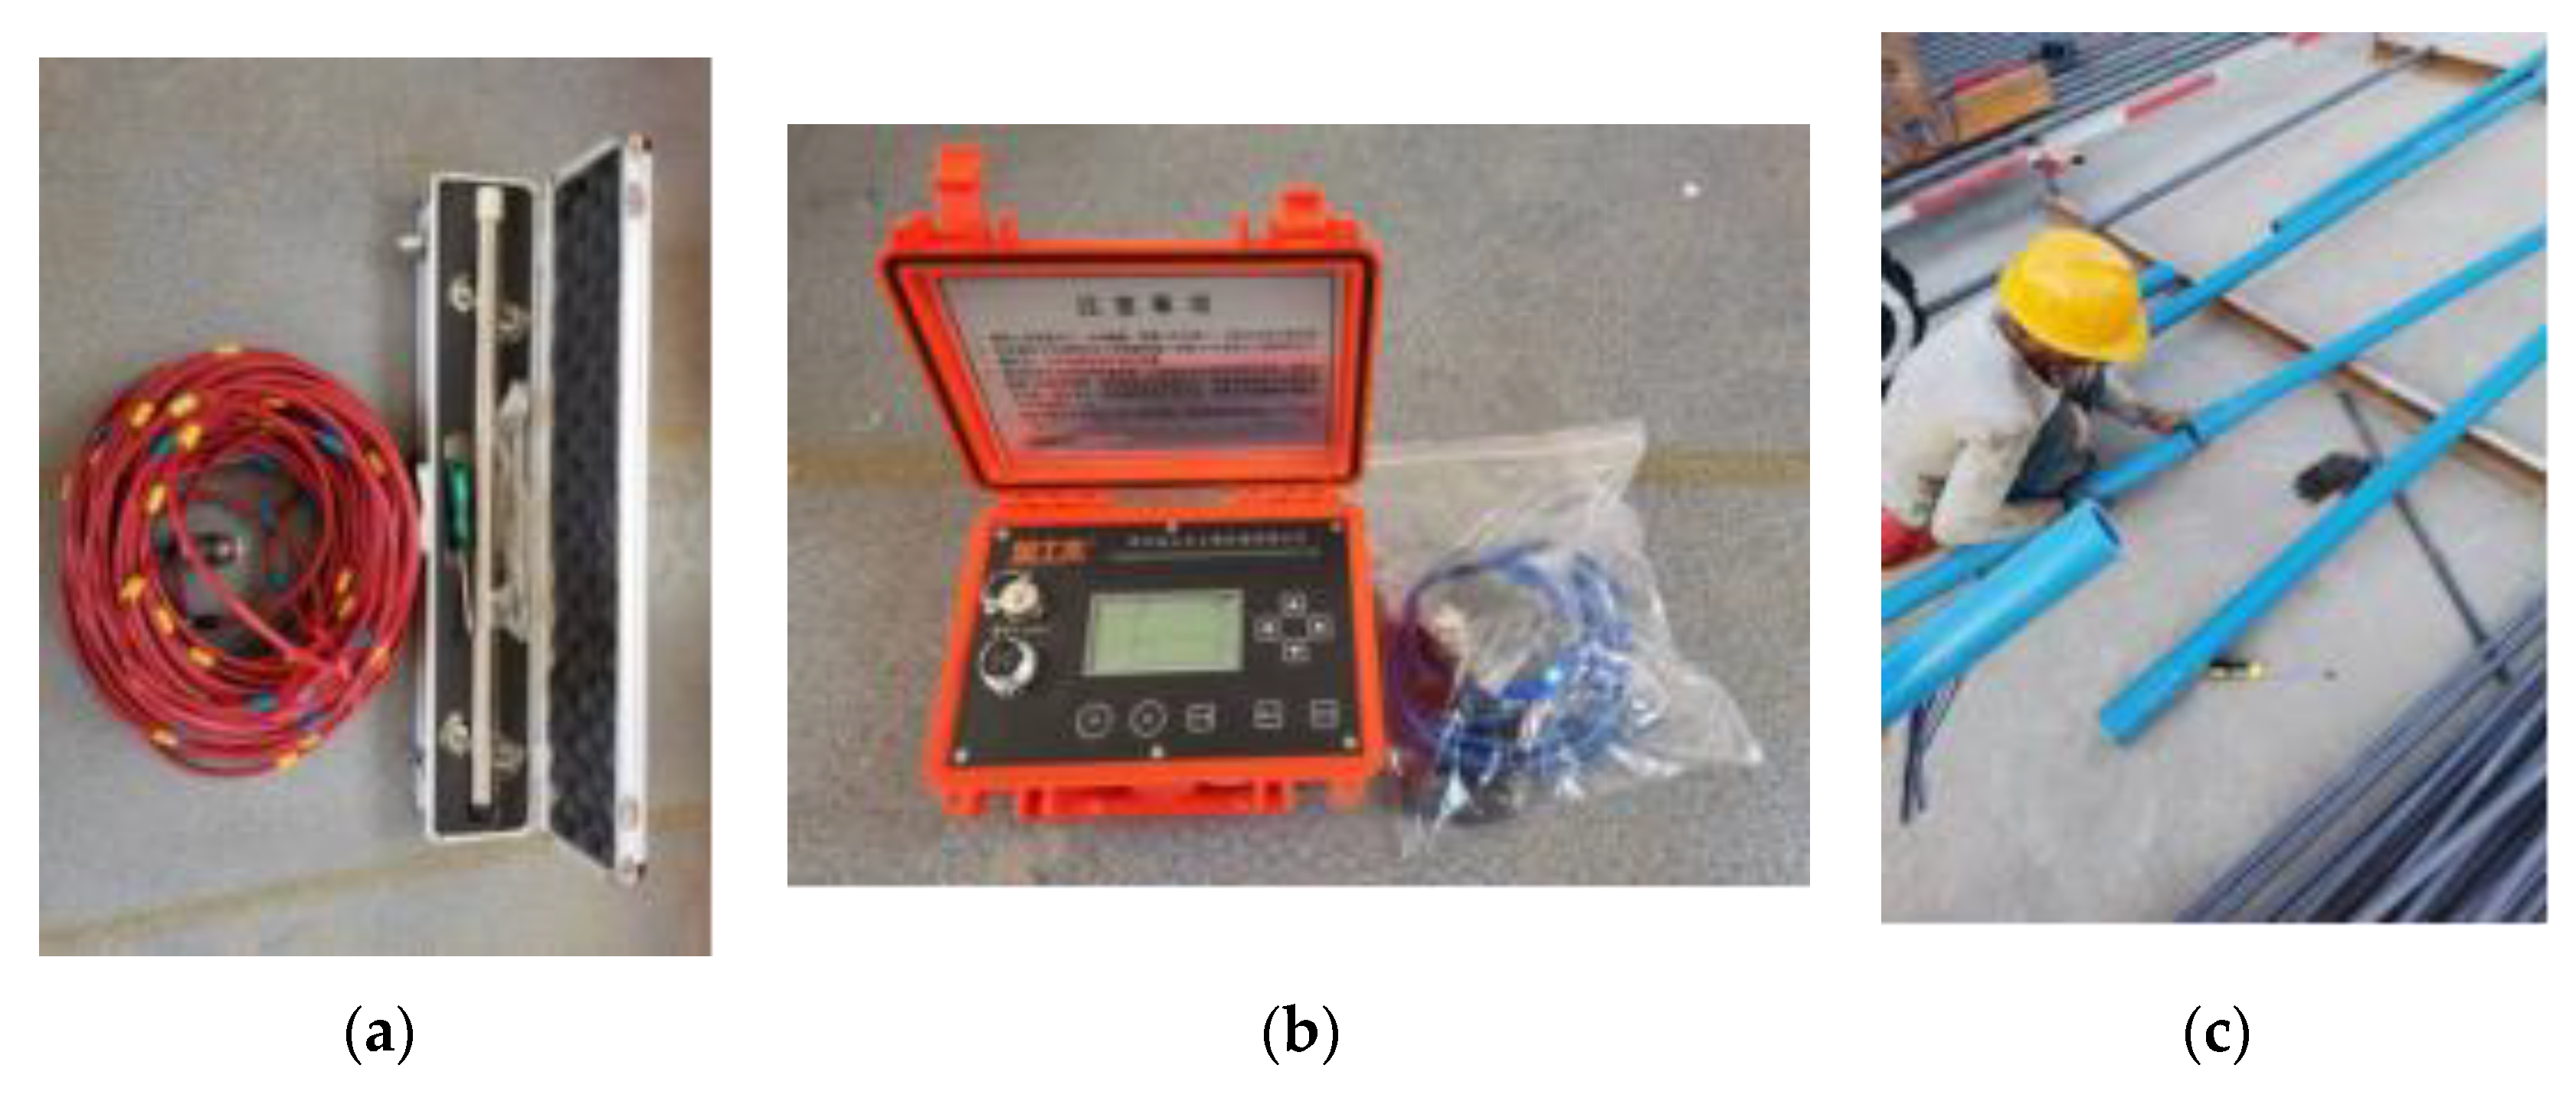
6. Site Monitoring
6.1. Radial Displacement Monitoring
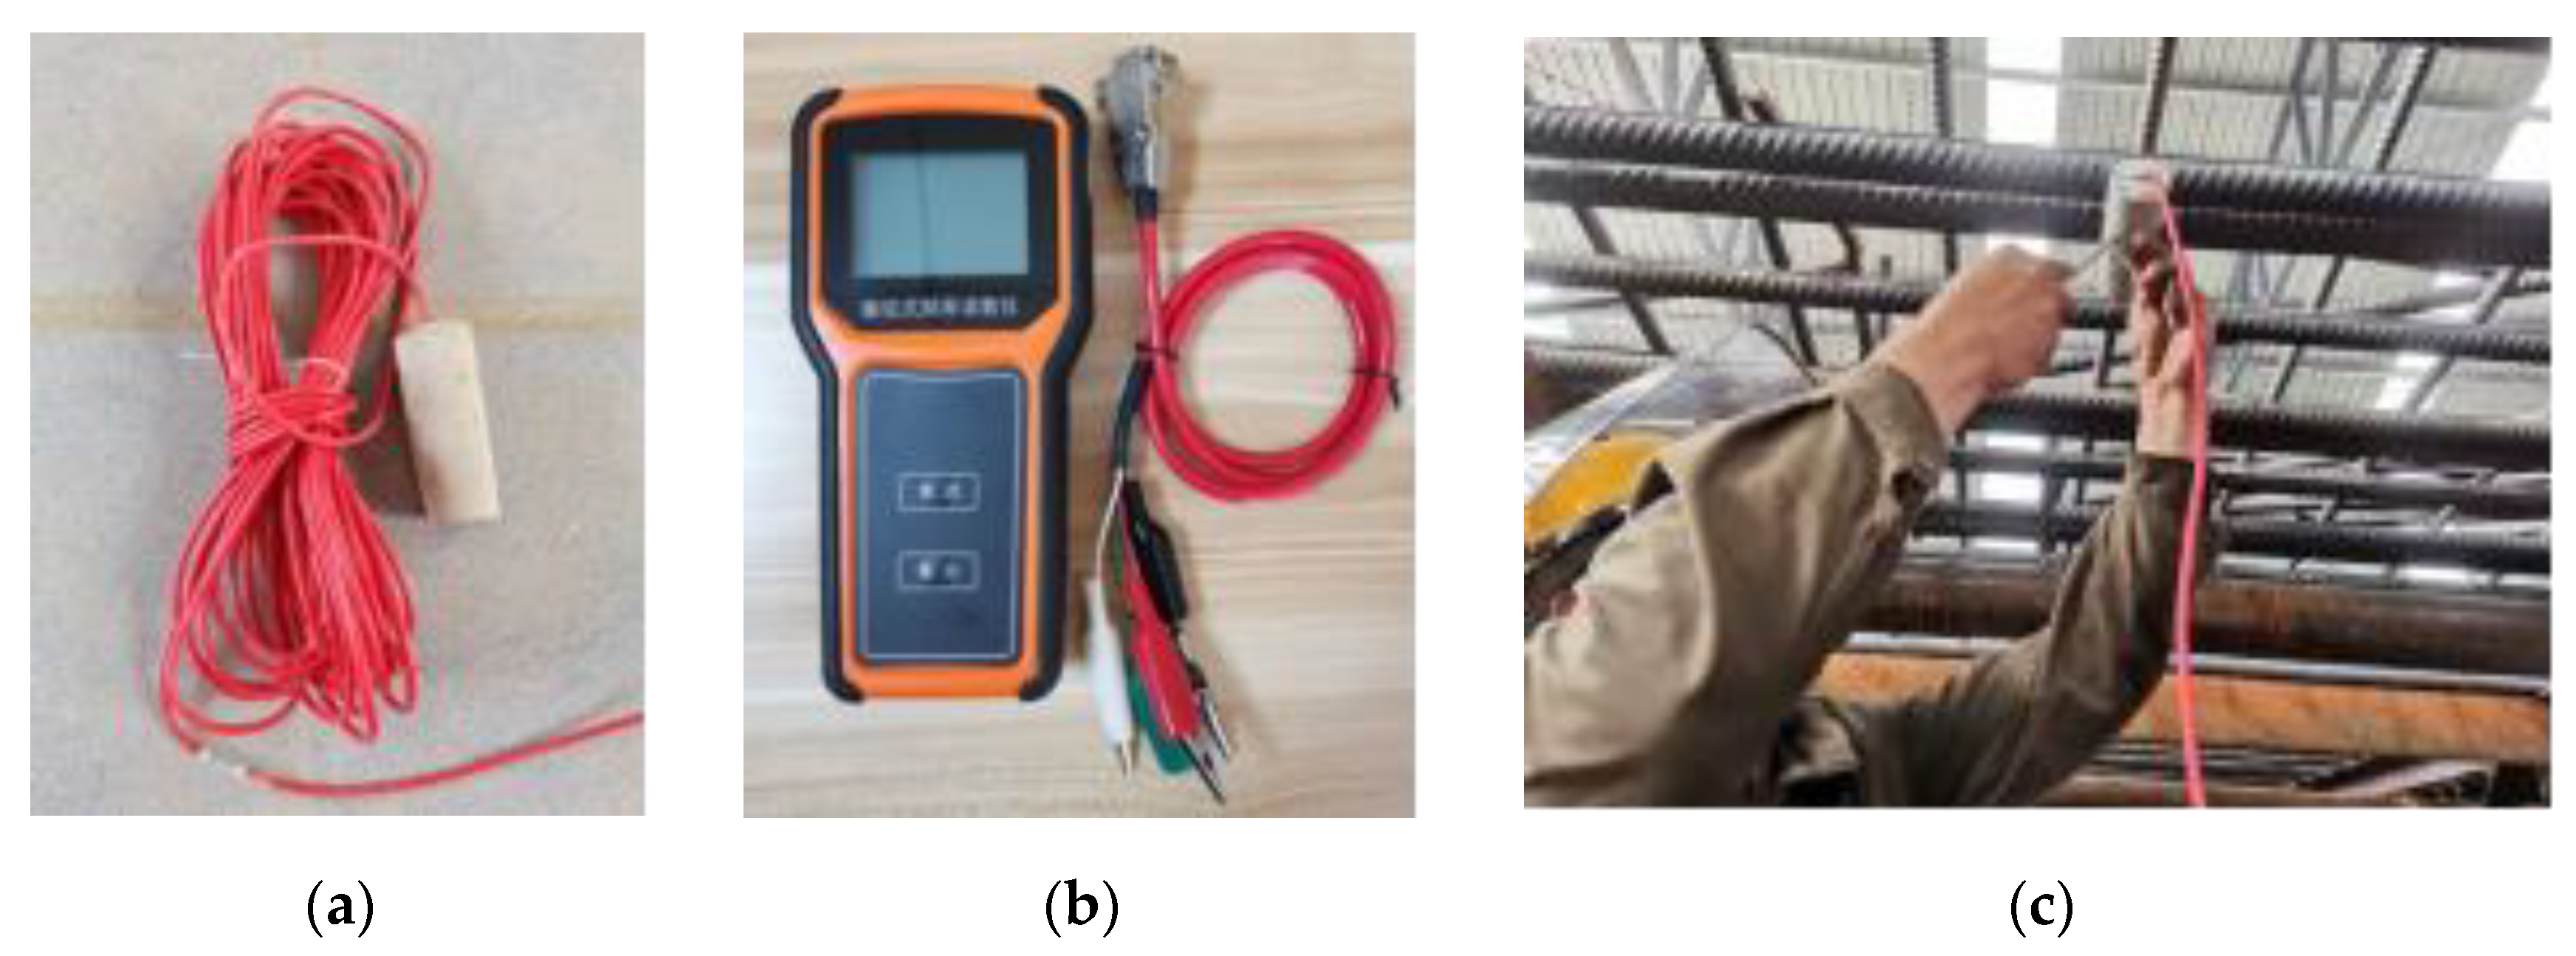
6.2. Circumferential Stress Monitoring
7. Results and Discussion
- (1)
- (2)
- (3)
- (4)
- The values of radial displacement, circumferential stress and vertical bending moment are only distinguished by the absolute values without considering plus and minus when describing the change law of the curve.
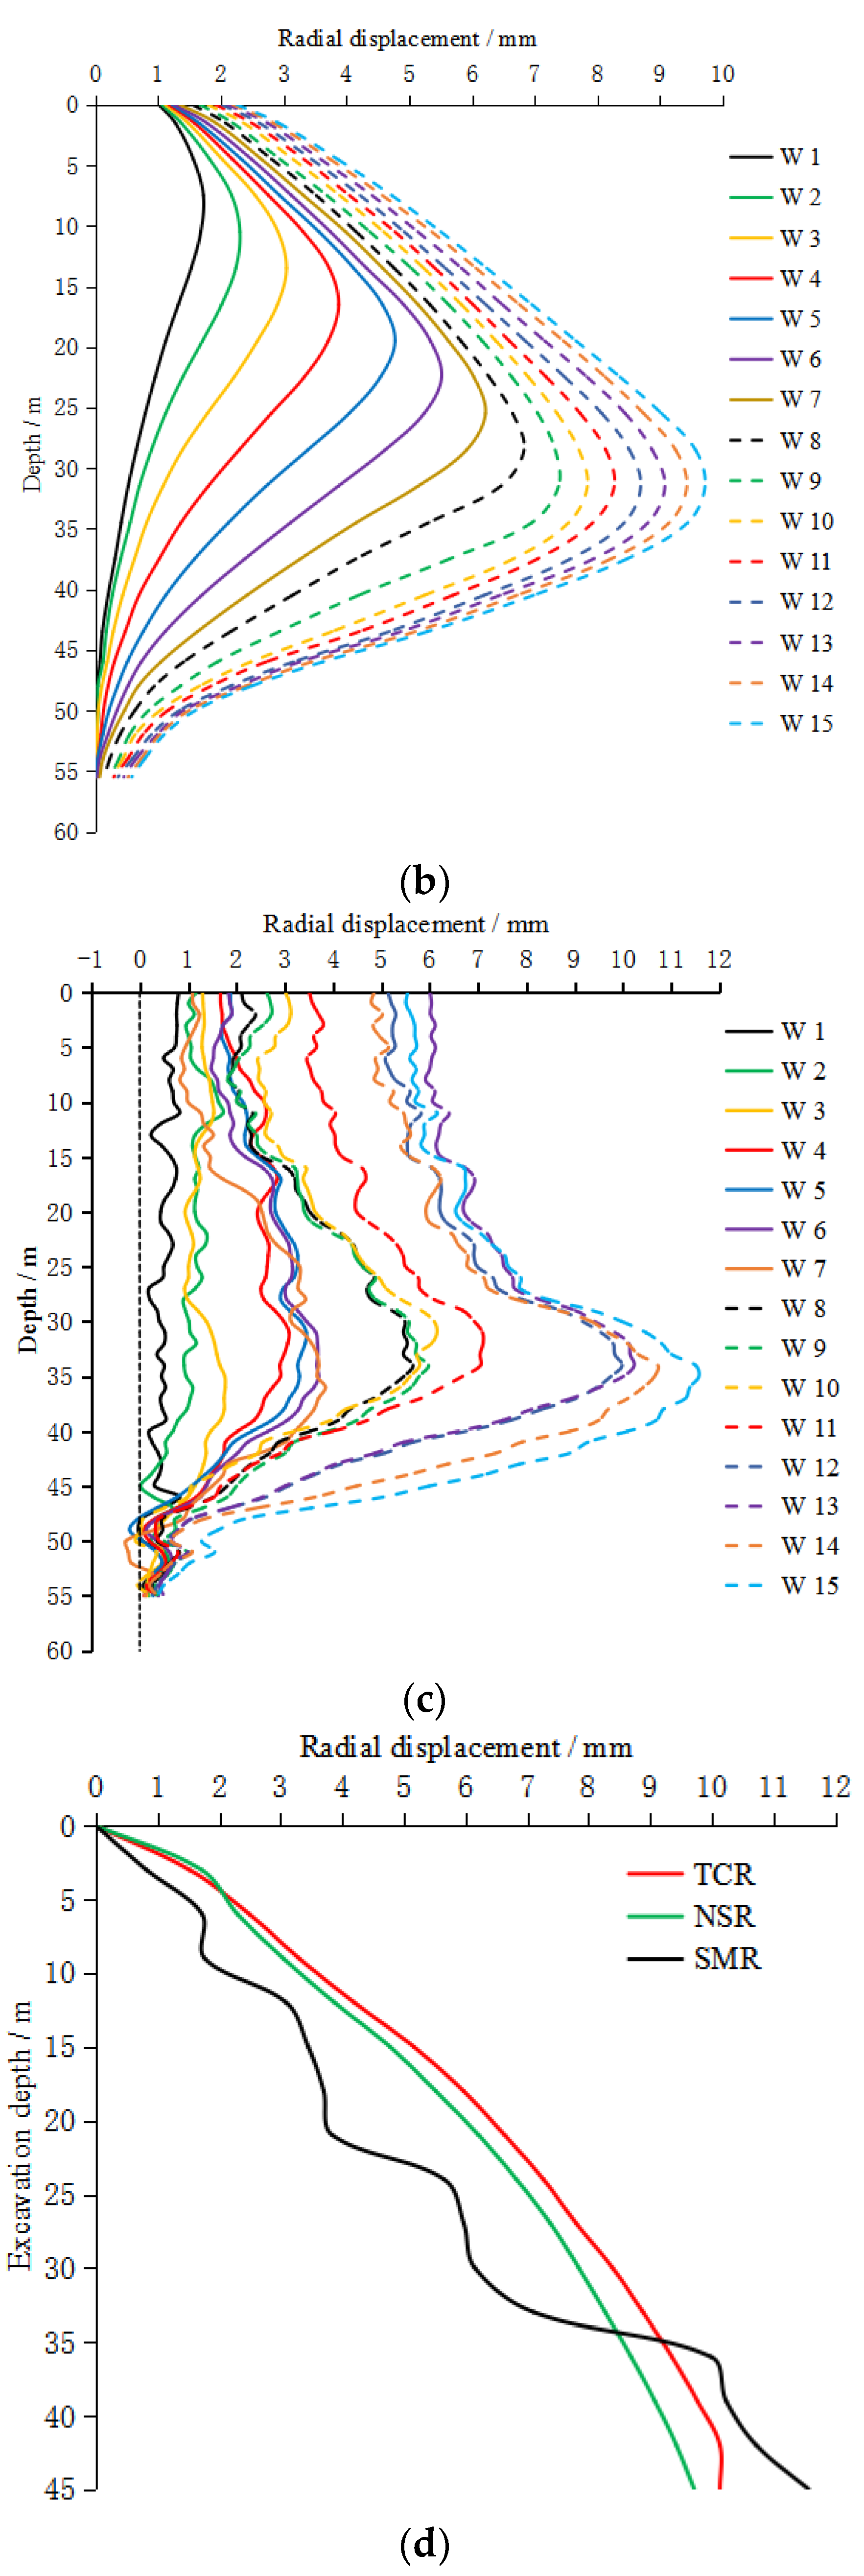
7.1. Radial Displacement of Circular Diaphragm Wall
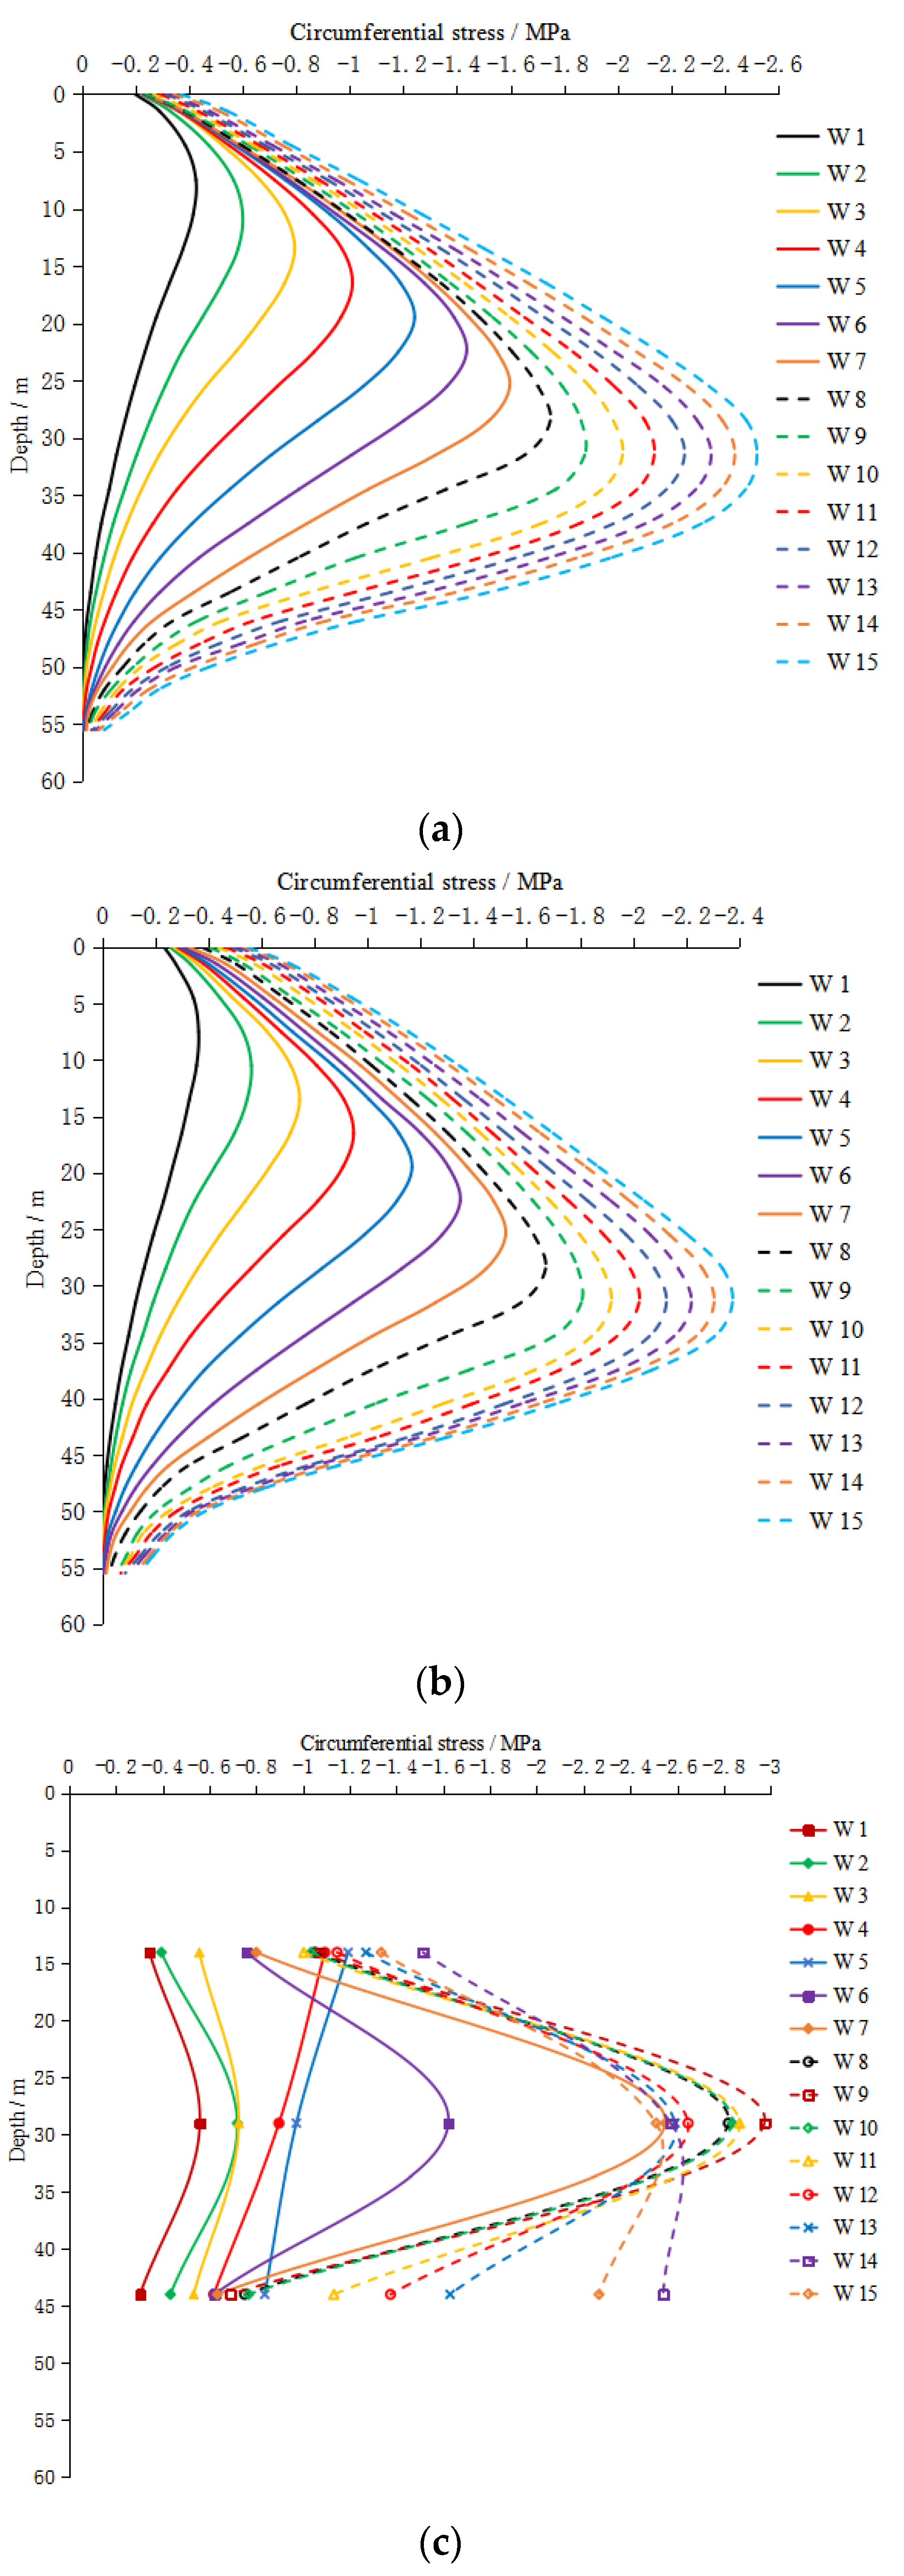
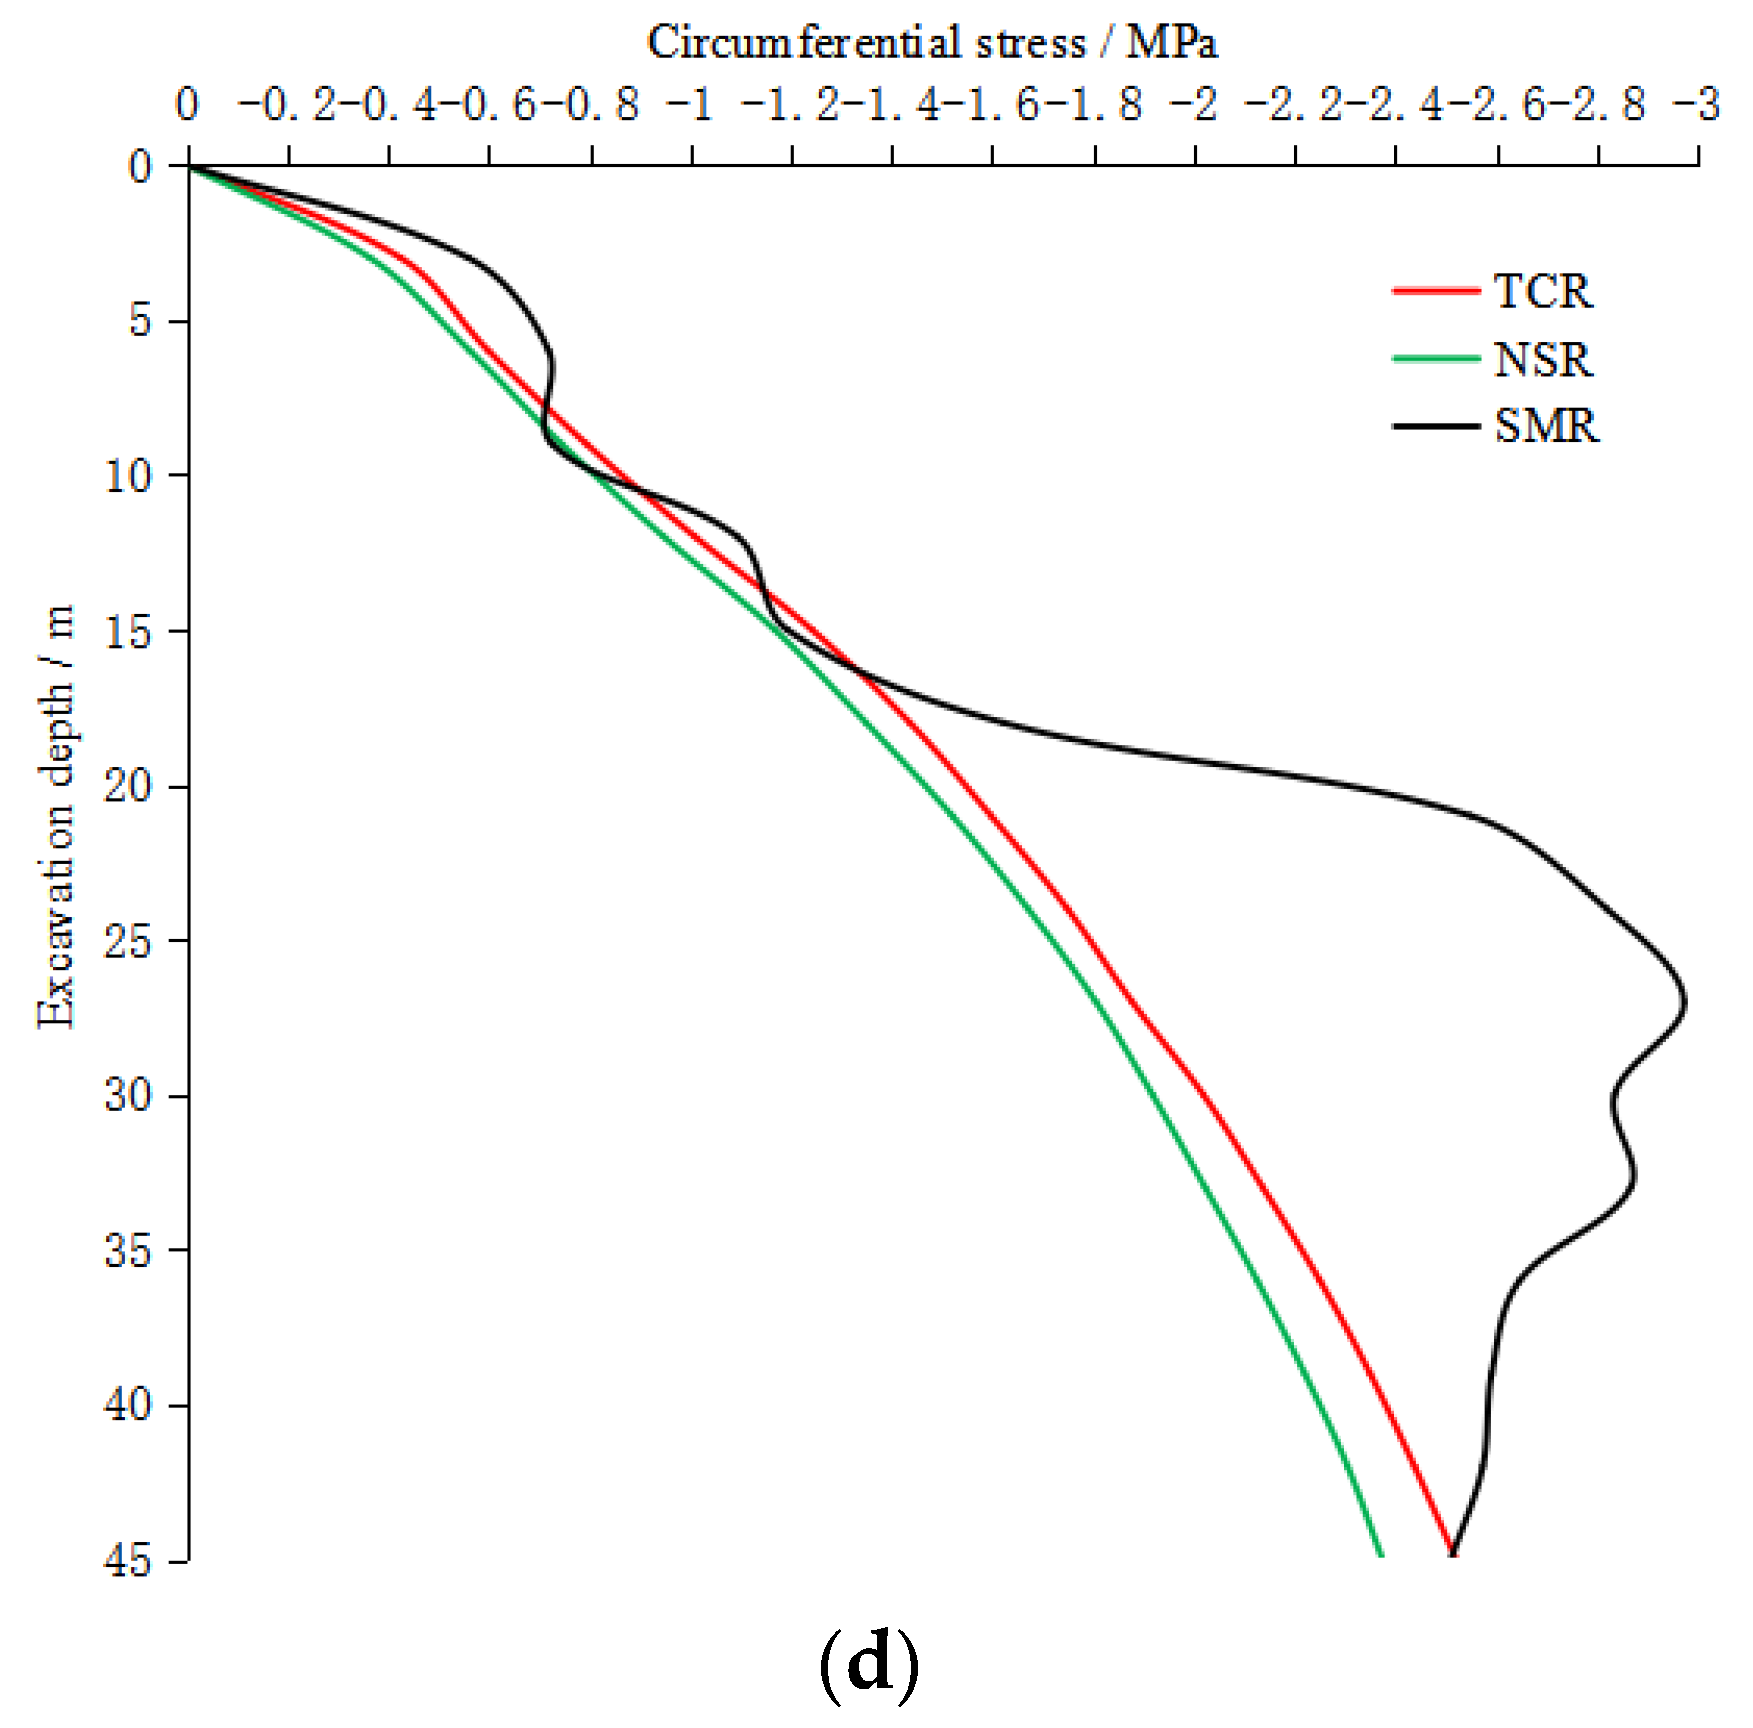
7.2. Circumferential Stress of Circular Diaphragm Wall
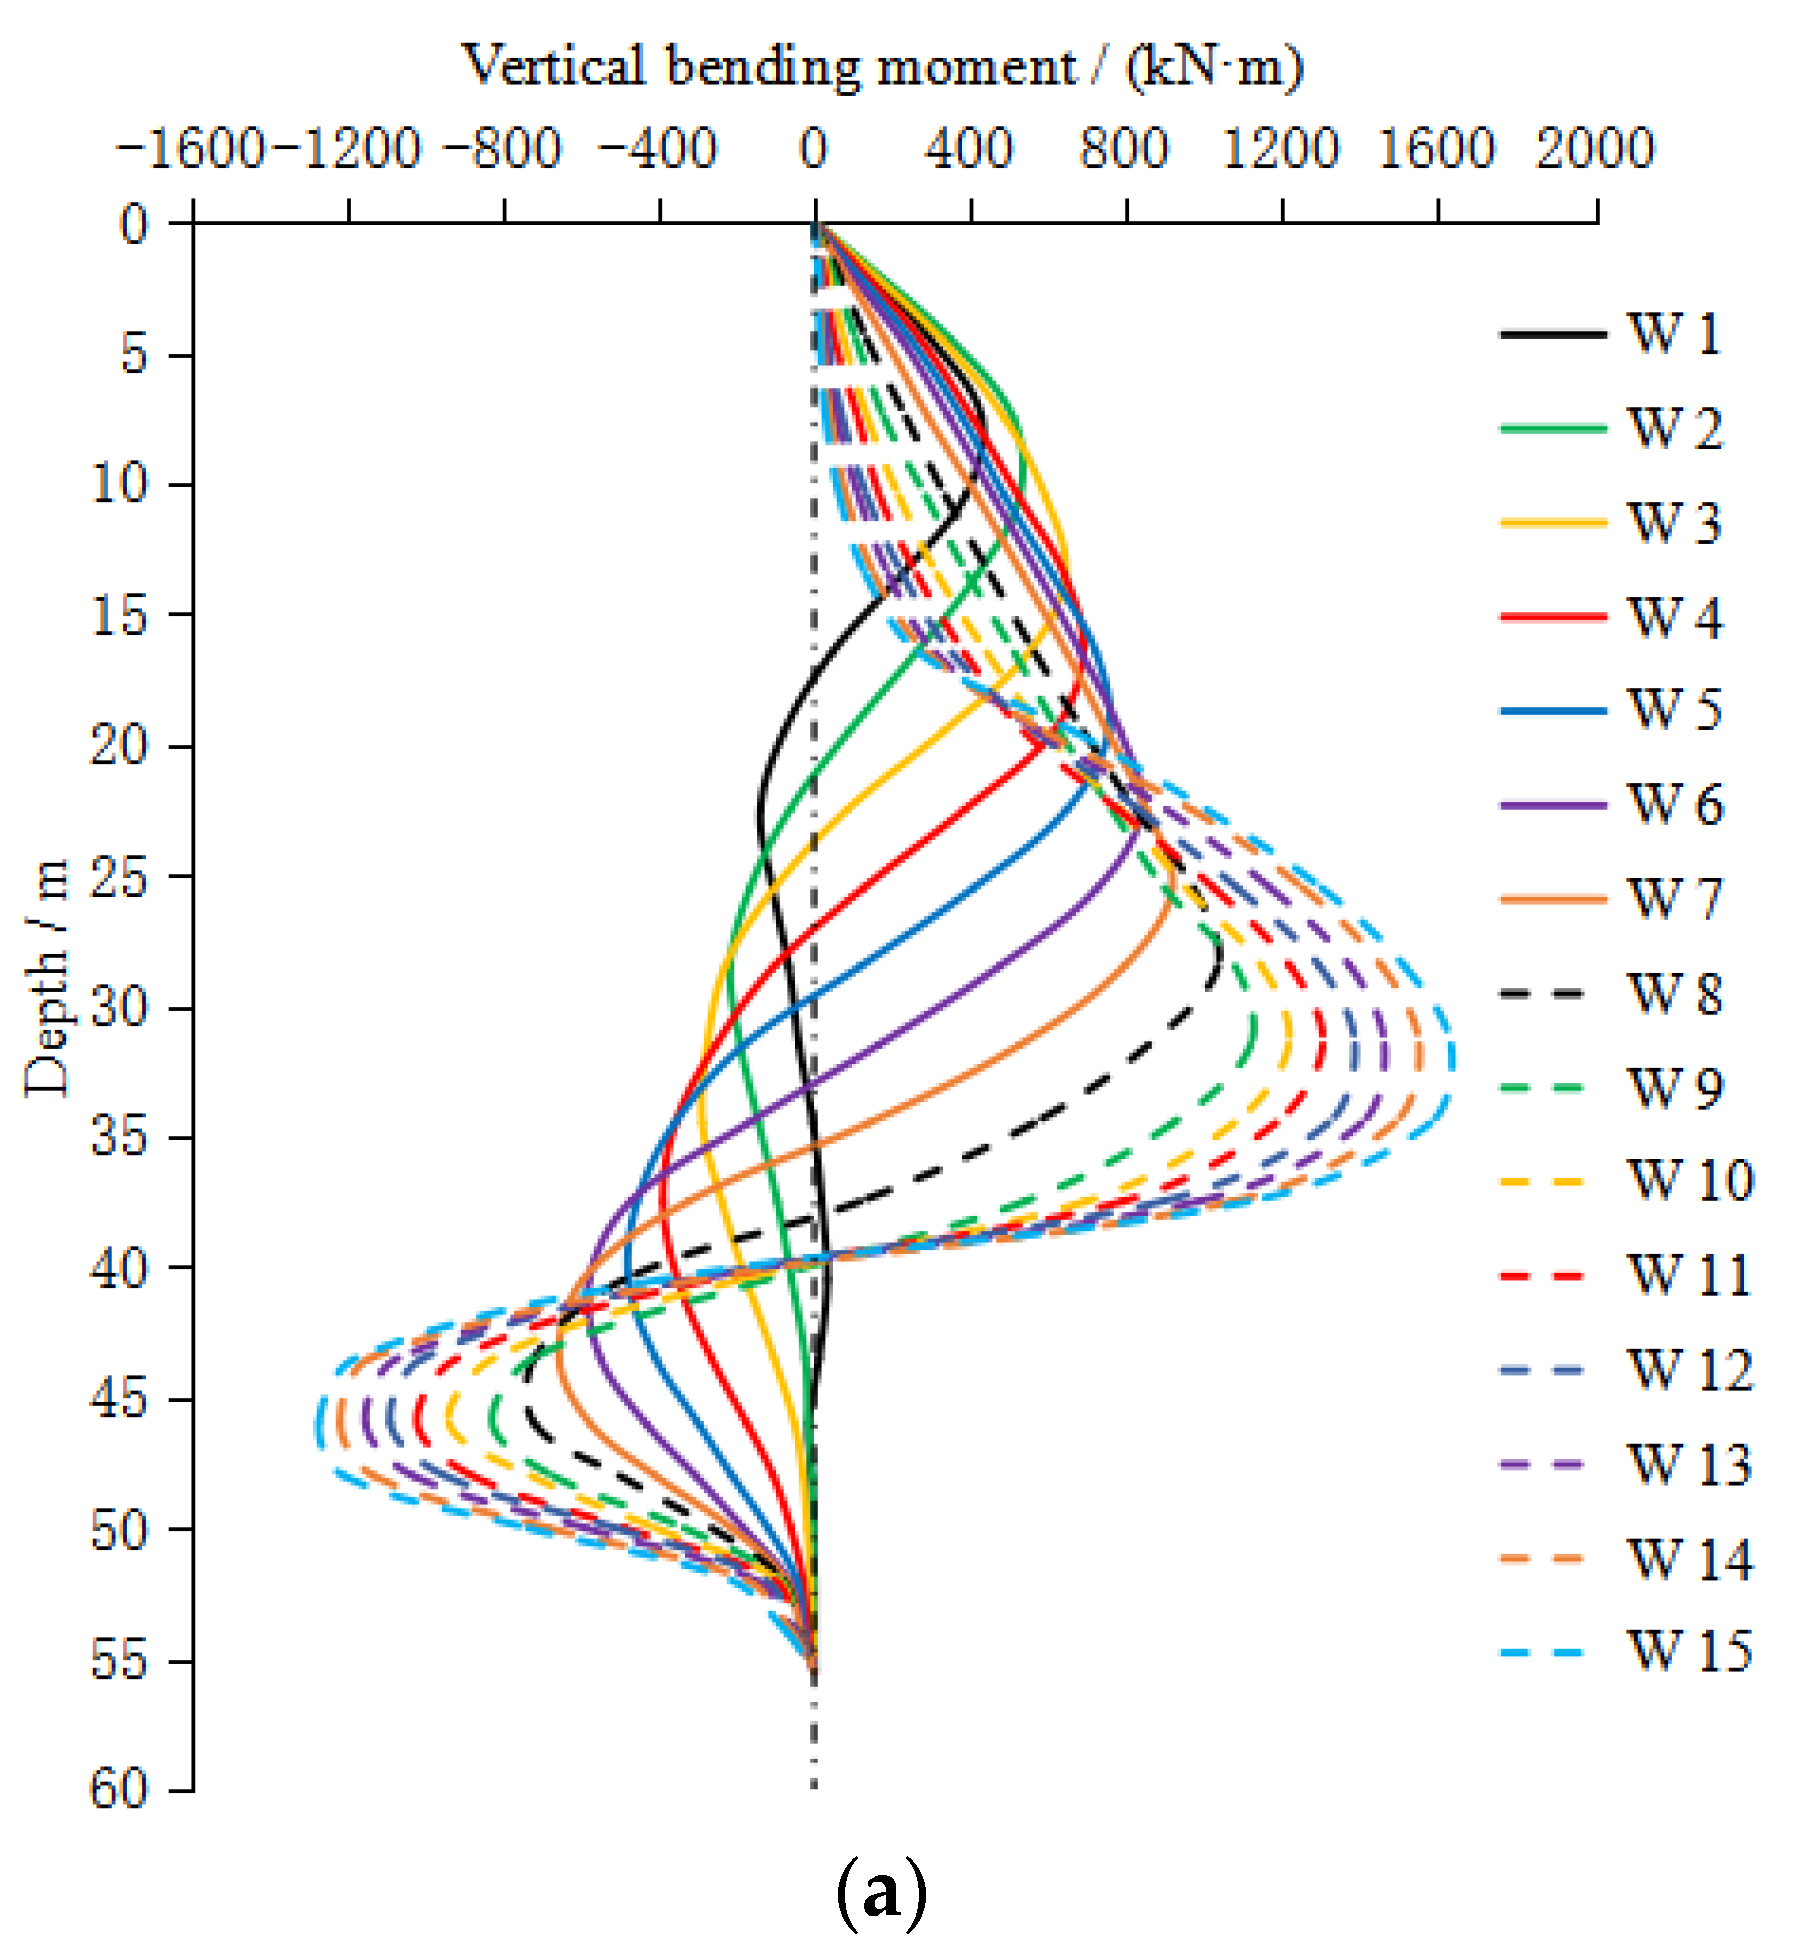
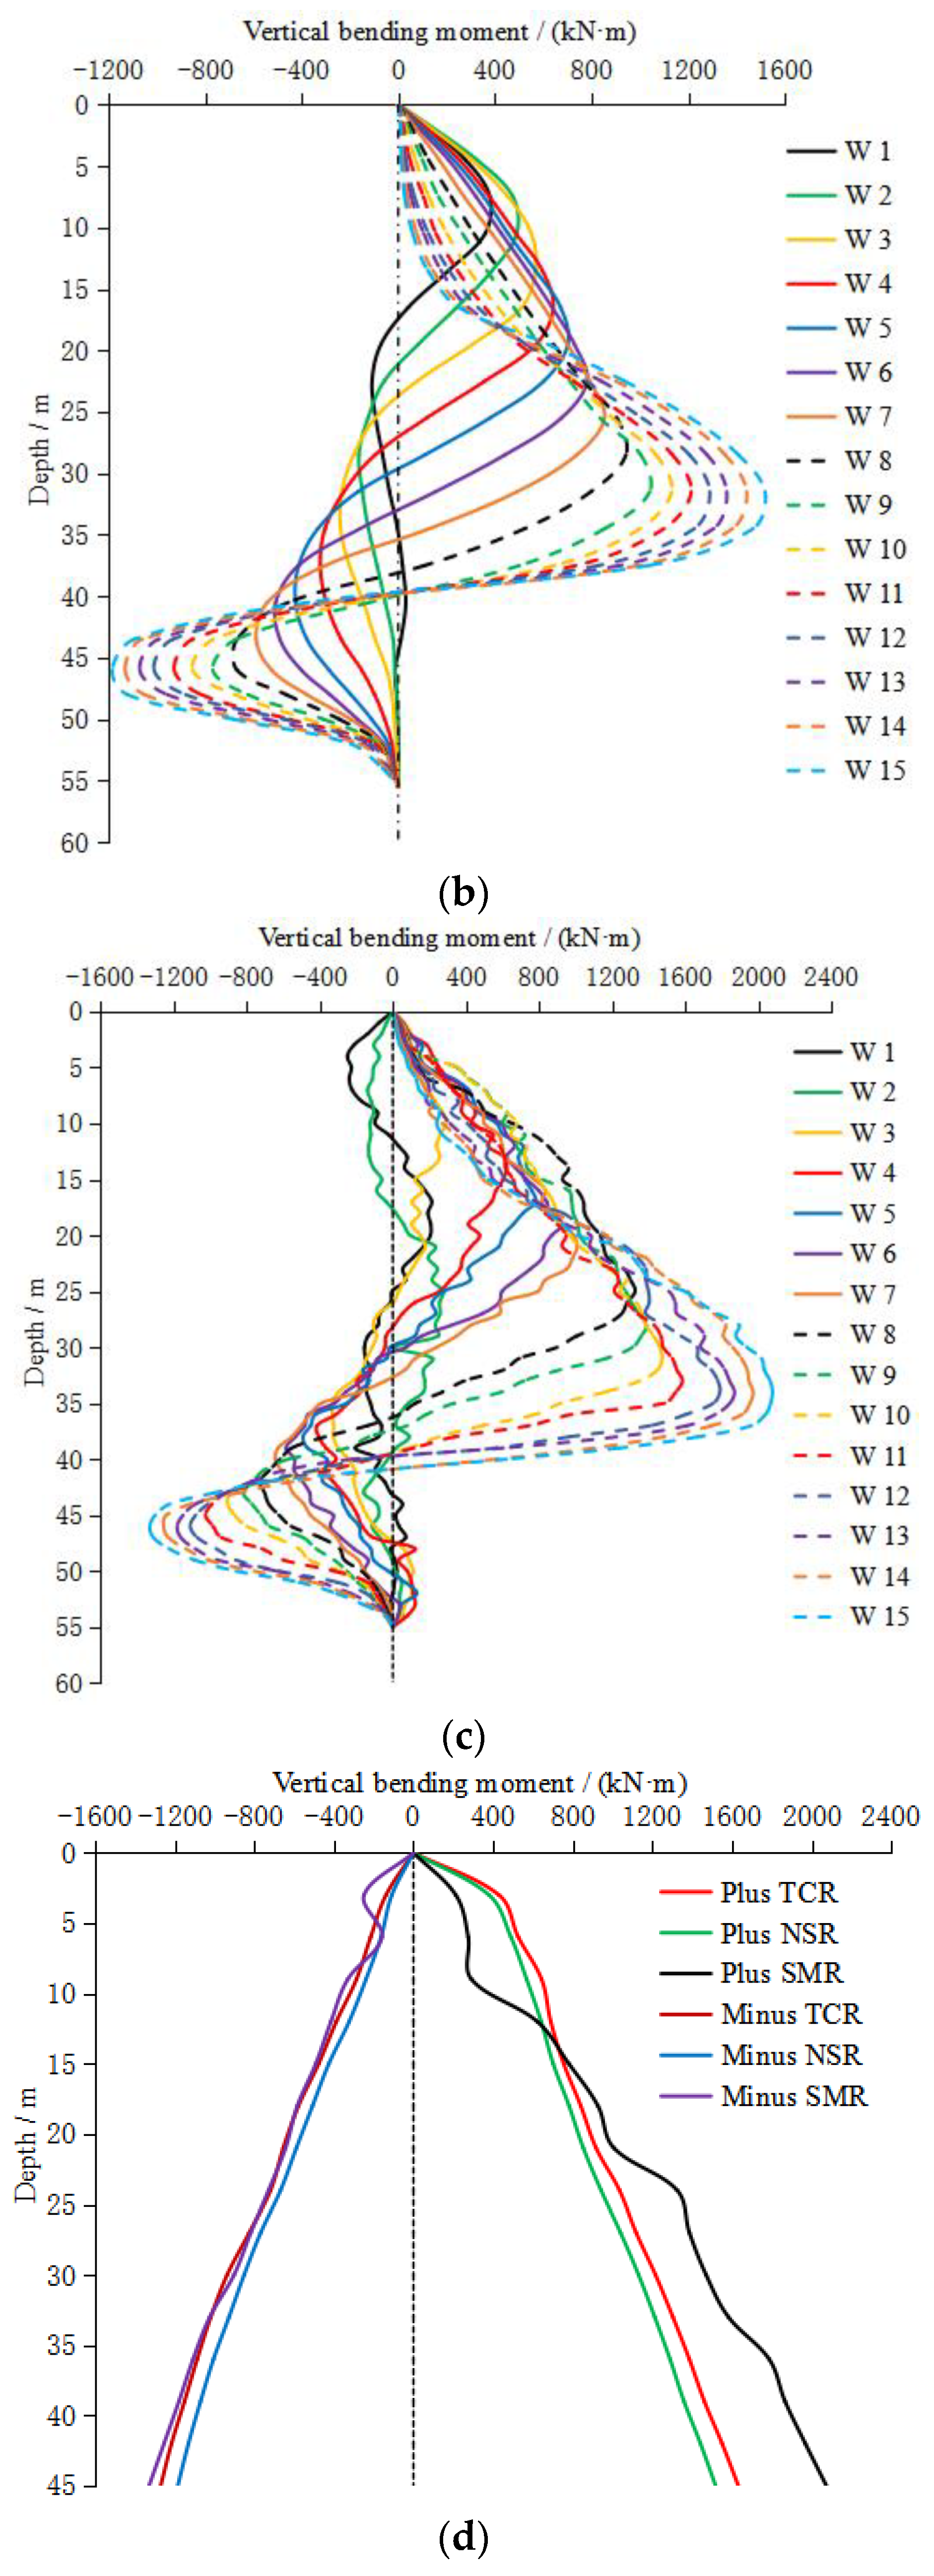
7.3. Vertical Bending Moment of Circular Diaphragm Wall
8. Conclusions
- (1)
- Because the circular diaphragm wall of the north anchorage foundation pit was mainly subjected to horizontal loads in the construction process, the mechanical calculation model of the circular diaphragm wall under the axisymmetric normal loads was given according to the mechanical characteristics of the circular diaphragm wall.
- (2)
- The circular diaphragm wall of the north anchorage foundation pit was simplified into a circular cylindrical shell model. The calculation formulas of the internal force and deformation of the circular diaphragm wall under axisymetric normal loads were derived by the circular cylindrical shell theory in elasticity, and the analytical solution and calculation steps based on the elastic superposition principle were provided.
- (3)
- The numerical model of the whole construction process of the north anchorage circular foundation pit was established, and the site monitoring of Section A was carried out.
- (4)
- The proposed CCSTCM and the FENSM were used to calculate the engineering case, and then the radial displacement, circumferential stress and vertical bending moment of the circular diaphragm wall under normal loads were obtained. All the obtained results were summarized regularly, and the numerical calculation model established was proven to be correct and reliable.
- (5)
- The TCR and NSR were compared with the SMR. On the whole, the TCR values were slightly larger than the NSR values, but slightly smaller than and closer to the SMR. Moreover, the curves obtained from the CCSTCM were highly similar to those obtained from the FENSM and site monitoring. All these facts fully prove the rationality and correctness of the CCSTCM proposed.
Author Contributions
Funding
Institutional Review Board Statement
Informed Consent Statement
Data Availability Statement
Conflicts of Interest
References
- Tan, Y.; Wang, D.L. Characteristics of a large-scale deep foundation pit excavated by the central-island technique in Shanghai soft clay. I: Bottom-up construction of the central cylindrical shaft. J. Geotech. Geoenviron. Eng. 2013, 139, 1875–1893. [Google Scholar] [CrossRef]
- Ling, X.; Wang, R.H. Seepage analysis and construction practice of anchorage circular foundation excavation in long-span suspension bridge. Appl. Mech. Mater. 2011, 90–93, 128–132. [Google Scholar] [CrossRef]
- Seitz, J.M. Diaphragm walls for deep shafts for the anchorage of a suspension bridge in Africa. In Proceedings of the Grouting 2017, Honolulu, Hawaii, 9–12 July 2017; Grouting 2017 GSP 289. pp. 491–501. [Google Scholar]
- Yong, Y.; Wu, Y.G.; Xu, G.P.; Gan, Y. Anchorage blocks of the Second Humen Bridge. In High Tech Concrete: Where Technology and Engineering Meet, Proceedings of the 2017 fib Symposium, Maastricht, The Netherlands, 12–14 June 2017; Springer International Publishing: Berlin/Heidelberg, Germany, 2018; pp. 2654–2659. [Google Scholar]
- Gao, X.H.; Tian, W.P.; Li, J.C.; Qi, H.L.; Li, S.Y.; Zhang, Z.P. Research on the stress and deformation characteristics of circular foundation pit during excavation in sand soil. Adv. Mater. Sci. Eng. 2023, 2023, 3008695. [Google Scholar] [CrossRef]
- JTG 3363-2019; Specifications for Design of Foundation of Highway Bridges and Culverts. Standards Press of China: Beijing, China, 2019. (In Chinese)
- Tan, Y.; Wang, D.L. Structural behaviors of large underground earth-retaining systems in Shanghai. I: Unpropped circular diaphragm wall. J. Perform. Constr. Facil. 2015, 29, 04014058. [Google Scholar] [CrossRef]
- Peck, R.B. Deep excavation and tunneling in soft ground. In Proceedings of the 7th International Conference of Soil Mechanics and Foundation Engineering, ISSMGE, Mexico City, Mexio, 29 August 1969; pp. 225–281. [Google Scholar]
- Mana, A.I.; Clough, G.W. Prediction of movements for braced cuts in clay. J. Geotech. Eng. Div. 1981, 107, 759–777. [Google Scholar] [CrossRef]
- Clough, G.W.; O’Rourke, T.D. Construction induced movements of in-situ walls. In Geotechnical Special Publication: Design and Performance of Earth Retaining Structures (GSP 25); ASCE: Reston, VA, USA, 1990; pp. 439–470. [Google Scholar]
- Ou, C.Y.; Hsieh, P.G.; Chiou, D.C. Characteristics of ground surface settlement during excavation. Can. Geotech. J. 1993, 30, 758–767. [Google Scholar] [CrossRef]
- Hsieh, P.G.; Ou, C.Y. Shape of ground surface settlement profiles caused by excavation. Can. Geotech. J. 1998, 35, 1004–1017. [Google Scholar] [CrossRef]
- Long, M. Database for retaining wall and ground movements due to deep excavations. J. Geotech. Geoenviron. Eng. 2001, 127, 203–224. [Google Scholar] [CrossRef]
- Moormann, C. Analysis of wall and ground movements due to deep excavation in soft soils based on a new worldwide database. Soils Found. 2004, 44, 87–98. [Google Scholar] [CrossRef] [Green Version]
- Kung, G.T.C.; Juang, C.H.; Hsiao, E.C.L.; Hashash, Y.M.A. Simplified model for wall deflection and ground-surface settlement caused by braced excavation in clays. J. Geotech. Geoenviron. Eng. 2007, 133, 731–747. [Google Scholar] [CrossRef]
- Liu, Y.D.; Hu, W.; Huang, D.X. The response of somatotype characteristics of circular underground diaphragm wall structure. Adv. Mater. Res. 2014, 1065–1069, 1290–1295. [Google Scholar] [CrossRef]
- Cui, J.F.; Hu, J.H.; He, Y.B. Force analysis of circular underground diaphragm wall based on Ritz Method. China J. Highw. Transp. 2017, 30, 48–55. (In Chinese) [Google Scholar]
- Cai, F.; Ugai, K.; Hagiwara, T. Base stability of circular excavations in soft clay. J. Geotech. Geoenviron. Eng. 2002, 128, 702–706. [Google Scholar] [CrossRef]
- Arai, Y.; Kusakabe, O.; Murata, O.; Konishi, S. A numerical study on ground displacement and stress during and after the installation of deep circular diaphragm walls and soil excavation. Comput. Geotech. 2008, 35, 791–807. [Google Scholar] [CrossRef]
- Borges, J.L.; Guerra, G.T. Cylindrical excavations in clayey soils retained by jet grout walls: Numerical analysis and parametric study considering the influence of consolidation. Comput. Geotech. 2014, 55, 42–56. [Google Scholar] [CrossRef]
- Wu, G.J.; Chen, W.Z.; Bian, H.B.; Yuan, J.Q. Structure optimisation of a diaphragm wall with special modelling methods in a large-scale circular ventilating shaft considering shield crossing. Tunn. Undergr. Space Technol. 2017, 65, 35–41. [Google Scholar] [CrossRef]
- Kumagai, T.; Ariizumi, K.; Kashiwagi, A. Behaviour and analysis of a large-scale cylindrical earth retaining structure. Soils Found. 1999, 39, 13–26. [Google Scholar] [CrossRef] [PubMed]
- Parashar, S.; Mitchell, R.; Hee, M.W.; Sanmugnathan, D.; Nicholson, G. Performance monitoring of deep shafts at Changi WRP project. In Proceedings of the 7th FMGM 2007: Field Measurements in Geomechanics, Singapore, 24–27 September 2007; pp. 1–12. [Google Scholar]
- Jia, J.; Zhai, J.Q.; Li, M.G.; Zhang, L.L.; Xie, X.L. Performance of large-diameter circular diaphragm walls in a deep excavation: Case study of Shanghai Tower. J. Aerosp. Eng. 2019, 32, 04019078. [Google Scholar] [CrossRef]
- Cabarkapa, Z.; Milligan, G.W.E.; Menkiti, C.O.; Murphy, J.; Potts, D.M. Design and performance of a large diameter shaft in Dublin boulder clay. In Proceedings of the International Conference on Foundations: Innovations, Observations, Design and Practice, Dundee, Scotland, 2–5 September 2003; Thomas Telford Publishing: London, UK, 2003; pp. 175–185. [Google Scholar]
- Schwamb, T. Performance Monitoring and Numerical Modelling of a Deep Circular Excavation. Ph.D. Thesis, Department of Engineering, University of Cambridge, Cambridge, UK, 2014. [Google Scholar]
- Schwamb, T.; Soga, K. Numerical modelling of a deep circular excavation at Abbey Mills in London. Géotechnique 2015, 65, 604–619. [Google Scholar] [CrossRef]
- Shi, H.; Jia, Z.L.; Wang, T.; Cheng, Z.Q.; Zhang, D.; Bai, M.Z.; Yu, K. Deformation characteristics and optimization design for large-scale deep and circular foundation pit partitioned excavation in a complex environment. Buildings 2022, 12, 1292. [Google Scholar] [CrossRef]
- Xu, Z.L. Elasticity (Second Volume); Higher Education Press: Beijing, China, 2016. (In Chinese) [Google Scholar]
- Timoshenko, S.; Woinowsky-krieger, S. Plate and Shell Theory. Translation Team for “Plate and Shell Theory” Translating; Science Press: Beijing, China, 1977. (In Chinese) [Google Scholar]
- Li, Q.Y.; Wang, N.C.; Yi, D.Y. Numerical Analysis, 5th ed.; Huazhong University of Science & Technology Press: Wuhan, China, 2018. (In Chinese) [Google Scholar]


| Working Condition | Construction Content | Start Date | Finish Date | Thickness/m |
|---|---|---|---|---|
| 0-1 | Constructed the circular diaphragm wall, excavated the overlying soil layer, and chiseled away the slurry at the top of circular diaphragm wall | 27 June 2022 | 24 July 2022 | 4.14 |
| 0-2 | Excavated the cap beam layer of soil | 25 July 2022 | 30 July 2022 | 2 |
| Constructed the cap beam layer of reinforced concrete | 27 July 2022 | 13 August 2022 | 3 | |
| W1 | Excavated the 1st layer of soil | 10 August 2022 | 21 August 2022 | 3 |
| Constructed the 1st lining layer of reinforced concrete | 16 August 2022 | 25 August 2022 | 3 | |
| W2 | Excavated the 2nd layer of soil | 23 August 2022 | 30 August 2022 | 3 |
| Constructed the 2nd lining layer of reinforced concrete | 26 August 2022 | 5 September 2022 | 3 | |
| W3 | Excavated the 3rd layer of soil | 31 August 2022 | 6 September 2022 | 3 |
| Constructed the 3rd lining layer of reinforced concrete | 6 September 2022 | 12 September 2022 | 3 | |
| W4 | Excavated the 4th layer of soil | 7 September 2022 | 13 September 2022 | 3 |
| Constructed the 4th lining layer of reinforced concrete | 13 September 2022 | 17 September 2022 | 3 | |
| W5 | Excavated the 5th layer of soil | 14 September 2022 | 19 September 2022 | 3 |
| Constructed the 5th lining layer of reinforced concrete | 18 September 2022 | 23 September 2022 | 3 | |
| W6 | Excavated the 6th layer of soil | 20 September 2022 | 26 September 2022 | 3 |
| Constructed the 6th lining layer of reinforced concrete | 24 September 2022 | 29 September 2022 | 3 | |
| W7 | Excavated the 7th layer of soil | 27 September 2022 | 4 October 2022 | 3 |
| Constructed the 7th lining layer of reinforced concrete | 30 September 2022 | 6 October 2022 | 3 | |
| W8 | Excavated the 8th layer of soil | 5 October 2022 | 10 October 2022 | 3 |
| Constructed the 8th lining layer of reinforced concrete | 7 October 2022 | 12 October 2022 | 3 | |
| W9 | Excavated the 9th layer of soil | 11 October 2022 | 15 October 2022 | 3 |
| Constructed the 9th lining layer of reinforced concrete | 13 October 2022 | 18 October 2022 | 3 | |
| W10 | Excavated the 10th layer of soil | 16 October 2022 | 22 October 2022 | 3 |
| Constructed the 10th lining layer of reinforced concrete | 19 October 2022 | 25 October 2022 | 3 | |
| W11 | Excavated the 11th layer of soil | 23 October 2022 | 28 October 2022 | 3 |
| Constructed the 11th lining layer of reinforced concrete | 26 October 2022 | 1 November 2022 | 3 | |
| W12 | Excavated the 12th layer of soil | 29 October 2022 | 5 November 2022 | 3 |
| Constructed the 12th lining layer of reinforced concrete | 2 November 2022 | 8 November 2022 | 3 | |
| W13 | Excavated the 13th layer of soil | 6 November 2022 | 11 November 2022 | 3 |
| Constructed the 13th lining layer of reinforced concrete | 9 November 2022 | 17 November 2022 | 3 | |
| W14 | Excavated the 14th layer of soil | 12 November 2022 | 25 November 2022 | 3 |
| Constructed the 14th lining layer of reinforced concrete | 18 November 2022 | 28 November 2022 | 3 | |
| W15 | Excavated the 15th layer of soil | 26 November 2022 | 5 December 2022 | 3 |
| Constructed the 15th lining layer of reinforced concrete | 29 November 2022 | 30 December 2022 | 3 |
| Code | Classification | Thickness/m | Bulk Density/ (kN/m3) | Young’s Modulus/MPa | Poisson’s Ratio | Cohesion/kPa | Internal Friction Angle/° |
|---|---|---|---|---|---|---|---|
| ① | Silty clay | 1.26 | 18.62 | 129 | 0.3 | 21.5 | 11.3 |
| ② | MSC | 7.6 | 17.64 | 93 | 0.3 | 10.3 | 6.6 |
| ③ | Silt | 16 | 18.5 | 305 | 0.3 | 10 | 20 |
| ④ | Fine sand | 14 | 19 | 341 | 0.3 | 0 | 24 |
| ⑤ | FBS | 2 | 22 | 975 | 0.3 | 0 | 45 |
| ⑥ | HWAS | 3 | 22.83 | 1227 | 0.2 | 150 | 25 |
| ⑦ | WCC | 2.1 | 23.03 | 4117 | 0.2 | 200 | 40 |
| ⑧ | MCAS | 11.54 | 23.42 | 4408 | 0.2 | 200 | 30 |
| Monitoring Item | Monitoring Frequency | ||
|---|---|---|---|
| Excavation 0 m~15 m | Excavation 15 m~30 m | Excavation 30 m~45 m | |
| Radial displacement monitoring | Once/3 d | Once/2 d | Once/d |
| Circumferential stress monitoring | Once/3 d | Once/2 d | Once/d |
| Method | EMRD | PCS /% | P /m | EMCS /Mpa | PCS /% | P /m | EMVPBM /kN·m | PCS /% | P /m | EMVMBM /kN·m | PCS /% | P /m |
|---|---|---|---|---|---|---|---|---|---|---|---|---|
| Site monitoring | 11.6 | - | 35 | 2.973 | - | 29 | 2074.5 | - | 34 | −1328.1 | - | 46 |
| CCSTCM | 10.1 | 87.1 | 32 | 2.521 | 84.8 | 32 | 1632.2 | 78.7 | 32 | −1269.8 | 95.6 | 46 |
| FENSM | 9.7 | 83.6 | 32 | 2.375 | 79.9 | 32 | 1518.0 | 73.2 | 32 | −1183.9 | 89.1 | 46 |
Disclaimer/Publisher’s Note: The statements, opinions and data contained in all publications are solely those of the individual author(s) and contributor(s) and not of MDPI and/or the editor(s). MDPI and/or the editor(s) disclaim responsibility for any injury to people or property resulting from any ideas, methods, instructions or products referred to in the content. |
© 2023 by the authors. Licensee MDPI, Basel, Switzerland. This article is an open access article distributed under the terms and conditions of the Creative Commons Attribution (CC BY) license (https://creativecommons.org/licenses/by/4.0/).
Share and Cite
Wang, L.; Shao, G. Force Analysis of Circular Diaphragm Wall Based on Circular Cylindrical Shell Theory. Appl. Sci. 2023, 13, 4450. https://doi.org/10.3390/app13074450
Wang L, Shao G. Force Analysis of Circular Diaphragm Wall Based on Circular Cylindrical Shell Theory. Applied Sciences. 2023; 13(7):4450. https://doi.org/10.3390/app13074450
Chicago/Turabian StyleWang, Lin, and Guojian Shao. 2023. "Force Analysis of Circular Diaphragm Wall Based on Circular Cylindrical Shell Theory" Applied Sciences 13, no. 7: 4450. https://doi.org/10.3390/app13074450