Article

Assessment of Deformation Flow in 1050 Aluminum Alloy by the Implementation of Constitutive Model Parameters

by
János György Bátorfi
1,2,*,
Gyula Pál
1,2,
Purnima Chakravarty
1,2 and
Jurij J. Sidor
1,*
1
Savaria Institute of Technology, Faculty of Informatics, Eötvös Loránd University (ELTE), Károlyi Gáspár tér 4, 9700 Szombathely, Hungary
2
Doctoral School of Physics, Faculty of Natural Sciences, Eötvös Loránd University (ELTE), P.O. Box 32, 1518 Budapest, Hungary
*
Authors to whom correspondence should be addressed.
Appl. Sci. 2023, 13(7), 4359; https://doi.org/10.3390/app13074359
Submission received: 26 February 2023 / Revised: 25 March 2023 / Accepted: 29 March 2023 / Published: 29 March 2023
(This article belongs to the Special Issue Alloys: Evolution of Microstructure and Texture)

Abstract

:

Featured Application

The manuscript describes the determination of the constitutive model parameters by a tensile test, while the validation of the material constants is performed by a simulation and experimental verification of the strain distribution during the symmetric and asymmetric rolling processes. A further validation was performed by modeling a depth-sensing indentation process.

Abstract

The behavior of technically pure aluminum was examined, and this investigation allowed the determination of the material constants by various models. The model parameters derived were subsequently used for the finite element simulations (FEM) of a cold rolling process. To determine the tuning parameters such as the strain-hardening coefficient K, strain-hardening exponent n, or elastic constant E, a tensile test was performed on the heat-treated sheet of 1050 Al alloy and the experimentally observed deformation behavior was compared to the simulated counterpart. The results of the FEM calculations reveal that the strain-hardening characteristics can be alternatively derived from the Brinell indentation. Additionally, the determined constitutive model parameters (E = 69.8 GPa, K = 144.6 MPa, and n = 0.3) were verified by simulating both the symmetric and asymmetric rolling processes. The distribution of the equivalent strain across the sheet thickness was computed by the FEM, and it was found that the modeled deformation profiles tend to reproduce the experimentally observed ones with high accuracy for different strain modes inasmuch as the mentioned rolling trials accommodate diverse amounts of shear and normal strain components.

1. Introduction

A vast variety of numerical models are used to investigate the evolution of thte microstructure in a deformed material or to assess the distribution of strain/stress in a particular direction. The most widely used finite element approaches are based on the principles of continuum mechanics. However, these numerical methods demand information on the behavior of the material during elastic/plastic deformation. In view of this, a whole spectrum of constitutive models was developed. These material models [1,2,3,4,5,6] describe analytically the relationship between the strain, strain rate, temperature, and other technological parameters. Depending on both the complexity of the algorithm and the number of examined parameters, the accuracy of the constitutive laws can differ from each other. For an effective numerical calculation, a relatively simple but accurate and physically sound approach is of particular importance. Various analytical equations, which relate strain and stress, are incorporated in the frame of finite element modeling. Typical examples are Ramberg–Osgood [3,4], bilinear [5,6], cubic [5,6], and linear hardening [7] material models. The plasticity approximations, such as Johnson–Cook-type models [8,9] (see Equation (1)), are capable of capturing the effect of temperature T and the strain rate on hardening. However, the major drawback of these type of descriptive models is that the determination of the fitting parameters requires numerous experiments as given below:
σ = σ 00 + B ε p l n 1 + C ln ε ˙ ε ˙ r e f 1 T T r e f T m T r e f m ,
where σ is equivalent stress, εpl is the plastic strain, ε ˙ is a strain rate, T is the temperature, σ00 is the yield stress, B is the hardening variable, n is the hardening exponent, ε ˙ r e f is the reference strain rate, C is the strain-rate sensitivity factor, Tref is the reference temperature, Tm is the melting point of the material, and m* is the thermal softening factor.
In the case of cold-forming processes, a relatively simple elastoplastic material model is used (Ramberg–Osgood approximation) [3,4]:
ε t = ε e l + ε p l = σ E + σ K 1 / n ,
where εt is the total strain, εel is the elastic strain, εpl is the plastic strain, σ is the stress, E is the linear elastic modulus, and K is the hardening coefficient in the Hollomon equation [10] (second term of the equation), which takes into account the effect of the strain rate ε ˙ on σ:
σ = K ε n ε ˙ m + σ 0 ,
where the exponent m expresses the dependence of stress on the strain rate, and σ 0 is the stress required to initiate the plastic deformation. It should be noted that, in the case of cold deformation, the effect of the strain rate on stress is negligible, and therefore m is generally assumed to be 0 [11].
All three material constants (E, K, and n) of Equation (2) can be determined from the tensile test. The necking point on the tensile curve can be determined by employing the Considére criterion [12] in the form of Equation (4) [13]. The necking process in metals starts at the advanced stages of tensile testing, leading to a reduced local cross-section:
σ ε = ε n = d σ ε = ε n d ε ,
where εn is the strain at the necking point.
The strain rate dependency can be accounted for by employing the Hart criterion [12]. In the Hollomon model [10], one can use the approach of Reihle [14], which provides a relationship between Hollomon’s theory and the Considére criterion (see Equations (5) and (6)):
n = ε n ,
K = σ B e n n ,
where σB is the maximum value of the engineering stress (it should be noted here that the engineering stress does not account for the reduction of the cross-section during tension, while this phenomenon is taken into consideration by the true stress).
In order to take into account the crystallographic aspect of the deformation in an arbitrary polycrystalline system, it is essential to consider the influence of active slip systems on the hardening rate in each crystal. Generally, this is done by relating the critical resolved shear stress in the given slip system to the resolved shear strain rate of the crystal. Recently, an analytical solution of this hardening rule was developed and applied at the macroscopic level for various metallic materials such as Al alloys, Cu, various steel grades, Ti alloys, high-entropy alloys, etc. [15]. These materials were subjected to different strain modes and their hardening behavior was simulated by the visco-plastic self-consistent model as well as successfully described by the following expression [15]:
σ = σ s a t σ s a t h p a 1 σ s a t ε p l + 1 σ 00 σ s a t 1 a 1 1 a ,
where σ00 is the yield stress, σsat is the saturation stress, hp is the hardening parameter, and a is a function of the strain-hardening exponent. The model parameters σsat, σ00, h, and a are fitted according to the procedure described in [15].
Since material-processing/forming technologies involve plastic deformation, it is of great importance to investigate the behavior of metals beyond the yield stress. In the case of tension, the hardening occurs between the yield and necking points, while an important issue is related to the prediction of failure. The commonly used Johnson–Cook failure model [16] is expressed by Equation (8):
ε f = D 1 + D 2 exp D 3 σ m σ e q 1 + D 4 ln ε ˙ p 1 + D 5 T T r e f T m T r e f ,
where D1D5 are damage-related-type model parameters, σm is the mean stress, ε ˙ p is the plastic strain rate, Tref is the reference temperature, and Tm is the melting point of the material.
The goal of this study is to analyze the available constitutive approaches and derive the model parameters for further finite element simulations of the forming processes. The accuracy of the material parameters will be tested on 1050 aluminum alloy subjected to tensile testing, while the derived material constants will be validated by simulating the cold rolling process and comparing the experimentally observed displacement fields with the simulated ones by FEM.

2. Materials, Experiments, and Numerical Methods

2.1. Material and Experimental Procedures

Commercially available 1050 Al alloy was investigated in the present study. This technically pure alloy (99.5 wt% of Al) contains minimal traces of Fe (max. 0.4 wt%) and Si (max. 0.25 wt%), while the concentration of other alloying elements such as Cu, Mg, Mn, V, and Ti is even lower (~0.05 wt%). The volume fraction of inclusions (large particles, secondary phases with a diameter above one micrometer) is very limited due to the low concentration of alloying elements and, therefore, the bulk of this material is expected to deform homogeneously, implying that the strain concentration will not occur in the vicinity of secondary phases. It should be mentioned here that the homogeneity of deformation cannot be guaranteed through the whole process since both necking in tension and inhomogeneous shear strain distribution in rolling account for the inhomogeneous material flow leading to heterogeneous strain/stress distribution.
The alloy under consideration was investigated via tensile testing to derive the necessary material constants for various constitutive laws. The simulation of cold symmetric and asymmetric rolling processes by finite element model allowed validation of material parameters. Prior to deformation, the as-received material was heat-treated at 550 °C for 3 min in order to ensure a fully recrystallized and stress-free state. As was already reported, heat treatment at elevated temperatures for a short time ensures a fully recovered microstructure [17].
The tensile test was performed by Zwick Roell Z100 with a speed of 20 mm/min according to EN ISO 6892-1 standard. The gauge length of the tensile sample (l0) was 50 mm while the initial cross-section (A0) was 18.44 mm2. The load cell and the longitudinal extensometer provided information on the change of force and elongation during the test.
The cold rolling was performed on a laboratory rolling mill with a roll diameter of 150 mm. Both symmetric and asymmetric rolling trials were carried out. In order to introduce an asymmetry to the conventional rolling process, the angular velocity of the upper and lower rolls was varied.

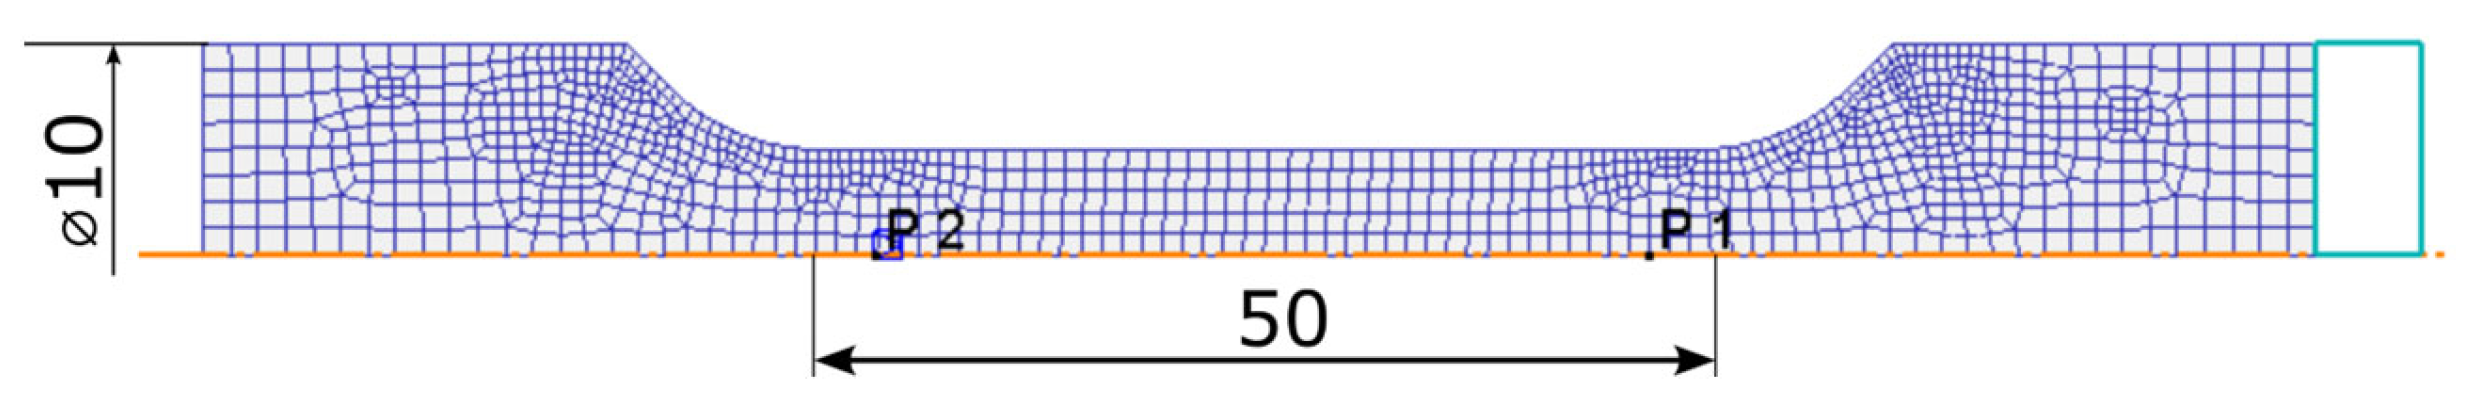
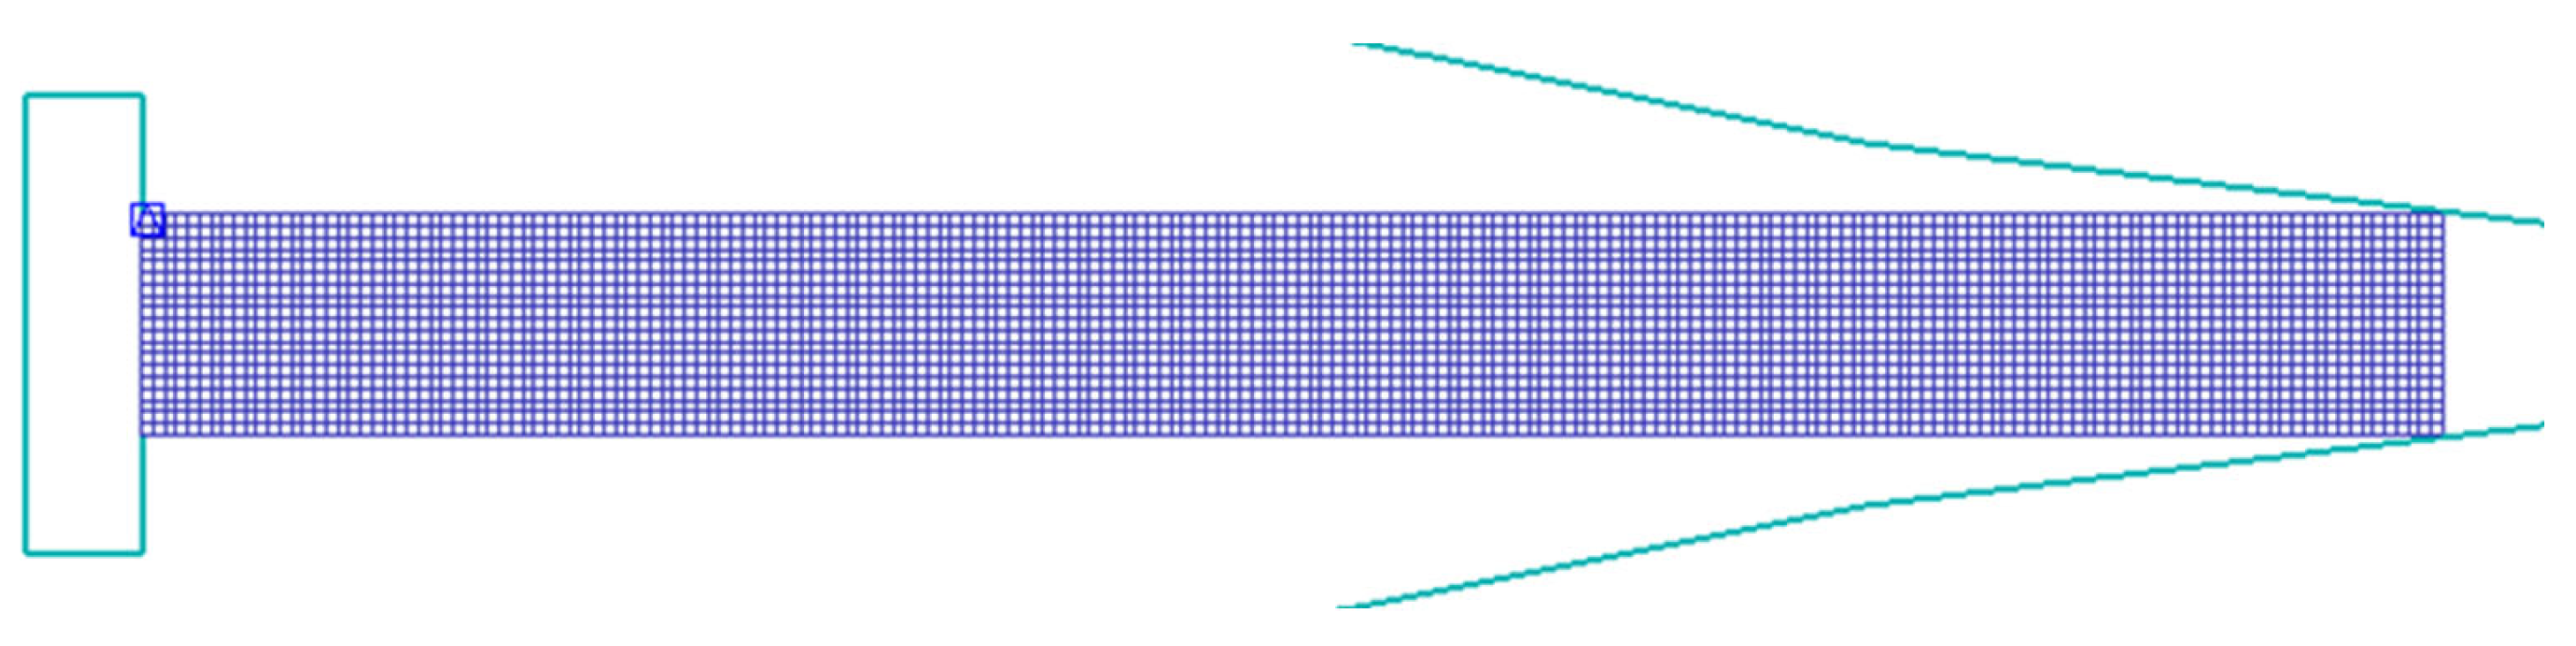
2.2. Finite Element Modeling of Tensile Test

The behavior of a material can be tested under various strain modes and, in the first instance, the finite element modeling of the tensile test was performed with the specimen geometry shown in Figure 1. The displacements were evaluated between points P1 and P2, and the force was applied to the supporting elements “glued” to the cylindrical tensile specimen. The DEFORM 2D© finite element software was employed for modeling the rotationally symmetric components. The simulation was performed for a simplified 2D geometry of the DIN 50125-A 10 × 50 tensile specimen. The gripping of the lower surface of the tensile specimen was replaced by the prescribed y-displacement defined for the lower edge. The calculation of stress and strain values and data post-processing were performed according to procedures described elsewhere [18,19].

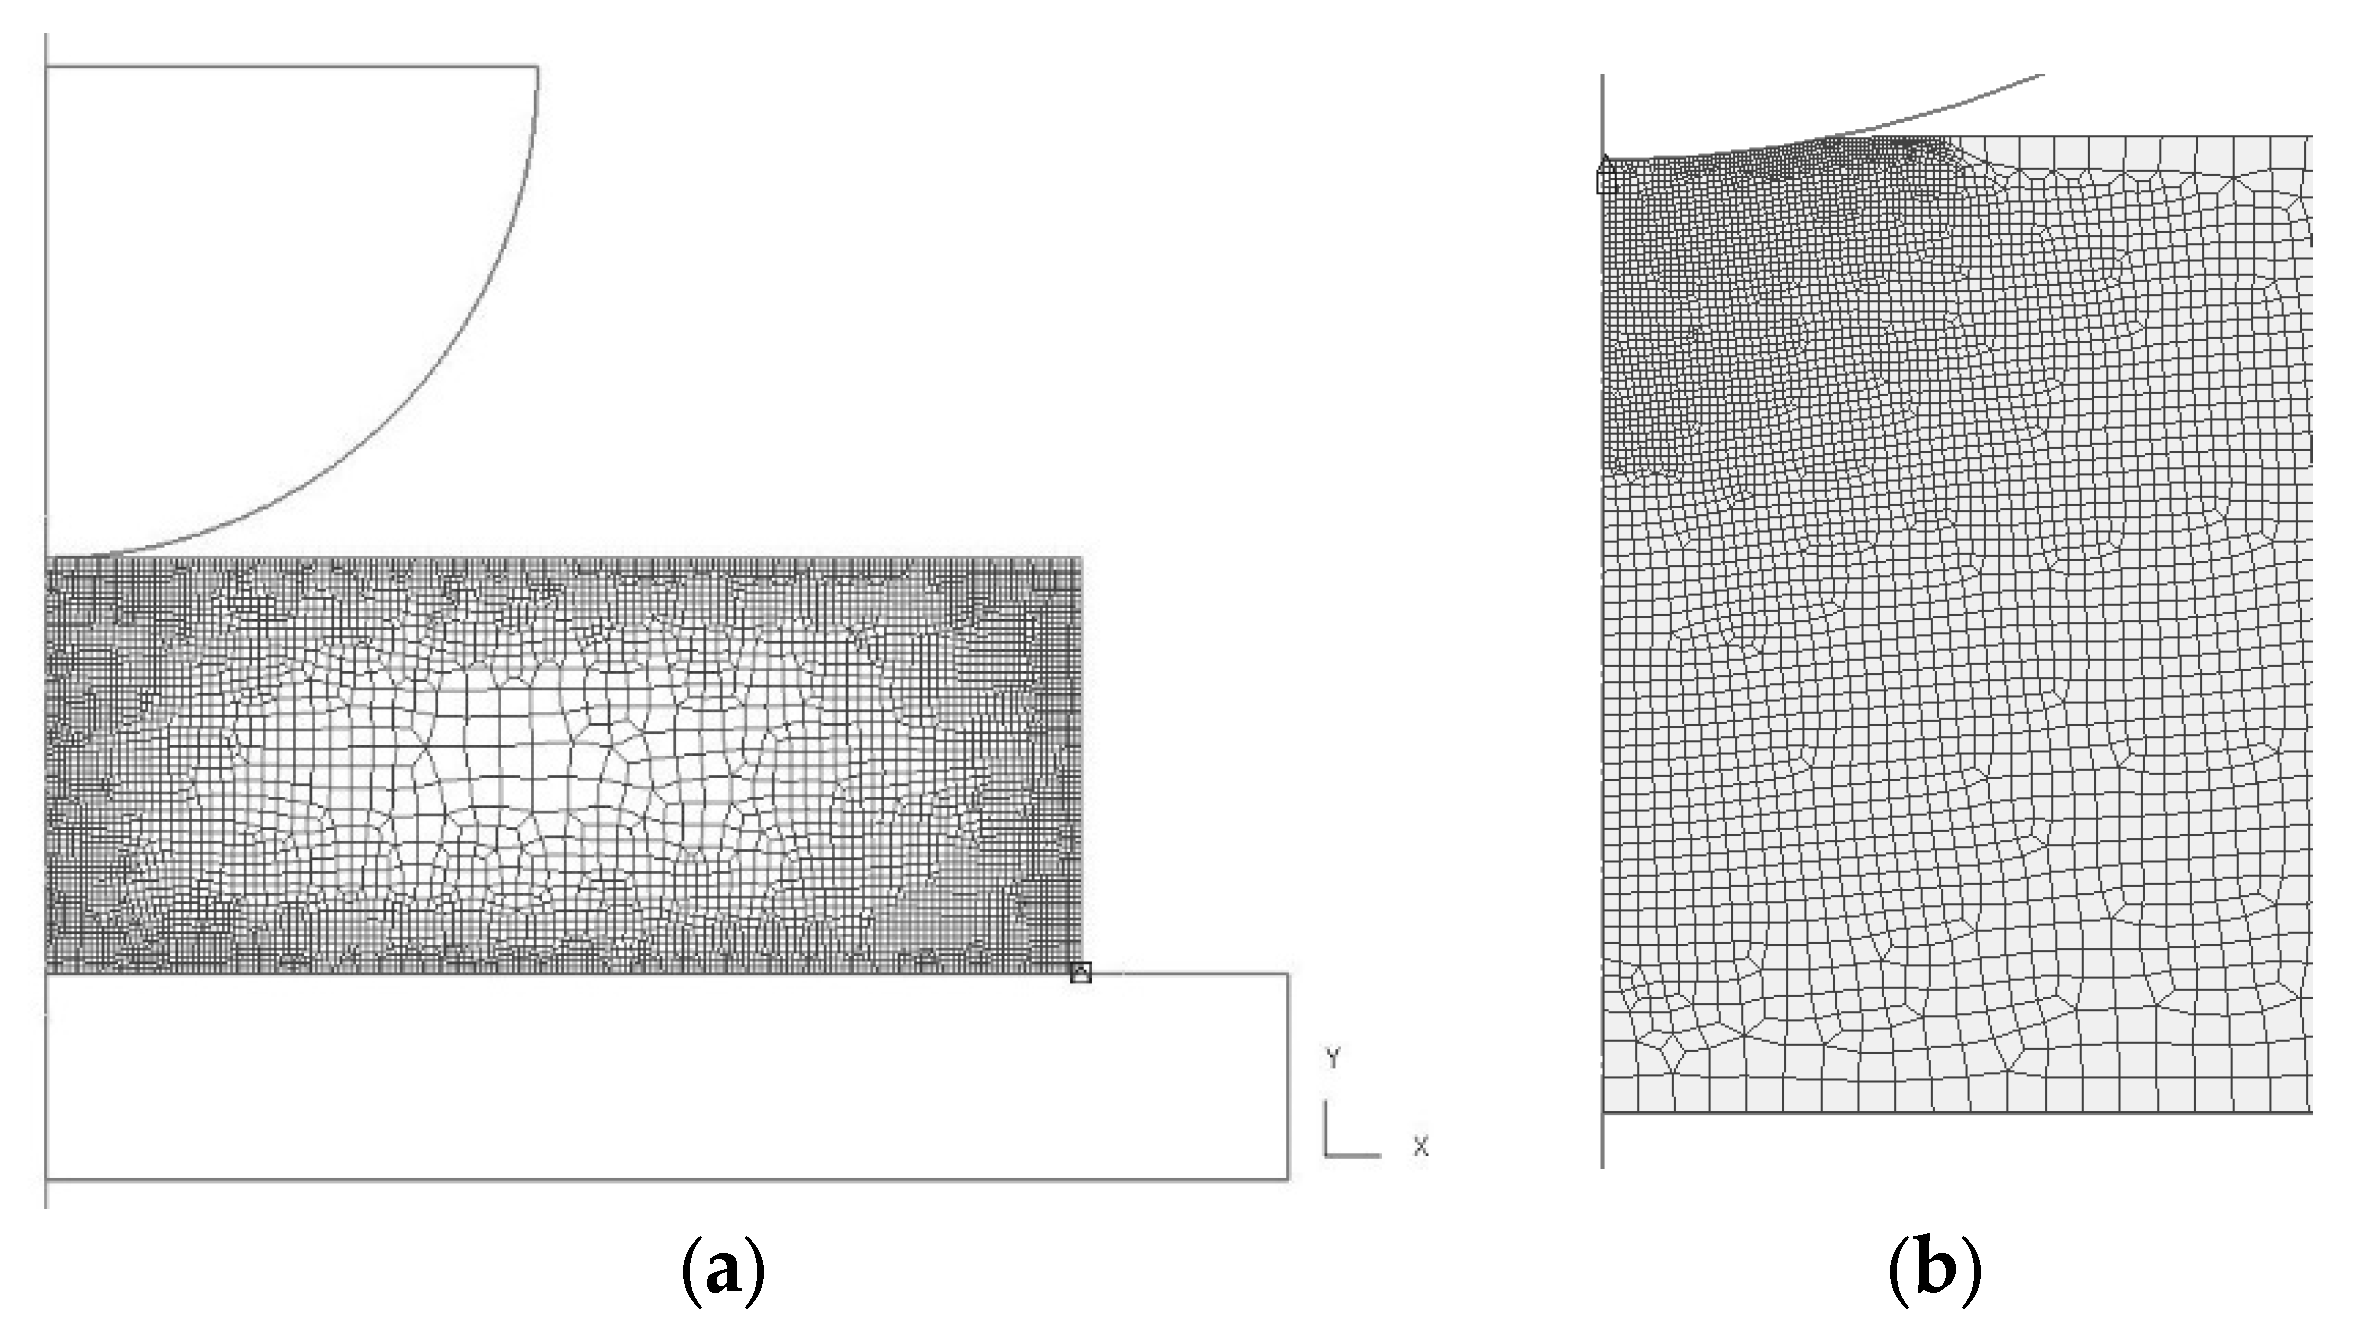
2.3. Finite Element Modeling of Hardness Measurement

Indentation techniques are widely used for the assessment of hardness and hardening or softening phenomena in various materials. During the measurement, an indenter with a known geometry is pushed into the surface of the material under a known load, and the size of the indent is measured with a microscope, while the indentation depth is calculated from the displacement values of the indenter [20]. The most common geometries of the indenter are spherical, triangular, or rectangular pyramidal (for Rockwell, Berkovich, and Vickers methods) [20,21]. In the case of the Brinell method, the measurement is done with a spherical indenter [20]. Given the geometric dimensions and the diameter of the indent, the hardness value can be calculated by using Equation (9) [22]:
H B = 2 F π D 2 D 2 d 2   ,
where HB is the Brinell hardness, F is the load force, D is the diameter of the indenter (sphere), and d is the diameter of the indentation, observed on the surface of the investigated material.
The geometrical model used for the FEM simulation is shown in Figure 2a,b.
The diameter d can be assessed from the indentation depth h by Equation (10); however, the measured and calculated values can be somewhat different due to the relaxation of the material after deformation. In our study, we used the back-calculated values to determine both the surface pressure and hardness values.
d = D 2 D 2 h 2 ,
Knowing the load F and the indentation size d, the value of the surface pressure Pm can be estimated as [20]:
P m = 4 F π d 2 ,
The pressure can be fitted with a function expressed by Equation (12) [20]:
P m = k d D p ,
where k is a proportionality factor, and p is an exponent, expressing the slope of the load curve.
According to the results of Sonmez and Demir [20], the values of p in Equation (12) and n in Equation (1) are nearly identical. Donohue et al. [6] showed that there is a link between the hardness and tensile test parameters. The value of k can be determined by the model of Sakai [23]:
P m = 3 K 0.1 d D n ,
In engineering practice, mainly finite element (FEM, [6,16]) and discrete element (DEM, [24,25]) methods are widely used for the simulation of hardness tests. In the present case, FEM was employed, and the calculation method is based on the minimization of the virtual plastic work according to Equation (14) [26].
π = V σ ¯ ε ¯ ˙ d V + V λ ε ˙ V d V + S F ¯ i v ¯ i d S ,
where π is the value of virtual work, σ ¯ is the mean stress, ε ¯ ˙ is the mean strain rate, λ is the average stress value in the cell, ε ˙ V is the volumetric strain rate, F ¯ i is the vectorial form of force acting on the surface of the element, and v ¯ i is the sliding velocity of the surface element.
The simulations of Brinell hardness were carried out by means of DEFORM 2D© software, which is suitable for modeling the elastoplastic processes [26,27]. The study was performed on the fine-meshed workpiece geometry, shown in Figure 2b. To simplify the model, 2D rotationally symmetric geometries were assumed while both the indenter (sphere) and the lower support disc were assumed to be infinitely rigid bodies. The load function was divided into 200 equal steps. The initial mesh was generated by considering the geometry of the indent (sphere with a diameter of 3 mm) and updated every 20 steps to account for accurate strain and curvature caused by the indentation. The friction coefficient between the indenter and the workpiece was set to 0.12 [27].
The material model employed in finite element calculations can be specified in several ways. The general description accounts for the estimation of strain, strain rate, and stress, based on the available database (presented in the form of a table with given strain, strain rate, and stress values, while the intermediate values are approximated). Another possibility to describe the behavior of the material during plastic deformation is to employ a parametric model [28]. The latter was used in our FEM studies.

2.4. Finite Element Modeling of Symmetric and Asymmetric Rolling

The behavior of 1050 Al alloy was additionally examined during both symmetric and asymmetric cold rolling processes. In asymmetric rolling, the speed of the upper and lower rolls was different, while the roll diameters are identical. In the case of symmetric rolling, the velocities of the upper and lower rolls are typically equal, so the introduced shear component is concentrated within a very thin surface layer and is significantly lower compared to the case of asymmetric rolling [29]. The advantage of asymmetric rolling is that a significant shear deformation can be introduced to the rolled material in addition to the normal component, which is characteristic of symmetric rolling. The calculation of the strain components during rolling is based on the analysis described elsewhere [30,31,32,33,34]:
ε = h i h f h i ,
γ = d z d x ,
ε s = 2 1 ε 2 ε 2 ε γ l n 1 1 ε ,
ε v M = 4 3 l n 1 1 ε 2 + ε s 2 3 ,
where hi is the initial thickness of the sheet, hf is the final thickness of the sheet, ε is the thickness reduction, z represents the normal direction of the rolled sheet, x corresponds to the rolling direction, γ is the derivative of displacement of the sheet in the rolling direction, εs is the shear strain, and εvM is the equivalent strain.
The cold rolling trials were simulated with the material model set-up identical to the one used for the simulation of tensile test. To evaluate the deformation flow across the thickness of a rolled sheet, a grid made of Vickers indents was introduced on the polished plane of transverse direction (cf. infra). The relative displacements of the indents (caused by rolling) with respect to each other were measured by optical microscopy, and the obtained displacement profiles were compared with the ones computed by means of FEM.
The geometry of the roll-gap, used for FEM simulation, is shown in Figure 3. The elasto-plastic workpiece (sheet) was deformed by two rigid rolls. At the beginning of the rolling process, the sheet is moved toward the roll-gap by an infinitely rigid rectangular object. During FEM simulation, the 2D plane-strain condition was imposed, implying that there is no deformation in the transverse direction. This boundary condition is physically sound since cold rolling does not account for widening.
The characteristic value of friction coefficient, necessary for cold rolling, is a function of the roll-gap geometry [35,36] and can be calculated by Equation (19). However, the real value might be additionally influenced by the roughness of the rolls, the relative sliding speed, or the temperature of the deformed material [37,38,39]:
μ = k 1 μ m i n = k 1 2 h f R l n h 0 h f + 1 4 h 0 h f R t a n 1 h 0 h f 1 ,
where μ is the actual coefficient of friction, and k1 is the coefficient of proportionality between the theoretical minimum value of μ necessary for rolling [35] and the actual (real) one (k1~1.1–1.5 [40,41]).
The technological parameters of rolling are presented in Table 1.

3. Results and Discussion
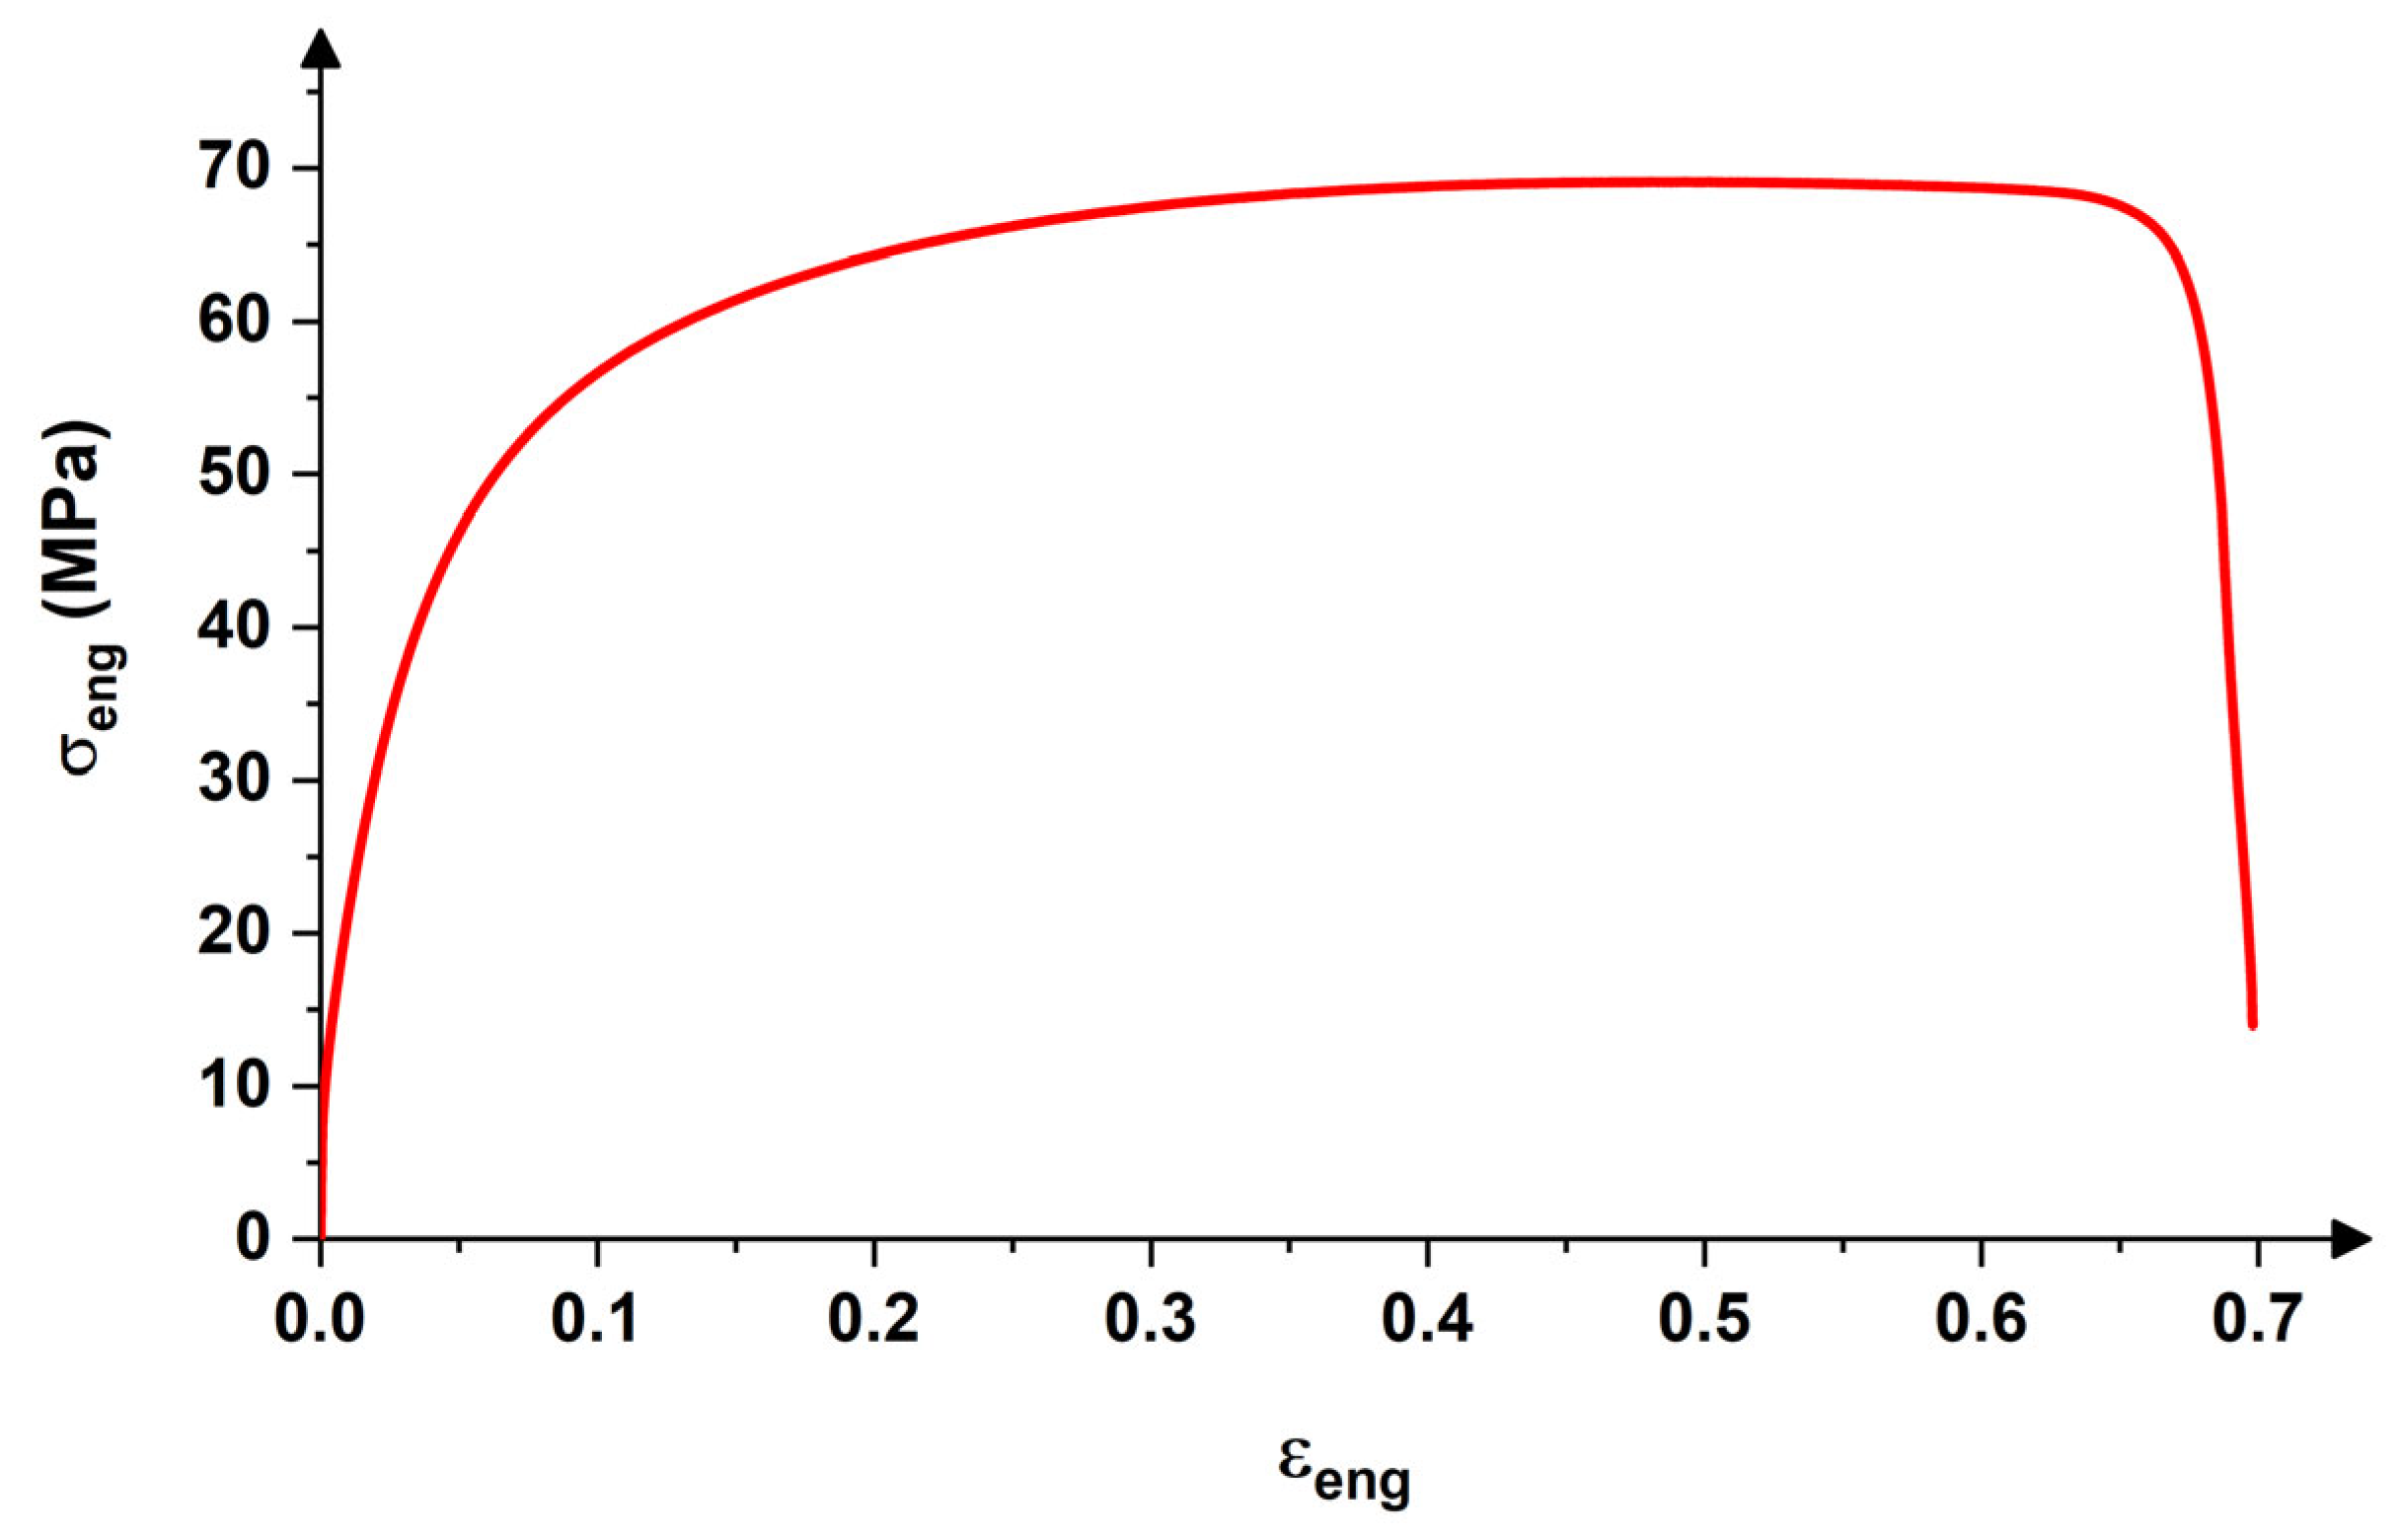
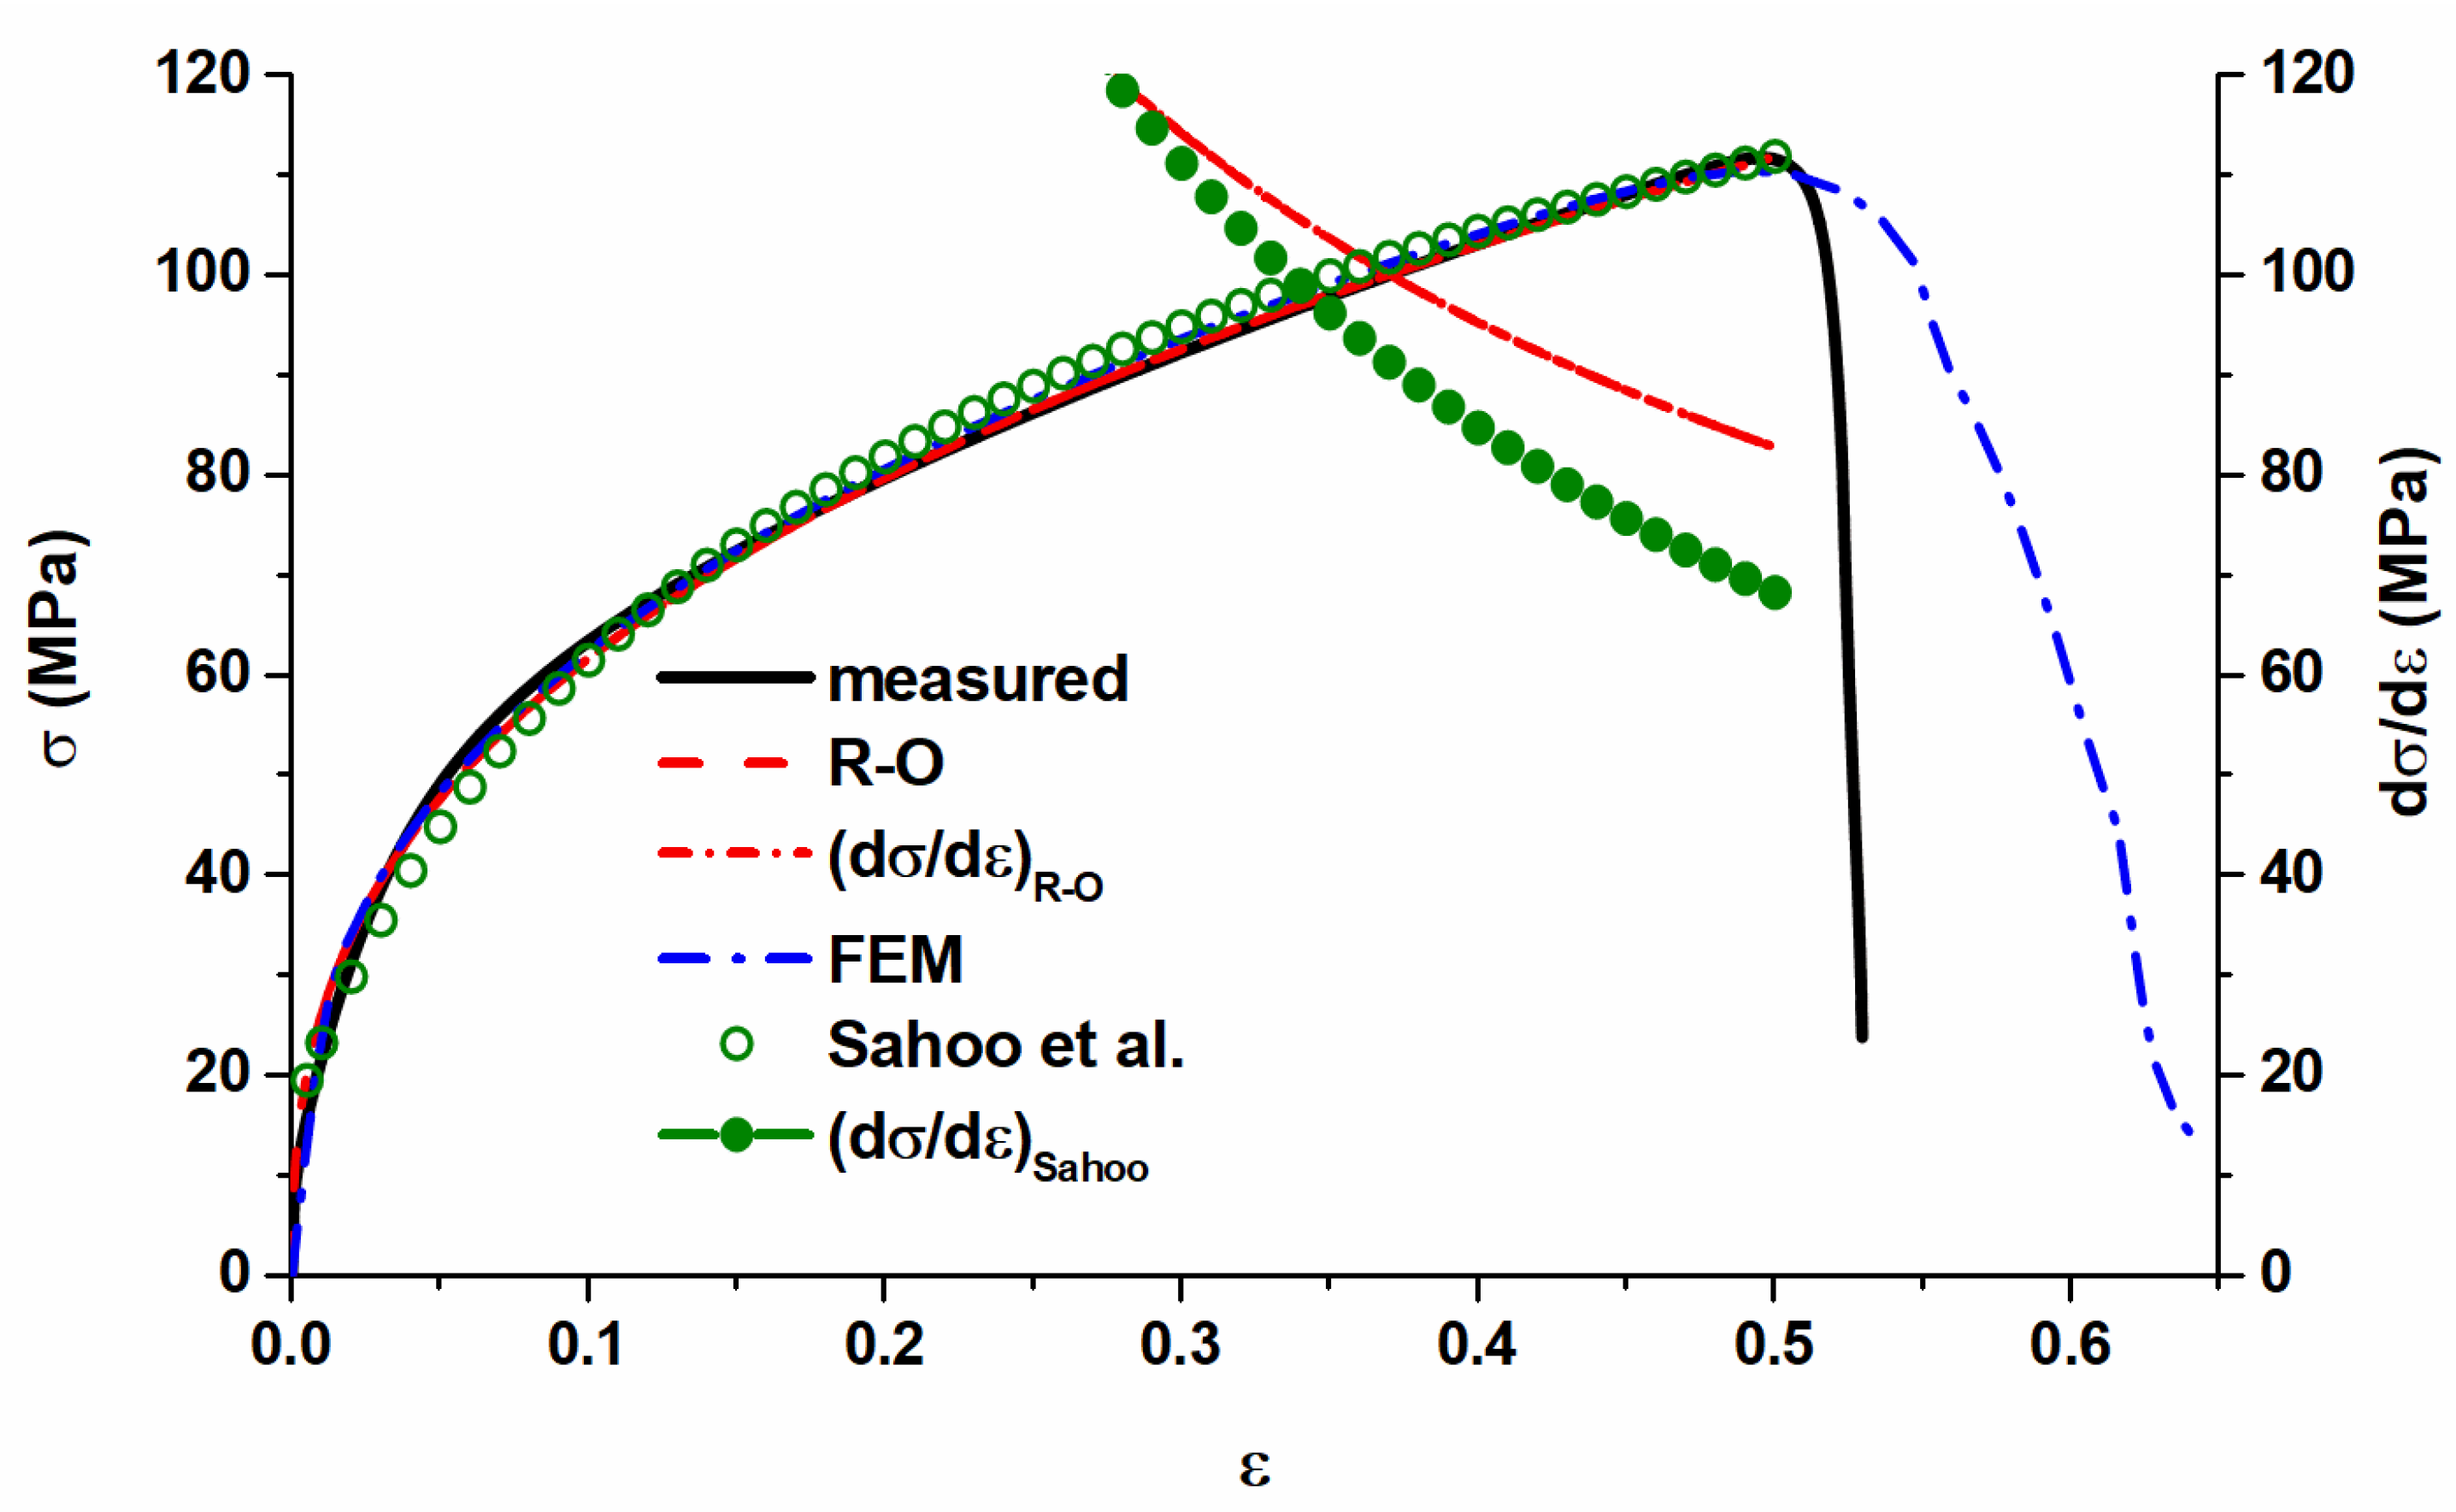
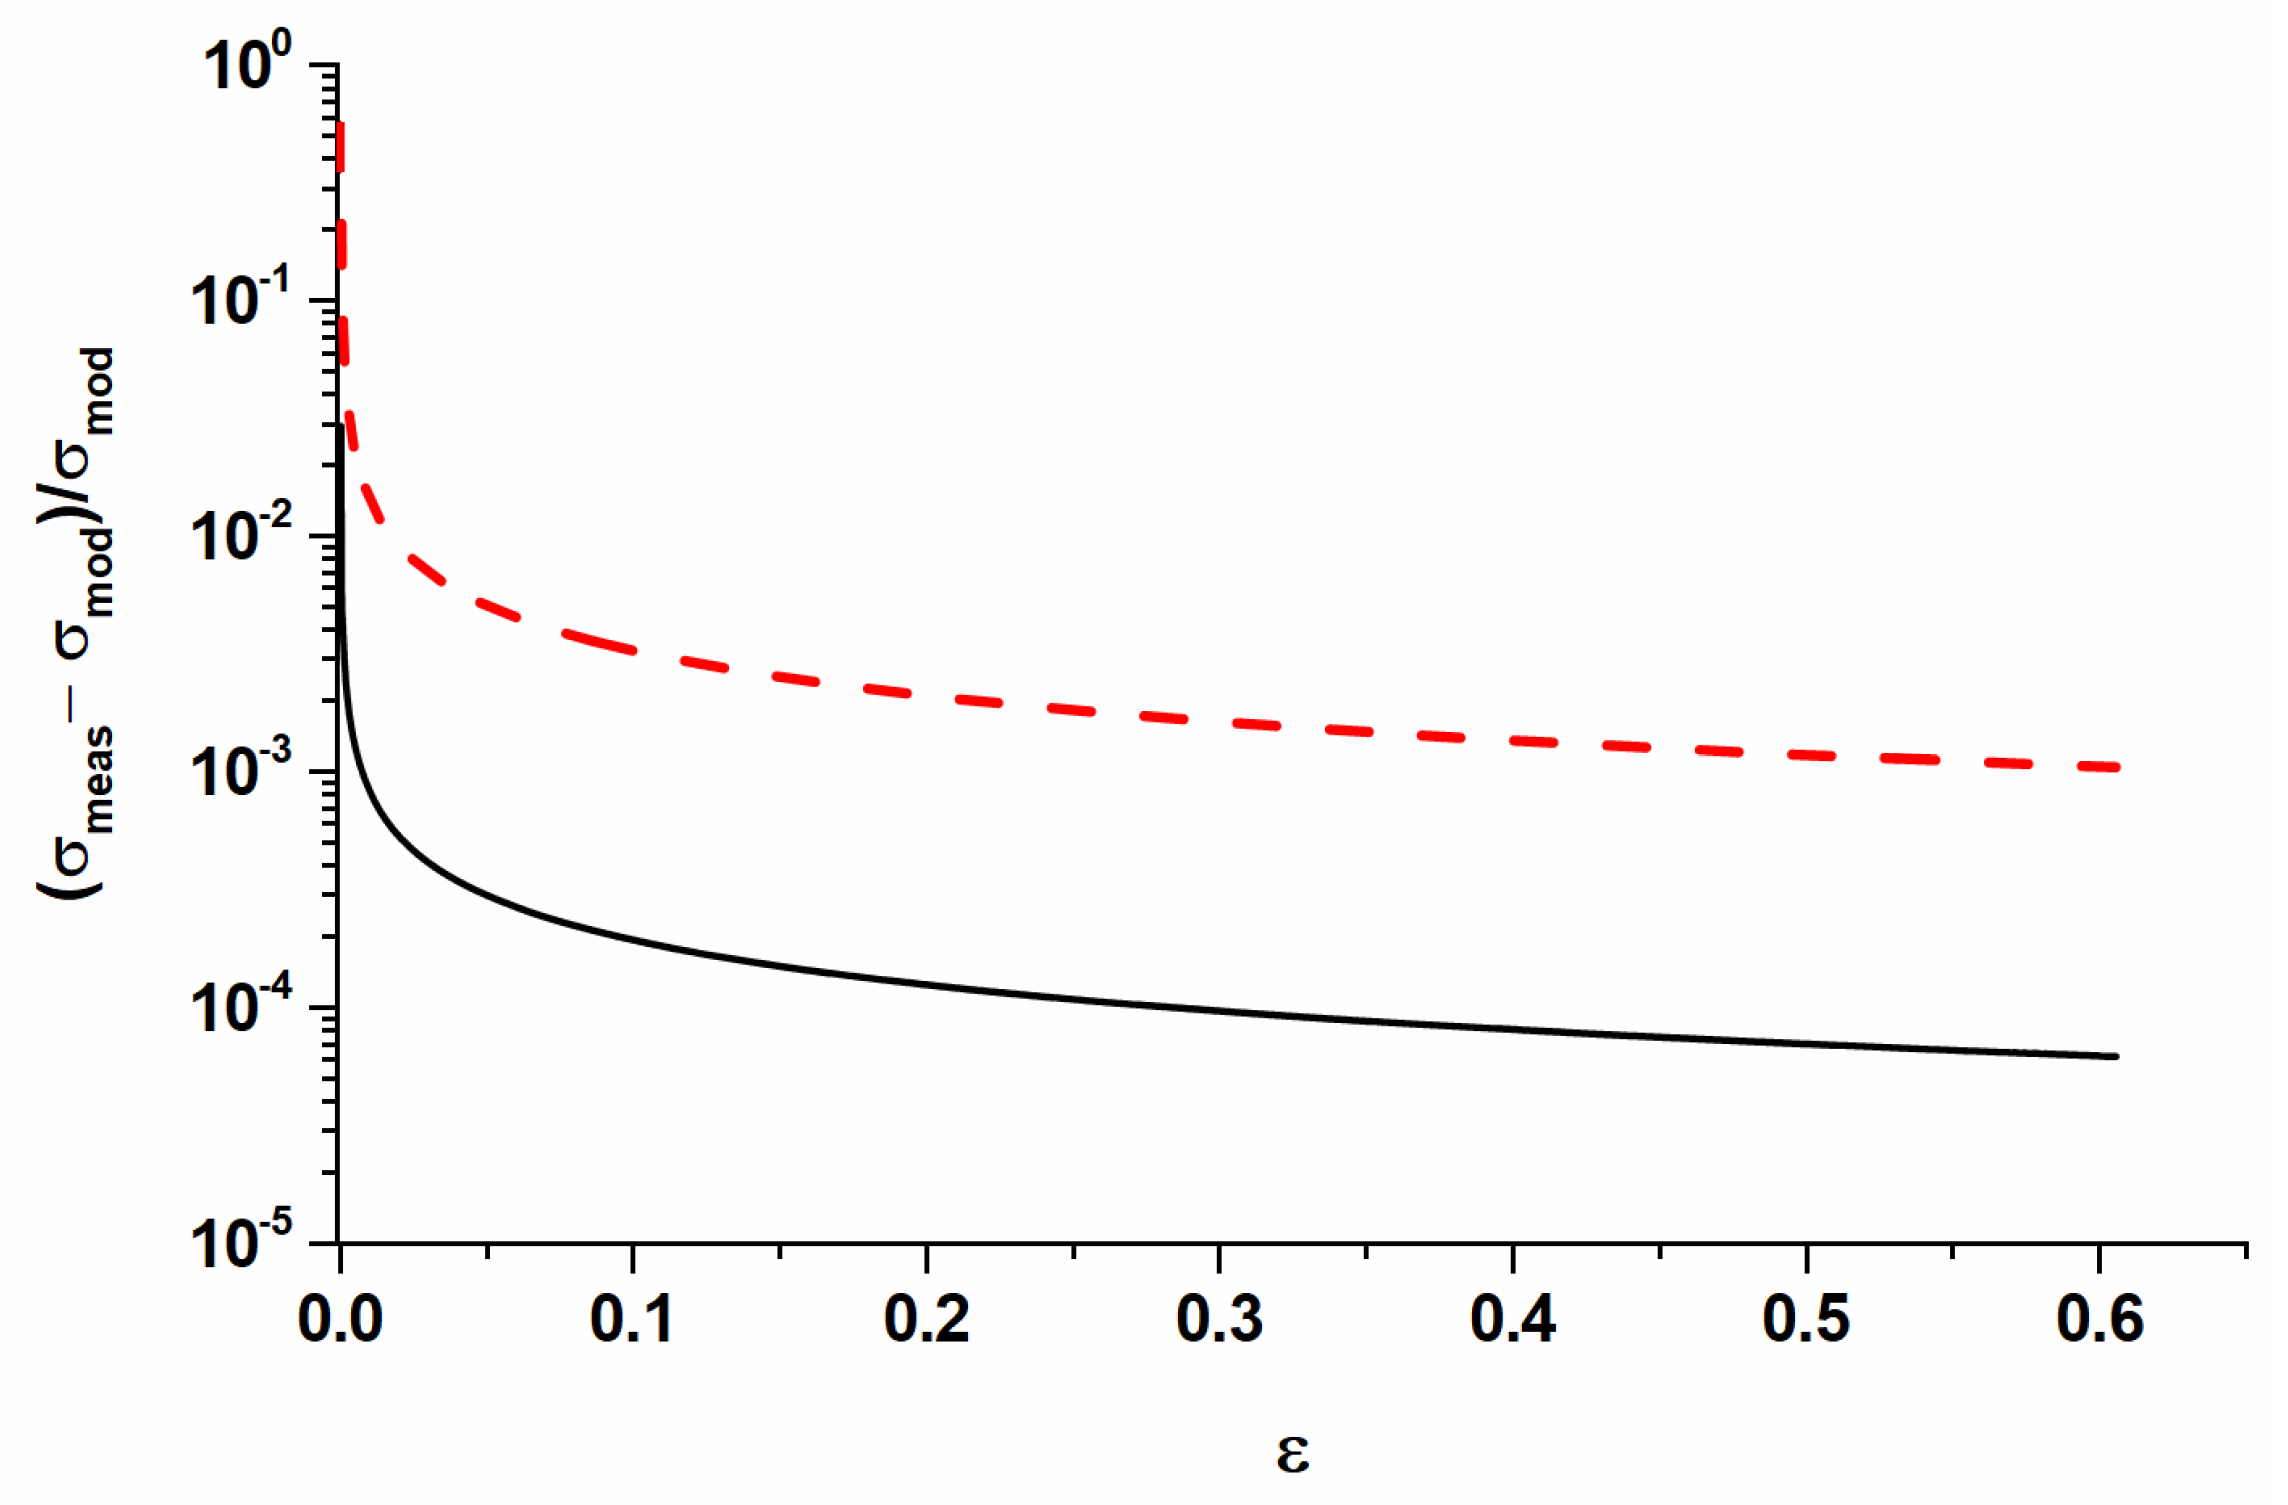
The validity of the material model was tested for different strain modes, whereas the evaluation of each test is performed separately.

3.1. Tensile Test

The change of length with elongation during the tensile test enables the calculation of the generally used engineering stress–strain curve (Figure 4). Alternatively, the true stress–strain relation, which better reflects the real nature of deformation compared to the engineering counterparts, can be expressed in the form of the Ramberg–Osgood (R–O) model (see Figure 5). The model parameters of the R–O equation were evaluated from the pre-neck formation stage. As Figure 5 shows, the measured strain–stress diagram can be successfully reproduced by implementing Equation (2) with the fitting parameters listed in Table 2. The peak stress for both the simulated and measured curves is observed at the true strain of 0.49 and this result is consistent with the one reported elsewhere [19], while the yield stress was estimated to be 15.3 MPa.
The engineering stress–strain relation (Figure 4) clearly shows that, when the strain value exceeds ~0.37 (at the max. stress value of 69.11 MPa), the stress shows a declining tendency due to the reduced cross-section. This phenomenon can be foreseen by using Equation (4), which predicts the formation of necking. The dσ/dε relation plotted together with the true stress–strain curve (see Figure 5) reveals that the formation of necking occurs at the straining level of 0.3703. Table 2 shows that the Ramberg–Osgood model parameters (Equation (2)) derived from the experimental data are comparable with the fitting parameters determined for the Hollomon model (Equations (5) and (6)). The difference between the model constants is negligibly small.
As Figure 6 shows, the FEM simulation (blue dash-dotted line) is capable of reproducing the experimental strain–stress curve (continuous line) with great accuracy (correlation coefficient = 0.9996) under the condition that the proper material model is employed. In the present case, the R–O material model (dashed line in Figure 5) was used in the FEM calculations. It is important to underline that the FEM captures the beginning of the neck formation quite accurately (Figure 6). However, the advanced stages of the contraction unfolded by the simulated results reveal some differences with respect to the experimental evidence; i.e., the failure of the investigated alloy occurs earlier compared to the results of the simulation. This discrepancy can be attributed to the fact that the heat-treated 1050 Al alloy is textured and therefore the anisotropy of the plastic strain ratio will affect the contraction. In the case of the isotropic material, the so-called average Lankford value (width-to-thickness reduction ratio or r-value) is equal to one, implying that the deformation is equally distributed in all directions. However, Al alloys are strongly textured with the prevailing {100}<001> component [42] (which is highly anisotropic in terms of the plastic strain ratio), and therefore the resulting r-value in this material will be below one. In turn, this leads to the thinning of a sheet during deformation and, consequently, the textured material fails faster compared to the isotropic one. Furthermore, numerical models are not capable of predicting the formation of voids, which contribute to failure.
The crystallographically resolved hardening is partially accounted for by the analytical description described by Sahoo et al. [15] (see Equation (7)). The tensile strain–stress curve for the 1050 Al alloy can be reproduced with the following model parameters: σsat = 650.8 MPa, σ00 = yield stress = 15.3 MPa, hp = 1255 MPa, and a = 15.5 (correlation coefficient = 0.9984). The hardening rate derived from this approximation predicts the occurrence of necking at a strain of ~0.34 (see Figure 5). The predicted strain value for the neck initiation (~0.34) is slightly underestimated compared to the experimentally observed one (~0.37); however, this model can accurately predict the behavior of a material under different strain modes at the advanced stages of deformation [15], which cannot be captured by tension.
The accuracy of the FEM simulation is affected by the model parameters of Equation (2) as well as by the elastic and plastic components of the Ramberg–Osgood approximation. Figure 7 shows the relative error caused by the neglection of the elastic part in Equation (1). Although the elastic region represents a relatively small part of the stress–strain diagram, it still has a noticeable influence on the accuracy of the simulation, which is shown in Figure 7.

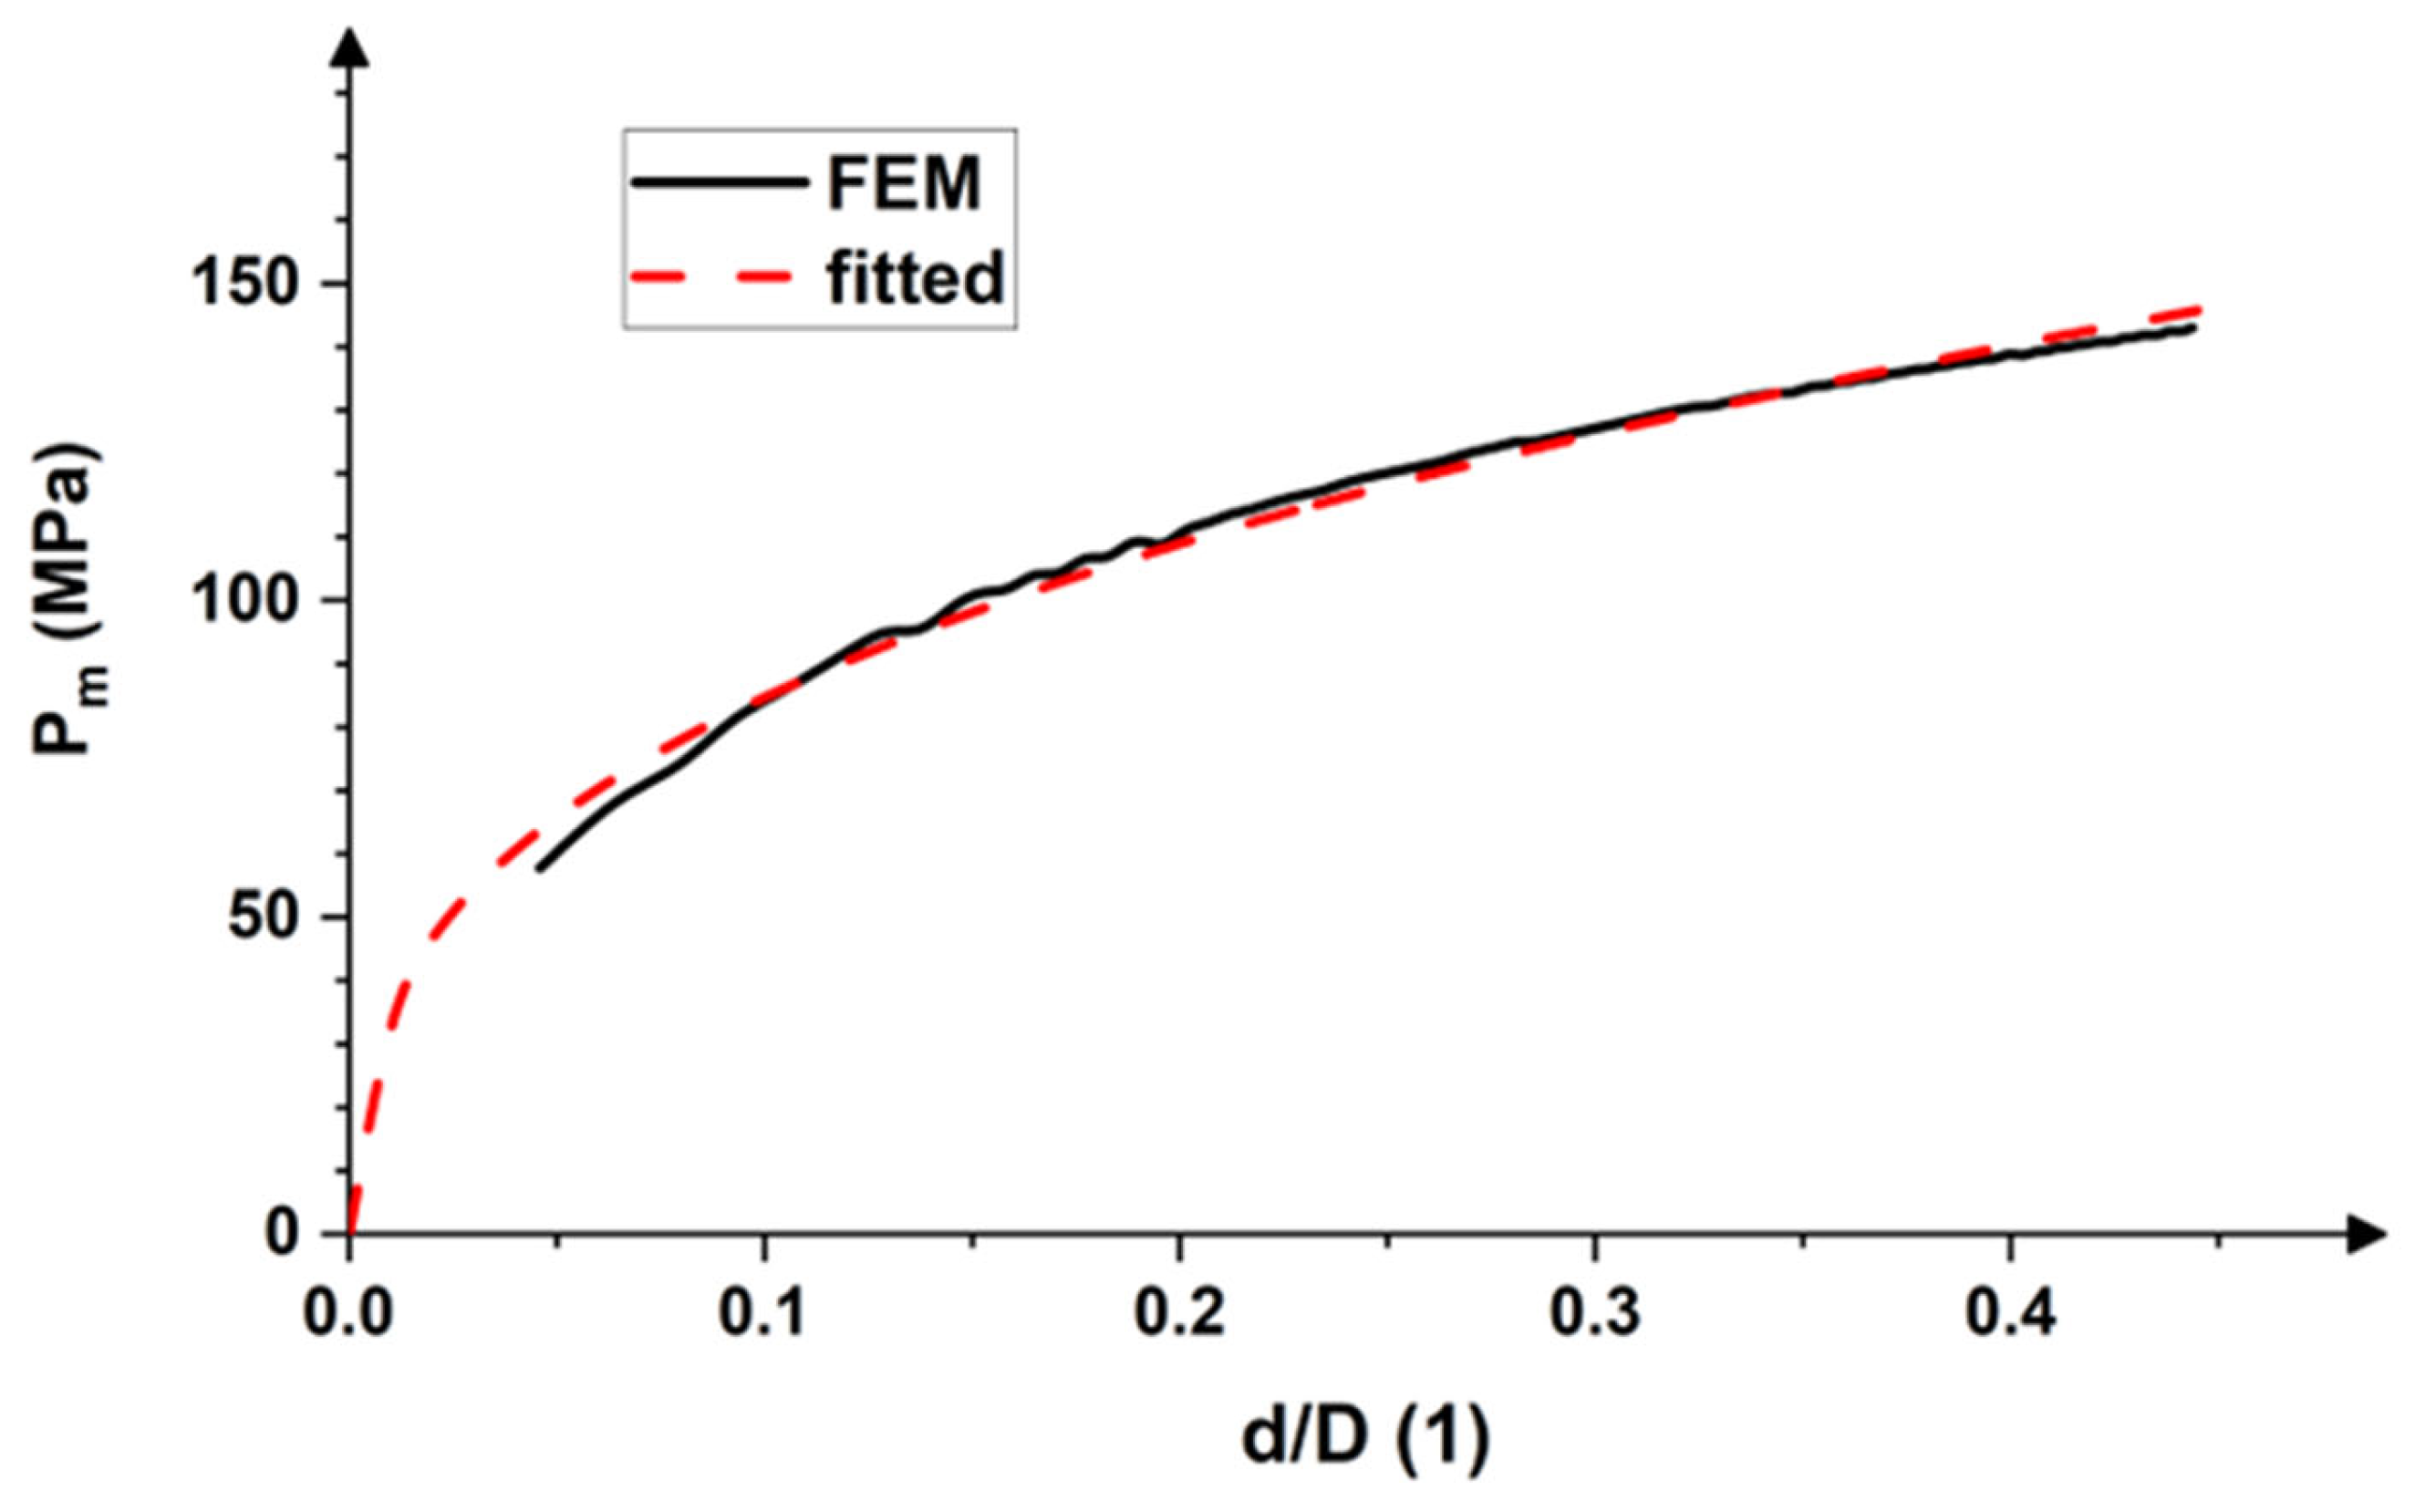
3.2. Defining the Model Parameters from Hardness Simulations

A finite element simulation allows us to investigate the behavior of a material under the applied load. The simulations were carried out for the indenter with a diameter of 3 mm. The investigated sheet with a length of 5 mm and thickness of 2 mm was virtually subjected to different loads. Both the indentation diameter and indentation depth were investigated as a function of the load. In the simulation of the Brinell hardness test, the Hollomon-type material model was employed. In the present case, the strain rate sensitivity was neglected by setting m to 0 in Equation (3) while the elastic part was accounted for by employing Hooke’s law. This implies that the model is valid for quasi-static loads; i.e., the process is neither time- nor velocity-dependent. This approximation can be used for Al alloys at ambient temperature and a relatively low deformation rate since the strain rate sensitivity is negligible under these conditions [43,44]. The material properties used for the simulation are listed in Table 2.
Figure 8 shows the dependence of a surface pressure Pm caused by the indentation-over-d/D ratio (indentation size per indenter size). The FEM simulation reveals a quasi-parabolic profile, which can be described by the following relation [20,23]:
P m = k d D p ,
where k and p are material constants.
As reported by Sakai [23], the model parameters k and p in Equation (20) are functions of the hardening coefficient K and strain-hardening exponent n, which can be derived from the tensile test:
k = 3 K 0.1 n     a n d       p = n
Figure 8 shows an excellent correspondence between the FEM simulated data and counterpart computed by Equations (20) and (21) with the strain-hardening coefficient and strain-hardening exponent listed in Table 2 (K = 144.56 MPa and n = 0.3691). This implies that the material model parameters can be derived from the Brinell hardness test, performed under various loads, and the strain-hardening characteristics can be calculated by employing Equations (20) and (21).

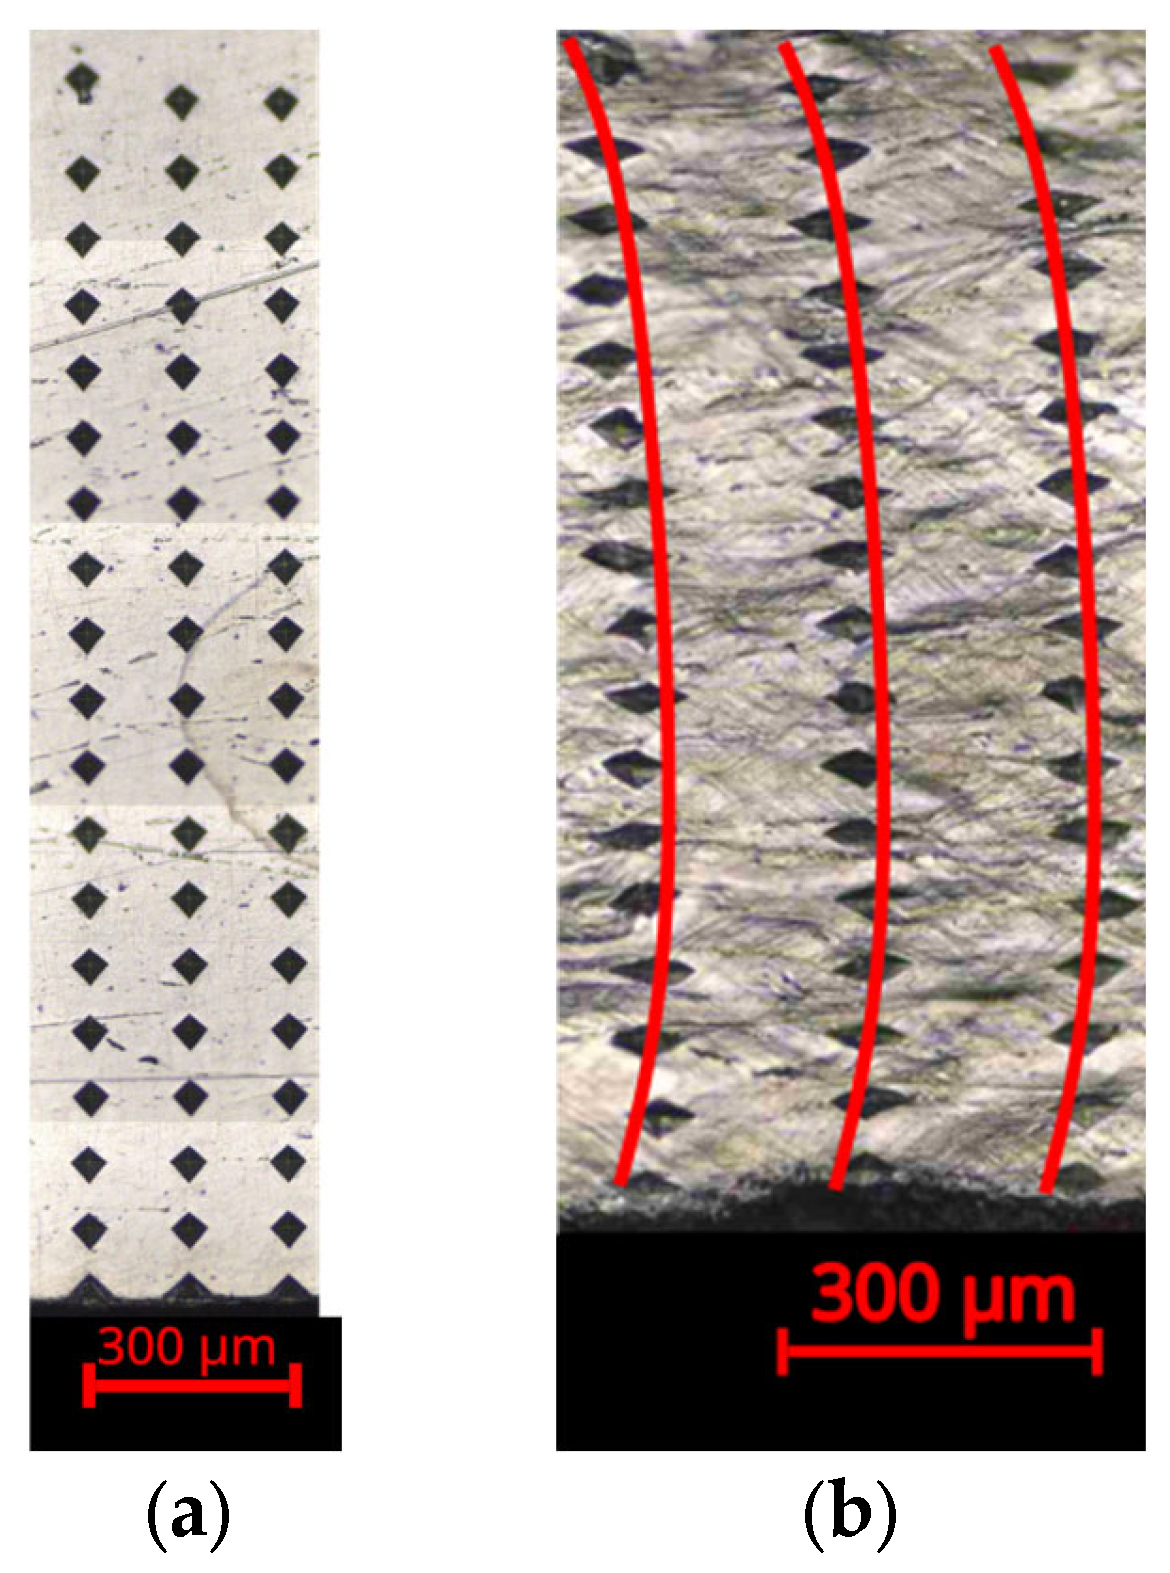
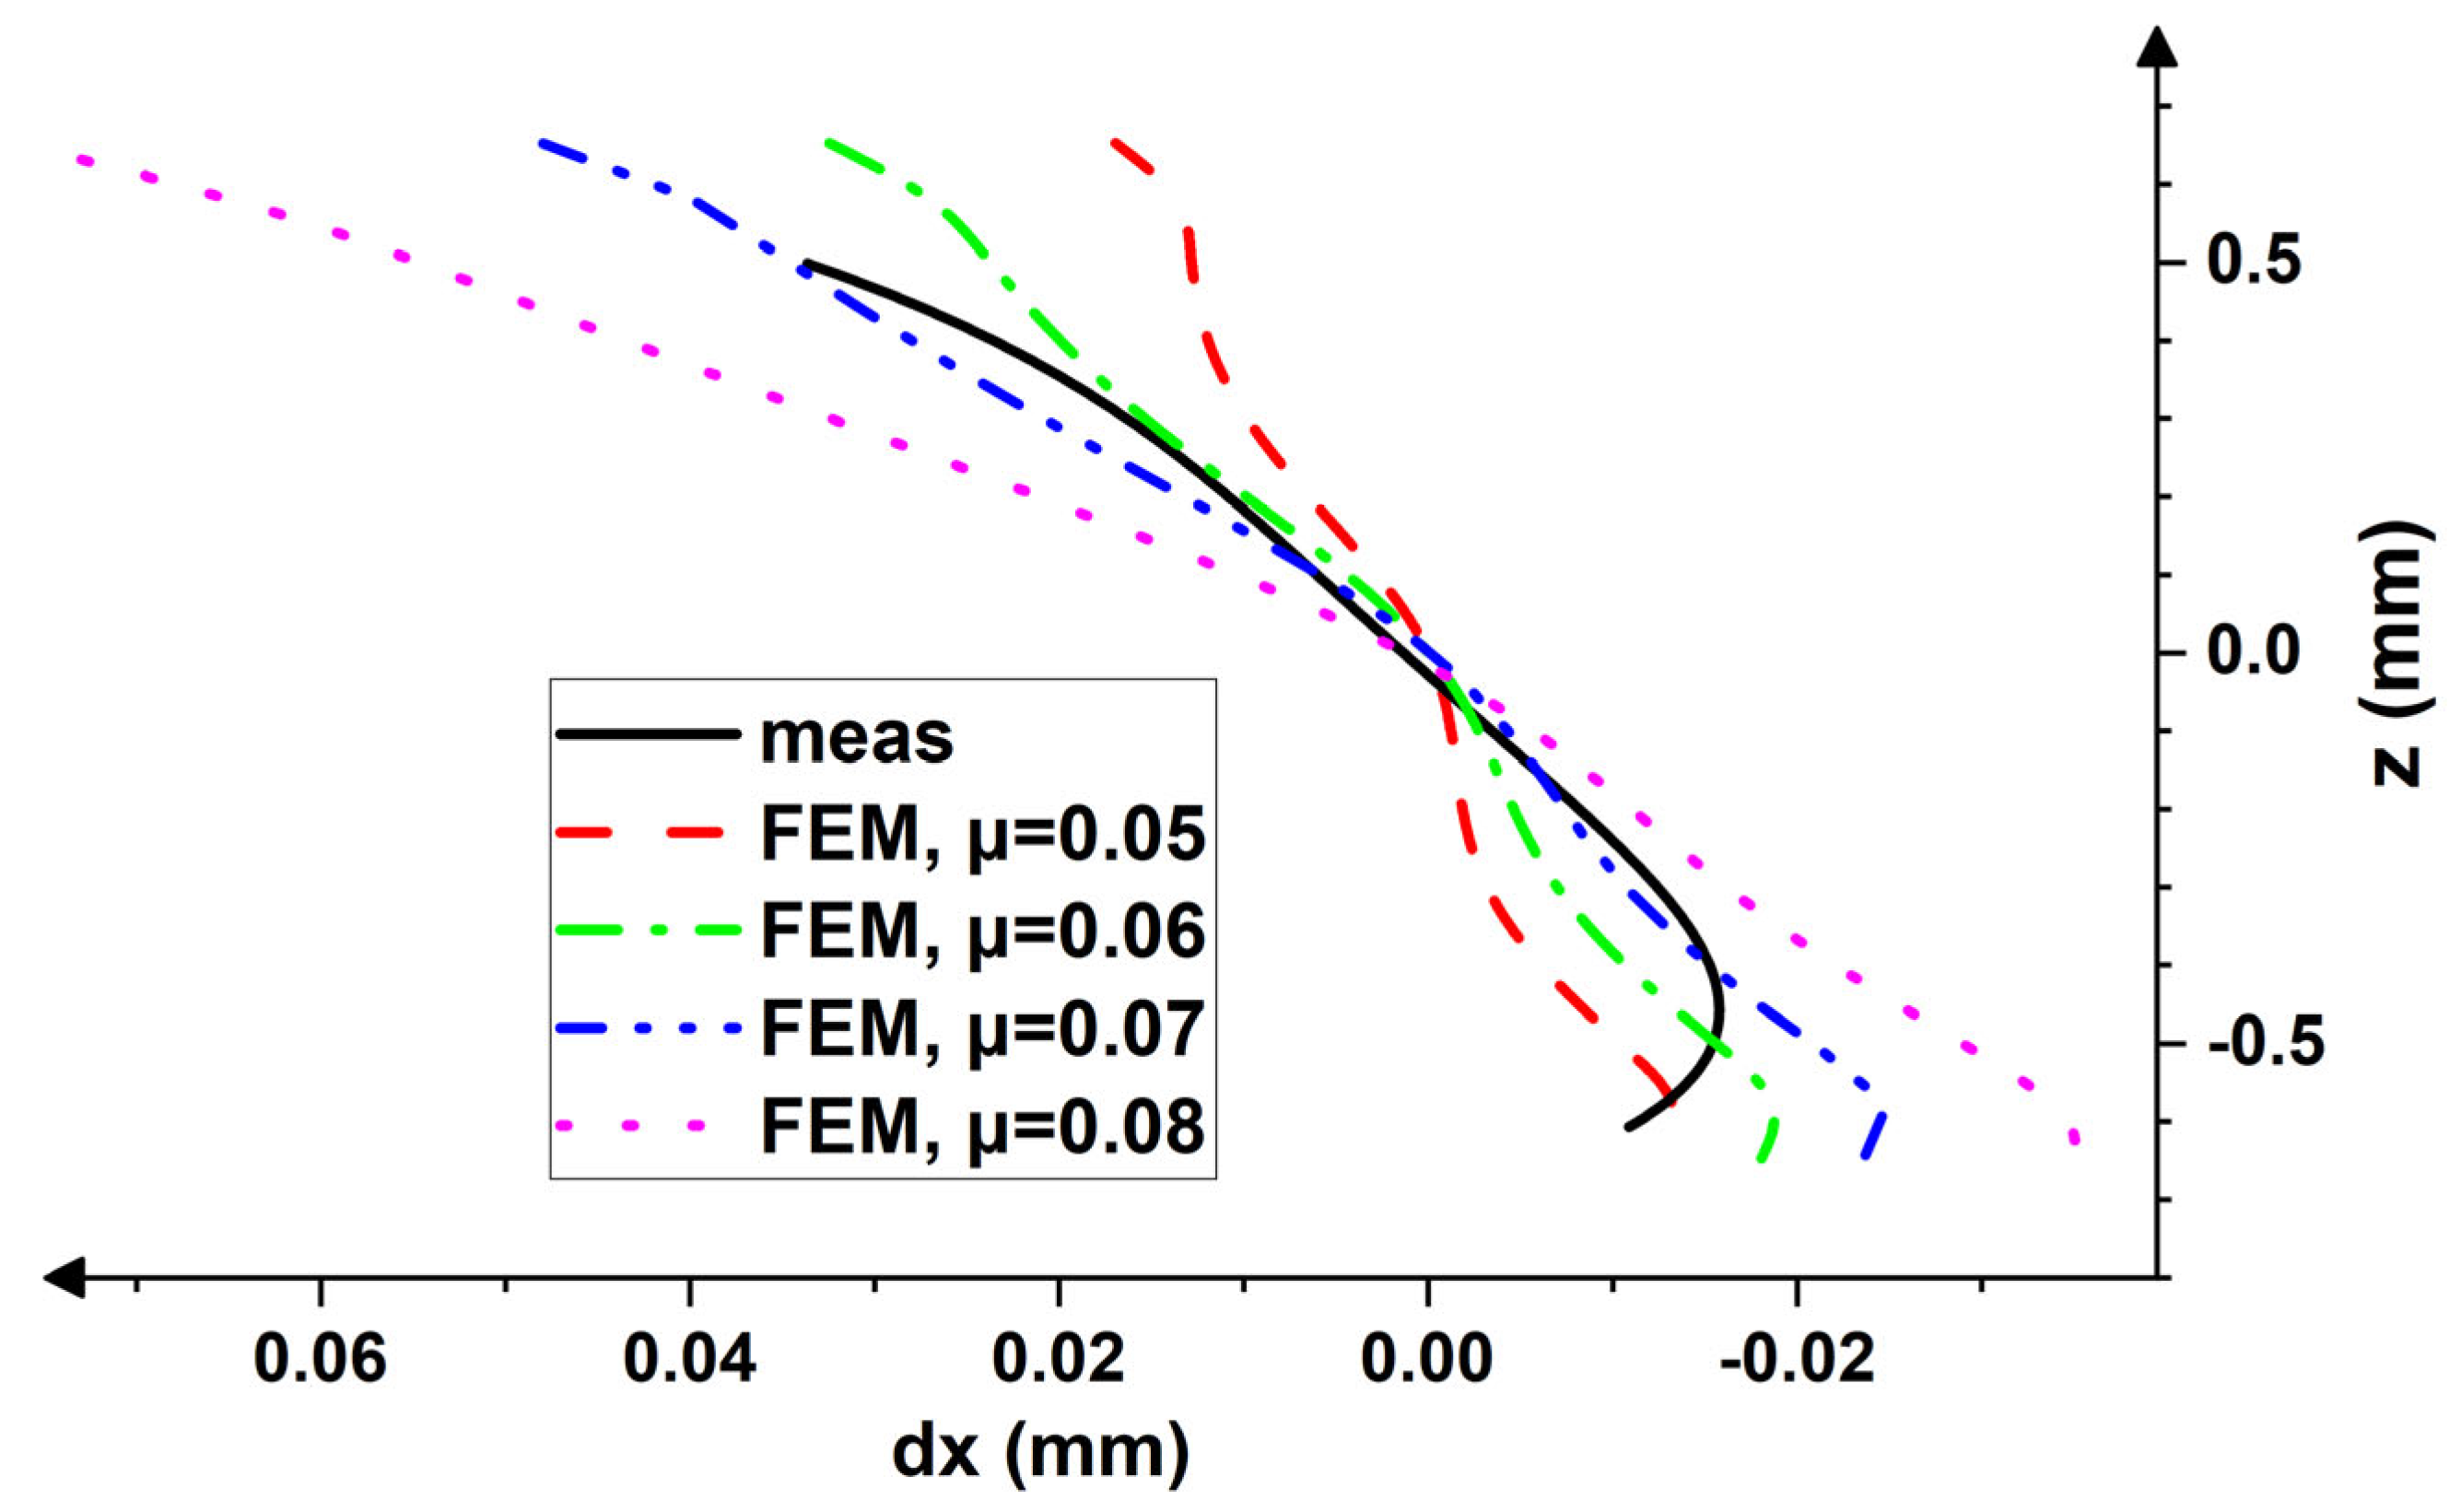
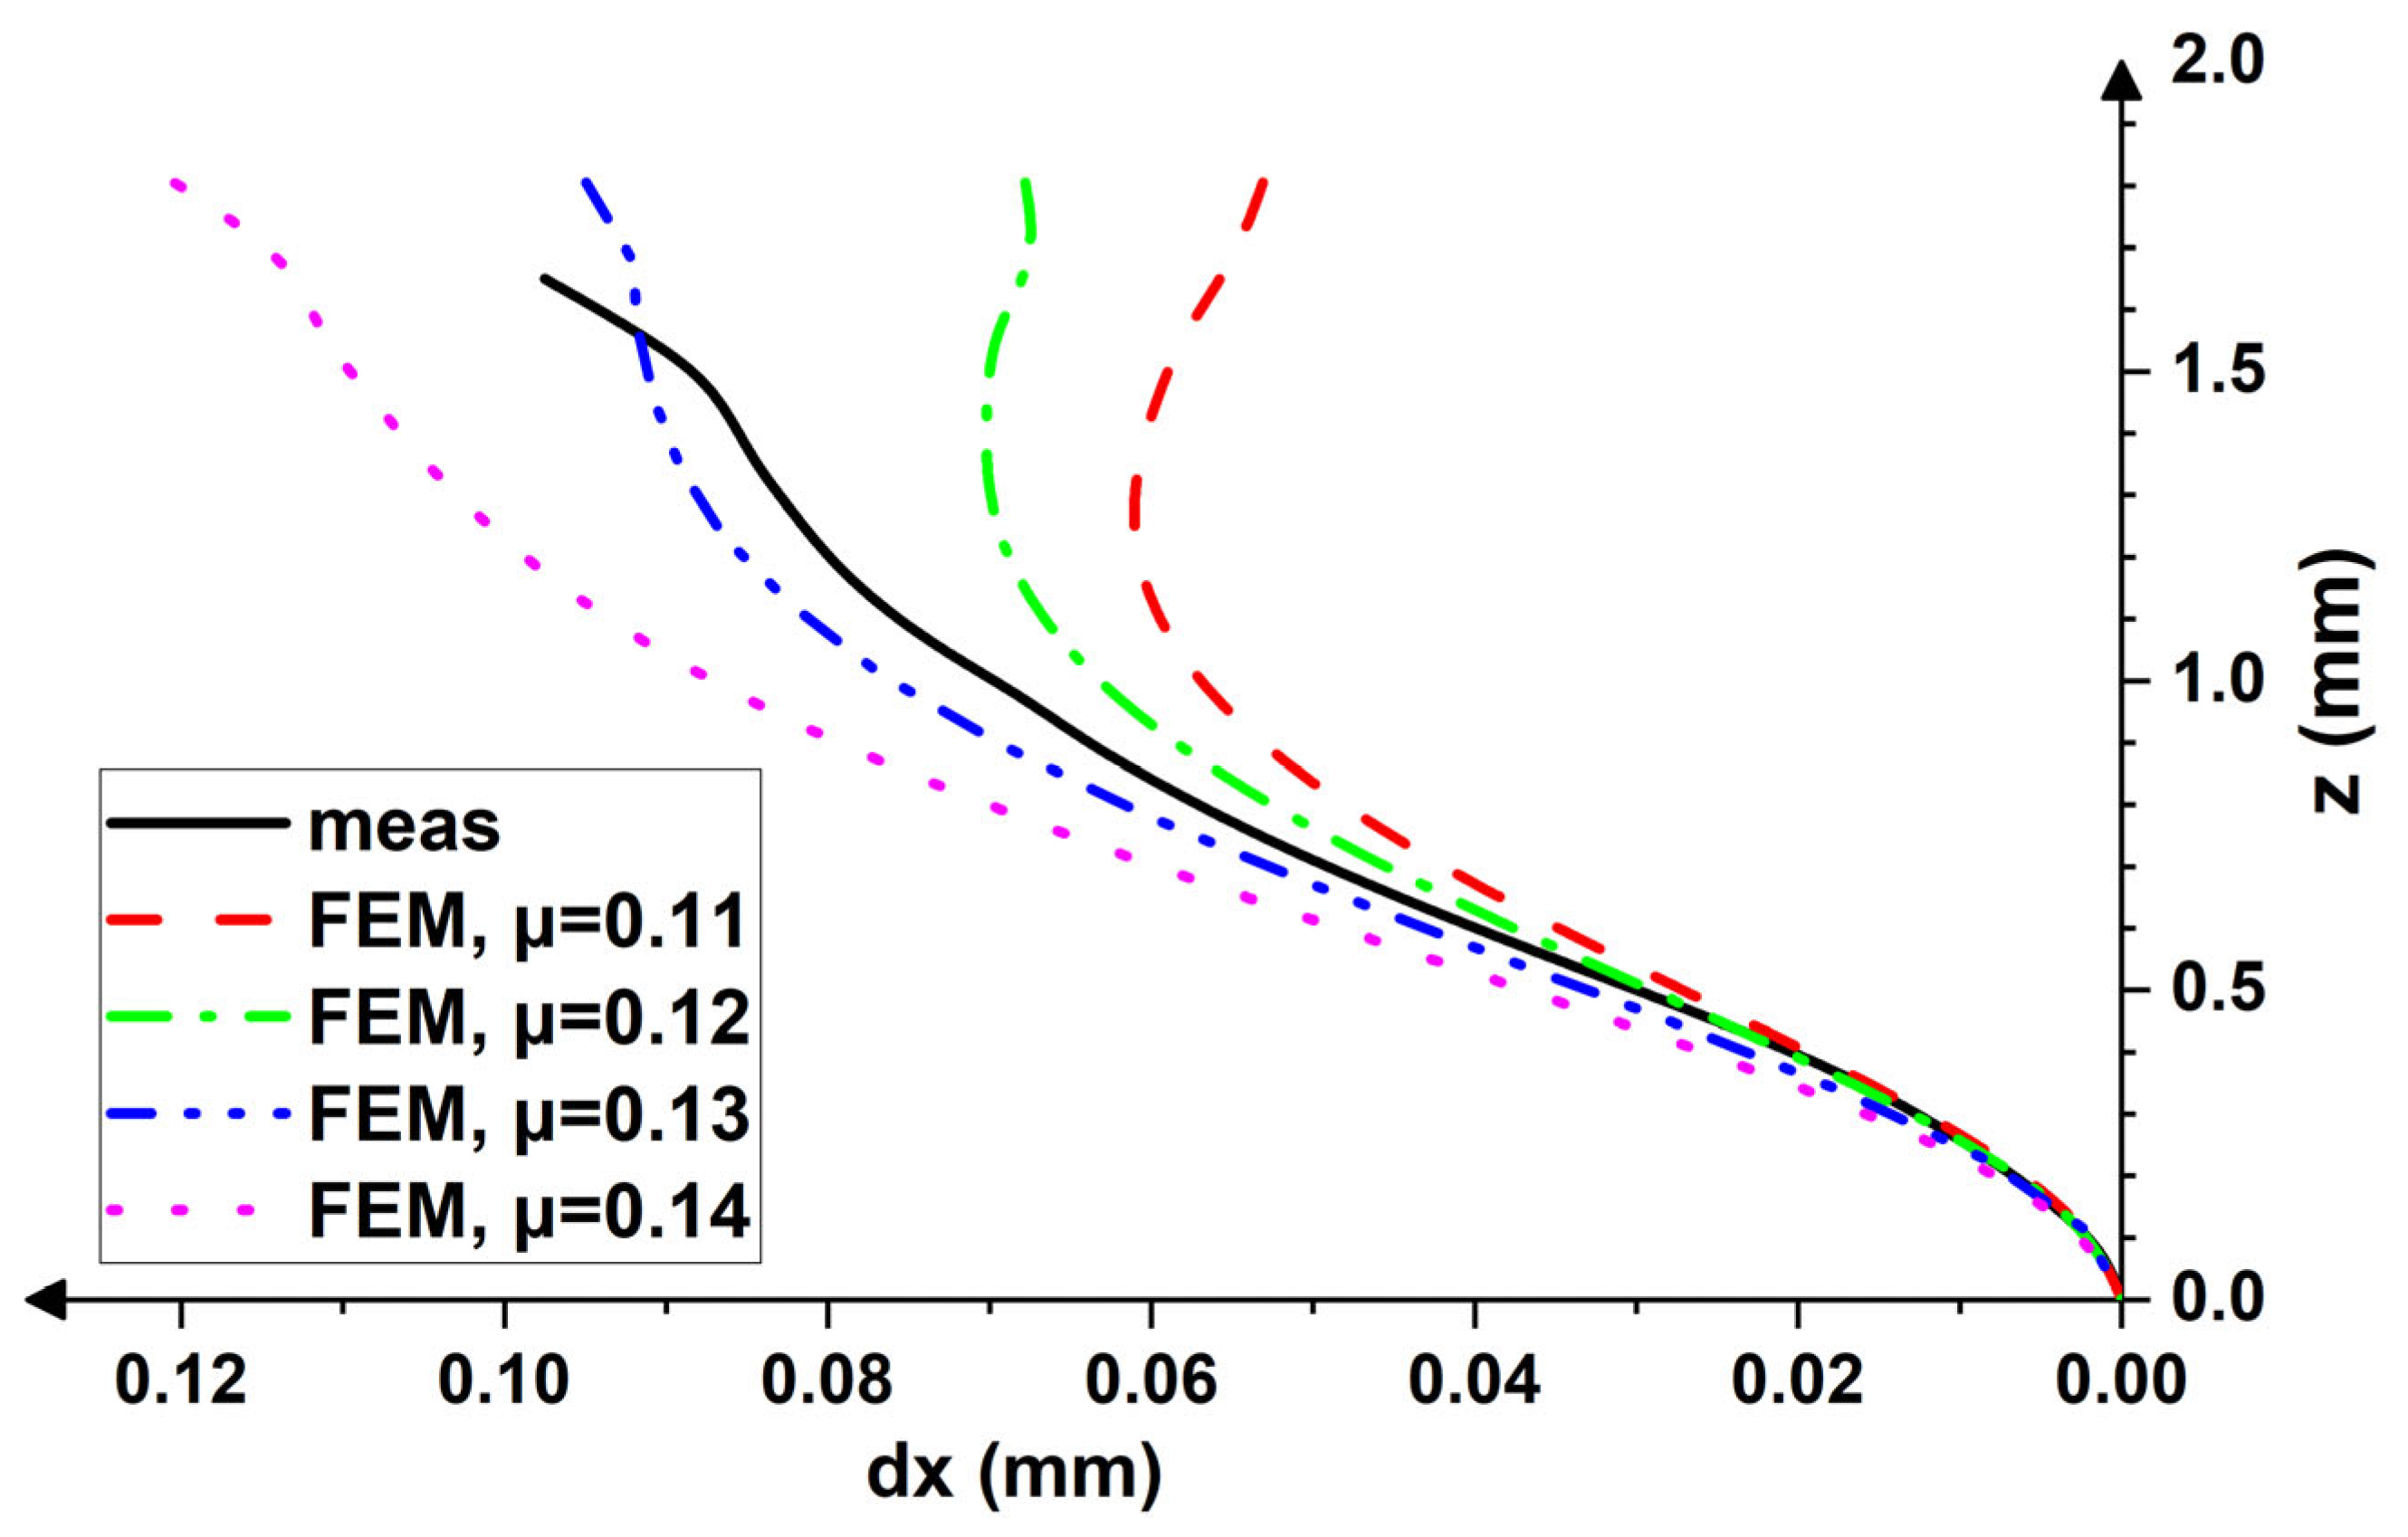
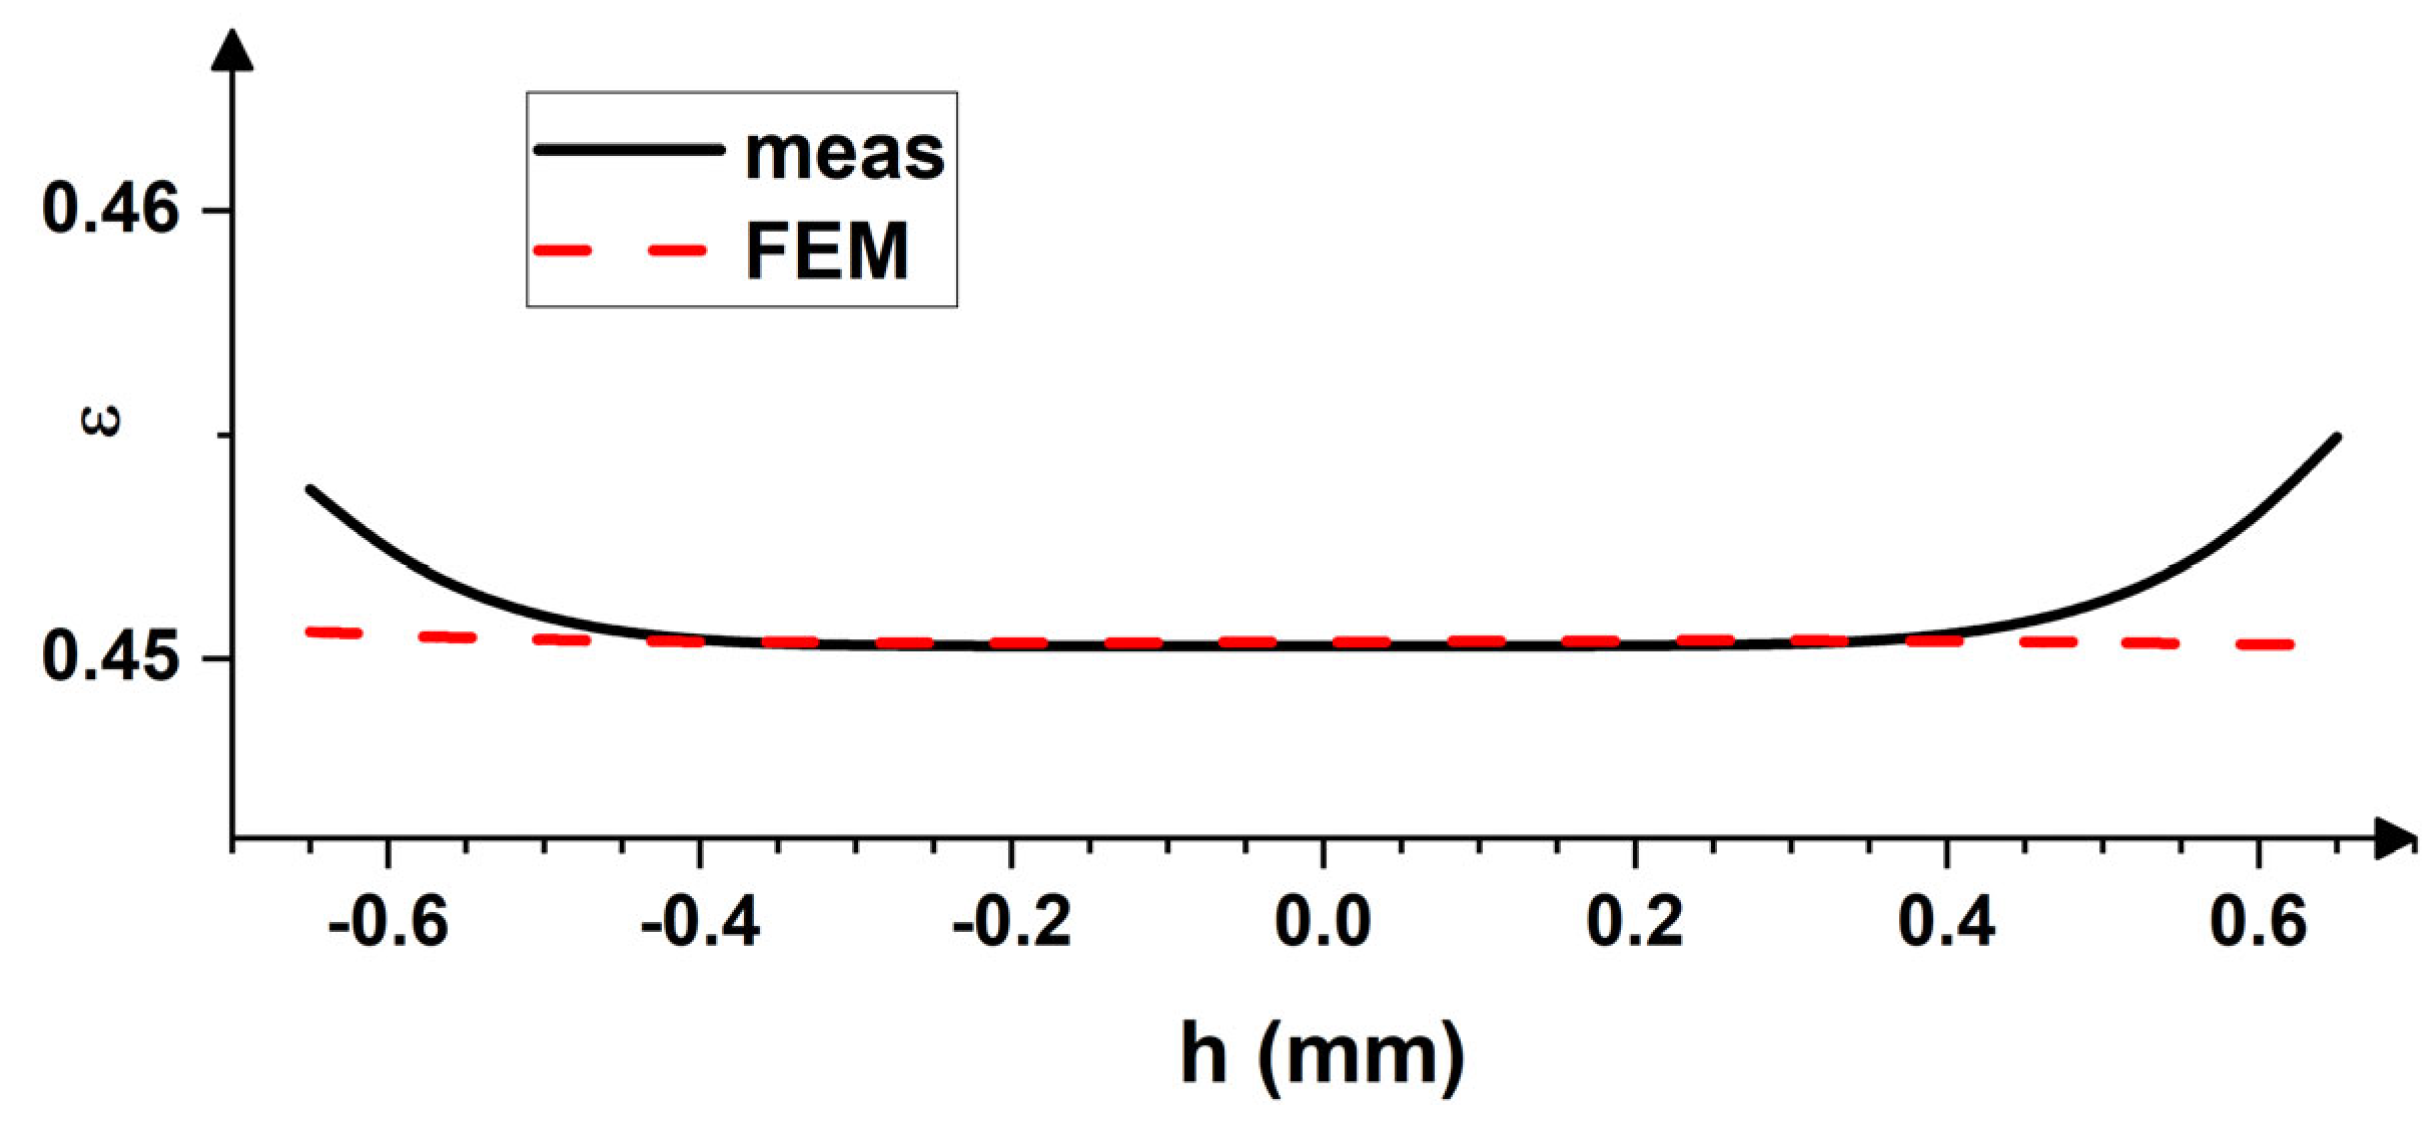
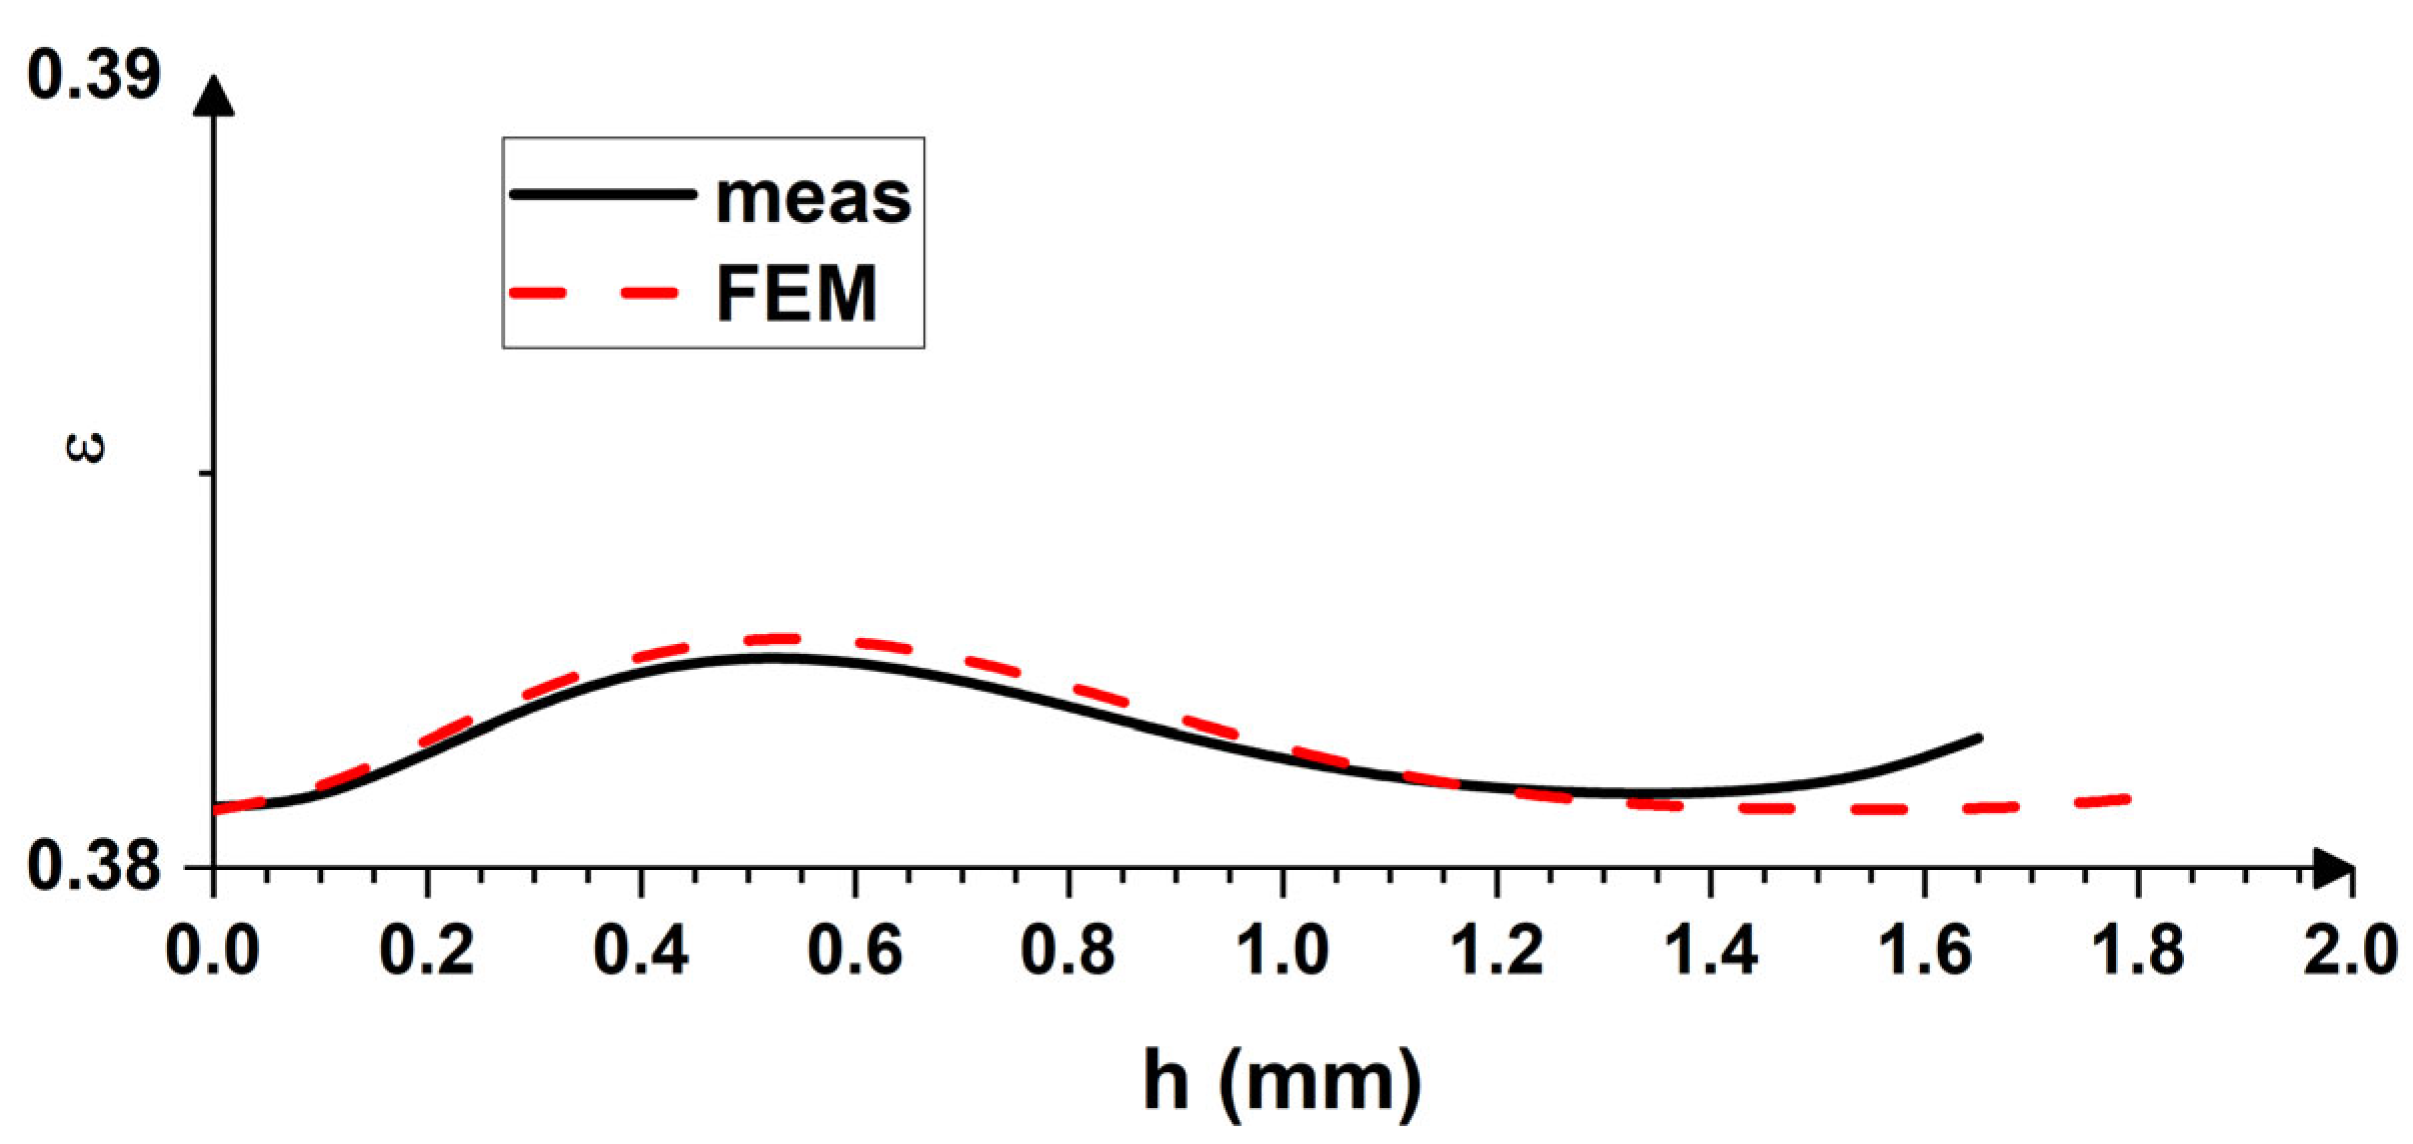
3.3. Rolling Processes: Simulation and Experiment

In order to test the material model as well as the model parameters derived from both the tensile test and FEM calculations, the process of cold rolling was simulated with Deform 2D by employing the Ramberg–Osgood approximation. The roll-gap geometry shown in Figure 3 was used for the simulation of the symmetric and asymmetric rolling trials. The geometry and technological parameters for both cases are listed in Table 1. In addition to the processing parameters, the coefficient of friction μ should be determined. In the present case, the minimal value of μ necessary for cold rolling was estimated by Equation (19), while the FEM simulations were conducted for a range of μ, exceeding μmin.
The flow of the investigated material during the rolling trials was examined experimentally by analyzing the distortion of the initially straight lines made by hardness indents on the transverse direction plane of the sheets (see Figure 9 and Figure 10). It is obvious that the symmetric and asymmetric rolling processes accounted for different deformation patterns. The diversity in the degree of distortion can be attributed to the differences in the shear strain distribution across the thickness. When the material is deformed symmetrically (both rolling cylinders rotate with an identical angular velocity), the symmetry plane is located in the mid-thickness part of the rolled sheet and the parabolic-type distortion is attributed to the shear strain localization within the subsurface region. In the case of asymmetric rolling, the symmetry is broken and the shear distribution is strongly affected by the roll-gap geometry as well as by the ratio of the angular velocities of the upper and lower rolls [45].
Figure 11 and Figure 12 show the simulated displacement patterns obtained by the FEM for various friction conditions and experimentally observed counterparts. The results of the calculation reveal that the displacement fields across the thickness can be successfully reproduced under the condition that the friction coefficient is known. In both cases, the successful simulation is carried out with the μ ≈ 1.1μmin (for symmetric rolling, the best fit is observed for μ ≈ 1.1μmin, while for the asymmetric trial, μ ≈ 1.13μmin). This result is consistent with the recently reported simulations [36].
Knowing the displacement profile, one can compute the distribution of the equivalent strain across the thickness by Equations (15)–(18). Since asymmetric rolling introduces shear across the whole thickness [28,45], the strain distribution is also expected to be quite homogeneous. An investigation of the substructure and texture evolution in the asymmetrically rolled sheets [28] showed that the asymmetric ratio of ~1.5 can ensure extensive shear even in the middle of the rolled sheets. This is justified by the current investigation of the displacement field. Furthermore, an analysis of the strain distribution suggests that a nearly uniform distribution can be obtained by asymmetric rolling when the optimum rate of angular velocity is [45,46]:
ω t ω b = h i h f 1.475 ,
where ωt is the angular velocity of the upper roll, and ωb is the angular velocity of the lower roll.
In the present investigation, the ratio of ωt/ωb = 1.474 and hi/hf = 1.476, and therefore the homogeneous strain distribution can be ensured, as shown in Figure 13. Comparable values are predicted by the model of Pustovoytov et al. [46] (ωt/ωb = 1.52 and hi/hf = 1.52). The discrepancy observed does not affect the result significantly in the examined case.
Similar to the calculations performed for asymmetric rolling, the distribution of the equivalent strain can be calculated for the conventionally rolled material as well. Figure 14 shows the measured strain (based on the displacement fields) and simulated profiles. It has been observed that the experimentally obtained data can be accurately reproduced by FEM calculations. It is important to mention here that the displacement fields cannot be examined in the close vicinity of the surface, since this region is subjected to the complex strain mode and the resulting distortions are quite severe within this thin subsurface layer [31,32,47].
The results of both the FEM simulations and measured data, presented in Figure 13 and Figure 14, suggest that an arbitrary deformation process can be modeled with high accuracy under the condition that the proper constitutive law is used, while the model parameters can be derived from a tensile test. The advantage of FEM simulation is that the deformation history for various thickness layers can be analysed. As Figure 15 and Figure 16 show, the strain rate distribution across the thickness of a rolled sheet is unequal, even if the equivalent strain seems to be quite homogeneous (see Figure 13, Figure 14, Figure 15 and Figure 16). It is also obvious from Figure 15 and Figure 16 that the asymmetrically rolled material experienced more extensive shear.
An accurate estimate of the strain rate distribution across the thickness of a rolled sheet enables the simulation of the evolution of the crystallographic texture. As shown elsewhere [36,41], the crystal plasticity (CP) models are capable of reproducing the experimentally measured textures if the deformation history is known. The latter can be accurately simulated by the FEM, as revealed above. In addition to this, not only can the bulk (overall) texture be computed by the CPs, but the heterogeneity of the textures in various thickness layers might also be explained [36,41] since various strain paths account for the diverse texture evolution.

4. Conclusions

The results presented in this study showed that the material model constants can be derived from a tensile test. In the present case, the behavior of the investigated 1050 Al alloy during deformation was described by the Ramberg–Osgood model, which was further implemented in the finite element simulations of the cold rolling trials. It was also shown that the strain-hardening characteristics can be derived from the Brinell hardness test and the obtained values of the strain-hardening coefficient and strain-hardening exponent correlated well with the counterparts computed from the tensile strain–stress diagram.
The two-dimensional finite element simulations enabled the successful modelling of the tensile test. The necking was quite accurately captured by the FEM; however, the simulated advanced stages of the contraction revealed some differences with respect to the experimental evidence. The discrepancies between the experimentally observed and calculated data are attributed to the anisotropic behavior of the investigated material, which cannot be described by the constitutive law employed. The isotropic Ramberg–Osgood (R–O) material model [3] as well as the one derived by considering the crystallographic aspects of a material [Sahoo et al. [15]] were capable of predicting the necking in tension with a quite high accuracy.
The R–O constitutive model was used for the FEM simulation of the cold symmetric and asymmetric rolling processes. The experimentally observed displacement fields were reasonably reproduced by the finite element simulations for both the symmetric and asymmetric trials. In turn, this allowed the calculation of the strain distribution across the thickness and the deformation history in terms of the strain-hardening rates. It was shown that the angular velocity ratio of ~1.5 ensures a quite homogeneous strain distribution through the thickness of the rolled sheet and this result is consistent with the recently reported experimental evidence.

Author Contributions

Conceptualization, J.G.B. and J.J.S.; methodology, J.G.B. and J.J.S.; investigation, J.G.B. and G.P.; resources, J.J.S.; writing—original draft preparation, J.G.B.; writing—review and editing, J.G.B., G.P., P.C., and J.J.S.; visualization, J.G.B.; supervision, J.J.S.; funding acquisition, J.J.S. All authors have read and agreed to the published version of the manuscript.

Funding

Project no. TKP2021-NVA-29 has been implemented with the support provided by the Ministry of Innovation and Technology of Hungary from the National Research, Development and Innovation Fund, financed under the TKP2021-NVA funding scheme.

Institutional Review Board Statement

Not applicable.

Informed Consent Statement

Not applicable.

Data Availability Statement

The data presented in this study are available upon request from the corresponding authors. The data are not publicly available since they will be further post-processed to develop new models.

Conflicts of Interest

The authors declare no conflict of interest.

References

  1. Pierazzo, E.; Artemieva, N.; Asphaug, E.; Baldwin, E.C.; Cazamias, J.; Coker, R.; Collins, G.S.; Crawford, D.A.; Davison, T.; Elbeshausen, D.; et al. Validation of Numerical Codes for Impact and Explosion Cratering: Impacts on Strengthless and Metal Targets. Meteorit. Planet. Sci. 2008, 43, 1917–1938. [Google Scholar] [CrossRef] [Green Version]
  2. Schulze, V.; Boev, N.; Zanger, F. Simulation of Metal Cutting Process with Variable Cutting Thickness During Broaching. Procedia CIRP 2012, 1, 437–442. [Google Scholar] [CrossRef] [Green Version]
  3. Ramberg, W.; Osgood, W.R. Description of Stress-Strain Curves by Three Parameters Technical Notes. National Advisory Committee for Aeronautics. Report: NACA-TN- 902. Washington, July 1943. Available online: https://ntrs.nasa.gov/citations/19930081614 (accessed on 5 January 2023).
  4. Gadamchetty, G.; Pandey, A.; Gawture, M. On Practical Implementation of the Ramberg-Osgood Model for FE Simulation. SAE Int. J. Mater. Manf. 2016, 9, 200–205. [Google Scholar] [CrossRef]
  5. Muhanna, R.L.; Mullen, R.L.; Rao, M.R. Nonlinear Interval Finite Elements for Beams. In Proceedings of the Second International Conference on Vulnerability and Risk Analysis and Management (ICVRAM2014), Liverpool, UK, 13–16 July 2014. [Google Scholar]
  6. Donohue, B.R.; Ambrus, A.; Kalidindi, S.R. Critical Evaluation of the Indentation Data Analyses Methods for the Extraction of Isotropic Uniaxial Mechanical Properties Using Finite Element Models. Acta Mater. 2012, 60, 3943–3952. [Google Scholar] [CrossRef]
  7. Imai, T.; Utsunomiya, H.; Matsumoto, R. Finite Element Analysis of Plastic Instability Phenomenon in Cold Rolling of Clad Sheets. Procedia Eng. 2017, 184, 306–312. [Google Scholar] [CrossRef]
  8. Kumar Reddy Sirigiri, V.; Yadav Gudiga, V.; Shankar Gattu, U.; Suneesh, G.; Mohan Buddaraju, K. A Review on Johnson Cook Material Model. Mater. Today Proc. 2022, 62, 3450–3456. [Google Scholar] [CrossRef]
  9. Jebri, L.; Lazghab, T.; Toumi, M.; Soula, M. The Behavior and Forming Performance of Vapor Hydroforming Process of Thin Aluminum Sheets: Numerical and Experimental Analysis. Adv. Mech. Eng. 2022, 14, 168781322210893. [Google Scholar] [CrossRef]
  10. Schulze, V.; Vöhringer, O. Plastic Deformation: Constitutive Description. In Encyclopedia of Materials: Science and Technology; Elsevier: Amsterdam, The Netherlands, 2001; pp. 7050–7064. ISBN 978-0-08-043152-9. [Google Scholar]
  11. Allazadeh, M.R. Computing Strain Rate Sensitivity of Aluminium Alloy 1050. Int. Sci. Surv. J. 2020, 3, 9–19. [Google Scholar]
  12. Yasnikov, I.S.; Vinogradov, A.; Estrin, Y. Revisiting the Considère Criterion from the Viewpoint of Dislocation Theory Fundamentals. Scr. Mater. 2014, 76, 37–40. [Google Scholar] [CrossRef]
  13. Jin, H.; Lloyd, D.J. The Tensile Response of a Fine-Grained AA5754 Alloy Produced by Asymmetric Rolling and Annealing. Metall. Mater. Trans. A 2004, 35, 997–1006. [Google Scholar] [CrossRef]
  14. Reihle, M. Ein einfaches Verfahren zur Aufnahme der Fließkurven von Stahl bei Raumtemperatur. Archiv. Eisenhüttenwesen 1961, 32, 331–336. [Google Scholar] [CrossRef]
  15. Sahoo, S.K.; Dhinwal, S.S.; Vu, V.Q.; Toth, L.S. A New Macroscopic Strain Hardening Function Based on Microscale Crystal Plasticity and Its Application in Polycrystal Modeling. Mater. Sci. Eng. A 2021, 823, 141634. [Google Scholar] [CrossRef]
  16. Gyurkó, Z.; Borosnyói, A. Brinell-Hardness Testing and Discrete Element Modelling of Hardened Concrete. Epa. J. Silic. Based Compos. Mater. 2015, 67, 8–11. [Google Scholar] [CrossRef]
  17. Zhao, Y.; Li, L.; Lu, Z.; Teng, G.; Liu, S.; Hu, Z.; He, A. The Effect of Annealing Temperature on the Recrystallization and Mechanical Properties of Severe Plastic Deformed Commercial Pure Aluminium during Ultra-Fast Annealing. Mater. Res. Express 2021, 8, 046515. [Google Scholar] [CrossRef]
  18. Cerbu, C.; Teodorescu-Draghicescu, H. Aspects On modeling the Mechanical Behavior of Aluminum Alloys with Different heat Treatments. J. Comput. Appl. Mech. 2017, 12, 85–98. [Google Scholar] [CrossRef]
  19. Joun, M.; Choi, I.; Eom, J.; Lee, M. Finite Element Analysis of Tensile Testing with Emphasis on Necking. Comput. Mater. Sci. 2007, 41, 63–69. [Google Scholar] [CrossRef]
  20. Sonmez, F.O.; Demir, A. Analytical Relations between Hardness and Strain for Cold Formed Parts. J. Mater. Process. Technol. 2007, 186, 163–173. [Google Scholar] [CrossRef]
  21. Oliver, W.C.; Pharr, G.M. An Improved Technique for Determining Hardness and Elastic Modulus Using Load and Displacement Sensing Indentation Experiments. J. Mater. Res. 1992, 7, 1564–1583. [Google Scholar] [CrossRef]
  22. Tabor, D. The Hardness of Metals; Oxford Classic Texts in the Physical Sciences; Clarendon Press: Oxford, UK; Oxford University Press: New York, NY, USA, 2000; ISBN 978-0-19-850776-5. [Google Scholar]
  23. Sakai, M. Indentation Contact Mechanics. Online Textbook. 2020. Available online: https://indentpt.com/pdf/IndentationContactMechanics_En_Revised2020.pdf (accessed on 10 January 2023).
  24. Yazdanshenas, A.; Goh, C.-H. Rockwell Hardness Testing on an Aluminum Specimen Using Finite Element Analysis. SSRG Int. J. Mech. Eng. 2020, 7, 1–10. [Google Scholar] [CrossRef]
  25. Rule, W.K. Finite Element Modeling of Brinell and Rockwell Hardness Testing of Metals. In Proceedings of the Problems Involving Thermal Hydraulics, Liquid Sloshing, and Extreme Loads on Structures, ASMEDC, San Diego, CA, USA, 1 January 2004; pp. 191–196. [Google Scholar]
  26. Mišović, M.; Tadić, N.; Jaćimović, M.; Janjić, M. Deformations and Velocities during the Cold Rolling of Aluminium Alloys. Mater. Tehnol. 2016, 50, 59–67. [Google Scholar] [CrossRef]
  27. Fluhrer, J. DEFORM(TM) 2D Version 8.1 User’s Manual; Scientific Forming Technologies Corporation: Columbus, OH, USA, 2015. [Google Scholar]
  28. Sidor, J.; Miroux, A.; Petrov, R.; Kestens, L. Controlling the Plastic Anisotropy in Asymmetrically Rolled Aluminium Sheets. Philos. Mag. 2008, 88, 3779–3792. [Google Scholar] [CrossRef]
  29. Cui, Q.; Ohori, K. Grain Refinement of High Purity Aluminium by Asymmetric Rolling. Mater. Sci. Technol. 2000, 16, 1095–1101. [Google Scholar] [CrossRef]
  30. Ma, C.Q.; Hou, L.G.; Zhang, J.S.; Zhuang, L.Z. Experimental and Numerical Investigations of the Plastic Deformation during Multi-Pass Asymmetric and Symmetric Rolling of High-Strength Aluminum Alloys. Mater. Sci. Forum 2014, 794–796, 1157–1162. [Google Scholar] [CrossRef]
  31. Inoue, T. Strain Variations on Rolling Condition in Accumulative Roll-Bonding by Finite Element Analysis. In Finite Element Analysis; Moratal, D., Ed.; InTech, Sciyo: Rijeka, Croatia, 2010; ISBN 978-953-307-123-7. [Google Scholar]
  32. Inoue, T.; Qiu, H.; Ueji, R. Through-Thickness Microstructure and Strain Distribution in Steel Sheets Rolled in a Large-Diameter Rolling Process. Metals 2020, 10, 91. [Google Scholar] [CrossRef] [Green Version]
  33. Hirt, G.; Senge, S. Selected Processes and Modeling Techniques for Rolled Products. Procedia Eng. 2014, 81, 18–27. [Google Scholar] [CrossRef] [Green Version]
  34. Ma, C.Q.; Hou, L.G.; Zhang, J.S.; Zhuang, L.Z. Strain Analysis during the Symmetric and Asymmetric Rolling of 7075 Al Alloy Sheets. In Light Metals 2015; Hyland, M., Ed.; Springer International Publishing: Cham, Switzerland, 2015; pp. 445–449. ISBN 978-3-319-48610-9. [Google Scholar]
  35. Avitzur, B. Friction-Aided Strip Rolling with Unlimited Reduction. Int. J. Mach. Tool Des. Res. 1980, 20, 197–210. [Google Scholar] [CrossRef]
  36. Sidor, J.J. Assessment of Flow-Line Model in Rolling Texture Simulations. Metals 2019, 9, 1098. [Google Scholar] [CrossRef] [Green Version]
  37. Szűcs, M.; Krallics, G.; Lenard, J.G. The Difficulties of Predicting the Coefficient of Friction in Cold Flat Rolling. J. Tribol. 2021, 143, 101703. [Google Scholar] [CrossRef]
  38. MiŁek, T. The Influence of Friction Coefficient on Forward Slip in Experimental Research on Cold Longitudinal Flat Rolling. In Proceedings of the Terotechnology: 10th Conference on Terotechnology, Brisbane, Australia, 25 August 2018; pp. 67–72. [Google Scholar]
  39. Wang, Q.Y.; Zhu, Y.; Zhao, Y. Friction and Forward Slip in High-Speed Cold Rolling Process of Aluminum Alloys. Appl. Mech. Mater. 2012, 229–231, 361–364. [Google Scholar] [CrossRef]
  40. Sidor, J.J. Crystal Plasticity and Continuum Mechanics-Based Modelling of Deformation and Recrystallization Textures in Aluminum Alloys. IOP Conf. Ser. Mater. Sci. Eng. 2018, 375, 012028. [Google Scholar] [CrossRef]
  41. Sidor, J.J. Deformation Texture Simulation in Al Alloys: Continuum Mechanics and Crystal Plasticity Aspects. Model. Simul. Mater. Sci. Eng. 2018, 26, 085011. [Google Scholar] [CrossRef]
  42. Alvi, M.H.; Cheong, S.W.; Suni, J.P.; Weiland, H.; Rollett, A.D. Cube Texture in Hot-Rolled Aluminum Alloy 1050 (AA1050)—Nucleation and Growth Behavior. Acta Mater. 2008, 56, 3098–3108. [Google Scholar] [CrossRef]
  43. Barlat, F. A Simple Model for Dislocation Behavior, Strain and Strain Rate Hardening Evolution in Deforming Aluminum Alloys. Int. J. Plast. 2002, 18, 919–939. [Google Scholar] [CrossRef]
  44. Hariharan, K.; Barlat, F. Modified Kocks–Mecking–Estrin Model to Account Nonlinear Strain Hardening. Metall. Mater. Trans. A 2019, 50, 513–517. [Google Scholar] [CrossRef]
  45. Sidor, J.; Petrov, R.H.; Kestens, L. Texture Control in Aluminum Sheets by Conventional and Asymmetric Rolling. In Comprehensive Materials Processing; Elsevier: Amsterdam, The Netherlands, 2014; pp. 447–498. ISBN 9780080965338. [Google Scholar]
  46. Pustovoytov, D.; Pesin, A.; Biryukova, O. Finite Element Analysis of Strain Gradients in Aluminium Alloy Sheets Processed by Asymmetric Rolling. Procedia Manuf. 2018, 15, 129–136. [Google Scholar] [CrossRef]
  47. Serajzadeh, S.; Karimi Taheri, A.; Nejati, M.; Izadi, J.; Fattahi, M. An Investigation on Strain Inhomogeneity in Hot Strip Rolling Process. J. Mater. Process. Technol. 2002, 128, 88–99. [Google Scholar] [CrossRef]
Figure 1. Geometry used for the modeling of tensile test.
Applsci 13 04359 g001
Figure 2. (a) Geometric set-up used for the simulation of Brinell hardness; and (b) fine mesh elements in the vicinity of an indent.
Applsci 13 04359 g002
Figure 3. Geometry of the roll-gap, used for FEM simulation.
Applsci 13 04359 g003
Figure 4. Engineering strain–stress curve measured by tensile test for 1050 Al alloy.
Applsci 13 04359 g004
Figure 5. Measured and simulated true strain–stress curves for 1050 Al alloy (the scale for the dσ/dε curve is shown on the right side); R–O stands for Ramberg–Osgood model [3,4].
Applsci 13 04359 g005
Figure 6. Neck formation as predicted by FEM.
Applsci 13 04359 g006
Figure 7. Effect of elastic and plastic terms in Equation (2) on the accuracy of FEM simulation: the continuous line takes into account both elastic and plastic parts, while the dotted line represents the simulation by considering only the plastic term.
Applsci 13 04359 g007
Figure 8. FEM-computed and analytically fitted curves (Equations (20) and (21)) of surface pressure over indentation per indenter size ratio d/D.
Applsci 13 04359 g008
Figure 9. Hardness indents before (a) and after (b) asymmetric cold rolling.
Applsci 13 04359 g009
Figure 10. Hardness indents before (a) and after (b) symmetric cold rolling.
Applsci 13 04359 g010
Figure 11. Experimental and simulated displacement patterns across the thickness of asymmetrically rolled sheet.
Applsci 13 04359 g011
Figure 12. Experimental and simulated displacement patterns across the half-thickness of symmetrically rolled sheet.
Applsci 13 04359 g012
Figure 13. Distribution of equivalent strain across the thickness of asymmetrically rolled sheet.
Applsci 13 04359 g013
Figure 14. Distribution of equivalent strain across the thickness of symmetrically rolled sheet.
Applsci 13 04359 g014
Figure 15. Strain rates in asymmetrically rolled sheet, calculated by FEM for different thickness layers: top and bot. surf.—are top and bottom surface layers; subsurf. layer is equidistant from both surface and middle; and mid. is the midthickness layer.
Applsci 13 04359 g015
Figure 16. Strain rates in symmetrically rolled sheet, calculated by FEM for different thickness layers: surf.—is a surface layer; subsurf. layer is equidistant from both surface and middle; and mid. is the midthickness layer.
Applsci 13 04359 g016
Table 1. Technological parameters used in FEM simulation of cold rolling.
DescriptionParameterValue
Asym.Sym.
Roll radiiR (mm)7575
Initial thickness of the sheethi (mm)1.925.02
Final thickness of the sheethf (mm)1.33.61
Initial sheet lengthL (mm)2020
Material-Al-1050Al-1050
Minimal friction coefficient necessary for rollingμmin0.06720.118
Angular velocity of the top rollωt (rad/s)1.10231.1023
Angular velocity of the bottom rollωb (rad/s)0.7481.1023
Velocity rateωt/ωb1.4741.000
Table 2. Fitted model parameters for two different material models.
Model ParameterRamberg–Osgood ModelHollomon Model
E (MPa)69,85469,519
K (MPa)144.56144.58
n0.36910.3703
Disclaimer/Publisher’s Note: The statements, opinions and data contained in all publications are solely those of the individual author(s) and contributor(s) and not of MDPI and/or the editor(s). MDPI and/or the editor(s) disclaim responsibility for any injury to people or property resulting from any ideas, methods, instructions or products referred to in the content.

