1. Introduction
Composite materials have been extensively used for decades for the production of both secondary and primary aircraft components. Nevertheless, there is still the need to study their damage behaviour because the weaknesses associated with composite materials continue to constrain their use, also limiting the benefits that could be gained from increasingly widespread application of these innovative materials [
1,
2]. The scientific community is now well aware that one of the main weaknesses of composite materials comes from impact damage with foreign objects [
3,
4,
5]. High-velocity impacts do not represent the real criticality, since, although very dangerous, they cause clearly visible and catastrophic damage [
6,
7]. Low-velocity impacts, on the other hand, are extremely critical as they trigger non-visible surface damages, in particular delamination and matrix breakage [
8,
9,
10]. In fact, low-velocity impacts have proven to be one of the primary causes of delamination in aircraft structures, which results in catastrophic damage, since their propagation significantly reduces the strength of the material, thus not allowing the structure’s operating loads to be sustained.
A significant background of the literature is present on delamination due to low-velocity impacts. For example, interlaminar and intralaminar damages due to low-velocity impact have been studied in [
11] both experimentally and numerically. Different models have been investigated by varying the interlayer with cohesive contacts to assess the delaminated area for each interface. In [
12], a methodology to predict impact-induced delamination was proposed. The work in [
13] studied the interaction between matrix failure and delamination in carbon/epoxy laminates subjected to low-velocity impact. In [
14], a review of the low-velocity impact responses of composite materials is presented.
From the perspective of damage tolerance design, the study of damage propagation has become of primary importance. Particularly in the early design stages of aircraft structures, an appropriate compromise between geometric dimensions, weight and operational loads is essential. The use of numerical analyses becomes fundamental in this context, allowing a first design solution and thus reducing the excessive costs of the manufacturing and testing of demonstration structures [
15,
16].
Many authors have performed numerical sensitivity analyses on composite components, considering the variation in various parameters, both with regard to geometry and loads. In [
17], a composite tapered beam made of a glass/epoxy material system was analysed for the sensitivity of interlaminar normal stress and total strain energy release rate at the free edge, due to variations in taper angle and layer angle. The tapered beam was analysed in terms of both tension and bending. In [
18], the effects of different sizes, shapes and positions of delamination and the stacking sequence of the sublaminate on the buckling load were studied. A sensitivity analysis to highlight the influence of the position and propagation of delaminations on the compressive behaviour of composite panels was carried out in [
19]. Comparisons against experimental data available in the literature were performed to prove the effectiveness of the considered numerical techniques. In [
20], the influence of interface ply orientation on delamination evolution was analysed in double cantilever beam and mixed-mode bending specimens both experimentally and numerically.
In this manuscript, a typical stiffened aeronautical panel with embedded circular delamination, representing a typical low-velocity impact damage, was numerically examined. Specifically, the influence of delamination size and depth on the buckling behaviour of the structure was assessed. Indeed, composite aircraft components are typically relatively thin; hence, buckling instability can occur prior to the desired failure load when the structure is loaded under compression, particularly in the presence of damages or manufacturing flaws.
Since most composite materials tend to be brittle, when subjected to compressive loads, structural failure can occur suddenly [
21,
22]. Therefore, it is difficult to determine whether premature buckling or compressive failure has occurred by observing an experimental test, since both buckling and collapse occur too quickly. Similarly, it is not possible to determine whether buckling has occurred on the basis of a post-failure examination. Based on these statements, in the preliminary design phase of an aircraft component, if one wanted to optimise the structure to delay the buckling load and damage propagation according to operational load specifications, one would need to manufacture and test several configurations, with a huge economic burden. Hence, the idea at the base of this paper to perform a sensitivity analysis, varying specific geometric parameters, aimed at studying the local buckling load of the circular delamination, the buckling of the skin and the global buckling of the reinforced panel. Furthermore, through the use of the virtual crack-closure-technique-based sMart time XB numerical procedure [
23,
24], the delamination initiation load and propagation were determined. The geometrical parameters were varied to highlight the criticalities associated with the propagation of delaminations in terms of damage-tolerant structures.
The paper is structured into sections:
Section 2 briefly describes the used numerical procedure,
Section 3 reports the geometrical characteristics of the different analysed stiffened panels,
Section 4 discusses the obtained results and finally
Section 5 contains the conclusions of the manuscript.
2. Theoretical Background
In this section, a brief introduction of the theory under the performed numerical analyses is reported. In particular, the linear buckling analyses (eigenvalue-based buckling analyses) [
25] and the virtual crack-closure-technique-based SMart time XB (SMXB) approach [
23,
24] are described.
2.1. Eigenvalue Buckling Analysis
Linear buckling is the most common and easiest type of numerical analysis to perform in the initial design stages of a structure. Indeed, thin structures, such as aircraft structures, when subjected to compressive loads may exhibit global buckling before service load. Therefore, it is essential to investigate the structural stability of aircraft components from the early design phases.
When buckling occurs, structures experience a large variation in displacement without load changes (beyond minor load perturbations). Eigenvalue or linear buckling analyses calculate the theoretical buckling resistance of an ideal linear elastic structure. Actually, most real structures do not reach the theoretical elastic buckling resistance due to imperfections and non-linear behaviour. Indeed, linear buckling generally produces non-conservative results because it does not take these effects into account.
Even though it is unconservative, linear buckling has the benefit of being computationally inexpensive compared to non-linear buckling solutions. To obtain the buckling load multiplier
, the eigenvalue problem in Equation (1) can be solved:
where [K] is the stiffness matrix, [S] is the stress stiffness matrix,
is the i-th eigenvalue (used to multiply the loads that generate [S]) and
is the i-th eigenvector of displacements. Different eigenvalue and eigenvector extraction procedures are available. In this paper, the subspace method was considered [
25].
2.2. SMXB Approach
Delamination growth is assessed via non-linear static analyses using the virtual crack closure technique (VCCT) [
26]. The VCCT assumes that the energy released when a crack extends from length
a to
a + Δ
a is the equivalent amount of energy required to close the same crack. The delamination growth can be numerically simulated considering the fail release (FR) approach, together with the VCCT equations. In detail, delamination is built with two models with coincident nodes. The initially unconnected zone is simulated with separated nodes without the possibility of penetration, and the zone in which delamination can propagate is simulated with contact elements that are initially attached and can only disconnect when and where the failure criterion is met (Equation (2)— linear power law).
In Equation (2), the term is the energy release rate associated with the fracture mode j and is the critical value of the energy release rate associated with the fracture mode j. The values for , and can be found experimentally (the linear criterion assumes ).
In this manuscript, the VCCT-FR-based procedure SMXB was considered. This tool is considered to be valuable and robust as it overcomes the limitations of the standard VCCT, implemented in most of the commercial finite element software, related to the mesh and load-step dependency of the results. The SMXB was previously validated for different types of coupons, complex structures and different shapes of delamination in [
23,
24,
27,
28], where the theoretical background of the procedure is reported in detail.
3. Test Case
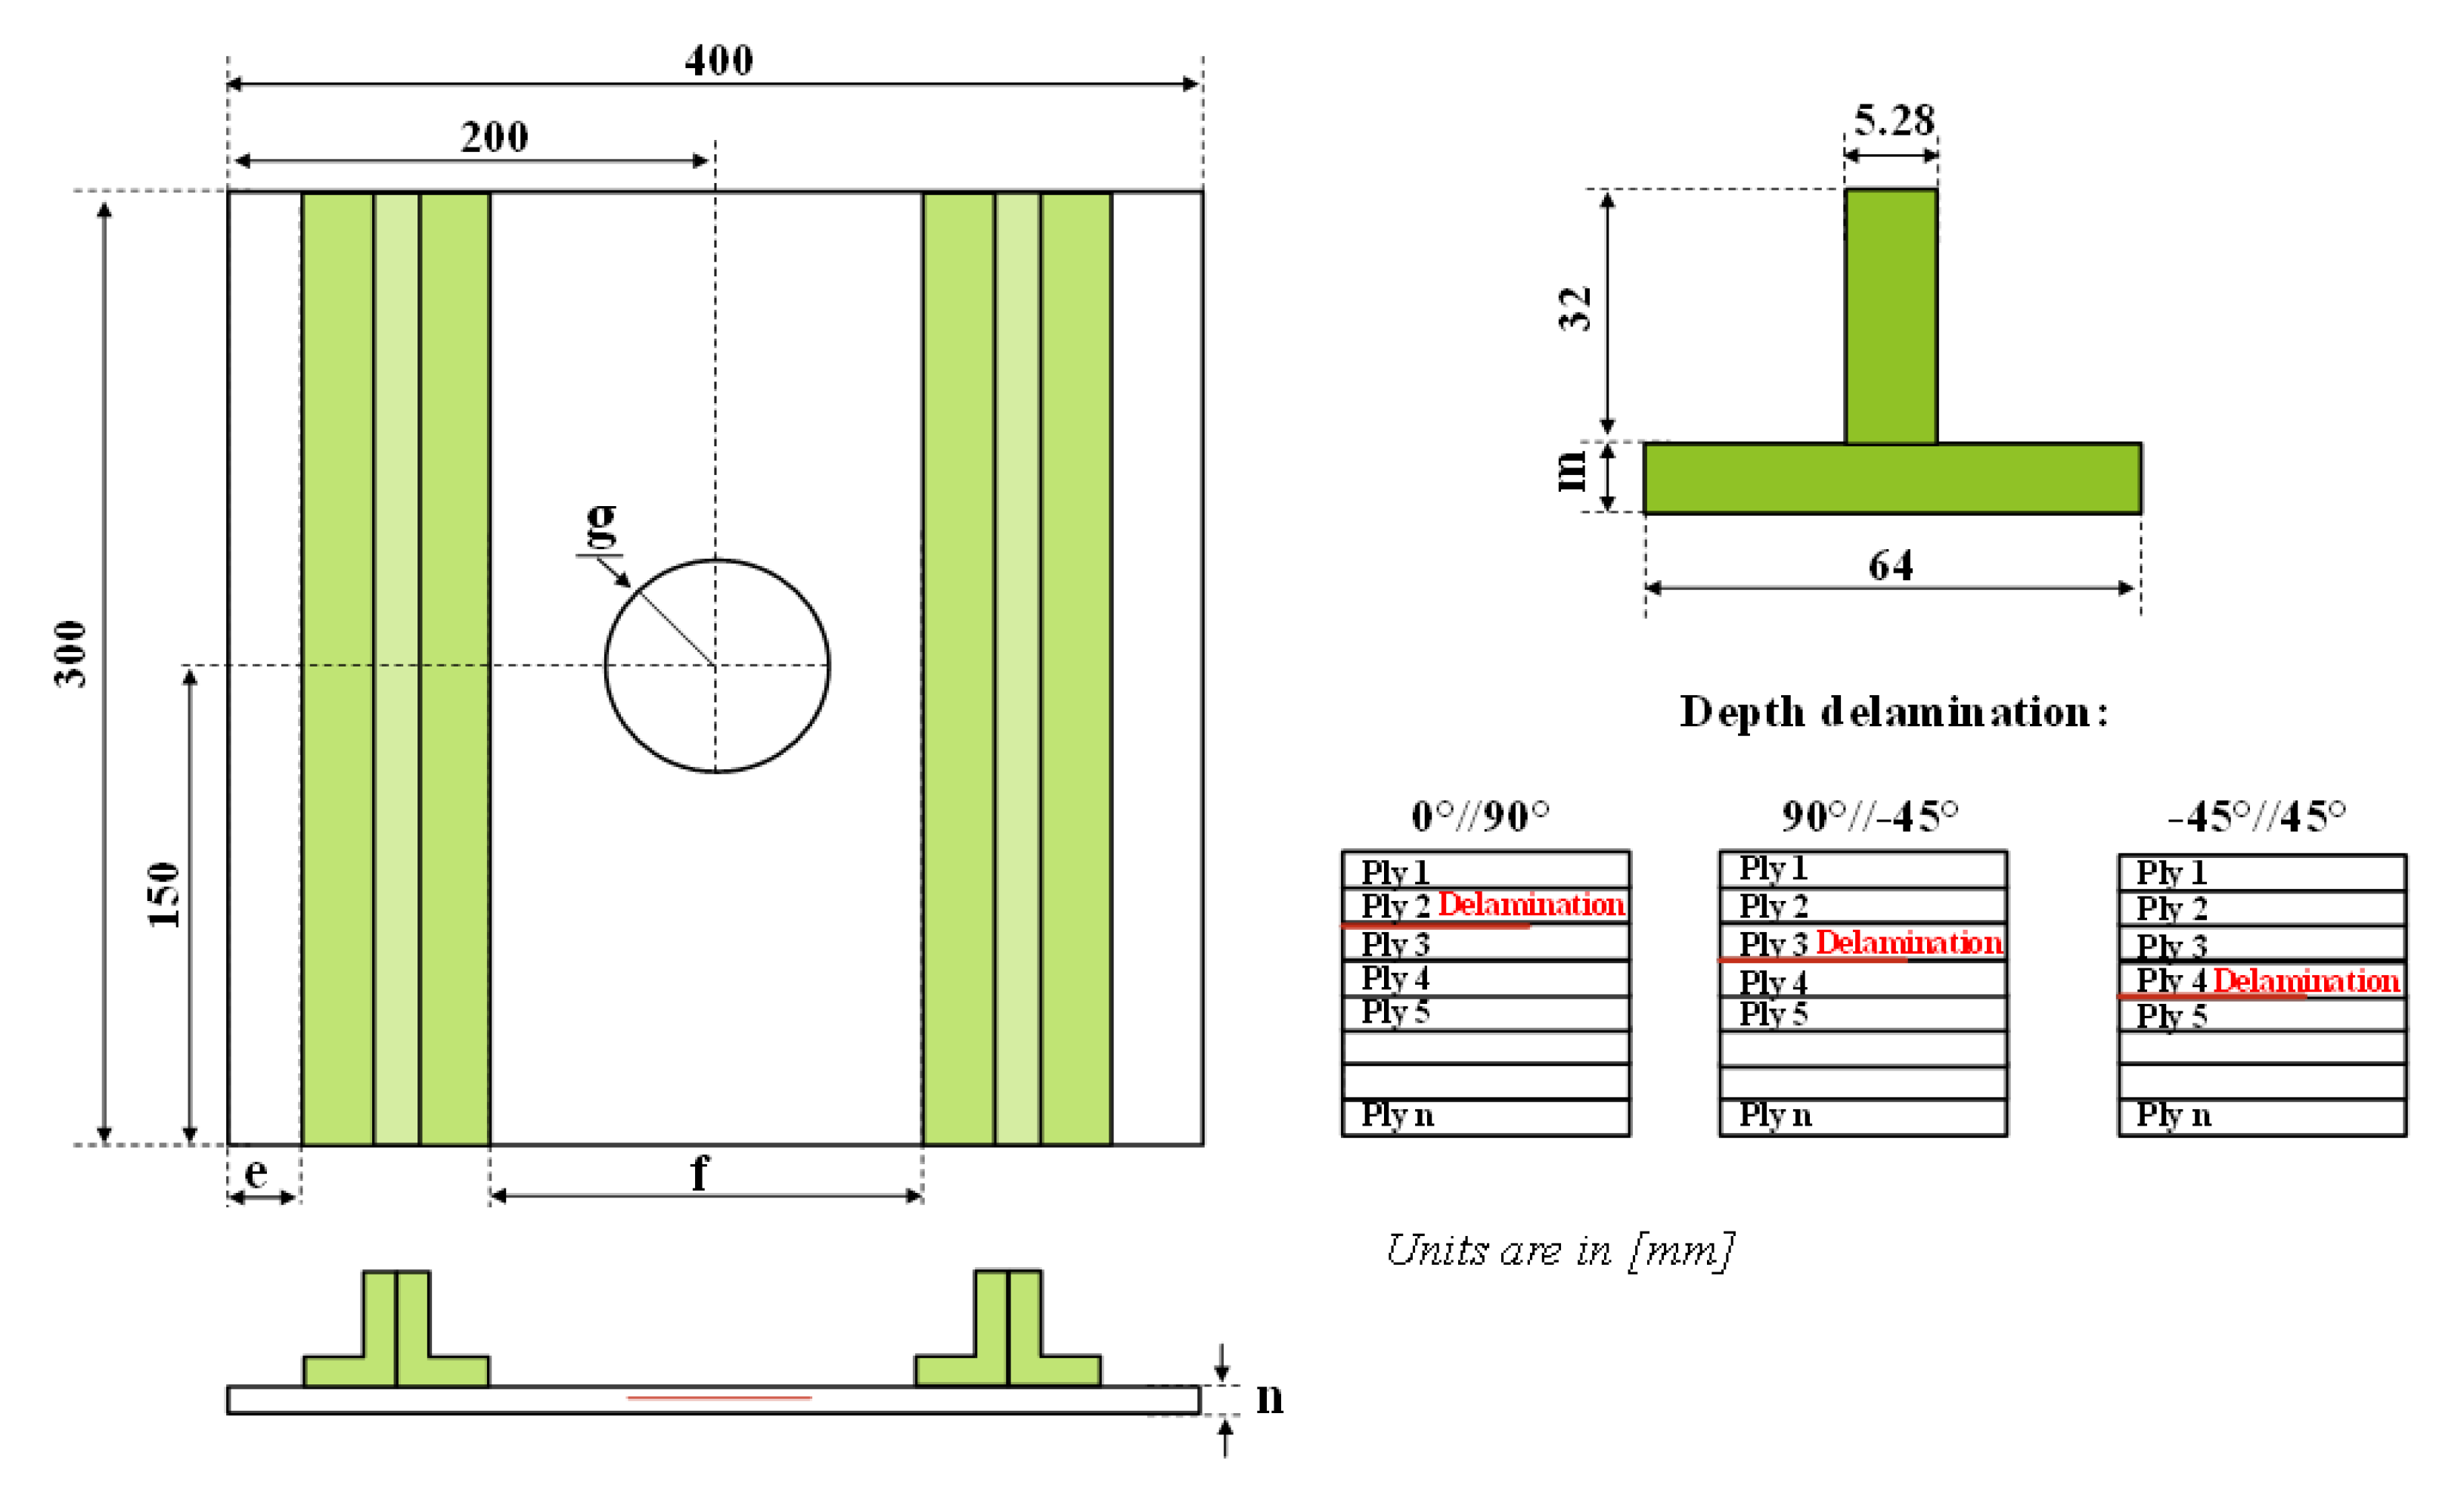
This section provides a detailed description of the geometric characteristics of the analysed composite reinforced panels, which include an initial embedded delamination damage.
The analysed structure was a typical aeronautical stiffened panel, with two T-shaped stiffeners tied on the skin panel and with a circular delamination placed in the middle of the bay. The geometry of the structure, including fixed dimensions, is described in
Figure 1, while the variable parameters, such as the length of the bay, the skin and foot stringer thicknesses and the delamination radius and depth, of the sixteen analysed configurations (CD1–CD16) are reported in
Table 1. The geometric dimensions were chosen according to typical aeronautical stiffened panels’ dimensions in the literature [
23,
24,
28].
According to
Table 1, the configurations CD1–CD4 differ in the radius and depth of delamination. The same can be said for CD5–CD8 configurations, which differ from the first four (CD1–CD4) because of increased skin and foot stringer thicknesses (24 plies against the previous 16 plies).
From configuration CD9, the stringers were moved closer to each other, reducing the width of the bay, and the structures were again examined by varying the depth and radius of the delamination (CD9–CD10) and increasing the number of layers in the foot stringer (CD11–CD16).
The web stringer stacking sequence was kept constant and equal to [(45°, 0°, 90, −45°)]
4s, with 32 layers each of 0.165 mm thickness. The panel was made of a Carbon Fibre/Epoxy resin material system, whereby properties were evaluated using an experimental campaign based on the principal ASTM test standards, performed at the National Research Council of Italy by using an MTS test machine. The mechanical properties are listed in
Table 2.
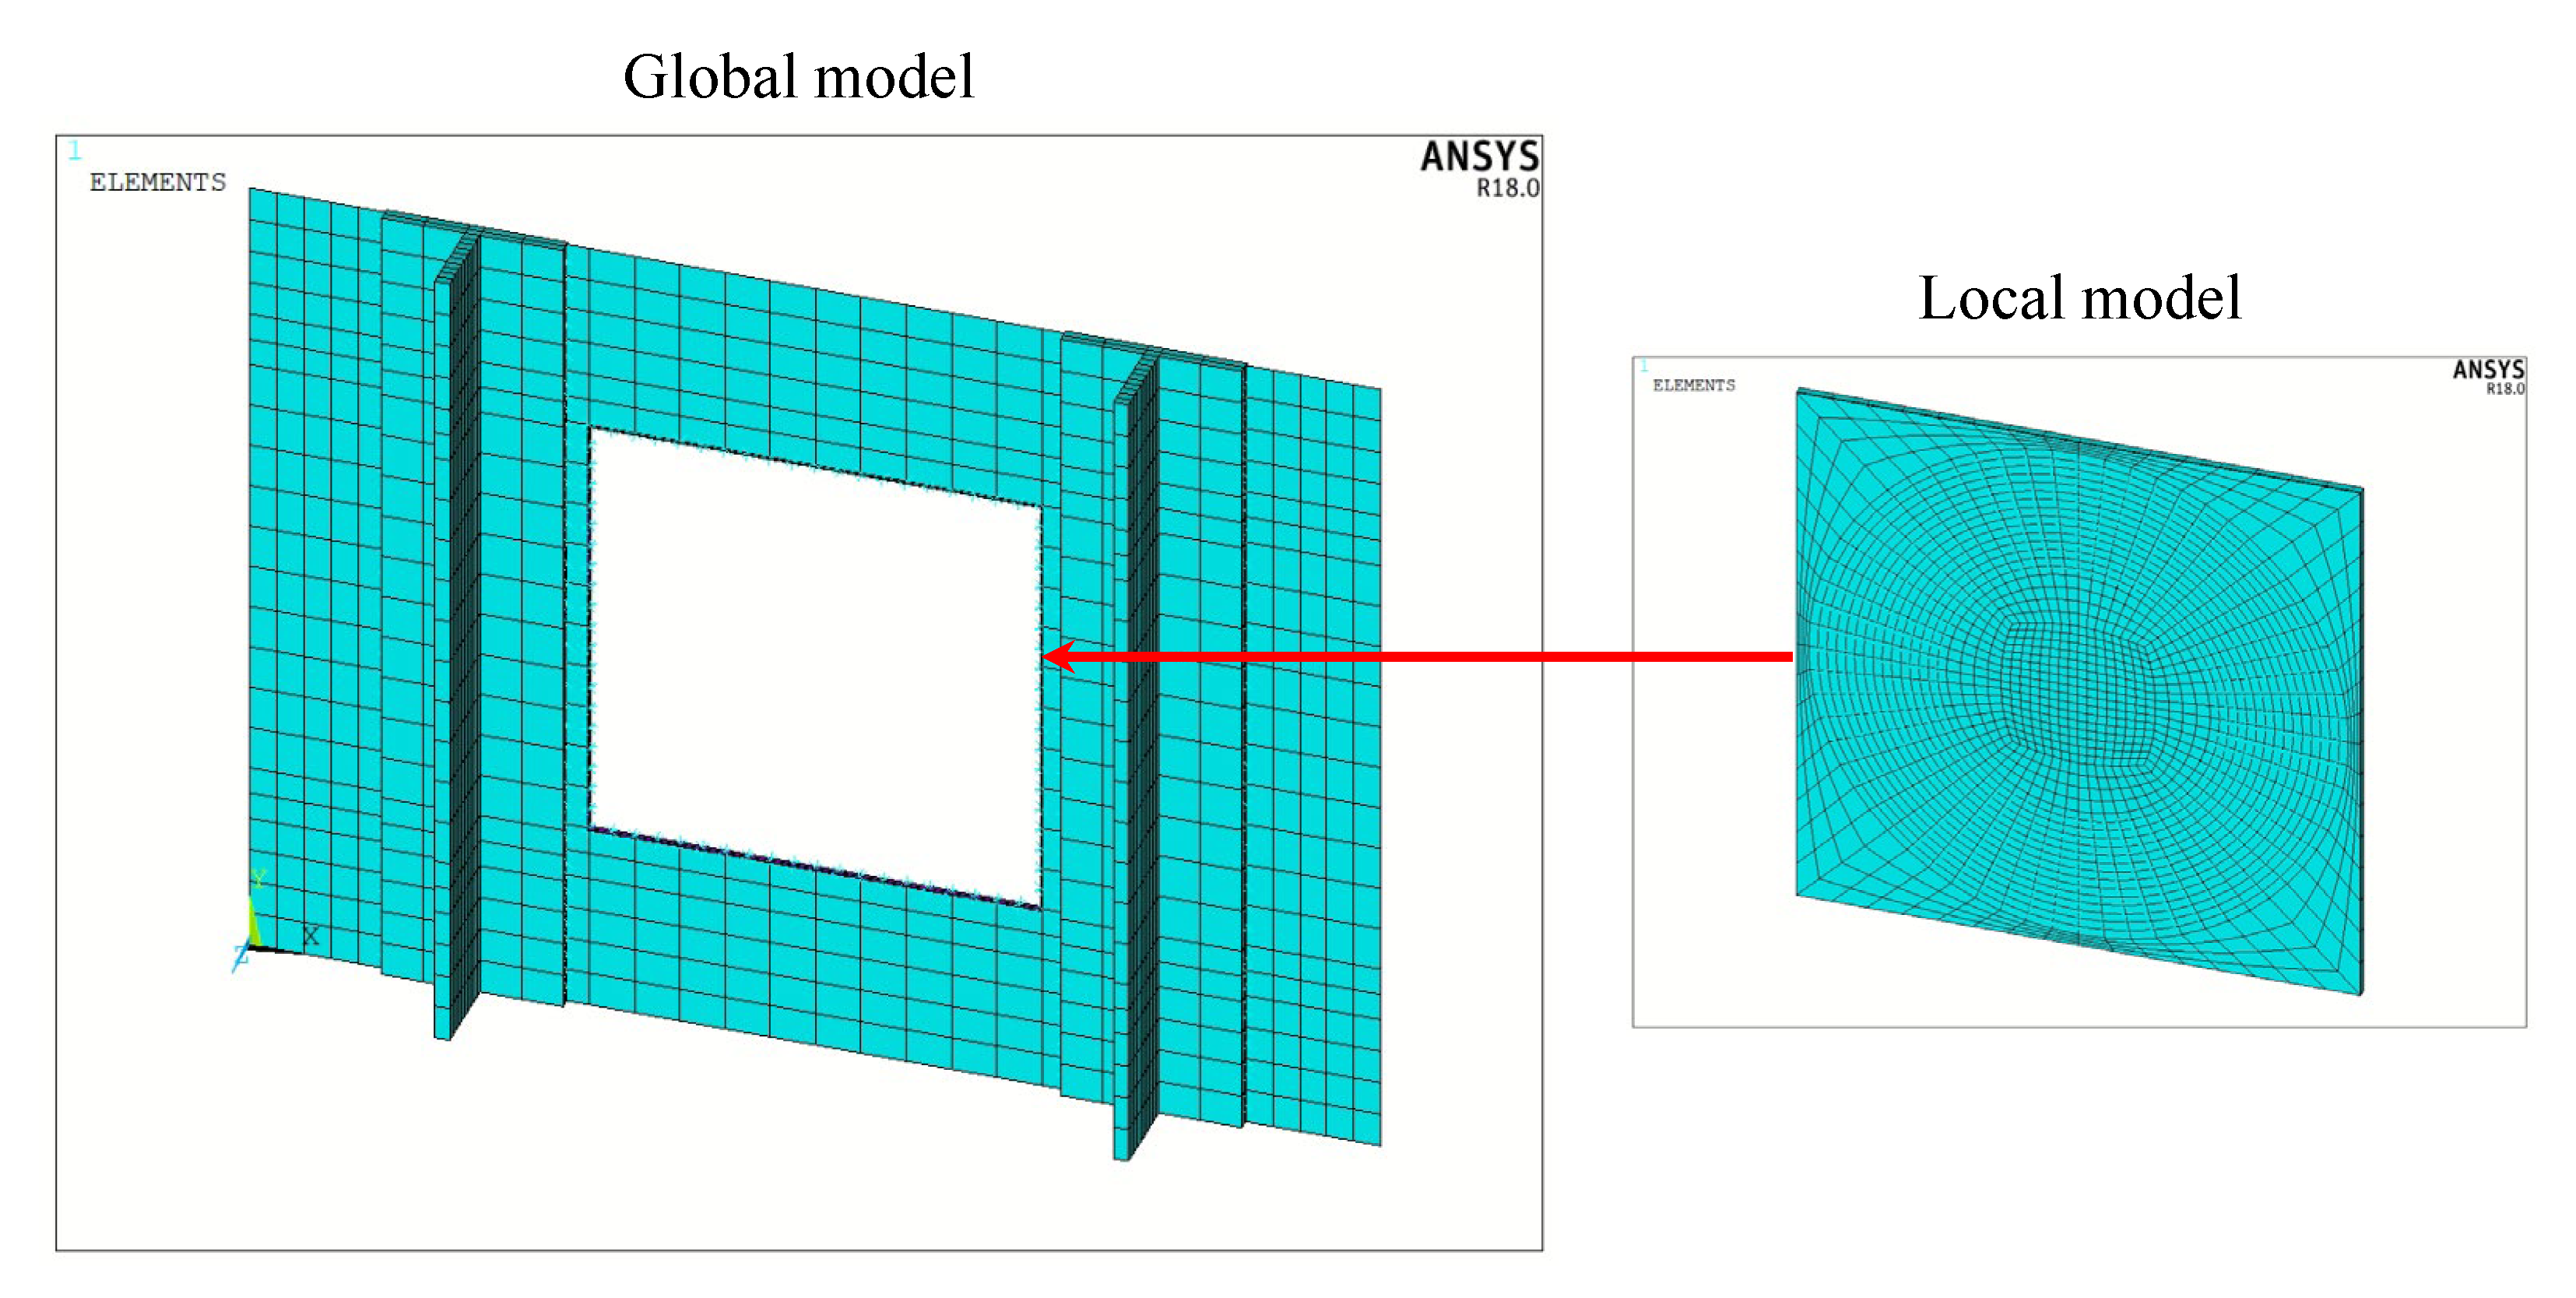
FEM Model
The reinforced composite panel was modelled using the parametric design language of the Ansys software version R18.0 (APDL). The global–local approach was used to reduce the computational effort. Hence, a coarse mesh was used for the panel, representing the global model, while the zone interested by the circular delamination and the propagation area, representing the local model, was finely discretised and connected to the global model through contact elements, as shown in
Figure 2.
The elements used for the discretisation were a combination of solid and shell. In detail, SOLID186 elements, defined by 20 nodes each having three degrees of freedom, were chosen for the stringers, the underlying skin, the delaminated area and the propagation zone. The layered structural solid option was set to properly assign the composite materials and stacking sequence. The remaining panel was modelled as a bidimensional part and meshed with layered shell elements.
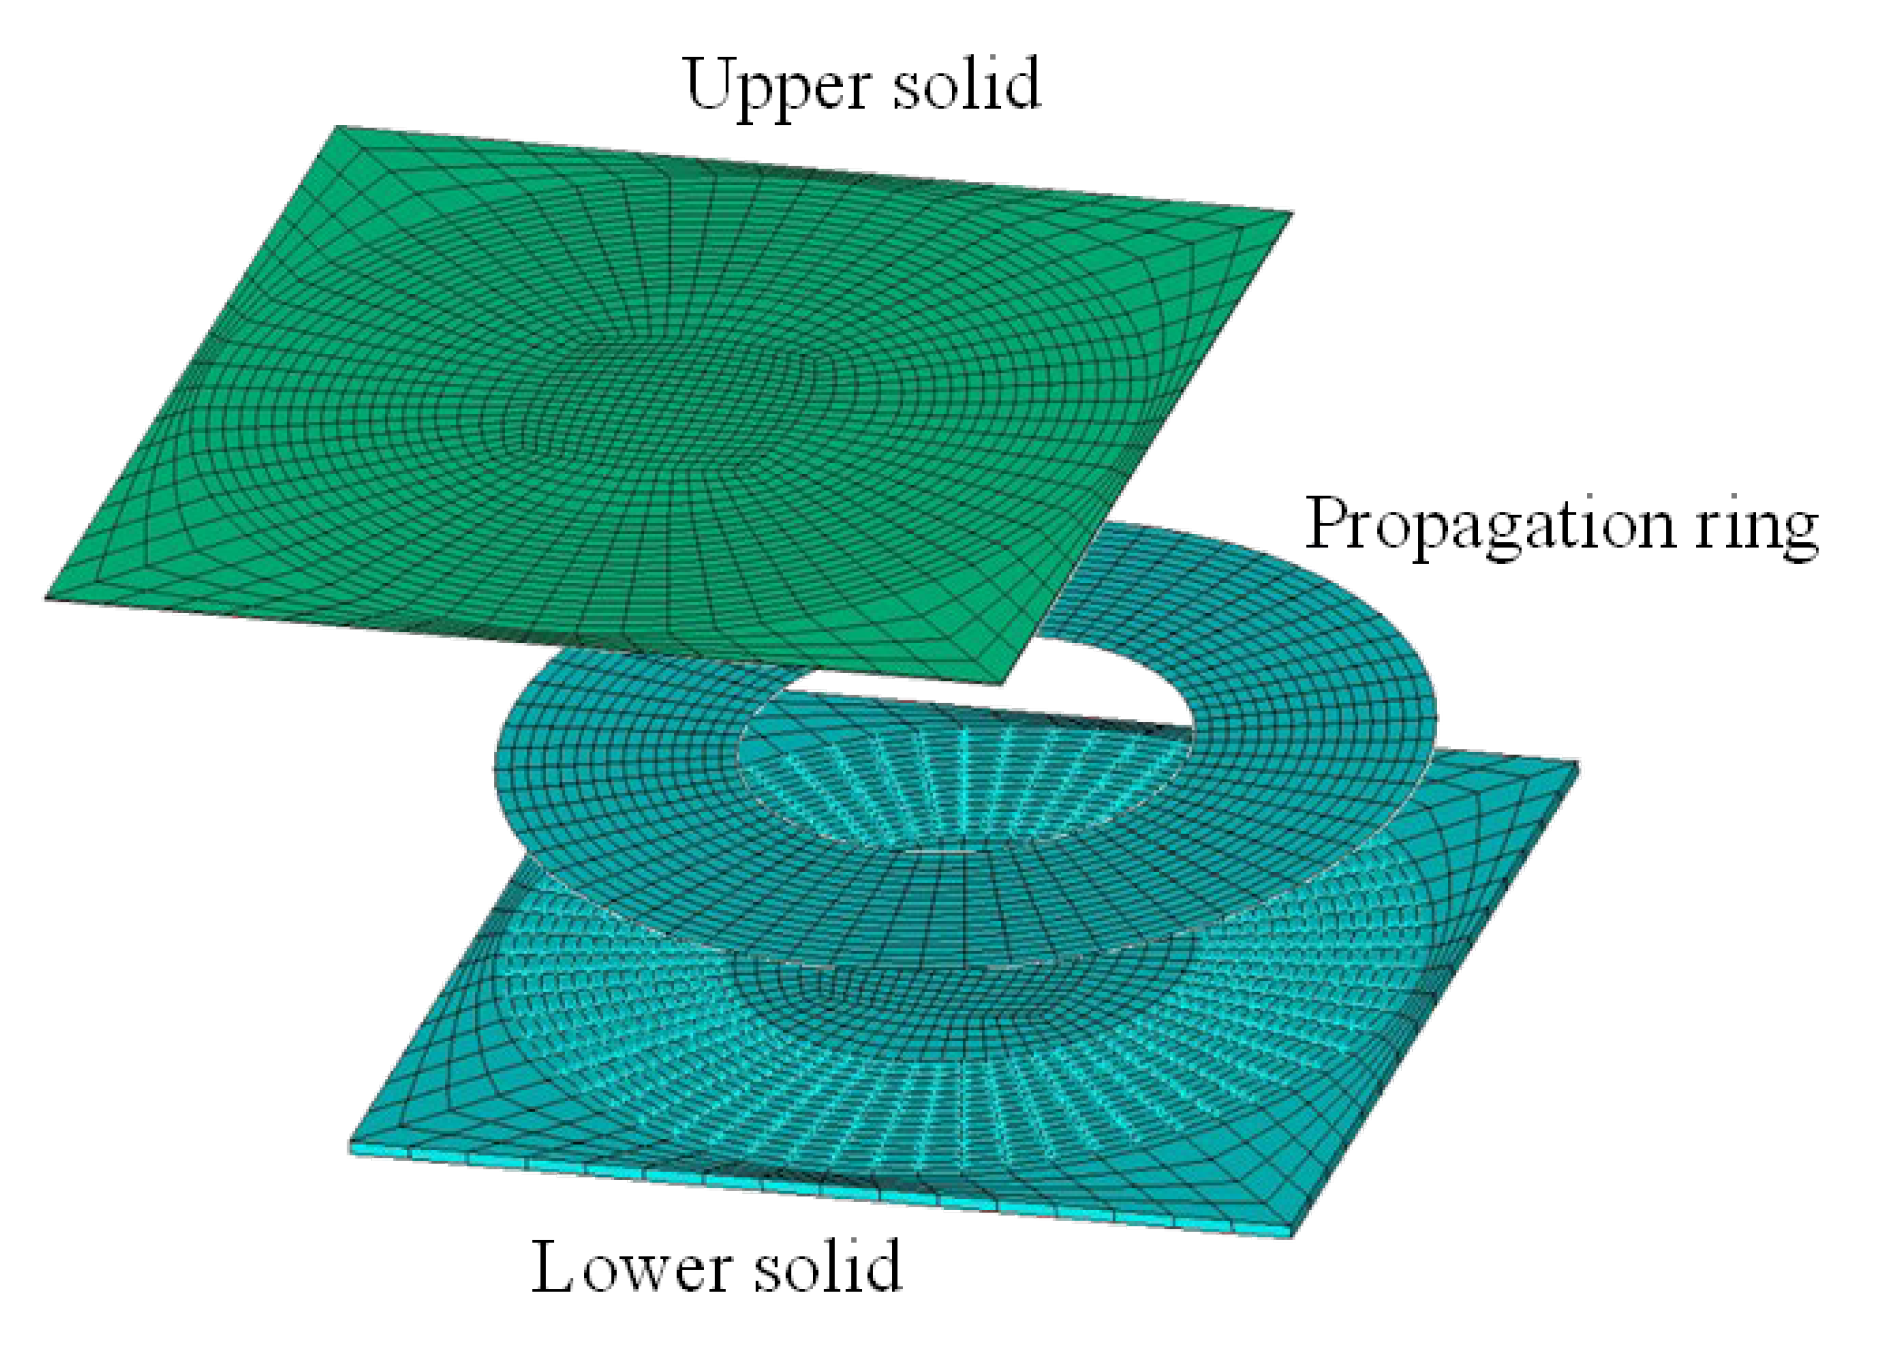
The detail of the delamination and the area eventually affected by the propagation were modelled with two overlying solids that were equal but distinct. In particular, the thickness of the solid on the top was determined by the number of layers under which the delamination was placed (e.g., if the delamination was located under three layers, the upper solid thickness was 3 ×
ply thickness), while the remaining thickness was determined by the layers underneath the delamination (lower solid). The circular delamination was simulated by a zone whose nodes were related by simple contact elements that prevented penetration, while the nodes of the propagation ring were initially bonded and were allowed to separate if and when the propagation criterion in Equation (2) was met. The detail of the local model is shown in
Figure 3.
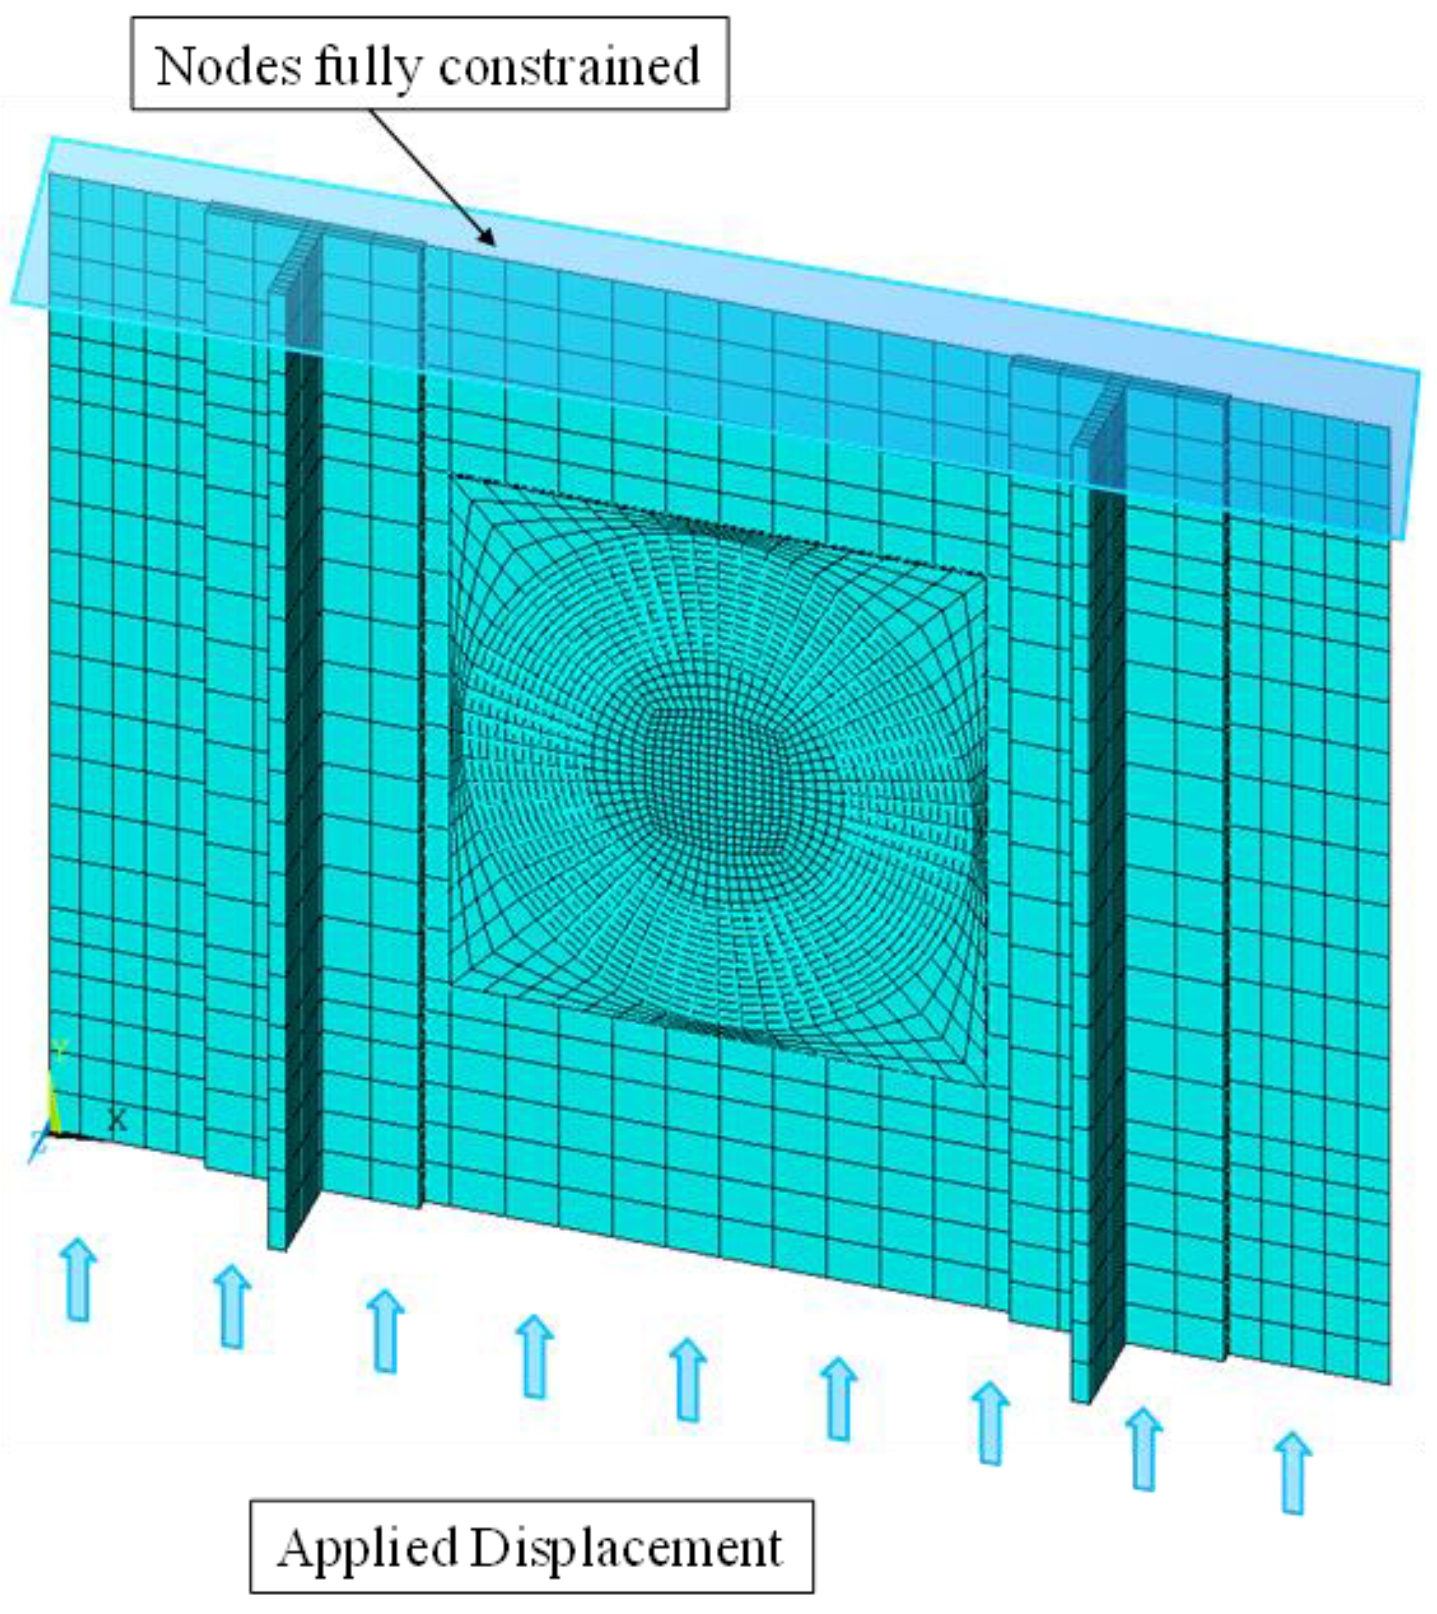
The stiffened panel was analysed under compression in the stiffeners’ direction. According to
Figure 4, the nodes belonging to one panel edge were fully constrained, i.e., all of the translational and rotational degrees of freedom were suppressed, while on the other side of the panel, compressive displacement was applied and the other degrees of freedom were clamped.
First, linear eigenvalue buckling analyses were conducted to assess the buckling load of the circular delamination, the buckling load of the skin and finally the global buckling load, also involving the stiffeners. Then, non-linear static analyses, under the displacement control mode, were performed using the SMXB procedure in order to determine the delamination propagation initiation load and the final delamination status for all of the sixteen configurations.
4. Results and Discussion
This section compares the results obtained for each configuration analysed, focusing on a particular geometric aspect each time. Indeed, the first subsection reports, discusses and compares the results of CD1–CD4 configurations, in which all geometric parameters are equal except for the size of the delamination passing from a 30 mm radius to a 40 mm radius, and the depth passing from 0.33 mm to 0.66 mm. The second subsection shows the results of the CD5–CD8 configurations, which were obtained from the first four by increasing the number of layers from 16 to 24 in the skin and foot stringer. Then,
Section 3 presents the CD9 and CD10 configurations, where the thicknesses and stacking sequences are the same as the CD1–CD4 configurations, but the bay width was reduced from 176 mm to 146 mm. Then, again, the fourth subsection reports the results of the remaining six configurations (CD11–CD16), which were obtained from the CD9 and CD10 by increasing the foot stringer thickness from 2.64 mm to 3.96 mm. The depth and radius of the delamination are again varied. Finally,
Section 4.5 provides a comparison of all of the analysed configurations for a better understanding of the results.
In the following sections, the contour plots of the out-of-plane displacements related to the eigenvalue buckling analyses (hereafter referred to as 1, 2 and 3) were reported without legends, as they do not represent the real displacements of the structure but provide the effective buckling shapes experienced by the panels. On the contrary, the legends related to the deformed shapes representing the out-of-plane displacements at the delamination initiation load (hereafter marked with number 4), obtained though non-linear analyses, have been reported.
4.1. CD1–CD4 Configurations
In
Table 3, the buckling loads and displacement obtained from the linear eigenvalue buckling analyses are reported for each configuration.
The stiffness of the panels remains almost the same. As expected, the configurations with delamination under two layers (CD1 and CD3) experience the local buckling of delamination at loads, that are 3.7 kN and 6.5 kN, respectively, much lower than the configurations with delamination under four layers (CD2 and CD4), where the loads are 21.4 and 38.2 kN. The skin buckling and the global buckling (which includes stringers) are very similar in terms of loads and displacements.
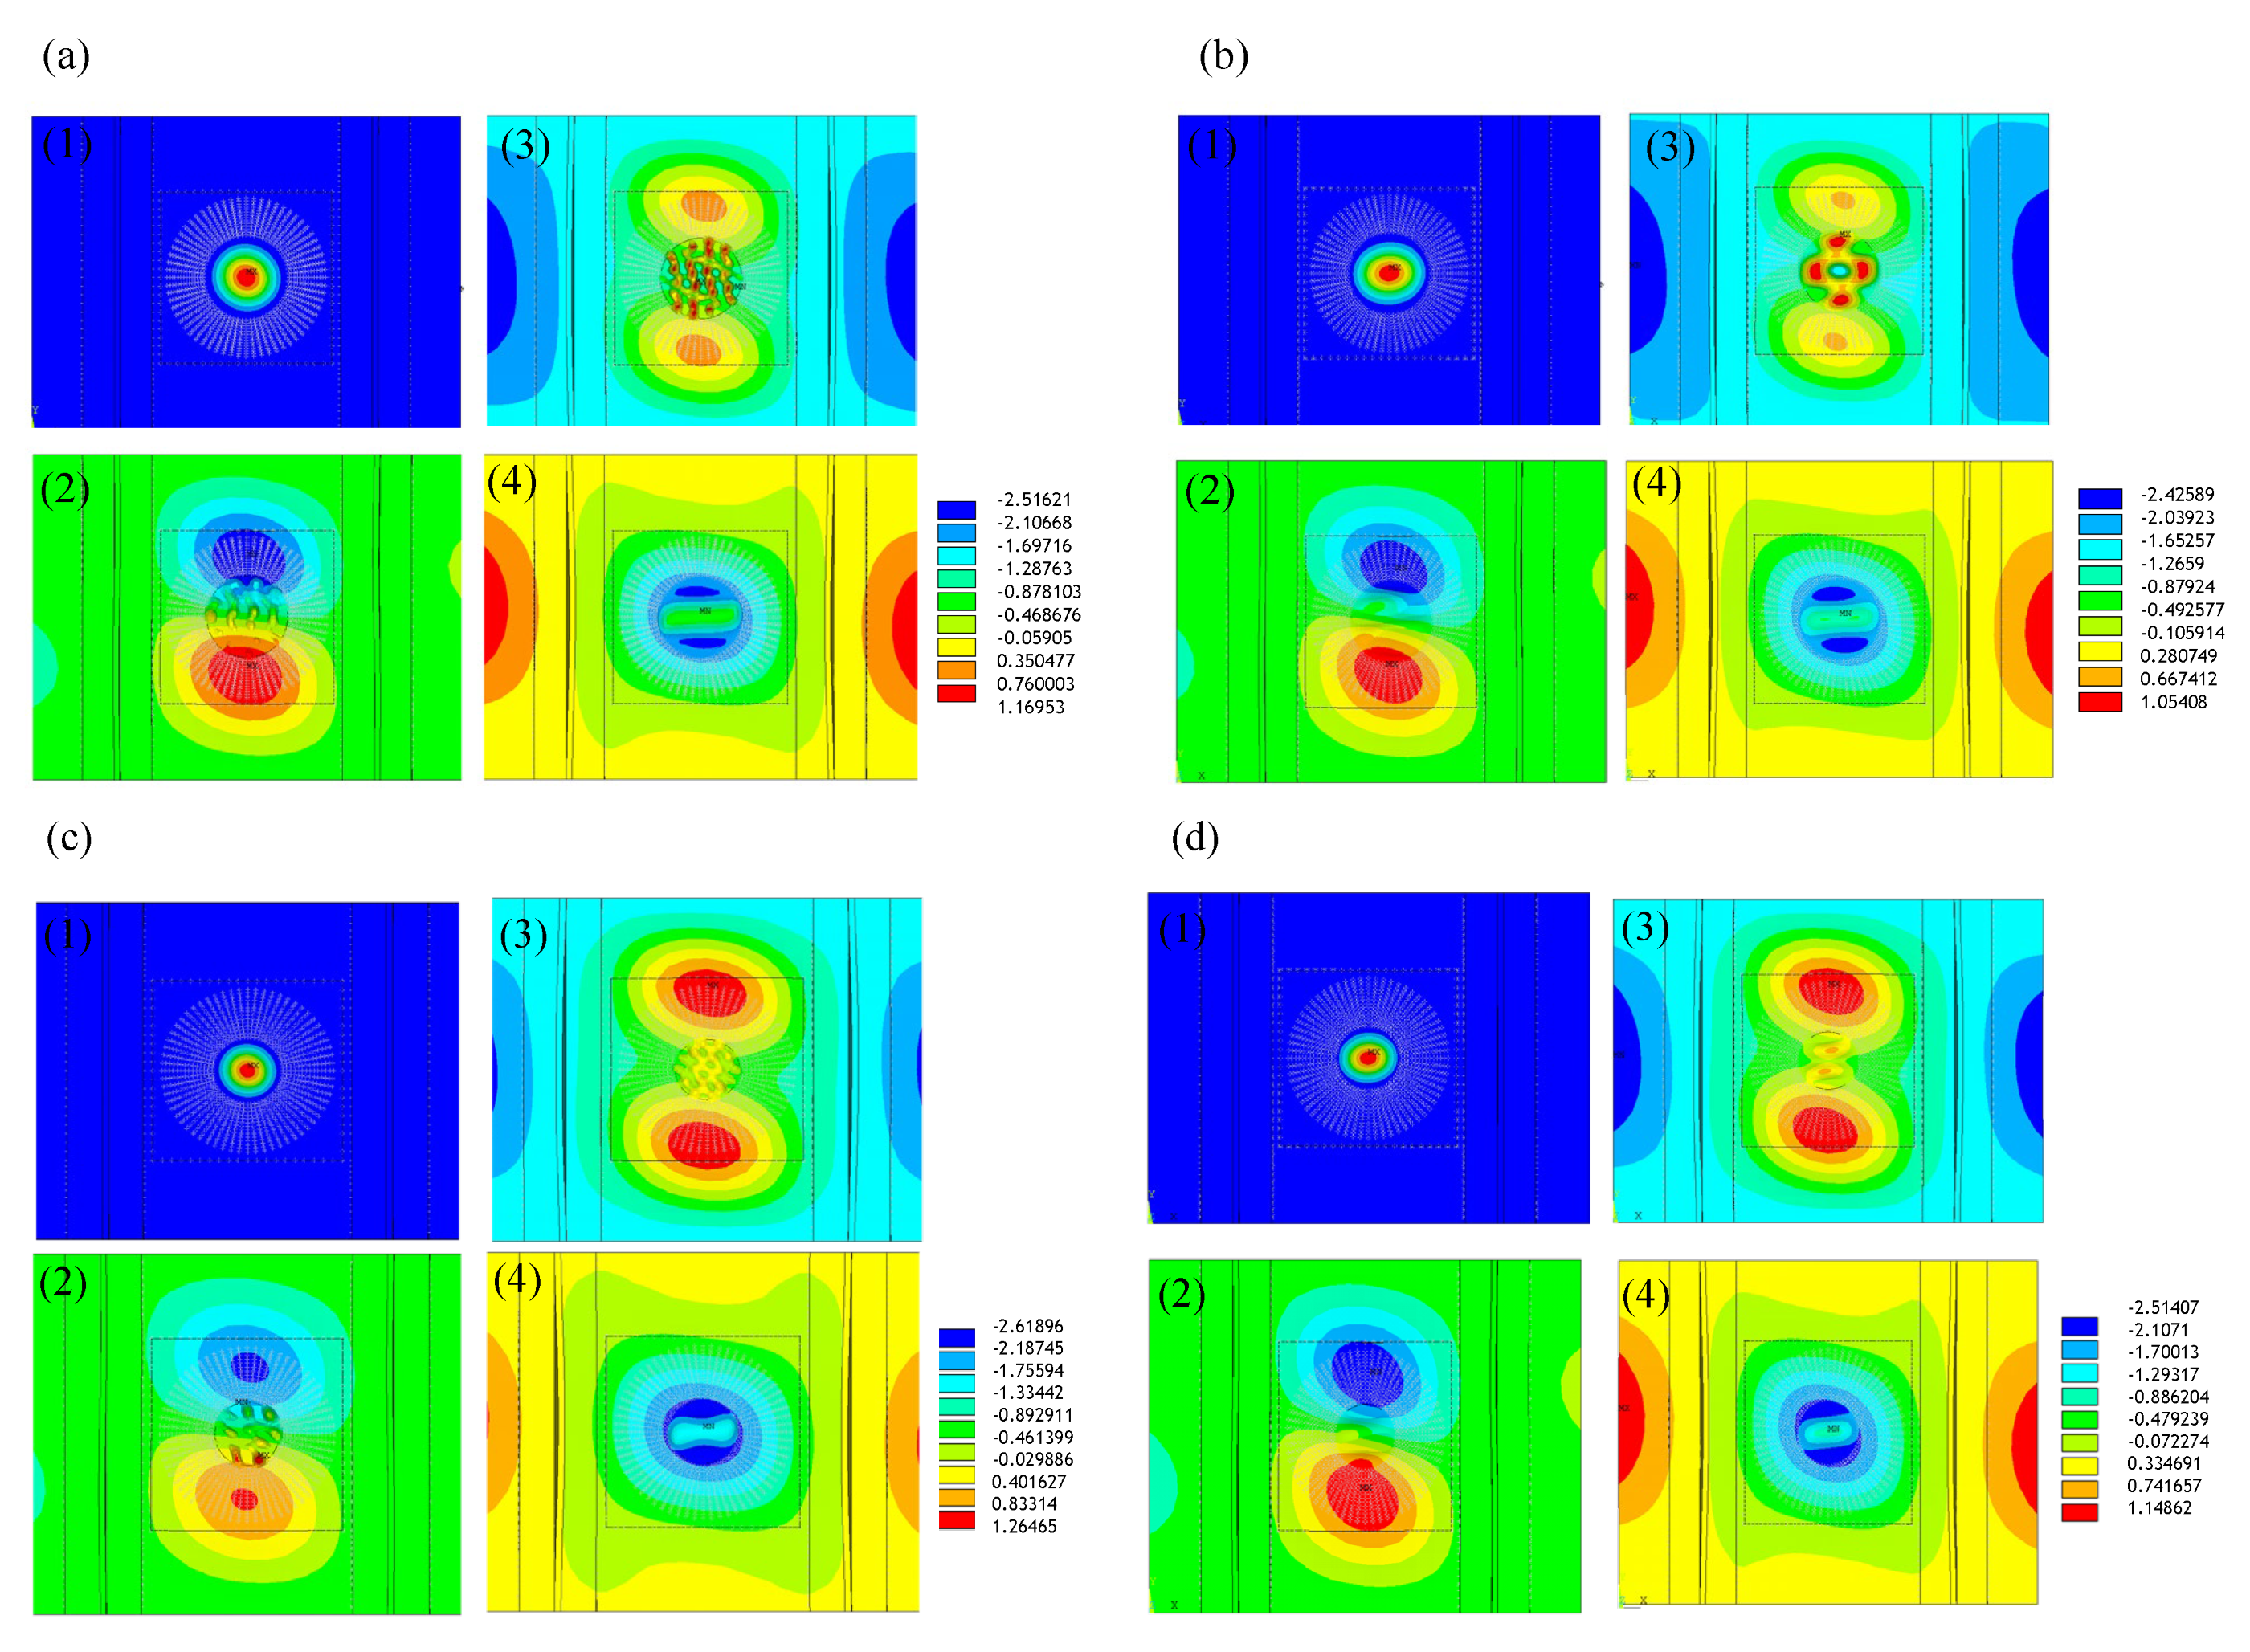
Figure 5 shows the deformed shape in terms of out-of-plane displacements for the CD1–CD4 configurations.
The initiation of propagation occurs earlier in the CD1 and CD3 configurations, but in all of the configurations, the delamination starts to propagate at loads (108 and 111.6 kN) considerably higher than the skin buckling (83.3 and 86.5 kN) and very close to the global buckling (123.3 and 124.6 kN), as can be noticed form the deformed shape in
Figure 5. Indeed, propagation initiates but does not evolve due to the global buckling of the panel, as shown in
Figure 6. All of the non-linear static analyses performed with the SMXB procedure stopped due to non-convergence after the global buckling of the panel.
4.2. CD5–CD8 Configurations
In
Table 4, the buckling loads and displacement obtained from the linear eigenvalue buckling analyses are reported for each configuration.
According to
Table 4, the global stiffness of the panels is again very similar (
). The loads related to the buckling of the delamination are very different (an order of magnitude) when the depth of the delamination changes, in this case doubling from two to four layers (from CD5, where it is 5.28 kN, to CD6, where it is 30.7 kN, and from CD7, where it is 9.2 kN, to CD8, where it is 53.7 kN). These configurations exhibit the buckling of the skin, coincident, or almost coincident, with the global buckling. Delamination initiation occurs before global buckling in all of the configurations, and specifically it is first triggered when the delamination is 0.66 mm deep (CD6 and CD8, where the onset load is 178 and 193 kN versus 200 kN of configurations CD5 and CD7).
Figure 7 displays the out-of-plane displacement contour plot of all of the configurations.
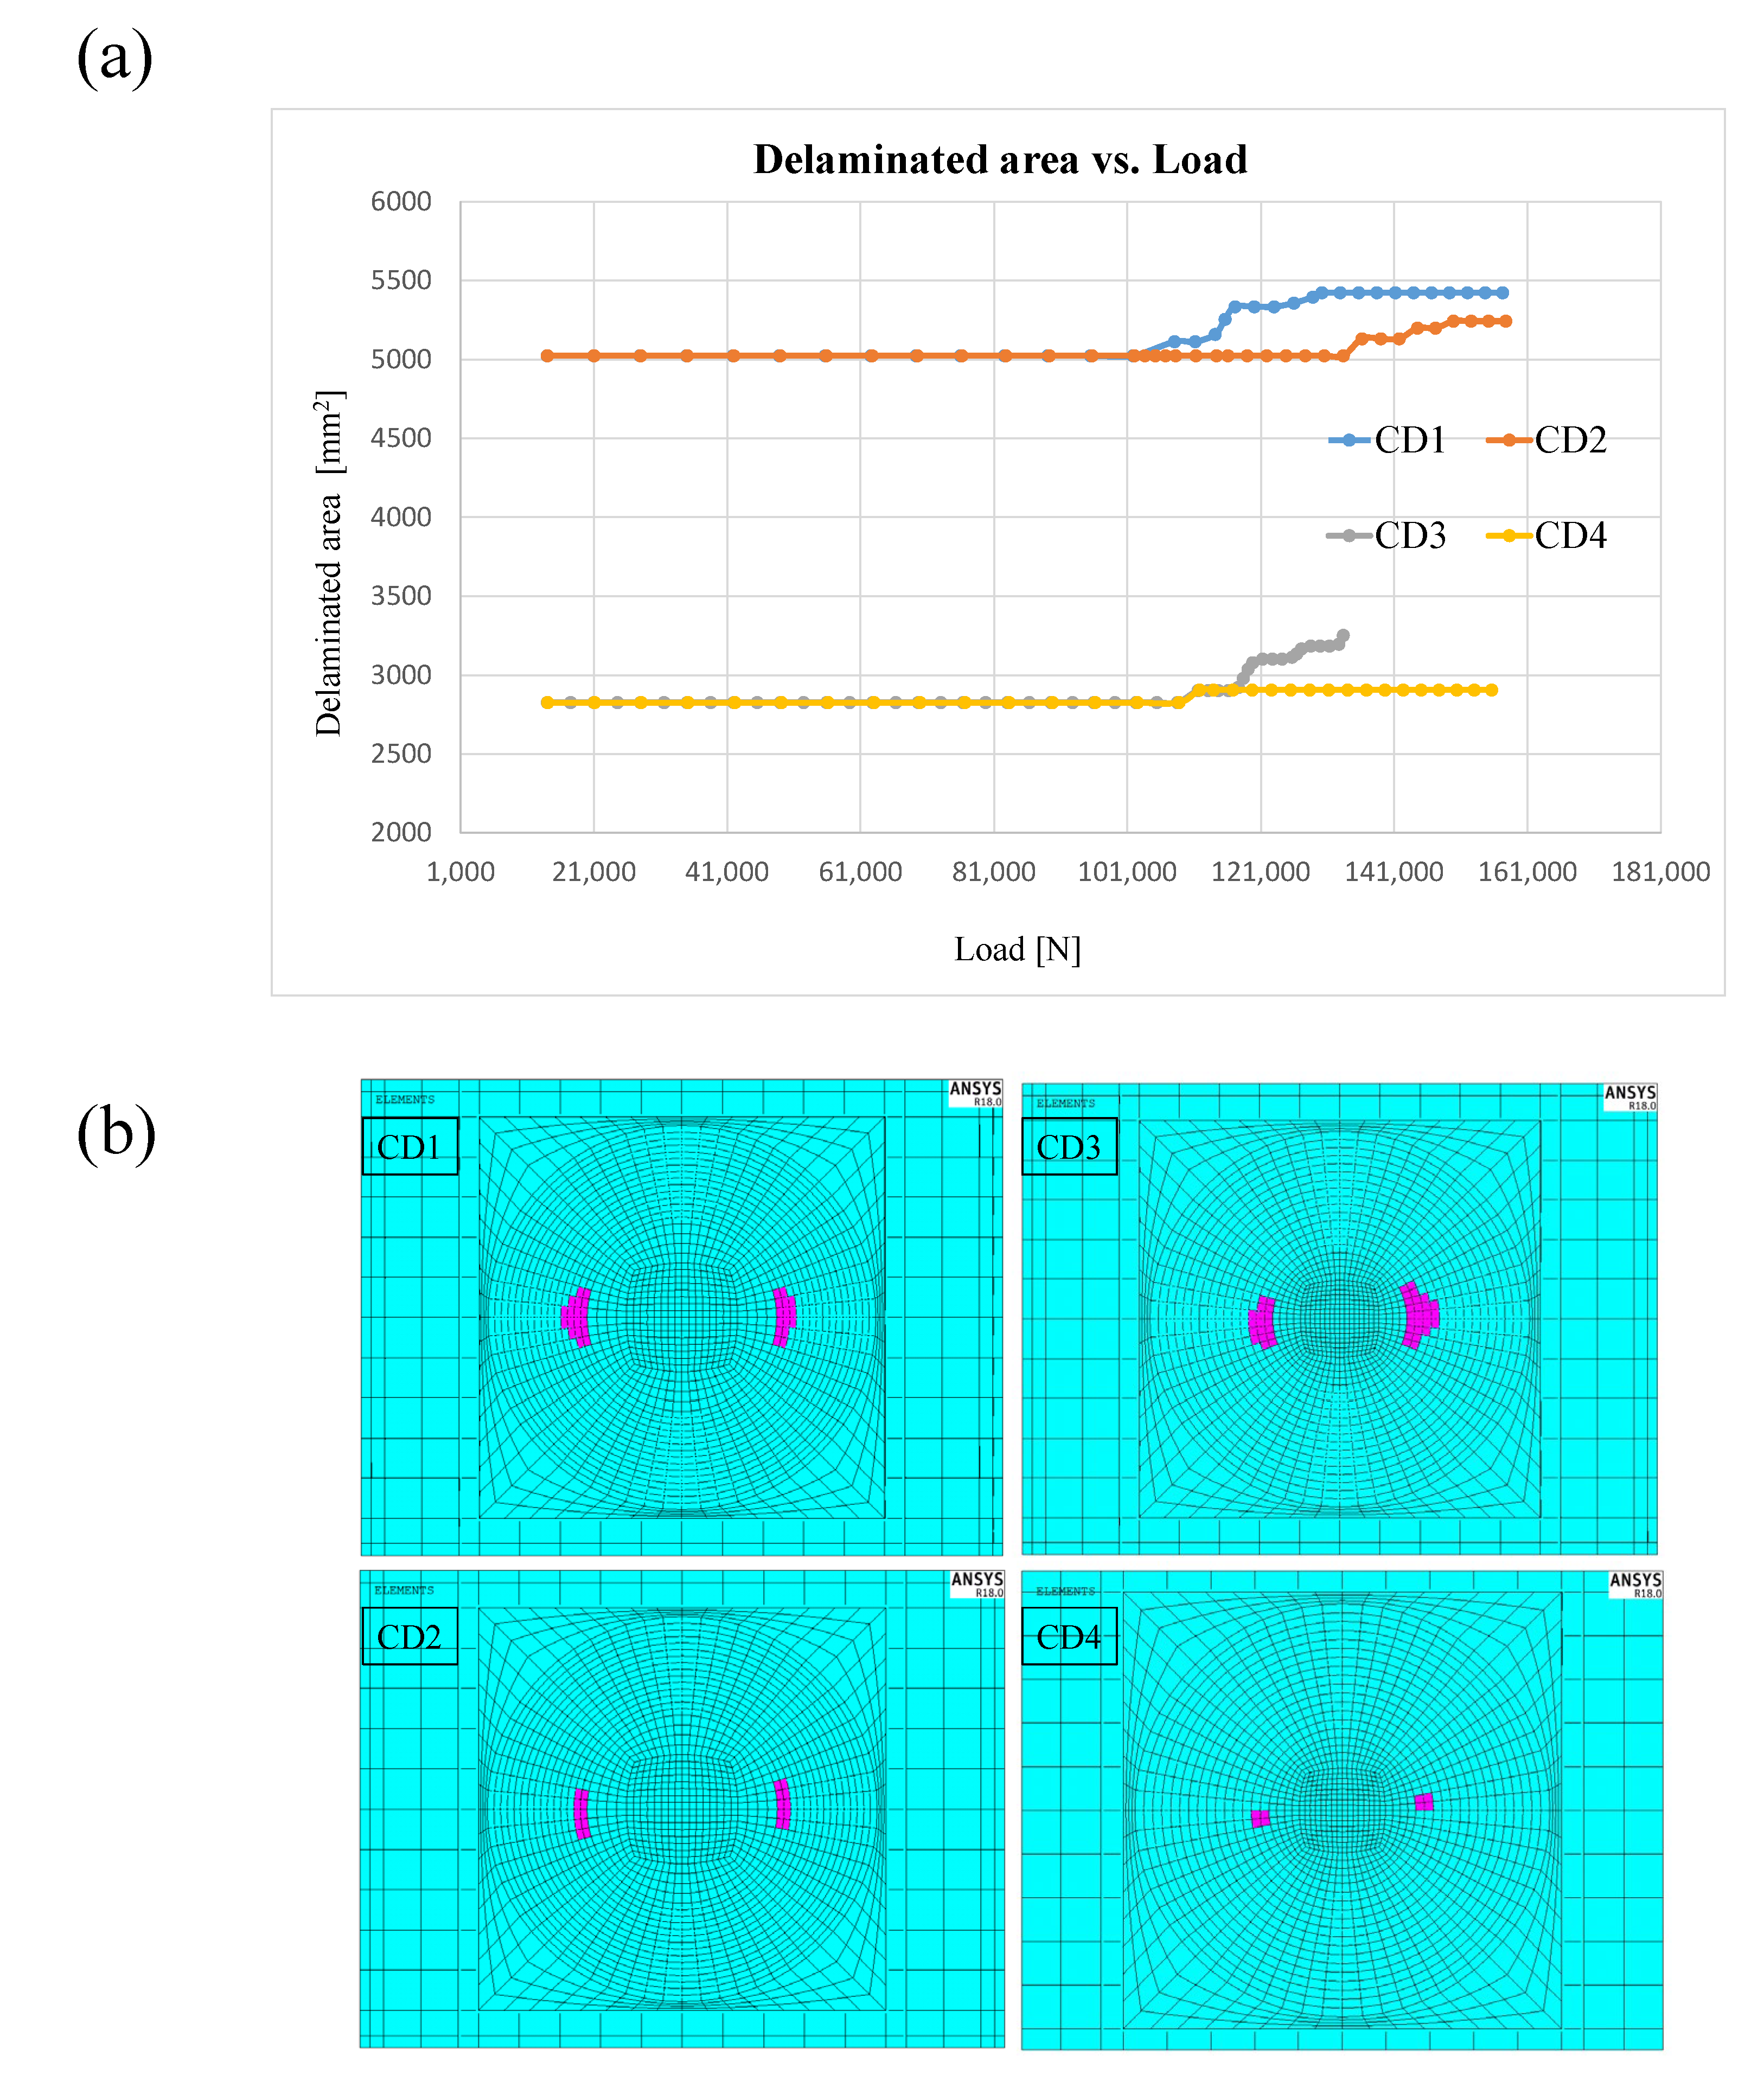
To summarise, in the configurations with delamination of both 40 mm and 30 mm of radius and depth of 0.33 mm (under two plies), the local buckling of the delamination occurs at very low loads (5.28 and 9.2 kN) and displacements (0.013 and 0.023 mm), but then propagation is triggered at elevated loads. On the contrary, in the case of delamination under four plies, of both radius 40 and 30 mm, the buckling of the delamination occurs at higher loads (30.7 and 53.7 kN) but propagation occurs earlier. According to
Figure 8a, representing the delaminated area evolution as a function of the load, CD6 and CD8 configurations present an unstable (sudden) delamination evolution, if compared against CD5 and CD7. Hence, if the delamination is more superficial, propagation occurs later and more gradually. In
Figure 8b, the final status of delamination can be observed.
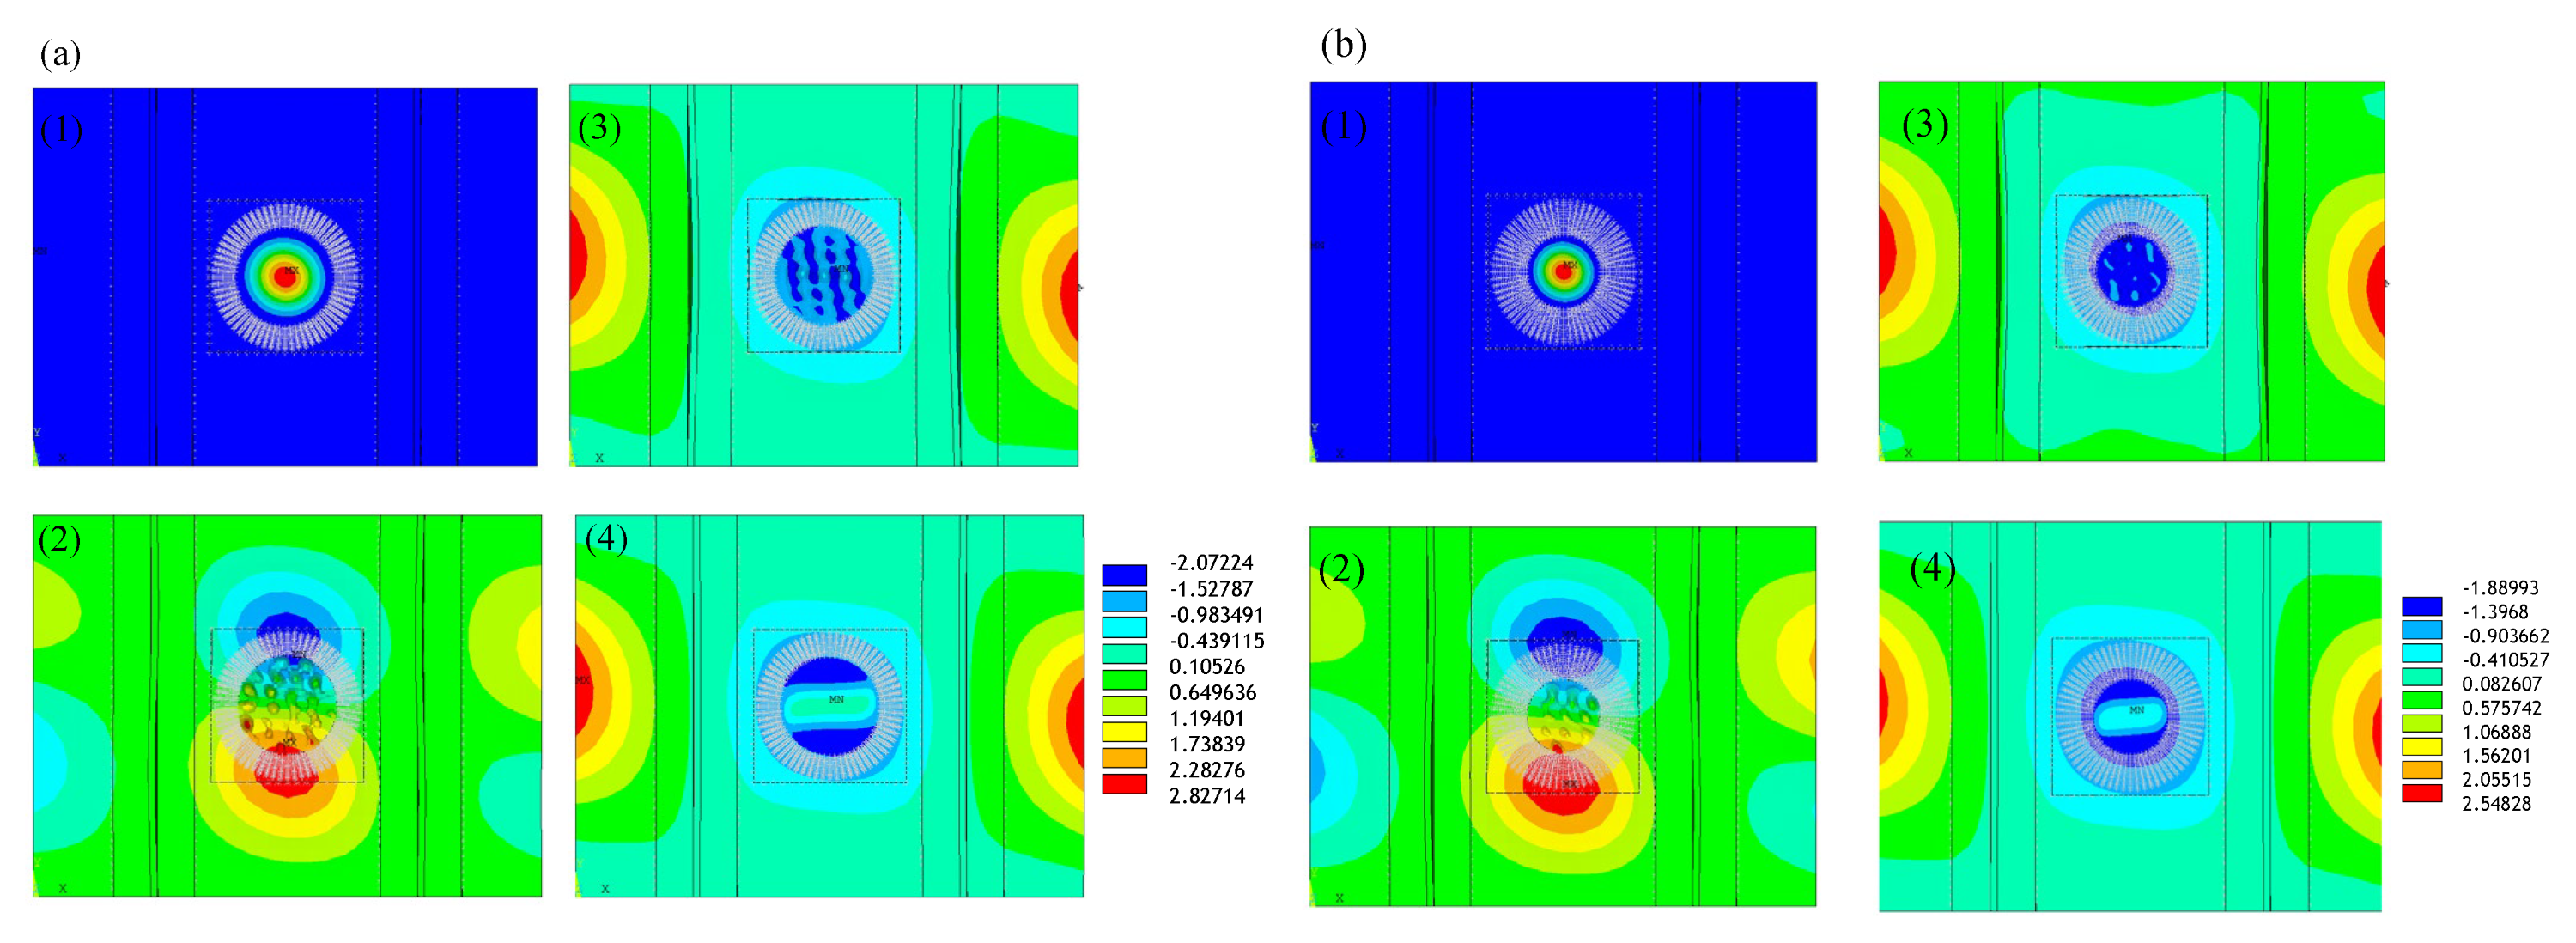
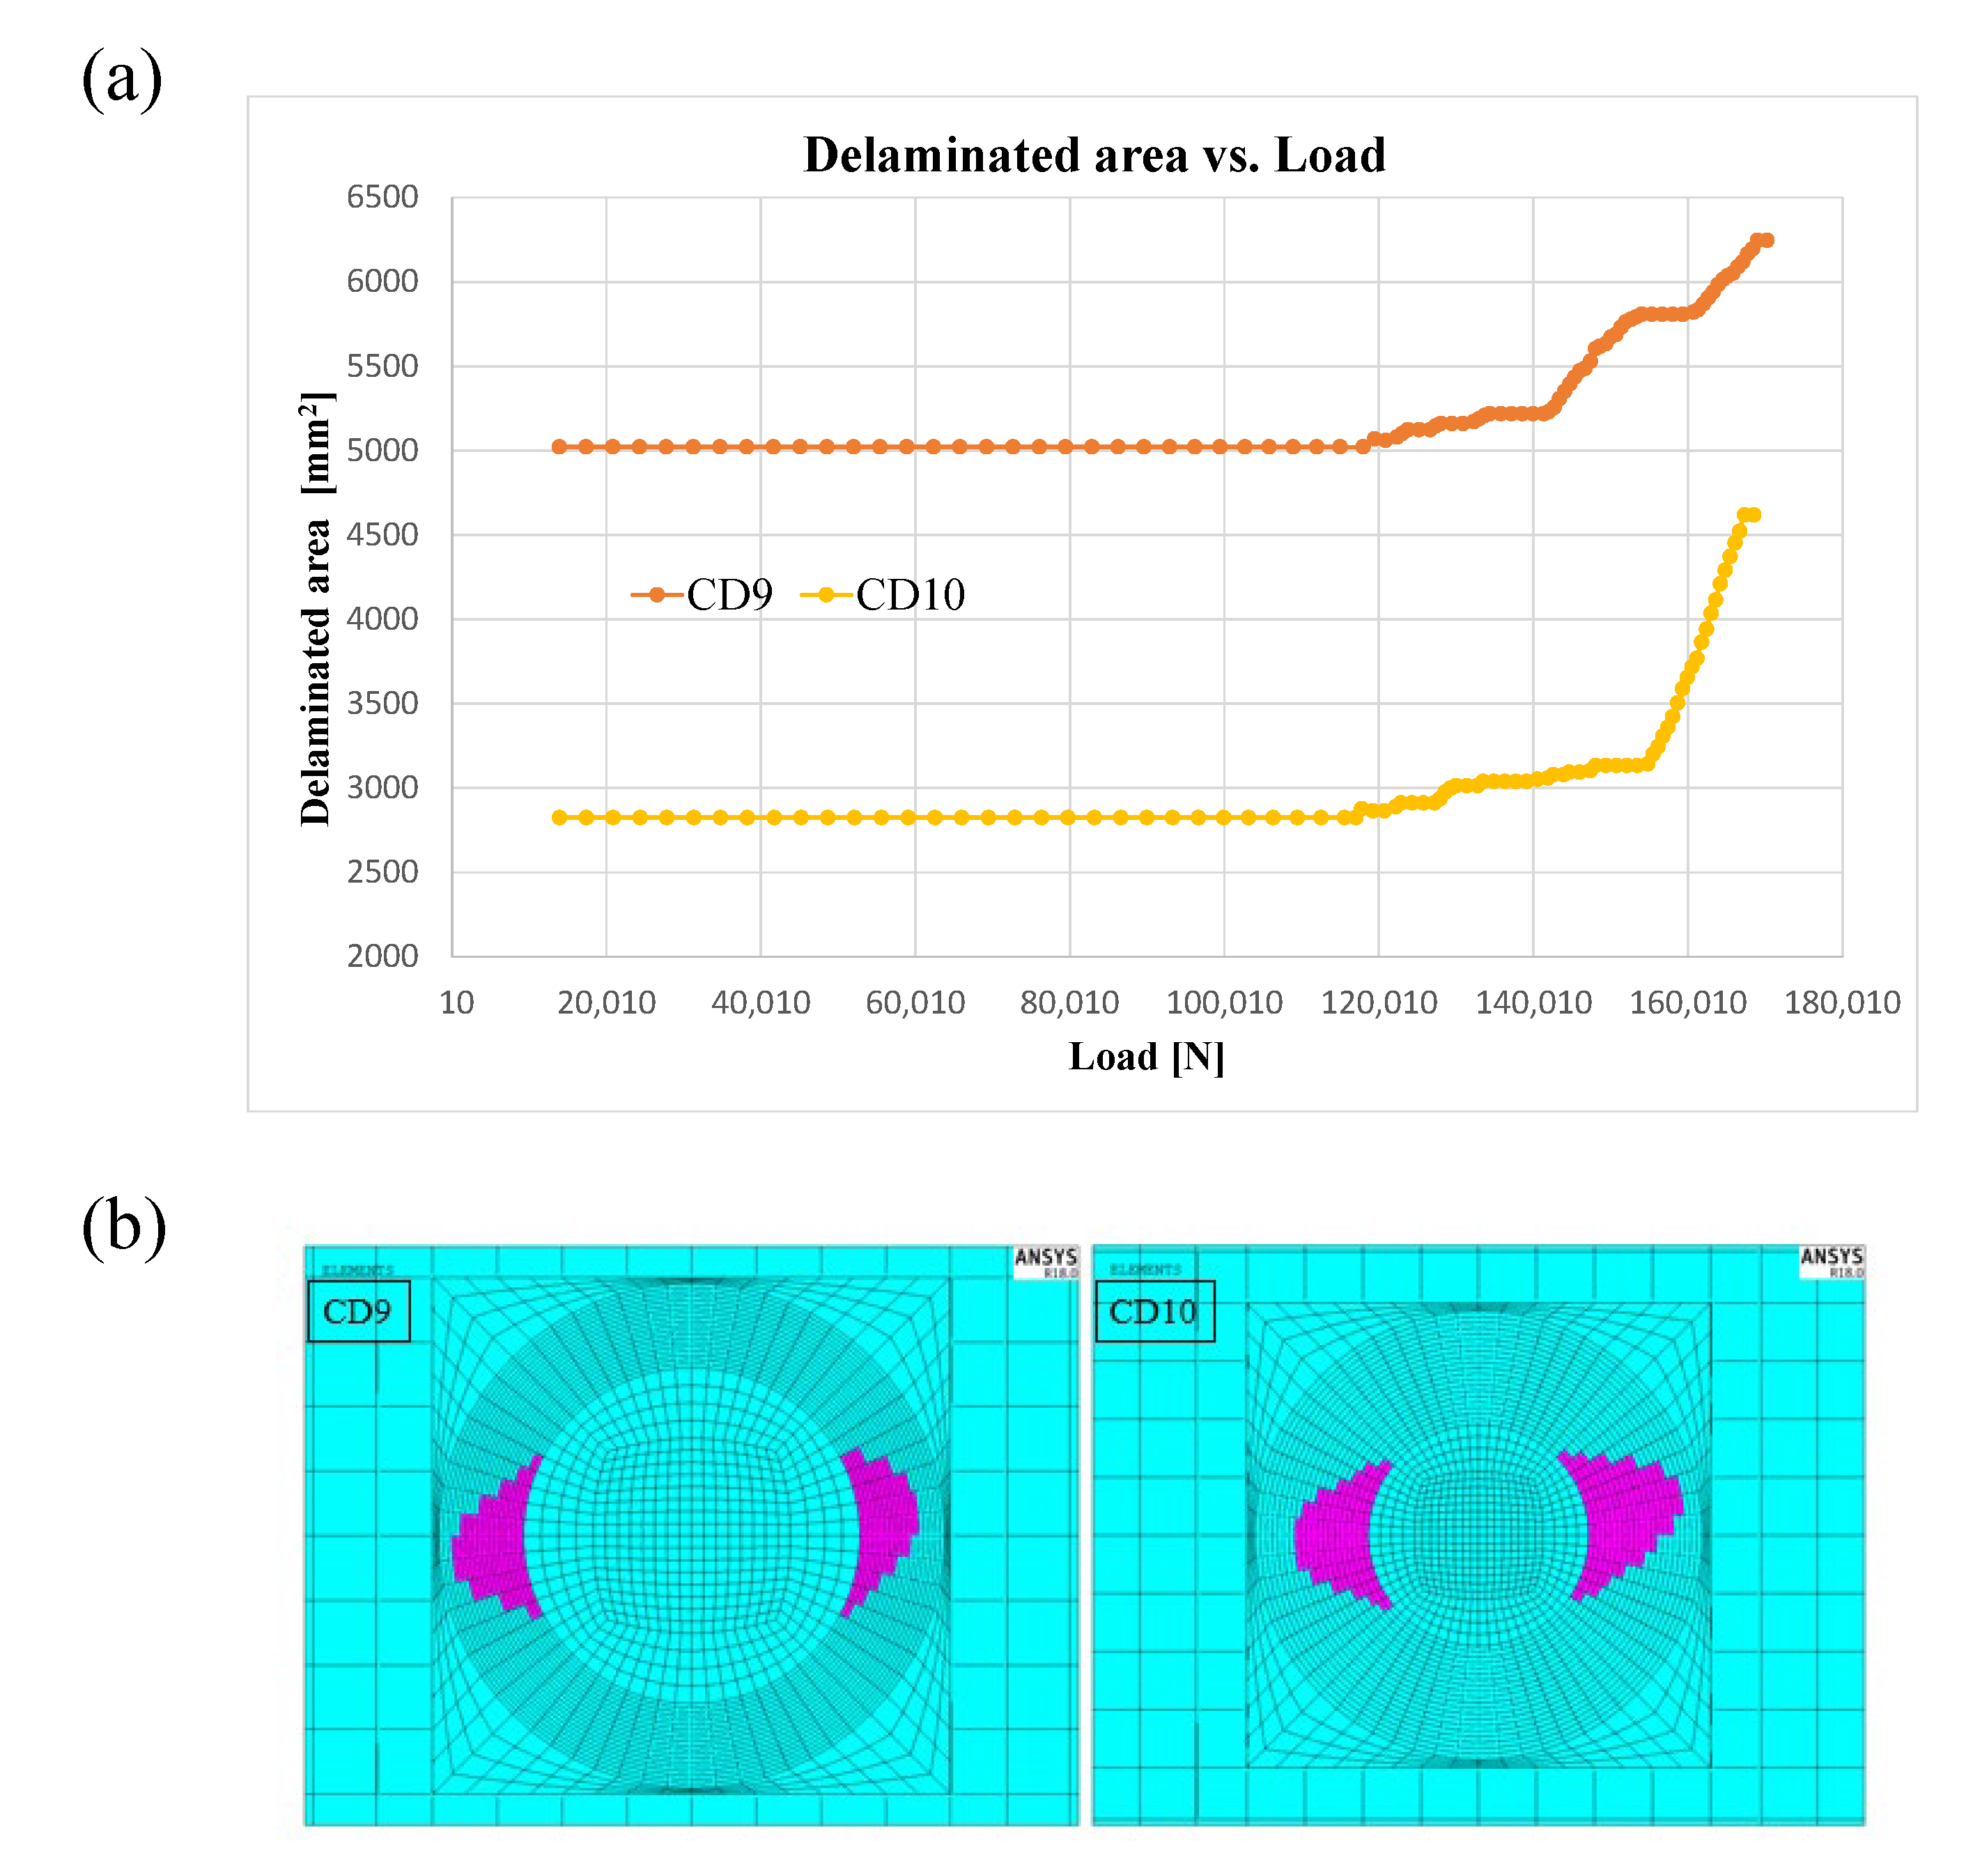
4.3. CD9–CD10 Configurations
In
Table 5, the buckling loads and displacement obtained from the linear eigenvalue buckling analyses are reported for each configuration.
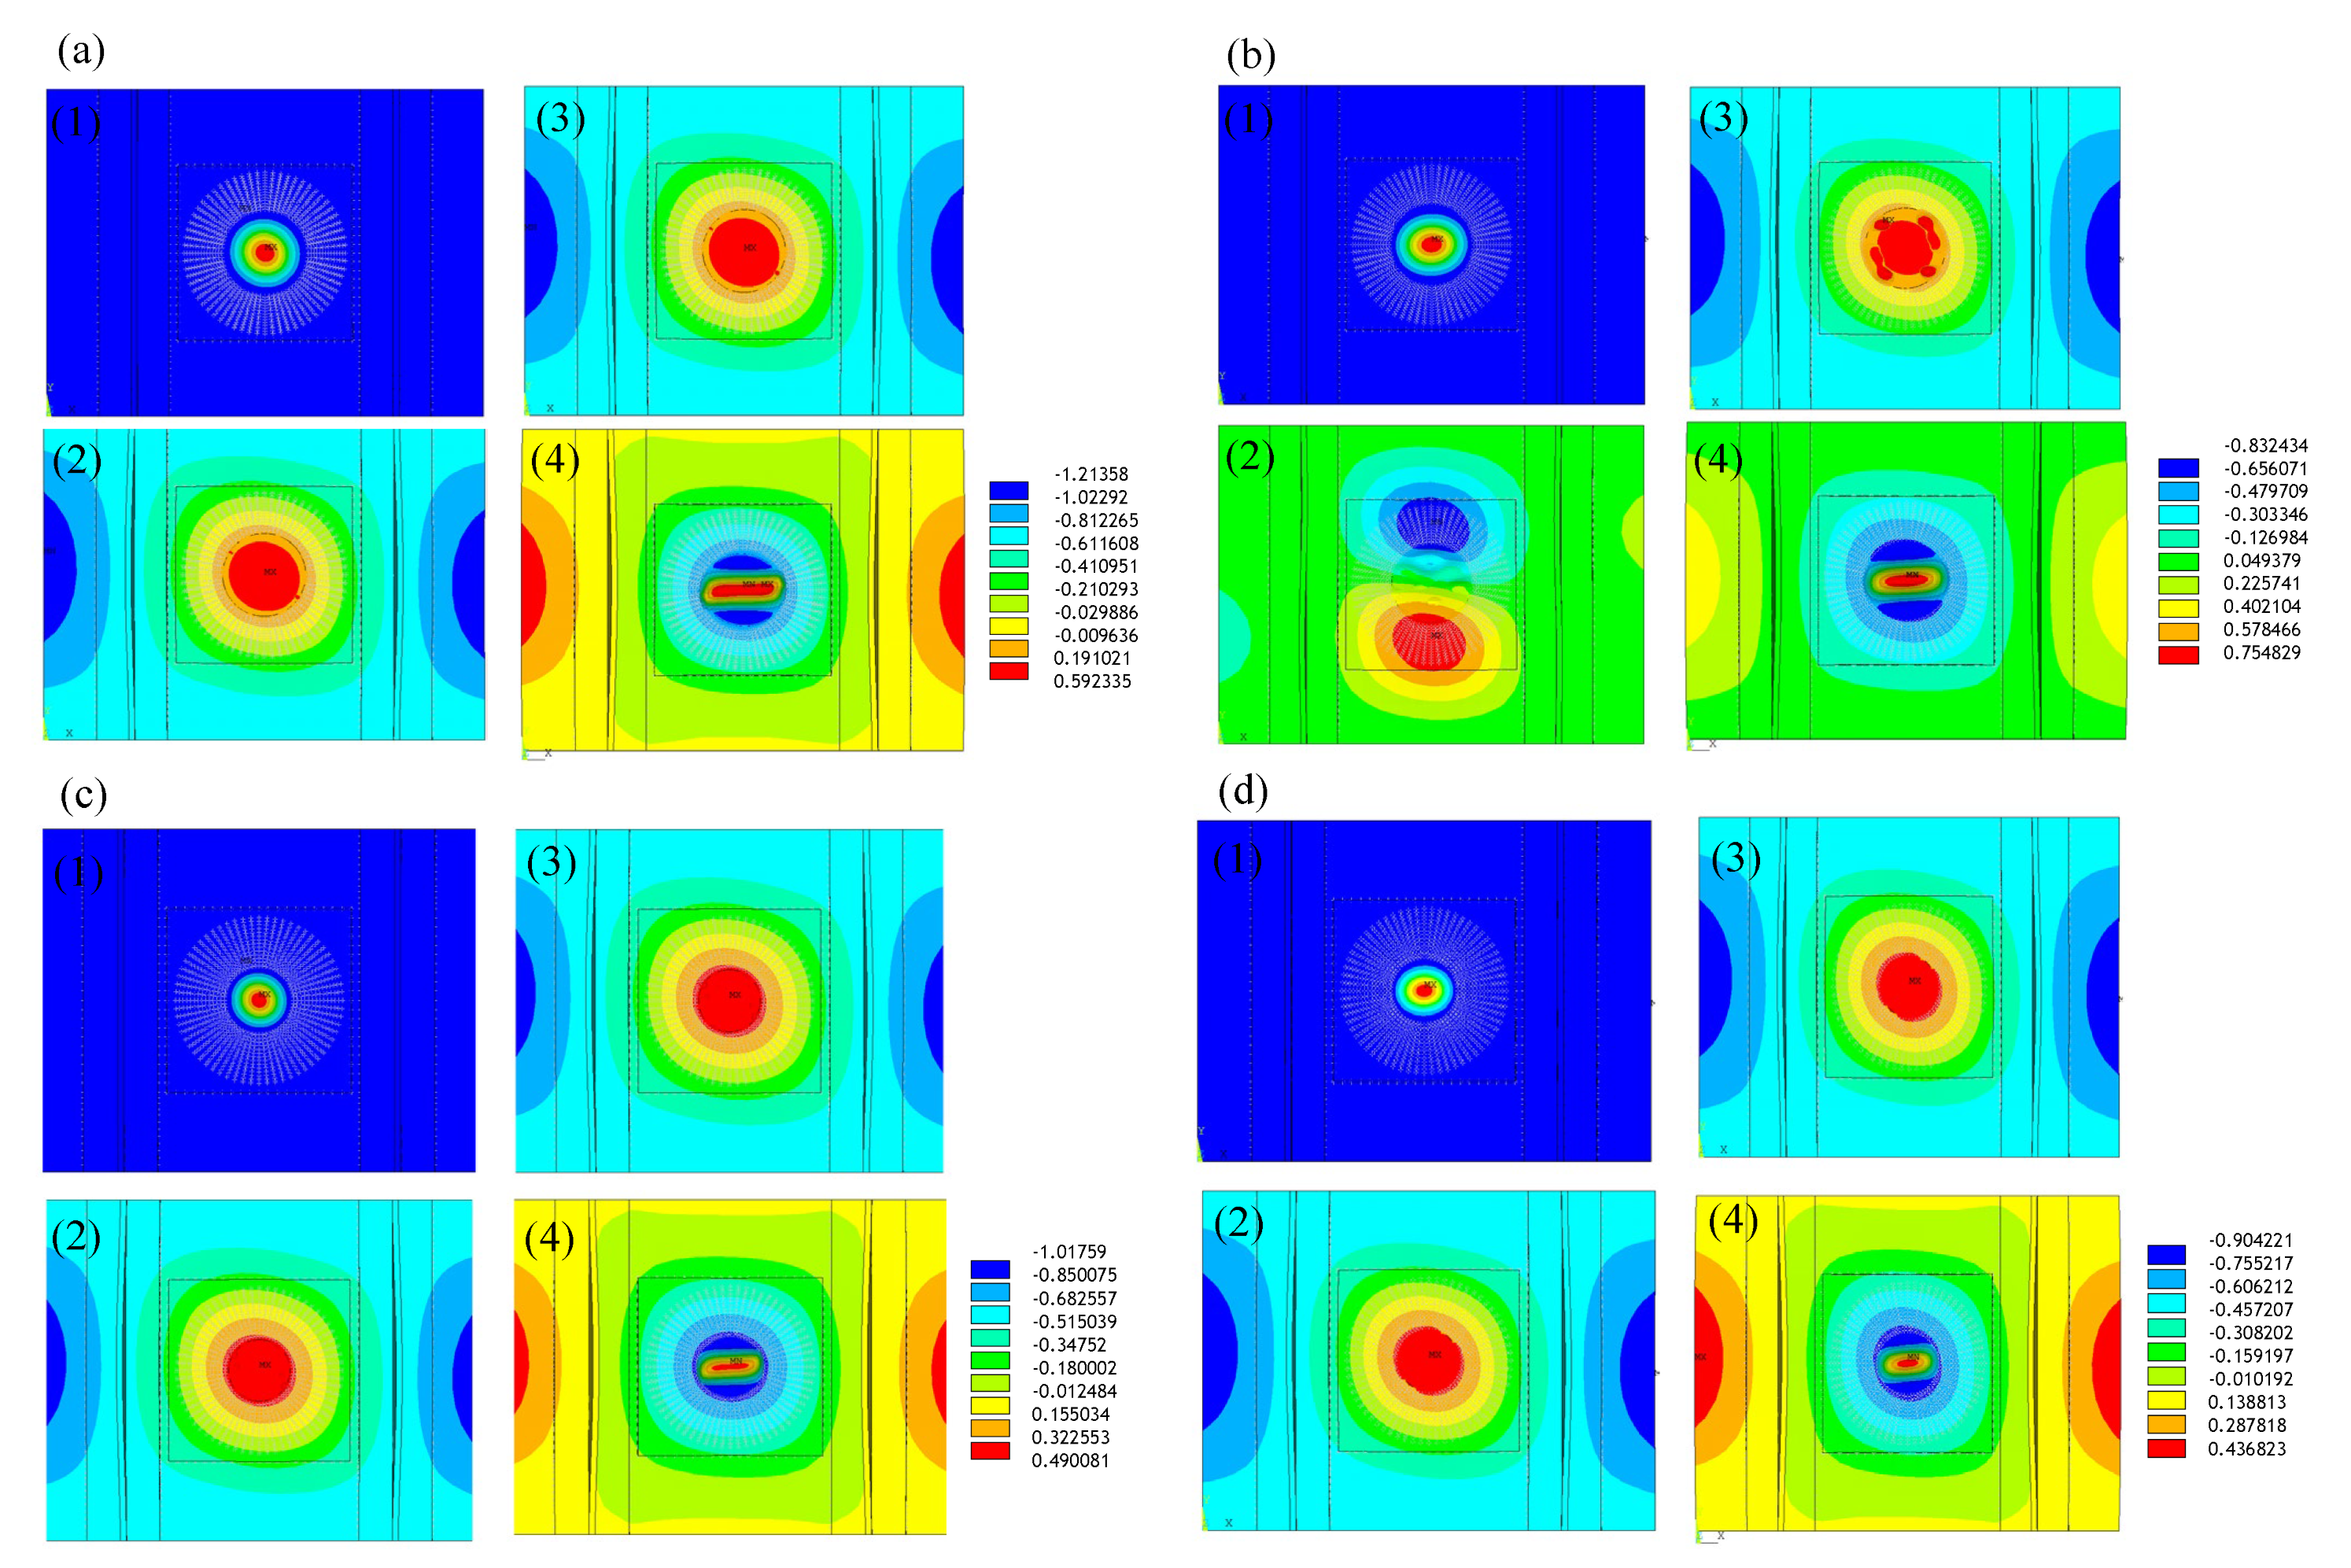
The two analysed configurations are very similar to each other, whereby only the local buckling of the delamination differs as the radius is different. In
Figure 9, the deformed shapes are reported. The propagation occurs after the global buckling of the panel, at loads of 119.4 and 117.7 kN versus the 112 kN of the global buckling; it is initially gradual and then becomes more rapid and unstable, especially in the CD10 configuration, as displayed in
Figure 10a.
Figure 10b shows the final extension of delamination for both considered configurations C9 and C10, respectively.
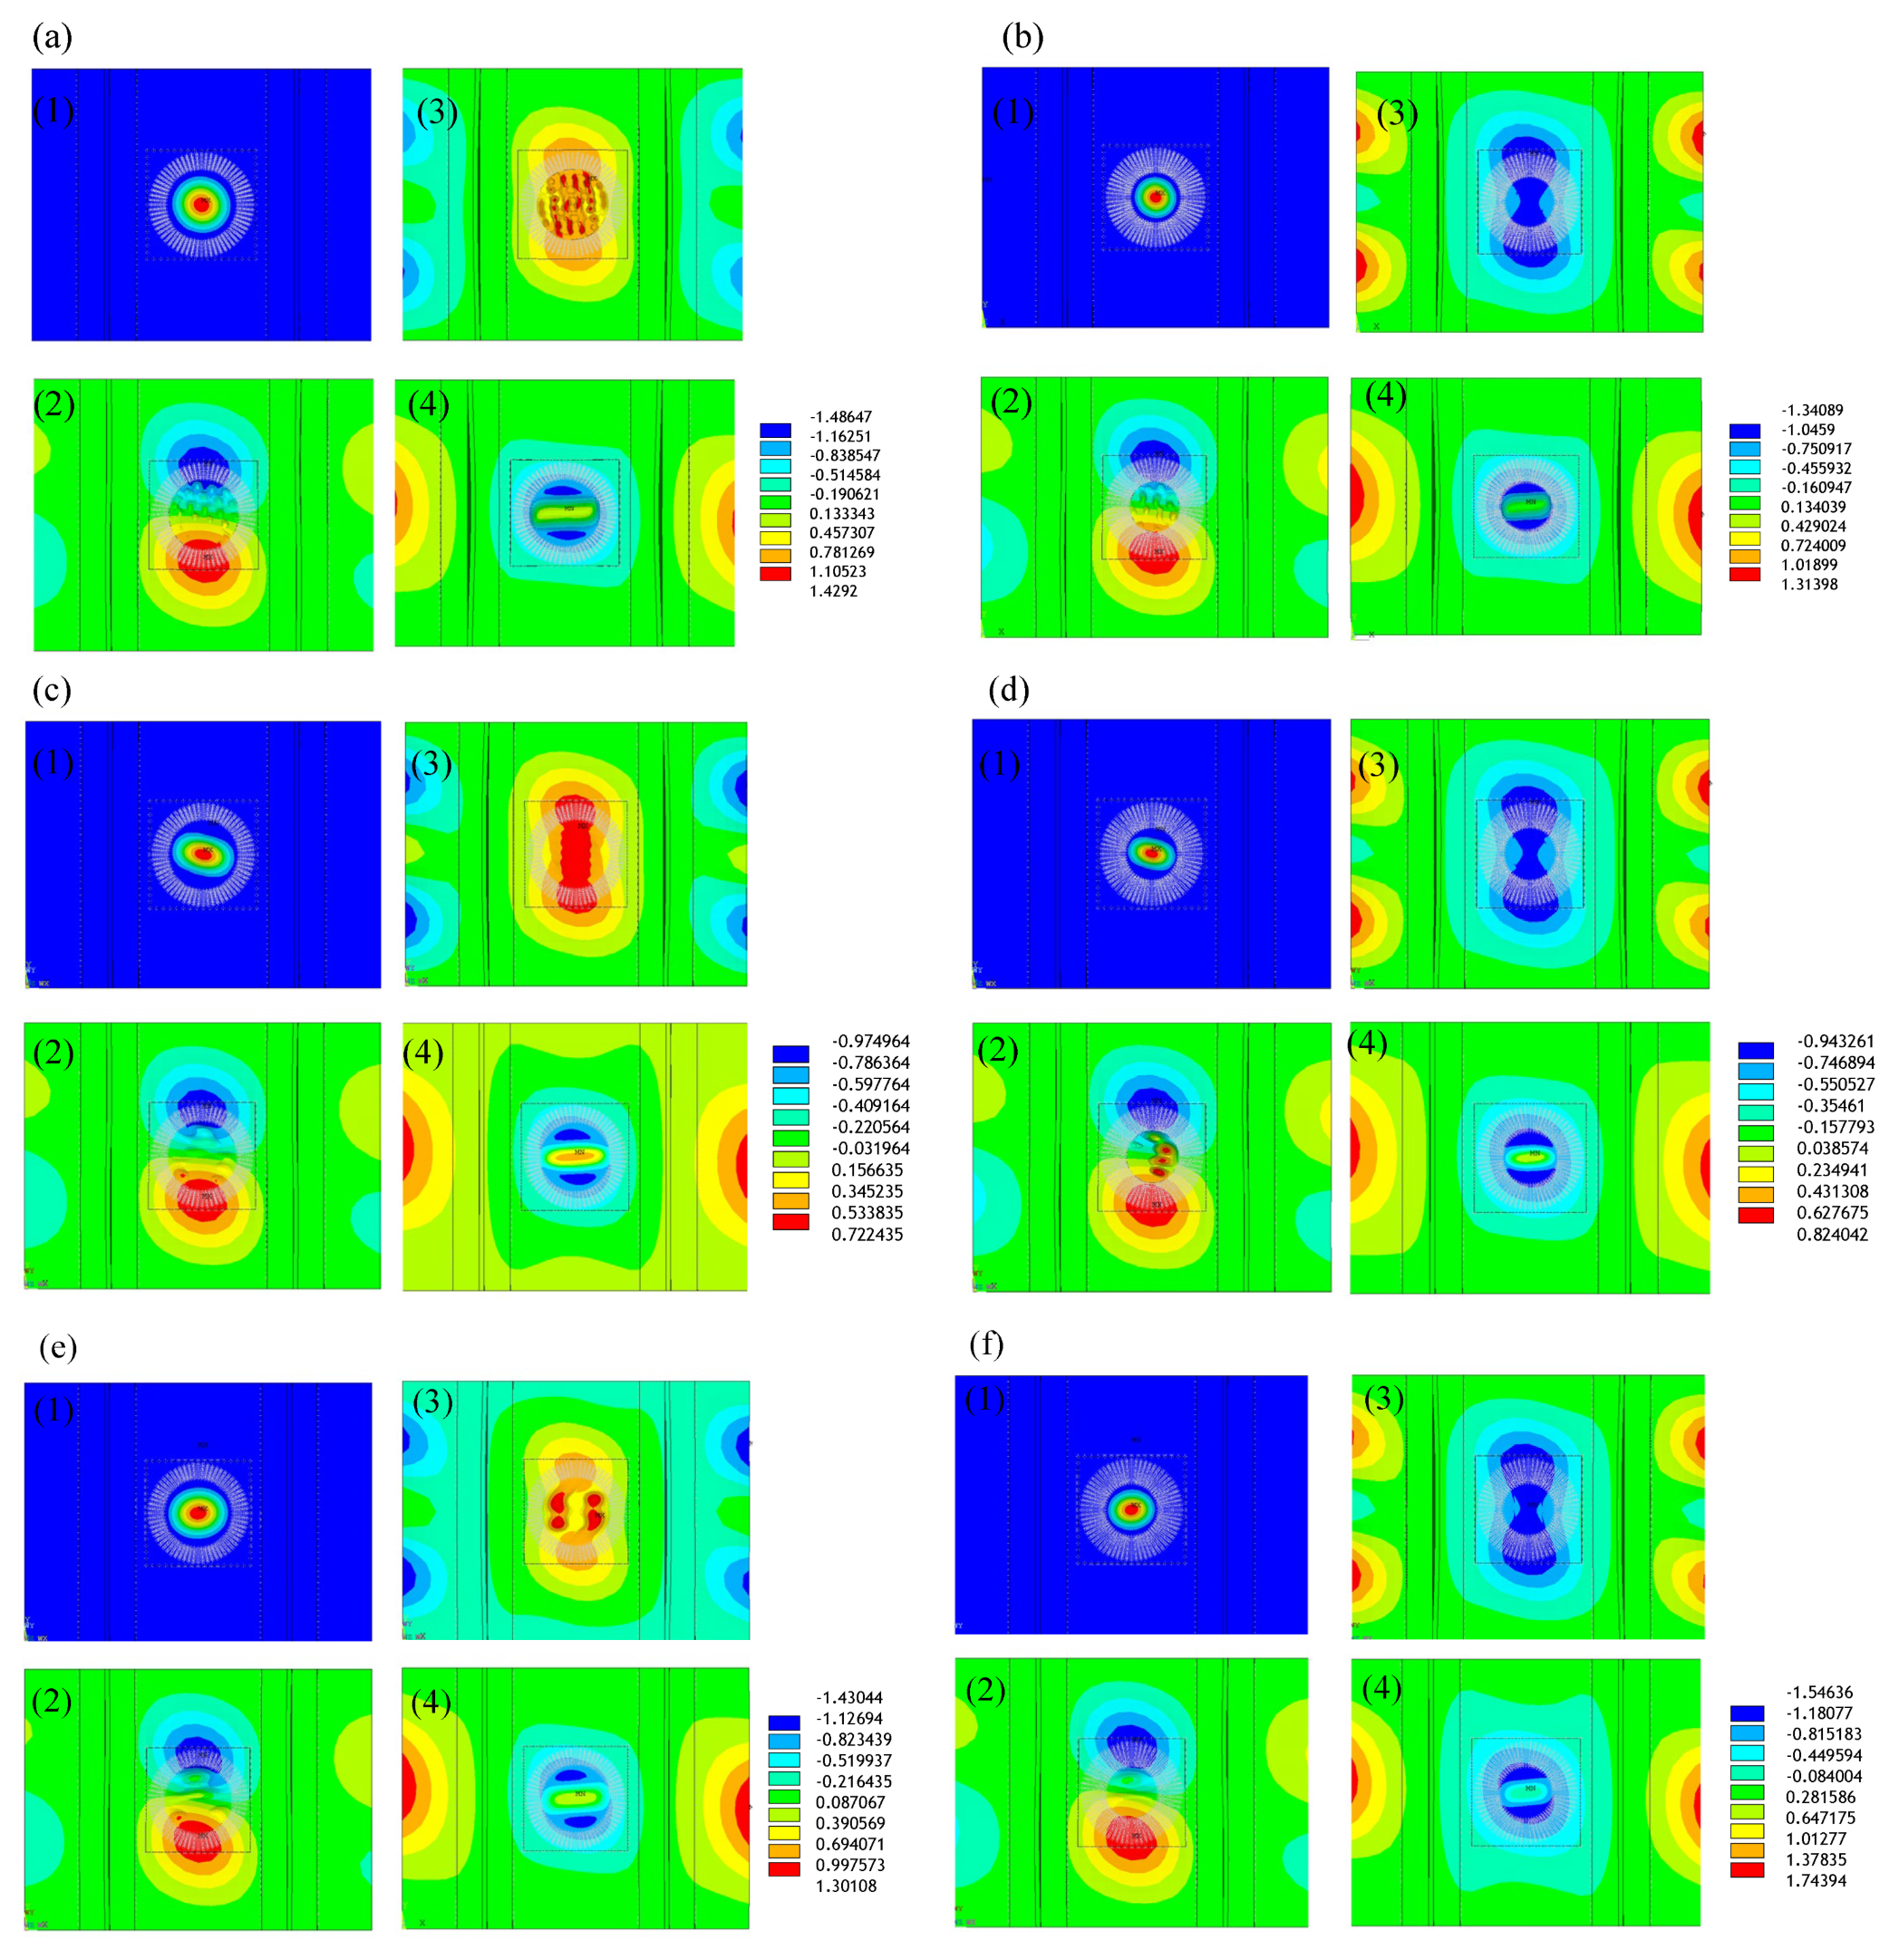
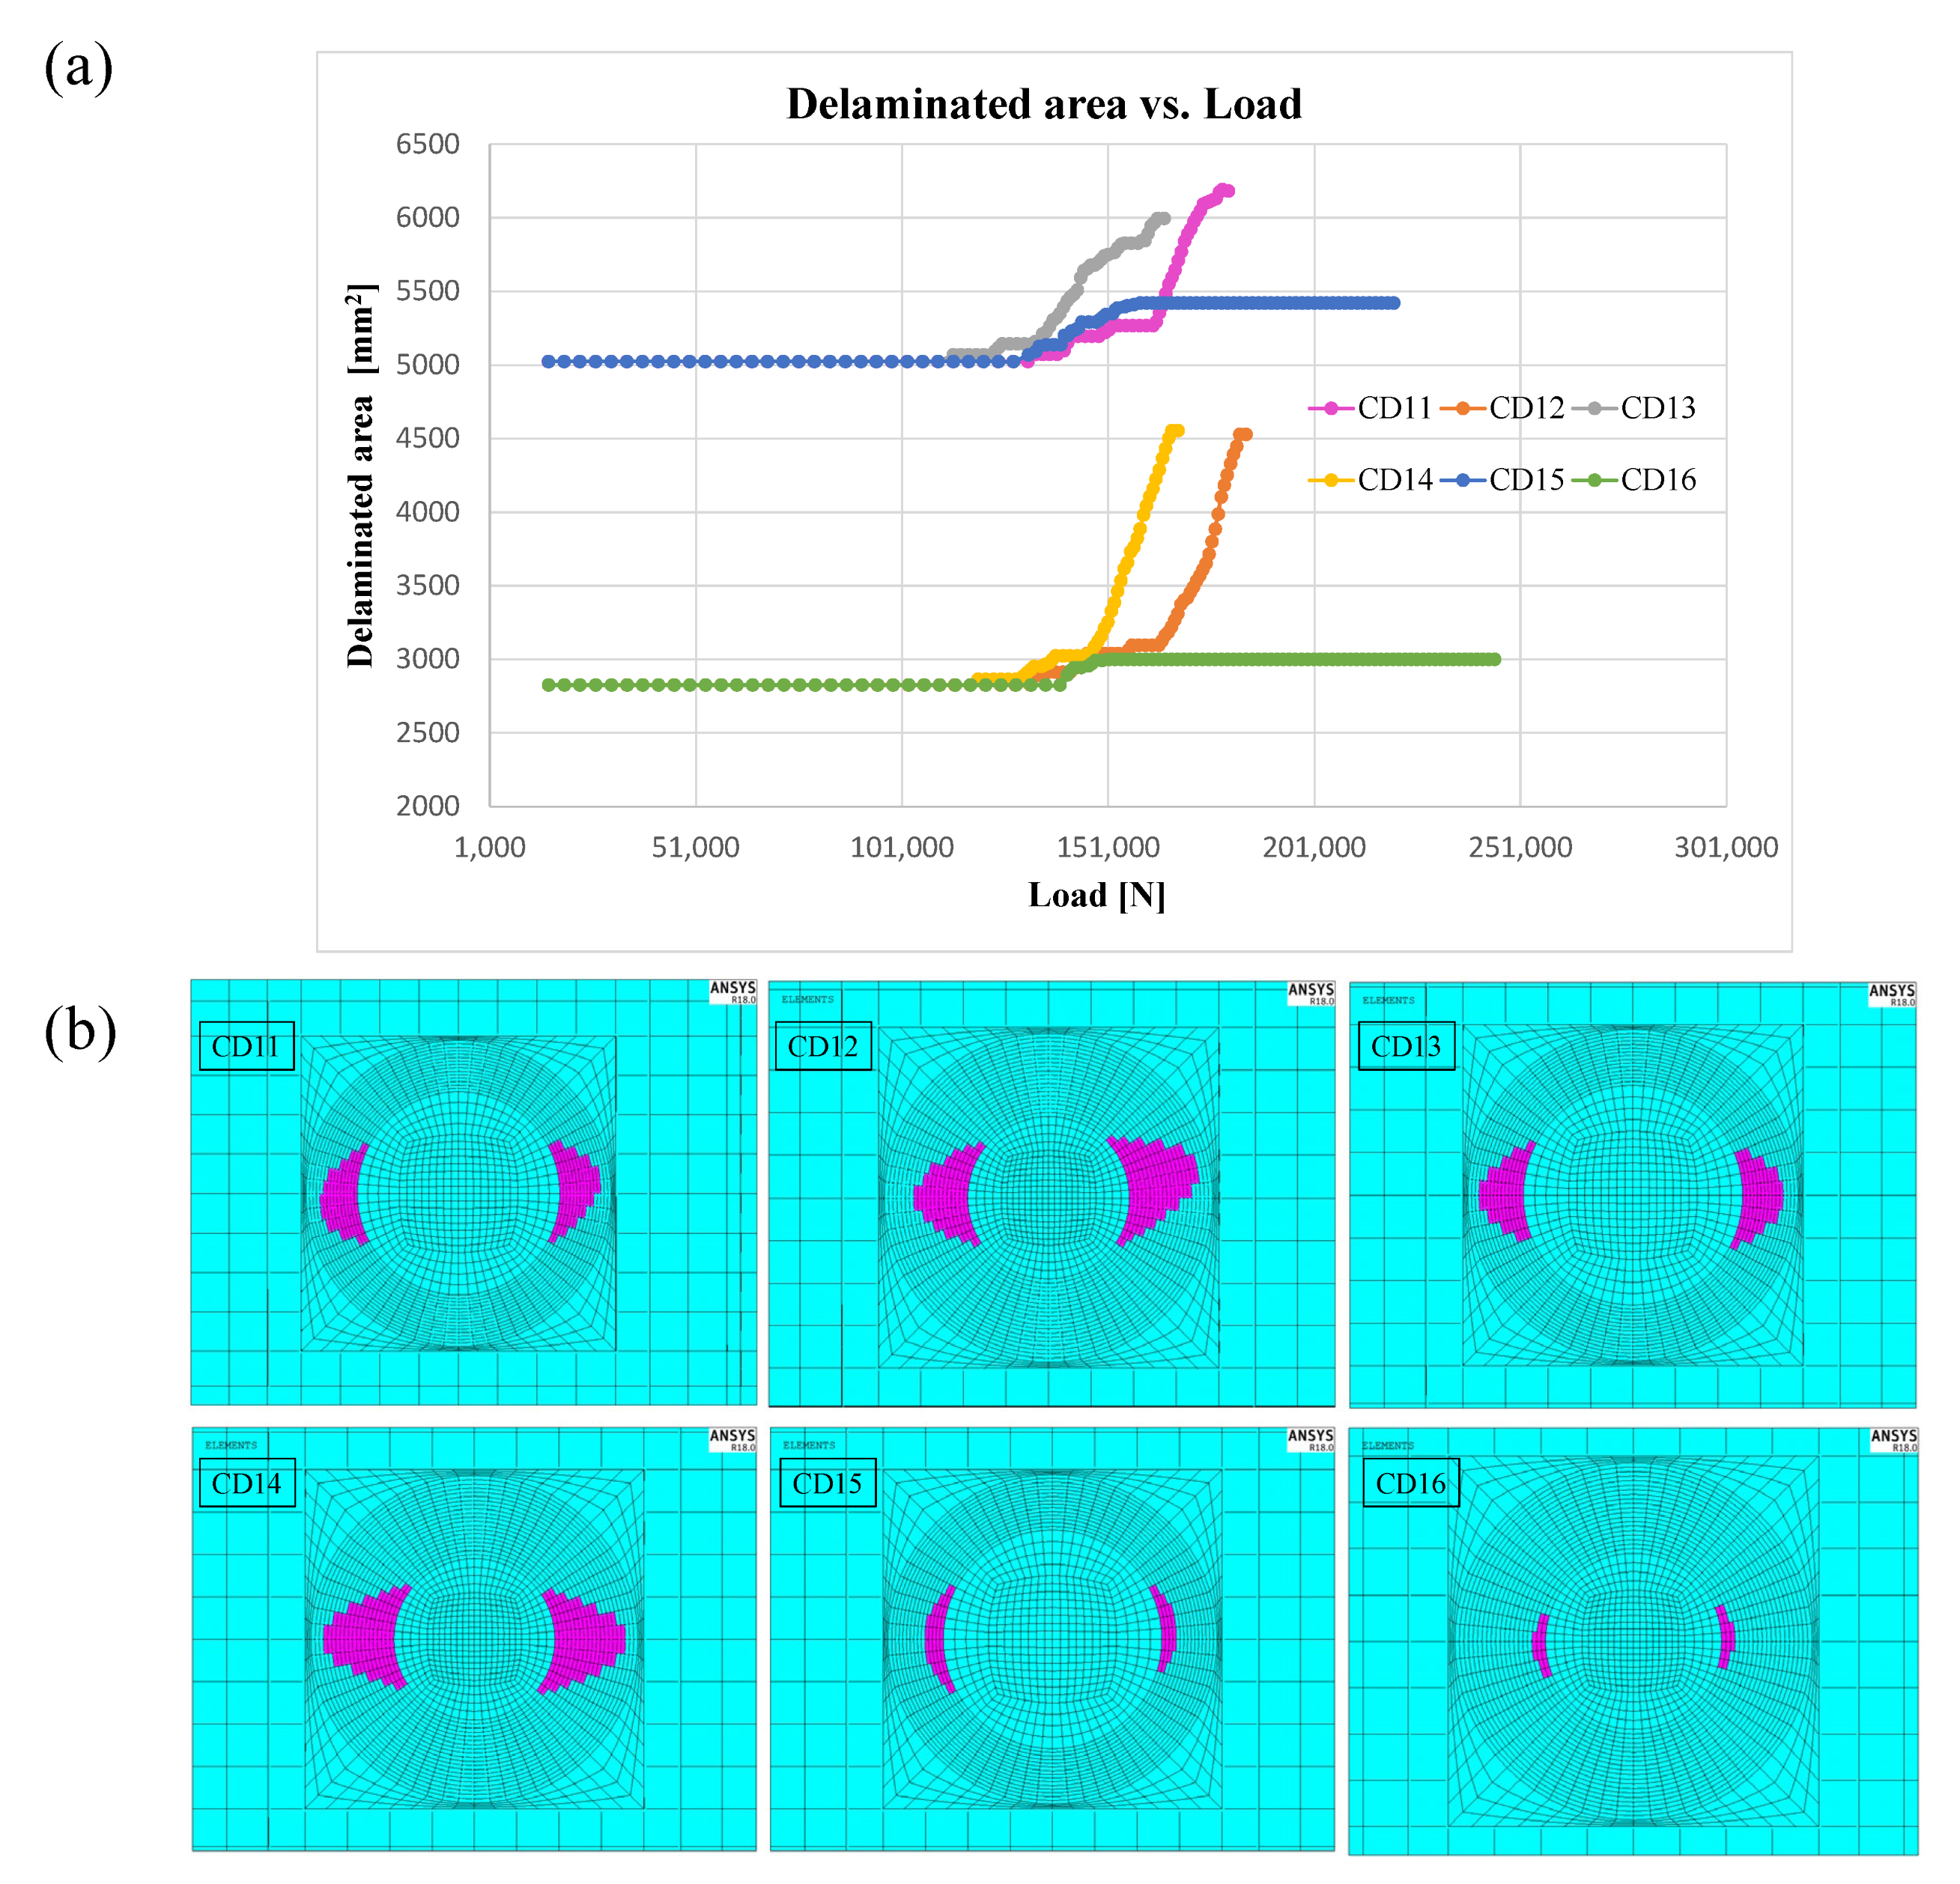
4.4. CD11–CD16 Configurations
In
Table 6, the buckling loads and displacement obtained from the linear eigenvalue buckling analyses are reported for each configuration.
According to
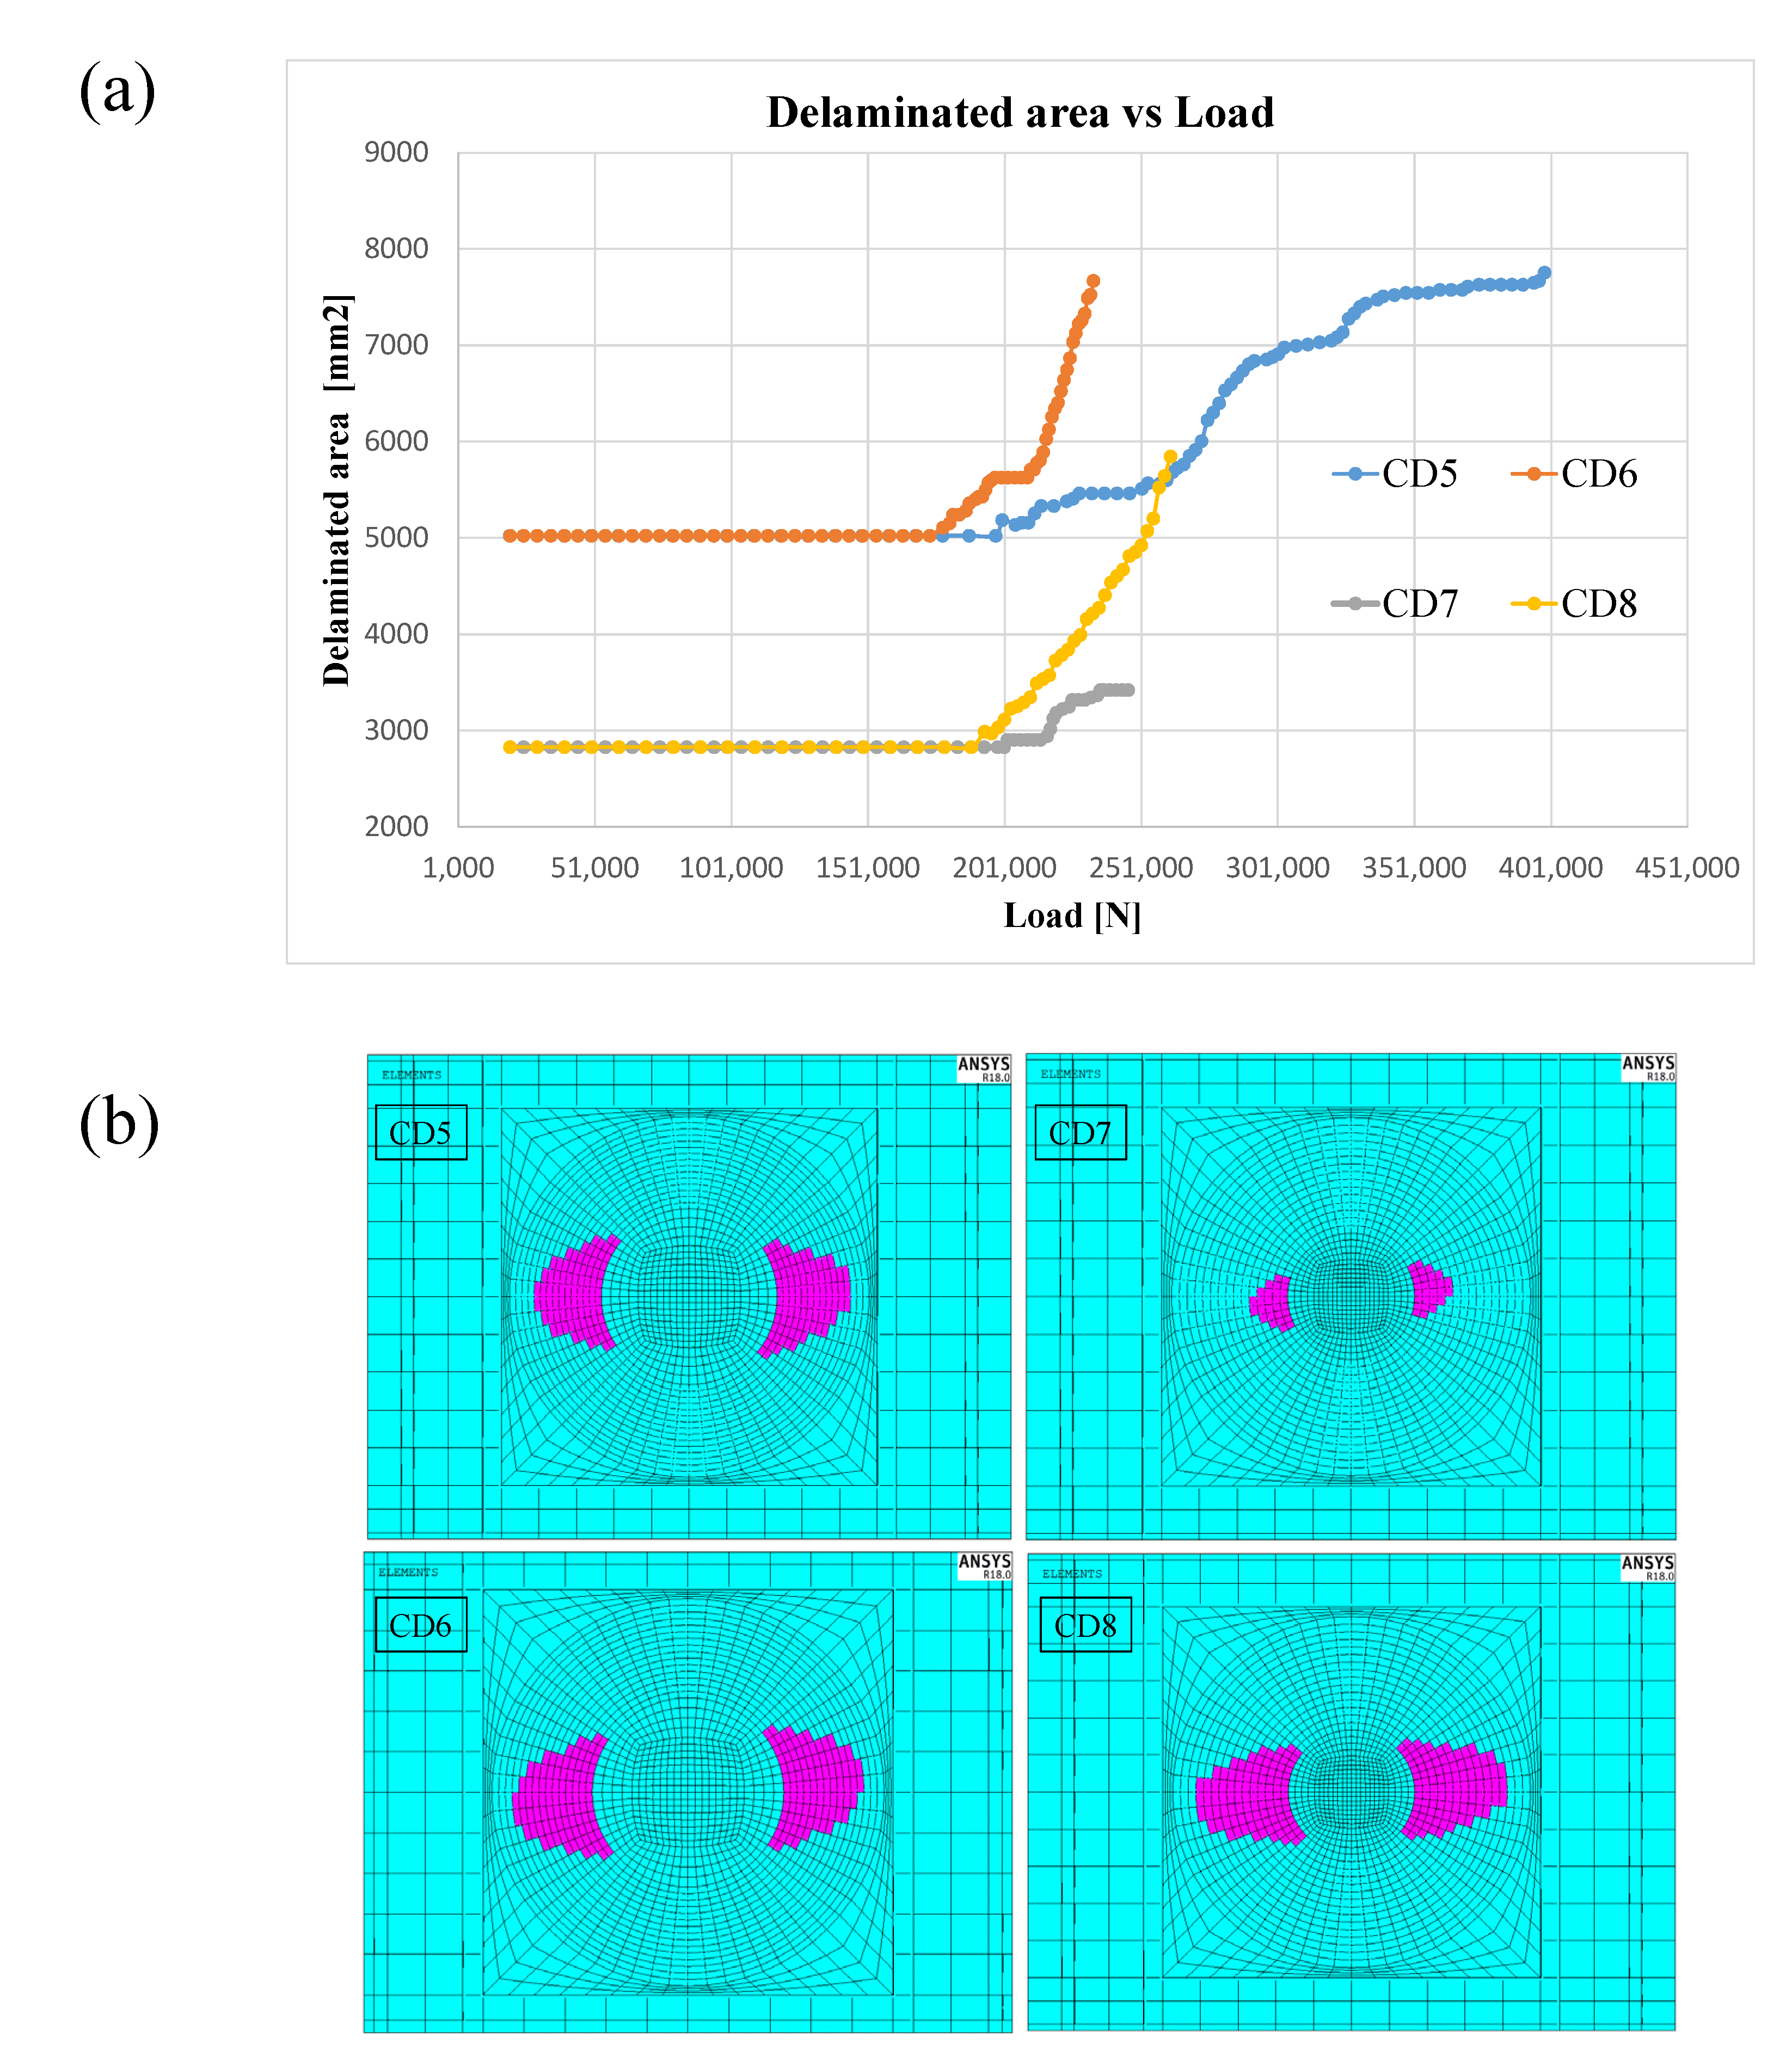
Table 6, the local buckling load increases as the depth of delamination increases (from 0.33 mm in CD11–CD12, to 0.495 mm in CD13–CD14, to 0.66 mm in CD15–CD16). In the CD11–CD12 and CD15–CD16 configurations, the initiation of propagation occurs after the buckling of the skin, at loads of 133.3, 133.8, 131.6 and 141 kN, respectively, with respect to 125.4, 130.3, 119 and 126.8 kN, while in the CD13–CD14 configurations, characterised by the delamination located under the third layer, i.e., between two layers at 90° and −45°, the initiation occurs at a lower load (113.4 and 119.4 kN), and the propagation reaches its maximum extension before the global buckling of the panel. In
Figure 11, the contour plots of the out-of-plane displacements are shown for each configuration, while in
Figure 12 the delamination evolution is reported.
As
Figure 12a shows, in two configurations characterised by delamination between 45//−45 (CD15–CD16), the propagation of delamination is triggered but does not evolve. Therefore, these configurations can be considered to be more conservative in terms of damage tolerance. Furthermore, the trend whereby an initial delamination with a lower radius exhibits a faster propagation is again confirmed, as shown by the curves in
Figure 12a for the CD12 and CD14 configurations, both having a delamination radius of 30 mm.
Figure 12b shows the final status of delamination for the CD11–CD16 considered configurations.
4.5. CD1–CD16 Configuration Comparison
In this last subsection, the results of all of the configurations are compared. The comparisons were made according to different criteria, distinct from the previous ones, for a better understanding of the results.
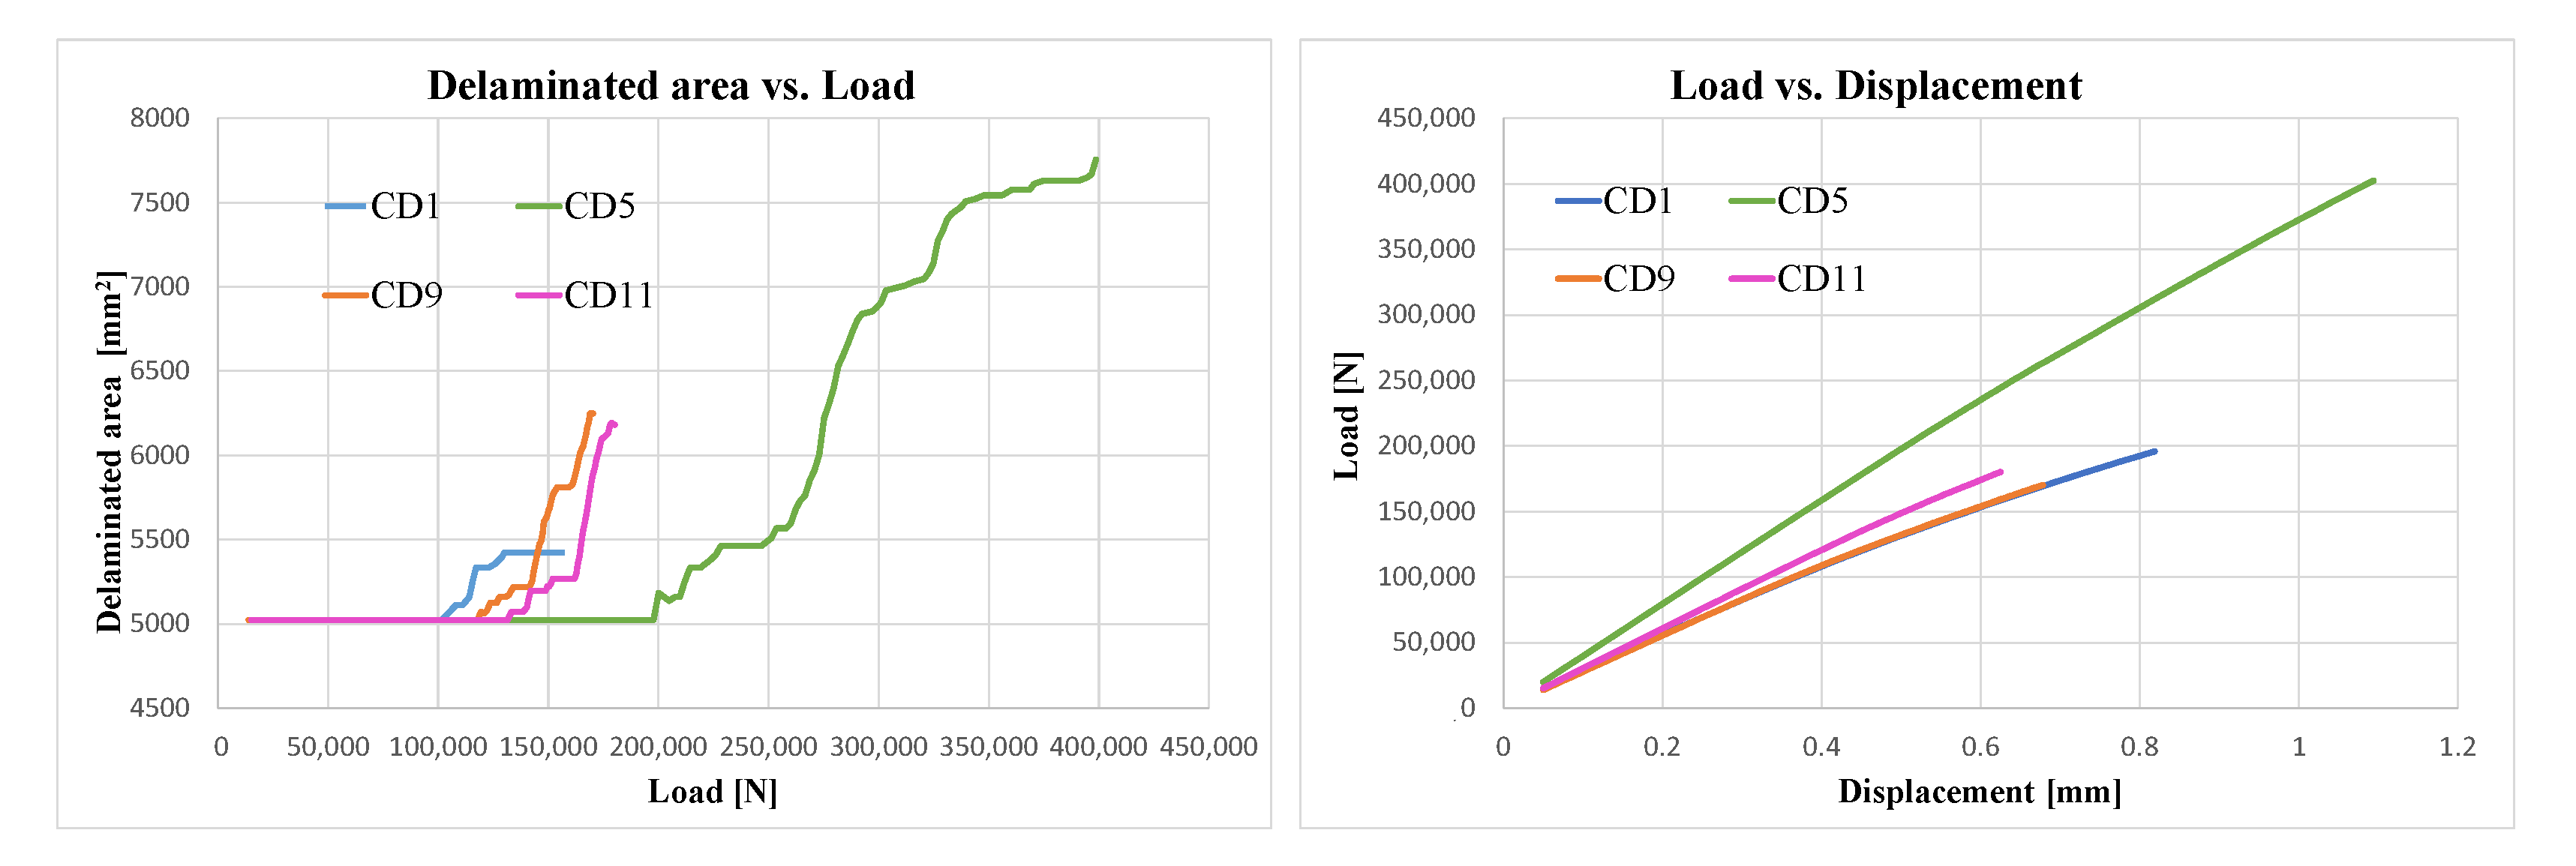
Figure 13, for example, compares four configurations that share the radius and depth of delamination, but differ in geometric characteristics (skin thickness, stringer thickness and bay width). In detail, the delamination radius is 40 mm and the depth of delamination is 0.33 mm (two layers) in all of the configurations, but the stringer foot increased from 2.64 mm to 3.96 mm when passing from CD1 to CD5, while the bay reduced from 176 mm to 146 mm when passing from CD1 to CD9 and CD11. The latter differs from CD9 because the foot stringer increased from 2.64 mm to 3.96 mm.
It may be observed that increasing the stringer and skin thicknesses by 1.32 mm (CD5) results in a significant increase in the overall panel stiffness. On the other hand, varying the width of the bay, assuming the same thicknesses, does not change the stiffness of the panel, but changes the propagation of the delamination, which increases as the bay is reduced and becomes unstable and sudden (CD9 configuration compared to CD1). Finally, the foot stringer thickening at the same bay width (CD9 to CD11) does not cause significant changes in either stiffness or delamination propagation.
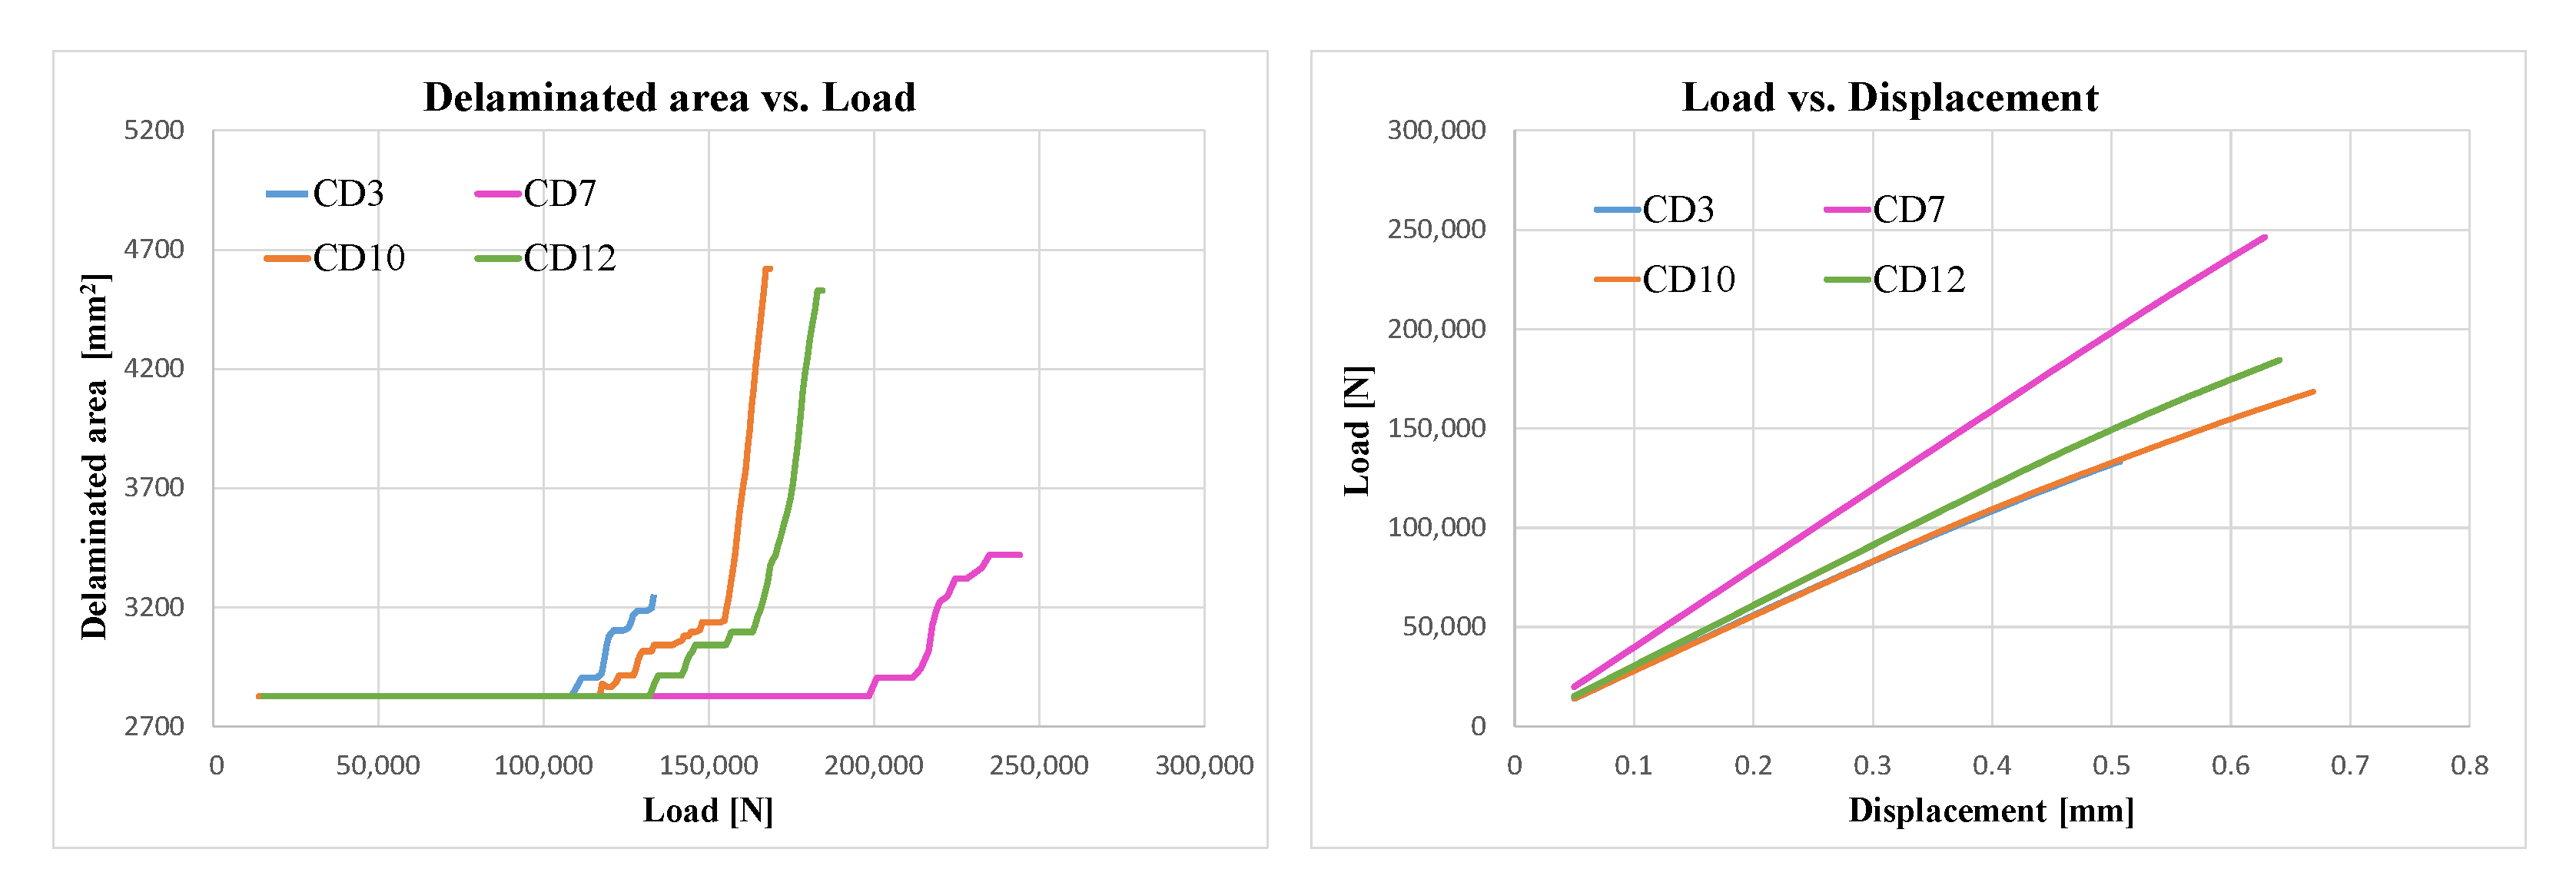
For the CD3, CD7, CD10 and CD12 configurations, displayed in
Figure 14, which all have a delamination of radius 30 mm under the second lamina (0.33 mm), similar considerations apply. Indeed, the stringer foot increased from 2.64 mm to 3.96 mm when passing from CD3 to CD7, while the bay reduced from 176 mm to 146 mm when passing from CD3 to CD10 and CD12. The latter differs from CD10 because the foot stringer increased from 2.64 mm to 3.96 mm.
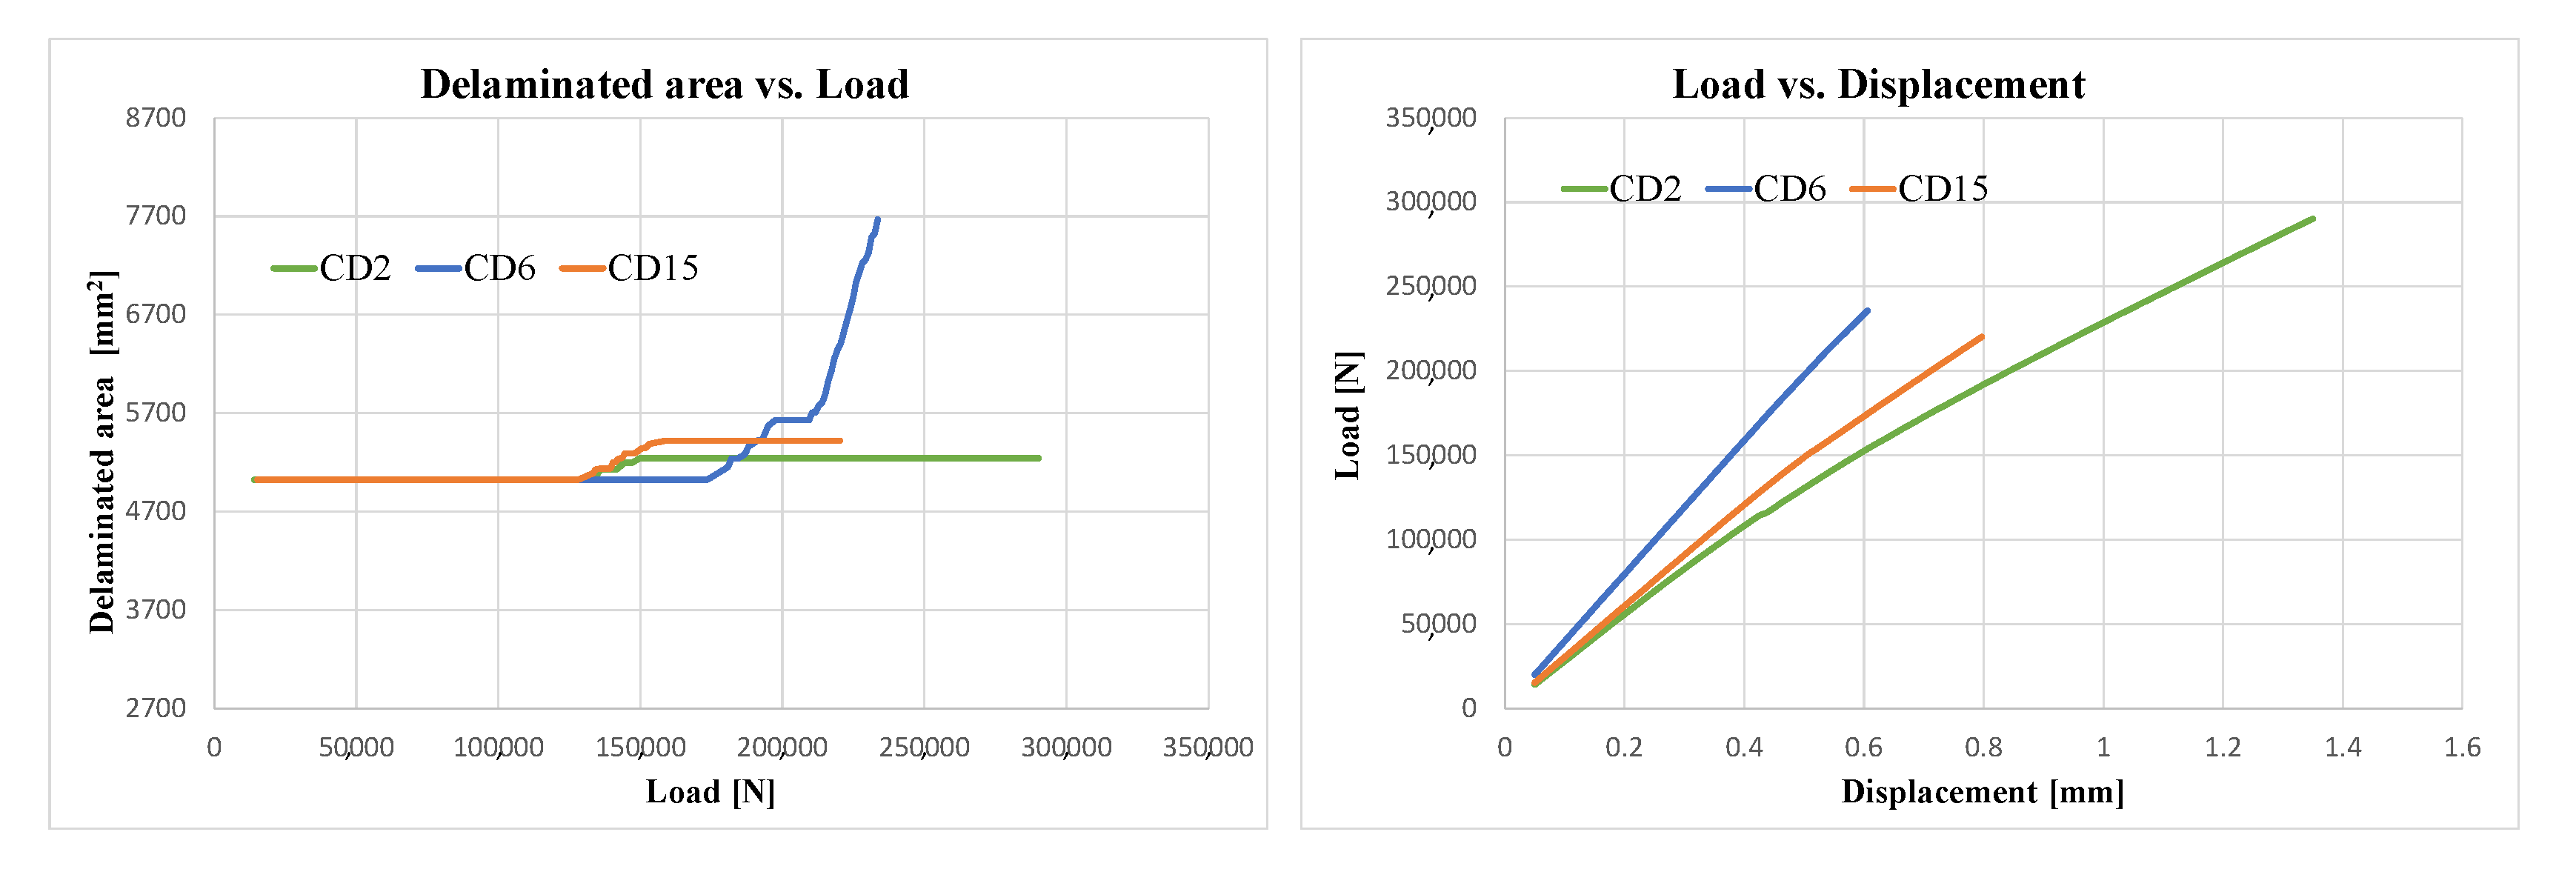
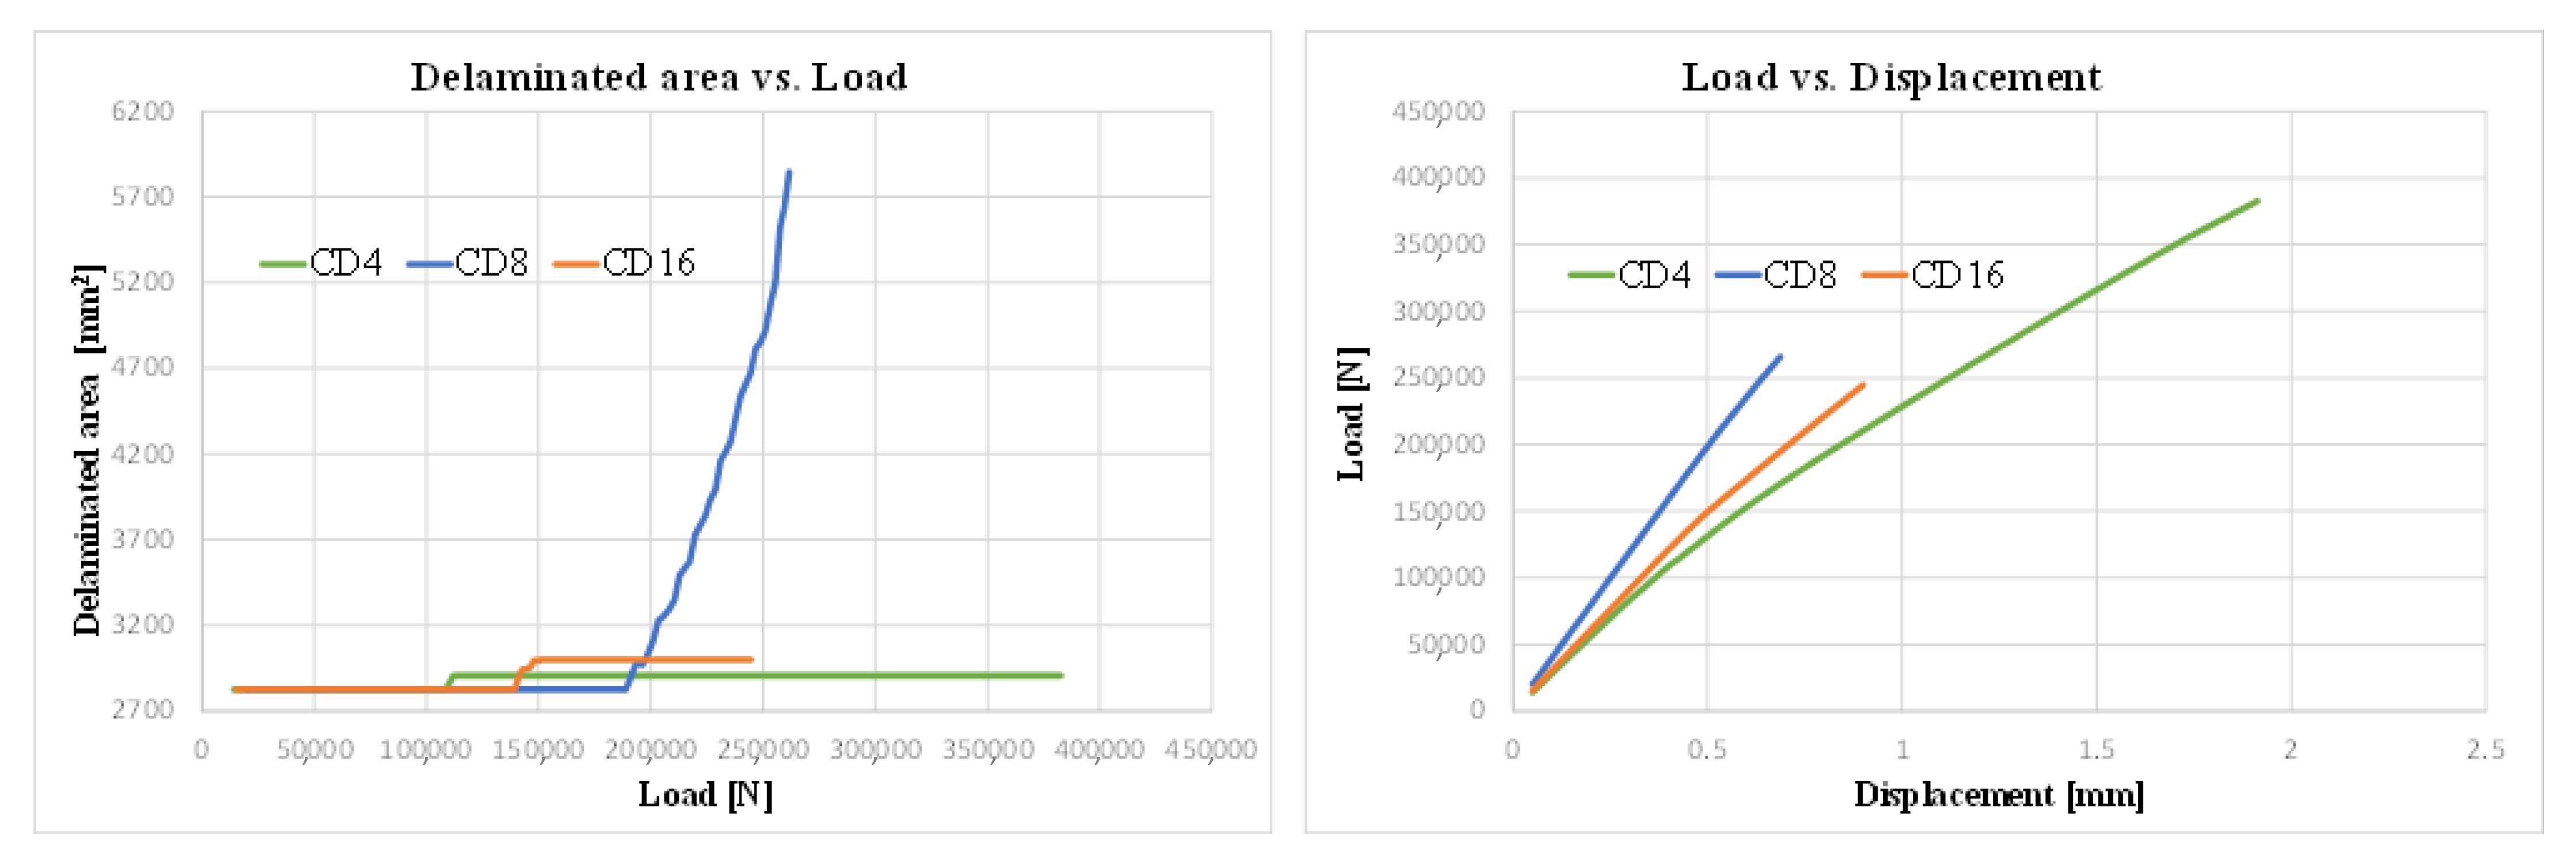
Figure 15 and
Figure 16 show configurations with a delamination depth of 0.66 mm (four laminae) and a radius of 40 mm and 30 mm (CD2, CD6 and CD15 versus CD4, CD8 and CD16, respectively). In both cases, the change is from a 16-layer skin and foot stringer to a 24-layer skin and foot stringer (the stacking sequence remains quasi-isotropic, symmetrical and balanced) with a high increase in panel stiffness and a very different delamination behaviour; the first does not propagate as the global buckling is reached, while in the second, the initial delamination increases more than 50% (see CD2–CD6 and CD4–CD8). On the contrary, by increasing only the thickness of the stringer foot from 16 to 24 layers and by moving the stringers closely together to reduce the width of the bay, no major changes in either delamination or loading occur (CD15 and CD16 configurations).
5. Conclusions
In this manuscript, a sensitivity analysis was carried out on a composite delaminated aeronautical panel by varying different geometrical parameters: delamination radius, delamination depth, skin and stringer thickness and bay width. The main conclusions can be summarised as follows:
The depth of the delamination influences the local buckling and damage propagation but does not affect the stiffness of the panel or the overall compressive behaviour.
The lower the radius of the initial delamination, the higher the propagation velocity, even if the triggering occurs later.
If the delamination initiation load is close to the overall buckling load of the panel, no damage propagation is observed.
By increasing the thickness of the panel and the stringers by 1.32 mm, corresponding to eight layers (quasi-isotropic, symmetrical and balanced layup sequence), the stiffness of the panel significantly changes, including damage propagation.
With the same geometric parameters, by reducing the width of the bay, the overall stiffness of the panel will not vary significantly, while the propagation of the damage will be completely different.
The achieved results permit, in the frame of a damage tolerance design approach, one to preliminary assess the damage behaviour of the panels, according to predefined load conditions, and select the geometric parameters and stacking sequences according to the demands.


