Article

Impurity Behavior in Plasma Recovery after a Vacuum Failure in the Experimental Advanced Superconducting Tokamak

1
Shanghai EBIT Laboratory, Key Laboratory of Nuclear Physics and Ion-Beam Application (MOE), Institute of Modern Physics, Fudan University, Shanghai 200433, China
2
Department of Nuclear Science and Technology, Fudan University, Shanghai 200433, China
3
Institute of Plasma Physics, Chinese Academy of Sciences, Hefei 230031, China
4
Science Island Branch of Graduate School, University of Science and Technology of China, Hefei 230031, China
5
National Institute for Fusion Science, Toki 509-5292, Gifu, Japan
6
Institutes of Physical Science and Information Technology, Anhui University, Hefei 230601, China
*
Authors to whom correspondence should be addressed.
Appl. Sci. 2023, 13(7), 4338; https://doi.org/10.3390/app13074338
Submission received: 4 March 2023 / Revised: 22 March 2023 / Accepted: 24 March 2023 / Published: 29 March 2023
(This article belongs to the Special Issue Advances in Fusion Engineering and Design)

Abstract

:
After a vacuum failure in a tokamak, plasma runaway or plasma disruptions frequently occur during plasma recovery, causing difficulties in rebuilding a well-confined collisional plasma. In this work, the impurity behavior during plasma recovery after a vacuum failure in the 2019 spring campaign of the Experimental Advanced Superconducting Tokamak (EAST) was studied by analyzing the spectra recorded by fast-time-response extreme ultraviolet (EUV) spectrometers with 5 ms/frame. During the plasma current ramp-up in recovery discharges, a high content of the low-Z impurities of oxygen and carbon was found, i.e., dozens of times higher than that of normal discharges, which may have caused the subsequent runaway discharges. The electron temperature in the recovery discharge may have dropped to less than 75 eV when the collisional plasma quenched to the runaway status, based on the observable impurity ions in the two cases. Therefore, the lifetime of collisional plasma in the recovery discharge, τc, was deduced from the lifetime of H- and He-like oxygen and carbon ions identified from EUV spectra. It was found that, after several discharges with real-time lithium granule injection, the runaway electron flux and O+ influx reduced to 45% and 20%, respectively. Meanwhile, the lifetime of confined plasma was extended from 113 ms to 588 ms, indicating the effective suppression of impurities and runaway electrons and improvement in plasma performance by real-time lithium granule injection. The results in this work provide valuable references for the achievement of first plasma in future superconducting fusion devices such as ITER and CFETR.

1. Introduction

Maintaining an ultra-high vacuum environment in a magnetic confinement fusion device is a fundamental condition for fusion plasma start-up and maintenance. Vacuum leaks may result from design defects or mechanical breakdowns in the operation of vacuum bellows [1] and other components. Once a vacuum failure occurs, it will be necessary to vent the vacuum vessel for the repair or replacement of broken components. Additionally, after the re-vacuuming, wall conditioning is performed to remove residue gas on the wall, reduce edge recycling, and recover well-confined plasma. For the plasma recovery of HT-7 (Hefei Tokamak-7), boronization is conducted to suppress impurities, and the ion cyclotron range of frequency (ICRF)-cleaning discharges are operated for hydrogen removal and wall condition improvement [2]. The vessel conditioning methods of the Joint European Torus (JET) include baking and glow discharge cleaning (GDC), which is used to remove water and gas impurities, and beryllium evaporation is carried out to reduce oxygen and carbon concentrations [3,4]. After the vacuum leak of Tore Supra, baking, GDC, and ICRF discharges were conducted to remove hydrogen and other absorbed impurities [5]. In EAST, after repairing the vacuum failure, normally, several wall conditioning techniques would also be conducted successively, i.e., baking, D2/He-GDC, and ICRF-DC [6].
When the vacuum chamber of the device is baked and cleaned for enough time, a process of plasma recovery is started. The main purpose in this plasma recovery process is to achieve well-confined plasma maintenance throughout the whole discharge. During this process, the establishment and maintenance of steady-state, well-confined plasma would be rather difficult without the application of additional wall conditioning techniques (e.g., GDC or lithium evaporation). Normally, there are 1–2 weeks of runaway discharges in which the plasma filled with high-energy runaway electrons—so called “non-collisional plasma”, with a very low electron temperature—and the plasma current might be carried by runaway electrons [7]. It was found that the impurity behavior plays an important role in plasma recovery. High levels of impurities such as oxygen, nitrogen, carbon dioxide, and water are present in the vacuum chamber, making it difficult to maintain well-confined plasma and increase electron temperature [8]. Usually, low-Z material coating (evaporation), such as lithium [9,10] or boron, is routinely utilized to enhance the wall condition and impurity suppression, and finally, accomplish the plasma recovery.
Once the confined plasma can be stably and repetitively sustained, the experimental campaign moves on to the next phase, which is normal plasma operation or the physical experimental phase. The results from several fusion devices have proved a positive effect of lithium coating and lithium granule injection for impurity control and plasma performance in this phase, e.g.,
  • a lower tungsten density in the core plasma, lower tungsten influx, and the achievement of a higher energy confinement time and density limit in T-10 tokamak [11];
  • a reduced peak heat flux on the divertor from 5 to 2 MW m−2, with 150 and 300 mg of pre-discharge lithium evaporation in NSTX [12];
  • an increased duration of enhanced H-mode pedestal phases of up to 350 ms with the injection of a powder of lithium particles 45 μm in diameter in DIII-D [13];
  • long-pulse, high-confinement H-mode discharge with a duration of over 30 s through advanced lithium wall conditioning in EAST [14].
It is important to shorten the plasma recovery time for the existing devices after vacuum failure occurs, and this is also essential to allow future devices such as ITER and CFETR to quickly obtain the first plasma. Unfortunately, many diagnostics are not available in plasma recovery due to the unsuitable operation conditions involved and the short lifetime of confined plasma in the discharges. Therefore, the characteristics of the impurity behavior and their impacts on plasma confinement in this special phase are not yet fully understood. In this work, two newly developed fast-time-response extreme ultraviolet (EUV) spectrometers were used to study the impurity behavior in plasma recovery. Meanwhile, real-time lithium granule injection was attempted instead of direct lithium wall coating during plasma recovery in order to verify the effect of lithium coating (evaporation) on impurity suppression and maintenance of confined plasma.
The experimental setup, especially the EUV spectrometers for impurity diagnosis, are described in Section 2. The impurity behaviors analyzed from EUV spectra in plasma recovery are presented in Section 3. The effect of real-time lithium granule injection is analyzed in Section 4. The paper is summarized in Section 5.

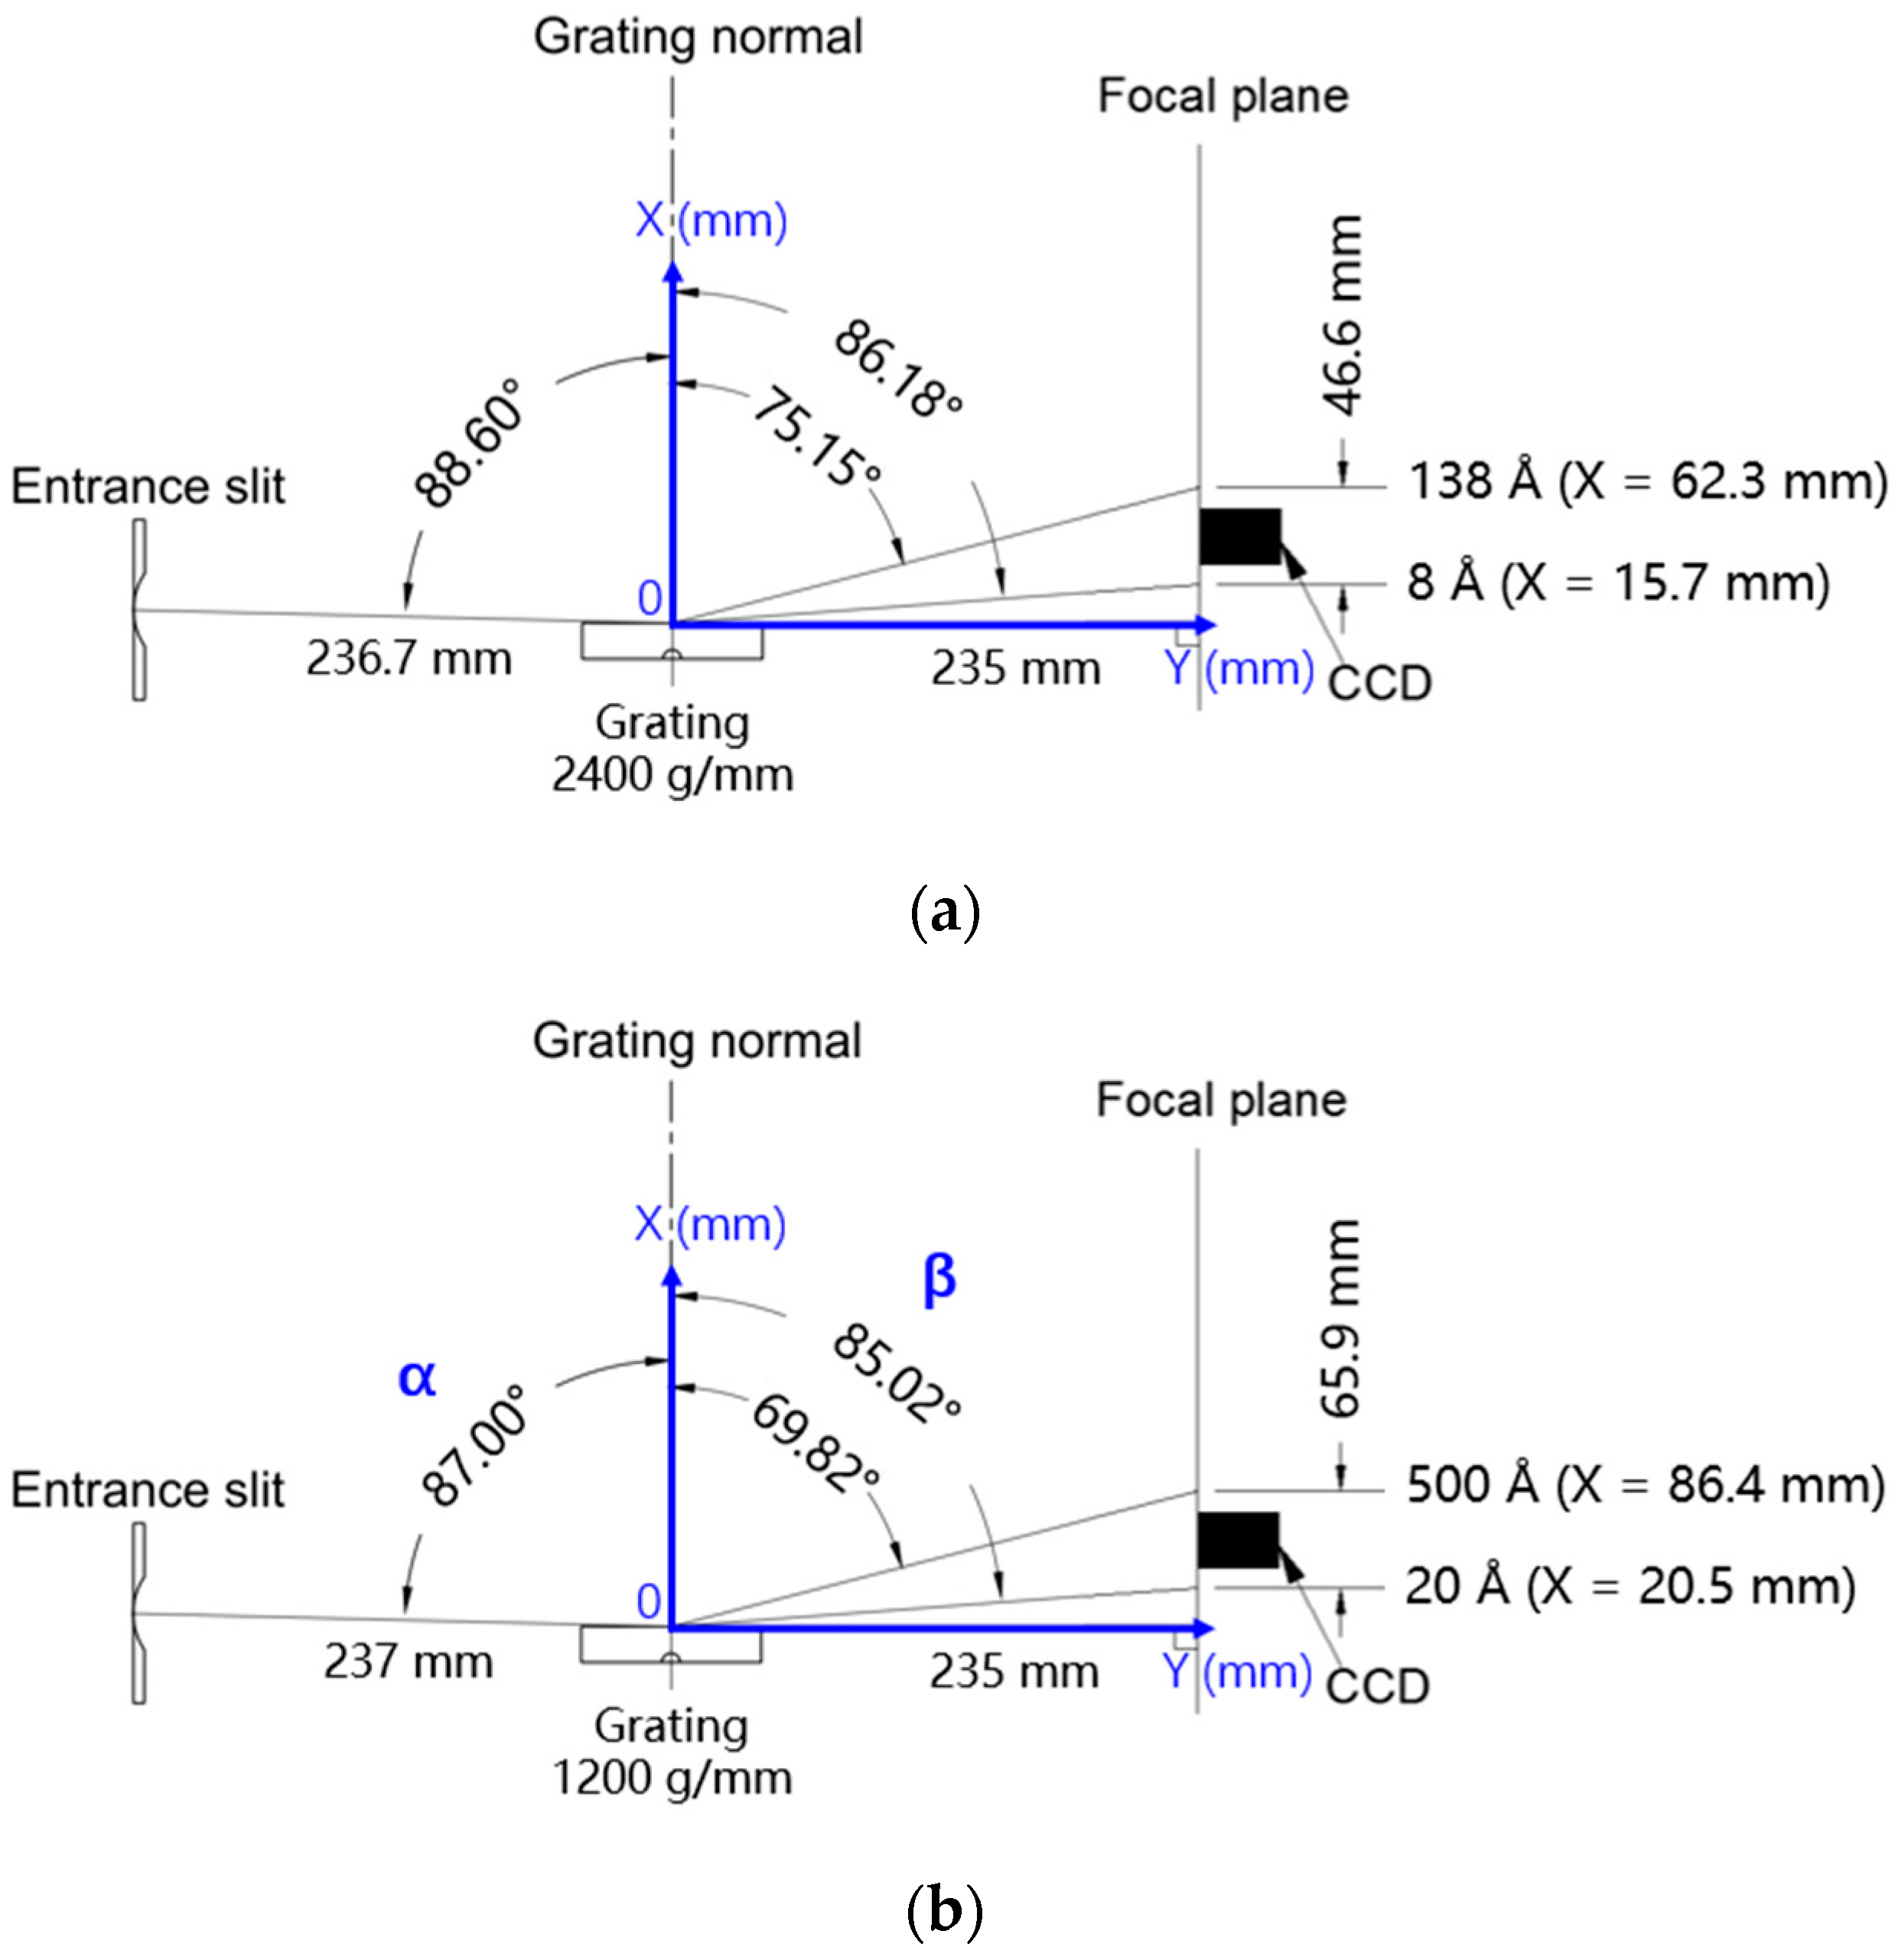
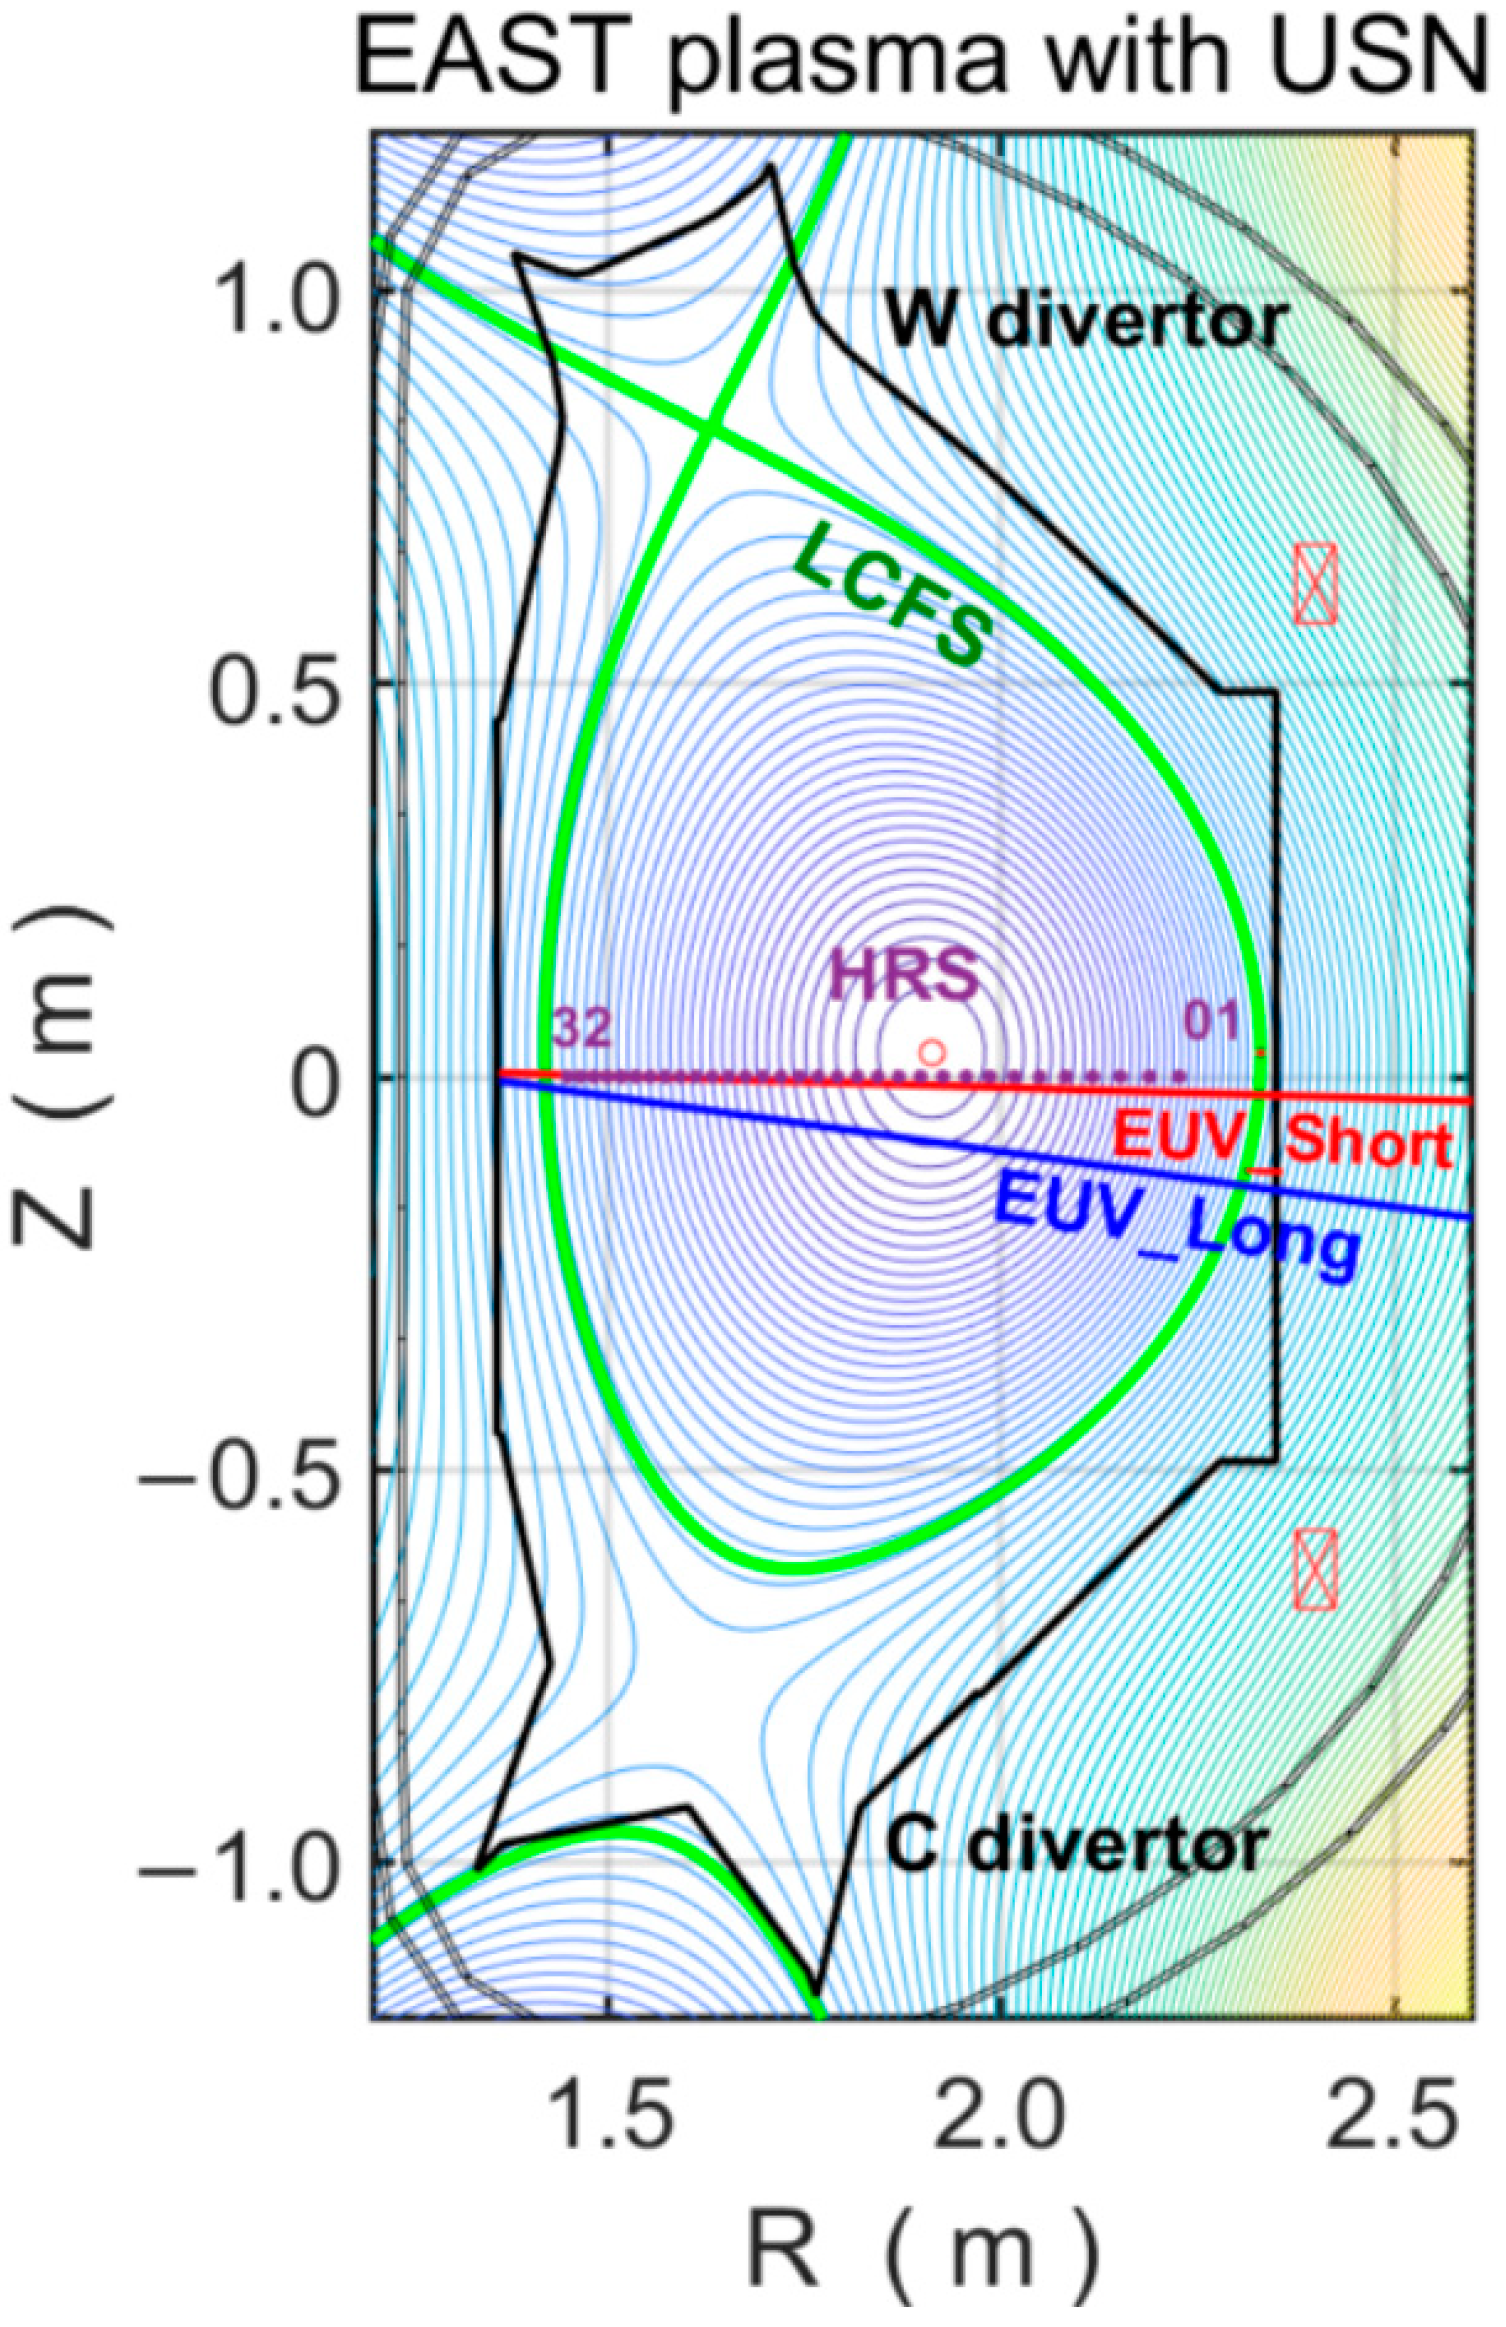
2. Experimental Setup

EAST is a fully superconducting diverted tokamak with a D-shaped poloidal cross section, featuring major parameters such as toroidal magnetic field BT in the range of 2.0–3.5 T, plasma current Ip up to 1 MA, and plasma elongation k between 1.2 and 2.0. It can be operated in upper single null (USN), lower single null (LSN), and double null (DN) divertor configurations, with Deuterium (D2) mostly used as working gas [15]. In order to improve the machine’s capability towards high-performance, steady-state discharge operation, the upper and lower graphite divertors of EAST were upgraded using ITER-like W/Cu monoblock in 2014 and 2021, respectively. EAST tokamak was operated with lower graphite divertor, molybdenum first wall, and upper tungsten divertor during 2014–2021 [16].
In the middle of the EAST 2019 spring campaign, a vacuum failure occurred. EAST vacuum vessel was exposed to air for 161 h to fix the leak point. Subsequently, the vacuum vessel underwent a series of wall conditioning, including baking at 150 °C for 70 h, baking at 180 °C for 130 h, D2-GDC for 47 h, and He-GDC for 64 h, with ICRF-DC assistance for approximately 21h, in order to recover the vacuum condition [6]. As mentioned earlier, during plasma recovery before routine lithium coating carried out, real-time lithium granule injection was performed to study the effect of lithium on the improvement of plasma performance. The plasma parameters for the discharges studied in this work were Bt = 2.5 T, USN configuration, Ip = 300–500 kA, and ne = 2.1–4.3 × 10¹⁹ m−3. Lower hybrid wave (LHW) at a frequency of 2.45 GHz (LHW1) and 4.6 GHz (LHW2) were injected for plasma current driving and heating, and the total power was in the range of 1.0–2.5 MW.
During plasma recovery, the confined plasma would only last for tens or hundreds of milliseconds in one discharge. Two fast-time-response EUV spectrometers, namely, ‘EUV_Short’ [17] and ‘EUV_Long’ [18], working at 8–130 Å and 20–500 Å, respectively, with acquisition rate of 5 ms/frame were used to observe the EUV spectra emitted from impurity ions, while many other diagnostic systems in EAST are not available, e.g., Te and its profile measurement due to poor plasma performance, and visible spectra acquisition due to a much longer cycle time required.
The EUV_Short and EUV_Long spectrometers were installed to EAST horizontal C-port and D-port, respectively, in the EAST 2019 experimental campaign [17,18]. The spectrometers were developed to measure spectra from highly ionized tungsten in EAST with a tungsten divertor, as well as spectra lines of low-Z and mid-Z impurities [19,20]. Both spectrometers are grazing-incidence, flat-field spectrometers consisting of entrance slits, varied line spacing (VLS) concave holographic gratings, and back-illuminated CCDs with effective areas of 26.6 × 6.6 mm2 and 1024 × 256 pixels, respectively. The incidence angles of the gratings are 88.6° and 87.0° for EUV_Short and EUV_Long, respectively. The groove spacing at the grating center are 2400 grooves/mm and 1200 grooves/mm, respectively. The top view of the optical layout of the EUV_Short and EUV_Long spectrometers are shown in Figure 1a,b), respectively. During inter-discharges, a remotely controlled pulse motor is used to move the CCD along the focal plane to change the wavelength interval. In this work, the EUV_Short spectrometer was set to observe a fixed wavelength range of 8–65 Å, while wavelength scans were performed three times to observe spectra at the full wavelength range for the EUV_Long spectrometer, i.e., 65–190, 190–320, and 320–495 Å. The intensity of the spectrometers was absolutely calibrated by comparing experimental and theoretical intensities of the bremsstrahlung continuum [18]. The lines of sight (LOS) of these two spectrometers are illustrated in Figure 2.
In this work, we used the polarimeter-interferometer (POINT) system to measure and provide real-time feedback control of the line averaged electron density, ne [21]. We also employed a 32-channel heterodyne radiometer (HRS) system to observe the intensity of thermal electron cyclotron emission (ECE) in the frequency range of 104–168 GHz [22]. Positions of ECE measurement at Bt = 2.25 T in the discharges studied in this work are illustrated in Figure 2. In addition, we used multi-channel hard X-ray diagnostics systems placed around the EAST machine to detect hard X-ray emission resulting from the thick target bremsstrahlung of runaway electrons that were lost from the plasma and impinging on the vessel walls or plasma facing components, covering the energy range of 0.1–7.0 MeV [7,23,24].

3. EUV Spectra Analysis in the Plasma Recovery

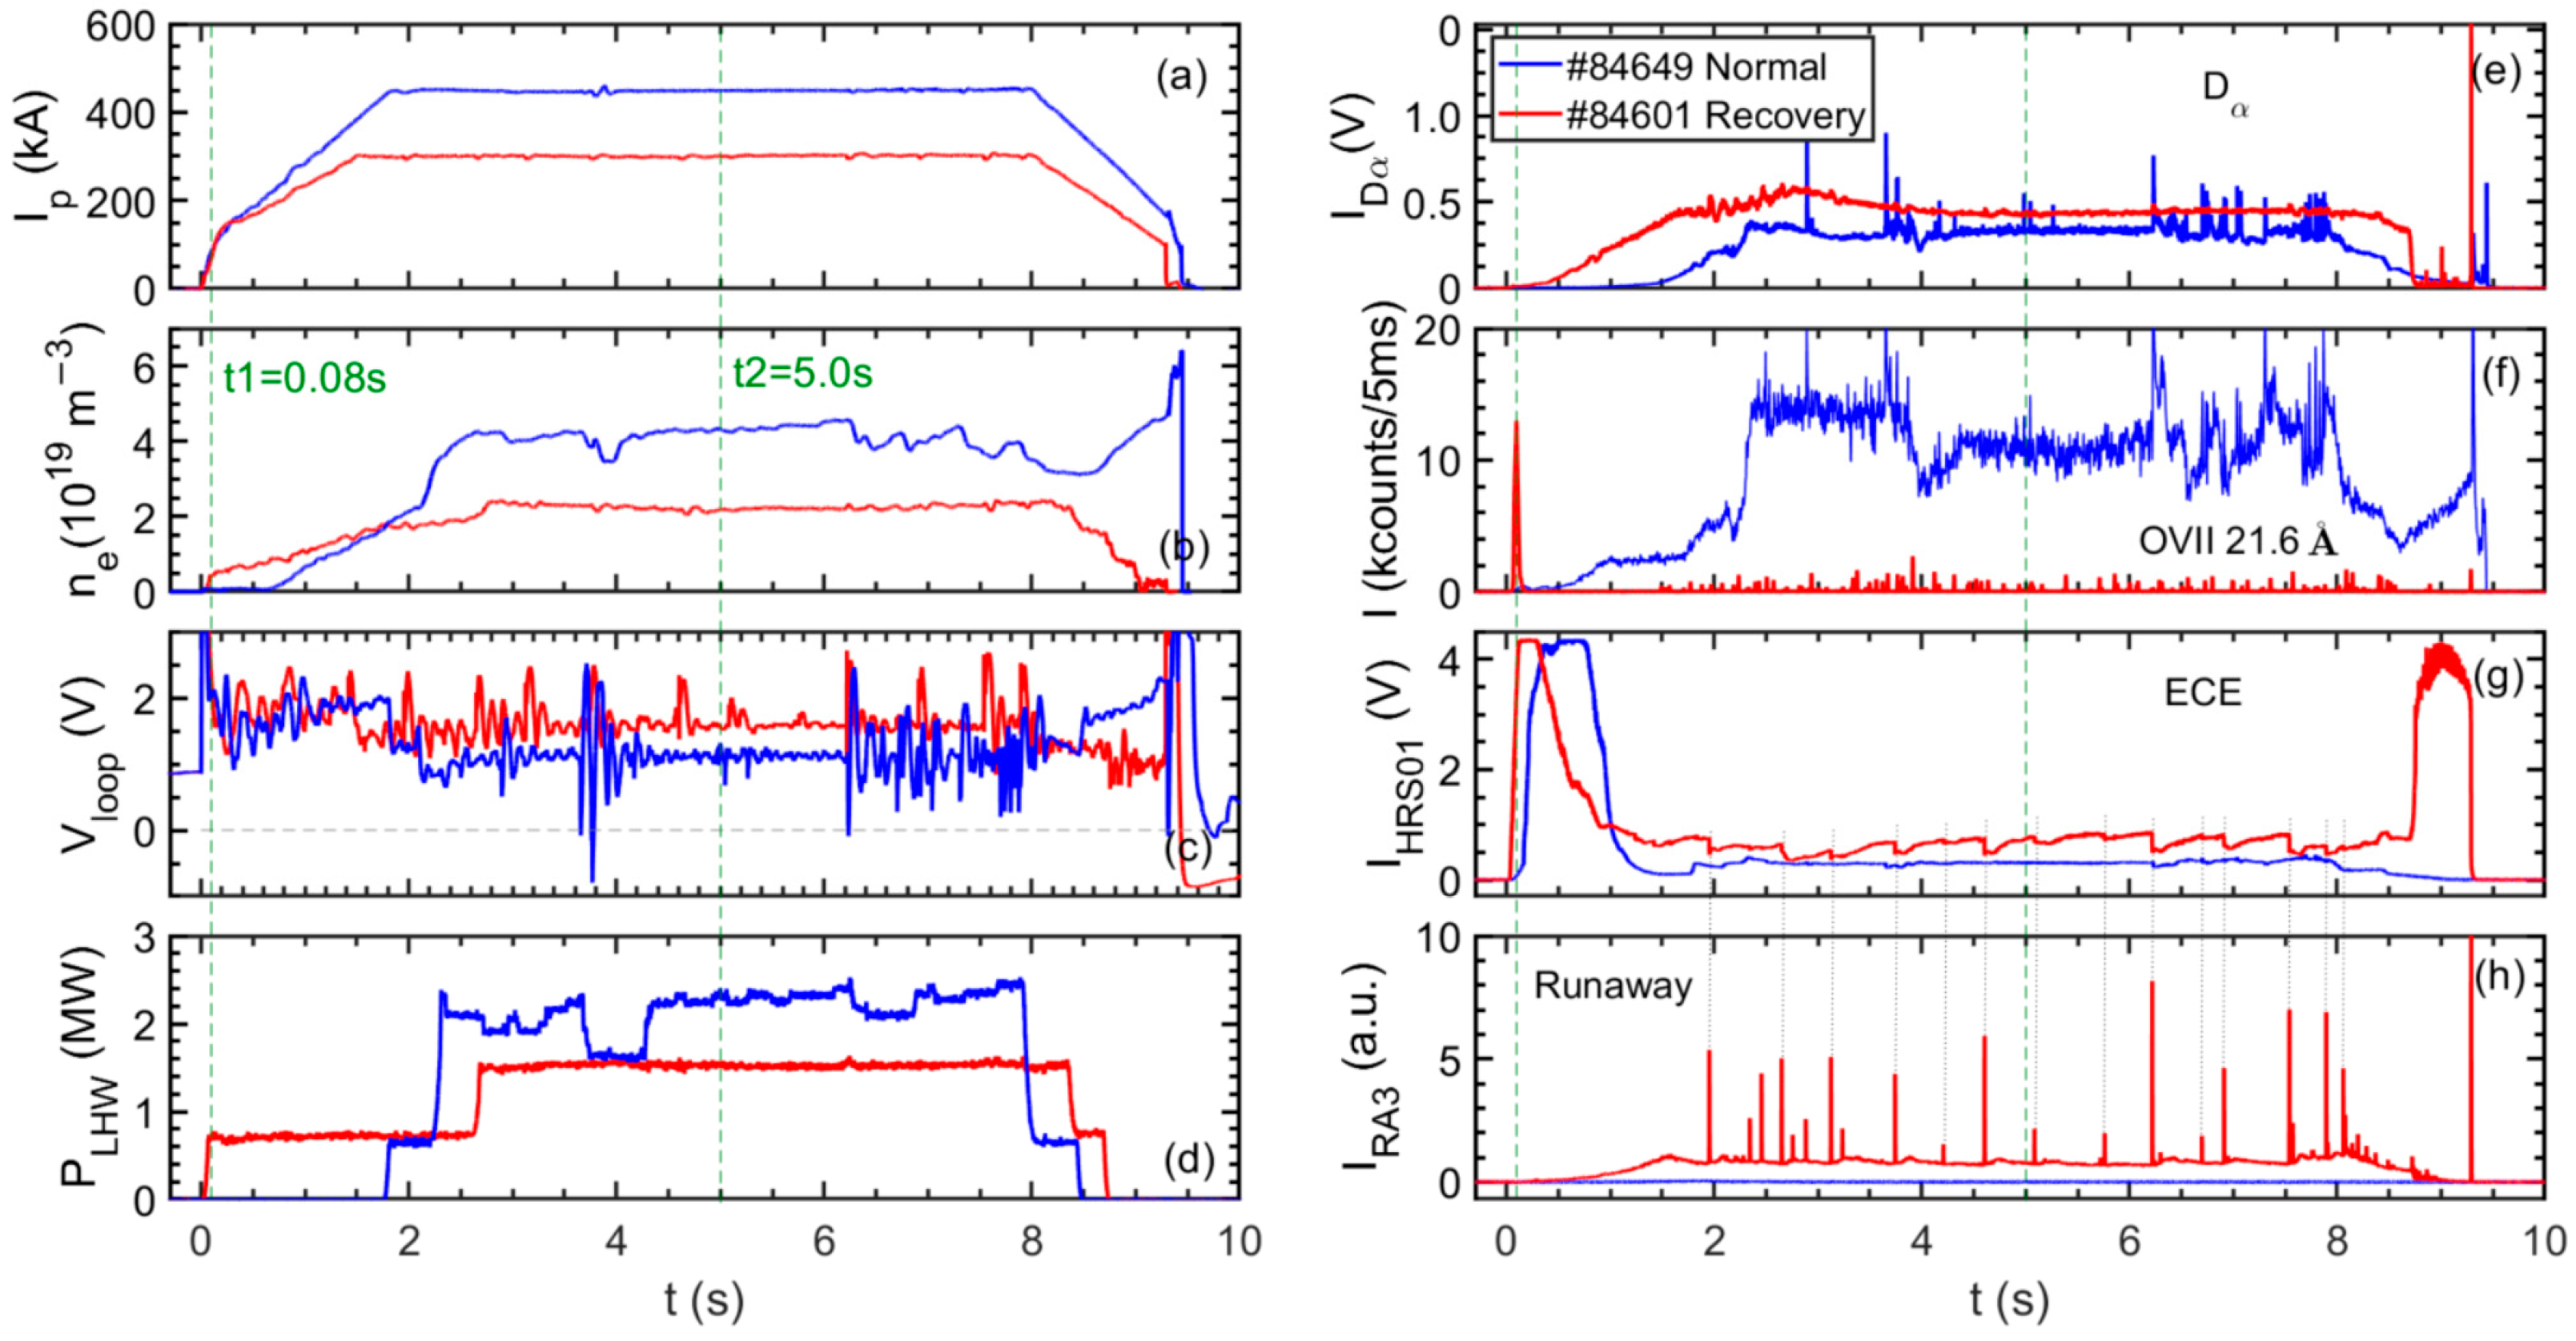
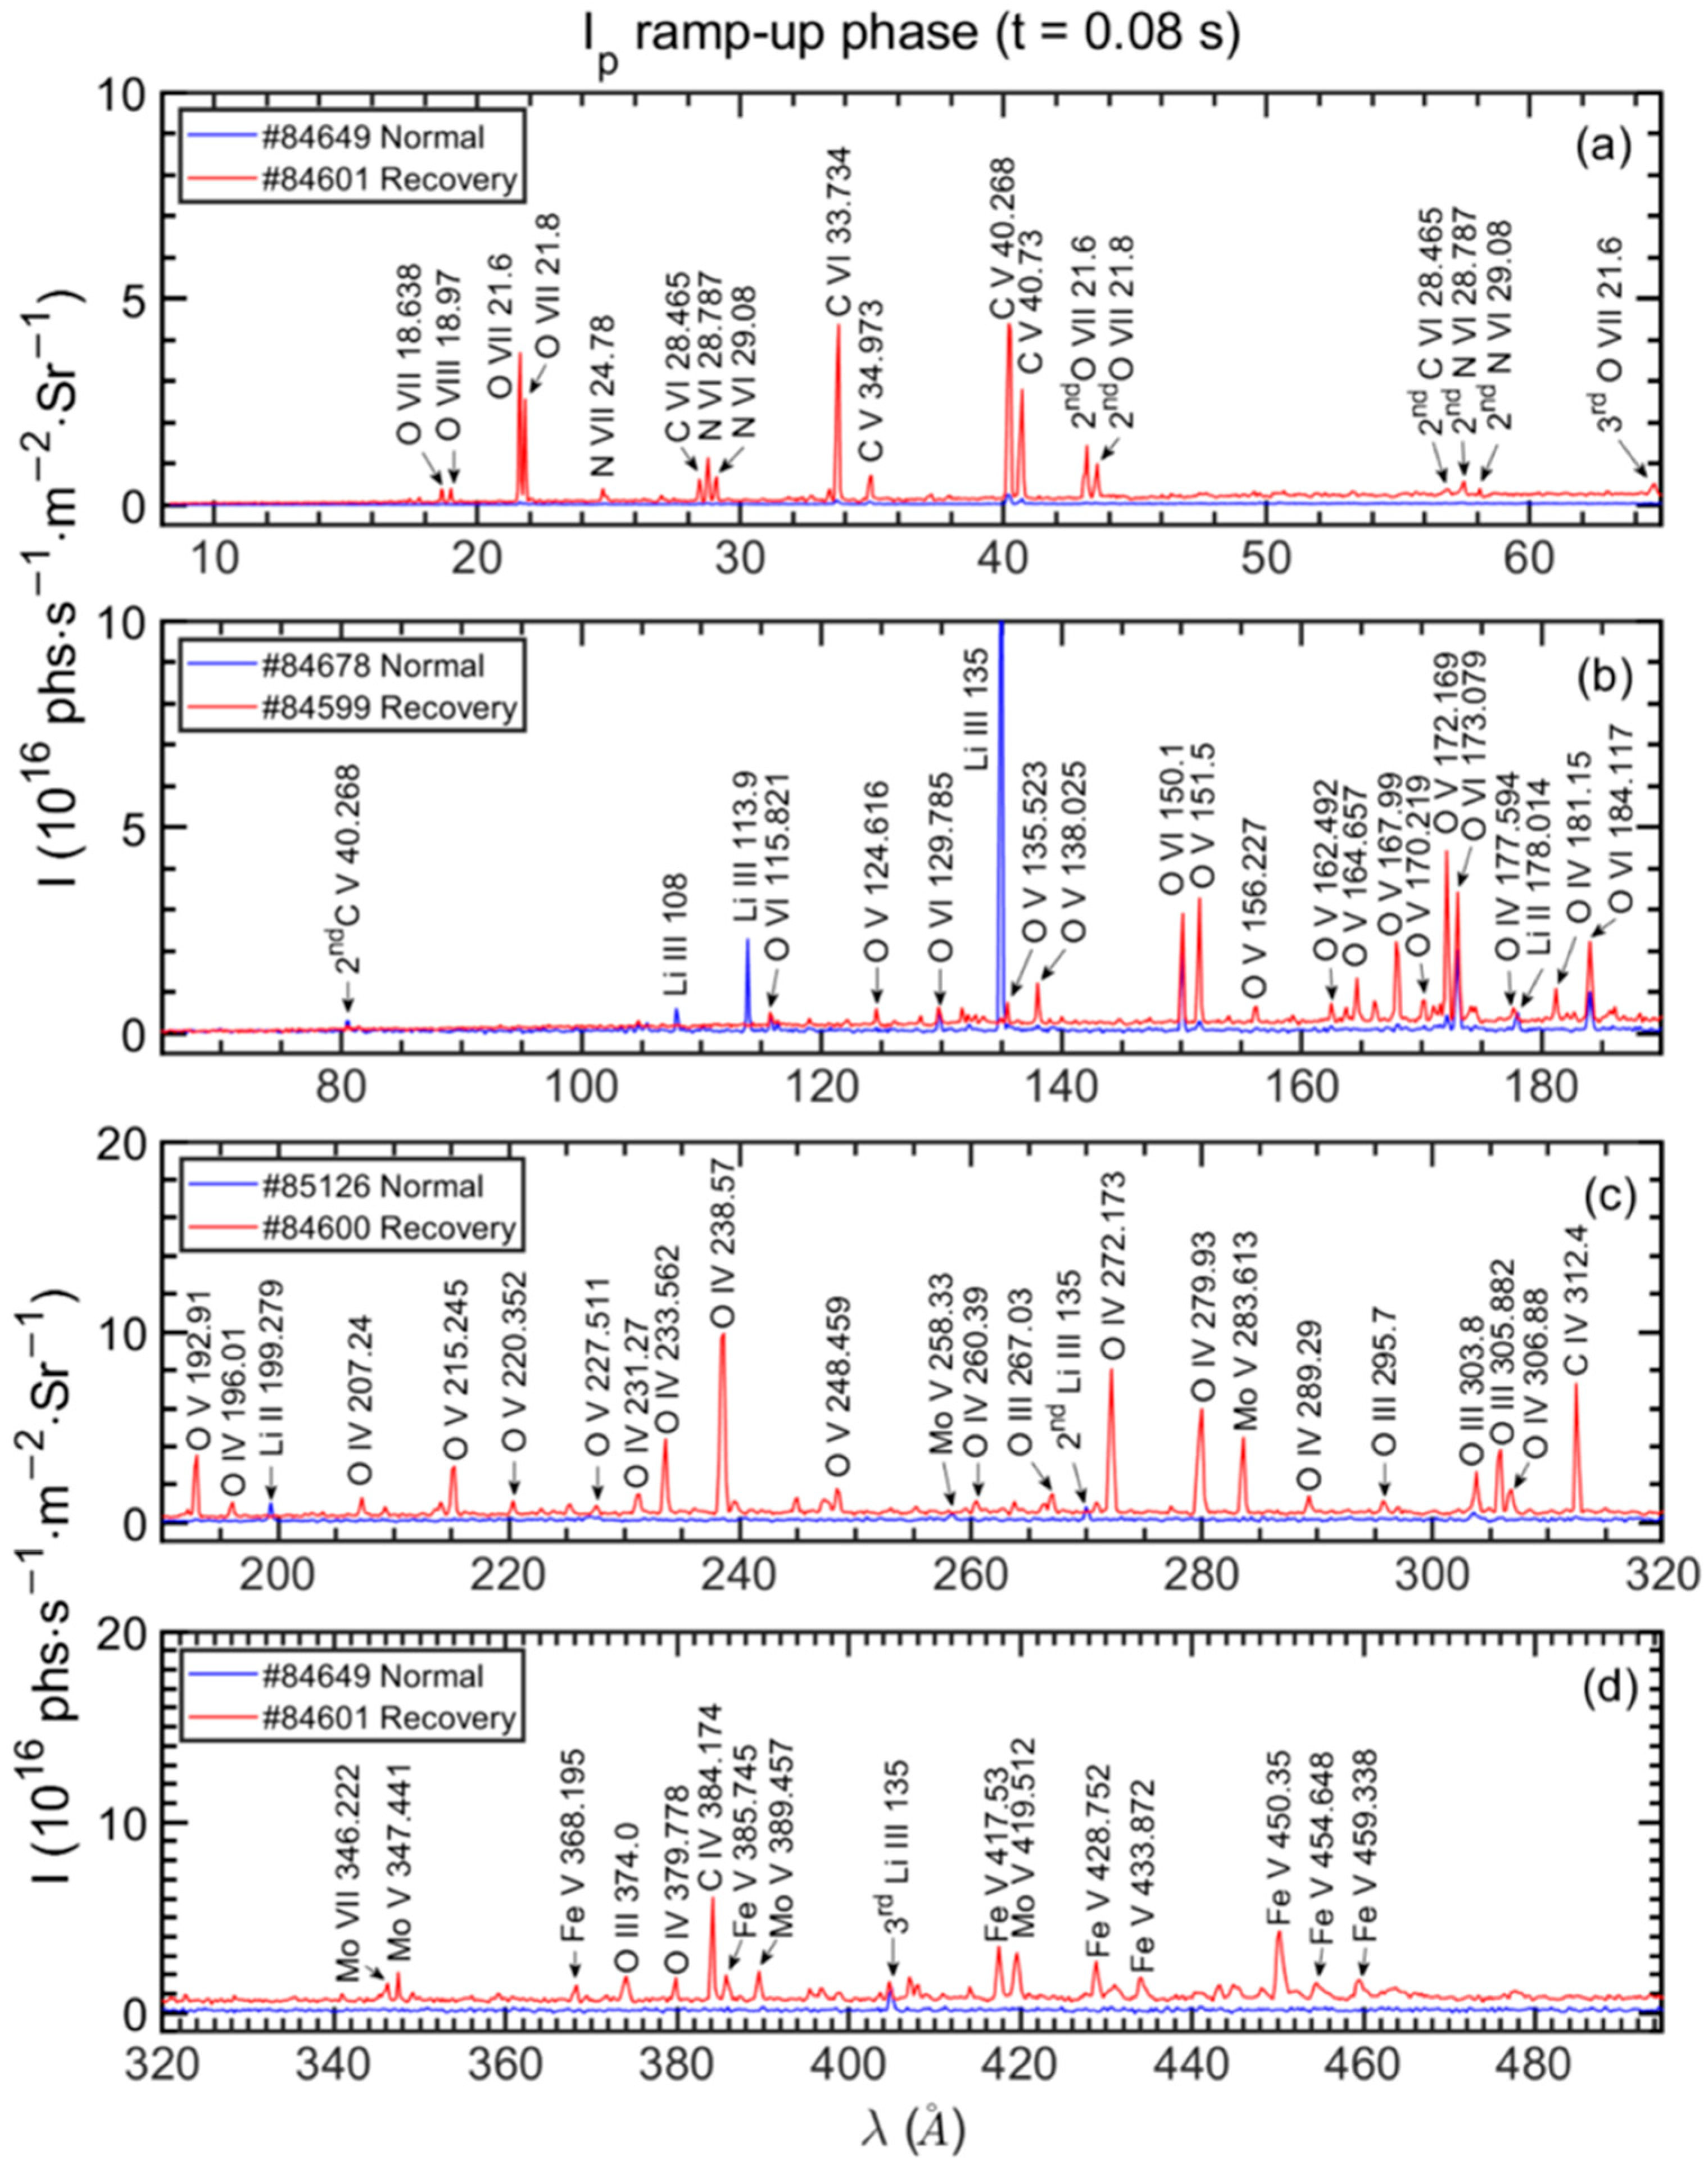
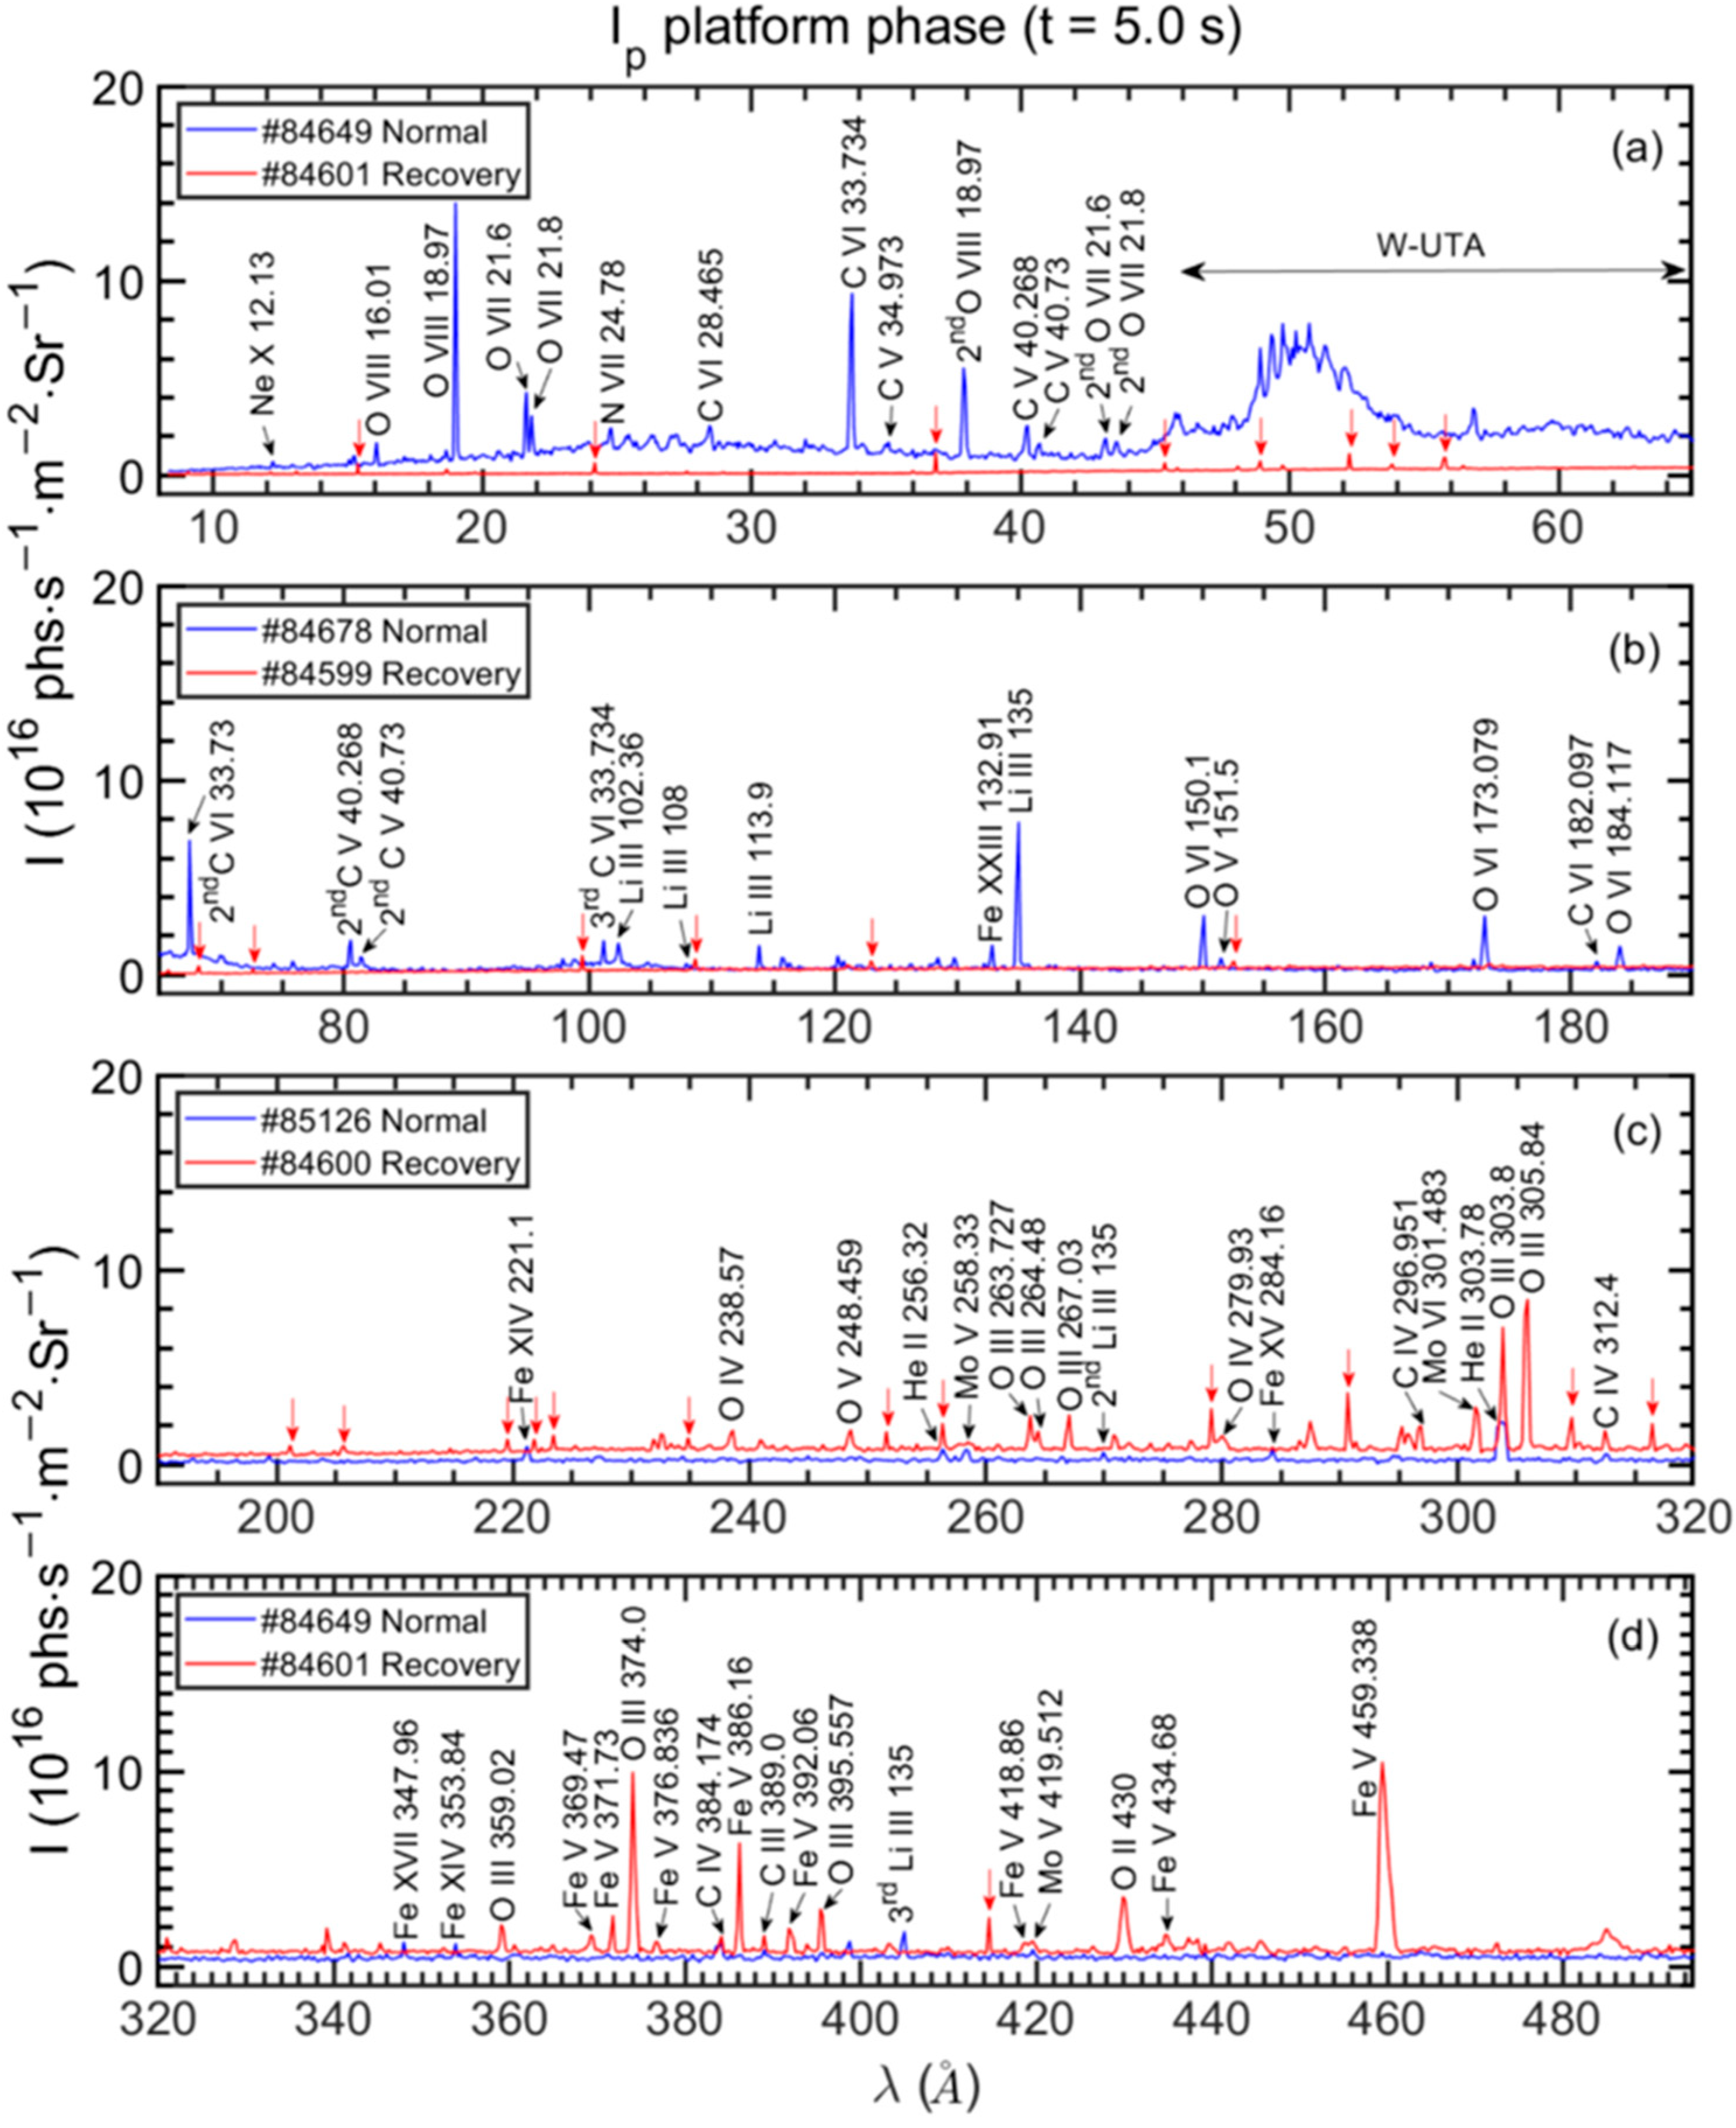
3.1. Discharge Waveform

The waveforms of EAST recovery discharge (#84601) and normal discharge (#84649) are shown in Figure 3. In the recovery discharge, the injected power from LHW1 and LHW2 was 0.8 MW each, from 0 to 8.6 s and 2.6 s to 8.4 s, respectively. The discharge had a plasma current of 300 kA and a line-averaged electron density of 2.2 × 10¹⁹ m−3. In the normal discharge, the injected power of LHW1 and LHW2 was 0.7 MW and 1.8 MW, from 1.8 to 8.2 s and 2.2 s to 8.0 s, respectively. This discharge had a plasma current of 450 kA and a line-averaged electron density of 4.3× 10¹⁹ m−3.
In both discharges, energetic electrons were generated during the Ip start-up phase, which significantly contributed to the saturated ECE signal. In the normal discharge (#84649), the line intensity of Dα and O VII (O6+, Ionization Energy Ei = 739.3 eV) at 21.6 Å was measured by the Filterscope system and the EUV_Short spectrometer, respectively. The line intensity slowly increased with ne, and then largely increased after 4.6 GHz LHW was superimposed due to the enhanced interaction between the plasma and wall (see the blue lines in Figure 3e,f). The spikes and dents in the time evolution of the signals were caused by the unstable power injection (see the blue line in Figure 3d). The energetic electrons started to slow down from t = 1.0 s despite a high loop voltage, and then the ECE signal was reduced. Meanwhile, the runaway signal remained at around 0 in the whole discharge (see the blue lines in Figure 3g,h).
On the contrary, in the recovery discharge (#84601), the line intensity of O VII was very high at the plasma start-up phase of t ≤ 0.1 s, i.e., 50–100 times higher than in the normal discharge, indicating a very high level of oxygen content. The emission lines disappeared at t = 133 ms and were replaced by random spike noises in the EUV spectra, indicating a quench of confined (collisional) plasma and the formation of low-temperature plasma (see the red line in Figure 3f). Other impurity lines, such as C VI 33.73 Å and C V 40.27 Å, had similar time traces as O VII. Therefore, the lifetime of confined (collisional) plasma in the recovery discharge, τc, can be deduced from the duration of emission lines from H- and He-like oxygen and carbon ions in the discharge. Although the plasma current was maintained throughout the whole discharge of #84601, the confined (collisional) plasma was only maintained for 133 ms. After that, the discharge changed to a runaway status filled with low-temperature plasma, and the plasma current was sustained by lower hybrid waves and runaway electrons. Lots of energetic electrons were continually accelerated from t = 133 ms and became runaway electron, leading to a gradually increasing runaway signal until the end of the Ip ramp-up phase (t = 1.8 s). During the Ip flattop phase, the step-like decrease in the ECE signal corresponded to spikes in the runaway signal, indicating sudden increases in thick target bremsstrahlung intensity caused by sudden losses of energetic electrons from plasma impinging on the first wall (see the red lines in Figure 3g,h).
The differences between normal and runaway discharge can be easily observed from the plasma appearances recorded by a high-speed CCD camera. As shown in Figure 4b, during the Ip platform phase of the normal discharge, the plasma appeared with a bright and clear boundary and dark bulk area, indicating a well confined plasma with a high core temperature, e.g., > 1.0 keV. On the contrary, during the Ip platform phase (t = 5.0 s) in the recovery discharge, the runaway plasma appeared with no boundary due to much lower temperature in the bulk plasma with poor confinement, as shown in Figure 4d. Images recorded during the plasma start-up phases for both discharges are extremely dark due to very low plasma density, i.e., ne = 0.1 × 10¹⁹ and 0.3 × 10¹⁹ m−3, respectively (see Figure 4a,c).

3.2. Impurity Behavior Analysis

As mentioned earlier, the observable wavelength range of the EUV_Short spectrometer was fixed to be 8–65 Å in the experiment, and wavelength scans (i.e., 65–190, 190–320, and 320–495 Å) were performed for the EUV_Long spectrometer in three discharges during plasma recovery. The EUV spectra covering 5–495 Å observed at the Ip ramp-up phase and platform phase in recovery discharges were then compared with those observed in the normal discharges to analyze the differences in impurity behavior. The parameters of the discharges, including plasma current (Ip), average electron density (ne), and the wavelength interval of the spectrometers, are listed in Table 1.
Figure 5 shows the typical EUV spectra during the Ip ramp-up phase (t = 0.08 s, before plasma quenching) in both recovery discharges (#84599, #84600, and #84601) and normal discharges after lithium coating (#84649, #84678, and #85126), covering a wavelength range of 8–495 Å. Figure 5a–c show a comparison of spectra in the 8–320 Å range. Several emission lines from H-like and He-like low-Z impurity of carbon (C V-C VI, C4+-C5+), nitrogen (N VI-N VII, N5+-N6+), and oxygen (O VII, O6+) with strong intensity appeared in the short wavelength range of 8–65 Å (see the red line in Figure 5a). The intensities of C V-C VI, N VI-N VII, and O VII in the recovery discharge are 20–40, 10–20, and 40–50 times higher than those in the normal discharge (see the blue line in Figure 5a), respectively, indicating a high content of low-Z impurities in plasma recovery since the electron density and temperature of the plasma are similar in both cases. At the wavelength of 65–190 Å, the most commonly observed emission lines in normal discharges were several O VI lines at 150.1, 173.079, and 184.117 Å, as shown in Figure 5b. Li III (Li2+) at 135 Å and 113.9 Å also appeared with strong intensity due to wall conditioning of lithium coating. In contrast, in the recovery discharges, many oxygen lines in the ionization state down to O2+ appeared at 110–380 Å, probably due to a high content of oxygen, potentially from residual water inside the EAST vacuum vessel, among which O V and O VI lines mainly appeared at 110–230 Å, while O IV and O III lines mainly appeared at 200–380 Å. Emission lines from lowly ionized iron and molybdenum ions also appeared at the long wavelength range of 340–460 Å in the recovery discharges, such as Fe V (Fe4+) and Mo V (Mo4+), probably due to residual metal dust from runaway electrons hitting the walls inside the EAST vacuum vessel, which was not observed in the case of normal discharges. Figure 5d shows a comparison of line intensity at 320–495 Å, where impurity lines of carbon, oxygen, and iron (mainly Fe V) in recovery discharge (#84601) were observed.
The EUV spectra recorded during recovery discharges are invaluable data that were rarely obtained and analyzed in previous research. The higher content of low-Z impurities in the current ramp-up phase, and the presence of residual metal dust inside the EAST vacuum chamber after a vacuum failure, may explain why the collisional plasma cannot be maintained.
Figure 6 presents the EUV spectra obtained at 8–495 Å during current platform (t = 5.0 s) in recovery (#84599, #84600, and #84601) and normal (#84649, #84678, and #85126) discharges after lithium coating. Figure 6a,b show the comparison of spectra at 8–190 Å. At this wavelength range, low-Z impurity lines from highly ionized lithium, carbon, nitrogen, and oxygen ions, e.g., C V–C VI (C4+–C5+), N VII, and O VI–O VIII (O5+–O7+), as well as tungsten unresolved transition array (W–UTA, W24+–W32+) appeared in normal discharges with a core electron temperature of ~1.5 keV. While only spike noises caused by high-energy runaway electrons were recorded in recovery discharges, as indicated by the red vertical arrows. Figure 6c,d show the comparison of spectra at 190–495 Å. In addition to the spike noises, many impurity lines from lowly ionized carbon, oxygen, and iron ions, e.g., C IV (C3+), O II–O III (O+–O2+), and Fe V (Fe4+) appeared, especially O III and Fe V lines with strong intensity dominating the spectra, indicating a very low electron temperature of the bulk plasma, e.g., 55–75 eV.
Comparison of EUV spectra during the current platform reveals the differences in impurity behavior between normal collisional plasma and runaway plasma in recovery discharges. In normal discharges, highly ionized low-Z impurity ions and tungsten UTA existed in the bulk plasma due to a higher core electron temperature of ~1.5 keV. In contrast, weakly ionized low-Z impurity, particularly O2+ and Fe4+ ions, appeared in the recovery plasma due to much lower electron temperature and poor plasma confinement. Additionally, the EUV spectra, especially in the wide wavelength range of 8–320 Å, suffered from numerous spike noises in the recovery discharges. The spike noises, which were caused by X-ray emission resulting from thick target bremsstrahlung, randomly appeared in time and were characterized by existing at a single pixel with no broadening and lasting only one frame in the spectrum.

4. The Effect of Lithium Granule Injection on Impurity Suppression and Plasma Performance Improvement

In order to investigate the effect of lithium coating on impurity suppression and improvement of plasma confinement, a small amount of lithium granule (10–20 mg/s) was injected in real time during several successive discharges (#84603–#84609). The plasma parameters, e.g., plasma current (Ip), average electron density (ne), loop voltage (Vloop), and the accumulated amount of lithium granule injection are listed in Table 2. Note that #84604, #84608, and #84610 are not included in the table due to disruption occurring at 1.18, 1.58, and 1.24 s, respectively. In addition, a late disruption occurred at 6.6 s in discharge #84606.

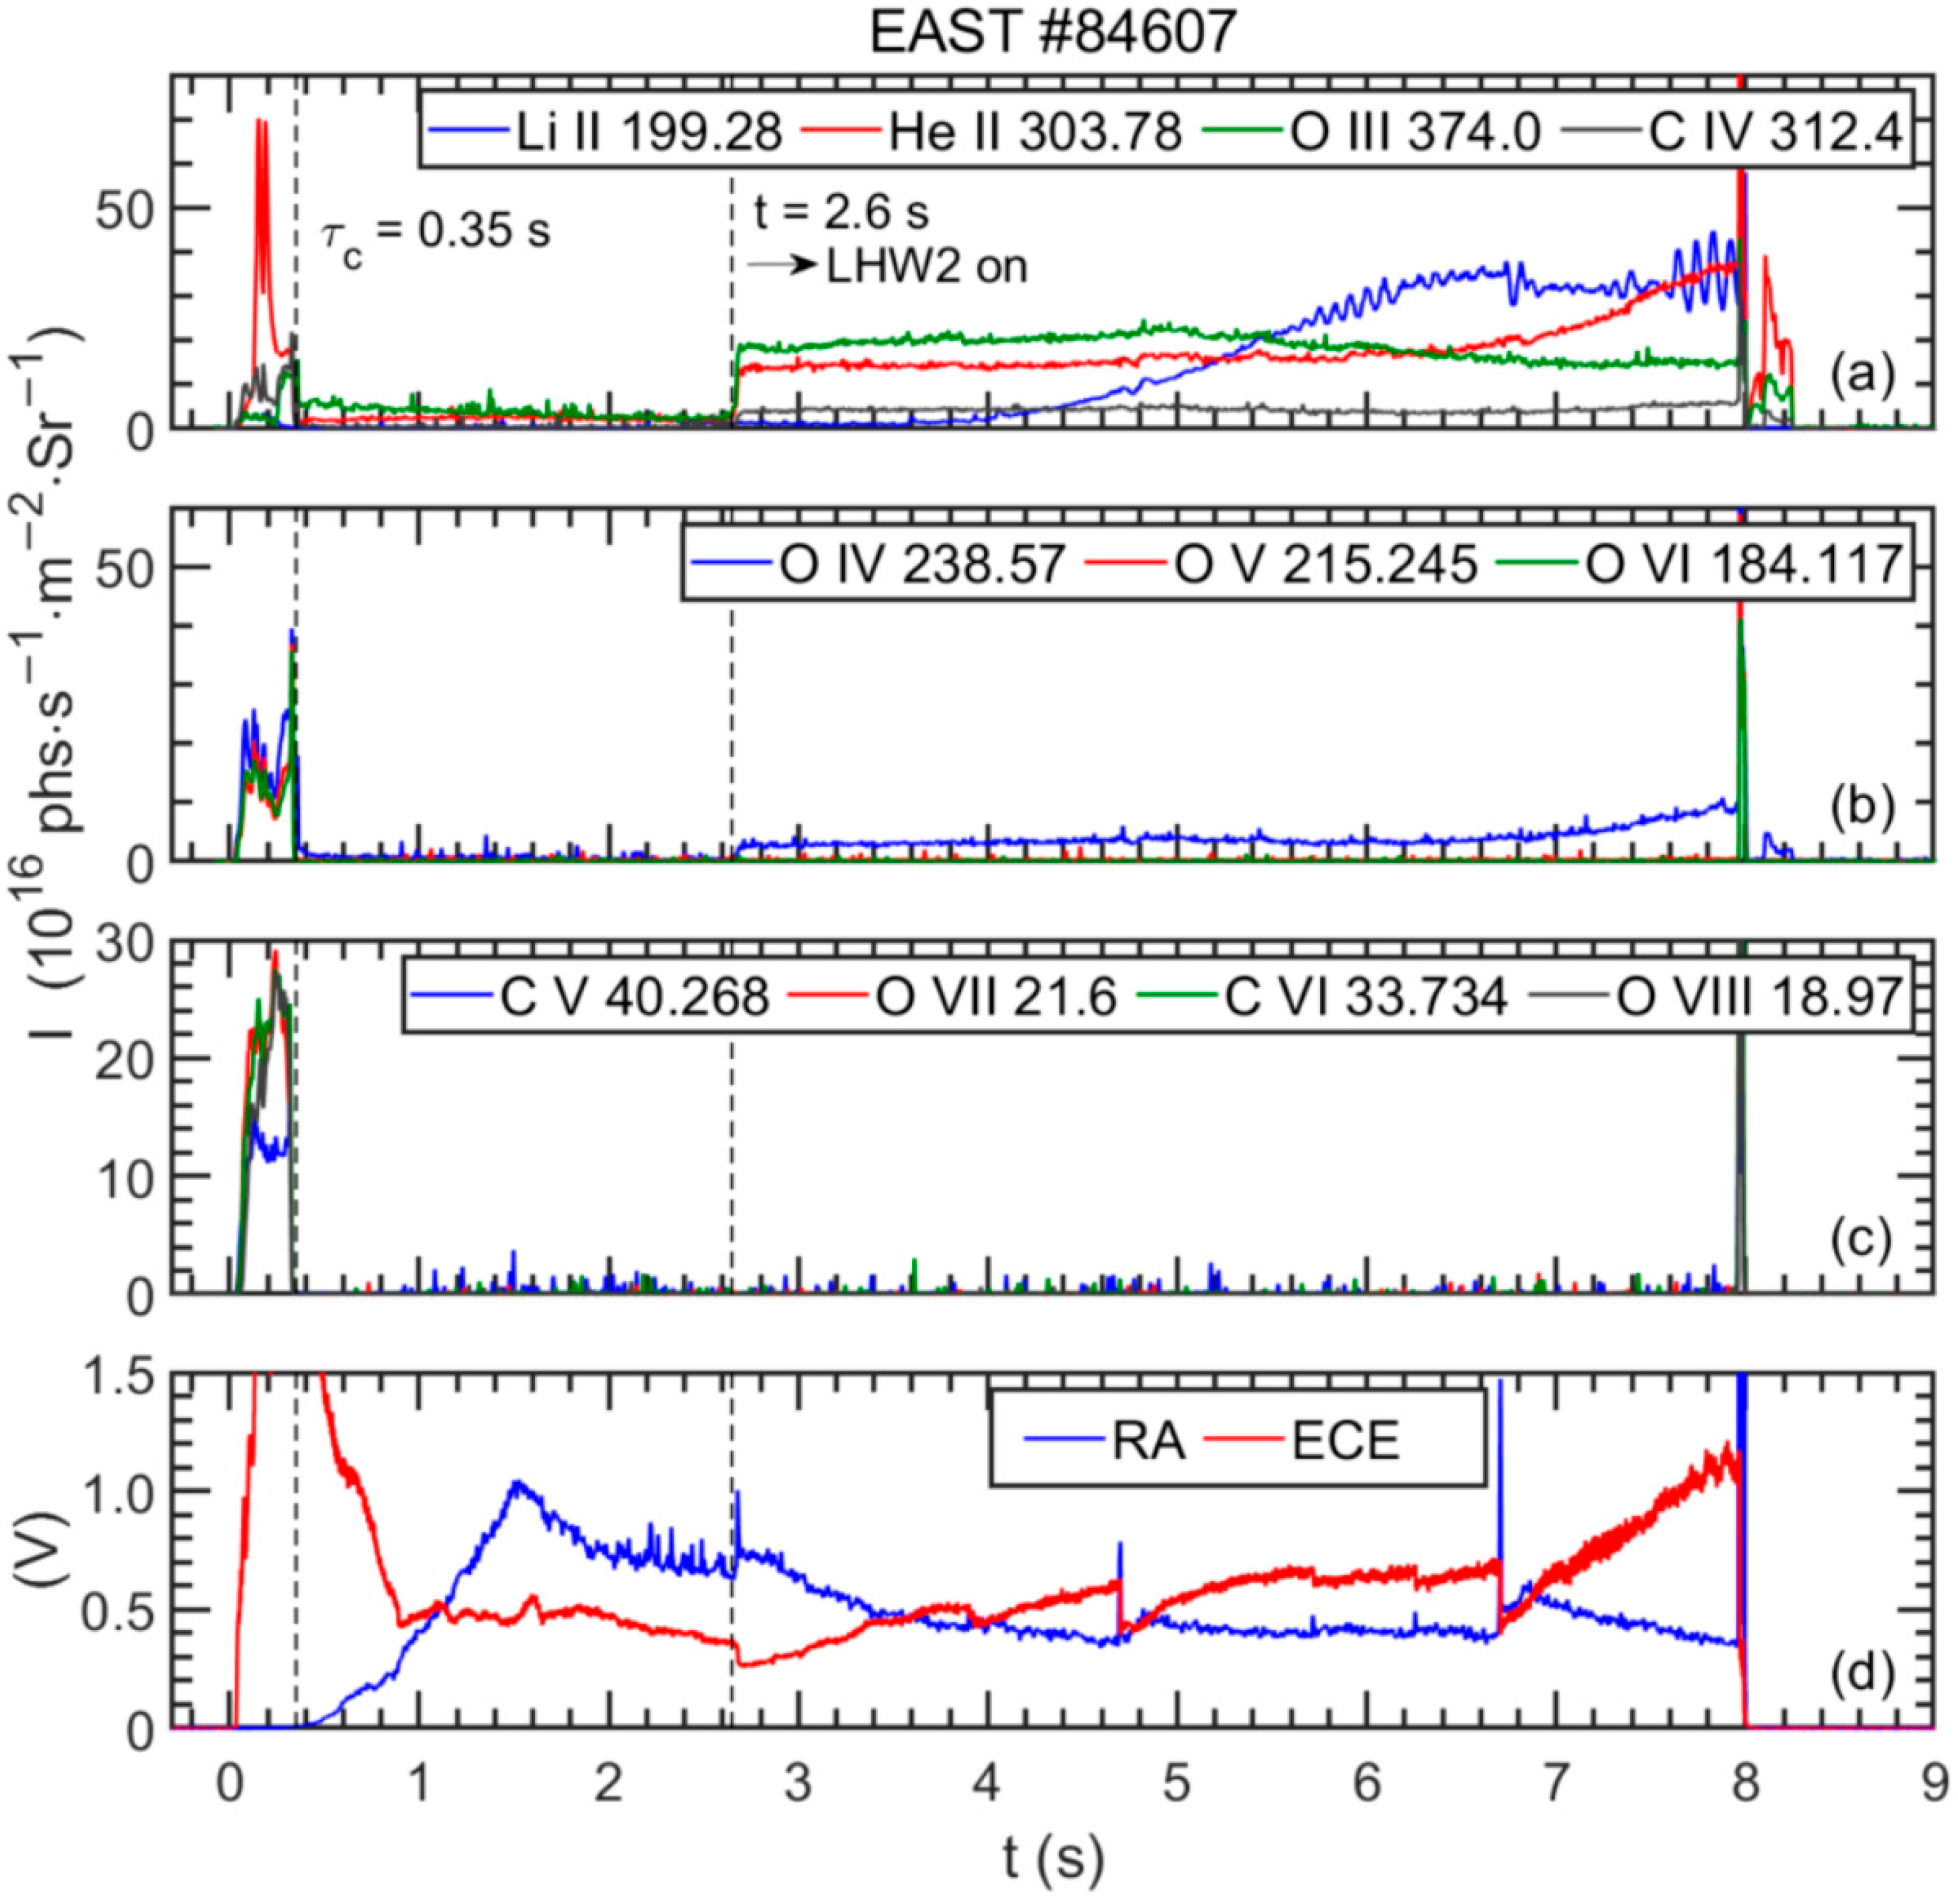
4.1. Typical Recovery Discharge with Lithium Granule Injection

Figure 7 illustrates a typical discharge with real-time lithium granule injection (shot #84607, with Ip = 300 kA, ne = 2.6 × 10¹⁹ m−3, PLHW1 = 0.8 MW, and PLHW2 = 0.8 MW injected from 0 to 8.0 s and 2.6 to 8.0 s, respectively). Until this discharge, the accumulated amount of lithium granule was ~286 mg. In this discharge, the lithium granule entered the plasma at 3.6 s based on the time trace of Li II line intensity (blue line in Figure 7a). All the emission lines disappeared at t = 0.35 s, indicating that the collisional plasma was sustained for 350 ms (see Figure 7a–c), which was significantly longer than in discharge #84601 without lithium injection. As shown in Figure 7d, during the Ip platform phase, the cycle of step-like decreasing and corresponding large spikes in ECE and runaway signal, respectively, was also extended to ~2 s, reflecting a much-reduced frequency of energetic electrons lost from the plasma. This indicates that, with real-time lithium injection, the confinement was improved even in the runaway status. After the injection of 4.6 GHz LHW power from t = 2.6 s, the intensity of low-Z impurity lines, e.g., He II 303.78 Å, O III 374.0 Å, and C IV 312.4 Å, started to increase, probably due to an increase in electron temperature and an enhancement of confined electrons.

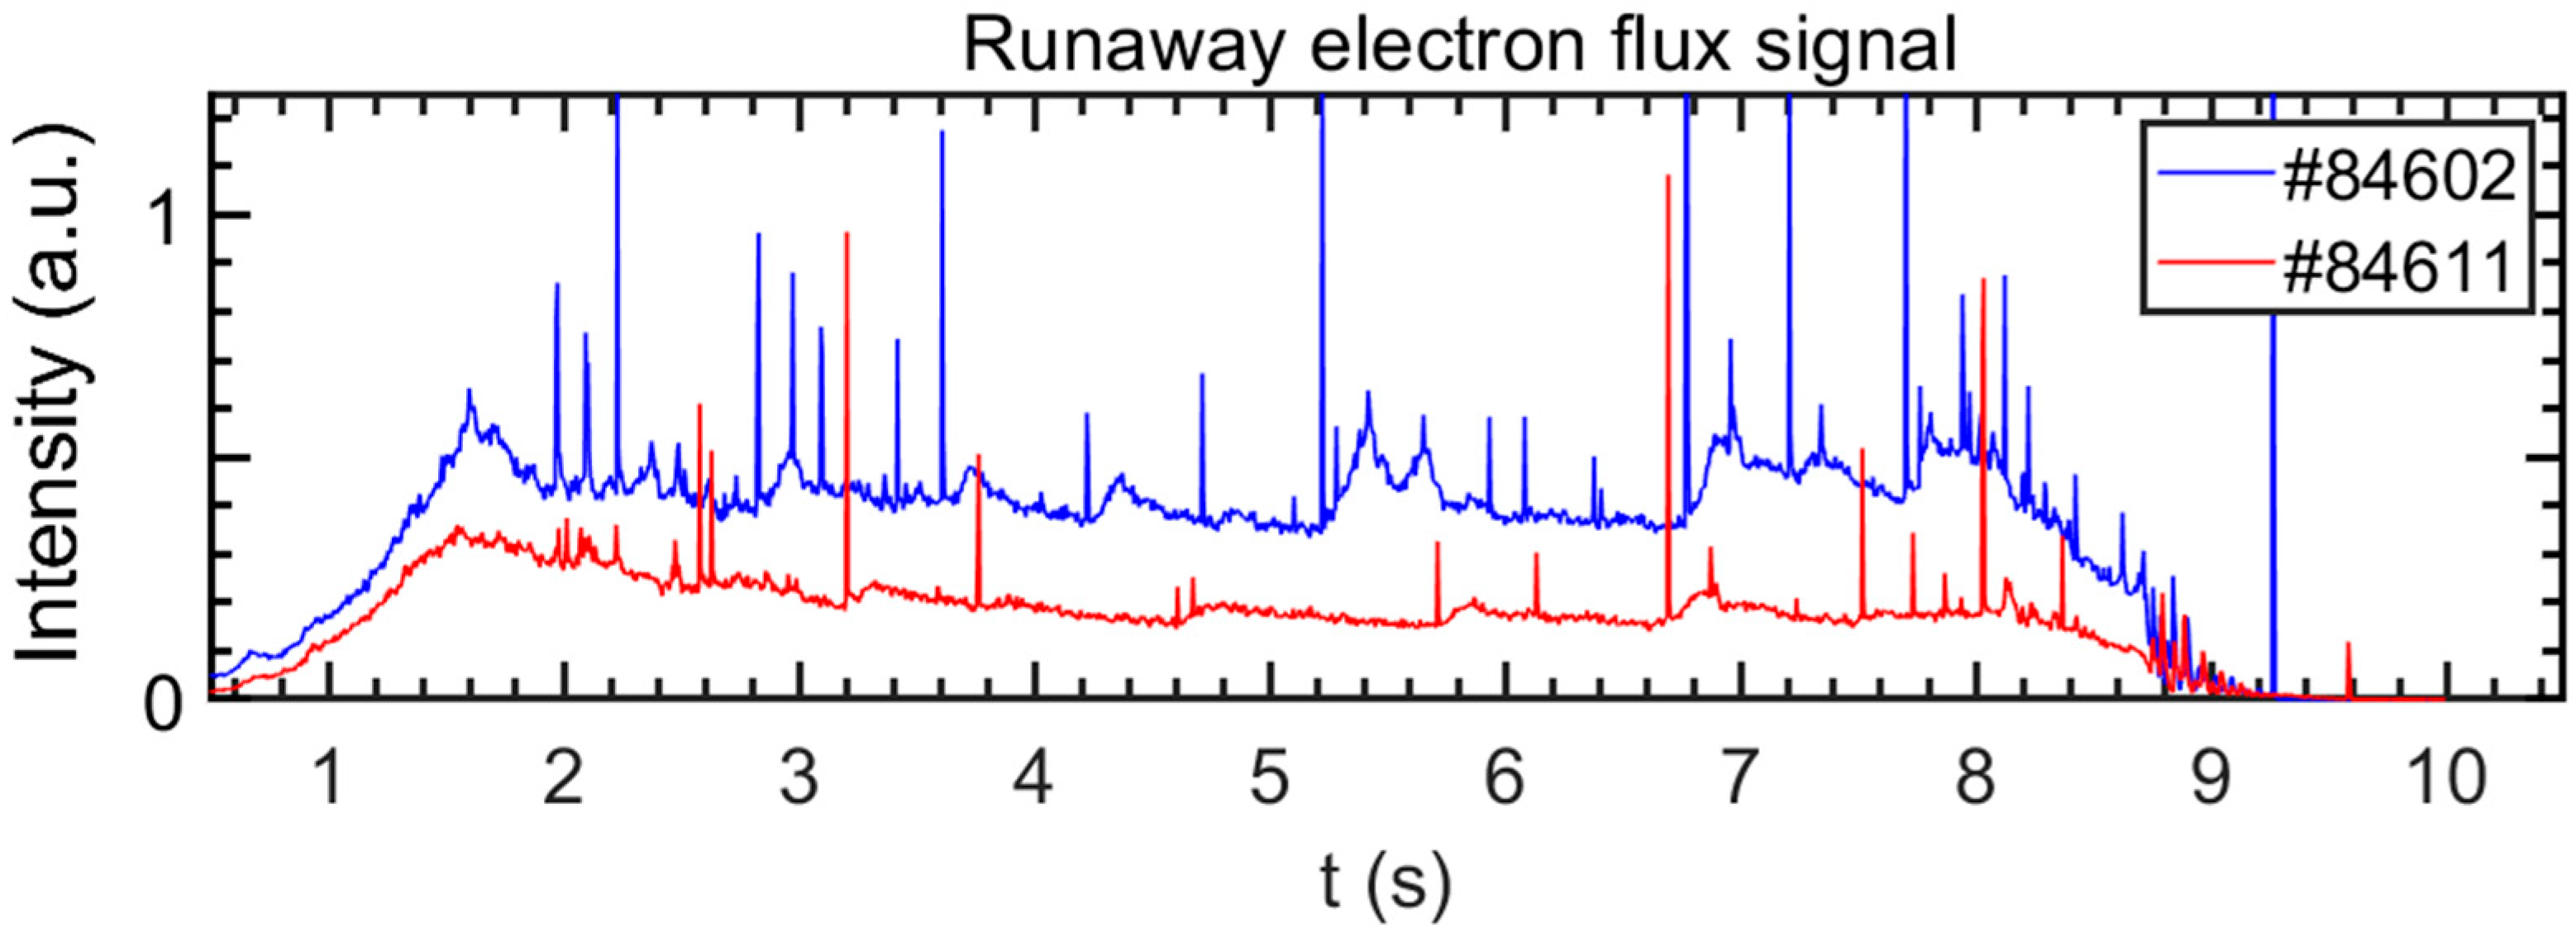
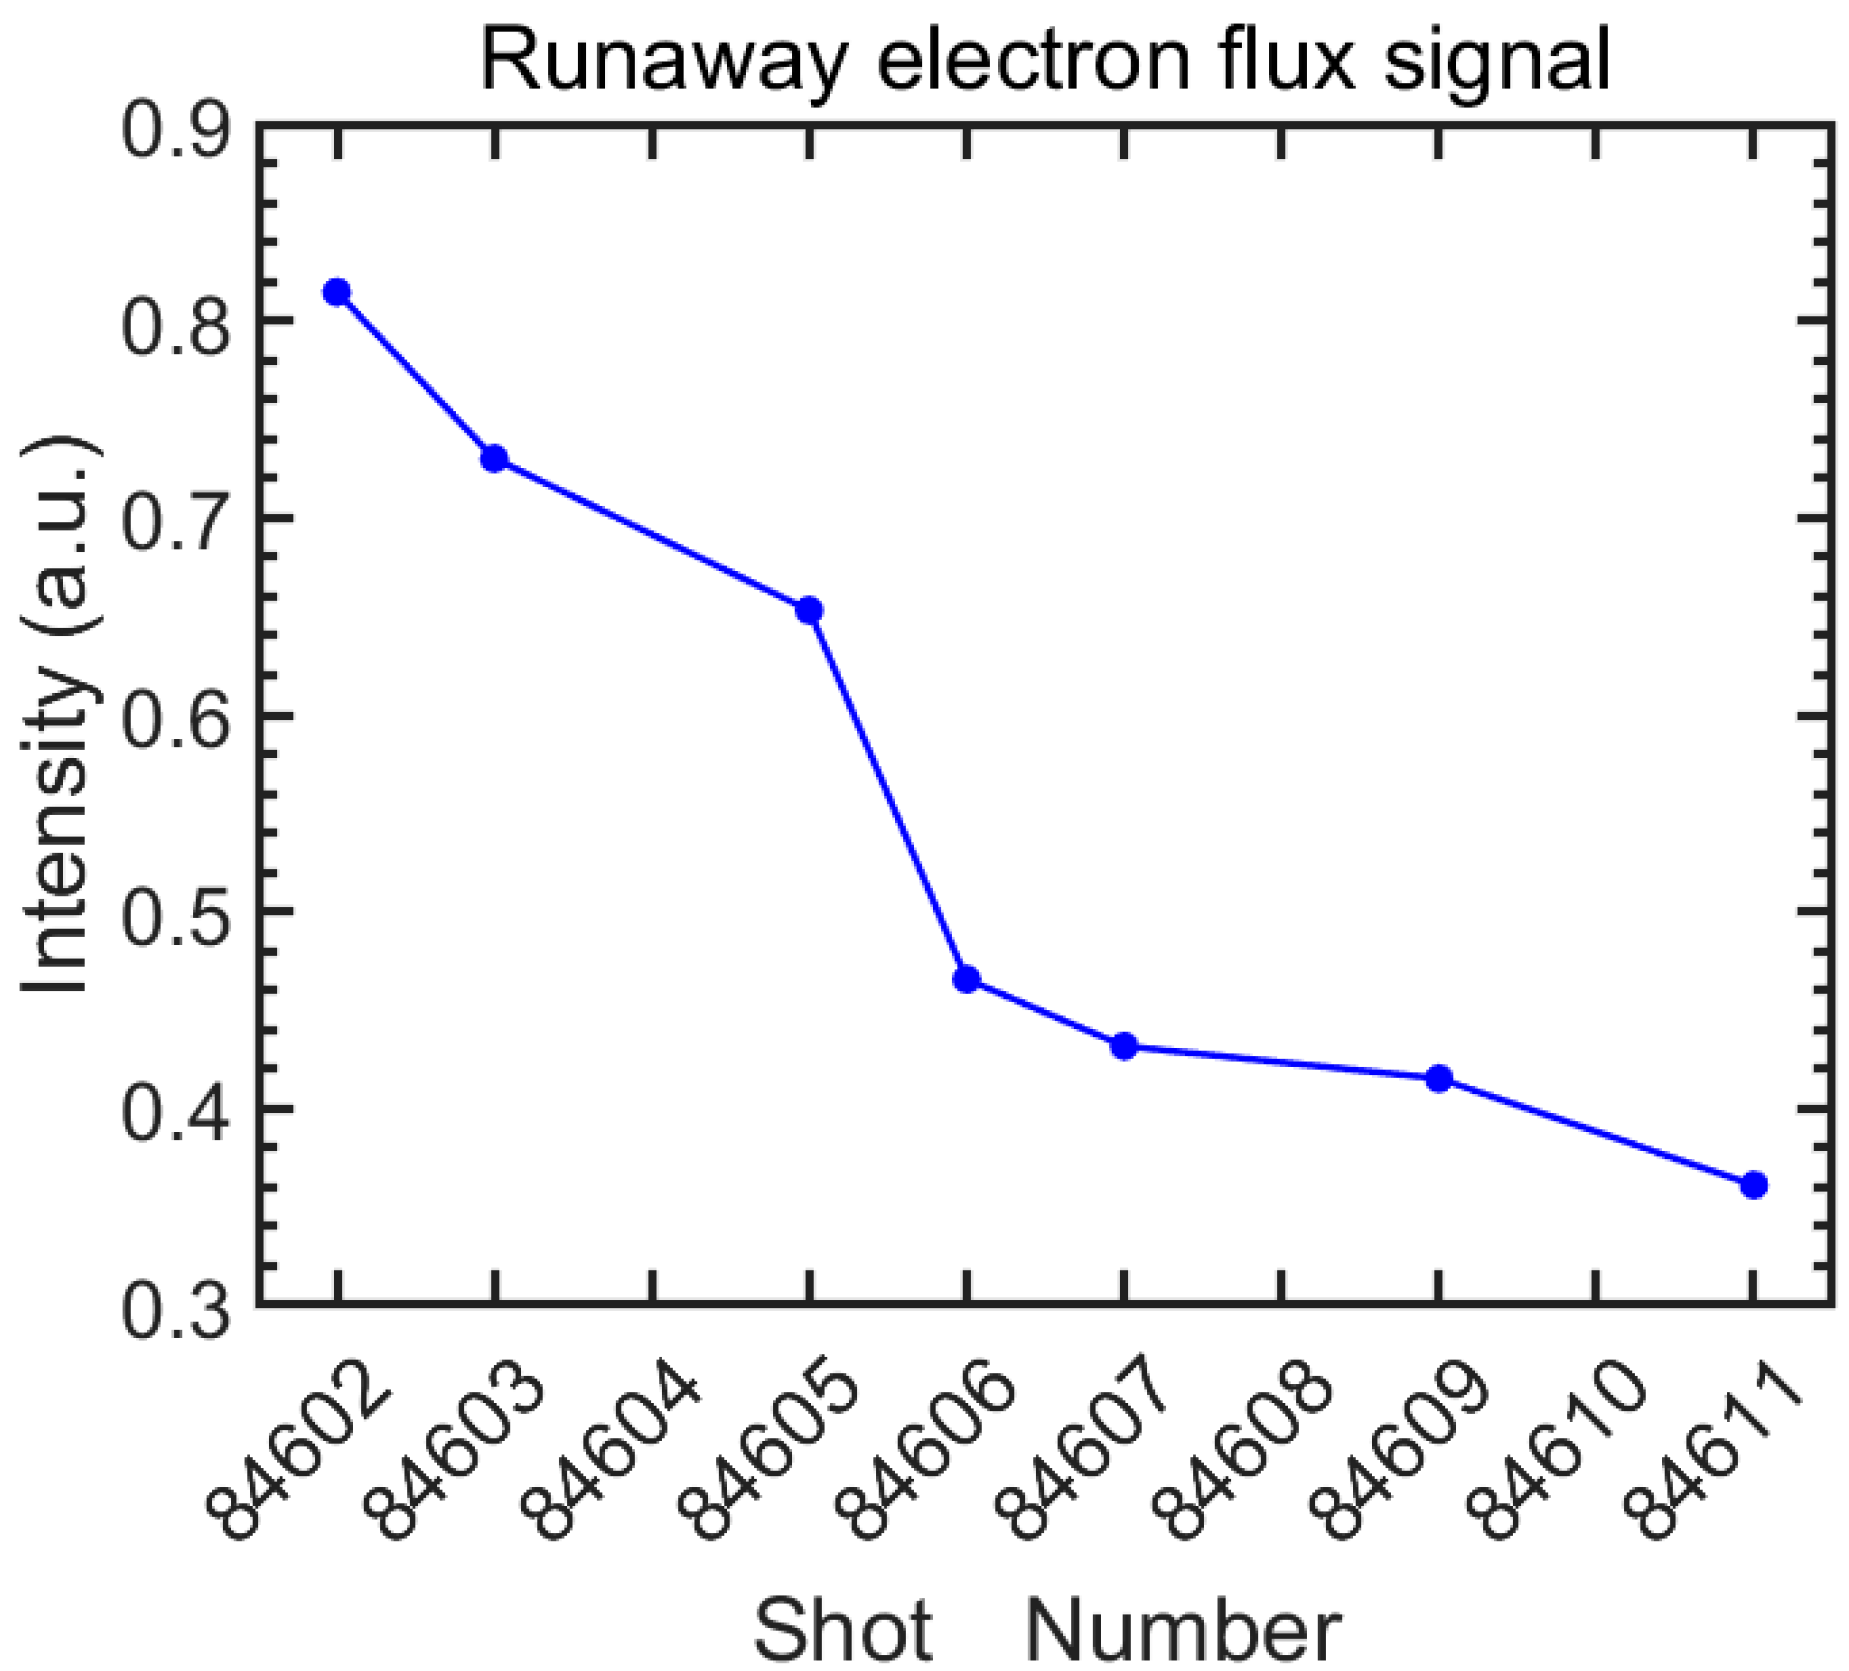
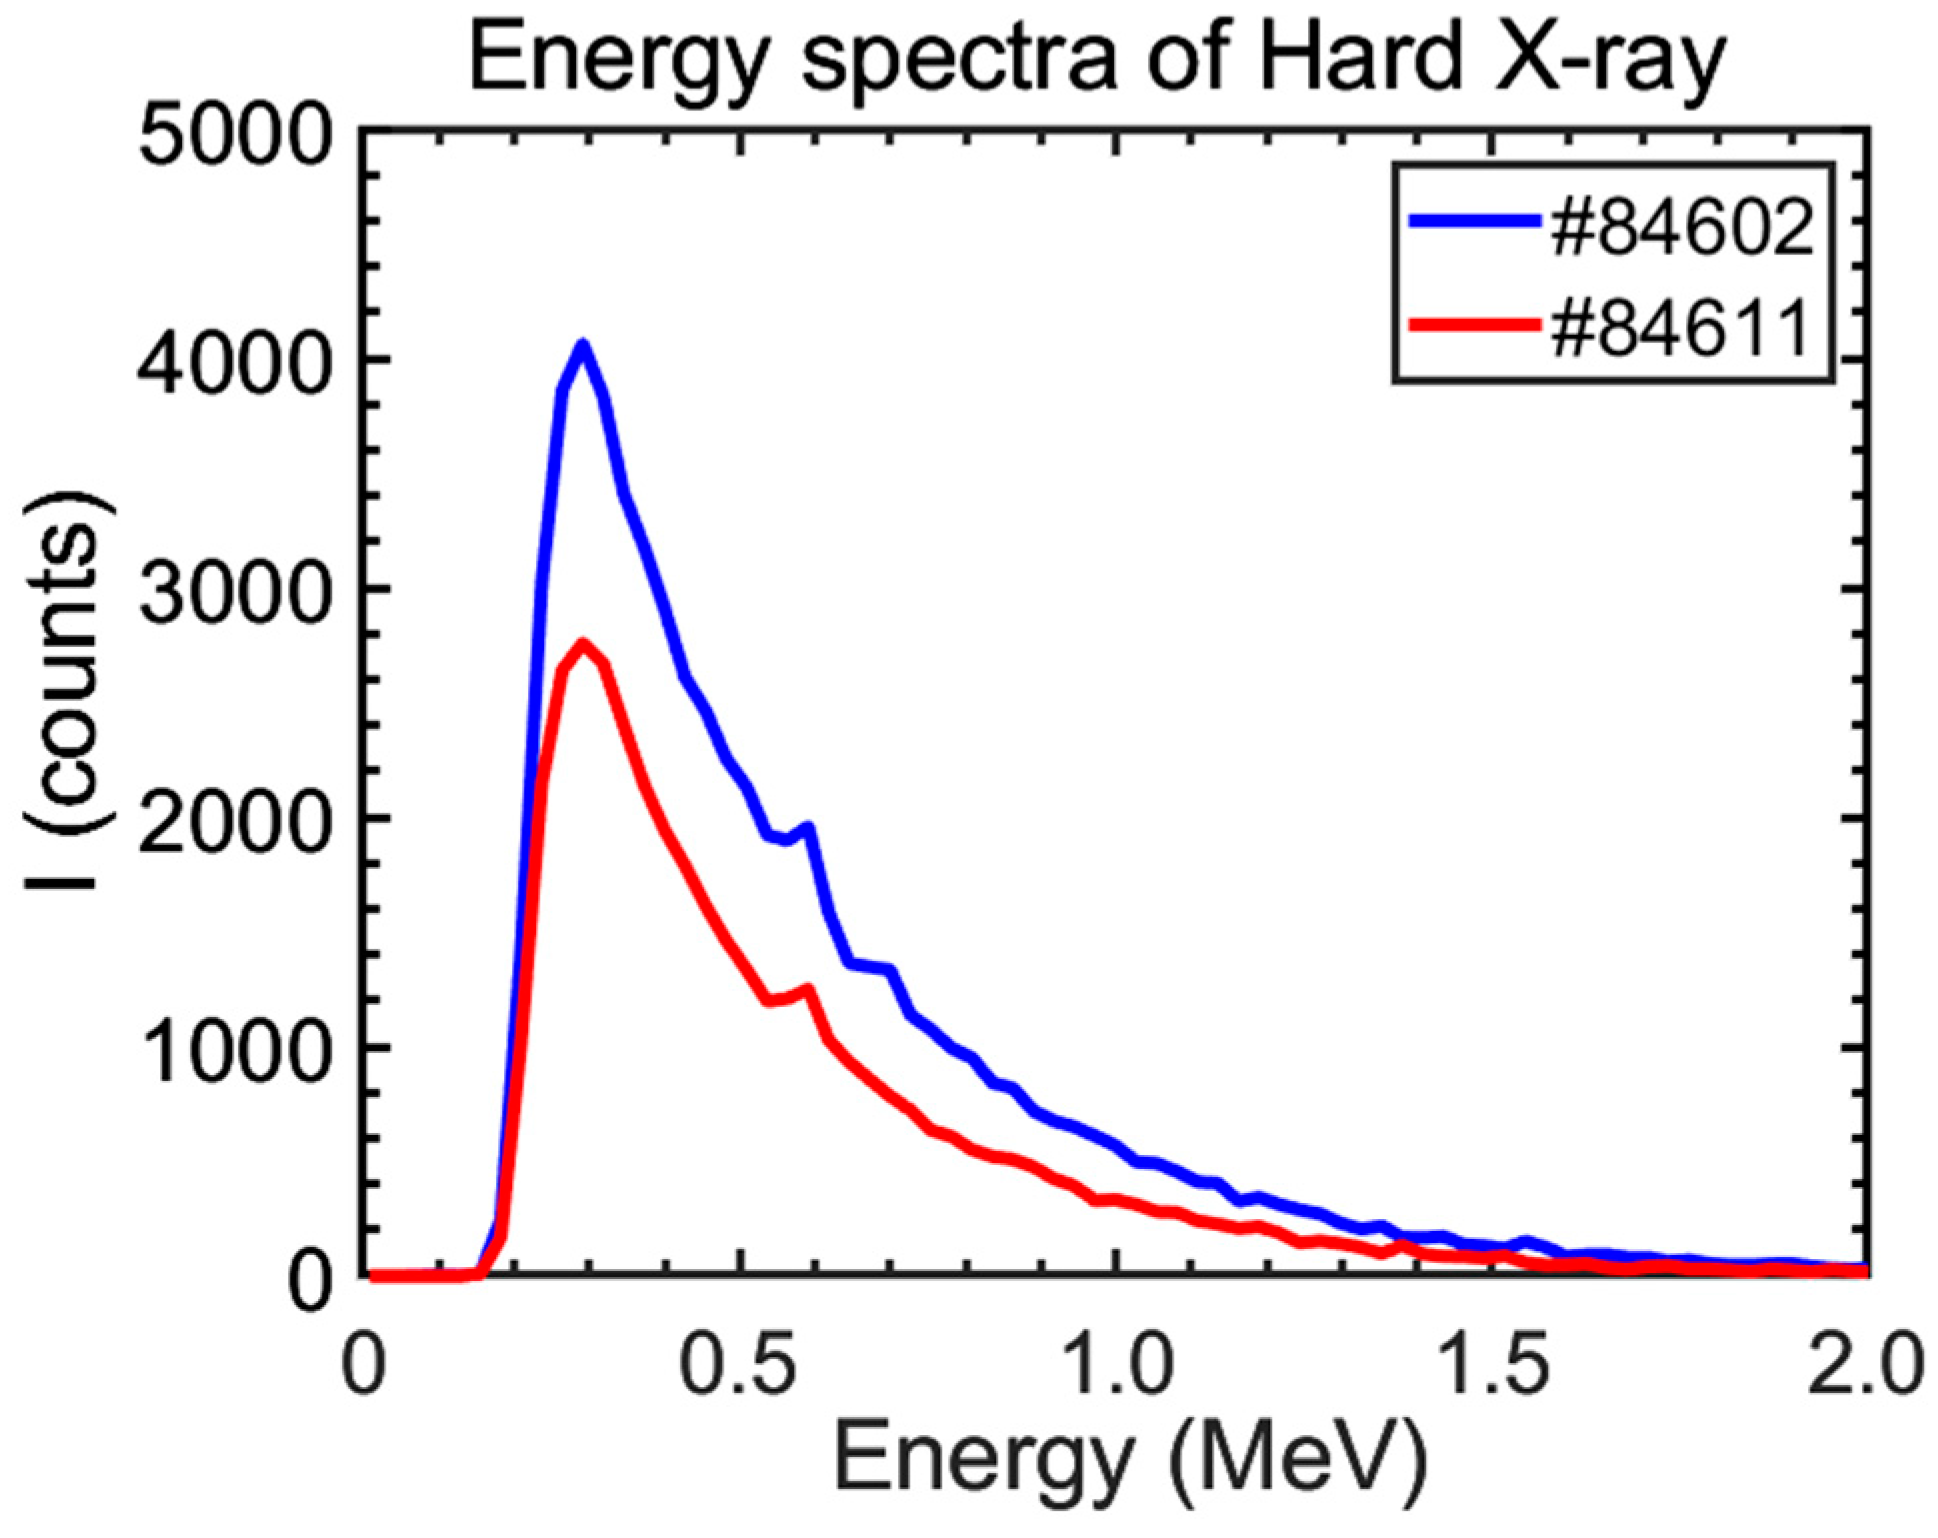
4.2. Suppression of Runaway Electron

Figure 8 shows the time evolution of the runaway electron flux signal of two comparable discharges conducted before and after the lithium granule injection experiment in plasma recovery. The results indicate a significant decrease in the averaged runaway electron flux signal, with both the spike frequency and amplitude experiencing a dramatical reduction after the lithium granule injection.
The baseline of the runaway signal was extracted, and the averaged intensity during 3.0–6.0 s (at Ip platform) was calculated to obtain the shot-evolution of runaway electron flux signal, as shown in Figure 9. Note that the data of #84604, #84608, and #84610 are missing due to disruptions.
The energy spectra of runaway electrons at the Ip platform (t = 5.0 s) for #84602 and #84611 are plotted in Figure 10. The peak energy of runaway electrons was maintained at ~0.29 MeV. The intensity of the peak energy in #84611 decreased to 68% of the original level after the lithium granule injection, suggesting an effective suppression of runaway electron by the injection.

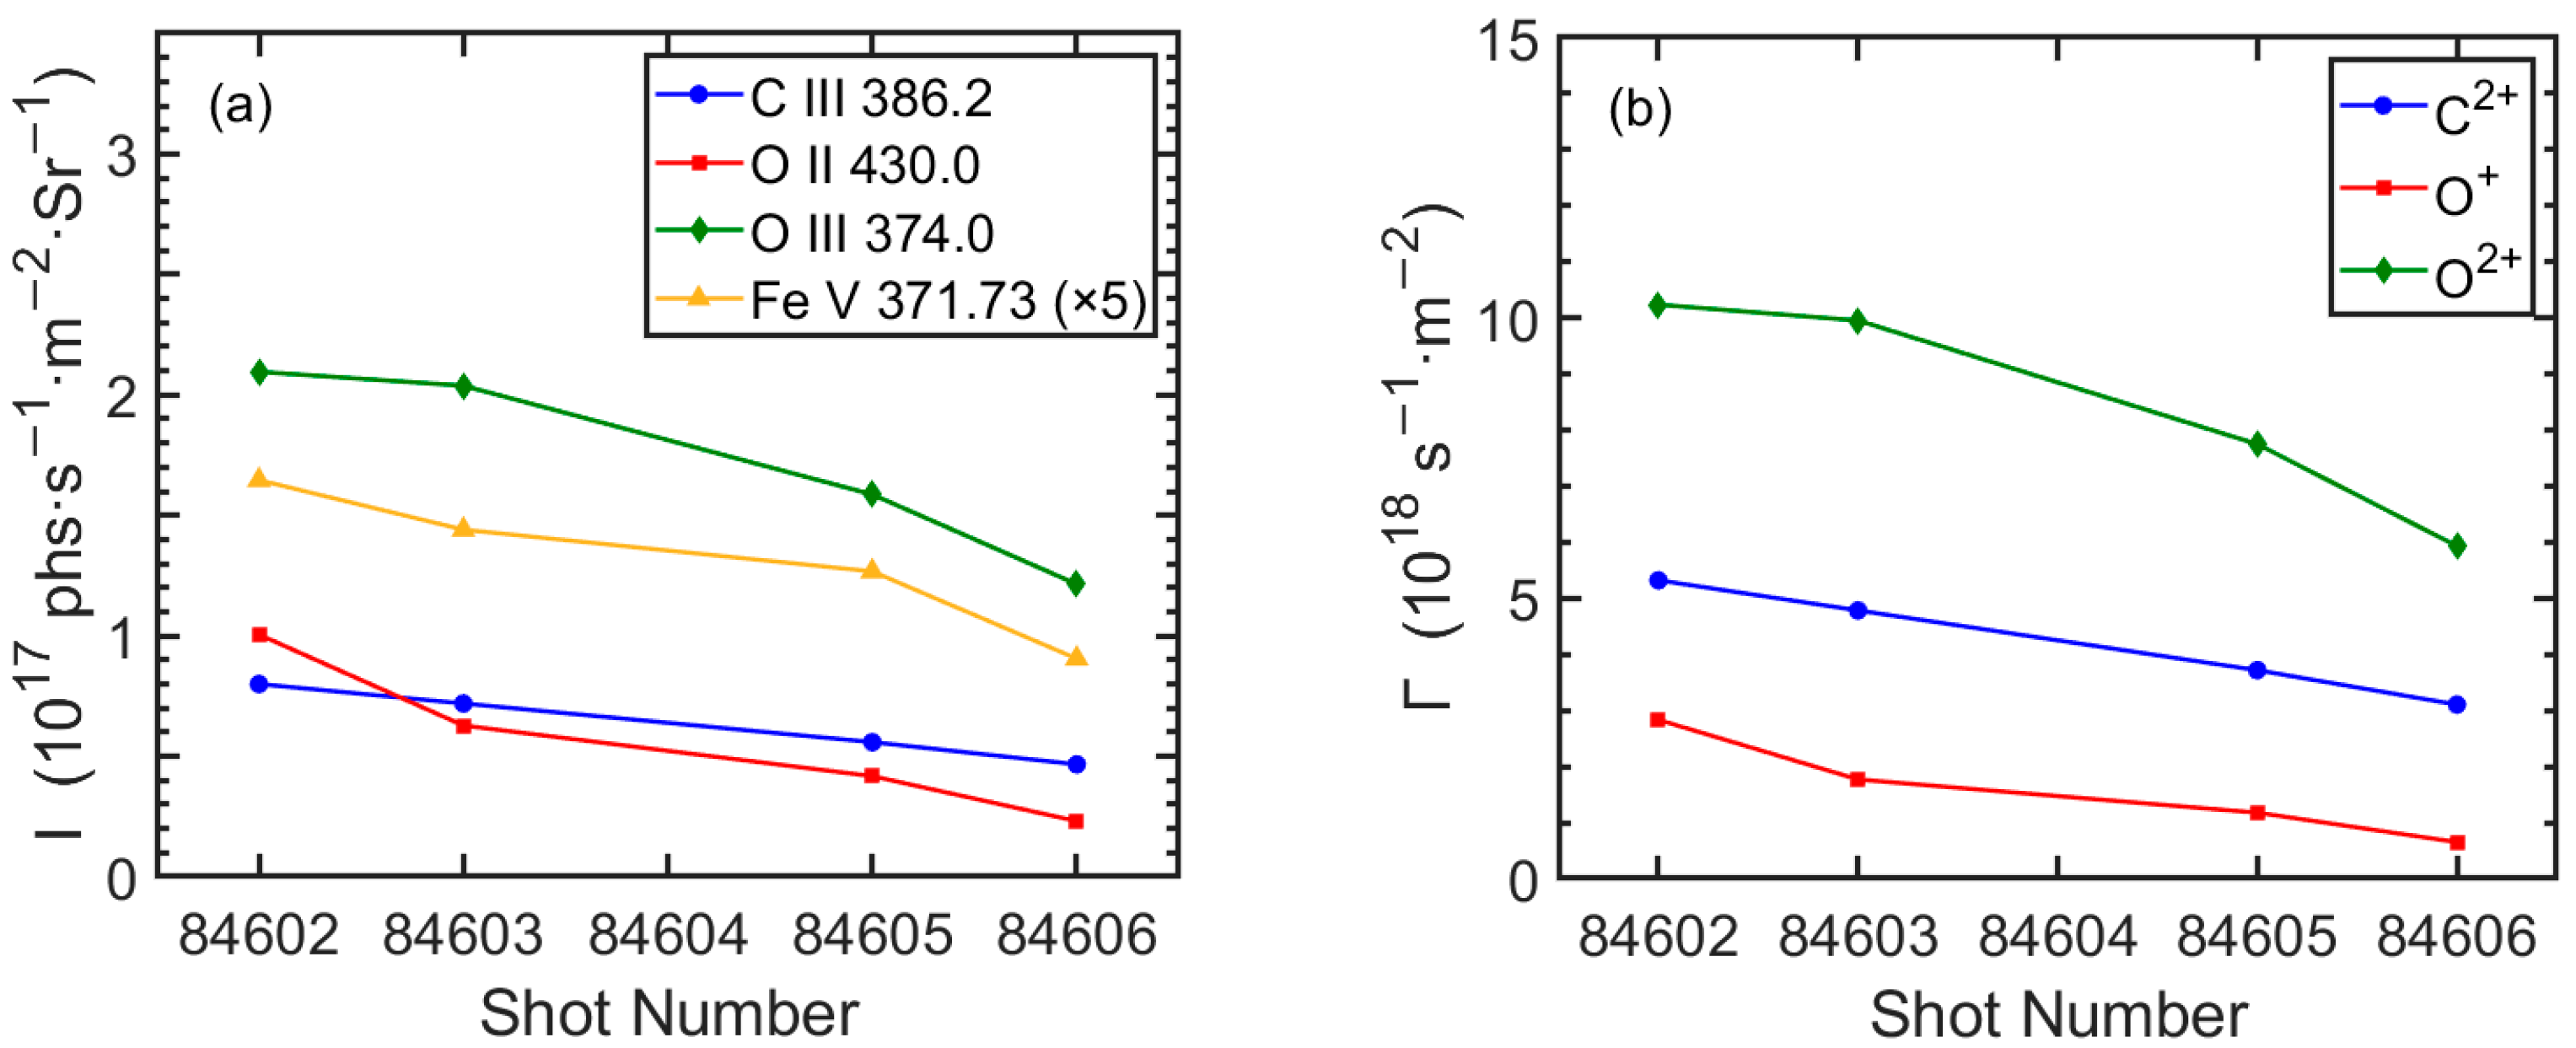
4.3. Suppression of Impurity Influx

Line intensities of C III 386.2 Å, O II 430.0 Å, O III 374.0 Å, and Fe V 371.73 Å at the Ip platform (t = 5.0 s) decreased gradually in several successive discharges with real-time lithium granule injection, as illustrated in Figure 11a. The particle influx of C2+ (blue), O+ (red), and O2+ (green) were calculated from line intensity through:
Γ = 4 π I 0 h ν S XB
with S/XB (Ionization per photon coefficients, where S denotes the ionization coefficient, X denotes the excited coefficient for electron collision, and B denotes the branching ratio) of 5.29, 2.24, and 3.89 for the three lines at Te = 47.9 eV, 35.1 eV, and 54.9 eV and ne = 5 × 10¹⁸ m3 were used, respectively. It can be observed in Figure 11b that Γ(C2+), Γ(O+), and Γ(O2+) decreased continually from 5.32 × 10¹⁸, 2.83 × 10¹⁸, and 10.24 × 10¹⁸ s1m2 to 3.10 × 10¹⁸, 0.65 × 10¹⁸, and 5.93 × 10¹⁸ s1m2 in the runaway plasma, respectively. This was probably due to the lithium film formed on the first wall, which absorbed the oxygen and water and weakened the plasma–wall interaction.

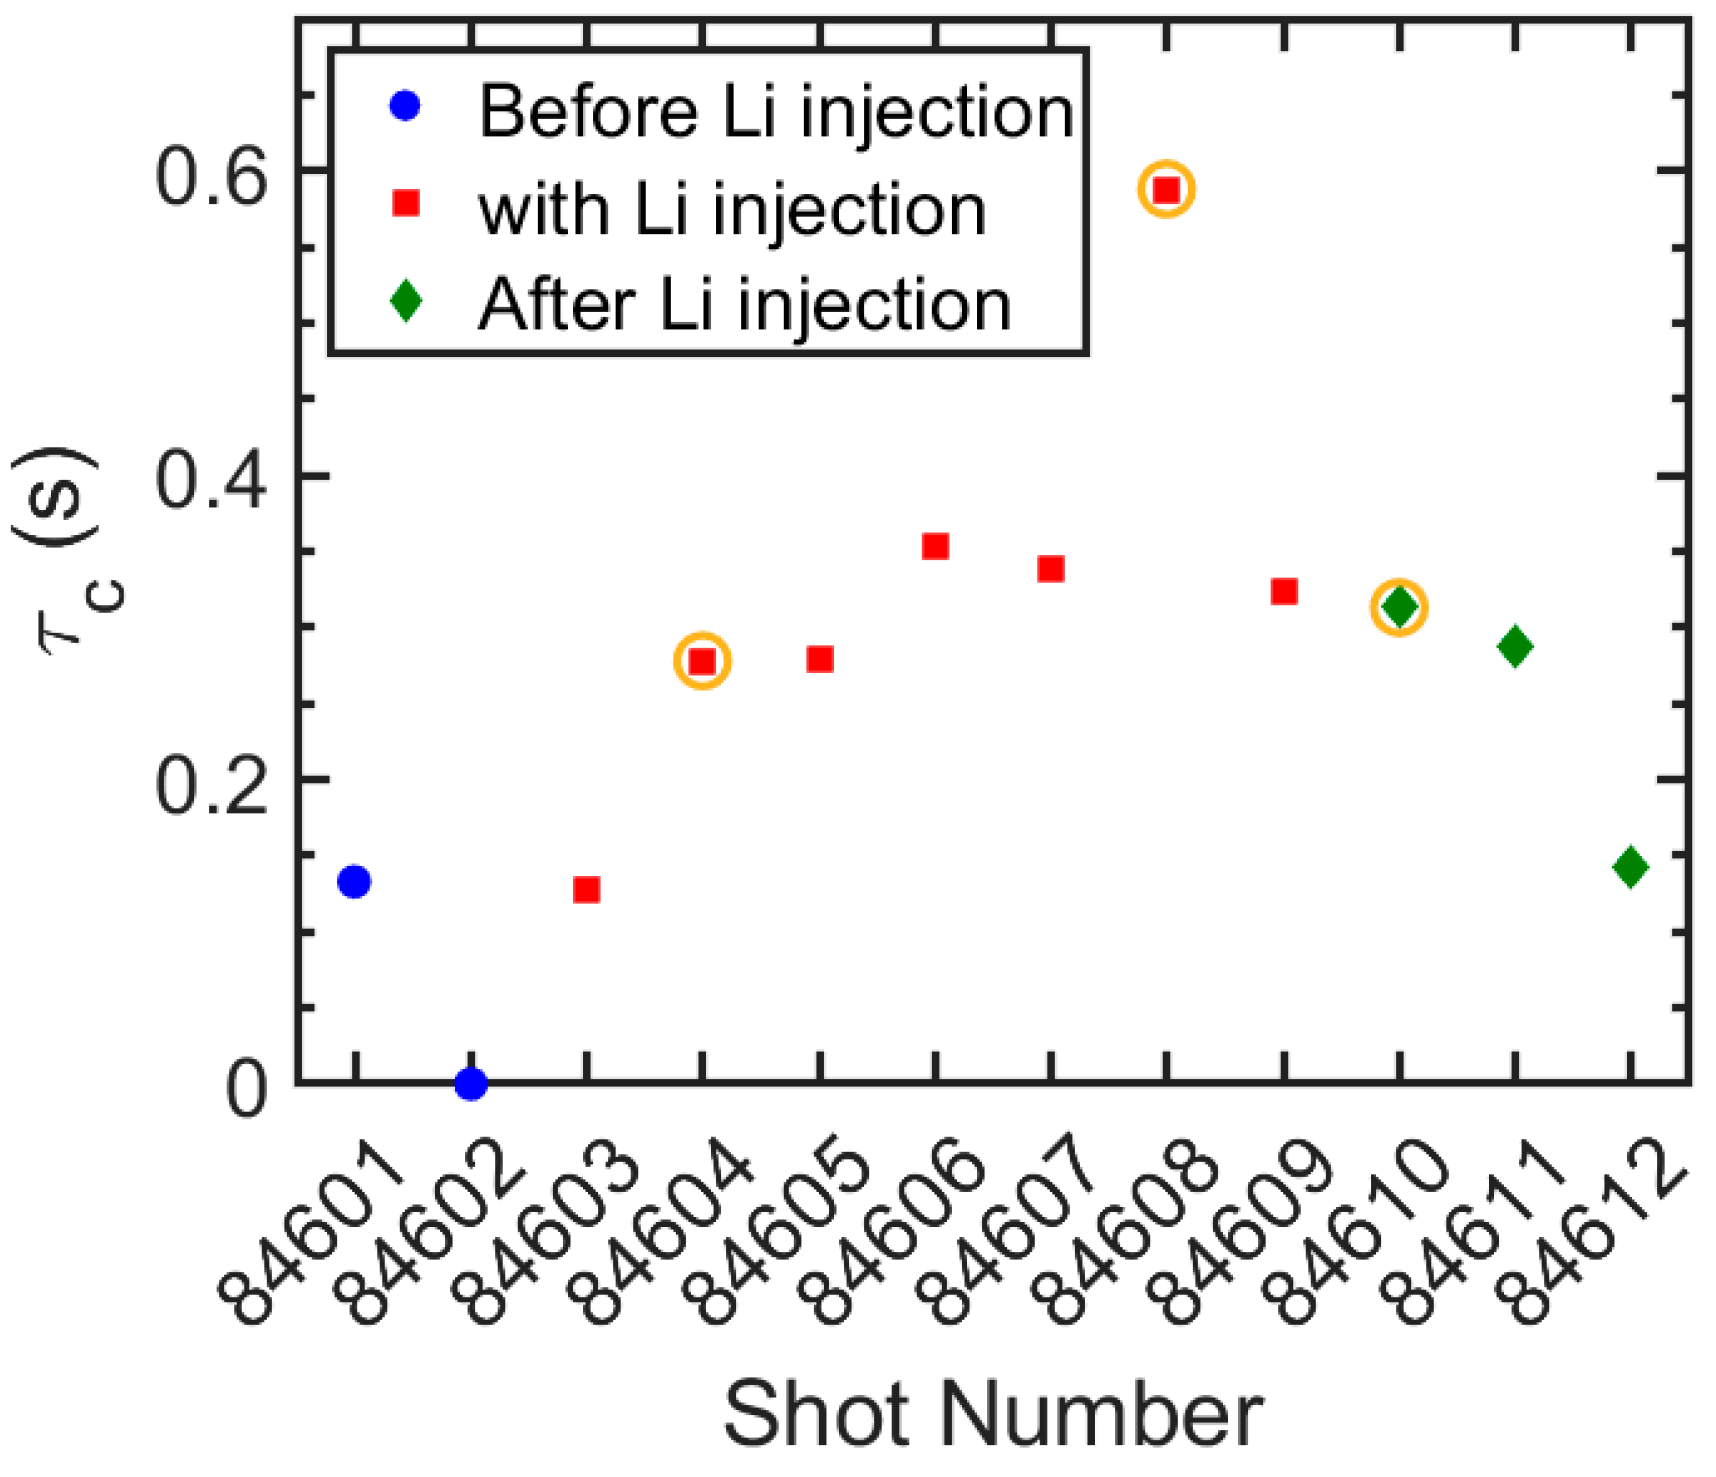
4.4. Extension of Lifetime of Collisional Plasma

The lifetime of the collisional plasma, τc, in discharges of #84601–#84612 was derived from the duration of impurity lines from highly ionized oxygen and carbon, as plotted in Figure 12. It is observed that the τc can be extended up to 0.6 s, indicating that the lithium injection has an effective role in enhancing the plasma performance. On the other hand, the τc in discharges #84605, #84609, and #84611 could not be further extended due to disruptions in their previous discharge, which indicates a degradation effect on plasma recovery. After the real-time lithium granule injection experiment, τc in #84612 returned to the previous level. With the combination of routine lithium coating and long-time GDC after #84612, the plasma eventually recovered.

5. Summary and Discussion

In the plasma of a superconducting tokamak after a vacuum failure, during the Ip ramp-up phase of recovery discharge, energetic electrons can be easily further accelerated and turn into runaway electrons, leading to frequent occurrence of runaway discharges or disruptions. Several wall conditioning techniques are then required to remove residual impurity gas and water on the wall and suppress the energetic runaway electrons.
In this paper, the impurity behavior in plasma recovery of EAST after a vacuum failure was studied using two EUV spectrometers with a fast-time-response of 5 ms/frame. The study revealed that during the recovery discharges, oxygen and carbon content was dozens of times higher than normal discharges, probably causing high Vloop and plasma runaway. The lifetime of highly ionized impurity ions of C5+ and O6+ was used to deduce the lifetime of sustained collisional plasma. Meanwhile, the EUV spectra showed that O2+–O6+ lines and O2+–O3+ lines dominated the spectra in the collisional plasma and the runaway status, respectively, from which the electron temperature of less than 75 eV was preliminarily evaluated for the runaway status in the discharge. Unfortunately, the metal impurities of Fe and Mo were found in both plasma statuses of the recovery discharges.
Real-time injection of a small amount of lithium granule in successive discharges effectively suppressed the runaway electrons and their impingement frequency on the inner wall. Meanwhile, plasma–wall interaction may be weakened by a gradually formed thin lithium film, leading to reduced impurity influx of oxygen and carbon. As a result, the lifetime of collisional plasma was extended.
Disruptions of tokamak plasma can lead to high thermal loads on the first wall, introduce impurities into the vacuum chamber, and make it challenging to re-establish normal collisional plasma in subsequent discharges. Although lithium injection has a positive effect on impurity control and plasma recovery, the coating of lithium has several drawbacks and is not likely to be applied in fusion reactors. The role of boron pellet injection into the plasma is currently being investigated in EAST experiments. The research of plasma recovery of EAST provides an important reference for establishing the first plasma in future superconducting fusion devices such as ITER and CFETR.

Author Contributions

Conceptualization, L.Z. and Z.Z.; methodology, L.Z.; software, Y.C. (Yunxin Cheng); validation, R.Z. and A.T.; formal analysis, Z.Z. and L.Z.; investigation, L.Z. and W.Z. (Wenmin Zhang); resources, A.H., Z.S., G.Z. and H.L.; data curation, F.Z., W.Z. (Weikuan Zhao), Z.L. and Y.C. (Yiming Cao); writing—original draft preparation, Z.Z.; writing—review and editing, L.Z., S.M. and Y.Y.; visualization, Z.Z.; supervision, L.Z.; project administration, L.Z.; funding acquisition, L.Z. and Y.Y. All authors have read and agreed to the published version of the manuscript.

Funding

This work is supported by the National Magnetic Confined Fusion (MCF) Energy Research & Development Program (No. 2022YFE03180400), National Natural Science Foundation of China (Grant Nos. 11704076, 11911530229, U1732140, 2021AMF01002, 1916321TS00103201), the National Key Research & Development Project (No. 2020YFB1902100), the Youth Innovation Promotion Association of Chinese Academy of Sciences (Grant No. 2021445) and Chinese Academy of Sciences President’s International Fellowship Initiative (PIFI) (No. 2020VMA0001).

Institutional Review Board Statement

Not applicable.

Informed Consent Statement

Not applicable.

Data Availability Statement

The data presented in this study are available on request from the corresponding author.

Conflicts of Interest

The authors declare no conflict of interest.

References

  1. Winkel, T.; Orchard, J. Leak evaluation in JET and its consequences for future fusion machines. Vacuum 1990, 41, 1988–1991. [Google Scholar] [CrossRef]
  2. Hu, J.S.; Li, J.G. Plasma recovery after various events in HT-7 superconducting tokamak. Fusion Eng. Des. 2008, 83, 689–694. [Google Scholar] [CrossRef]
  3. Saibene, G.; Rossi, A.; Monk, R.D.; Orchard, J.; Andrew, P.; Barnsley, R.; Cushing, D.; Coad, P.J.; Davies, S.; Erents, K.; et al. Review of vacuum vessel conditioning procedures at JET and their impact on plasma operation. J. Nucl. Mater. 1995, 220–222, 617–622. [Google Scholar] [CrossRef]
  4. Peacock, A.T.; Coad, J.P.; Dietz, K.J.; Israel, G.; Jensen, H.S.; Pick, M.A.; Saibene, G.; Bergsaker, H. Operational experience with the JET beryllium evaporators. In Proceedings of the 16th Symposium on Fusion Technology, London, UK, 3–7 September 1990; pp. 468–472. [Google Scholar]
  5. Gauthier, E.; Cal, E.d.L.; Beaumont, B.; Becoulet, A.; Gil, C.; Grisolia, C.; Grosman, A.; Hutter, T.; Kuus, H.; Ladurelle, L.; et al. Wall conditioning technique development in Tore Supra with permanent magnetic field by ICRF wave injection. J. Nucl. Mater. 1997, 241–243, 553–558. [Google Scholar] [CrossRef]
  6. Wang, J.R.; Hu, J.S.; Yu, Y.W.; Cao, B. Recovery of vacuum condition and plasma performance after vessel vent in EAST tokamak. Vacuum 2021, 183, 109854. [Google Scholar] [CrossRef]
  7. Zhou, R.J.; Hu, L.Q.; Li, E.Z.; Xu, M.; Zhong, G.Q.; Xu, L.Q.; Lin, S.Y.; Zhang, J.Z. Investigation of ring-like runaway electron beams in the EAST tokamak. Plasma Phys. Control. Fusion 2013, 55, 055006. [Google Scholar] [CrossRef]
  8. Wauters, T.; Stange, T.; Laqua, H.P.; Brakel, R.; Marsen, S.; Moseev, D.; Pedersen, T.S.; Volzke, O.; Brezinsek, S.; Dinklage, A. Wall Conditioning by ECRH and GDC at the Wendelstein 7-X stellarator. In Proceedings of the 43rd EPS Conference on Plasma Physics, Leuven, Belgium, 4–8 July 2016; p. 4.047. [Google Scholar]
  9. Yu, Y.W.; Hu, J.S.; Zuo, G.Z.; Sun, Z.; Wang, L.; Xu, W.; Wang, J.R.; Cao, B.; Gao, W.; Xu, J.C.; et al. Control of hydrogen content and fuel recycling for long pulse high performance plasma operation in EAST. Nucl. Fusion 2019, 59, 126036. [Google Scholar] [CrossRef]
  10. Sun, Z.; Hu, J.S.; Zuo, G.Z.; Ren, J.; Cao, B.; Li, J.G.; Mansfield, D.K. Influence of lithium coatings with large-area coverage on EAST plasma performance. Fusion Eng. Des. 2014, 89, 2886–2893. [Google Scholar] [CrossRef]
  11. Vershkov, V.A.; Sarychev, D.V.; Notkin, G.E.; Shelukhin, D.A.; Buldakov, M.A.; Dnestrovskij, Y.N.; Grashin, S.A.; Kirneva, N.A.; Krupin, V.A.; Klyuchnikov, L.A.; et al. Review of recent experiments on the T-10 tokamak with all metal wall. Nucl. Fusion 2017, 57, 102017. [Google Scholar] [CrossRef]
  12. Gray, T.K.; Canik, J.M.; Maingi, R.; McLean, A.G.; Ahn, J.W.; Jaworkski, M.A.; Kaita, R.; Ono, M.; Paul, S.F. The effects of increasing lithium deposition on the power exhaust channel in NSTX. Nucl. Fusion 2014, 54, 023001. [Google Scholar] [CrossRef]
  13. Osborne, T.H.; Jackson, G.L.; Yan, Z.; Maingi, R.; Mansfield, D.K.; Grierson, B.A.; Chrobak, C.P.; McLean, A.G.; Allen, S.L.; Battaglia, D.J.; et al. Enhanced H-mode pedestals with lithium injection in DIII-D. Nucl. Fusion 2015, 55, 063018. [Google Scholar] [CrossRef]
  14. Guo, H.Y.; Li, J.; Wan, B.N.; Gong, X.Z.; Liang, Y.F.; Xu, G.S.; Zhang, X.D.; Ding, S.Y.; Gan, K.F.; Hu, J.S.; et al. Recent advances in long-pulse high-confinement plasma operations in Experimental Advanced Superconducting Tokamak. Phys. Plasmas 2014, 21, 056107. [Google Scholar] [CrossRef] [Green Version]
  15. Wu, S.T. An overview of the EAST project. Fusion Eng. Des. 2007, 82, 463–471. [Google Scholar] [CrossRef]
  16. Yao, D.M.; Luo, G.N.; Du, S.J.; Cao, L.; Zhou, Z.B.; Xu, T.J.; Ji, X.; Liu, C.L.; Liang, C.; Li, Q.; et al. Overview of the EAST in-vessel components upgrade. Fusion Eng. Des. 2015, 98–99, 1692–1695. [Google Scholar] [CrossRef]
  17. Xu, Z.; Zhang, L.; Cheng, Y.X.; Morita, S.; Li, L.; Zhang, W.M.; Zhang, F.L.; Zhao, Z.H.; Zhou, T.F.; Wu, Z.W.; et al. An extreme ultraviolet spectrometer working at 10–130 Å for tungsten spectra observation with high spectral resolution and fast-time response in Experimental Advanced Superconducting Tokamak. Nucl. Instrum. Methods Phys. Res. Sect. A 2021, 1010, 165545. [Google Scholar] [CrossRef]
  18. Zhang, L.; Morita, S.; Xu, Z.; Wu, Z.; Zhang, P.; Wu, C.; Gao, W.; Ohishi, T.; Goto, M.; Shen, J.; et al. A fast-time-response extreme ultraviolet spectrometer for measurement of impurity line emissions in the Experimental Advanced Superconducting Tokamak. Rev. Sci. Instrum. 2015, 86, 123509. [Google Scholar] [CrossRef]
  19. Li, L.; Zhang, L.; Xu, Z.; Morita, S.; Cheng, Y.X.; Zhang, F.L.; Zhang, W.M.; Duan, Y.M.; Zang, Q.; Wang, S.X.; et al. Line identification of extreme ultraviolet (EUV) spectra from low-Z impurity ions in EAST tokamak plasmas. Plasma Sci. Technol. 2021, 23, 075102. [Google Scholar] [CrossRef]
  20. Zhang, W.M.; Zhang, L.; Cheng, Y.X.; Morita, S.; Wang, Z.X.; Hu, A.L.; Zhang, F.L.; Duan, Y.M.; Zhou, T.F.; Wang, S.X.; et al. Line identification of extreme ultraviolet (EUV) spectra from iron, copper and molybdenum ions in EAST tokamak. Phys. Scr. 2022, 97, 045604. [Google Scholar] [CrossRef]
  21. Liu, H.Q.; Jie, Y.X.; Ding, W.X.; Brower, D.L.; Zou, Z.Y.; Qian, J.P.; Li, W.M.; Yang, Y.; Zeng, L.; Zhang, S.B.; et al. Internal magnetic field measurements by laser-based POlarimeter-INTerferometer (POINT) system on EAST. J. Instrum. 2016, 11, C01049. [Google Scholar] [CrossRef]
  22. Han, X.; Liu, X.; Liu, Y.; Domier, C.W.; Luhmann, N.C.; Li, E.Z.; Hu, L.Q.; Gao, X. Design and characterization of a 32-channel heterodyne radiometer for electron cyclotron emission measurements on experimental advanced superconducting tokamak. Rev. Sci. Instrum. 2014, 85, 073506. [Google Scholar] [CrossRef]
  23. Lu, H.W.; Hu, L.Q.; Chen, Z.Y.; Jang, Y.; Lin, S.Y. Observation of runaway electrons in the first EAST ohmic discharge. J. Plasma Phys. 2008, 74, 445–453. [Google Scholar] [CrossRef]
  24. Lu, H.W.; Hu, L.Q.; Lin, S.Y.; Wang, S.F.; Zhong, G.Q. Runaway Electron Measurements in the EAST Tokamak. Contrib. Plasma Phys. 2010, 50, 141–145. [Google Scholar] [CrossRef]
Figure 1. Top view of optical layout of (a) EUV_ Short and (b) EUV_Long spectrometer.
Applsci 13 04338 g001
Figure 2. EAST poloidal cross-section, lines of sight of EUV spectrometers (EUV_Short: red line and EUV_Long: blue line) and position of ECE measurement (purple points, HRS01–HRS32), channels of 01–32 are from low field side (LFS) to high field side (HFS). The red rectangles indicate the cross section of magnetic coils.
Applsci 13 04338 g002
Figure 3. Time-evolution of (a) plasma current, Ip, (b) line averaged electron density, ne, (c) loop voltage, Vloop, (d) total injection power of low hybrid wave (LHW), (e) line intensity of Dα, (f) line intensity of O VII (O6+) at 21.6 Å, (g) intensity of electron cyclotron emission (ECE) of HRS01, (h) runaway electron flux signal in recovery discharge #84601 (red lines) and normal discharge #84649 (blue lines). Vertical gray lines in (g,h) indicate the timings of corresponding jumps and spikes in ECE and Runaway signal, respectively.
Applsci 13 04338 g003
Figure 4. Image frames recorded by high-speed CCD camera at (a,c) t = 0.08 s, and (b,d) t = 5.0 s in normal discharge (#84649) and recovery discharge (#84601), respectively.
Applsci 13 04338 g004
Figure 5. EUV spectra comparison during Ip ramp-up phase (t = 0.08 s) of recovery (red lines) and normal (blue lines) discharges. (a) 8–65 Å, (b) 65–190 Å, (c) 190–320 Å, and (d) 320–495 Å.
Applsci 13 04338 g005
Figure 6. EUV spectra comparison during Ip platform phase (t = 5.0 s) in recovery (red lines) and normal (blue lines) discharges. (a) 8–65 Å, (b) 65–190 Å, (c) 190–320 Å, and (d) 320–495 Å. Spike noise are indicated with red arrows.
Applsci 13 04338 g006
Figure 7. Time traces of spectral lines intensity with lithium granule injection (#84607, recovery discharge). (a) Li II 199.28 Å, He II 303.78 Å, O III 374.0 Å, and C IV 312.4 Å, (b) O IV 238.57 Å, O V 215.245 Å, and O VI 184.117 Å, (c) C V 40.268 Å, O VII 21.6 Å, C VI 33.734 Å, and O VIII 18.97 Å, (d) runaway electrons and ECE signal. Lithium granule entered plasma at t = 3.6 s in this discharge.
Applsci 13 04338 g007
Figure 8. Time evolution of runaway electron flux signal in two discharges before (#84602, blue line) and after (#84611, red line) lithium granule injection.
Applsci 13 04338 g008
Figure 9. The averaged runaway electron flux signal during t = 3.0–6.0 s change in the discharges during lithium granule injection (#84602–#84611).
Applsci 13 04338 g009
Figure 10. Energy spectra of runaway electron at Ip platform before (#84602, blue line) and after (#84611, red line) lithium granule injection.
Applsci 13 04338 g010
Figure 11. (a) Intensity of impurity lines of C III 386.2 Å (blue), O II 430.0 Å (red), O III 374.0 Å (green), and Fe V 371.73 Å (orange) and (b) particle influx of C2+ (blue), O+ (red), and O2+ (green) at Ip platform phase (t = 5.0 s) changes in several successive discharges with real-time lithium granule injection, in which the particle influxes are calculated from line intensity of and the S/XB data at certain Te and ne, respectively.
Applsci 13 04338 g011
Figure 12. Lifetime of confined plasma during lithium granule injection (#84601–#84612). The orange circles indicate the discharges in which an early disruption occurred.
Applsci 13 04338 g012
Table 1. Plasma parameters at initial phase (t1 = 0.08 s) and current platform (t2 = 5.0 s) and wavelength interval of the spectrometers in recovery and normal discharges.
StatusShot No.Ip (kA)
t1/t2
ne (1019 m−3)
t1/t2
<λ> (Å)
Recovery#8460150/3000.3/2.28–65
320–495
#8459950/3000.3/2.365–190
#8460050/3500.3/3.4190–320
Normal#8464970/4500.1/4.38–65
320–495
#8467870/4000.2/2.165–190
#8512670/5000.1/3.3190–320
Table 2. Plasma parameters of Ip ramp-up phase (t1 = 0.08 s) and Ip platform phase (t2 = 5.0 s) during lithium granule injection.
Shot Num.Ip (kA)
(t1/t2)
ne (1019 m−3)
(t1/t2)
Vloop (V)
(t2)
Accumulation of Li Amount (mg) (t2)
8460252/3000.2/2.20.7780
8460354/3000.2/2.30.694~18
8460553/3000.2/2.70.690~100
8460655/3000.2/3.10.691~226
8460756/3000.3/2.60.671~286
8460955/3000.2/2.50.684~379
8461156/3000.2/2.30.628~428
Disclaimer/Publisher’s Note: The statements, opinions and data contained in all publications are solely those of the individual author(s) and contributor(s) and not of MDPI and/or the editor(s). MDPI and/or the editor(s) disclaim responsibility for any injury to people or property resulting from any ideas, methods, instructions or products referred to in the content.

