1. Introduction
Deep Learning (DL) algorithms in Autonomous Vehicles (AV) have evolved in recent years, with works such as [
1,
2] providing important developments in the field. In particular, 2D-based camera object detection has received a lot of attention due to the accurate performance achieved by models such as YOLO [
3]. One of the reasons behind the performance of object detection models is the presence of large-scale labeled datasets such as COCO [
4] with more than 220,000 labeled images of a total of 330,000 with 1.5 M object instances, 80 object categories and 91 ’stuff’ categories.
However, 3D sensors, such as light detection and ranging (LiDAR), have attracted the interest of researchers, but due to the lack of labeled data, 3D-based object detection models have not yet reached the same performance as 2D-based ones, such as YOLO which can process 45 frames per second in its original version and 155 frames per second in a FAST YOLO version in real-time systems using 2D cameras [
3]. One of the leading datasets for 3D vehicle detection is KITTI [
5], but its main weakness is its relatively small size, which contains around 15.000 images, which cannot be enough to train certain DL models. Recently, another 3D-labeled perception dataset has been published as WAYMO [
6], with 2030 video segments yielding a total of 390k frames. Because many frames correspond to the same vehicle in the same video, the WAYMO dataset lacks in variability. In addition, both datasets have been developed in a very similar way, using images and point clouds taken from a vehicle with multiple sensors. This point of view, in addition to being the most used in AV systems, is relatively specific and cannot be used in other tasks that need different angles of vision.
DL models need large volumes of data for good performance [
7] and the availability of the data can be a critical factor in the results of DL algorithms. The datasets mentioned above have been labeled with much less information than the 2D-based ones and have also been presented with a fixed point of view. However, researchers have routinely selected both datasets due to the cost involved in annotating new 3D labels. The challenges facing the AV industry are widely different with different set-ups and configurations of the sensors, e.g., using cameras and LiDAR placed in the middle of a roundabout or on a bridge or a gantry that points over the road. As these datasets are not enough for new scenarios and the tedious and costly work that has to be done to traditionally build new datasets, a new approach, auto-labeled datasets, has to be adopted.
Instead of manually labeling 2D data, commercial tools or works based on Convolutional Neural Networks (CNNs) have been proposed to generate auto-labeled datasets [
8,
9,
10]. As CNNs achieves contrasting results in 2D object detection, one of the main ideas that has been proposed is to auto-label datasets. There are works such as [
8,
11] in which LiDAR point clouds are projected on the input images, obtaining the object bounding box coordinates and the class as a 3D label as output, achieving 3D auto-generated labels. Despite the auto-labeling process in both works, the datasets have been developed with the same point of view as KITTI and WAYMO, so the bias in the datasets is still a problem. However, as far as we are concerned, it is worth researching whether there is a way to use the models present in the literature to generate datasets with a new approach.
Before diving into the idea of creating a novel methodology to generate different auto-labeled datasets, it has been proposed to use DL models to detect objects over images similarly to YOLO to generate new labels. In the KITTI dataset, the level of occlusion of an object is used to determine the difficulty of its classification; officially, KITTI proposes three different categories based on occlusion. The accuracy of the model is evaluated using the F-score metric, in which the values for the three difficulty categories are 0.957 for easy, 0.927 for moderate, and 0.740 for hard.
These new auto-generated labels are the ones proposed to train models with new scenarios. However, to conclude that the new labels work with new approaches, proven models have to be taken to analyze the performance using the new labels. Therefore, we have proposed to retrain the contrast models presented in the KITTI benchmark [
5,
12] such as [
13,
14,
15] to be retrain with the new autogenerated labels. The performance obtained, although lower than that achieved with manual taken labels, is still reliable, with a small drop in accuracy expected compared to that achieved with manually taken labels. So, manually taken labels can be replaced by auto-generated ones and the models can continue to perform well.
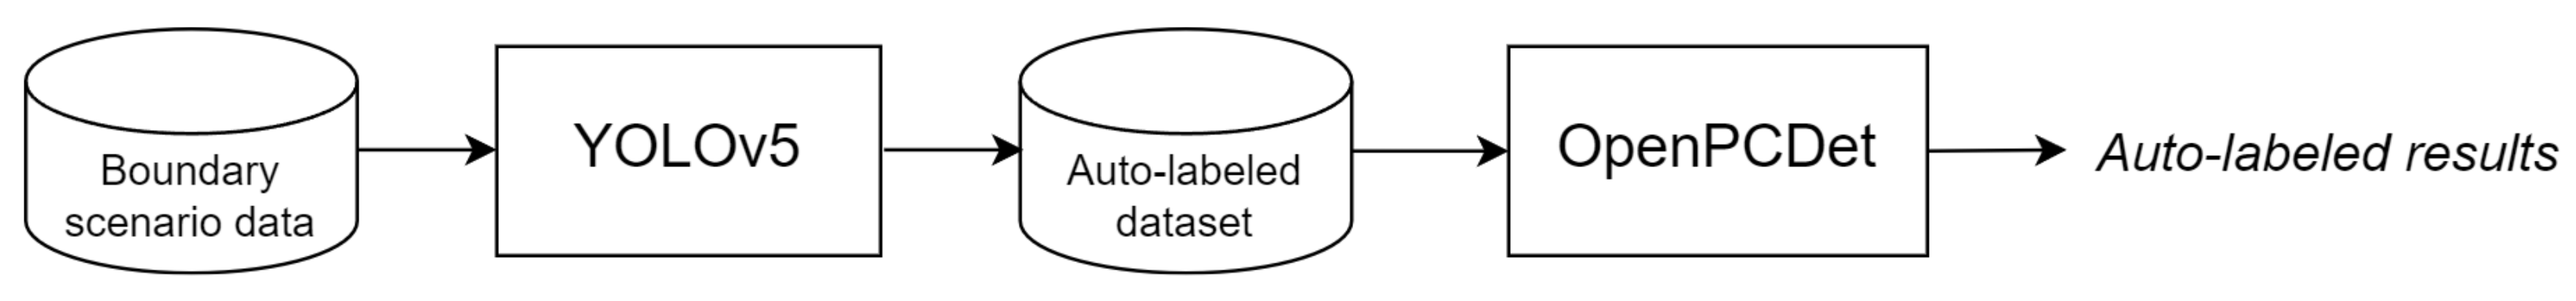
Due to the minor deviation obtained with the proposed models, the slightly reduced accuracy is balanced by the enormous amount of data that can be generated at low cost. Therefore, the main contribution of this work is a novel methodology proposed to generate new 3D based auto-labeled datasets from boundary conditions and it has been further demonstrated with the development of our own 3D auto-labeled dataset with the point of view of sensors located at an elevated point above an infrastructure, in our case, a bridge, a gantry or a panel over a highway.
One of the challenges facing researchers in the automotive field is to find datasets that fit a specific scenario. Traditionally, most of the work has been developed under the same conditions [
16,
17,
18], i.e., they usually consist of a vehicle with different sensors placed in similar positions such as on the roof of the vehicle or on the hood, generating datasets with the same viewpoint. The main problem associated with this is that it is not possible to use these data for applications with different perspectives, thus requiring further research. Therefore, models have been developed that can automatically generate labeled datasets, avoiding the tedious task of manually labeling new data each time a system is developed.
Although there are datasets that have been manually labeled as KITTI [
5], WAYMO [
6], or nuScenes [
19], the trend is evolving towards label automation. There are works such as [
20] in which an incomplete auto-labeling process is proposed. Annotators identify a bounding box in a LiDAR point cloud in a particular frame and then, using tracking techniques, automatically propagate it to the rest of the video frames. This technique does not completely reduce human workload, but it considerably increases the size of the labeled dataset at a low cost.
To achieve fully auto-labeled datasets, one of the types of models that can best handle this type of data is CNNs. There are several examples such as [
21], in which Generative Adversarial Network (GAN) networks based on CNNs are used to perform data augmentation on a labeled dataset generating new labeled images from scratch. One of the main limitations of this approach is that it cannot work with point clouds, making it impossible to use this approximation in LiDAR-based detection.
In [
8] the YOLO architecture is also used, in this case re-trained with the KITTI dataset. In [
9] a combination of complexYOLO [
22] with PointRCNN [
13] is proposed for the detection of objects in LiDAR data. The other approximation is followed in [
23] in which the Single Shot Detector (SSD) network is used to project the bounding box of a corresponding camera image onto the LiDAR point clouds. However, in spite of all the literature, there are already several applications that can handle the process of automatic label images, such as LabelBox, Image Labeler, RectLabel, etc.
Most of the previous auto-labeling models lack in their generalization, being only capable of work under certain circumstances, e.g., the point of view of a camera in the front of a car. Previous work such as [
24] used traditional computer vision techniques and LiDAR point clouds to auto-label new datasets with different camera angles. This research is focused on using transfer learning techniques on models trained with KITTI, to use these new models to auto-label new datasets using different camera angles.
Thus, the aim of this paper is to propose a novel methodology based on the YOLO network to generate auto-labeled point cloud images. This methodology could be used to generate large volumes of labeled data using YOLO as a label generator. On the one hand, this approximation is capable to enlarge the volumes of available data, but on the other hand our methodology can also be used to label datasets of different point-of-views, e.g., a camera placed on a bridge, a gantry or a panel over a highway.
The rest of the paper is structured as follows:
Section 2 explains the methodology of the current research, focusing on the datasets that have been used, the models in charge of the auto-labeling task and the validation framework.
Section 3 reviews the performance of the model under two different experiments: the first one analyses the differences between training using a manually labeled dataset against using an auto-labeled dataset using the proposed methodology, the second experiment covers the results of different models using a dataset with other point-of-view and the labels of our framework.
Section 4 gives an overview of the results and discusses limitations, relationships with other researches and future research. Finally,
Section 5 provides a summary of the results of the methodology and the performance of the model, analysing the results presented in previous sections.
2. Methodology
In this paper, we propose a framework capable of tackling the following two problems: generate 3D based auto-labeled datasets for AV tasks and verify the auto-labeling process by evaluating the performance of the datasets regardless of the point of view from which the sensors, such as cameras or LiDAR, are placed to generate the dataset.
To achieve our goal and propose a methodology, we first used the KITTI dataset as our base workbench, as it is a dataset used in multiple previous AV papers such as [
13,
14,
15] in which DL models applied to 3D object detection are presented on the point cloud generated by lasers. However, although the aforementioned works are recognized as the models that offer the best results with KITTI, in particular [
9,
10], these works use radar sensors as input to carry out the detection work. There are other classification works that allow vehicle detection through techniques such as object segmentation and using transfer learning techniques [
20,
25,
26]. Finally, other works, such as [
8,
21], try to implement data augmentation techniques through GAN models applied to point cloud datasets.
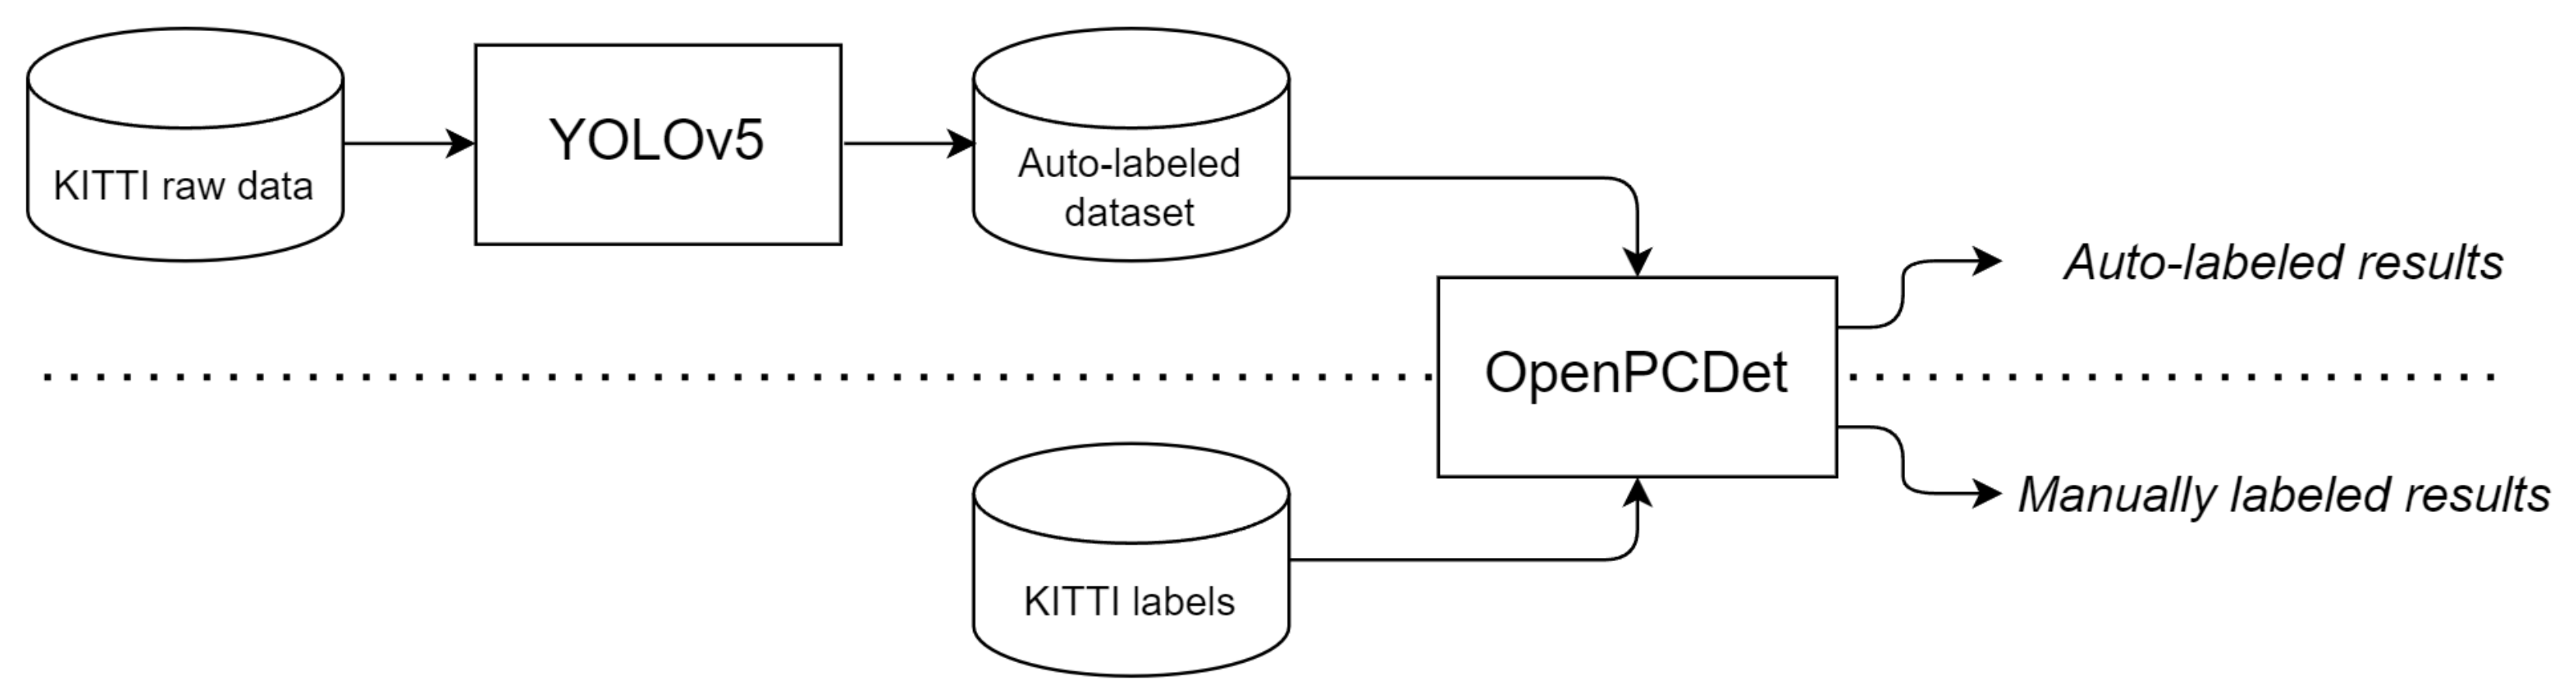
Furthermore, the KITTI dataset is published and can be publicly accessed. Thus, we will apply the 2D auto-labeling model to the raw KITTI dataset to project the bounding box of the images into point clouds, generating new automatic labels. Then the results of the auto-label dataset will be compared against the human KITTI annotated dataset. These results, measured with the F-Score, will show the difference between the human annotated labels and the auto-labels produced in our system.
Furthermore, we will compare the performance of Artificial Neural Network (ANN) models by training some models from OpenMMlab’s OpenPCDet open-source project [
27] with the new auto-labeled images. OpenPCDet is a general codebase for 3D object detection from point cloud and the way in which the models have been designed to work is by projecting the labels of the 2D images onto their corresponding 3D point cloud. In addition, these models have been shown to work effectively with KITTI and these will be used as a comparison for the performance of the models. In order to evaluate the performance of the proposed auto-label method, we will train the models mentioned from scratch with the new datasets. Moreover, as the main purpose is to demonstrate the good performance of the models with the auto-generated labels rather than to propose improvements such as a greater capacity to detect more vehicle classes, all tests have been performed only attending to the car class because it is sufficient to obtain clear results of the performance of the methodology.
Therefore, since the KITTI dataset is widely the most used in the field of AV object detection as it has been public since 2012 rather than Waymo, which has been available since 2020, KITTI will be used to develop a 3D auto-label methodology, which will then serve to label new datasets automatically. Thus, the presented framework demonstrates and tests an auto-labeling workflow using a well-documented dataset. This method, which demonstrates the possibility of exchanging annotator labels for auto-generated ones, can be applied to any dataset, including Waymo.
2.1. YOLO
The idea of auto-labeling the dataset has been proposed in some other works, such as [
8,
9]. It has been shown that CNNs works well for that purpose when it comes to 2D labeling: some of the most popular models used in traffic object detection are: SSD [
23], Yolo [
3] or ComplexYolo [
22]. In particular, for our purposes, we have selected the last YOLO release, YOLOv5, as its CNN backbone for automatic 2D labeling of KITTI data.
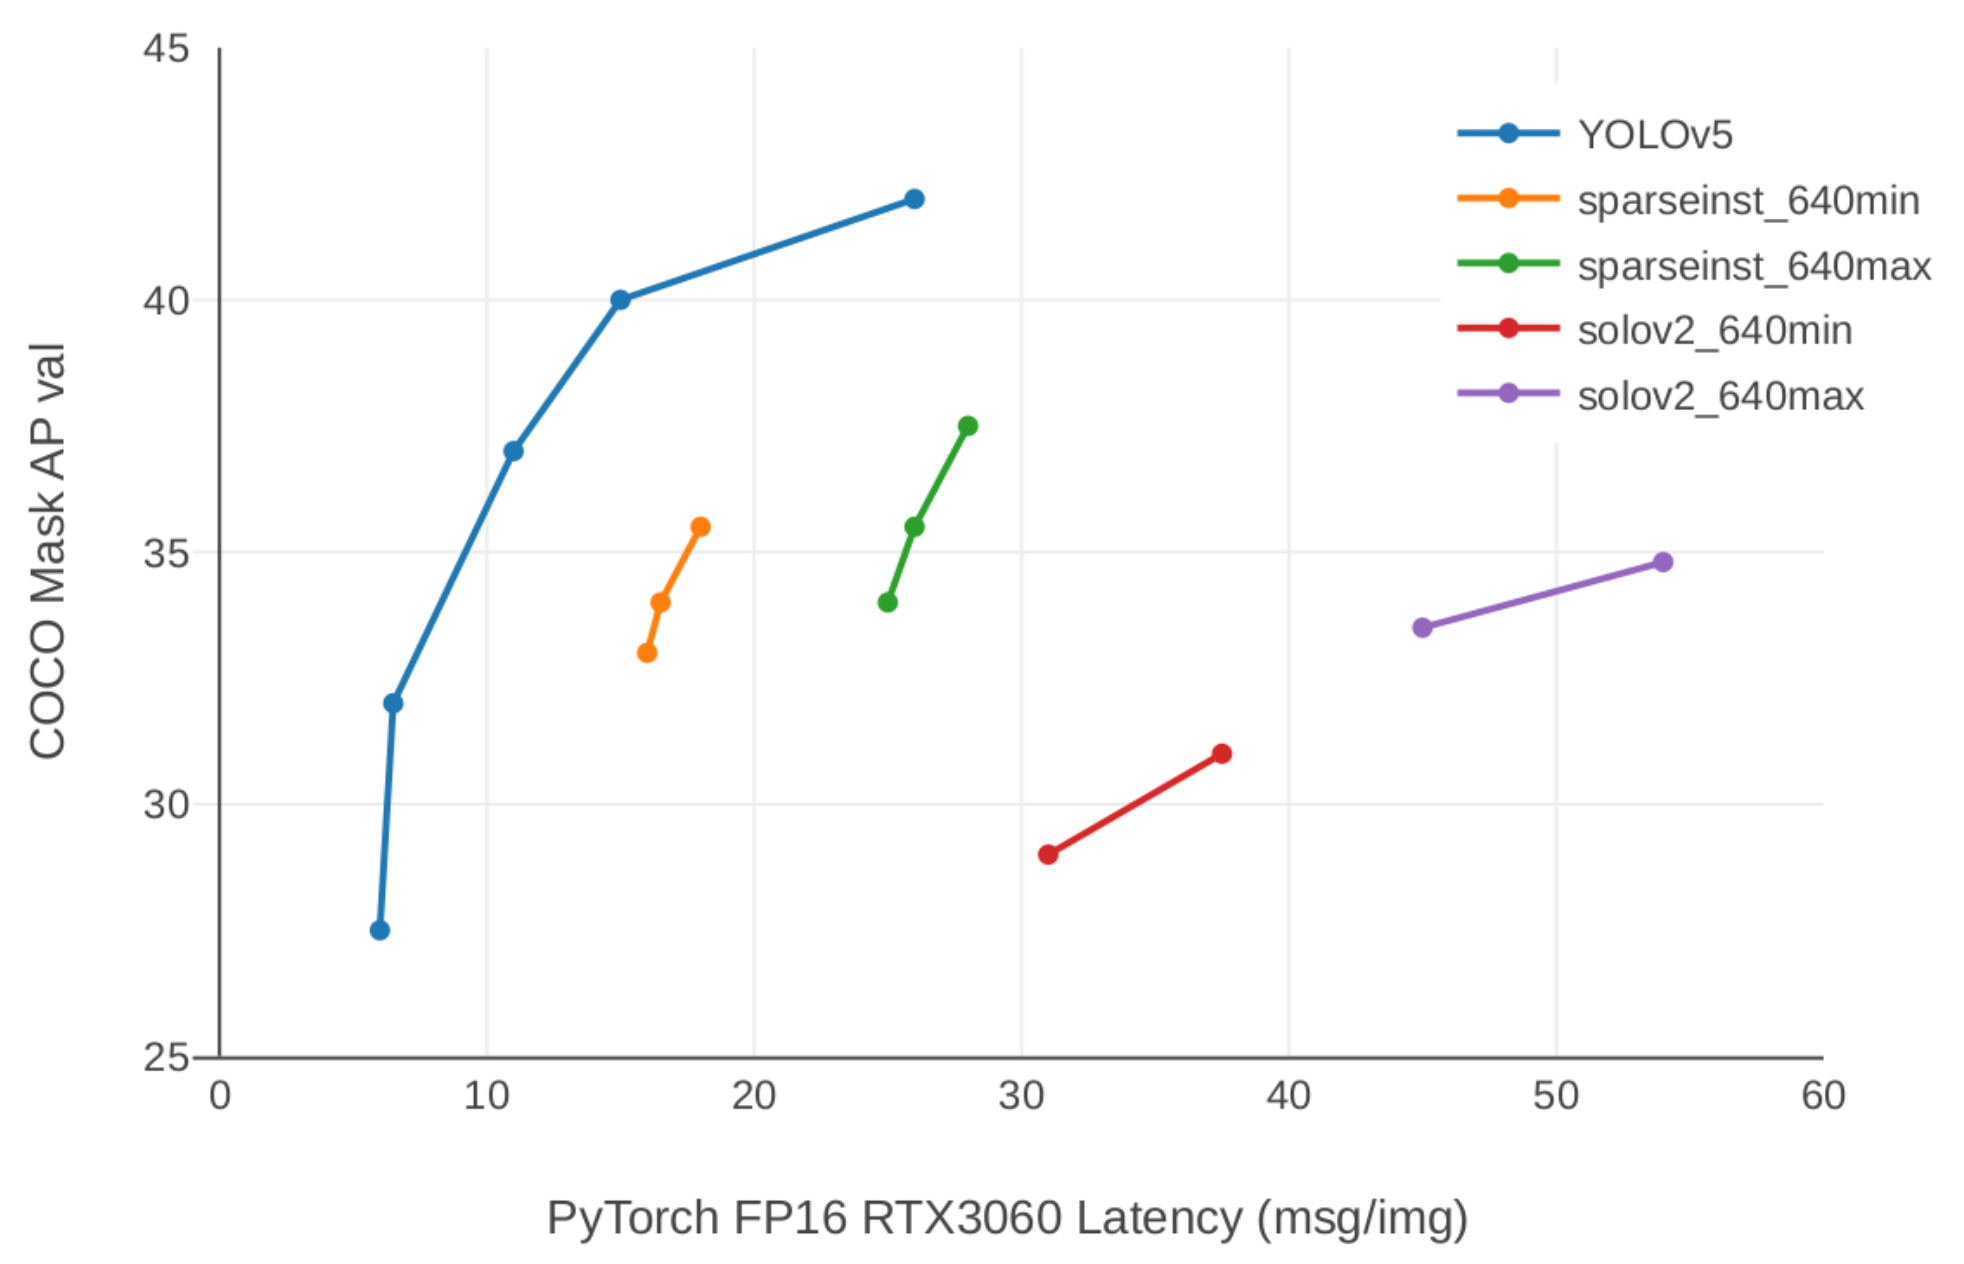
YOLOv5 has been selected as the model to perform 2D labeling due to the fact that it is one of the models published in the literature in object detection task, as shown by Ultralytics, comparing it with literature benchmarks [
28] as can be shown in
Figure 1. YOLOv5 is published as a pre-trained model and can be used to predict where objects are located in 2D images, as well as to classify them. We use this information to project the generated bounding boxes onto the 3D point clouds and automatically build the necessary labels for our target by generating 3D labels.
2.2. KITTI
The KITTI dataset is known to have been widely used in 3D AV research, but recently new datasets have appeared, such as nusCense or Waymo, which are also a very common choice for the latest work. However, despite the emerging datasets, KITTI has been chosen for the measurement of the auto-labeling task because all the published models that will be used have been previously trained with KITTI, and we will be applying the auto-labeling task to the raw KITTI dataset. This will facilitate the comparison of the results between the proposed methodology and previous work.
KITTI is made up of 7481 training images and 7518 test images, as well as their corresponding point clouds, covering a total of 80,256 labeled objects. In addition, depending on the occlusion of the object, each label has the difficulty of viewing the object as easy, moderate and hard. The main idea is to take the raw data as a YOLOv5 input and use the generated bounding boxes as labels and to measure the YOLO labeling performance. The KITTI dataset labeled by annotators has been used as the ground truth for comparison purposes.
2.3. Validation Models
It is considered necessary that the models to be used in this methodology have been previously tested using KITTI. Thus, we have selected some models from OpenPCDet, in particular it was decided to test our methodology with PointPillar [
14], PointRCNN [
13], Voxel R-CNN [
15] and PV-RCNN [
29]. The main idea is to compare the performance of each model when using KITTI labels with respect to the labels generated by YOLOv5.
To measure the accuracy of each model as proposed in [
30] it is possible to perform Bird’s Eye View (BEV) or 3D object detection and the 7518 test images provided by KITTI have been used as a validation set. BEV is a representation of all the features captured from a camera perspective located from a elevated position over vehicles [
31,
32]. This method of representing transformed images offers some advantages, such as the lack of scale ambiguity and the absence of near occlusions due to its overhanging perspective. However, BEV tends to be sparse, which implies a non-efficient application of CNNs [
14]. Furthermore, 3D detection and orientation estimation consist of three parts: first, 2D object detection measured in Average Precision (AP) is performed. Subsequently, Average Orientation Similarity (AOS) is performed to measure the 3D orientation estimation. Finally, pure classification and regression are evaluated [
30]. The performance of the KITTI dataset, reported in each paper of each selected model, is shown in
Table 1.
Regardless of the fact that PointPillars of the selected model is the only model that has been published in the paper to provide the performance measured in BEV, this metric has been considered an interesting point by us due to the advantages previously mentioned, because it is considered later on when comparing the performance with auto-generated labels. It will be important and explanatory to count with more than one metric used to measure the state-of-the-art 3D object detection models based on point clouds. This new metric will provide a more complete view of the performance of the proposed algorithm, making a comparison with the literature models possible.
In addition to the fact that the models shown have all been trained with KITTI, two of them, Voxel-RCNNN and PV R-CNNN, have also been tested with WAYMO and their performance has also been proven to be good. The aim of this work is to demonstrate that the auto-labeling method does not depend on the way the dataset has been obtained, in terms of how and from what point of view the objects have been obtained. In addition, it is proved that the models, existing or to be developed, can work in different scenario settings (usually focused on the point of view from which the data are captured).
2.4. Auto-Label Model
For the labeling task we determined that the YOLOv5 model, pre-trained by Ultralytics, was a good tool to use based on the comparison shown in the literature benchmark, so this model with its weights have been selected as the correct ones to perform this process. Ultralytics is a repository with comparisons and implementations of the most popular machine learning models. Regarding segmentation tasks, Ultralytics provides a set of models that compare their performance in particular problems.
Regarding the auto-labeling task, we decided to use the YOLOv5 model, using the pre-trained weights in the Ultralytics implementation [
28]. We decided to use this particular model as a result of its performance reported in the benchmark literature presented on the Ultralytics main page (
Figure 1).
The implementation of the YOLOv5 model in our research is motivated because it is the most advanced YOLO network and has the best results in object location and detection tasks. In addition, as stated before, it has achieved the best results regarding realtime instance segmentation, which is the most similar task in comparison to our particular situation. Finally, YOLO is an architecture that has been proven in multiple situations [
8,
9], therefore, we consider the best and most reliable alternative.
To evaluate the accuracy of YOLOv5 labeling we followed the same procedure as in [
30], in
Table 2 shows the results of our evaluation of the YOLOv5 model with images from the KITTI raw dataset [
5], measured using the F-Score, which is the harmonic mean of the precision and recall values of the model, the values or F-Score are dimensionless.
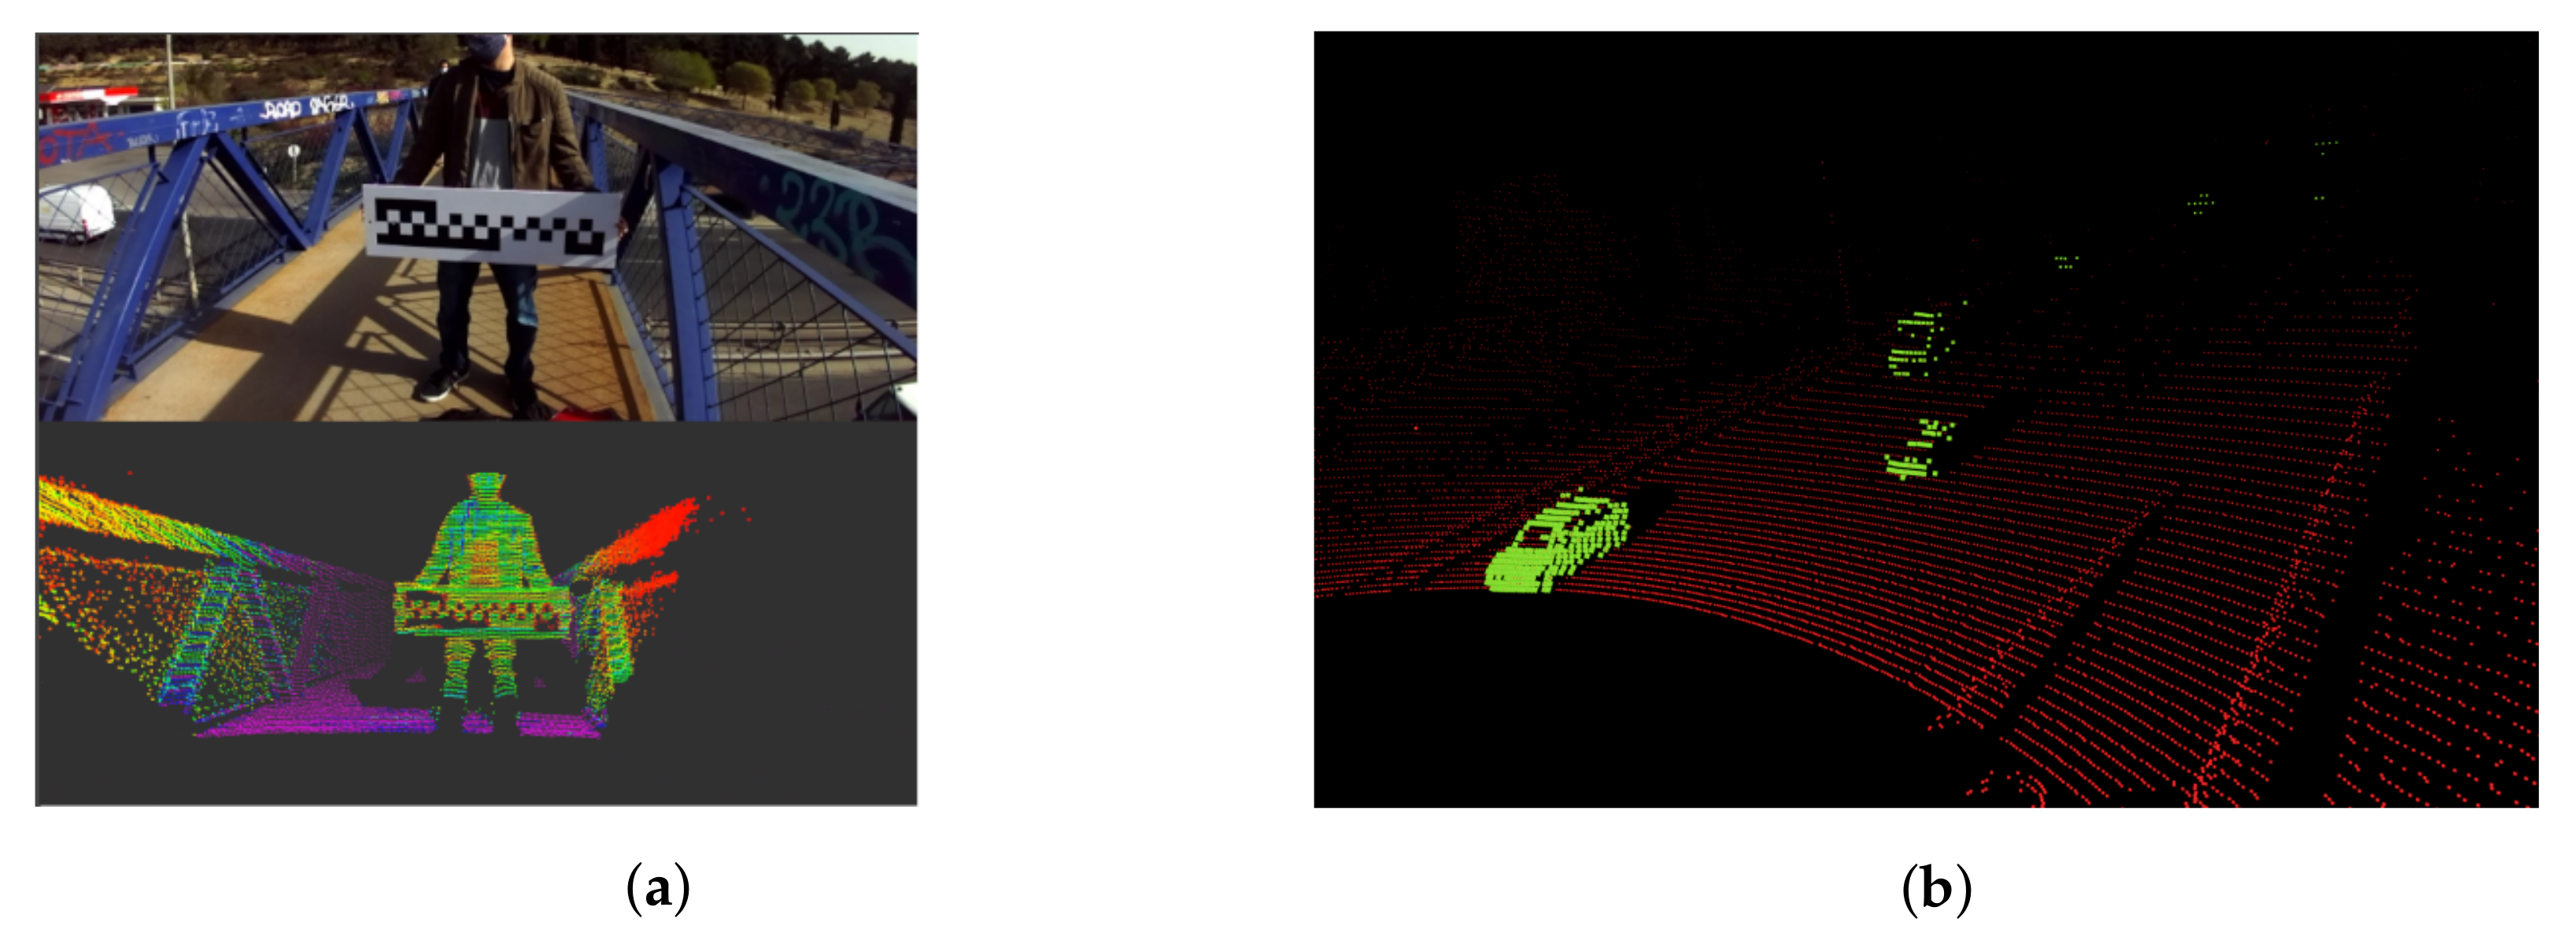
Once the 2D data are labeled, we propose to label the 3D point clouds by projecting the labels onto the corresponding KITTI point clouds and use them as the ground truth for the 3D detection models.
2.5. Models Trained from Scratch
Normally, because of the training of the Artificial Intelligence (AI) models, the datasets are divided into training and test data; KITTI is also divided into a training set and a test set, but the official KITTI website has a validation tool with its own validation set. As the KITTI test set has been used to measure the performance of the models that have been trained from scratch with our auto-generated labels, the comparison with the results shown in each paper is not fair because it is obtained by submitting their models to the official benchmark tool with a specific test test selected by authors. Therefore, to make a proper comparison, the pre-trained models in OpenPCD have been taken to measure their performance with the KITTI test set, whose results are slightly different
Table 1. The main reason for the performance differences is not only the set used in the validation, is that an AOS has been calculated by recalling 40 positions, as recently recommended on the official KITTI website [
33].
4. Discussion
The proposed methodology for generating point cloud data labels using LiDAR sensors has significant implications for various fields, particularly those related to autonomous driving and robotics. Labeling point cloud data is a time-consuming and labor-intensive task, and the ability to automate this process using LiDAR sensors could greatly improve the efficiency of data labeling. This would allow for faster and more accurate development of autonomous driving systems and other applications that rely on point cloud data. Furthermore, the proposed methodology would allow for the generation of labeled data from previously unexplored perspectives, allowing research to be developed for different scenarios, using automatically labeled data.
With respect to previous similar approaches to the same problem [
24], our contribution is proven to work under high reliability boundary scenarios, where previous approaches always use the same point-of-view, i.e., the sensor placed in front of a car [
8,
9,
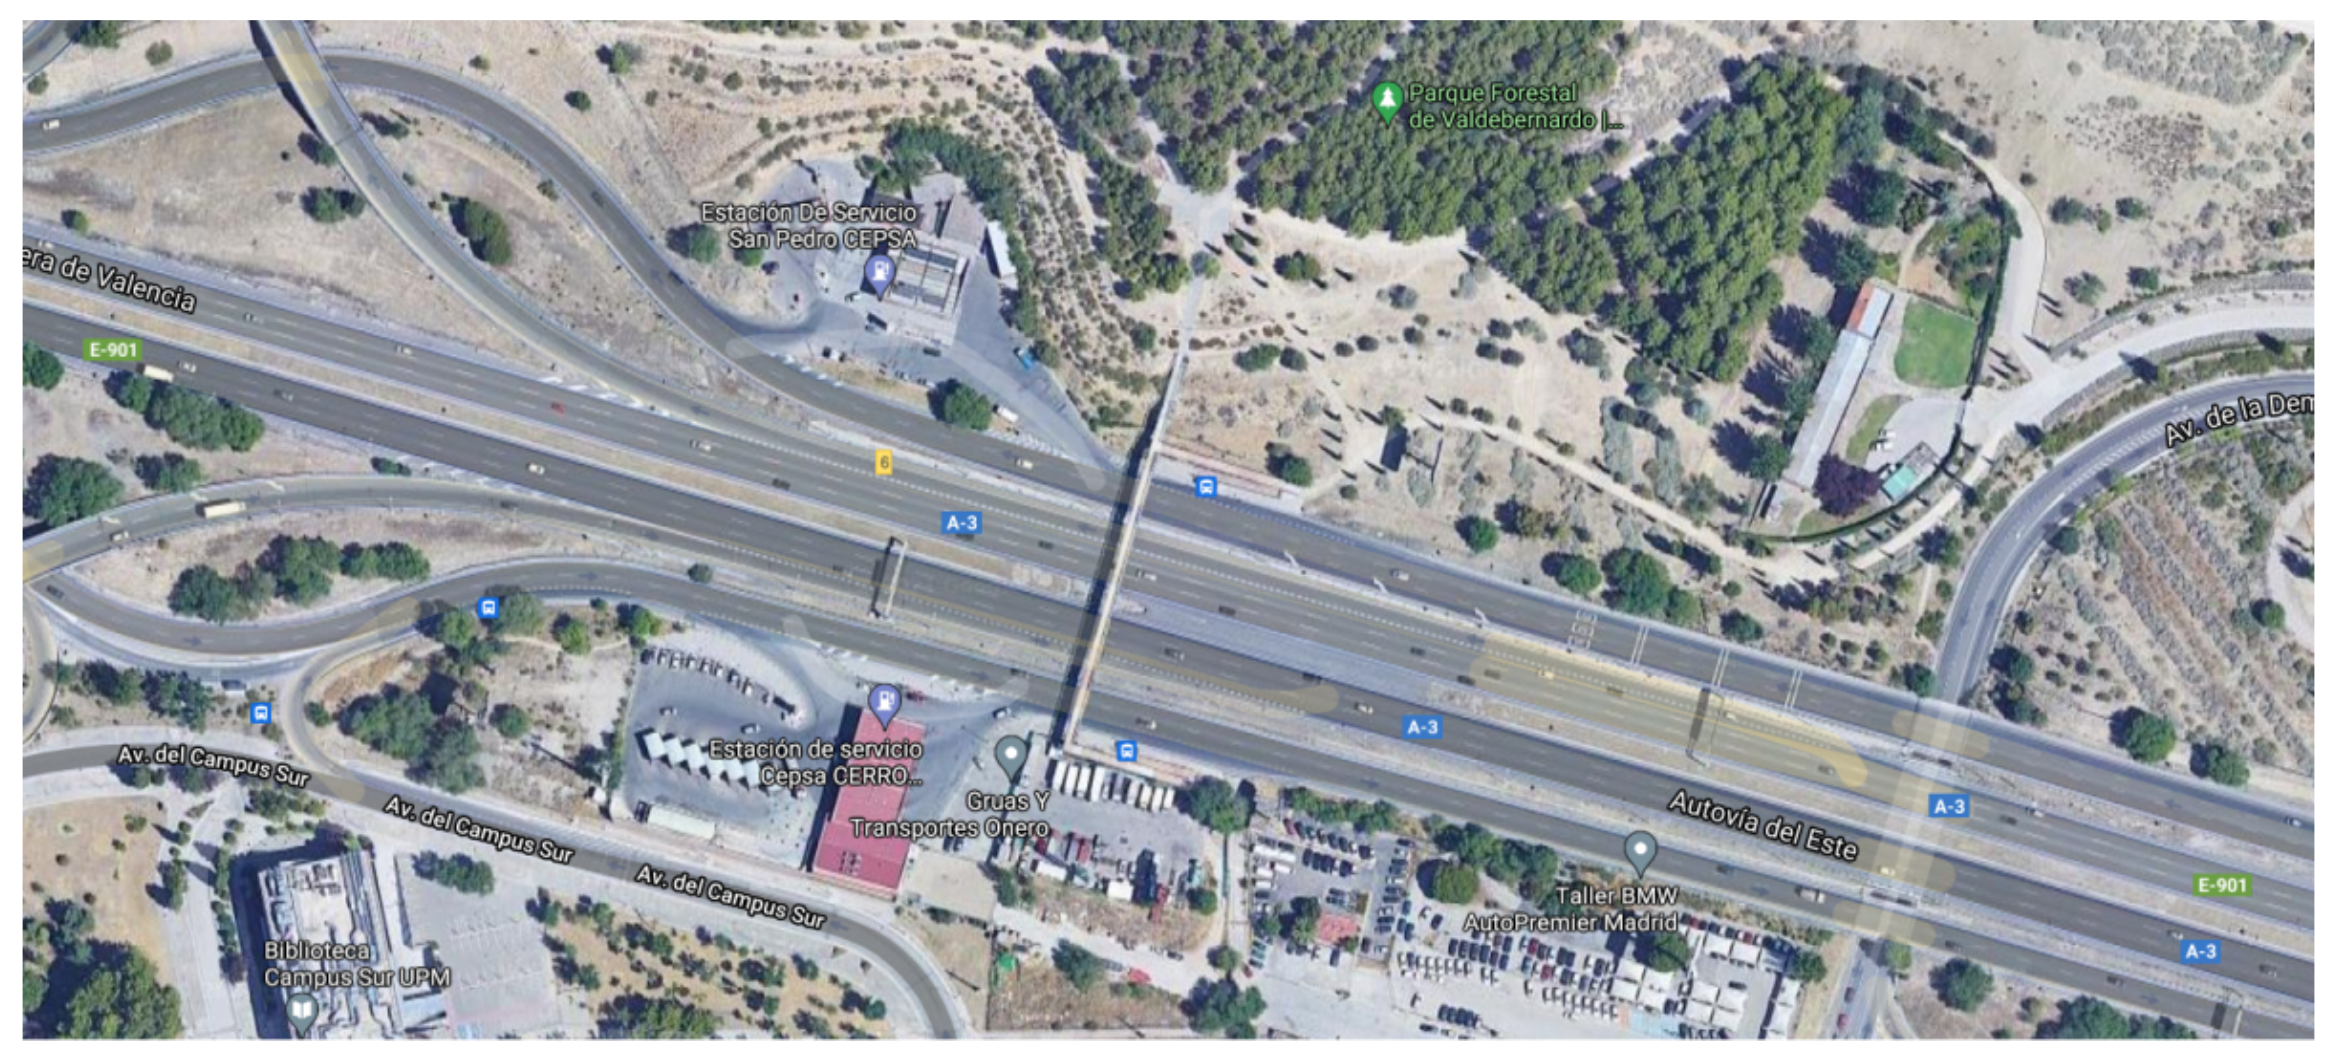
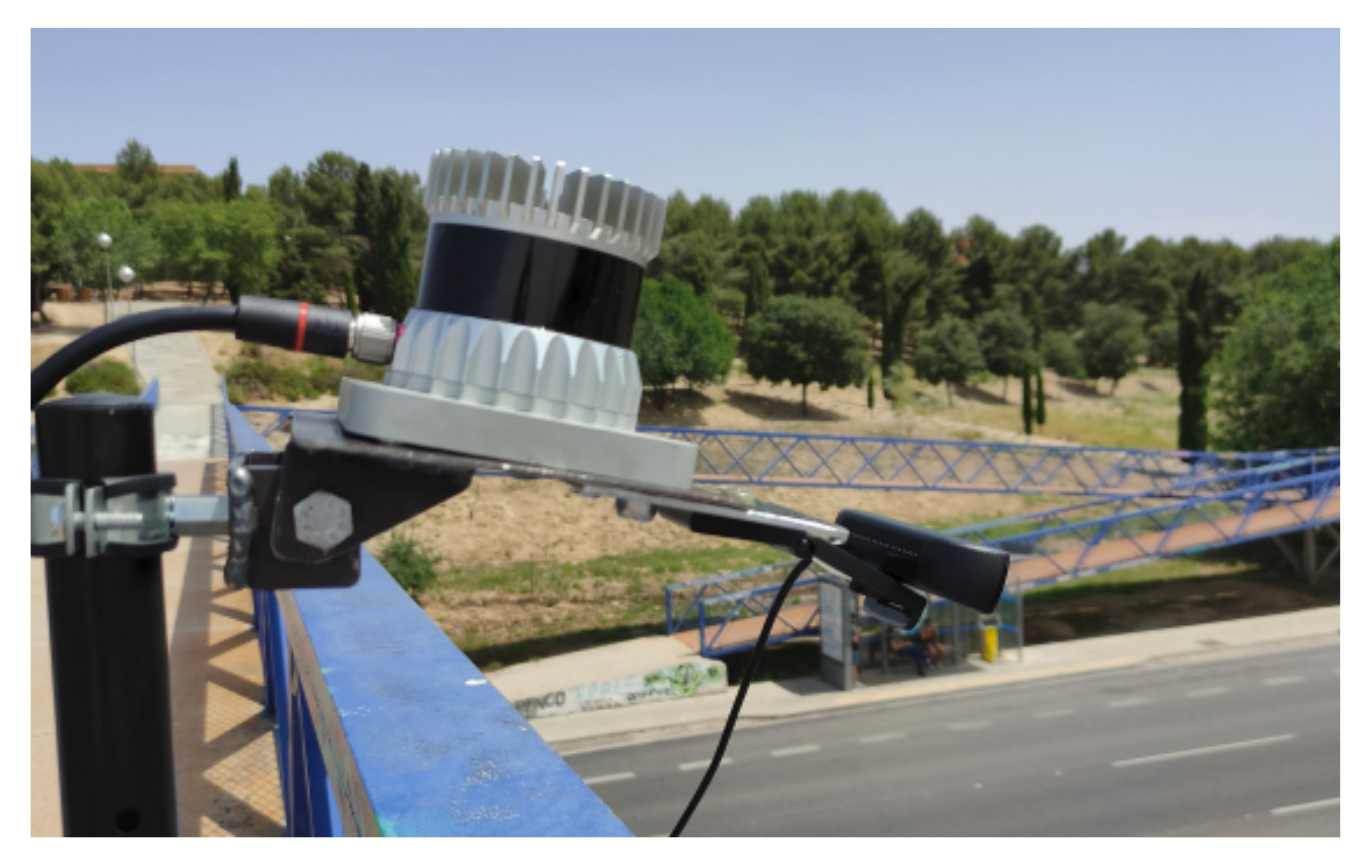
10]. In particular, we have tested the performance of the methodology in a scenario with the sensor placed on a bridge, a gantry or a panel over a highway, demonstrating that, in addition to being a position where labeled data are not available, the results are highly reliable.
One of the limitations of the proposed methodology for generating points cloud data labels using LiDAR sensors is that the accuracy of the labels is linked to the performance of the model that auto-labels the data. The accuracy of the auto-labeling model can be affected by various factors such as the quality of the LiDAR sensor, the complexity of the scene, and the type of object being labeled. If the auto-labeling model is not accurate enough, it may generate incorrect labels that could lead to errors in downstream applications that rely on these labels.
Further research could also focus on developing more advanced auto-labeling models that can handle a wider range of scenarios and object types. For example, current auto-labeling models may struggle to accurately label objects that have a complex or irregular shape [
34], or that are partially occluded by other objects in the scene [
35]. Developing more robust and adaptable auto-labeling models could significantly improve the accuracy and applicability of the proposed methodology.
The proposed method for producing point cloud data labeling using LiDAR sensors is a significant advance in the field of data labeling, but there are several promising paths for future research to further improve accuracy and efficiency of the method.
5. Conclusions
One of the main challenges in building a model for auto-labeling auto-motion scenarios is dealing with high data variability. Autonomous vehicles must be capable of operating in a wide variety of environments and the data used to train the model should reflect this diversity. The problem associated with this challenge is growing due to the high demand for data needed to provide increasingly complex AI models with the data.
In general, building an auto-labeling model for autonomous vehicles is a complex task that requires a combination of machine learning, crowd-sourcing, and other techniques. It is important to carefully design and evaluate the model to ensure that it is capable of accurately labeling the data and supporting the development of effective autonomous vehicle systems.
This paper has presented an approach to perform this work using models already known from the literature and has shown that the errors produced in the process are trivial. To take the demonstration of their performance a little further, we have contrasted the results of training models using known data such as KITTI and self-labeled data, where, despite slightly worse results, the difference is negligible in contrast to the benefits of using these technologies.
Regarding the results, the differences between models are not very large; it would be possible to obtain even better results by applying this method to a larger set of models. Considering these four models (PointPillars, Voxel R-CNN, PointRCNN and PV-RCNN), there is the presence, as can be seen, of statistical outliers such as PointPillars or PV-RCNN with much larger differences than the other two and than with respect to the mean. This is because these particular models are too dependent on the hyper-parameters used for their training. If better parameters were sought for these two or a more extensive set of models not dependent on the network hyper-parameters were used, these statistics could result in a smaller difference in the percentage accuracy of the models trained with auto-generated labels with respect to the original ones, since the outliers would have less significance.
Regarding the possible limitations of the proposed methodology, the most sensible part of the algorithm is the auto-labeling network. The network used in each case must be able to correctly detect vehicles in the scene, and the accuracy of the generated labels is subordinated to the performance of the network.
Therefore, the paper presents a solution to the tedious task of labeling large datasets using a self-labeling model. As shown in the results presented, the model works correctly with negligible errors, and it has also been shown that models can be trained exclusively using these self-labeled datasets. Thus, the proposed methodology could be used in a wide variety of cases where labeled datasets are not available, allowing new problems to be tackled with point of views not faced so far in the literature, as far as we can sincerely be aware, by training DL models based on self-generated labels.


 ,
, 


