Review

Mouth Sounds: A Review of Acoustic Applications and Methodologies

by
Norberto E. Naal-Ruiz
1,*,
Erick A. Gonzalez-Rodriguez
2,
Gustavo Navas-Reascos
1,
Rebeca Romo-De Leon
1,
Alejandro Solorio
1,
Luz M. Alonso-Valerdi
1 and
David I. Ibarra-Zarate
1
1
Escuela de Ingenieria y Ciencias, Tecnologico de Monterrey, Monterrey 64849, Mexico
2
Facultad de Ingenieria Mecanica y Electrica, Universidad Autonoma de Nuevo Leon, San Nicolas de los Garza 66451, Mexico
*
Author to whom correspondence should be addressed.
Appl. Sci. 2023, 13(7), 4331; https://doi.org/10.3390/app13074331
Submission received: 16 January 2023 / Revised: 8 March 2023 / Accepted: 21 March 2023 / Published: 29 March 2023
(This article belongs to the Special Issue Audio and Acoustic Signal Processing)

Abstract

:
Mouth sounds serve several purposes, from the clinical diagnosis of diseases to emotional recognition. The following review aims to synthesize and discuss the different methods to apply, extract, analyze, and classify the acoustic features of mouth sounds. The most analyzed features were the zero-crossing rate, power/energy-based, and amplitude-based features in the time domain; and tonal-based, spectral-based, and cepstral features in the frequency domain. Regarding acoustic feature analysis, t-tests, variations of analysis of variance, and Pearson’s correlation tests were the most-used statistical tests used for feature evaluation, while the support vector machine and gaussian mixture models were the most used machine learning methods for pattern recognition. Neural networks were employed according to data availability. The main applications of mouth sound research were physical and mental condition monitoring. Nonetheless, other applications, such as communication, were included in the review. Finally, the limitations of the studies are discussed, indicating the need for standard procedures for mouth sound acquisition and analysis.

1. Introduction

Mouth sounds occur due to the passing of airflow through muscles in the vocal tract and are powered by the lungs, producing audible vibrations. Sound waves are modified by the pharynx, larynx, mouth, nasal cavity, and paranasal sinuses, which act as resonance chambers. Resonance refers to the prolonging, amplification, or modification of a sound by vibration. Sound is also modified by the constriction and relaxation of the muscles in the wall of the pharynx and the movement of muscles of the face, tongue, and lips, for example, to produce recognizable speech [1]. Mouth sounds serve several purposes, from the clinical diagnosis of diseases to emotional recognition. Figure 1 illustrates the organs and regions involved in mouth sound production.
The following review aims to synthesize and discuss the different methods to apply, extract, analyze, and classify the acoustic features of mouth sounds. The current work is divided as follows: Section 2 explains the types of mouth sounds and the acoustic features employed in the revised literature. Section 3 describes the thorough methodology followed to review research articles concerning mouth sounds. Section 4 presents the main findings of the literature review. Section 5 discusses common trends and limitations observed in the reviewed literature. A conclusion regarding the relevance of mouth sound research is given in Section 6, and finally, future directions are given in Section 7.

2. Mouth Sounds and Their Acoustic Features

2.1. Which Are the Mouth Sounds?
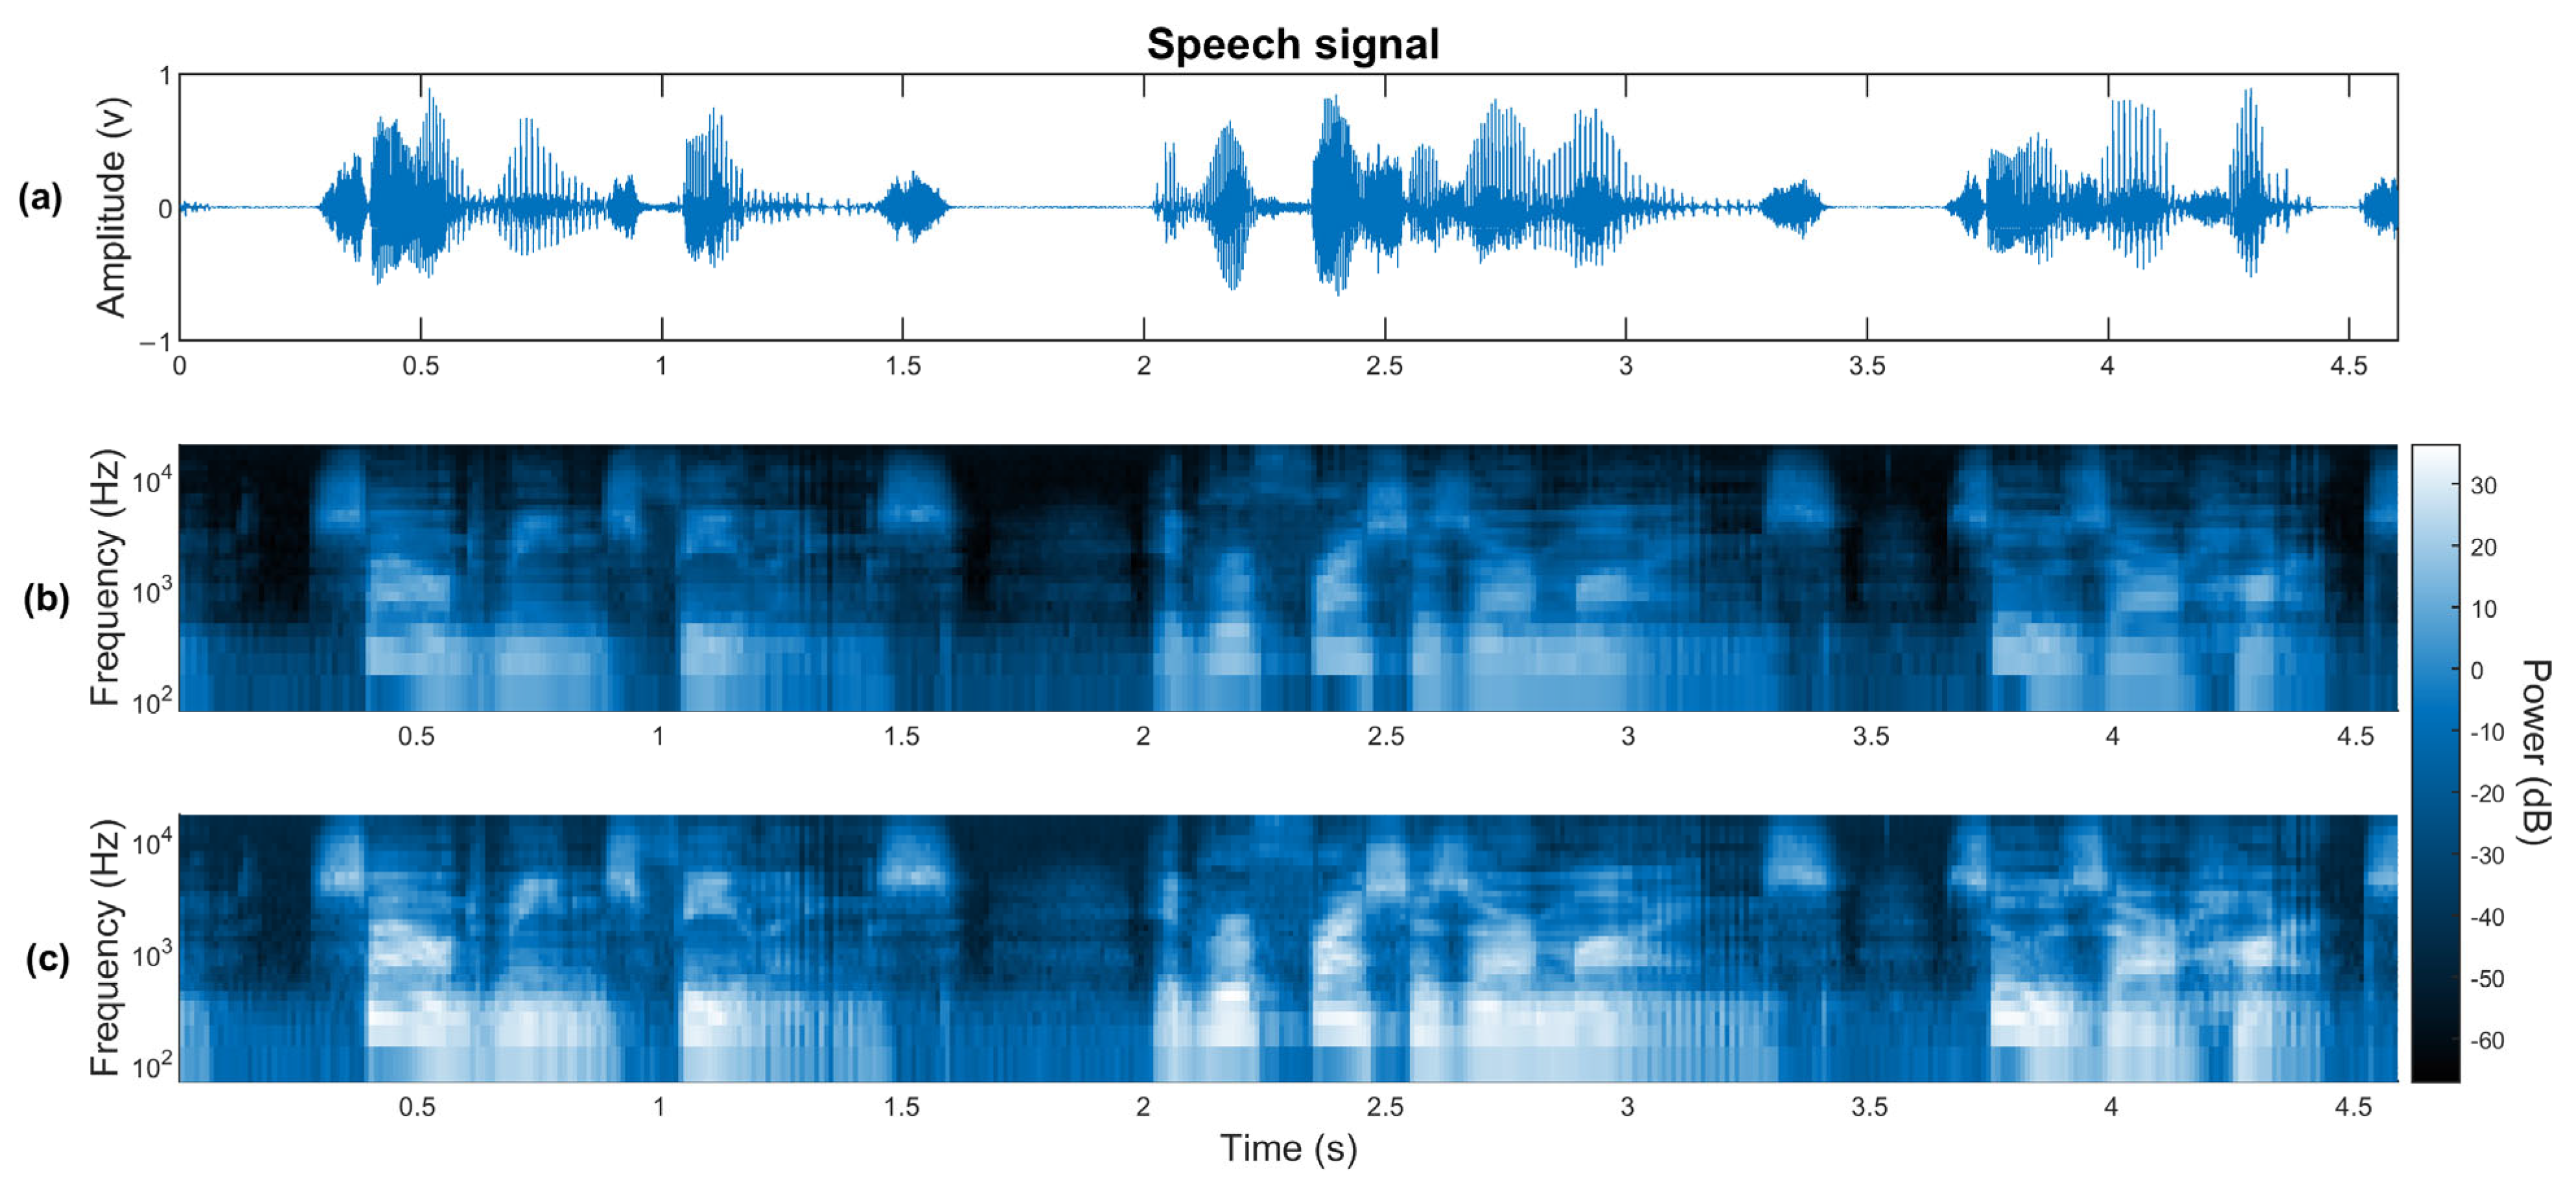
2.1.1. Speech

Human speech production is the most common type of sound that humans make. Typically, speech contains frequencies between 100 and 3000 Hz [1]. Any structural or neurologic pathology in one of the organs involved in speech production may disrupt this function completely [2].
Different timbres, pitches, and fundamental frequencies (f0) are produced by different types of vibrations in vocal folds that occur due to the stiffness of the tissue by the contraction of muscles [3]. When there is decreased tension, the voice has a lower pitch. In contrast, during the contraction of the cricothyroid muscle, there is an increase in length and tension, strengthening the contraction of other muscles and generating a rise in pitch [2].
The variations in f0 in sustained vowel sounds are the best index to explore the instability of the vibration of the larynx in the presence of a shaking and abnormal voice [4].

2.1.2. Singing

Singing is powered by air exiting the lungs, and is produced by muscular contractions of the vocal folds via the laryngeal muscles [5]. The frequency range of singing reported in the literature is 80 Hz–1 kHz [6], without considering overtones caused by resonances. Singing has been used to treat diseases, such as obstructive pulmonary disease, as singing requires active expiratory effort. Therefore, recordings before and after treatment could be useful for better tracking in patients [7].

2.1.3. Babbling

Unintelligible speech-like sounds are a definition of babbling [8]. Present in the prelinguistic vocalization stages of babies, babbling consists of articulatory gestures. Babbling sounds have been researched to improve language in people with Autism Spectrum Disorder (ASD) [9]. The frequency range must be similar to that of speech, but it has been suggested that f0 can be observed in the range of 30–2500 Hz [10].

2.1.4. Whistling

Human whistling is resonance caused by compressed air entering or exiting the mouth [11]. The whistle frequency range is 0.9–4 kHz [11,12]. A smaller area in the oral cavity is related to a higher pitch in whistling, while a greater area is related to low frequencies. Whistles have been demonstrated to encode information related to muscular strength in participants with neuromuscular disorders [13].

2.1.5. Breathing Sounds

Normal breathing sounds originate from the lungs, causing air turbulence in the airways, such as the trachea and bronchi [14]. Breathing sound production is due to turbulent flow caused inside large cavities, either entering (inhalation) or exiting (exhalation) the lungs [15]. The chaotic airflow exits from the mouth in a noise-like sound with random amplitudes between 200 and 2000 Hz, which is almost inaudible due to reduced loudness [16]. Noisy and audible inspiration and expiration could be indicators of diseases such as bronchitis and asthma [15]. Therefore, spectral analysis of breath sounds could aid in the clinical diagnosis of illness.

2.1.6. Cough

Coughing, either voluntary or involuntary, is a defense mechanism of the body forcing exhalation to prevent foreign bodies or substances from entering the cavities of the respiratory tract [17,18]. Exhalation is caused by neural impulses sent through the vagus nerve, closing and opening the glottis, contracting muscles in the larynx and those involved in expiration, to produce airflow from the lungs to the outside of the mouth [19]. F0 in cough sounds can range from 100 to 2000 Hz, but the sound can reach 20 kHz [20]. Bronchopulmonary dysplasia and bronchial asthma are diseases in infants that have been studied utilizing cough sounds [21,22].

2.1.7. Snoring

Snoring is a respiratory sound event caused by air turbulence passing through the pharyngeal structure, causing soft tissue vibration in the vocal tract [23,24]. Research has shown the frequency range of snoring sounds, which is from 20 to 300 Hz [24], reaching up to 1000 Hz in overtones [23]. The abnormal duration and frequency content could be indicators of diseases, such as apneas and hypopneas [24].

2.1.8. Crying

Crying in infants is a form of communication caused by air pressure exiting the mouth with additional resonances from the oral cavity [25]. The frequency range of crying is between 400 and 700 Hz [26,27,28]. Sound information in crying has been shown to be useful for the detection of hearing impairments [29]. It can be accompanied by sobbing, respiratory spasms, and accelerated inhalation and exhalation.

2.2. Acoustic Features of Mouth Sounds

Mouth sounds are recorded using a microphone that converts air pressure fluctuations into electrical signals [30,31]. The discrete versions of those signals are analyzed to extract the acoustic features mentioned below.

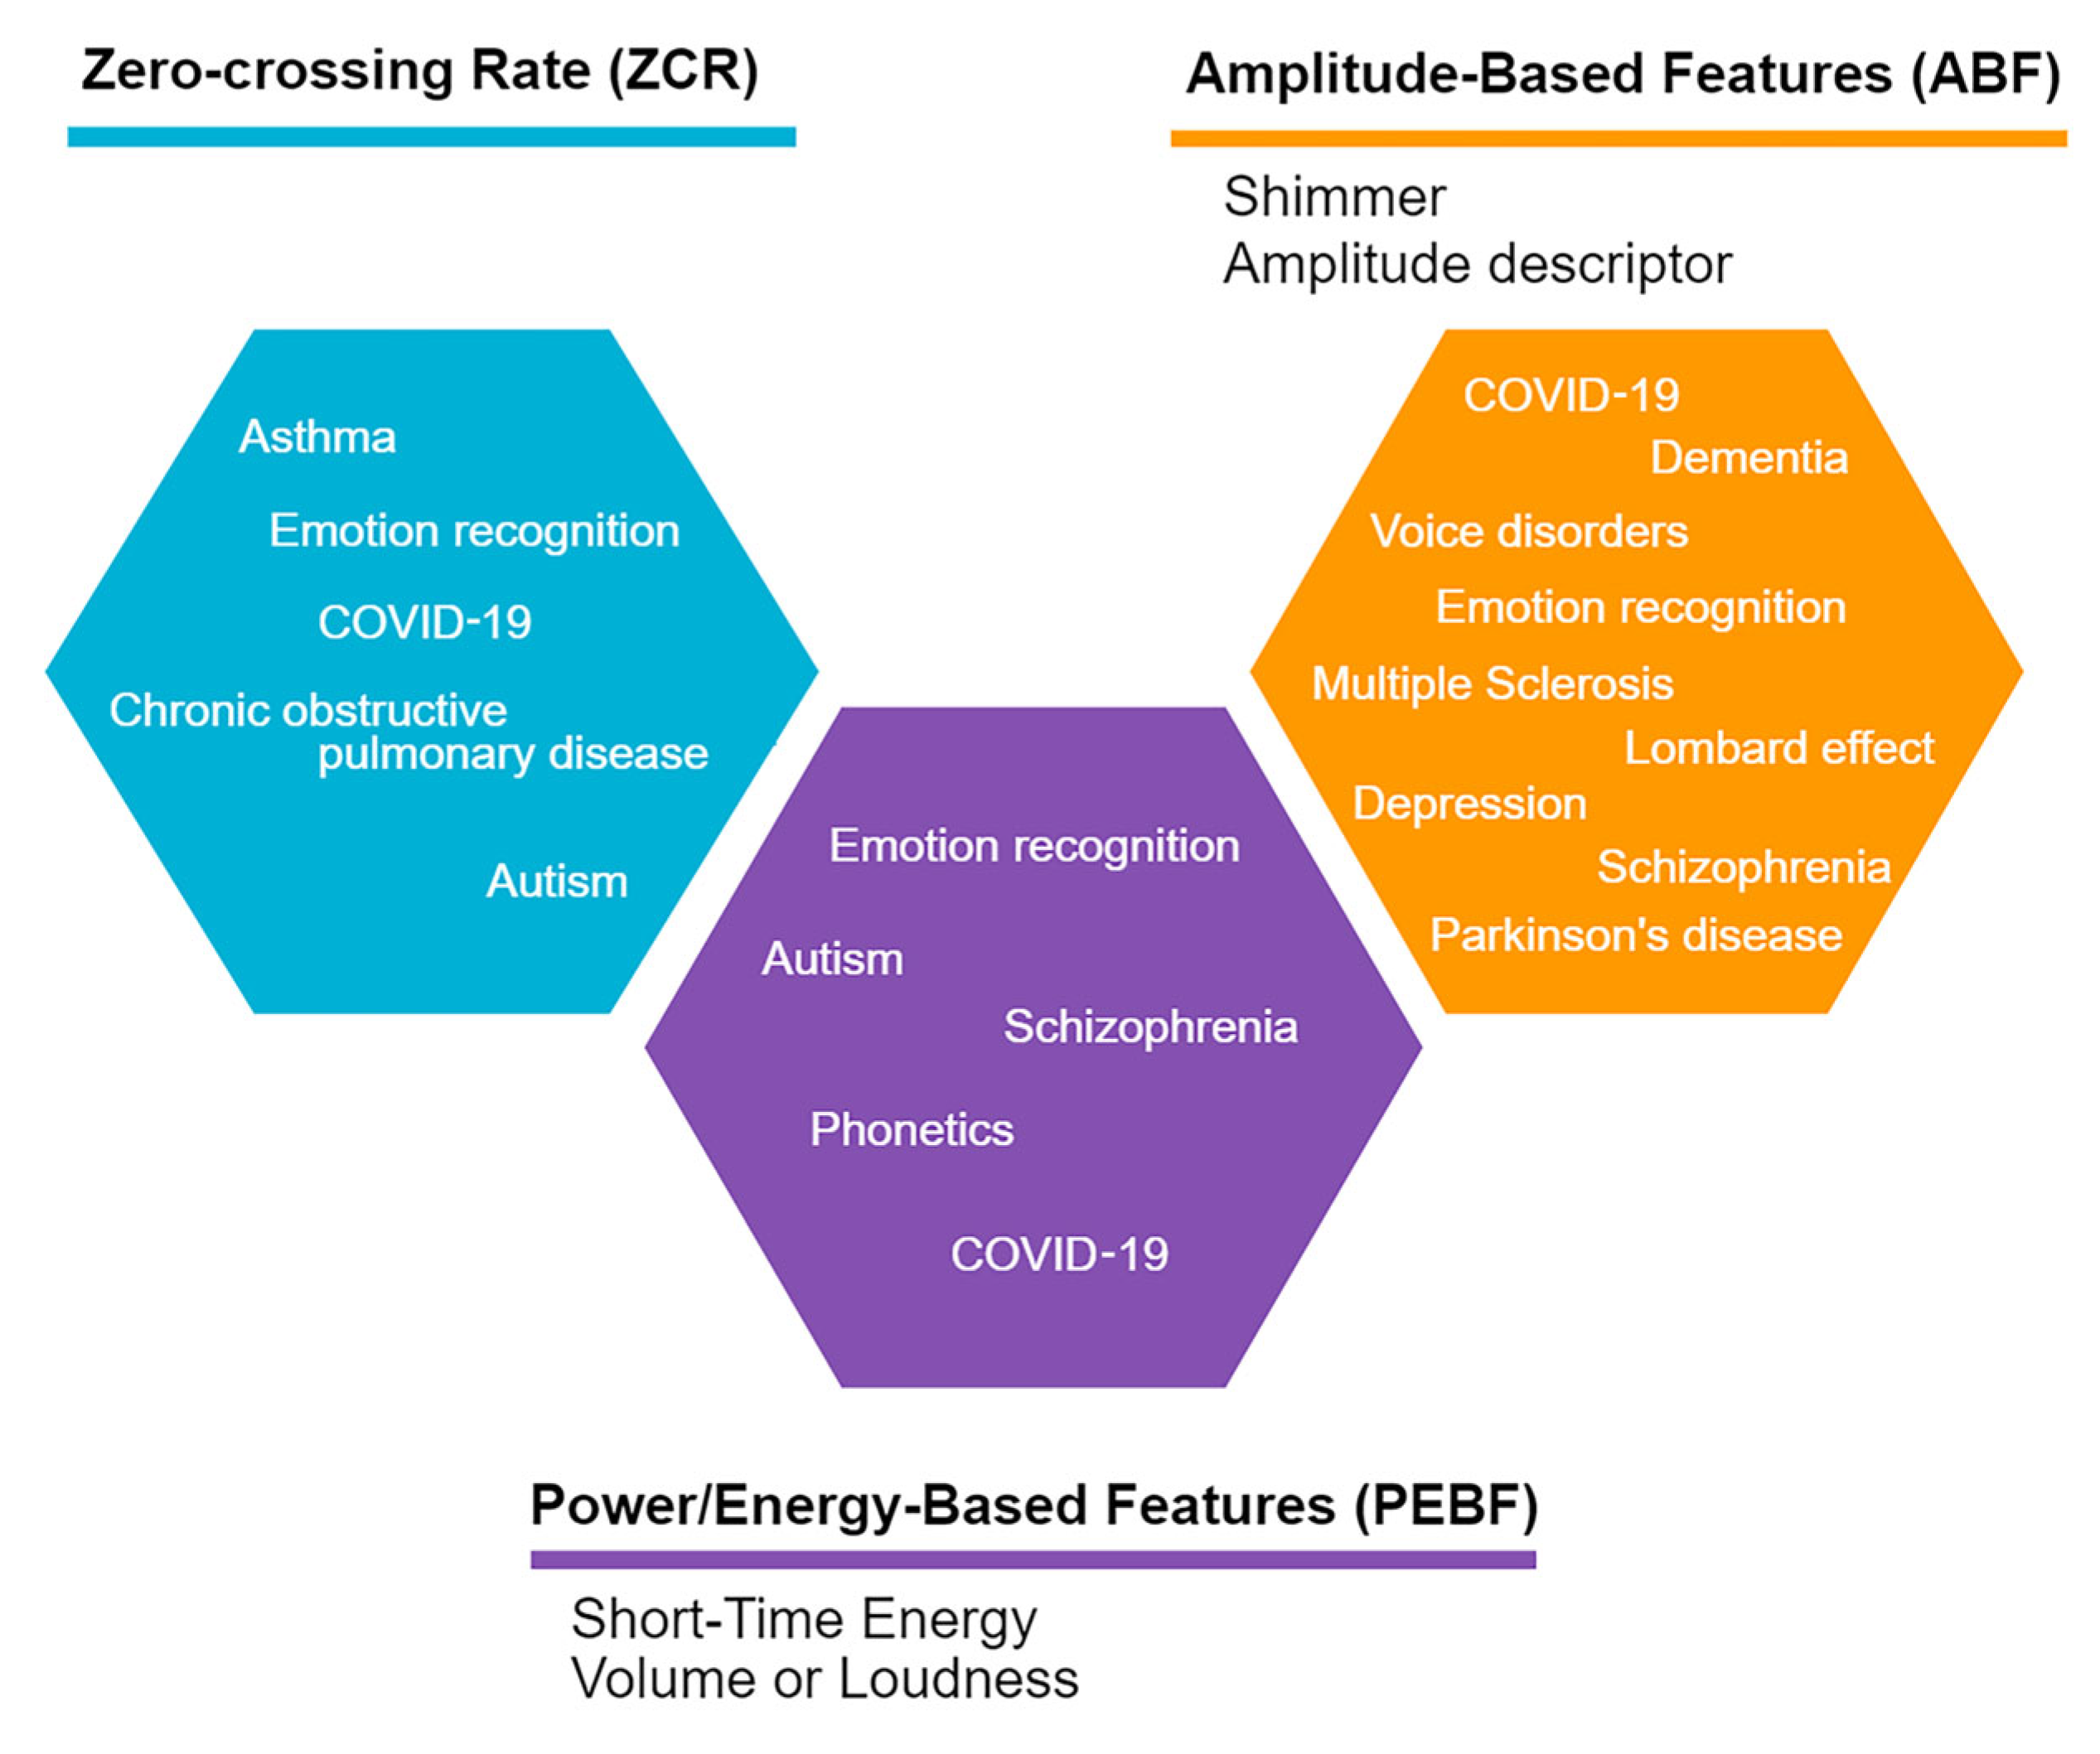
2.2.1. Time Domain Features

Time domain audio signal features are extracted directly from the audio signal samples [32] and help to analyze acoustic parameters, such as the signal-to-noise ratio of background noise in recordings [33]. Moreover, the most recurrent parameters in this review can be classified into three categories: (1) Zero-Crossing Rate (ZCR), (2) Power/Energy-Based Features (PEBF), including Short-Time Energy (STE) and Volume or Loudness; and (3) Amplitude-Based Features (ABF), including includes Shimmer, Amplitude Descriptor, Linear Predictive Coding, Maximum Phonation Time, and Speech Intensity Prominence. Features in these categories are described in this section, and the rest can be found in Appendix A.
A.
Zero-Crossing Rate (ZCR)
The ZCR is defined as the rate of change in a signal sign during a time frame [34]. The ZCR can be interpreted as a measure of the noisiness of a signal, and it is useful to reflect the spectral characteristics of a signal without a domain transformation [32]. In speech, it is used to estimate the f0 and to detect unvoiced and voiced segments [34]. This feature is presented in Figure 2.
B.
Power/Energy-Based Features (PEBF)
Short-Time Energy (STE). A high variation is expected between high- and low-energy states in speech signals because of the brief periods of silence between words [32]. Therefore, to predict a value, the STE is defined as the average energy per time frame [34]. This feature is presented in Figure 2.

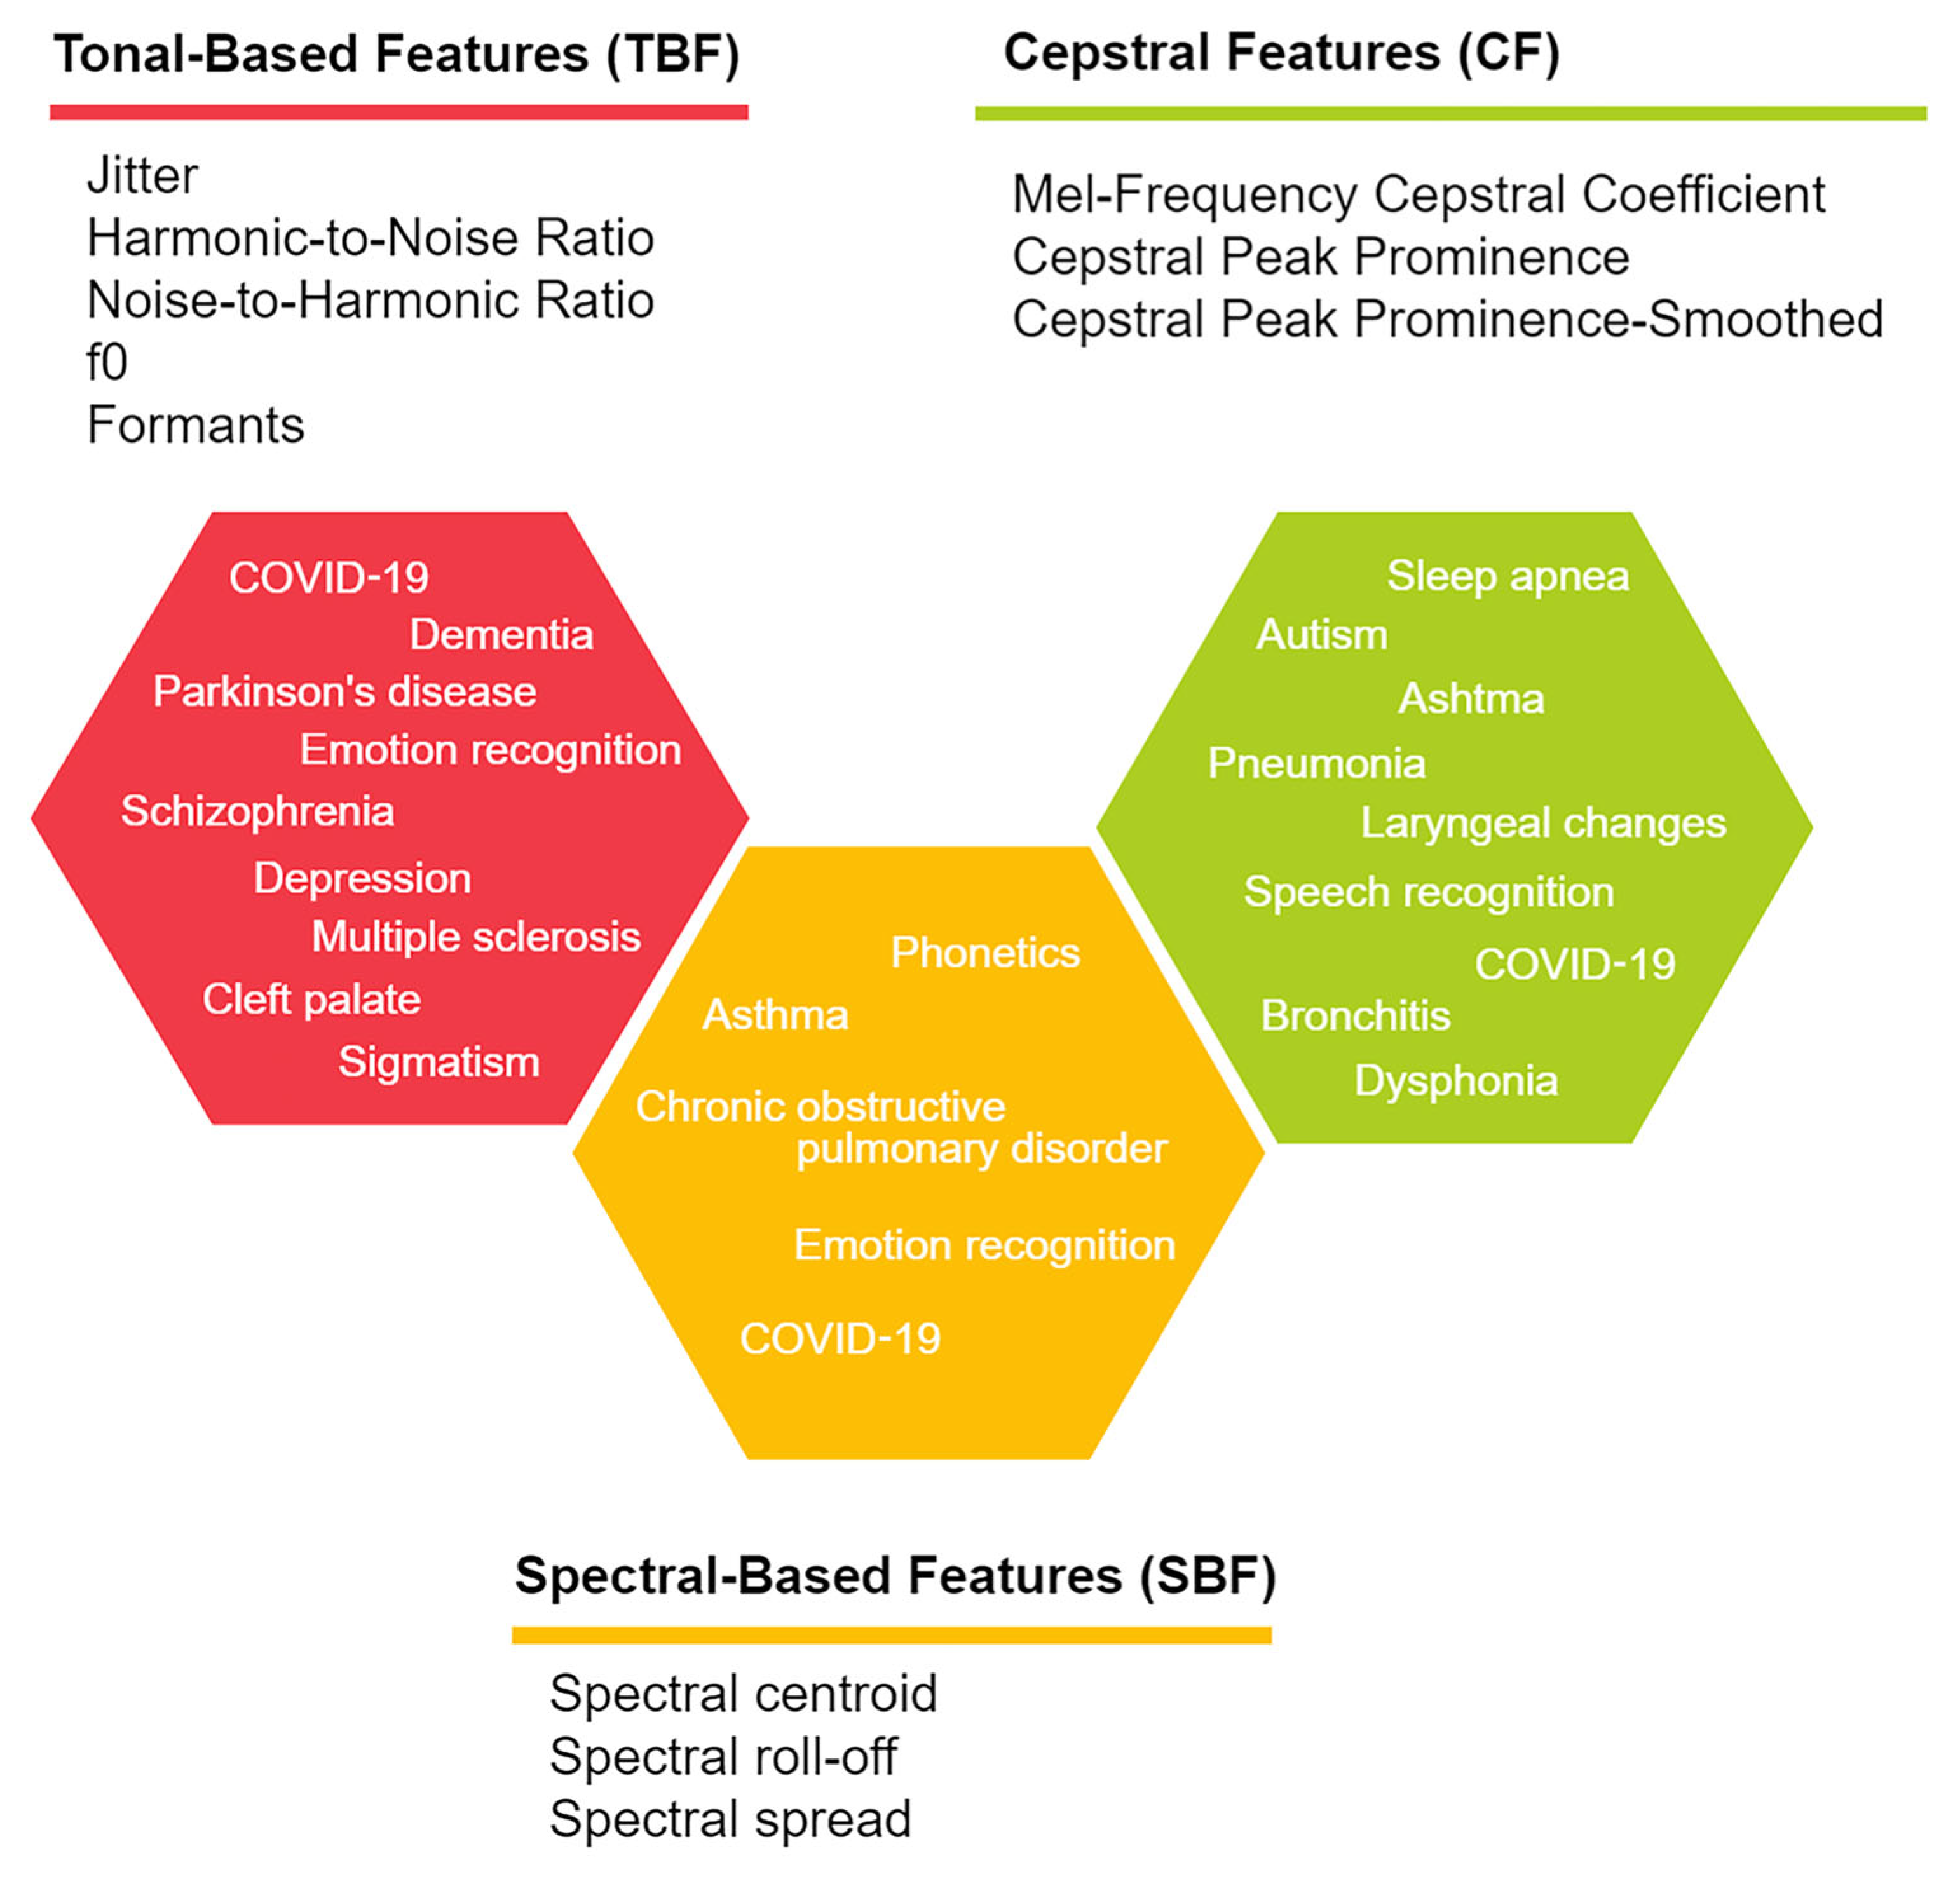
2.2.2. Frequency Domain Features

Frequency domain analysis is a valuable tool in audio signal processing. The frequency domain is mostly studied to observe the periodicity and spectral composition of signals. To analyze a signal in the frequency domain, it is necessary to convert the time domain signal using a mathematical transformation, such as Fourier transformation [34,35]. The most recurrent features in this review can be classified into three categories: (1) Tonality-Based Features (TBF), including jitter, Harmonic-to-Noise Ratio (HNR), Noise-to-Harmonic Ratio (NHR), fundamental frequency (f0) or pitch, and formants; (2) Spectral-Based Features (SBF), including spectral centroid or spectral brightness, spectral roll-off, spectral spread, spectrum envelope, spectral flux, spectral kurtosis, and entropy; and (3) Cepstral Features (CF), including the Mel-Frequency Cepstral Coefficient (MFCC), Bark Frequency Cepstral Coefficient (BFCC), Linear Prediction Cepstral Coefficients, Cepstral Peak Prominence (CPP), Cepstral Peak Prominence–Smoothed (CPPS), Linear Frequency Cepstral Coefficients (LFCC), Rasta-PLP, Teager energy cepstral coefficient, and Teager energy based Mel-frequency cepstral coefficient. Features in these categories are described in this section, and the rest can be found in Appendix B.
C.
Cepstral Features (CF)
Mel-Frequency Cepstral Coefficient (MFCC). MFCC is a technique for speech feature extraction [35], which represents the power spectrum based on discrete cosine transform [34]. This feature is presented in Figure 3.
Bark Frequency Cepstral Coefficient (BFCC). This is a process that combines perceptual linear prediction processing of the spectra and cosine transformation to compute the cepstral coefficients [36]. This feature is presented in Figure 3.

3. Materials and Methods

3.1. Databases

The articles included in this review were accessed through the following databases: EBSCO Academic Search Ultimate, Scopus, ScienceDirect, IEEE Xplore, AES E-Library, and the Journal of the Acoustical Society of America.

3.2. Inclusion Criteria

In the first search, 11,631 papers in total were found in the databases. The literature material for this review fulfilled the following criteria: (1) articles published between 2017 and 2022; (2) articles describing the analysis and processing in time or frequency of audio signals coming from the mouth; (3) acoustic features of the signals were extracted; (4) database of signals had to be previously validated; and (5) research had an application (e.g., clinical diagnosis, mental health, or communication).
Research with applications on voice commands, signals outside of the 20–20 kHz range of frequency (infra- or ultrasound), auscultation or recordings of audios that did not come from the mouth, not-validated signal databases, books or book chapters, theses, and articles not published in journals were excluded.
After considering these criteria, 93 articles were included in the review and are analyzed in Section 4.

3.3. Boolean Operators and Keywords

To facilitate searching and find the best material related to the objective of the review, Boolean operators were used to filter articles outside of the scope of this work.
Further, the authors made a list with 20 keywords related to five questions intended to be answered during the review: (1) What is the main objective? (2) What was done to the signal? (3) How was the signal acquired? (4) What was used to process the signal? Finally, (5) which were the fields of study? Basic Boolean operators AND, OR, and parentheses were used to narrow the results obtained from the databases. Table 1 shows the words used during the search.

4. Main Findings

Figure 4 summarizes the most common trends in mouth sound types, sample rates, bit depths, software, hardware, and applications across studies.

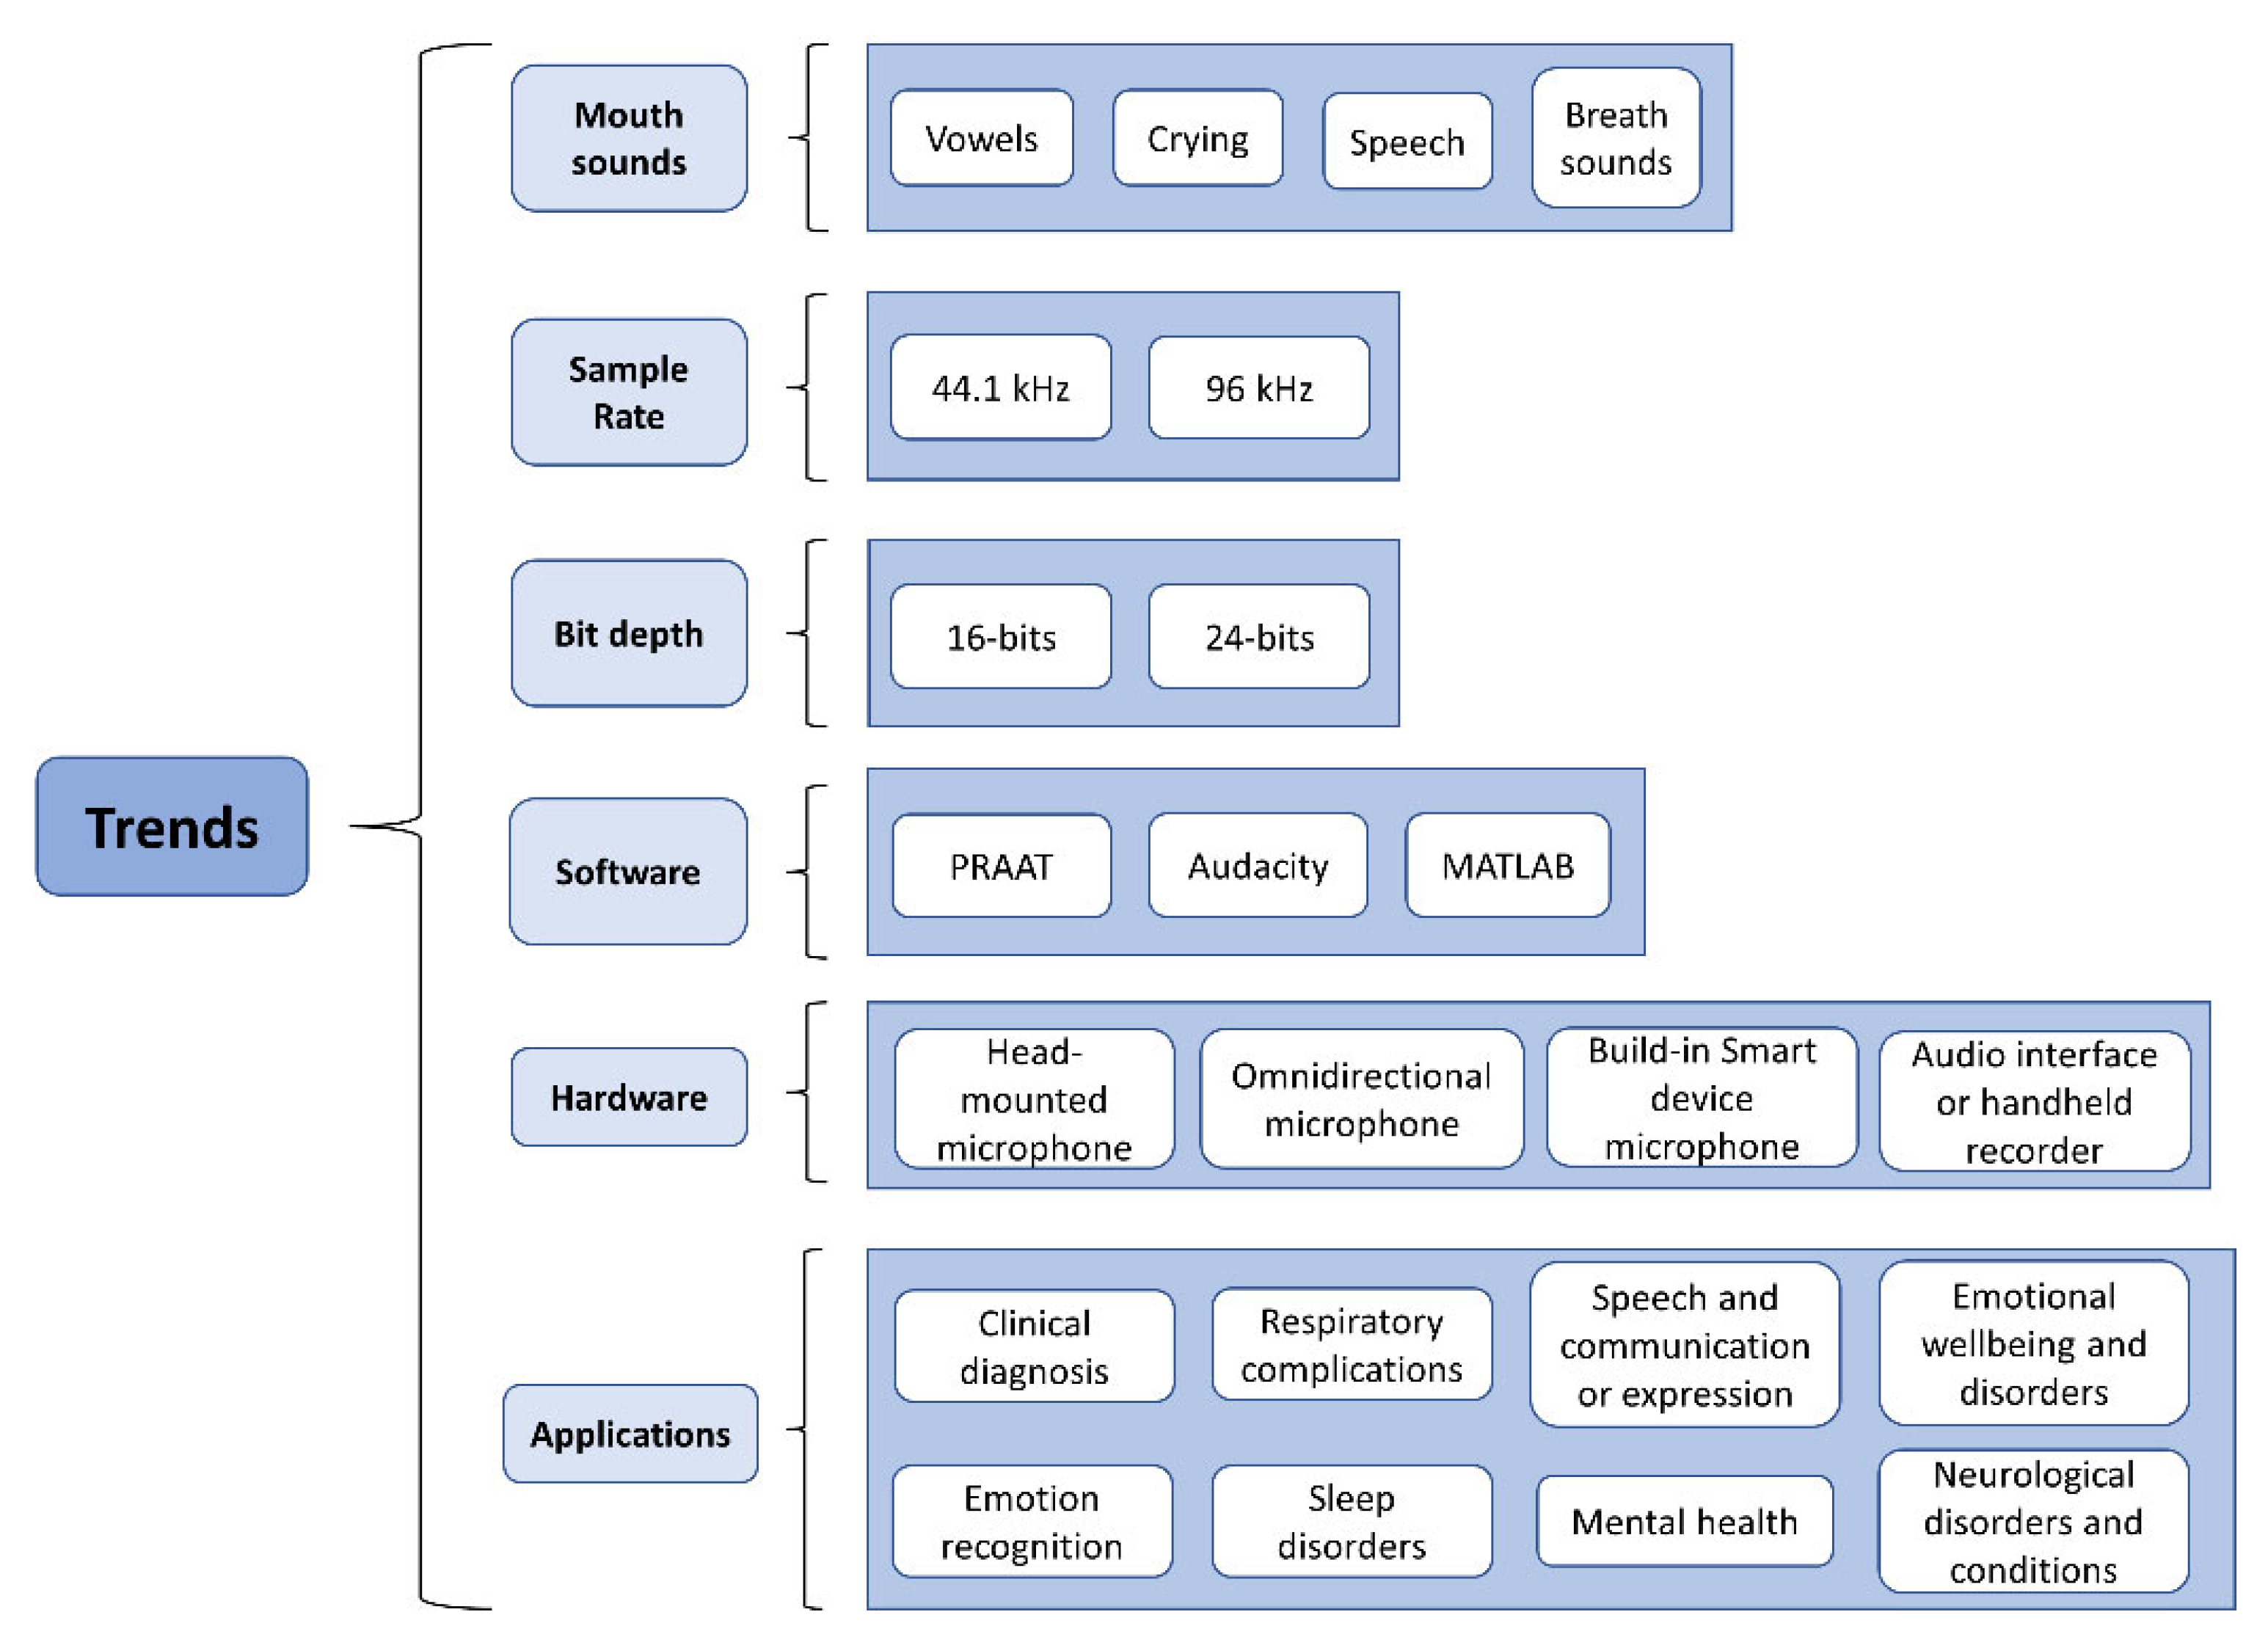
4.1. Recording Conditions

The most common recording parameters were (1) sampling rate of 44.1 kHz and (2) 16-bit depth [37,38,39,40,41,42,43,44,45,46,47,48,49,50,51,52]. However, other sampling frequencies (e.g., 96 kHz and 16 kHz) and bit depths (e.g., 32 bits and 24 bits) were selected [10,53,54,55,56,57,58,59,60,61,62,63,64,65,66,67,68,69,70]. In the case of speech sounds, the highest frequencies of the human voice are in the limit of 3 kHz; therefore, having a sampling frequency of 8 kHz should be enough to adequately capture all the information of the mouth according to the Nyquist theorem [71].
According to the reviewed literature, specialized devices with external microphones have been reported, and microphone placement ranged between 2.5 and 50 cm [33,39,40,42,44,45,52,60,61,72,73,74,75,76]. Those distances seemed to achieve a good representation of the information obtained. Some studies included filters, such as low-pass, band-pass, and high-pass filters, to reduce unwanted noises [37,39,44,51,68,77,78,79,80,81,82].
In many studies, the most used software packages for signal analysis were PRAAT [41,51,53,60,69,73,83,84,85,86,87,88,89] and MATLAB [39,44,59,74,75,77,81,90,91]. Moreover, Audacity was commonly used for audio recording [38,41,43,50,61,64,84,92,93,94].
Recording hardware portability was found to play an important role in data acquisition. The most common devices were smartphones [41,44,52,61,63,64,68,69,93,95,96] and small recorders, such as H4 Zoom [46,54], H5 Zoom [42,97], H6 Zoom [57], and Olympus [51,98]. On the other hand, the most used microphones were headsets and head-mounted microphones from many different manufacturers [39,45,47,48,53,66,70,74,75,89,99,100,101]. From this, we can find that there is no specialized and standardized hardware for signal acquisition. Hence, there is a need to establish it.

4.2. Acoustic Signal Processing Techniques

There are several methods to extract information from the sounds generated by people through the mouth. Signals are processed in two domains: time and frequency [34,99]. Each of them and their most recurrent features will be described separately.

4.2.1. Time Domain

From the revised literature, the most analyzed acoustic parameters in the time domain were ZCR [49,51,77,80,93,94], volume or loudness [10,66,67,102,103], shimmer [50,64,70,83,85,87,89,97,102], the amplitude descriptor, including duration [33,47,49,50,73,89,90,91,104,105], and STE [49,94]. Another recurrent feature in the time domain was sound level [47,49,73,75,104]. Figure 5 summarizes the most employed features and their main applications in the literature.

4.2.2. Frequency Domain

The most recurrent frequency features and main applications in the literature are detailed in Figure 6. After the signals were captured, to carry out analysis, data were transformed into the frequency domain. Several studies analyzed pitch, f0, or harmonics [29,41,42,49,51,56,57,59,60,70,73,85,89,94,95,104,106,107,108].
Other studies used MFCC for their analyses [40,41,42,44,52,56,58,60,61,63,65,72,73,77,80,87,94,100,101,107,109,110,111,112], also combined with other techniques, such as LFCC [113]. Several researchers used CPP [84,97] and CPPS [45,73,74,75]. The most recurrent SBFs were spectral centroid [49,52,67,77,80,93], followed by spectral spread [67,80,93], and, finally, spectral roll-off [52,67,77,93].
A small number of researchers concentrated their analyses on voice formants, another frequency feature related to vocal tract characteristics and voice analysis [37,46,47,48,49,59,60,80,86,89,107,114].
Further, Welch’s method for the short-term average spectrum and the Fourier transformation of the Hilbert envelope for the modulation spectrum were used to investigate speech production in noisy environments [33].
Lastly, energy was a feature analyzed in time and frequency domains across several studies [49,56,80,94,107,115].

4.2.3. Spatial Filtering

In addition to the acoustic features described in Section 2.2, a method that has shown promising results for mouth sound extraction is beamforming, which is discussed in this section. This technique aims to extract signals of interest by isolating the source from specific positions relative to an array of microphones, increasing the amplitude of the signal and attenuating sources of noise [116,117]. Delay-and-sum beamforming was used to extract cough sounds and sibilants of words from people for health-related analysis: COVID-19 [100] and sigmatism [39,101]. Fifteen- [39] and one-hundred-and-twelve-microphone [100] arrays have been used in the study of source extraction; for the version with one hundred and twelve microphones, the model increases anomaly classification in machine learning algorithms when combined with video content.

4.3. Acoustic Feature Analysis

It is known that acoustic signals provide features useful for several applications, such as speech recognition [55], disease identification [49,65,68,113], and recognition of notes with musical purposes [118].
This subsection summarizes the statistical analysis techniques, traditional Machine Learning (ML) methods, and more complex algorithms that apply Deep Learning (DL) algorithms, all of which aim to detect patterns and associate features in audio recordings coming from the mouth of a person. ML and statistical analyses are used in all research articles to provide certainty of the results in each investigation. Both methods have been used to reach conclusions related to physical and emotional health.

4.3.1. Statistical Analyses for Evaluation

Across studies, normality in data was primarily tested with the Kolmogorov–Smirnov test [29,45,74,75,89] and the Shapiro–Wilk test [47,73].
The parametric Student’s t-test was reported in most studies comparing two acoustic variables, either paired or unpaired [29,41,45,50,79,84,85,87,88,89,104,105,119]. In [79], an unpaired Student’s t-test was employed to analyze pathologies, such as vocal fold cysts, unilateral vocal fold paralysis, and vocal fold polyps. Cohen’s effect size was used in [50] to analyze pre/post-session changes in the voices of actors. The non-parametric Mann–Whitney U test for unpaired data was also reported [61,74,82,94].
Several studies conducted multiple comparisons across variables. To counteract multiple comparison issues, Bonferroni’s correction was used [50,53,82].
Analysis of variance (ANOVA) and its variations was another method employed in statistical testing. Some studies used one-way ANOVA [46,75,83,87,106], two-way ANOVA [84,97], repeated-measures ANOVA [33], multivariate ANOVA [102], Friedman’s test [70,82], analysis of covariance [73], and Welch’s unequal-variances t-test [65,105].
Correlation between variables was assessed using Pearson’s test [47,75,108,119]. In [50], the inter-rater reliability was correlated in listening evaluations of vocal exercises. Additionally, in [82], the relationship between the cough peak flow and cough peak sound pressure level was measured using Spearman’s rank correlation coefficient analysis.
Other statistical analyses presented in different works were descriptive statistics, mainly involving measures of central tendency [37,91,120]. These measures help to gain a better understanding of behavior and tendency. Furthermore, regression analysis was used across different studies to model relationships among variables [37,91,92].
Some studies previously mentioned using combinations of statistical methods for a better inference of results based on the behavior of the analyzed signal. For example, Ref. [87] computed descriptive statistics, t-tests, and multivariate ANOVA, taking features such as shimmer, f0, jitter, and NHR from the sounds of women. This procedure aimed to detect hyposalivation. Note that these techniques were used to describe relations between groups, conditions, and group interactions.
Other studies showed the application of non-conventional statistical methods to compare features extracted from audio recordings. For example, Bonferroni’s corrected planned comparison led to a better understanding of the effects of certain masks in acoustic features and communication [53]. Similarly, the log-likelihood function proved useful in the classification of sounds between PD sufferers and control patients, employing cross-validation leave-one-subject-out before Welch’s t-test [65].
Regarding statistical tools, the most used software was the Statistical Package for the Social Sciences [53,62,82,83,87,88,114], a statistical software broadly use for basic analyses.

4.3.2. Machine Learning (ML) Techniques for Pattern Recognition

ML algorithms, including DL, performed well when used to classify features from audio recordings [55,64,113]. Most of these techniques were used to differentiate between control and experimental groups [87,114]. For this purpose, correlation models, such as the identification of autocorrelation between variables [10] and correlation-based feature subset algorithms [78], have proven useful to identify features for a better classification of data in ML algorithms.
The most common algorithms used in studies included Support Vector Machine (SVM) [40,49,72,78,80,94,96,101,107,108,111,115,121,122], Neural Networks (NNs) [38,39,42,45,62,67,72,100,123,124], the Gaussian Mixture Model (GMM) [63,65,72,109,112] combined with the Hidden Markov Model (HMM) [51,60,76,90,110], and Random Forest (RF) [80,93,115].
One of the most pursued differentiations is the detection of apneas/hypopneas presented in snoring during sleep [68,113], showing promising results in classifying apneas and hypopneas compared with a gold standard. The logistic regression model was used to classify snoring sounds as apnea/hypopnea and non-apnea sounds.
Another very commonly pursued differentiation refers to emotion recognition. In [125], a classification performance of 73.1% was achieved when analyzing cries from babies containing frequent short noises. Furthermore, a classification algorithm named SemiEager reported accuracies of 88.08% and 90.66% [56] in classifying emotional states. This learning algorithm was intended to reduce computational cost while receiving perceptual-based features, such as MFCC and BFCC, and time features, such as ZCR and STE. The highest accuracy scores were observed when feature fusion was employed [49,56].
Overall, a trend was observed in research articles, including the diagnosis of pathologies or disorders. The majority of them used either ML algorithms, smartphone applications, or both [10,78,96,125,126,127].

4.3.3. Beyond ML Strategies

DL techniques could also be combined with classical ML methods to improve information extraction from the original data. For example, in [64], an embedded hybrid feature deep-stacked autoencoder was developed using both original and deep features from the audio signal. The autoencoder consisted of three parts: (1) original features embedding into the layer hidden in the stack encoder; (2) information regularization and feature reduction algorithm; and (3) feature reduction method for outlier removal. The results showed better effectiveness than other deep autoencoders, and the combination of the three parts performed better than any other significant parts separated from each other. Still, only three out of four autoencoders achieved higher than 85% accuracy when trying to classify four mental disease groups.
In other applications, a novel deep clustering technique was developed to separate image and audio from video recordings and identify voice in a mixture of different noises [55]. Looking at the performance of the technique, it seemed that Audio–Visual Deep Clustering outperformed other methods.

4.4. Applications

4.4.1. Physical Health Monitoring

A.
Clinical Diagnosis
In the clinical environment, acoustical analysis has been a way to diagnose health problems [40,79,84,109,121], pathologies, and speech language complications, such as language development in children [10], those with a cleft palate [122], speech intelligibility from cochlear implant users [33], diplophonia [76], lateral sigmatism [39,101], asthma and chronic obstructive pulmonary disorder [80,91,93,96], and pathologies affecting sound production through the voice (e.g., dysphonia, laryngeal changes, and hyposalivation) [45,54,72,73,74,75,87,106,119]. Technology used for voice recordings has helped to evaluate and measure progress before and after treatment. For example, early word production in children was evaluated through an app using only the internal microphone of a tablet device [13].
In speech and language complications, acoustical features from voice recordings tend to change. The extraction of f0, CPP, and smoothed CPP were the most studied acoustic features across studies. In [45,72,73,74], CPP and CPPS have shown significant differences (p < 0.05) for pathology detection. Other features, such as MFCC, have shown 95% when introduced to ML algorithms, such as SVM [72,75]. However, in diplophonia, there are two simultaneous f0; therefore, the analysis of single f0 is limited [76].
In [87], acoustic differences between the voice of women with hyposalivation and normal voices were explored by performing tasks, such as reading and pronouncing isolated vowels. Significant differences were observed only in isolated vowels /a/ and /i/ on f0. Therefore, the results of these studies might indicate that the frequency parameters of sound voices are useful for abnormality detection in voices.
Besides speech, snoring has also been acoustically analyzed for clinical purposes by measuring sound intensity, formant frequencies, and spectrographic patterns before and after surgery due to nasal septal deviation [88], and describing acoustic differences in normal and drug-induced sleep [114].
Recently, cry signals have provided relevant information about the physical and psychological states of newborns [128]. To diagnose diseases based on the analysis of the sound of a cry, in [51], a fully automatic non-invasive system using the crying sounds of babies (expiratory and inspiratory) in different contexts was developed. The signals were collected in a natural hospital environment at different times. The results achieved a high average true positive rate of approximately 95.6% for the expiratory class and 92.47% for the inspiratory class using GMM and HMM classifiers, respectively.
In the same context, newborn cries have been correlated with negative sensations, such as hunger and discomfort [58]; on the other hand, hearing problems are related to the future development of speech disabilities [29].
Only one study [72] used voice recordings from the MEEI Voice Disorder Database. As speech is also altered when the human body is stressed, in [38], it was proposed to extract its acoustic features to predict biological signals, such as blood volume pressure and skin conductance. The conclusion was that deep representation learning using pre-trained convolutional NN is a practical approach for blood volume pressure biological prediction [38]. Therefore, the acoustic analysis of speech can be part of a complete diagnosis and prediction of overall health.
B.
Respiratory Complications
Smartphones with ML classifiers have been used to diagnose lung diseases, such as asthma and chronic obstructive pulmonary disease, by detecting forced exhalations using SVM (97% accuracy) [93] or adventitious sounds in breathing using RF (96.47% F-score) [96]. Digital devices could serve as a tool for clinicians and patients to keep track of health at home and the early detection of health complications.
In the same way, in [63], an automatic system to assist clinicians in the decision-making process was developed. The system analyzed coughs and the vocalized /A:/ sounds of asthmatic and healthy children. The MFCCs with additional constant-Q cepstral coefficients features were extracted and modeled using two separate GMM-universal background models from both sounds. The fused model with both sounds showed the best results achieved a 91.1% sensitivity and 95.0% specificity. The better performance here was attributed to the larger number of cough sounds per child.
To evaluate the cough ability using cough sound with or without a facemask, in [82], a cough flow prediction model associating cough sounds with cough flow was proposed. The amplitude and envelope were analyzed using different correlation methods. One of them showed that the correlation coefficients were 0.895 (p < 0.001; 100% power) for the in-ear mic, 0.879 (p < 0.001; 100% power) for the mini-speech mic, and 0.795 (p < 0.001; 99.9% power) for the smartphone mic. The study revealed a non-linear relationship between cough sound and cough flow.
Furthermore, a feedback system for inhaler usage has been proposed to monitor subjects with asthma and chronic obstructive pulmonary disorder [80]. This system included a micro-electro-mechanical system microphone with a microcontroller to acquire acoustic breathing signals. The extracted characteristics were the MFCC, ZCR, spectral centroid, spectral spread, and energy entropy. The acoustic parameters scored high values in classification metrics with SVM (98.5% accuracy, 100% precision, 97.8% recall, and 98.9% F1 score). Nevertheless, the sample consisted of six participants, and the recording condition was an indoor environment, without further details. The results open the opportunity for further research in health monitoring through acoustic signals related to respiratory diseases.
C.
Coronavirus Disease 2019 (COVID-19)
In 2019, the world was hit by a wave of COVID-19, and the importance of knowing its impact on the health of people and daily life gained attention rapidly. Most studies focused on finding acoustic biomarkers of COVID-19 [61,97] for its detection by means of ML algorithms [42,43,44,52,60,62,77,100]. The most recurrent mouth sounds were sustained vowel /a/ [42,43,52,59,61], cough sounds [43,44,60,77,100], and sentences [43,44,52,59,62]. Some authors reported using acoustic features, such as MFCC [42,44,52,60,61,62,77,100] or a large combination of those mentioned in Section 2.2, as inputs for NNs [42,43,52,59,61,77]. The Visual Geometry Group (97.2% accuracy) [100], Honey Badger Optimization-based Deep Neuro Fuzzy Network (91.76% accuracy) [77], convolutional NN (95% accuracy) [44], and feed-forward neural network (89.71% accuracy) [42] were the DL algorithms employed. However, studies pointed out the need for many acoustic characteristics (e.g., 512 [62]) to obtain accuracy scores above 80%. Interestingly, when using fewer characteristics, traditional ML methods, such as SVM and HMM-based algorithms reported 90.24% [52] and 93.33% [60] accuracy, respectively, suggesting the high performance of these methods under these conditions when data are limited.
Moreover, other studies focused on the intelligibility of messages when using masks, one of the main pandemic safety measures worldwide. In [53], the effects of different masks on the voice showed no significant differences in intelligibility for single words and sentences (p = 0.621 and p = 0.542, respectively). Still, the intelligibility of speakers decreased depending on the type of mask used compared with using no mask. Meanwhile, in [59], the intelligibility of sentences was measured when wearing KN95 face masks against not wearing them. This study showed better intelligibility when using the mask (mean accuracy 89.38% ± 12.39) against not using it (84.86% ± 14.84). Nevertheless, these results could be biased by the subjective perception of the speech-language pathologist who interpreted the sentences of speakers through audio calls or by the speaking effort made by the participants. It was also noted that, following strategies such as speaking clearly, louder, and slower, the intelligibility of the message improves (94.25% ± 12.87, 96.20% ± 5.26, and 92.50% ± 11.91, respectively).
D.
Neurological Disorders and Conditions
The acoustic features found in speech recordings have helped to identify symptoms of neurological disorders, such as abnormal prosody in schizophrenia [37], depression [64], cerebral palsy with dysarthria [46], early detection of ASD in children [78], ataxia [111], observation of differences between high-risk ASD and typically developing babies [94], dementia [89], multiple [70,85] and amyotrophic lateral sclerosis [48], and PD analysis under several conditions [47,65,85,92,104,108,112,115].
The features involved in the analysis of abnormal prosody in schizophrenia were mainly the formant frequencies, involving the variability in pitch given by the standard deviation of f0, intensity, and loudness [37]. The results showed reduced variability in pitch and loudness for patients with schizophrenia compared with controls by using distributional properties and descriptive statistics. This study suggested that symptoms of aprosody may be quantified by acoustical analysis.
For instance, in [78], vocalization recordings in children while reading words, sentences, and stories were used to detect ASD. A correlation-based feature-subset-selection algorithm selected paramount acoustic features out of 74. These features were demonstrated to be age- and gender-independent. Parameters. such as the root-mean-square energy, MFCC, ZCR, probability of voicing, f0, and the first-order delta coefficients, of these elements combined with visual facial attributes have achieved significant results in classifying voice features between high-risk ASD and typically developing babies. SVM was the algorithm with the best results observed in the metrics of the classifier (96.39% accuracy, 95.00% recall, 97.67% specificity, 94.59% area under the curve, and 97.44% positive predictive value) [94].
Another example refers to dementia detection. Promising results by studying pitch, overall intonation, differences between harmonics, jitter, shimmer, HNR and NHR, creakiness, and breathiness were reported in [89]. SVM with selected features by recursive feature elimination showed 100% accuracy. Features were extracted from manually transcribed conversations between neurologists and patients.
Regarding types of sclerosis, significant differences (p < 0.05) were observed in jitter, f0, shimmer, NHR, and the formal centralization ratio for the detection of multiple sclerosis [70,85]. Furthermore, linear discriminant analysis reported 88% accuracy when vowel features, such as differences between envelopes, mutual formant elements, and harmonic amplitude structure, were introduced to the classifier.
The most investigated acoustic parameters across studies concerning PD were f0, jitter, shimmer, range, and intensity [47,85,104,108]. Some studies showed significant evidence for voice anomaly detection related to PD (p < 0.05) [85,104] or 99% accuracy using SVM [47].

4.4.2. Mental Condition Monitoring

A.
Emotional Well-Being and Disorders
Regarding emotional disorders, some studies analyzed the effects in mouth sound recordings of psycho-emotional and posttraumatic stress disorders, either using ML algorithms or statistical analysis [103,126].
One study suggested using voice recordings to detect human psycho-emotional disorder through formant analysis and an improved complete ensemble empirical mode decomposition with an adaptive noise algorithm [126]. First- and second-type errors were calculated for recording sets of databases, including syllables, words, and sentences, to evaluate the effectiveness of pathology and normal voice determination. The results showed that the proposed method in the study achieved the most precise identification of the disorder when analyzing sentences, as this pathology seriously affects vocalized characteristics. The first-type error (α) was a false assignment of a normal speech signal produced by a person with an emotional disorder, and the second-type error (β) was a false assignment of the pathology to the speech signal produced by a healthy person. The results of the most precise study were α = 8.16% and β = 5.66% [126].
Another application of acoustic analysis of mouth sound recordings is in the research field of posttraumatic stress disorder [103]. It is suggested that the vocal analysis of the acoustic startle response could be a way to identify changes in vocal features with changing stimuli parameters, such as intensity, duration, rise time, and spectral type. The results were obtained from statistical analyses applied to f0, voice energy, response peaks, peak times, fall times, and duration [103]. Therefore, the analysis of acoustic features in speech recordings could be a useful way to assess the psycho-emotional states of patients, and it could possibly help to diagnose other pathologies related to emotional states.
B.
Emotion Recognition
A trend in certain aspects was observed from research articles that addressed emotion recognition [49,107,125,129]. Research studies used the discrete domain of emotions, categorizing them as anger, disgust, fear, happiness, sadness, and surprise. The most commonly extracted features were MFCC, pitch, formants, and energy. None of these studies selected the valence and arousal model, which relies on the appetitive system that seeks well-being, and the aversive system, which prevents individuals from entering dangerous situations [130,131]. Emotion recognition in the continuous dimensions of valence and arousal could serve as an initial phase of emotion recognition by classifying emotions in positive and negative (valence) sensations, and between the level of calmness and excitation (arousal) [130,131].
Just one of the research articles included an analysis of the dimensions of valence, power, and arousal in their study, using a regression for sets of acoustic components [102]. The results showed that valence was the worst predictor, while power and arousal provided 50% of the variance accounted for by the predictive sets [102]. The acoustic parameters that power and arousal had in common were formant amplitude, dynamics, and low-frequency energy. Therefore, emotion recognition in the dimensions of valence, arousal, and power could indeed be part of future analysis for emotion recognition in voice recordings.
C.
Mental Health
Regarding mental health, in [132], the voice of participants related to personality traits was analyzed. It was expected to find information linked to mental disorders, specifically alexithymia, the inability to perform or match actions with emotions. The results obtained showed a correlation between personality traits and speech features. Nevertheless, this investigation did not consider participants with any mental disorders, and considered only healthy people.
In [81], cries from newborns before feeding were recorded to study neurodevelopmental disorders. F0 and five basic melodic shapes (falling, rising, symmetrical, plateau, and complex) were analyzed. After feature extraction, parameters were introduced into an automated classification method that reached 89.5% accuracy. Further research is needed to identify a trend, because only six babies participated in the study.

4.4.3. Other Applications

A.
Sleep Disorders
Breathing sounds can be an effective method of sleep monitoring and the early diagnosis of sleep disorders. In [133], a novel audio-based algorithm was proposed to estimate the four sleep stages and attend chronic sleep disorders. The breathing and snoring sounds of a male were recorded while asleep. Extracting the periodicity, intensity, variation, and non-linearity for each audio, a decision tree was developed using the vertical box control chart to detect the breath or snore sound. The results showed an accuracy of classifying deep and light sleep of 97.8%.
In the same form, in [134], a snore-detection algorithm was developed by combining two NNs. Five microphones were placed around a bed to record the snoring of people. A combination of a convolutional NN and a recurrent NN using a constant-Q transformation spectrogram was employed. It was found that the performance of the proposed method was more related to the distance than the position of the microphones.
Some studies focused their attention on one disorder. Obstructive sleep apnea is a pervasive disorder present in patients with breathing problems, being one of the most severe diseases related to the respiratory process [68,113]. Using microphones from smartphones seemed to be the form that helped users feel less uncomfortable while sleeping. In [68], the average accuracy of apnea and hypopnea detection was 81.79%, while in [113], it reached 92% using a WB-microphone.
B.
Speech and Communication/Expression
Over time, speech has worked as a communication tool between individuals. For completing the process of receiving and understanding auditory messages, researchers have looked for different situations where it is difficult to accomplish. In [55], a novel complex method solved the cocktail party problem while analyzing images and audio from recordings. The algorithm outperformed other speech separation methods when combining information from two speakers.
The ability to produce sounds with the mouth has helped humans to express feelings through art. In [50], the acoustic and auditory short-effect of vocal warm-up in theatre actors was determined. Acoustic parameters, such as five formants F1–F5, jitter, duration, shimmer, NHR, and dynamic range, did not show noticeable differences. Still, the self-confidence of the actors improved their performance after the warm-up.
Furthermore, using applications on smart devices to encourage and record vocalization demonstrated an improvement in children. The system analyzed recordings in terms of pitch and loudness [10]. The results indicated a strong correlation between the app’s performance and assessments by human experts.
Finally, in [118], the melody of human whistling was extracted using time–frequency analysis. Their method consisted of four stages: (1) audio recording transformation into the frequency domain, (2) single-frequency value extraction, (3) conversion to a note number corresponding to a MIDI standard, and (4) MIDI file creation with identified notes. The algorithm showed promising results, with an average of 92.7% accuracy for detecting musical errors.

5. Discussion

5.1. Recording Conditions

Previous studies providing information on the processing, recording, and analysis of mouth sounds were limited in several aspects. Firstly, it was observed that some studies did not detail their recording conditions [48,57,94,105,132], pointing out the need for audio experts in these multidisciplinary teams. In [50], the influence of real environments on recorded data was mentioned, as real-life settings may have altered the quality of recordings. In [135], it was suggested that voice data must be collected in a quiet room and assessed in a controlled environment. However, this is extremely difficult for many studies due to the nature of the context, for example, recording cough sounds in a hospital with typical background noise, such as talking, ambulance sirens, and machine noises [63]. Several researchers performed experiments in noisy environments [56,83,89,118] or used non-professional audio equipment, such as cellphones or laptops [10,43,48,61,68,69,78,88,89,93,94,96,114,118], which could reduce the quality of the data obtained. Only three studies reported recording sounds in acoustically treated rooms [46,47,108]. This condition is vital, because treated rooms reduce unwanted reflections or noises in recordings that could alter the original sound, as previously mentioned. Nevertheless, it reduces pathology detection under the noisy conditions present in daily life, which indicates the need for noise-robustness algorithms.
The recording conditions and acquisition systems in studies related to neurological condition identification had some other implications. In [89], a built-in microphone from a laptop was used, which could impact the fidelity of audio recordings. The frequency responses of audio devices tend to modify the frequency content of audio signals to the point that they can distort them [136]. In future studies, smartphones with a wide and flatter frequency range should be used to acquire more spectral information about mouth sounds.
Still, obtaining suitable recording equipment could be difficult due to its cost [113]. This limitation calls for more accessible devices over which acoustic analyses can be conducted, and using smartphones as a tool for recording audios has proven to be a reliable technique. Microphone selection is crucial for quality audio recordings and, consequently, for analyzing the human voice. According to [83], the most important characteristics to consider on a microphone for voice recording are directionality, transduction, frequency response, and mouth-to-microphone distance. Additionally, iOS devices were compared against a gold-standard computer preamplification system. The results concluded that recordings from the iOS device had no statistically significant difference compared with the gold standard [83]. However, there were limitations, as only healthy subject voices were used, and only one type of iOS device was employed.
Further, the distance between microphones and lips varied across studies, ranging from 2.5–50 cm. There was no standardization of the distance, which should be further considered. Close placement of the microphone to the lips could cause the proximity effect [137], which accentuates lower frequencies, having implications when extracting acoustic features. In fact, in [82], it was affirmed that a constant distance between the mouth and the microphone is critical for improving estimation accuracy. Nonetheless, the distance to the mouth varied widely either for the comfort of the subject [65,68,70,87,89,113,114] or for the simulation of the distance between two people [53,64]. Either way, this separation distance between the mouth and microphone could significantly affect the recorded signal’s quality.
Several studies standardized the sampling rate of the voice signal to 44.1 kHz and 16-bit depth [46,47,48,70,112]. Others chose 16 kHz [52,60,62,112] and 22,050 Hz sampling rates at 16 bits [70]. The sampling frequency should be selected with caution to ensure the quality of recordings and the effective acquisition of the expected frequency range. Moreover, bit depth is related to the dynamic range of the recording. Higher bit depths allow higher sound pressure levels to be recorded. An inappropriate selection of these parameters could cause unnecessary data acquisition, signal distortion, or aliasing [138].
At present, recording tools are being improved rapidly. As a result, other audio recording strategies should be also considered for mouth sound-detection purposes. For example, a state-of-the-art tool refers to audio segmentation, which divides digital audio into frames that then are typically classified into three classes (speech recognition, music, and noise) based on deep learning [139]. Mouth sounds vary depending on the condition or problem being investigated, creating challenging tasks for researchers in the field of sound analysis [135].

5.2. Acoustic Signal Processing Techniques

In brief, time domain analysis is mainly harnessed to develop online systems, as this analysis allows the monitoring of audio signal changes in real time. On the other hand, frequency domain analysis is usually applied to characterize systems, as such analysis provides the frequency composition of the audio signal in use. However, not just stand-alone applications, as presented in Figure 5 and Figure 6, have been undertaken so far. In many other applications, the integration of both analyses is the best solution [140], where voice activity was detected accurately (100%) when time domain features (ZCR, standard deviation, normalized envelope, kurtosis, skewness, and root-mean-square energy) and frequency domain features (13 MRCCs) were combined in conjunction with SVM.
Regarding this matter, considering a combination of time domain and frequency domain features would be the best way to obtain better results in detecting voice, and they could be employed in noisier environments where is difficult to identify the presence of a voice and, therefore, a message.

5.3. Acoustic Feature Analysis

From the revised literature, it was observed that researchers used statistical tests to evaluate the relationship between acoustic features and mouth sound conditions. Tests such as the t-test, ANOVA, and correlation tests were used to describe these relationships. ML algorithms were mostly employed for pattern recognition and the detection of conditions. It is important to note that ML and DL communities are moving toward audio–visual learning [141]. As is known, most ML/DL tools were designed based on human learning and animal behaviors. For both entities, a higher number of sensory inputs (more environmental information) leads to a more accurate human/animal response. Therefore, it appears consistent that novel ML/DL strategies are moving toward generating and representing audio–visual information to achieve better performance in the recognition of speech and voice.
Regarding the sample size, several studies did not have sufficient signals to work with DL algorithms, as they require a sufficiently large amount of training data [67,113]. Despite the reduced amount of signal information, SVM was the most-used ML method, suggesting a standard and reliable method to analyze and classify mouth sounds [49,108,111,115,121,142].
In some cases, authors preferred to use databases to train and prepare classification algorithms. All studies concerning emotion recognition used recorded data from those databases, but none of the studies used the same dataset. Therefore, a direct comparison of the results might not be valid. This limitation indicates the need for standard comparison methods in acoustic signals from several databases to reasonably observe significant differences across methodologies. Variation in recording databases across studies can affect results, as mentioned in [55] regarding phonetic differences.

5.4. Applications

In addition to the wide variety of applications discussed above, the scientific community is always innovative and is making use of all of these advances to develop emerging technologies, such as brain–computer interfaces based on imaginary speech. As was mentioned before, speech occurs due to the activation of the Broca’s Area, located commonly on the frontal lobe of the left hemisphere of the brain, controlled by the nervous system. This emerging technology makes use of the nervous system’s information resulting from imaginary speech in order to reestablish communication in completely paralyzed individuals [143]. Finally, Table 2 summarizes the most important aspects identified in the literature review concerning the questions posed in Table 1.

6. Conclusions

The current work aimed to identify trends in mouth sound applications. First, the physiology and acoustic mechanisms of mouth sounds were explained. Secondly, the methodology to review research was described. Further, the most common trends and limitations were discussed. The findings of the review indicated that vowels, speech, breathing sounds, and crying were the most researched sounds across studies. The most analyzed features were ZCR, PEBF (STE, volume or loudness), and ABF (shimmer and amplitude descriptor) in the time domain; on the other hand, TBF (jitter, HNR, NHR, f0, and formants), SBF (spectral centroid, spectral roll-off, and spectral spread), and CF (MFCC, CPP, and CPPS) were the most employed features in the frequency domain. Regarding acoustic feature analysis, t-test, variations of ANOVA, and Pearson’s correlation tests were the most common statistical tests used. SVM and GMM were the most-used ML methods. NNs were employed according to data availability. The main applications of mouth sound research were physical monitoring for disease detection and mental condition monitoring to assess emotions. Nonetheless, other applications, such as communication, have shown favorable results. Finally, the lack of recording condition specifications (recording environment, signal acquisition parameters, and audio devices), sample size, and database selection indicate the need for standard procedures for mouth sound acquisition and analysis. Future research is encouraged to improve acoustic pattern interpretation of mouth sounds.

7. Future Directions

Some challenges in this topic stem from the required robustness and self-adaptation capability of analysis algorithms that operate adequately in non-controlled environments under non-professional guidance or support and must provide very high levels of sensitivity and specificity. In these contexts, we highlight the following requirements that have a decisive impact on the adoption of the technology:
Usability. Solutions must be as simple as possible to provide high usability levels. In clinical applications, patients are mainly elderly people with significant physical impairment. To avoid impacting long-term utilization, systems should be applicable without any or much-reduced assistance. Single-signal solutions usually lend themselves to realizations with higher degrees of usability.
Robustness. Solutions must operate under non-controlled environments and will be handled by non-experts. Robustness and self-adaptation/self-calibration capability will directly impact the long-term adoption of health solutions, as it will affect confidence in the system and usability. False-positive rates must be as low as possible to avoid unnecessarily alarming the user. On the other hand, false negatives must be avoided in order to not compromise confidence in the system.
Computational complexity. Solutions must be efficient in terms of computational cost to provide feedback to users in real-time and for energy efficiency reasons.
Energy efficiency. Health systems must be energy-efficient to avoid frequent battery charges, which would affect the usability of the system. Single-channel solutions usually significantly impact the required hardware and local processing, lending themselves to more straightforward and energy-efficient realizations.
From the above indicators, it becomes clear that existing methods do not adequately meet these requirements; therefore, further research is necessary.

Author Contributions

Conceptualization, N.E.N.-R., L.M.A.-V. and D.I.I.-Z.; methodology, N.E.N.-R. and E.A.G.-R.; formal analysis, N.E.N.-R., E.A.G.-R., G.N.-R., R.R.-D.L. and A.S.; investigation, N.E.N.-R., E.A.G.-R., G.N.-R., R.R.-D.L. and A.S.; writing—original draft preparation, N.E.N.-R., E.A.G.-R., G.N.-R., R.R.-D.L. and A.S.; writing—review and editing, L.M.A.-V. and D.I.I.-Z.; visualization, N.E.N.-R., E.A.G.-R. and G.N.-R.; supervision, L.M.A.-V. and D.I.I.-Z.; project administration, N.E.N.-R. and E.A.G.-R. All authors have read and agreed to the published version of the manuscript.

Funding

This work was supported by Tecnologico de Monterrey and CONACyT (CVU: 963990).

Institutional Review Board Statement

Not applicable.

Informed Consent Statement

Not applicable.

Data Availability Statement

Data sharing not applicable.

Acknowledgments

Thanks to Jose Alfredo Gonzalez-Perez for the artwork of Figure 1.

Conflicts of Interest

The authors declare no conflict of interest.

Appendix A. Time-Domain Feature Definitions

Table A1. Definitions of different time features mentioned in the studies.
FeaturesDefinition
Power/Energy-Based Features (PEBF)
Volume or LoudnessIt is used in the discrimination and segmentation of speech signals [144], and it is calculated as the root-mean-square (RMS) of the amplitude in a waveform for each time frame [34].
Amplitude-Based Features (ABF)
ShimmerBased on the waveform, shimmer computes the cycle-to-cycle differences in the amplitude [35]. It is used to discriminate between vocal and non-vocal sound regions [144] and in the recognition and verification of speakers [34].
Amplitude descriptorThis feature allows differentiating between diverse envelopes, focusing on collecting the energy, length, and duration [34,144]
Linear Predictive CodingIt intends to model human speech by considering the formants of the vocal tract [145]. It intends to predict future values with previous information [34].
Maximum Phonation TimeIt estimates the longest period one person can sustain the phonation of a vowel sound [146] and it is used to estimate vocal function.
Speech Intensity ProminenceIt is used to estimate the overall loss of speech–sound intensity or attenuation effect. It is calculated by subtracting the floor intensity from the average intensity [53].

Appendix B. Frequency-Domain Feature Definitions

Table A2. Definitions of the frequency features present in the majority of studies.
FeaturesDefinition
Tonality-Based Features (TBF)
JitterIt computes f0 variations [35] and reflects the periodicity of vocal fold vibration [144]. It helps to analyze pathological voices and determine vocal and non-vocal sounds [34,144].
Harmonic-to-Noise Ratio (HNR)It is a measure reflecting the amount of additive noise in a voice signal [144], and it is computed as the ratio between the harmonic part to the rest of the signal. It is used to analyze pathological voices [34].
Noise-to-Harmonic Ratio (NHR)It is the inverse of HNR and refers to the ratio of noise to the harmonic energy of a signal [147].
Fundamental
frequency (f0) or pitch
In simple terms, f0, also denoted as pitch, is the lowest frequency of a waveform [34] and is calculated by evaluating the periodicity of it in the time domain [144].
FormantsFormants are resonances produced by the vocal tract. Formants can be seen as peaks in the spectrum signal and are usually significant in the pronunciation of vowels [35].
Spectral-Based Features (SBF)
Spectral centroid or spectral brightness.It is defined as the center of ‘gravity’ of the spectrum [32], describing the brightness of a sound, and helps to measure timbre [34]. Moreover, it has a relation with the subjective intensity perception of a sound.
Spectral roll-offIt is the frequency below which the spectral magnitude is concentrated at 85% [144], 90% [32], and 95% [34] of the maximum spectral magnitude. Spectral roll-off is used in speech classification [34] and discriminates between voiced and unvoiced sounds [32].
Spectral spreadThis feature is closely related to the bandwidth of the signal [34] and measures how the spectrum is distributed around its centroid [32]. Generally, it is narrow for speech sounds [34].
Spectrum envelopeIt is a feature obtained with the log-frequency power spectrum, used chiefly in music genre classification [34].
Spectral fluxIt measures the change in the spectral content over time [32] by the frame-to-frame difference in the spectral amplitude [34].
Spectral kurtosisIt is related to the flatness of the signal around the mean value; it has been used in Parkinson’s disease (PD) detection [34].
EntropyIt measures the flatness of a signal; it is used in automatic speech recognition [34].
Cepstral Features (CF)
Linear prediction cepstral
coefficients
Derived directly from linear predictive coding, it uses the recursion technique, rather than applying inverse Fourier transformation of the logarithms of the spectrum of the original signal [148]. It is used to capture emotion-specific information manifested through vocal tract features.
Cepstral Peak Prominence (CPP)CPP measures the amplitude of the cepstral peak normalized to the overall amplitude. Having a higher CPP would imply a less periodic signal [149].
Cepstral Peak Prominence-Smoothed (CPPS)CPPS is similar to CPP, but uses different algorithms because it smooths the cepstral feature before extracting the peak [150].
Linear Frequency Cepstral
Coefficients (LFCC)
LFCC is similar to MFCC, but the difference is found in the filter bank, as the coefficients of this filter are distributed with the same size throughout all the frequencies and have the same importance; in contrast, MFCC put more emphasis on low frequencies [151].
Rasta-PLPIt is used in speech recognition to reduce noise variations [34].
Teager energy cepstral
coefficient
It is similar to MFCC—the difference is that MFCC uses the standard energy instead of the non-linear Teager energy that is used for this feature [152].
Teager energy-based Mel-frequency cepstral coefficient.It is a feature used for speech recognition when there are high noise levels. It uses the Teager energy, warping it to the MFCC [153].

References

  1. Tortora, G.J.; Derrickson, B. Principles of Anatomy & Physiology; John Wiley and Sons: Hoboken, NJ, USA, 2017; ISBN 9781119320647. [Google Scholar]
  2. Woodson, G.E. Laryngeal and Pharyngeal Function, 7th ed.; Elsevier Inc.: Amsterdam, The Netherlands, 2010. [Google Scholar]
  3. Wang, X.; Jiang, W.; Zheng, X.; Xue, Q. A computational study of the effects of vocal fold stiffness parameters on voice production. J. Voice 2021, 35, 327.e1–327.e11. [Google Scholar] [CrossRef] [PubMed]
  4. Giovanni, A.; Ghio, A.; Mattei, A. Estudio clínico de la fonación. EMC Otorrinolaringol. 2021, 50, 1–16. [Google Scholar] [CrossRef]
  5. Hirano, M. Vocal mechanisms in singing: Laryngological and phoniatric aspects. J. Voice 1988, 2, 51–69. [Google Scholar] [CrossRef]
  6. Blythe, S.G. Appendix 2: Frequency Range of Vocals and Musical Instruments. In Attention, Balance and Coordination: The A.B.C. of Learning Success; John Wiley and Sons Inc.: Hoboken, NJ, USA, 2017; ISBN 9781119964148. [Google Scholar]
  7. Lewis, A.; Philip, K.E.J.; Lound, A.; Cave, P.; Russell, J.; Hopkinson, N.S. The physiology of singing and implications for ‘Singing for Lung Health’ as a therapy for individuals with chronic obstructive pulmonary disease. BMJ Open Respir. Res. 2021, 8, e000996. [Google Scholar] [CrossRef] [PubMed]
  8. Rvachew, S.; Alhaidary, A. The Phonetics of Babbling. In Oxford Research Encyclopedia of Linguistics; Oxford University Press: Oxford, UK, 2018. [Google Scholar]
  9. Bedford, R.; Saez de Urabain, I.R.; Cheung, C.H.M.; Karmiloff-Smith, A.; Smith, T.J. Toddlers’ Fine Motor Milestone Achievement Is Associated with Early Touchscreen Scrolling. Front. Psychol. 2016, 7, 1108. [Google Scholar] [CrossRef] [Green Version]
  10. Daffern, H.; Keren-Portnoy, T.; DePaolis, R.A.; Brown, K.I. BabblePlay: An app for infants, controlled by infants, to improve early language outcomes. Appl. Acoust. 2020, 162, 107183. [Google Scholar] [CrossRef] [PubMed]
  11. Meyer, J. Whistle Production and Physics of the Signal. In Whistled Languages; Springer: Berlin/Heidelberg, Germany, 2015; pp. 69–90. [Google Scholar]
  12. Azola, A.; Palmer, J.; Mulheren, R.; Hofer, R.; Fischmeister, F.; Fitch, W.T. The physiology of oral whistling: A combined radiographic and MRI analysis. J. Appl. Physiol. 2018, 124, 34–39. [Google Scholar] [CrossRef] [Green Version]
  13. Aloui, S.; Khirani, S.; Ramirez, A.; Colella, M.; Louis, B.; Amaddeo, A.; Fauroux, B. Whistle and cough pressures in children with neuromuscular disorders. Respir. Med. 2016, 113, 28–36. [Google Scholar] [CrossRef] [Green Version]
  14. Ball, M.; Hossain, M.; Padalia, D. Anatomy, Airway; StatPearls: Treasure Island, FL, USA, 2022. [Google Scholar]
  15. Sarkar, M.; Madabhavi, I.; Niranjan, N.; Dogra, M. Auscultation of the respiratory system. Ann. Thorac. Med. 2015, 10, 158. [Google Scholar] [CrossRef]
  16. Forgacs, P.; Nathoo, A.R.; Richardson, H.D. Breath sounds. Thorax 1971, 26, 288–295. [Google Scholar] [CrossRef] [Green Version]
  17. Andrani, F.; Aiello, M.; Bertorelli, G.; Crisafulli, E.; Chetta, A. Cough, a vital reflex. mechanisms, determinants and measurements. Acta Biomed. 2019, 89, 477–480. [Google Scholar] [CrossRef] [PubMed]
  18. Sykes, D.L.; Morice, A.H. The Cough Reflex: The Janus of Respiratory Medicine. Front. Physiol. 2021, 12, 684080. [Google Scholar] [CrossRef] [PubMed]
  19. Chung, K.F.; Widdicombe, J.G.; Boushey, H.A. (Eds.) Cough: Causes, Mechanisms and Therapy; Wiley: Hoboken, NJ, USA, 2003; ISBN 9781405116343. [Google Scholar]
  20. Korpáš, J.; Sadloňová, J.; Vrabec, M. Analysis of the Cough Sound: An Overview. Pulm. Pharmacol. 1996, 9, 261–268. [Google Scholar] [CrossRef] [PubMed]
  21. Jadcherla, S.R.; Hasenstab, K.A.; Shaker, R.; Castile, R.G. Mechanisms of cough provocation and cough resolution in neonates with bronchopulmonary dysplasia. Pediatr. Res. 2015, 78, 462–469. [Google Scholar] [CrossRef] [PubMed] [Green Version]
  22. Korpas, J.; Vrabec, M.; Sadlonova, J.; Salat, D.; Debreczeni, L.A. Analysis of the cough sound frequency in adults and children with bronchial asthma. Acta Physiol. Hung. 2003, 90, 27–34. [Google Scholar] [CrossRef] [PubMed]
  23. Pevernagie, D.; Aarts, R.M.; De Meyer, M. The acoustics of snoring. Sleep Med. Rev. 2010, 14, 131–144. [Google Scholar] [CrossRef]
  24. Alencar, A.M.; da Silva, D.G.V.; Oliveira, C.B.; Vieira, A.P.; Moriya, H.T.; Lorenzi-Filho, G. Dynamics of snoring sounds and its connection with obstructive sleep apnea. Phys. A Stat. Mech. Appl. 2013, 392, 271–277. [Google Scholar] [CrossRef] [Green Version]
  25. Gračanin, A.; Bylsma, L.M.; Vingerhoets, A.J.J.M. Is crying a self-soothing behavior? Front. Psychol. 2014, 5, 502. [Google Scholar] [CrossRef] [Green Version]
  26. Rothgänger, H. Analysis of the sounds of the child in the first year of age and a comparison to the language. Early Hum. Dev. 2003, 75, 55–69. [Google Scholar] [CrossRef]
  27. Shinya, Y.; Kawai, M.; Niwa, F.; Imafuku, M.; Myowa, M. Fundamental frequency variation of neonatal spontaneous crying predicts language acquisition in preterm and term infants. Front. Psychol. 2017, 8, 2195. [Google Scholar] [CrossRef] [Green Version]
  28. Gabrieli, G.; Scapin, G.; Bornstein, M.; Esposito, G. Are Cry Studies Replicable? An Analysis of Participants, Procedures, and Methods Adopted and Reported in Studies of Infant Cries. Acoustics 2019, 1, 866–883. [Google Scholar] [CrossRef] [Green Version]
  29. Mahmoudian, S.; Aminrasouli, N.; Ahmadi, Z.Z.; Lenarz, T.; Farhadi, M. Acoustic Analysis of Crying Signal in Infants with Disabling Hearing Impairment. J. Voice 2019, 33, 946.e7–946.e13. [Google Scholar] [CrossRef] [PubMed] [Green Version]
  30. Ballou, G. Handbook for Sound Engineers, 5th ed.; Focal Press: Waltham, MA, USA, 2015; ISBN 978-0-203-75828-1. [Google Scholar]
  31. Duville, M.M.; Alonso-Valerdi, L.M.; Ibarra-Zarate, D.I. Electroencephalographic Correlate of Mexican Spanish Emotional Speech Processing in Autism Spectrum Disorder: To a Social Story and Robot-Based Intervention. Front. Hum. Neurosci. 2021, 15, 626146. [Google Scholar] [CrossRef] [PubMed]
  32. Giannakopoulos, T.; Pikrakis, A. Audio Features. In Introduction to Audio Analysis; Elsevier: Amsterdam, The Netherlands, 2014; pp. 59–103. [Google Scholar]
  33. Lee, J.; Ali, H.; Ziaei, A.; Tobey, E.A.; Hansen, J.H.L. The Lombard effect observed in speech produced by cochlear implant users in noisy environments: A naturalistic study. J. Acoust. Soc. Am. 2017, 141, 2788–2799. [Google Scholar] [CrossRef] [PubMed] [Green Version]
  34. Sharma, G.; Umapathy, K.; Krishnan, S. Trends in audio signal feature extraction methods. Appl. Acoust. 2020, 158, 107020. [Google Scholar] [CrossRef]
  35. Abhang, P.A.; Gawali, B.W.; Mehrotra, S.C. Introduction to EEG- and Speech-Based Emotion Recognition; Elsevier: Amsterdam, The Netherlands, 2016; ISBN 9780128045312. [Google Scholar]
  36. Kumar, P.; Biswas, A.; Mishra, A.N.; Chandra, M. Spoken Language Identification Using Hybrid Feature Extraction Methods. arXiv 2010, arXiv:1003.5623. [Google Scholar]
  37. Compton, M.T.; Lunden, A.; Cleary, S.D.; Pauselli, L.; Alolayan, Y.; Halpern, B.; Broussard, B.; Crisafio, A.; Capulong, L.; Balducci, P.M.; et al. The aprosody of schizophrenia: Computationally derived acoustic phonetic underpinnings of monotone speech. Schizophr. Res. 2018, 197, 392–399. [Google Scholar] [CrossRef]
  38. Baird, A.; Amiriparian, S.; Berschneider, M.; Schmitt, M.; Schuller, B. Predicting Biological Signals from Speech: Introducing a Novel Multimodal Dataset and Results. In Proceedings of the 2019 IEEE 21st International Workshop on Multimedia Signal Processing (MMSP), Kuala Lumpur, Malaysia, 27–29 September 2019; IEEE: New York, NY, USA, 2019; Volume 3346632, pp. 1–5. [Google Scholar]
  39. Krecichwost, M.; Mocko, N.; Badura, P. Automated detection of sigmatism using deep learning applied to multichannel speech signal. Biomed. Signal Process. Control 2021, 68, 102612. [Google Scholar] [CrossRef]
  40. Liao, S.; Song, C.; Wang, X.; Wang, Y. A classification framework for identifying bronchitis and pneumonia in children based on a small-scale cough sounds dataset. PLoS ONE 2022, 17, e0275479. [Google Scholar] [CrossRef]
  41. Tracey, B.; Patel, S.; Zhang, Y.; Chappie, K.; Volfson, D.; Parisi, F.; Adans-Dester, C.; Bertacchi, F.; Bonato, P.; Wacnik, P. Voice Biomarkers of Recovery From Acute Respiratory Illness. IEEE J. Biomed. Health Inform. 2022, 26, 2787–2795. [Google Scholar] [CrossRef]
  42. Vahedian-azimi, A.; Keramatfar, A.; Asiaee, M.; Atashi, S.S.; Nourbakhsh, M. Do you have COVID-19? An artificial intelligence-based screening tool for COVID-19 using acoustic parameters. J. Acoust. Soc. Am. 2021, 150, 1945–1953. [Google Scholar] [CrossRef] [PubMed]
  43. Despotovic, V.; Ismael, M.; Cornil, M.; Call, R.M.; Fagherazzi, G. Detection of COVID-19 from voice, cough and breathing patterns: Dataset and preliminary results. Comput. Biol. Med. 2021, 138, 104944. [Google Scholar] [CrossRef] [PubMed]
  44. Costantini, G.; Cesarini, V.; Robotti, C.; Benazzo, M.; Pietrantonio, F.; Di Girolamo, S.; Pisani, A.; Canzi, P.; Mauramati, S.; Bertino, G.; et al. Deep learning and machine learning-based voice analysis for the detection of COVID-19: A proposal and comparison of architectures. Knowl. Based Syst. 2022, 253, 109539. [Google Scholar] [CrossRef] [PubMed]
  45. Suppa, A.; Asci, F.; Saggio, G.; Marsili, L.; Casali, D.; Zarezadeh, Z.; Ruoppolo, G.; Berardelli, A.; Costantini, G. Voice analysis in adductor spasmodic dysphonia: Objective diagnosis and response to botulinum toxin. Park. Relat. Disord. 2020, 73, 23–30. [Google Scholar] [CrossRef] [PubMed]
  46. Mou, Z.; Teng, W.; Ouyang, H.; Chen, Y.; Liu, Y.; Jiang, C.; Zhang, J.; Chen, Z. Quantitative analysis of vowel production in cerebral palsy children with dysarthria. J. Clin. Neurosci. 2019, 66, 77–82. [Google Scholar] [CrossRef]
  47. Thies, T.; Mücke, D.; Lowit, A.; Kalbe, E.; Steffen, J.; Barbe, M.T. Prominence marking in parkinsonian speech and its correlation with motor performance and cognitive abilities. Neuropsychologia 2020, 137, 107306. [Google Scholar] [CrossRef]
  48. Vashkevich, M.; Azarov, E.; Petrovsky, A.; Rushkevich, Y. Features extraction for the automatic detection of ALS disease from acoustic speech signals. In Proceedings of the 2018 Signal Processing: Algorithms, Architectures, Arrangements, and Applications (SPA), Poznan, Poland, 19–21 September 2018; pp. 321–326. [Google Scholar] [CrossRef]
  49. Jing, S.; Mao, X.; Chen, L. Prominence features: Effective emotional features for speech emotion recognition. Digit. Signal Process. Rev. J. 2018, 72, 216–231. [Google Scholar] [CrossRef]
  50. Di Natale, V.; Cantarella, G.; Manfredi, C.; Ciabatta, A.; Bacherini, C.; DeJonckere, P.H. Semioccluded Vocal Tract Exercises Improve Self-Perceived Voice Quality in Healthy Actors. J. Voice 2020, 36, 584.e7–584.e14. [Google Scholar] [CrossRef]
  51. Abou-Abbas, L.; Tadj, C.; Fersaie, H.A. A fully automated approach for baby cry signal segmentation and boundary detection of expiratory and inspiratory episodes. J. Acoust. Soc. Am. 2017, 142, 1318–1331. [Google Scholar] [CrossRef] [Green Version]
  52. Robotti, C.; Costantini, G.; Saggio, G.; Cesarini, V.; Calastri, A.; Maiorano, E.; Piloni, D.; Perrone, T.; Sabatini, U.; Ferretti, V.V.; et al. Machine Learning-based Voice Assessment for the Detection of Positive and Recovered COVID-19 Patients. J. Voice 2021. [Google Scholar] [CrossRef]
  53. Magee, M.; Lewis, C.; Noffs, G.; Reece, H.; Chan, J.C.S.; Zaga, C.J.; Paynter, C.; Birchall, O.; Rojas Azocar, S.; Ediriweera, A.; et al. Effects of face masks on acoustic analysis and speech perception: Implications for peri-pandemic protocols. J. Acoust. Soc. Am. 2020, 148, 3562–3568. [Google Scholar] [CrossRef] [PubMed]
  54. McLoughlin, I.V.; Perrotin, O.; Sharifzadeh, H.; Allen, J.; Song, Y. Automated Assessment of Glottal Dysfunction Through Unified Acoustic Voice Analysis. J. Voice 2020, 36, 743–754. [Google Scholar] [CrossRef]
  55. Lu, R.; Duan, Z.; Zhang, C. Audio-Visual Deep Clustering for Speech Separation. IEEE/ACM Trans. Audio Speech Lang. Process. 2019, 27, 1697–1712. [Google Scholar] [CrossRef]
  56. Yerigeri, V.V.; Ragha, L.K. Speech stress recognition using semi-eager learning. Cogn. Syst. Res. 2021, 65, 79–97. [Google Scholar] [CrossRef]
  57. González Hautamäki, R.; Sahidullah, M.; Hautamäki, V.; Kinnunen, T. Acoustical and perceptual study of voice disguise by age modification in speaker verification. Speech Commun. 2017, 95, 1–15. [Google Scholar] [CrossRef]
  58. Hariharan, M.; Sindhu, R.; Vijean, V.; Yazid, H.; Nadarajaw, T.; Yaacob, S.; Polat, K. Improved binary dragonfly optimization algorithm and wavelet packet based non-linear features for infant cry classification. Comput. Methods Programs Biomed. 2018, 155, 39–51. [Google Scholar] [CrossRef] [PubMed]
  59. Gutz, S.E.; Rowe, H.P.; Tilton-Bolowsky, V.E.; Green, J.R. Speaking with a KN95 face mask: A within-subjects study on speaker adaptation and strategies to improve intelligibility. Cogn. Res. Princ. Implic. 2022, 7, 73. [Google Scholar] [CrossRef]
  60. Zealouk, O.; Satori, H.; Hamidi, M.; Laaidi, N.; Salek, A.; Satori, K. Analysis of COVID-19 Resulting Cough Using Formants and Automatic Speech Recognition System. J. Voice 2021. [Google Scholar] [CrossRef]
  61. Bartl-Pokorny, K.D.; Pokorny, F.B.; Batliner, A.; Amiriparian, S.; Semertzidou, A.; Eyben, F.; Kramer, E.; Schmidt, F.; Schönweiler, R.; Wehler, M.; et al. The voice of COVID-19: Acoustic correlates of infection in sustained vowels. J. Acoust. Soc. Am. 2021, 149, 4377–4383. [Google Scholar] [CrossRef]
  62. Maor, E.; Tsur, N.; Barkai, G.; Meister, I.; Makmel, S.; Friedman, E.; Aronovich, D.; Mevorach, D.; Lerman, A.; Zimlichman, E.; et al. Noninvasive Vocal Biomarker is Associated With Severe Acute Respiratory Syndrome Coronavirus 2 Infection. Mayo Clin. Proc. Innov. Qual. Outcomes 2021, 5, 654–662. [Google Scholar] [CrossRef]
  63. Balamurali, B.T.; Hee, H.I.; Teoh, O.H.; Lee, K.P.; Kapoor, S.; Herremans, D.; Chen, J.-M. Asthmatic versus healthy child classification based on cough and vocalised /ɑ:/ sounds. J. Acoust. Soc. Am. 2020, 148, EL253–EL259. [Google Scholar] [CrossRef]
  64. Chen, H.; Lin, Y.; Li, Y.; Wang, W.; Wang, P.; Lei, Y. Hybrid Feature Embedded Sparse Stacked Autoencoder and Manifold Dimensionality Reduction Ensemble for Mental Health Speech Recognition. IEEE Access 2021, 9, 28729–28741. [Google Scholar] [CrossRef]
  65. Jeancolas, L.; Benali, H.; Benkelfat, B.E.; Mangone, G.; Corvol, J.C.; Vidailhet, M.; Lehericy, S.; Petrovska-Delacretaz, D. Automatic detection of early stages of Parkinson’s disease through acoustic voice analysis with mel-frequency cepstral coefficients. In Proceedings of the 2017 International Conference on Advanced Technologies for Signal and Image Processing (ATSIP), Fez, Morocco, 22–24 May 2017. [Google Scholar] [CrossRef]
  66. Chong, A.J.; Risdal, M.; Aly, A.; Zymet, J.; Keating, P. Effects of consonantal constrictions on voice quality. J. Acoust. Soc. Am. 2020, 148, EL65–EL71. [Google Scholar] [CrossRef] [PubMed]
  67. Korvel, G.; Treigys, P.; Kostek, B. Highlighting interlanguage phoneme differences based on similarity matrices and convolutional neural network. J. Acoust. Soc. Am. 2021, 149, 508–523. [Google Scholar] [CrossRef] [PubMed]
  68. Castillo-Escario, Y.; Ferrer-Lluis, I.; Montserrat, J.M.; Jane, R. Entropy analysis of acoustic signals recorded with a smartphone for detecting apneas and hypopneas: A comparison with a commercial system for home sleep apnea diagnosis. IEEE Access 2019, 7, 128224–128241. [Google Scholar] [CrossRef]
  69. Cesari, U.; De Pietro, G.; Marciano, E.; Niri, C.; Sannino, G.; Verde, L. A new database of healthy and pathological voices. Comput. Electr. Eng. 2018, 68, 310–321. [Google Scholar] [CrossRef]
  70. Vizza, P.; Mirarchi, D.; Tradigo, G.; Redavide, M.; Bossio, R.B.; Veltri, P. Vocal signal analysis in patients affected by Multiple Sclerosis. Procedia Comput. Sci. 2017, 108, 1205–1214. [Google Scholar] [CrossRef]
  71. Oshana, R. Overview of Digital Signal Processing Algorithms. In DSP Software Development Techniques for Embedded and Real-Time Systems; Newnes: Burlington, MA, USA, 2006; pp. 59–121. [Google Scholar] [CrossRef]
  72. Fang, S.H.; Tsao, Y.; Hsiao, M.J.; Chen, J.Y.; Lai, Y.H.; Lin, F.C.; Wang, C. Te Detection of Pathological Voice Using Cepstrum Vectors: A Deep Learning Approach. J. Voice 2019, 33, 634–641. [Google Scholar] [CrossRef]
  73. Sampaio, M.C.; Bohlender, J.E.; Brockmann-Bauser, M. Fundamental Frequency and Intensity Effects on Cepstral Measures in Vowels from Connected Speech of Speakers with Voice Disorders. J. Voice 2019, 35, 422–431. [Google Scholar] [CrossRef]
  74. Selamtzis, A.; Castellana, A.; Salvi, G.; Carullo, A.; Astolfi, A. Effect of vowel context in cepstral and entropy analysis of pathological voices. Biomed. Signal Process. Control 2019, 47, 350–357. [Google Scholar] [CrossRef] [Green Version]
  75. Phadke, K.V.; Laukkanen, A.M.; Ilomäki, I.; Kankare, E.; Geneid, A.; Švec, J.G. Cepstral and Perceptual Investigations in Female Teachers With Functionally Healthy Voice. J. Voice 2018, 34, 485.e33–485.e43. [Google Scholar] [CrossRef] [PubMed]
  76. Aichinger, P.; Hagmuller, M.; Schneider-Stickler, B.; Schoentgen, J.; Pernkopf, F. Tracking of Multiple Fundamental Frequencies in Diplophonic Voices. IEEE/ACM Trans. Audio Speech Lang. Process. 2018, 26, 330–341. [Google Scholar] [CrossRef]
  77. Dar, J.A.; Srivastava, K.K.; Ahmed Lone, S. Design and development of hybrid optimization enabled deep learning model for COVID-19 detection with comparative analysis with DCNN, BIAT-GRU, XGBoost. Comput. Biol. Med. 2022, 150, 106123. [Google Scholar] [CrossRef] [PubMed]
  78. Gong, Y.; Yatawatte, H.; Poellabauer, C.; Schneider, S.; Latham, S. Automatic Autism Spectrum Disorder Detection Using Everyday Vocalizations Captured by Smart Devices. In Proceedings of the 2018 ACM International Conference on Bioinformatics, Computational Biology, and Health Informatics, Washington, DC, USA, 29 August–1 September 2018; pp. 465–473. [Google Scholar] [CrossRef]
  79. Al-nasheri, A.; Muhammad, G.; Alsulaiman, M.; Ali, Z. Investigation of Voice Pathology Detection and Classification on Different Frequency Regions Using Correlation Functions. J. Voice 2017, 31, 3–15. [Google Scholar] [CrossRef]
  80. Xie, W.; Gaydecki, P.; Caress, A.L. An Inhaler Tracking System Based on Acoustic Analysis: Hardware and Software. IEEE Trans. Instrum. Meas. 2019, 68, 4472–4480. [Google Scholar] [CrossRef] [Green Version]
  81. Manfredi, C.; Bandini, A.; Melino, D.; Viellevoye, R.; Kalenga, M.; Orlandi, S. Automated detection and classification of basic shapes of newborn cry melody. Biomed. Signal Process. Control 2018, 45, 174–181. [Google Scholar] [CrossRef]
  82. Umayahara, Y.; Soh, Z.; Sekikawa, K.; Kawae, T.; Otsuka, A.; Tsuji, T. Estimation of cough peak flow using cough sounds. Sensors 2018, 18, 2381. [Google Scholar] [CrossRef] [Green Version]
  83. Oliveira, G.; Fava, G.; Baglione, M.; Pimpinella, M. Mobile Digital Recording: Adequacy of the iRig and iOS Device for Acoustic and Perceptual Analysis of Normal Voice. J. Voice 2017, 31, 236–242. [Google Scholar] [CrossRef]
  84. Madill, C.; Nguyen, D.D. Impact of Instructed Laryngeal Manipulation on Acoustic Measures of Voice–Preliminary Results. J. Voice 2020, 37, 143.e1–143.e11. [Google Scholar] [CrossRef]
  85. Vizza, P.; Tradigo, G.; Mirarchi, D.; Bossio, R.B.; Lombardo, N.; Arabia, G.; Quattrone, A.; Veltri, P. Methodologies of speech analysis for neurodegenerative diseases evaluation. Int. J. Med. Inform. 2019, 122, 45–54. [Google Scholar] [CrossRef]
  86. Flego, S. Estimating vocal tract length by minimizing non-uniformity of cross-sectional area. Proc. Meet. Acoust. 2019, 35, 060003. [Google Scholar] [CrossRef]
  87. Grinstein-Koren, O.; Herzog, N.; Amir, O. Hyposalivation Affecting Womens’ Voice. J. Voice 2021. [Google Scholar] [CrossRef] [PubMed]
  88. Koo, S.K.; Kwon, S.B.; Koh, T.K.; Ji, C.L.; Park, G.H.; Lee, H.B. Acoustic analyses of snoring sounds using a smartphone in patients undergoing septoplasty and turbinoplasty. Eur. Arch. Oto-Rhino-Laryngol. 2021, 278, 257–263. [Google Scholar] [CrossRef] [PubMed]
  89. Mirheidari, B.; Blackburn, D.; Walker, T.; Reuber, M.; Christensen, H. Dementia detection using automatic analysis of conversations. Comput. Speech Lang. 2019, 53, 65–79. [Google Scholar] [CrossRef] [Green Version]
  90. Alghamdi, N.; Maddock, S.; Marxer, R.; Barker, J.; Brown, G.J. A corpus of audio-visual Lombard speech with frontal and profile views. J. Acoust. Soc. Am. 2018, 143, EL523–EL529. [Google Scholar] [CrossRef] [PubMed] [Green Version]
  91. Pangputt, P.; Parr, B.; Demidenko, S.; Drain, A. Real-time acoustic analysis for flow rate estimation in a medical aerosol application. In Proceedings of the 2018 IEEE International Instrumentation and Measurement Technology Conference (I2MTC), Houston, TX, USA, 14–17 May 2018; IEEE: New York, NY, USA, 2018; pp. 1–6. [Google Scholar]
  92. Karlsson, F.; Schalling, E.; Laakso, K.; Johansson, K.; Hartelius, L. Assessment of speech impairment in patients with Parkinson’s disease from acoustic quantifications of oral diadochokinetic sequences. J. Acoust. Soc. Am. 2020, 147, 839–851. [Google Scholar] [CrossRef] [Green Version]
  93. Rahman, M.M.; Ahmed, T.; Nemati, E.; Nathan, V.; Vatanparvar, K.; Blackstock, E.; Kuang, J. ExhaleSense: Detecting High Fidelity Forced Exhalations to Estimate Lung Obstruction on Smartphones. In Proceedings of the 2020 IEEE International Conference on Pervasive Computing and Communications (PerCom), Austin, TX, USA, 23–27 March 2020; IEEE: New York, NY, USA, 2020; pp. 1–10. [Google Scholar]
  94. Tang, C.; Zheng, W.; Zong, Y.; Qiu, N.; Lu, C.; Zhang, X.; Ke, X.; Guan, C. Automatic identification of high-risk autism spectrum disorder: A feasibility study using video and audio data under the still-face paradigm. IEEE Trans. Neural Syst. Rehabil. Eng. 2020, 28, 2401–2410. [Google Scholar] [CrossRef]
  95. Fujimura, S.; Kojima, T.; Okanoue, Y.; Kagoshima, H.; Taguchi, A.; Shoji, K.; Inoue, M.; Hori, R. Real-Time Acoustic Voice Analysis Using a Handheld Device Running Android Operating System. J. Voice 2020, 34, 823–829. [Google Scholar] [CrossRef]
  96. Azam, M.A.; Shahzadi, A.; Khalid, A.; Anwar, S.M.; Naeem, U. Smartphone Based Human Breath Analysis from Respiratory Sounds. In Proceedings of the 2018 40th Annual International Conference of the IEEE Engineering in Medicine and Biology Society (EMBC), Honolulu, HI, USA, 18–21 July 2018; IEEE: New York, NY, USA, 2018; pp. 445–448. [Google Scholar]
  97. Asiaee, M.; Vahedian-azimi, A.; Atashi, S.S.; Keramatfar, A.; Nourbakhsh, M. Voice Quality Evaluation in Patients With COVID-19: An Acoustic Analysis. J. Voice 2022, 36, 879.e13–879.e19. [Google Scholar] [CrossRef]
  98. Shang, W.; Stevenson, M. Detection of speech playback attacks using robust harmonic trajectories. Comput. Speech Lang. 2021, 65, 101133. [Google Scholar] [CrossRef]
  99. Allwood, G.; Du, X.; Webberley, K.M.; Osseiran, A.; Marshall, B.J. Advances in Acoustic Signal Processing Techniques for Enhanced Bowel Sound Analysis. IEEE Rev. Biomed. Eng. 2019, 12, 240–253. [Google Scholar] [CrossRef] [PubMed]
  100. Lee, G.-T.; Nam, H.; Kim, S.-H.; Choi, S.-M.; Kim, Y.; Park, Y.-H. Deep learning based cough detection camera using enhanced features. Expert Syst. Appl. 2022, 206, 117811. [Google Scholar] [CrossRef] [PubMed]
  101. Krecichwost, M.; Miodonska, Z.; Badura, P.; Trzaskalik, J.; Mocko, N. Multi-channel acoustic analysis of phoneme /s/ mispronunciation for lateral sigmatism detection. Biocybern. Biomed. Eng. 2019, 39, 246–255. [Google Scholar] [CrossRef]
  102. Scherer, K.R.; Sundberg, J.; Fantini, B.; Trznadel, S.; Eyben, F. The expression of emotion in the singing voice: Acoustic patterns in vocal performance. J. Acoust. Soc. Am. 2017, 142, 1805–1815. [Google Scholar] [CrossRef] [PubMed] [Green Version]
  103. Dropuljic, B.; Mijic, I.; Petrinovic, D.; Jovanovic, T.; Cosic, K. Vocal Analysis of Acoustic Startle Responses. IEEE/ACM Trans. Audio, Speech, Lang. Process. 2018, 26, 318–329. [Google Scholar] [CrossRef]
  104. Sun, Y.; Ng, M.L.; Lian, C.; Wang, L.; Yang, F.; Yan, N. Acoustic and kinematic examination of dysarthria in Cantonese patients of Parkinson’s disease. In Proceedings of the 2018 11th International Symposium on Chinese Spoken Language Processing, ISCSLP 2018, Taipei, Taiwan, 26–29 November 2018; pp. 354–358. [Google Scholar]
  105. Hall, R. The mouths of others: The linguistic performance of race in Bermuda. J. Socioling. 2019, 23, 223–243. [Google Scholar] [CrossRef]
  106. Mięsikowska, M. Analysis of Polish Vowels of Tracheoesophageal Speakers. J. Voice 2017, 31, 263.e5–263.e11. [Google Scholar] [CrossRef]
  107. Prasada Rao, K.; Chandra Sekhara Rao, M.V.P.; Hemanth Chowdary, N. An integrated approach to emotion recognition and gender classification. J. Vis. Commun. Image Represent. 2019, 60, 339–345. [Google Scholar] [CrossRef]
  108. Haq, A.U.; Li, J.P.; Memon, M.H.; Khan, J.; Malik, A.; Ahmad, T.; Ali, A.; Nazir, S.; Ahad, I.; Shahid, M. Feature Selection Based on L1-Norm Support Vector Machine and Effective Recognition System for Parkinson’s Disease Using Voice Recordings. IEEE Access 2019, 7, 37718–37734. [Google Scholar] [CrossRef]
  109. Barreira, R.R.A.; Ling, L.L. Kullback–Leibler divergence and sample skewness for pathological voice quality assessment. Biomed. Signal Process. Control 2020, 57, 101697. [Google Scholar] [CrossRef]
  110. Grozdić, Đ.T.; Jovičić, S.T.; Subotić, M. Whispered speech recognition using deep denoising autoencoder. Eng. Appl. Artif. Intell. 2017, 59, 15–22. [Google Scholar] [CrossRef]
  111. Kashyap, B.; Horne, M.; Pathirana, P.N.; Power, L.; Szmulewicz, D. Automated Topographic Prominence based quantitative assessment of speech timing in Cerebellar Ataxia. Biomed. Signal Process. Control 2020, 57, 101759. [Google Scholar] [CrossRef]
  112. Moro-Velázquez, L.; Gómez-García, J.A.; Godino-Llorente, J.I.; Villalba, J.; Orozco-Arroyave, J.R.; Dehak, N. Analysis of speaker recognition methodologies and the influence of kinetic changes to automatically detect Parkinson’s Disease. Appl. Soft Comput. J. 2018, 62, 649–666. [Google Scholar] [CrossRef]
  113. Markandeya, M.N.; Abeyratne, U.R. Smart Phone based Snoring Sound analysis to Identify Upper Airway Obstructions. In Proceedings of the 2019 41st Annual International Conference of the IEEE Engineering in Medicine and Biology Society (EMBC), Berlin, Germany, 23–27 July 2019; pp. 4233–4236. [Google Scholar] [CrossRef]
  114. Koo, S.K.; Kwon, S.B.; Moon, J.S.; Lee, S.H.; Lee, H.B.; Lee, S.J. Comparison of snoring sounds between natural and drug-induced sleep recorded using a smartphone. Auris Nasus Larynx 2018, 45, 777–782. [Google Scholar] [CrossRef]
  115. Zhang, T.; Zhang, Y.; Sun, H.; Shan, H. Parkinson disease detection using energy direction features based on EMD from voice signal. Biocybern. Biomed. Eng. 2021, 41, 127–141. [Google Scholar] [CrossRef]
  116. Kellermann, W. Beamforming for Speech and Audio Signals. In Handbook of Signal Processing in Acoustics; Springer: New York, NY, USA, 2008; pp. 691–702. [Google Scholar]
  117. Liu, C.-F.; Ciou, W.-S.; Chen, P.-T.; Du, Y.-C. A Real-Time Speech Separation Method Based on Camera and Microphone Array Sensors Fusion Approach. Sensors 2020, 20, 3527. [Google Scholar] [CrossRef] [PubMed]
  118. Danayi, A.; Seyedin, S. A novel algorithm based on time-frequency analysis for extracting melody from human whistling. In Proceedings of the 2018 4th Iranian Conference on Signal Processing and Intelligent Systems (ICSPIS), Tehran, Iran, 25–27 December 2018; IEEE: New York, NY, USA, 2018; pp. 135–139. [Google Scholar]
  119. Kim, G.; Bae, I.; Park, H.; Lee, Y. Comparison of Cepstral Analysis Based on Voiced-Segment Extraction and Voice Tasks for Discriminating Dysphonic and Normophonic Korean Speakers. J. Voice 2021, 35, 328.e11–328.e22. [Google Scholar] [CrossRef] [PubMed]
  120. Mainka, A.; Platzek, I.; Mattheus, W.; Fleischer, M.; Müller, A.S.; Mürbe, D. Three-dimensional Vocal Tract Morphology Based on Multiple Magnetic Resonance Images Is Highly Reproducible During Sustained Phonation. J. Voice 2017, 31, 504.e11–504.e20. [Google Scholar] [CrossRef] [PubMed]
  121. Hammami, I.; Salhi, L.; Labidi, S. Voice Pathologies Classification and Detection Using EMD-DWT Analysis Based on Higher Order Statistic Features. IRBM 2020, 41, 161–171. [Google Scholar] [CrossRef]
  122. Dubey, A.K.; Prasanna, S.R.M.; Dandapat, S. Sinusoidal model-based hypernasality detection in cleft palate speech using CVCV sequence. Speech Commun. 2020, 124, 1–12. [Google Scholar] [CrossRef]
  123. Xiong, F.; Goetze, S.; Kollmeier, B.; Meyer, B.T. Joint estimation of reverberation time and early-to-late reverberation ratio from single-channel speech signals. IEEE/ACM Trans. Audio Speech Lang. Process. 2019, 27, 255–267. [Google Scholar] [CrossRef]
  124. Fujimura, S.; Kojima, T.; Okanoue, Y.; Shoji, K.; Inoue, M.; Omori, K.; Hori, R. Classification of Voice Disorders Using a One-Dimensional Convolutional Neural Network. J. Voice 2020, 36, 15–20. [Google Scholar] [CrossRef]
  125. Kurokawa, T.; Miura, T.; Yamashita, M.; Sakai, T.; Matsunaga, S. Emotion-Cluster Classification of Infant Cries Using Sparse Representation. In Proceedings of the 2018 Asia-Pacific Signal and Information Processing Association Annual Summit and Conference (APSIPA ASC), Honolulu, HI, USA, 12–15 November 2018; IEEE: New York, NY, USA, 2018; pp. 1875–1878. [Google Scholar]
  126. Alimuradov, A.K.; Tychkov, A.Y.; Churakov, P.P. Formant Analysis of Speech Signals Based on Empirical Mode Decomposition to Detect Human Psycho-Emotional Disorder. In Proceedings of the 2019 IEEE Conference of Russian Young Researchers in Electrical and Electronic Engineering (EIConRus), Saint Petersburg and Moscow, Russia, 28–31 January 2019; IEEE: New York, NY, USA, 2019; pp. 1123–1128. [Google Scholar]
  127. Liu, L.; Li, W.; Wu, X.; Zhou, B.X. Infant cry language analysis and recognition: An experimental approach. IEEE/CAA J. Autom. Sin. 2019, 6, 778–788. [Google Scholar] [CrossRef]
  128. Kheddache, Y.; Tadj, C. Identification of diseases in newborns using advanced acoustic features of cry signals. Biomed. Signal Process. Control 2019, 50, 35–44. [Google Scholar] [CrossRef] [PubMed]
  129. Cornejo, J.; Pedrini, H. Bimodal Emotion Recognition Based on Audio and Facial Parts Using Deep Convolutional Neural Networks. In Proceedings of the 2019 18th IEEE International Conference on Machine Learning and Applications (ICMLA), Boca Raton, FL, USA, 16–19 December 2019; IEEE: New York, NY, USA, 2019; pp. 111–117. [Google Scholar]
  130. Fernández-Abascal, E.G.; Guerra, P.; Martínez, F.; Domínguez, F.J.; Muñoz, M.Á.; Egea, D.A.; Martín, M.D.; Mata, J.L.; Rodríguez, S.; Vila, J. El Sistema Internacional de Sonidos Afectivos (IADS): Adaptación española. Psicothema 2008, 20, 104–113. [Google Scholar] [PubMed]
  131. Soares, A.P.; Pinheiro, A.P.; Costa, A.; Frade, C.S.; Comesaña, M.; Pureza, R. Affective auditory stimuli: Adaptation of the International Affective Digitized Sounds (IADS-2) for European Portuguese. Behav. Res. Methods 2013, 45, 1168–1181. [Google Scholar] [CrossRef] [Green Version]
  132. Guidi, A.; Gentili, C.; Scilingo, E.P.; Vanello, N. Analysis of speech features and personality traits. Biomed. Signal Process. Control 2019, 51, 1–7. [Google Scholar] [CrossRef]
  133. Deng, B.; Xue, B.; Hong, H.; Fu, C.; Zhu, X.; Wang, Z. Decision tree based sleep stage estimation from nocturnal audio signals. In Proceedings of the 2017 22nd International Conference on Digital Signal Processing (DSP), London, UK, 23–25 August 2017; IEEE: New York, NY, USA, 2017; pp. 1–4. [Google Scholar]
  134. Xie, J.; Aubert, X.; Long, X.; van Dijk, J.; Arsenali, B.; Fonseca, P.; Overeem, S. Audio-based snore detection using deep neural networks. Comput. Methods Programs Biomed. 2021, 200, 105917. [Google Scholar] [CrossRef]
  135. Islam, R.; Tarique, M.; Abdel-Raheem, E. A Survey on Signal Processing Based Pathological Voice Detection Techniques. IEEE Access 2020, 8, 66749–66776. [Google Scholar] [CrossRef]
  136. Naal-Ruiz, N.E.; Alonso-Valerdi, L.M.; Ibarra-Zarate, D.I. Frequency responses of headphones modulate alpha brain oscillations related to auditory processing. Appl. Acoust. 2022, 185, 108415. [Google Scholar] [CrossRef]
  137. Milanov, N.E.; Milanova, B.E. Proximity Effect of microphone. Audio Eng. Soc. 2001, 1–11. Available online: http://www.aes.org/e-lib/browse.cfm?elib=9940 (accessed on 15 January 2023).
  138. Black, R. Anti-alias filters: The invisible distortion mechanism in digital audio? In Proceedings of the 106th Convention of the Audio Engineering Society, Amsterdam, The Netherlands, 16–19 May 1998; Volume 966. [Google Scholar]
  139. Aggarwal, S.G.V.; Selvakanmani, S.; Pant, B.; Kaur, K.; Verma, A.; Binegde, G.N. Audio Segmentation Techniques and Applications Based on Deep Learning. Sci. Program. 2022, 2022, 7994191. [Google Scholar] [CrossRef]
  140. Alimi, S.; Awodele, O. Voice Activity Detection: Fusion of Time and Frequency Domain Features with A SVM Classifier. Comput. Eng. Intell. Syst. 2022, 13. [Google Scholar] [CrossRef]
  141. Zhu, H.; Luo, M.-D.; Wang, R.; Zheng, A.-H.; He, R. Deep Audio-visual Learning: A Survey. Int. J. Autom. Comput. 2021, 18, 351–376. [Google Scholar] [CrossRef]
  142. Sherman, R. Sherman Foundational Data Modeling. In Business Intelligence Guidebook; Elsevier: Amsterdam, The Netherlands, 2015; pp. 173–195. ISBN 9780124114616. [Google Scholar]
  143. Jiping, Z. Brain Computer Interface System, Performance, Challenges and Applications. J. Comput. Nat. Sci. 2023, 3, 46–57. [Google Scholar] [CrossRef]
  144. Chaki, J. Pattern Analysis Based Acoustic Signal Processing: A Survey of the State-of-Art; Springer: New York, NY, USA, 2021; Volume 24, ISBN 0123456789. [Google Scholar]
  145. Mada Sanjaya, W.S.; Anggraeni, D.; Santika, I.P. Speech Recognition using Linear Predictive Coding (LPC) and Adaptive Neuro-Fuzzy (ANFIS) to Control 5 DoF Arm Robot. J. Phys. Conf. Ser. 2018, 1090, 012046. [Google Scholar] [CrossRef]
  146. Maslan, J.; Leng, X.; Rees, C.; Blalock, D.; Butler, S.G. Maximum phonation time in healthy older adults. J. Voice 2011, 25, 709–713. [Google Scholar] [CrossRef] [Green Version]
  147. Kreiman, J.; Gerratt, B.R. Perceptual interaction of the harmonic source and noise in voice. J. Acoust. Soc. Am. 2012, 131, 492–500. [Google Scholar] [CrossRef] [Green Version]
  148. Chia Ai, O.; Hariharan, M.; Yaacob, S.; Sin Chee, L. Classification of speech dysfluencies with MFCC and LPCC features. Expert Syst. Appl. 2012, 39, 2157–2165. [Google Scholar] [CrossRef]
  149. Hillenbrand, J.; Cleveland, R.A.; Erickson, R.L. Acoustic correlates of breathy vocal quality. J. Speech Lang. Hear. Res. 1994, 37, 769–778. [Google Scholar] [CrossRef]
  150. Heman-Ackah, Y.D.; Sataloff, R.T.; Laureyns, G.; Lurie, D.; Michael, D.D.; Heuer, R.; Rubin, A.; Eller, R.; Chandran, S.; Abaza, M.; et al. Quantifying the cepstral peak prominence, a measure of dysphonia. J. Voice 2014, 28, 783–788. [Google Scholar] [CrossRef]
  151. Mohammadi, M.; Sadegh Mohammadi, H.R. Robust features fusion for text independent speaker verification enhancement in noisy environments. In Proceedings of the 2017 Iranian Conference on Electrical Engineering (ICEE), Tehran, Iran, 2–4 May 2017; pp. 1863–1868. [Google Scholar] [CrossRef]
  152. Khoria, K.; Kamble, M.R.; Patil, H.A. Teager energy cepstral coefficients for classification of normal vs. whisper speech. In Proceedings of the 2020 28th European Signal Processing Conference (EUSIPCO), Amsterdam, The Netherlands, 18–21 January 2021; pp. 371–375. [Google Scholar] [CrossRef]
  153. Georgogiannis, A.; Digalakis, V. Speech Emotion Recognition using non-linear Teager energy based features in noisy environments. In Proceedings of the 2012 20th European Signal Processing Conference (EUSIPCO), Bucharest, Romania, 27–31 August 2012; pp. 2045–2049. [Google Scholar]
Figure 1. Organs involved in mouth sound production. Air powered by the lungs passes through the pharynx, larynx, and oral and nasal cavities, causing resonances and vibrations audible to human hearing.
Applsci 13 04331 g001
Figure 2. Illustrations of the time features on a fragment of a speech signal. (a) Time signal. (b) ZCR. (c) STE.
Applsci 13 04331 g002
Figure 3. Illustrations of frequency features on a fragment of a speech signal. (a) Time signal. (b) Spectrogram based on MFCC. (c) Spectrogram based on BFCC.
Applsci 13 04331 g003
Figure 4. Most common trends across studies, from mouth sounds to applications. Here, important aspects regarding the processing and recording of mouth sounds, as well as the application of their analysis, are described.
Applsci 13 04331 g004
Figure 5. Most used acoustic features in the time domain from the revised literature. The main applications for each group of features are shown inside the hexagons.
Applsci 13 04331 g005
Figure 6. Commonly used acoustic features in the frequency domain from the revised literature. The main applications for each group of features are shown inside the hexagons.
Applsci 13 04331 g006
Table 1. List of words used for this research. These keywords were used in the different databases to limit the research of material to only the topics of interest.
What Is the Main Objective?What Was Done to the Signal?How Was the Signal
Acquired?
What Was Used to Process the Signal?Which Are the Fields of Study?
SoundProcessingRecordingAlgorithmApplication
MouthAnalysisAcquisitionCodeCOVID-19
AudioExtractionConditionsDevicesCoronavirus
FeaturesClassification InstrumentsSARS-CoV-2
Characteristics
COVID-19: Coronavirus disease 2019.
Table 2. Summary of important aspects regarding mouth sounds, analyzed acoustics features, and applications.
Mouth SoundsAcoustic FeaturesApplications
TimeFrequency
VowelsZCRMFCCClinical diagnosis
SpeechVolume or loudnessCPPRespiratory complications
Breathing soundsSTECPPSNeurological disorders and conditions
CryingShimmerJitterEmotional wellbeing and disorders
Amplitude descriptorHNREmotion recognition
NHRMental health
f0Sleep disorders
FormantsSpeech and communication/expression
Spectral centroid
Spectral roll-off
Spectral spread
Disclaimer/Publisher’s Note: The statements, opinions and data contained in all publications are solely those of the individual author(s) and contributor(s) and not of MDPI and/or the editor(s). MDPI and/or the editor(s) disclaim responsibility for any injury to people or property resulting from any ideas, methods, instructions or products referred to in the content.

