1. Introduction
Highways are important to the research and application of CVIS in intelligent highways [
1,
2]. Deploying multiple RSUs along the highway ensures vehicles can access the Internet more easily. RSUs can also collect and forward observation data within their range. Some RSUs are built in remote areas, such as mountain forests or the Gobi, which makes Internet connectivity difficult and costly [
3]. Therefore, isolated RSUs must carry data through mobile vehicles to reach the RSU access range to the backbone network and then upload the data. RSU observation data include traffic conditions, environmental monitoring, natural disasters, and animal activity information [
4,
5,
6]. RSU collects monitoring data in a timely manner, and different data types have different delay deadline requirements [
7]. High-speed moving vehicles cause the time-varying network topology of vehicles. An unnecessary impact is caused when the data cannot be fed back to the relevant departments before the delay deadline. Therefore, the main goal of this paper is to determine the optimal scheduling strategy considering that monitoring data have different deadlines and data queues are stable, minimizing the end-to-end average delay.
2. Related Work and Contributions
The high mobility of vehicles in CVIS creates a time-varying network topology. Its communication has intermittent connectivity, which increases not only opportunities for data distribution and network capacity, but also data transmission delays. It is more suitable for delay-tolerant services.
Kyoungsoo et al. [
8] proposed an RSU scheduling that provides V2I-based data services through multiple RSUs. The proposed scheme connects the RSU through a wired backbone network. The scheme adopts a cooperation strategy of multiple RSUs to transmit secure and non-secure data, reducing the deadline failure rate and average response time. Guo et al. [
9] proposed a V2R data access scheme based on data integrity and importance. Based on the vehicle request’s initial information, they first estimated whether it could avoid invalid data access requests. On this basis, the author proposed a multi-request priority scheduling scheme considering the importance of requests and deadlines. Finally, the author used a priority-based strategy to satisfy these requests.
TAN et al. [
10] proposed studying the problem of efficient content broadcasting through vehicle networks. They expressed it as a joint optimization problem of data prefetching and broadcast transmission scheduling with buffer size constraints and transmission rate adaptive constraints. This article considers a highway scenario covered by multiple RSUs and the deadline requirements of interactive applications. The author used a heuristic algorithm to solve the integer linear programming problem.
The block must be delivered within the playback period to achieve the desired video quality during playback. Bethanabhotla et al. [
11] proposed a network utility maximization (NUM) problem where the network utility function is a concave, component-by-component, non-decreasing function of the video quality index requested by time-averaged users. Maximization depends on the stability of all queues in the system.
Due to the lack of an average delay performance guarantee in existing research, Yang et al. [
12] focused on the key goal of delivering next-generation real-time services before the corresponding deadline of each packet while minimizing the overall cloud network resource cost, introducing a novel queueing system, which can track the life cycle of data packets, and formalizing the optimal cloud network control problem with strict deadline constraints. Having explained the main challenge of sending packets to their destination before their life cycle expires, the author developed an equivalent formula. The relaxed flow conservation allowed the use of Lyapunov optimization to derive a provable, near-optimal, and fully distributed algorithm for the original problem.
Hu et al. [
13] proposed an auction bidding scheme to determine the RSU in response to the computing request. In other words, auctioning the computing request to obtain bids from the least energy consuming RSUs. The scheme works in a decentralized model, which effectively reduces the complexity of its implementation. In order to process computing requests simulated as DAG applications, the DAG is divided into individual tasks using upper-order values. They also proposed a deadline-aware queue jump algorithm assigned to server queues in specific RSUs.
When tasks require different delay deadlines, computing resource allocation becomes more challenging. Mukherjee et al. [
14] proposed a scheduling strategy to maximize the number of tasks completed within their deadlines and stabilize the network. The Lyapunov drift plus penalty function on the queue length was used to schedule tasks. Sethi et al. [
15] proposed a scheduling architecture that minimizes RSUs’ energy consumption and achieves uniform energy consumption between adjacent RSUs. In turn, this scheme increases the request fulfillment percentage for RSUs. The proposed architecture classifies incoming requests as traditional (with less computation) or smart requests (with more computation). They proposed a hard-deadline low-computing-requirement method (HLCA) and a soft-deadline high-computing-requirement method (SHCA) aimed at traditional and intelligent data requests, respectively.
Wu et al. [
16] proposed the random unloading problem of minimizing long-term energy consumption. They used the perturbed Lyapunov optimization technique to construct a virtual queue and transformed the task deadline guarantee problem into a virtual queue stability control problem. They proposed an energy-saving online unloading algorithm for DelayAware, which can adaptively unload more tasks under good network quality conditions. Additionally, the transmission is delayed when the connection is poor, but the deadline is not compromised.
Xiang et al. [
17] considered the delay sensitivity of different vehicles to receive early warning information and studied the release of emergency information using V2X communication. We divided the vehicles covered by the roadside unit (RSU) into primary and secondary priority groups according to the distance between the vehicle and the emergency point. A joint optimization problem of content division, user groupings, and channel allocation was proposed to improve resource utilization and emergency message delivery efficiency. The goal was to ensure that all vehicles in the primary priority group could reliably receive warning messages within a fixed deadline. In addition, RSUs could send countless warning messages to vehicles in the secondary priority group.
The main contributions of this paper are as follows:
We proposed an optimization strategy based on a vehicle carrier relay to minimize end-to-end delays of RSU packets. This strategy decides packet scheduling using the high- and low-priority data cache queue and vehicle speed status of multiple RSUs. According to the queue and speed states of multiple RSUs, this strategy dynamically selects the data cache queue and the number of packets sent to ensure system performance and minimize end-to-end delays.
The packet scheduling problem is transformed into a knapsack problem, and simulation results verify the algorithm’s effectiveness.
The remaining organizational structure of this paper is as follows.
Section 3 describes the packet scheduling strategy and system model. In
Section 4, Lyapunov optimization theory transforms the model, and the knapsack problem is solved. In
Section 5, the performance of the proposed optimization strategy is evaluated and compared to existing algorithms. The superiority of the proposed scheme is renamed here.
Section 6 contains the conclusion of this paper.
3. System Model
On the highway section of L-length, transferring data packets to through a single RSU may cause the following problems:
Considering the maximum capacity of the data cache queue of the RSU, when the monitoring data of the road section is stored in the data cache queue of the RSU, the data cache queue of the RSU will be full quickly, and the data packets that arrive later will overflow, resulting in the loss of available data packets.
When the arrival rate of vehicles on the road section is high, a single RSU only sends data packets to one vehicle in each time slot, which may cause multiple vehicles to have no data packets to carry, so the stability of the data cache queue can’t be guaranteed.
When the data packet arrival rate is high, considering that there are fewer data packets that can be sent in each time slot of a single RSU, the data cache queue length of the RSU will remain in a higher state, and the higher data queue length will lead to larger average queuing delay, which will affect the overall performance of the system.
In this paper, we consider that N RSUs are evenly distributed on the highway section of L-length. each RSU observes its coverage and collects data and stores it in its data cache queue. DDPS makes data packet scheduling decisions according to the corresponding states of N RSU in each time slot to avoid the above problems.
As shown in
Figure 1, RSUs are deployed on highways. N RSUs in remote areas, such as mountains and forests, which consider economic benefits and other factors, cannot access the backbone network. Therefore, many RSUs deployed in remote areas use mobile vehicles as transmission media to forward data packets from mobile vehicle carriers to backbone networks. The data cache queue of RSUs is divided into emergency and non-emergency data cache queues. Emergency data mainly include extreme weather, forest fires, and static obstacles on the road. Non-emergency data are mainly daily traffic, environmental data, and other monitoring data.
Based on the speed and queue status, scheduling determines whether data packets are sent, how many, and what type of data packets are sent to vehicles. The data should be transmitted to the backbone before the deadline to ensure the relevant departments can handle the consequences of emergency and non-emergency data. In remote areas,
is the distance between two RSUs, and
is the shortest distance between the destination node
and the isolated RSUs. Since
is much larger than the communication range of RSU, the latter can be ignored. RSU indexes of
are deployed in the scenario of L-length highway sections. The system time is discretized, the index is
, and the length of each slot is represented by τ. When the vehicle enters the coverage area of
,
unloads the collected data packets onto it. Using the data scheduling controller,
determines a scheduling strategy for processing data packets in the data queues.
Figure 2 shows that the data transmission control model comprises vehicle speed state
, data queues length
, packet arrival number
, queue selection decision
, and data packet transmission decision
.
3.1. Vehicle Speed State Model
We only considered the one-lane scenario of the highway, where the vehicle is in a free-flow traffic date and its arrival obeys the Poisson distribution with parameter
. Therefore, we can conclude that the arrival time interval
of any two cars obeys a negative exponential distribution. Its probability density function is as follows:
The probability distribution function is derived as
Therefore, the probability of at least one car arriving at this section in the τ time slot is
Then, the probability of no vehicles arriving in the τ time slot is .
In this paper, we considered
as the speed of the vehicle when it arrives in the t-slot and assumed that the vehicle’s speed in the road section does not change. In the free flow traffic state, the speed
obeys the normal distribution with an average value of
and a standard deviation of
. Its probability density function is
If the speed limit interval of the highway is expressed as
, then the truncation probability density function of the speed distribution is
The continuous speed is divided into
X + 1 speed states [
18]. The state vector is expressed as
, in which
and
represent the minimum and the maximum speed limits of the highway, respectively, and satisfy
.
indicates the speed the vehicle reaches
in the t-slot.
indicates
and
indicates that no vehicle will arrive at
in the t-slot.
Let
represents the probability that the vehicle is in the speed state
x, and its probability density function expression is
3.2. Prediction Model of Vehicle Communication Quantity
In the research scenario of this paper, the connection between vehicles and RSU is not continuous. Therefore, we must determine how many vehicles establish communication links with N RSU. When a vehicle enters the RSU coverage area, its communication state is defined as ON. When the vehicle drives out of the RSU coverage area, its communication state is defined as OFF [
19]. In this paper, we analyzed the free flow traffic model to predict the number of vehicles establishing communication links with RSU on the road as
. We assumed that the probability of the vehicle and establishing communication links obey the discontinuous Bernoulli distribution (IBP) with parameter
[
20]. The vehicle’s travel time in the ON/OFF state shows a geometric distribution, and the expected values are
and
, respectively.
The cumulative distribution function of vehicle residence time
on this road section can be expressed as
is the probability distribution function corresponding to the truncated probability density function in the previous section.
The arrival of vehicles obeys the Poisson distribution with parameter
; therefore, the probability expression of k vehicles arriving in the road section within the interval of
is as follows:
The t-slot,
, represents the probability of any vehicle arriving in the
-slot. The vehicle’s arrival obeys the Poisson distribution. Therefore, the vehicle arrival time distribution depends on whether k vehicles arrive within the time interval of
. This is the same as the uniform distribution of k points within
. The probability expression for the existence of any k vehicles on the road section within the t-slot is as follows:
The probability of the vehicle leaving the road section in the t-slot during the time interval of
is as follows:
Depending on whether k vehicles arrive within the time interval of
, the probability of y vehicles driving on the road section within the t-slot is as follows:
The probability of establishing a communication link between a vehicle and
follows a discontinuous Bernoulli distribution with a parameter of
. Therefore, the probability of y vehicles driving on the road section in t-slot and r vehicles with RSU coverage is as follows:
3.3. Queue Model
The data types are divided into emergency and non-emergency data. According to the type of data arrival, the data cache queue of the vehicle is divided into high- and low-priority data queues. Let denote the data cache queue selection decision within the range of in the t-slot, of which . indicates that the data packets in the high-priority data queue will be transmitted by in the t-slot. indicates that the data packets in the low-priority data queue will be transmitted by in the t-slot.
Considering that the data queue capacity of RSU is limited, let
denote the high-priority data cache queue length of
in the
t + 1 slot. Then, the updated data queue expression would be as follows:
represents the number of emergency data packets arriving at the high-priority data queues of in the time slot t, which is expressed as .
indicates the probability that the data type arriving is an emergency data packet. indicates the probability that the data type arriving is a non-emergency data packet.
represents the number of data packets that reach
in time slot t. Its probability density function is
where
represents the probability of u data packets arriving at RSUs in the time slot t. The data arrival distribution satisfies
, and
. The average arrival rate of the group is
. When the data queue is full, the newly arrived data packet overflows.
is the number of emergency data packets transmitted by
in the t-slot, which is expressed as
represents the number of data packets that sent to the arriving vehicle in the time slot t, where S is the maximum number of data packets that can transmit to the vehicle in each time slot, is when the vehicle speed state is X + 1, indicating that no vehicle arrived in the current time slot. is satisfied .
In order to ensure the data cache queue’s stability and reduce the data transmission delays, the system designates
as the upper limit of the long-term average data cache queue length. The expression is as follows:
Let
denote the low-priority data cache queue length in the
t + 1 slot. The data queue update expression would be as follows:
represents the number of non-emergency data packets arriving at the low-priority data queues of
in the time slot
t, which is expressed as
The newly arrived data packet overflows when the data queue is full.
is the number of non-emergency data packets transmitted by
in the t-slot, which is expressed as
To ensure the data cache queue’s stability and reduce data transmission delays, the system gives
as the upper limit of the long-term average data cache queue length. The expression is as follows:
3.4. Average Delay Model
Emergencies such as extreme weather, fires, traffic accidents, etc., are timely and may have a negative impact when not handled properly or within an effective time. Although less serious than the emergency itself, non-emergency events such as animals and daily traffic still reduce the work efficiency of the relevant departments when not treated quickly. Therefore, data packet deadlines must be considered.
In this paper, different data deadlines are divided into emergency and non-emergency data packet deadlines based on the severity of the event. The data packet is discarded when the transmission time is exceeded.
The average end-to-end delays of emergency data packet transmission in the time slot mainly comprise the following two parts:
The average propagation delay
is the average time
requires sending a packet to the vehicle and carry it to
in the t-slot. Its expression is as follows:
represents the average speed at which the vehicle reaches at time slot, t. The expression is .
represents the distance between and , and its expression is .
The average queue delay is . According to the emergency data deadline , the relationship can be deduced as .
Its expression is as follows:
Therefore, the average end-to-end delay expression for
to complete emergency data packet transmission in the t-slot is as follows:
It can be obtained in the same way that the average end-to-end delay expression for
to complete non-emergency data packet transmission in the t-slot:
Furthermore, the expression of the weighted end-to-end average delay of each data packet from all RSUs in the time slot is as follows:
The system’s long-term average weighted delay expression is as follows:
The optimization problem is as follows:
4. Lyapunov Optimization Model
Lyapunov optimization refers to the optimal control of a dynamic system using the Lyapunov function. The Lyapunov function is widely used in control theory to ensure system stability. Multidimensional vectors usually describe a system’s state at specific times. The Lyapunov function is a non-negative scalar measure of this multidimensional state. According to Lyapunov optimization technology, network stability is achieved by initiating the control action that causes Lyapunov drift from negative to zero. Moreover, the weighted (positive) network utility term is subtracted from the Lyapunov drift and minimizes the sum. As a result, the drift plus penalty algorithm for joint network stability and utility maximization is produced.
It is necessary to transform the optimization model and reduce computational complexity because of the large state space of the problem and the high complexity of online optimization. We set the vector matrix
. The Lyapunov function is defined by this matrix:
According to Formula (28), the data queue length is positively correlated with the value of
. Data queue dynamics can be described using the Lyapunov function for differences between adjacent time slots, that is, the Lyapunov drift
, which is expressed as follows:
System optimization aims to keep the RSU’s data queue length low while minimizing end-to-end average delays. Therefore, the end-to-end average delay becomes the drift component in Formula (29), which can be rewritten as
V is the tradeoff parameter between data queue length and end-to-end average delays. If the V value increases, the weight of the end-to-end average delay in the Lyapunov drift parameter increases. In turn, the drift effect on the system increases. It makes the system focus on reducing the end-to-end average delay, but the length of the data queue increases accordingly. Therefore, the system can be optimized by adjusting the value of V. System optimization is possible by minimizing the upper bound of the Lyapunov drift.
According to the theorem,
is true for
; therefore, the following inequality is derived from Formula (13).
It can be obtained in the same way:
According to Formula (28), the following relational expression can be derived:
Through
, and
, we can obtain the following relations:
Through
, we can obtain the following relation:
If parameter
is substituted with inequality (34), then the Lyapunov drift function satisfies the following inequality relation:
Among them, the right end of the inequality is the Lyapunov drift function’s upper bound. By minimizing the upper bound, the optimization model’s critical point can be obtained through data packet scheduling decisions
. The system’s optimization model then transforms into the following expression:
Cons,
and
are constant in each time slot. Since the system results are not affected by them, they can be omitted. The Formula (37) is simplified as follows:
4.1. Queue Selection Decision
Assuming a reasonable data packet scheduling decision vector
, we can describe the queue selection problem as follows:
Since
is a constant, the optimal solution of the above equation can be expressed as
We can obtain the optimal decision vector of queue selection .
4.2. Packet Scheduling Decision
Given the queue selection optimal decision vector
, the packet scheduling problem is described as
When we set
, the system optimization model is described as
The purpose of the optimization model was to maximize its value based on limited packet scheduling decisions (resource space). Therefore, we obtained optimal data scheduling by transforming the model into a knapsack problem [
21].
In the knapsack problem, the system optimization model’s system value is expressed by . The system first arranges the values of in descending order, then inserts them into the “knapsack”. However, this process can be interrupted. The optimal solution to the system optimization problem depends on the system state at the time of interruption. Therefore, the key to the knapsack problem is to find the breakpoint. Typical interruption conditions in knapsack problems are as follows:
The remaining “weight” space is 0.
The value of the “item” inserted into the “backpack” is negative.
Optimal packet scheduling decisions can be determined by the break point of the knapsack problem. Define
as the interruption index parameter of the system knapsack problem, and
, of which
satisfies the following relation:
Then, the optimal solution for packet scheduling decisions
is supplied as follows:
5. Performance Evaluation
The simulation experiment in this section follows two parts of the simulation experiment on DDPS proposed in this paper through MATLAB simulation software. The first part involves drawing curve images of the average system delay and packet queue length, which vary with the system’s weight coefficient V and packet arrival rate. The second part compares this strategy model’s performance to two commonly used packet scheduling strategies, Equal Allocation Strategy (EAS) and Queue-weighted Strategy (QS), regarding system average delay and packet queueing under constant simulation parameters.
Table 1 shows the simulation parameters.
In addition,
Section 3 mentions the discontinuous Bernoulli distribution parameter
. The time, T, is set to 1500 s, the number of emergency data packet deadlines
is set to 1000 s, and the number of non-emergency data packet deadlines
is set to 1500 s.
This paper considers that compared with the end-to-end delay, the end-to-end average delay fluctuates more stably, which can better measure the performance of the scheduling strategy. The lower the end-to-end average delay, makes the higher the transmission efficiency of data packets. The average end-to-end delay cannot exceed the data deadlines.
In the second part of the comparative experiment, the EAS indicates that the number of packet transmissions between RSUs and vehicles is equal. QS indicates that the system allocates the transmission weight between vehicles according to the packet queue length in RSUs: the longer the queue length of RSU packets, the more data RSUs send to vehicles.
Figure 3,
Figure 4 and
Figure 5 show a DDPS simulation based on system performance.
Figure 3 shows the curve trend of average delay in each time slot with the increase in weight coefficient
V. The simulation results show that the average delay decreases with the increase in weight coefficient
V. The results show that with the increase in weight coefficient
V, the average delay’s impact on system performance increases gradually. Therefore, the system will adaptively reduce the average delay to ensure its overall performance.
Figure 4 and
Figure 5 show that the high- and low-priority data queue lengths change with the increase in weight coefficient
V, which reduces the impact of queue length on system performance. System decisions tend to adjust the factors that greatly impact system performance; therefore, the system reduces the average delay and increases the length of high- and low-priority queues.
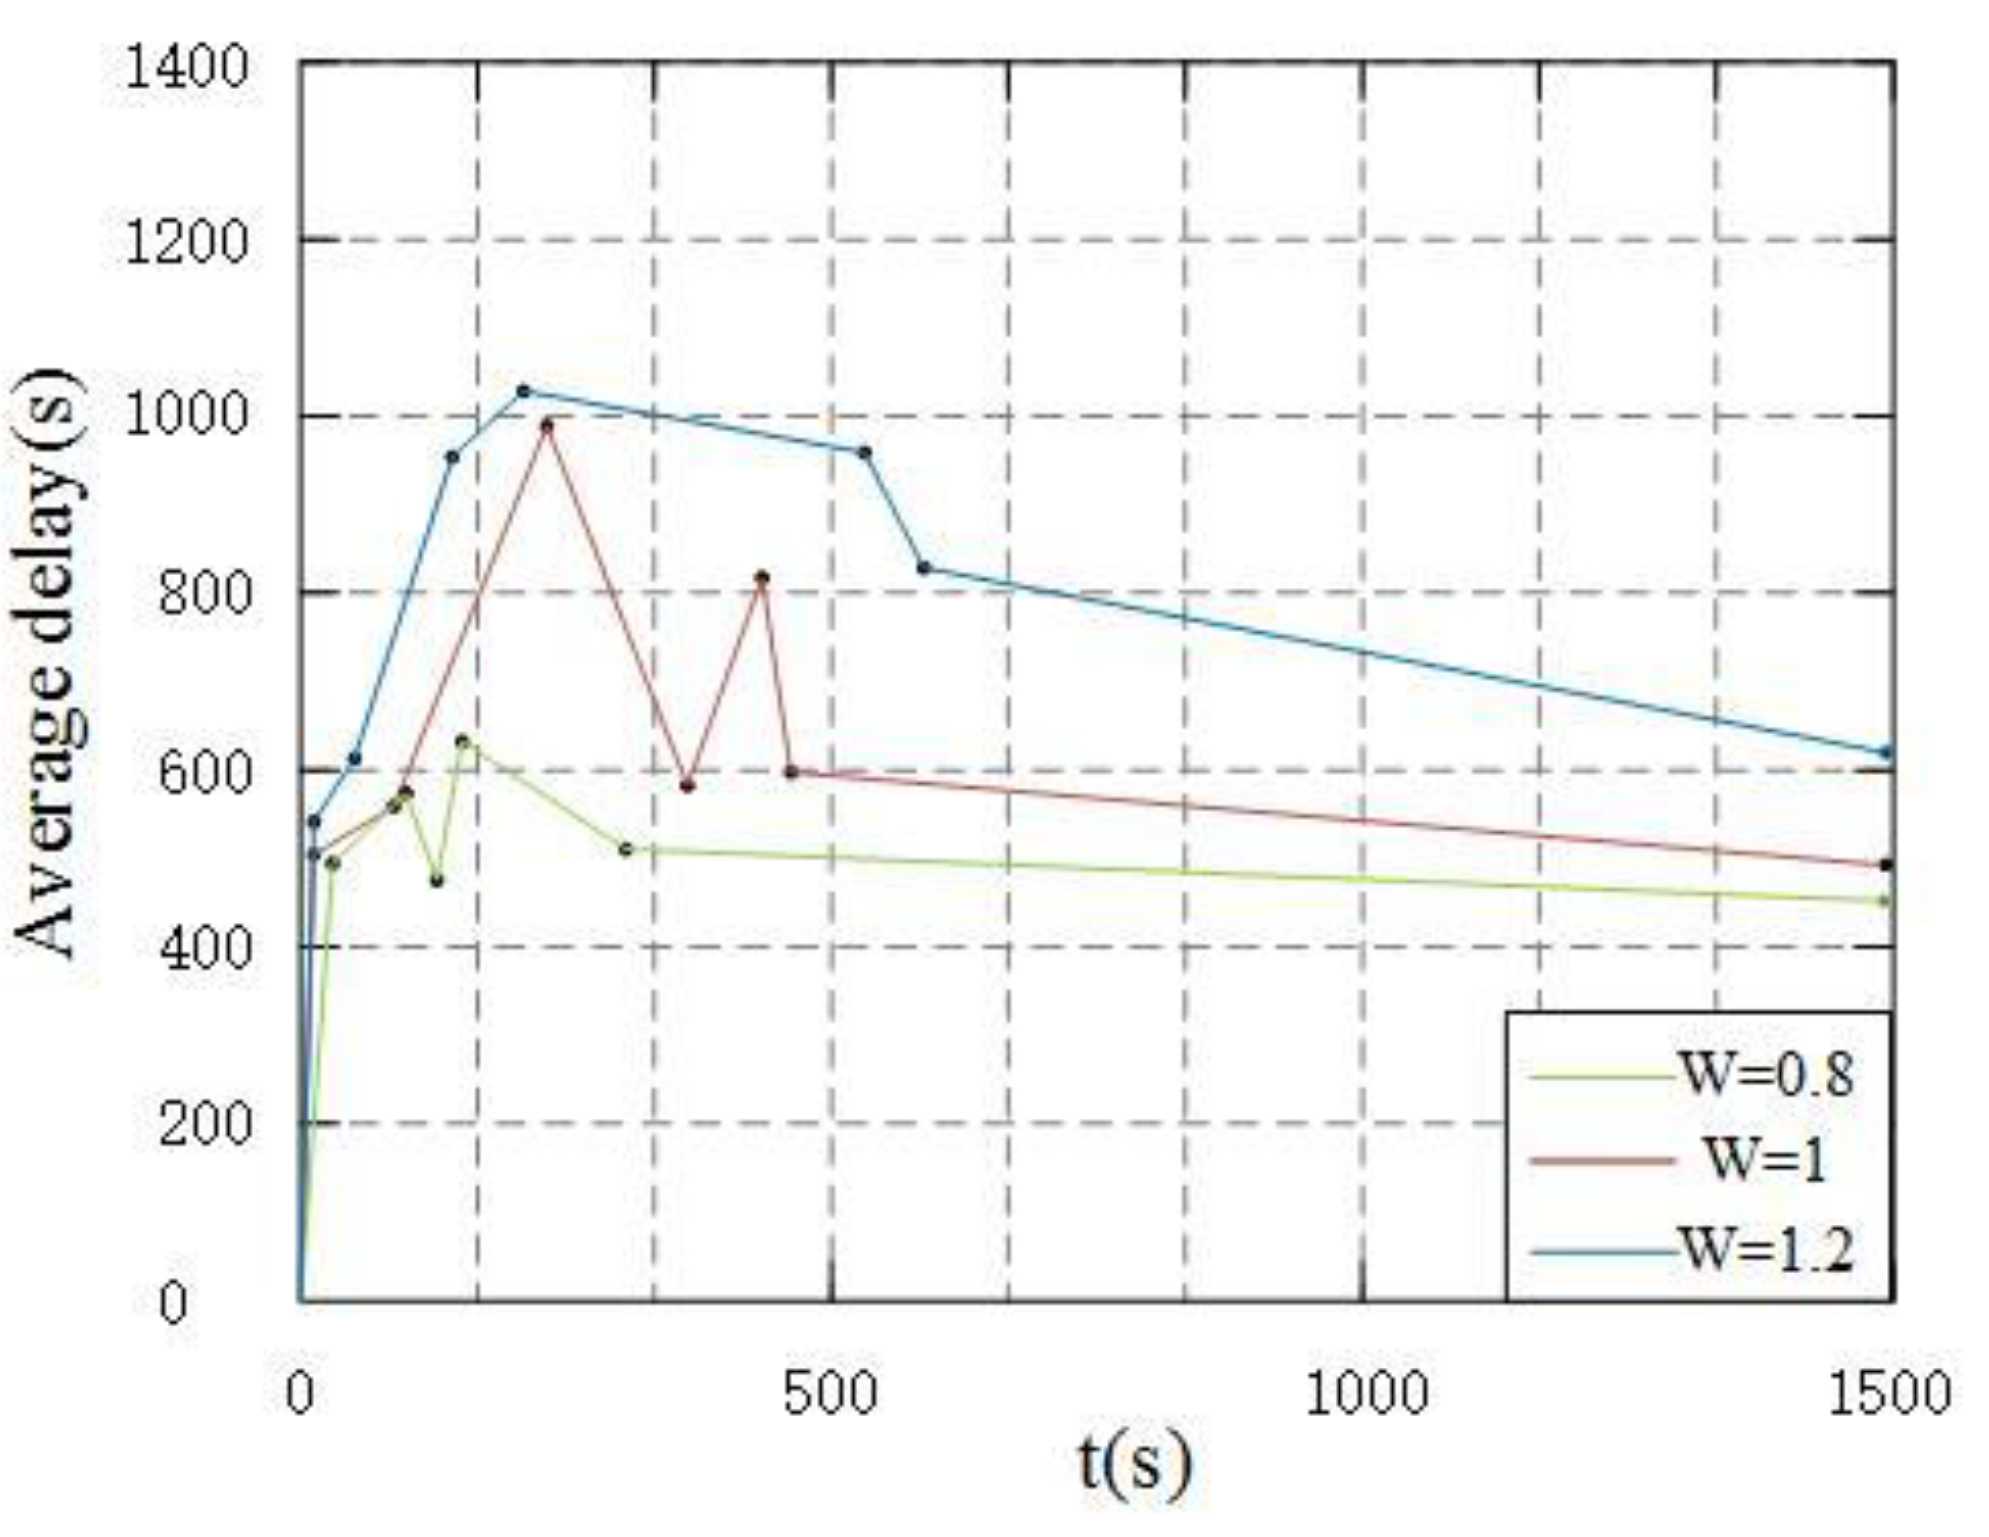
The packet arrival rate will change accordingly when the system environment is different. Therefore, verifying whether the system’s packet scheduling strategy can adaptively optimize packet scheduling under different arrival rates ensures online optimization. The results of this experimental scheme are as follows: The experimental scheme provides the weight value w, set to 0.8, 1, 1.2, multiplied by the packet arrival state
of the system. Set the weight to
V = 2.
Figure 6,
Figure 7 and
Figure 8 show the experimental results. As shown in
Figure 6, the increase in packet arrival rate increases the average queue length and system delays accordingly.
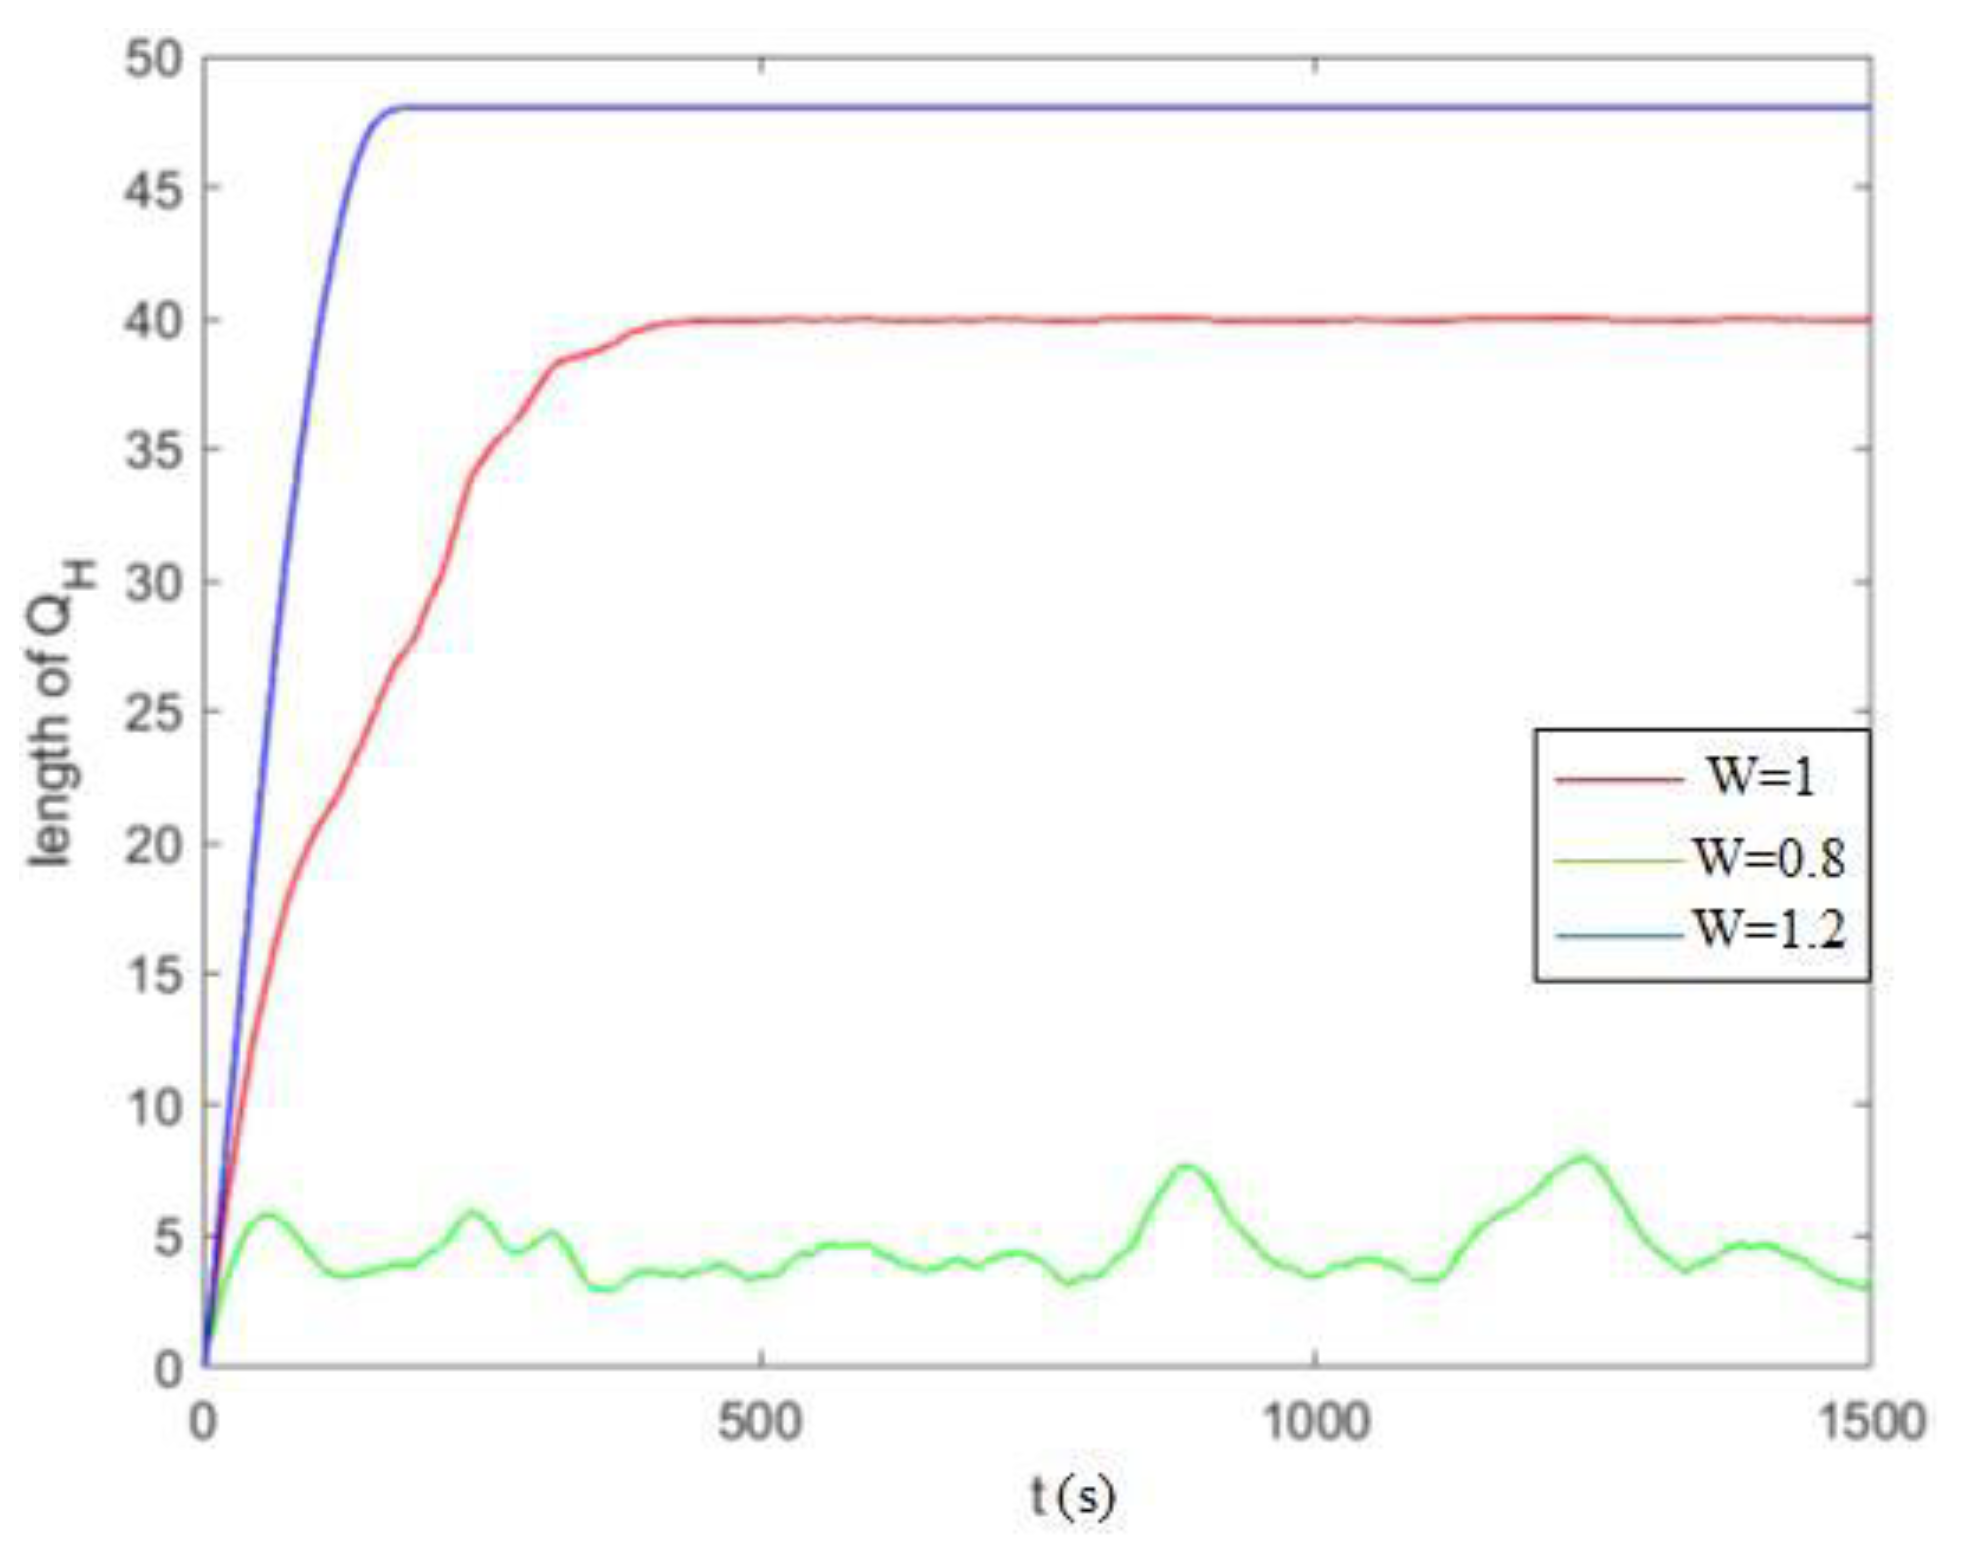
We consider that the size of a single data packet is 1 MB. In order to ensure the long-term stability of the data queue and avoid the high queuing delay of the data packet, which makes the total end-to-end delay exceed the deadline, the system sets high priority and low priority queue length should not exceed the threshold
, that is,
and
. When the average packet arrival rate is
, the system sets
, that is, the queue length of high priority should not exceed 40 MB, and the queue length of low priority should not exceed 90 MB. As shown in
Figure 7 and
Figure 8, the increase in packet arrival rate increases the system’s queue length. Furthermore, the threshold
will increase with an increase in packet arrival rate.
Figure 6,
Figure 7 and
Figure 8 show that the system’s average delay and queue length can be manipulated under different packet arrival rates and finally converge. The results show that the DDPS strategy proposed in this paper can dynamically adjust the packet scheduling strategy according to the change in packet arrival rate. This method ensures the system’s optimal performance and stability.
The above experiments analyze the performance of the DDPS and compare it to the EAS and QS to prove the advantages of the DDPS. We set the experiment weight to
V = 2. The simulation results are shown in
Figure 9,
Figure 10 and
Figure 11.
Figure 9 shows the average delay of the system, and
Figure 10 and
Figure 11 compare the high- and low-priority queue lengths. The simulation results show that when the system works for a long time, the average DDPS delay is low. When it tends to be stable, the sum of high- and low-priority queue lengths is also low. DDPS improves system efficiency by dynamically adjusting the queue and the number of packets sent according to the speed status of passing vehicles and the length of high- and low-priority queues. On the other hand, the EAS’s insensitivity to vehicles’ high-speed mobility and packet queue length affects its performance. The QS only optimizes the system regarding queue length without considering the effect of vehicle speed on transmission delays. The DDPS proposed in this paper has obvious advantages over these two strategies.
6. Conclusions
In this paper, we proposed an optimization strategy to minimize end-to-end delays in multi-RSU-distributed packet scheduling based on vehicle carrier relays in CVIS. This strategy determines packet scheduling decisions according to the double buffer queue lengths and vehicle speed status of multiple RSUs on the highway. The advantage of Lyapunov theory is that it can maximize the network performance on the premise of ensuring the stability of the whole network, so Lyapunov optimization theory was used to transform the problem. Lyapunov drift parameters and weights were also introduced to the average system delay and length of high- and low-priority packet queues, which were treated as knapsack problems. This method can dynamically adjust the packet scheduling strategy through the real-time changes of multiple RSUs’ high- and low-priority queue lengths and vehicle speed status on the road, ensuring that the packet is transmitted to the destination before the deadline and minimizing end-to-end delays.
The simulation results show that the average end-to-end delay of the DDPS strategy proposed in this paper is 39% lower than the ESA strategy and 50% lower than the QS strategy when the queue length of the proposed ESA policy is higher and lower than that of the QS strategy and is significantly lower than that of the QS strategy. With the continuous change of parameters, the end-to-end average delay of the DDPS strategy does not change much, so it can be known that the DDPS strategy has good robustness.
In the assumption of this paper, a single lane of vehicle arrival in a highway section obeys a Poisson distribution with an arrival rate of , considering that the vehicle arrival rate is independently and identically distributed in multiple lanes, that is, the number of vehicle arrivals in multiple lanes can be expressed as multiple superpositions of a single lane. In the simulation, the DDPS proposed in this paper has little change in system performance when the arrival rate is high, so the DDPS strategy is also suitable for multi-lane scenarios.
In the hypothetical scenario of this paper, the transmission of data packets does not take into account the influence of the weather environment, and in the real-world scenario, vehicles may be affected by rainy weather and road conditions in the process of data store–carry–forward. Therefore, we will further study this limitation in future work.


