1. Introduction
The flyer is a high-speed (1~10 km/s) or ultra-high-speed (>10 km/s) material carrier produced by pulse energy that may be used for dynamic shock loading, space debris collision modeling, and explosive ignition. High-energy-density physics, dynamic high-pressure physics, and astrophysics have all made extensive use of flyer-driving technologies. Flyer-driving technology is classified as explosive-driven flyer, light gas gun, electrical exploding foil accelerator, magnetically accelerated flyer, and laser-driven flyer based on pulse energy type. Flight parameters involving flyer velocity and morphology can effectively evaluate the quality of flyer-driving devices and their implementation effects in application research. Flyer velocity implies the energy coupling efficiency of the flyer plate, which influences impact performance; on the other hand, flyer morphology primarily denotes planarity and integrity, which determine the utilization rate of flyer energy and influence functional reliability. The pulse energy source, flyer characteristics, and flying environment all have an effect on the flyer’s velocity, planarity, and integrity.
Several approaches have been presented so far to characterize flyer velocity and morphology. It is critical to evaluate different flyer-driving technologies for mutual reference or research technique absorption. Research progress on the flying characteristics of flyers is reviewed in this contribution from two aspects: the investigation means and the influencing factors. Furthermore, some suggestions for the future development of flyer-driving technologies are proposed.
2. Flyer-Driving Technology
2.1. Explosive-Driven Flyer
As shown in
Figure 1, the detonator ignites the plane wave lens, which is followed by a quasi-one-dimensional plane detonation wave. The main charge is then detonated, causing the flyer to move. Several explosive-driven flyer technologies, such as contact explosion loading, multi-stage explosive slabs driving flyer, and two-dimensional convergence pressurization, have been developed on the basis of this concept [
1]. These approaches possess simple structure, ease of synchronization, large testing range, and multiple sample layout.
Venkataramudu et al. employed an explosive-driven plate impact system to implement planar shock loading of RHA steel in the pressure range of 20~100 GPa [
2]. Jin et al. developed an explosive loading technique with precise control of the flyer’s flatness for measuring tantalum shock Hugoniot data and copper sound velocities [
3].
With the development of MEMS initiating explosive devices, a novel initiation technique has been developed for detonating insensitive explosives using a high-speed flyer driven by micro-charge detonation. As shown in
Figure 2, the in situ produced microscale energetic material is detonated through the MEMS energy conversion component, and the detonation products exert high pressure on the flyer layer resulting in a high-speed flyer through the barrel. This device is integrated and millimeters in dimension as compared to traditional explosive-driven flyer apparatuses. Xie et al. designed a micro-initiating train based on a flyer driven by a miniature detonator, establishing a foundation for MEMS fuse research [
4]. Glavier et al. presented a compact rocket system capable of cutting and propelling a 2.5 mm stainless steel flyer in the barrel for explosive shock ignition [
5].
2.2. Light Gas Gun
The compressed gas gun and the two-stage light gas gun are two types of light gas guns. The compressed gas gun is used for providing a dynamic response behavior to materials undergoing low-pressure impact. By accelerating projectiles to high velocities, the two-stage light gas gun simulates the impact effect of orbital debris on spacecraft and satellite components. In comparison to explosive-driven flyer technologies, the light gas gun offers the advantages of precise projectile velocity adjustment, smooth flyer flight, superior data repeatability, and high measurement accuracy.
The powder chamber, pump tube, coupling section, and launch tube are the primary components of a two-stage light gas gun, as illustrated in
Figure 3. The propellant in the powder chamber is ignited during the experiment cycle. At a moderate pressure, the burning propellant produces a high molecular weight gas that drives a large piston down the smooth pump tube. Initially, this pump tube is a closed system containing appropriate helium or hydrogen. The light gas is compressed to high pressure as the piston moves down the pump tube and into the coupling section. The opening of a burst diaphragm permits this gas to propel a small projectile down the launch tube at high speeds.
Bogdanoff et al. optimized the two-stage light gas gun by adjusting the pump tube length to the diameter ratio, the piston mass, and the hydrogen pressure, allowing a projectile of known shape and mass to be propelled at speeds of up to 15 km/s for debris shield design [
6]. Zheng et al. used a two-stage light gas gun to perform hyper-velocity impact studies on solar cell arrays and assessed the main mechanical damage characteristics [
7].
2.3. Electrical Exploding Foil Accelerator
Figure 4 depicts the working principle of a metallic foil electrically exploding driving flyer. The strong pulse current flows through the bridge foil, increasing the current density in the smallest cross-sectional area instantaneously. The bridge foil is transiently extended through solid, liquid, vapor, and plasma phases to drive the flyer layer. The barrel shearing produces the high velocity flyer. This technique offers benefits over explosive-driven flyers and light gas guns in terms of compact construction, ease of operation, and available high strain rate.
Wang et al. developed two sets of experimental apparatuses with different storage energies for launching hyper-velocity flyers and subsequently analyzing material dynamics and hyper-velocity impact models of space debris [
8]. Pal et al. investigated the functional relationship among the pressure amplitude and duration; the flyer plate velocity and thickness; and the target, which is established for the initiation of HNS-IV explosives by the impact of a 50 μm flyer and also enables the design of low energy initiating devices for various applications [
9].
2.4. Magnetically Accelerated Flyer
As illustrated in
Figure 5, a high current generated by the short-circuit load flows through the cathode and anode, resulting in the formation of a magnetic field B in the insulating gap. The interaction of the current density and magnetic field produces a magnetic pressure P, which induces compressive stress waves in the anode and cathode materials. The flyer moves independently of the surrounding anode without losing electrical contact owing to the stress wave propagation. The smoothly increasing pressure pulse provides a quasi-isentropic loading capable of launching the flyer at a high velocity.
Near-symmetric impact experiments for generating stress at the TPa level with relatively high accuracy can be achieved. In addition, in a single experiment, the isentropic line of a pressure range can be acquired, and multiple samples can also be launched simultaneously.
Lemke et al. implemented an ultra-high velocity plate impact experiment on the Z accelerator to obtain the equation for state data of a material compressed to multi-megabar pressure [
10]. Wang et al. designed two types of hyper-velocity flyer launch experiments with different load configurations, such as flyer plate size, current waveform, and diagnostic systems based on the output characteristics of the PTS accelerator [
11].
2.5. Laser-Driven Flyer
The laser launch process is depicted in
Figure 6. Flyer material is a metal sheet coated over a transparent substrate. A short laser pulse is used to irradiate the interface between the substrate and the flyer. A thin layer of the flyer surface facing the laser beam is vaporized to form plasma. Since the substrate is immobile and massive in comparison to the flyer, the plasma expands preferentially away from the substrate and then propels the remainder of the flyer material.
Flyer plates are typically disk-shaped with micron-level thicknesses, sub-millimeter-level diameters, and milligram-level masses. The laser-driven flyer provides a compact and convenient technique for imparting shocks to materials in excess of TPa with sub-nanosecond durations.
Okada et al. developed a laser-driven flyer system based on a high-power glass laser system. The system was demonstrated to be capable of accelerating the flyer to approximately 23 km/s while maintaining a very flat shape [
12]. Shui et al. carried out three approaches for launching hyper-velocity flyer experiments at the SG-III prototype laser facility, which provides a reference for further experimental studies on shock waves generated by flyer loading [
13].
The fundamental performance and features of different flyer launch techniques are listed in
Table 1.
Each of the aforementioned flyer launch technologies can accelerate flyer plates of various materials, sizes, and weights to precise velocities that are used in specialized applications. However, the pulse energy limits the velocity of the given flyer with fine morphology. Therefore, increasing flyer velocity is a critical issue that must be addressed. A feasible path is the combination of multiple driving principles. For example, the exploding foil initiator combines an exploding foil and an explosive, and the flyer is driven to a velocity to initiate the explosive, which propels the secondary flyer to a higher velocity [
14]. A two-stage light gas gun combines gunpowder and compressed gas to propel a high-velocity projectile. Nevertheless, these coupling techniques are series coupling, which results in input energy loss for the flyer velocity. Parallel coupling may be a more efficient method. For example, Zhu et al. used the laser to re-energize the metallic foil’s electrically exploding products, which improves the pressure and temperature of the plasma, allowing for the flyer’s hyper-velocity launch [
15]. It is clear that several challenges remain for parallel coupling, such as the coupling method, device integration, the flyer’s velocity, and morphology regulation.
3. Research Progress in Flyer Velocity
3.1. Investigation of Flyer Velocity
Generally, flyer velocity measurement technology can be divided into continuous methods and discrete methods. Continuous methods include displacement interferometers, velocity interferometers, and microwave interferometers. Photon Doppler velocimetry (PDV) and the laser displacement interferometer system for any reflector (DISAR) belong to the displacement interferometer category. The velocity interferometer system for any reflector (VISAR) and Fabry–Perot interferometer (FPI) are classified as velocity interferometers. The discrete method mainly involves optical beam blocking, magnetic velocity induction systems (MAVIS), sensor techniques, high-speed photography, and electrical probe methods.
3.1.1. PDV
Figure 7 shows the conventional PDV configuration. The initial laser beam is divided into two equal beams. One beam is delivered to the surface of a moving target and then reflected back to the detector, while the other beam is directly sent to the detector. A beat frequency is generated through the detector by combining the initial and reflected beams, and the accompanying signal is displayed with an oscilloscope. The target’s moving velocity is equal to half of the laser wavelength times the beat frequency [
16].
The most recent version of PDV has a larger detector bandwidth, as well as a higher sampling rate and bandwidth of the oscilloscope; it uses the latest fiber optic technology, making PDV useful for acquiring precise velocity data with high temporal and spatial resolutions. Zhu et al. investigated the flight of titanium flyers driven by small detonators. The rising, holding, and decreasing of flyer velocity was clearly observed in the velocity history collected by the PDV system [
17]. Banishev et al. developed a device that combines ultra-fast stroboscopic optical microscopy with PDV to investigate impact events of laser-launched flyers and glass targets [
18].
The traditional PDV equipment is compact, robust, and has strong speed measuring ability. PDV probes of various forms can be conveniently positioned in a variety of experimental configurations. Nevertheless, single-point measurements do not have the ability to quantify velocity distributions on the target line or in the plane. Time division multiplexing [
19], frequency division multiplexing [
20], and the spectroscopic approach [
21] are all methods for achieving multi-point measurement. Hodgin et al. built a 16-channel PDV system based on optical heterodyning and multiplexing technologies and employed it to measure the speed of an explosive-driven 3.8 μm thick Parylene flyer [
22]. Ling et al. developed a multi-point PDV system by incorporating an optical communication component that can divide the laser into several parts to deliver the light source to different lines. This device was used to measure the particle velocity of the back surface of Al targets of varying thicknesses under laser shock [
21].
3.1.2. DISAR
Figure 8 is a schematic illustration depicting the DISAR’s fundamental operation. A fiber splitter divides the laser beam into two parts: one is sent to a 3 × 3 single-mode fiber coupler and used as the reference light, while the other is transmitted through a single-mode fiber circulator and focused on the target surface by the measuring head. The reflected light will be redirected into the circulator. Only the light with the right modes can interfere with the reference light in the coupler. An oscilloscope will detect and record three output signals from the coupler [
23].
The single-mode fiber coupler produces a 120° phase shift among the three outputs, which not only improves signal resolution but also simplifies movement direction judgment. Furthermore, because each arm’s light intensity can be adjusted, the modulation depth of the optical interference signal is greatly improved. This method also does not cause fringe loss and can measure uniform moving targets [
24,
25]. Tan et al. used DISAR to estimate the velocities of Mylar flyer plates in order to investigate the influence of slight density changes in shock initiation characteristics [
26].
3.1.3. VISAR
Discrete VISAR
As shown in
Figure 9, the laser beam reflected from a mirrored specimen surface is split, and part of it is delayed before being recombined with the undelayed portion. Thus, the light frequency involving the Doppler shift induced by the moving specimen surface constantly interferes with the light frequency which existed at delay time τ. The constant λ/2τ, where λ is the laser light wavelength, quantifies interferometer sensitivity. In order to eliminate the luminous interference and improve the flyer surface reflectivity, it is generally necessary to conduct surface coating treatment on the flyer. However, due to the limitation of the photo-multiplier tube and oscilloscope, the time resolution of the VISAR in its typical configuration is inadequate to observe the events such as the study of detonation fronts.
Lefrançois et al. measured the highest velocities of aluminum samples on the GEPI with a VISAR interferometer. The stabilized velocity on the sample of 0.9 mm thickness was 7.65 km/s, and the thin one of 0.4 mm thickness reached 10.24 km/s before the extinction of the VISAR signal [
27].
When the observed signal frequency exceeds the recording system bandwidth due to a considerable acceleration of the object or a small fringe constant, high-frequency information from VISAR measurements is ignored. With the use of known target plate displacement or theoretical prediction, the lost fringe constant may be determined [
28]. Furthermore, the loss fringes may be identified by measuring the flyer velocity using two fringe constants with a non-integral multiple relation [
29]. Moreover, combining observations with the same delay but different dispersions could be beneficial [
30].
The typical VISAR has no spatial resolution, making multi-point or multi-directional measurements on the same target problematic. Installing multiple optical fiber probes to allow multichannel optical signals with velocity information to enter the interference cavities is a simple and cost-effective method. Yuan et al. used multi-point dual-sensitivity VISAR to measure the velocity histories of the metal hemisphere at three different angles and obtained the velocity-time curve of the flyer motion [
31].
All-Fiber VISAR (AFVISAR)
Discrete VISAR has many disadvantages such as complex optical path adjustment, insufficient spatial coherence, and low light energy utilization. With the advancement of optical fiber technology, AFVISAR was developed using the laser Doppler approach to tackle the concerns listed above.
Figure 10 diagrammatically depicts a typical AFVISAR system. The light from the fiber laser is directed to the 2 × 2 coupler I, where it is split into two beams. The two beams are routed to the 2 × 2 coupler II through the fiber direct line (L1) and the fiber delay line (L2), then subsequently to the moving object via the collimator. The reflected beams carrying moving information are returned to coupler II and subsequently to coupler I via the L1 or L2. In the coupler I, only beams with appropriate coherent paths might interfere. Wang et al. derived the relationship between the velocity of a moving object and the frequency of the interfered signal [
32]. AFVISAR is distinguished by its compact construction, short coherence length, easily adjustable light route, and any fringe constant. Guang et al. developed a two-point all-fiber VISAR system. Hong et al. established a two-point all-fiber VISAR and applied it to measure velocities on the same specimen impacted by the split Hopkinson pressure bar [
33].
Optically Recording Velocity Interferometer System (ORVIS)
With the exception of the streak camera recording interference fringe motion, the ORVIS system is similar to a VISAR system. The observed picture of a moving fringe pattern over time directly represents the velocity history of the monitored surface [
34]. The main advantage of ORVIS over VISAR is that the time resolution is mostly limited by the streak camera capacity. Furthermore, because of a continuous record of the shock velocity history, the ORVIS approach helps determine the stability of shock propagation in the sample.
As illustrated in
Figure 11, the laser beam from a laser passes through a collimating lens Ll to the monitored diffuse surface. The diffuse reflection is picked up and collimated by lens L1 and separated from the incoming beam by M1. The collimated return beam is reduced by the telescope and split into two equal parts by the beam splitter. After recombining the two beams at the beam splitter, a straight-line interference pattern is converted into a set of bright spots on the input slit of a streak camera. The cylindrical lens increases the intensity of interference patterns at the camera entrance slit without altering the fringe spacing.
Lu et al. constructed an ORVIS with tens of picosecond temporal resolution and applied it to laser-driven shock experiments [
35]. Bloomquist et al. developed an ORVIS to measure velocity with a time resolution of about 300 ps and employed it to measure the flyer velocity of a 25 μm thickness copper foil for studying the detonation-driven shock waves [
36].
Line-VISAR
There have been many improvements based on the ORVIS system involving imaging to provide spatially resolved velocimetry data along a line on the sample surface. This system is closely related to ORVIS and is referred to as “line-VISAR”.
The classic line-VISAR structure is shown in
Figure 12. A convergent probe beam is incident on the flyer surface through the imaging system. The reflected beam, which contains velocity information, is collected and fed into a pair of interferometers. Doppler shifts appear as fringe shifts at interferometer outputs. The fringes are focused through a relay lens on a narrow slit at the entrance of a streak camera and recorded to determine the development of the flyer velocity over time [
37,
38]. The line-VISAR has μm-level spatial resolution and ps-level temporal resolution when compared to discrete multi-point measuring technology. Furthermore, the scanning image can directly display the speed difference with space–time resolution.
Liu et al. developed a line-imaging velocity interferometer with 50 ps temporal resolution and 20 μm spatial resolution. In the velocity measurement experiment of the laser-driven Al flyer, the data processing results of the image recording provided a large amount of valuable information about the velocity and displacement distribution of a line on the target surface [
39].
Two-Dimensional (2D) VISAR
The VISAR system has been limited to measuring motion at points or lines across a target. The 2D-VISAR is introduced for monitoring motion across a 2D image. Unlike the line-VISAR, the 2D-VISAR uses a framing camera to record the 2D spatially resolved interference fringes of the entire surface at multiple times. The recording image plane and the target plane have a one-to-one corresponding object–image relationship to achieve continuous spatial resolution. The Doppler frequency shift of each point on the target plane is different, resulting in different phases of each point of the comb fringe. The phase of each point of the fringe can be obtained through data processing. The relationship between phase and velocity is given by Celliers [
40].
Liu et al. developed a framing–imaging VISAR with a spatial resolution of 5 μm and a velocity sensitivity of 15 m/s. This technique was employed to measure a 2D spatial velocity field of the laser-driven flyer and to reveal the continuous evolution of flyers [
41].
3.1.4. FPI
Figure 13 illustrates a schematic overview of the Fabry–Perot system. A multi-mode fiber is employed to guide laser light to the moving object. The interferometer is composed of a Fabry–Perot etalon with coated mirrors, and the interference pattern is captured by a streak camera. The wavelength of the incoming light determines the diameter of the interference fringe. As a result, the projectile velocity may be expressed in terms of the Fabry–Perot fringes’ instantaneous diameter. The temporal resolution is usually at the nanosecond level; however, for some studies, it is still limited by etalon settings and camera resolution.
Chen et al. developed an FPI system with nanosecond temporal resolution, a velocity resolution of 10 m/s, and a fringe constant of 1000 m/s. Based on this technology, velocity measurements for explosive-driven and electric gun-driven flyers were implemented [
42]. Saxena et al. investigated the feasibility of employing a single Fabry–Perot velocimeter for two surface velocity measurements in an experiment. This approach has been used to measure equations of state [
43].
As shown in
Figure 14, Goosman et al. designed a multi-beam Fabry–Perot velocimeter and used it to obtain high-resolution continuous data records of explosive detonations driving a copper flyer. The velocimeter allows recording the speed data of five channels in a single experiment. The optical fiber transmission system allows independent positioning of each channel to achieve spatial flexibility. Furthermore, each data channel has a variable recording length [
44].
The traditional FPI converts the wavelength change into the ring diameter change through the F–P etalon. However, the thick etalon for obtaining a clear image will lead to a slow response time, which is not enough to study the high-acceleration motion process. The F–P optical resonator can change the continuous wide spectrum of the incident light into the quasi-discrete spectrum of the transmitted light, so that it plays a role in frequency selection. Therefore, the absolute amount of Doppler frequency shift can be measured by using the F–P optical resonator. Compared with other laser interferometers, this method has the characteristics of fast response, low performance requirements for recording equipment, easy operation, compact structure, and low cost.
As shown in
Figure 15, the laser beam irradiates the flyer surface through the F–P probe and returns from the surface to port 3 with a Doppler frequency shift. The reflected beam is divided into two parts by the beam splitter. One part passes through the F–P optical resonator, and the transmitted light intensity I
1 generated by coherence is measured by photo-detector 1; the other part is directly monitored by photo-detector 2, thus producing light intensity I
2. The relative transmittance T(f) = I
1/I
2 is calculated for inversely solving the frequency, and then the speed–time curve can be obtained. Tang et al. developed a type of velocity interferometer on the basis of the F–P optical resonator. The polyimide flyer driven by an electric exploding foil is monitored by this system [
45].
3.1.5. Microwave Interferometer
As shown in
Figure 16, after the power amplification and distribution of the signal from the continuous microwave source, one channel passing through the attenuator is used as the local oscillation signal of the quadrature mixer; the other channel is transmitted to the flyer surface through the circulator and antenna and generates reflection. The reflected signal is input to the mixer after transiting the antenna, circulator, and low-noise amplifier. The output signal frequency, after mixing with the local oscillation signal, is amplified by the amplifier and recorded by the oscilloscope. A short-time Fourier transform on the collected signal is used for calculating the Doppler frequency shift, and then the flyer velocity is equal to the Doppler frequency shift times half of the electromagnetic wavelength.
The laser and microwave interferometric techniques are physically similar, without mentioning any technical details. Their main difference is the electromagnetic radiation frequency used. Because the microwave technology employs 3~4 orders of magnitude longer waves than the laser technique, it has several advantages. First, measurements in radio transparent materials are possible; second, the measured target’s surface roughness is ignorable; third, the recording system’s bandwidth needs are low; and fourth, a broad range of velocity measurement is possible. However, the microwave interferometry technology has clear drawbacks, such as limited temporal resolution and relatively low precision.
Jia et al. designed two microwave interferometers in the Ka and X-band. Complete interior ballistic data was obtained by combining the short-time Fourier transform and phase calculation [
46]. Belskii et al. studied the acceleration process of an aluminum plate driven by explosive detonation using a microwave interference diagnostic technique with a speed measurement range of 10 km/s [
47].
3.1.6. Optical Beam Blocking
The principle of the optical beam blocking method is shown in
Figure 17. During the experiment, the flying projectile blocks three parallel laser beams, and the blocked light signal is converted into a pulse electrical signal through the multi-channel laser velocimeter and then collected by the oscilloscope. The average velocity can be determined by reading the time interval of the falling front of the two pulse signals and combining it with the known distance. This method possesses a simple structure, is anti-vibration, and has high reliability.
Wang et al. established an all-fiber optical beam breakout measurement system with a velocity measurement range of up to 7 km/s and an extending uncertainty of less than 0.8%. The measurement result analysis revealed that the system could fulfill the requirements for accuracy and reliability in precise physical tests [
48].
3.1.7. MAVIS
The MAVIS is shown in
Figure 18. The permanent magnets are toroidal in shape; the coils are wound in the same direction; a capacitor is connected across the coil output for noise reduction; and a resistor on the output side of the coil is necessary for impedance matching. Eddy currents are induced in the metallic impactor as the projectile enters the field of the permanent magnet. The currents flowing in the impactor set up their own magnetic field, which interacts with the field of the permanent magnet. A current is therefore induced in the stationary pickup coil due to the approaching impactor field. This process is repeated with each pickup coil station. After the test, measurements are taken at or near the zero crossover points of the records to obtain the time interval needed to calculate the velocity.
This measurement method belongs to the non-contact measurement category and has high accuracy. When measuring the projectile speed of non-metallic flyers, it is necessary to add metal rings to realize magnetic induction, but this will increase the projectile mass, thus affecting the acquisition of high projectile speed. In addition, the structure and installation of the measuring device are relatively complex.
Shi et al. developed a magnet-induced system capable of measuring speeds ranging from 1 to 6 km/s. The system was used to monitor the projectile velocity on a two-stage light gas gun. Time observation and velocity measurement accuracy are 0.03% and 0.10%, respectively [
49]. Moody et al. used a magnetic induction approach to measure projectile velocities on the two-stage light gas gun. The device is designed to allow projectile speeds ranging from 3.5 to 6.5 km/s [
50].
3.1.8. Sensor Method
It is a simple, highly operable, and low-cost method for estimating the average flyer velocity by obtaining the time interval of the flyer passing through the given barrel by the piezoelectric sensor, piezoresistive sensor, or fiber probe.
Gu et al. used the quartz piezoelectric sensor to measure the speed of the aluminum flyer driven by a small laser. The photo-diode was used to receive the optical signal as time zero, and the sensor was arranged at the end of the barrel for collecting the flyer impact signal [
51]. It should be pointed out that the starting relaxation time of the flyer, the sensor response time, and the triggering time synchronization error should be considered. Yin et al. measured the average speed of an electrically exploding foil driving flyer by using an optical fiber as the probe. An optical fiber was located at the center of the barrel end face, and the light generated by the explosive foil entered the optical fiber through the flyer, thus forming an initial time. The mutation time of the optical fiber luminous flux caused by flyer impact was recorded. The average speed of the flyer was calculated by combining the barrel height [
52].
3.1.9. High-Speed Photography
Greenaway et al. used high-speed camera equipment to measure the velocity of the laser-driven flyer, which is comparable to the sensor approach [
53]. After a short flight, the flyer collided with a transparent window. The shock event generated enough light for photography. A streak image was taken with the camera facing the flyer; the average velocity of the flyer can be calculated from this. This approach is distinguished its simple operation, wide application, reliable results, and moderate accuracy. Nevertheless, the continual change in flyer velocity is not possible.
Flash X-ray photography is a kind of high-speed photography. The main difference between it and visible-light high-speed photography is that it uses a very narrow pulse width ray source, which makes it possible to record the shape and trajectory of the projectiles through the fire and smoke caused by the explosion or high-speed impact; it can also capture the change process of opaque objects.
Zhang et al. used the flash X-ray system to diagnose the flight attitude and target ballistic penetration process of the projectile on the non-powder-driven two-stage light gas gun [
54]. The X-ray beams irradiated the flying projectile and the corresponding optical negative was exposed. Simultaneously, a ruler inlaid with a lead scale line was placed on the photographic channel, and a picture of the scale on the negative background was taken during flash photography. The projectile flight distance during the two flashes was read on the negative film, and the projectile speed can be obtained by combining the time interval between the two flashes recorded by the timer. This method is intuitive and accurate, but it is very expensive.
3.1.10. Electric Probe Method
As shown in
Figure 19, the front end face of the flyer successively connects two probes with a spacing, which causes the discharge circuit to generate the signal output. The flyer speed can be obtained by interpreting the time interval between the two signals on the timing instrument.
The electric probe device is simple and convenient for on-site installation. However, it is still difficult to complete high-precision measurements for special-shaped flyers and non-metallic flyers. The contact measurement also affects the effective impact area of small-diameter flyers. In addition, when the environment medium is hydrogen, the hydrogen escaping to the front end of the flyer makes it easy to ionize the residual air at the tip of the charged probe, causing the probe to conduct ahead of time.
Jin et al. used multi-channel VISAR and electric probes to monitor the free-surface velocity history of a metal flyer driven by detonation in order to verify experimental results and analyze test system parameters affecting measurement precision [
55].
The aforementioned velocity measurement technologies are compared in
Table 2.
Most of the current flyer velocity measurement technologies are discussed, and each of them has clear advantages and disadvantages. In practical applications, researchers in a certain field are usually restricted by some measurement methods, which may be due to low measurement requirements, limited funding, or information asymmetry. This paper may lay the foundation for breaking the information asymmetry.
The development of the flyer velocity investigation technology mainly depends on measurement requirements. Some research, such as detonation reaction zone structure measurement, requires high spatial and temporal resolution; however, other research focuses on low cost and simple operation. In the future, a technical library of surveying velocity may be established and improved with the emerging measurement needs in fundamental research and application fields.
3.2. Factors Affecting Flyer Velocity
The driving process of the flyer is very complex, and it is difficult to accurately estimate the flyer speed with formulas. In general, the flyer speed is decided by the pulse energy source, parameters related to the flyer, and the flight environment. However, the specific influencing factors need to be determined according to the actual flyer-driving technology.
3.2.1. Explosive-Driven Flyer
Generally, the driving ability of the explosive is positively correlated with its density, while in other conditions it remains unchanged. Furthermore, Liu et al. found out that the flyer velocity can reach a high value when the length-to-diameter ratio of charges is 1.5, which considers the safety and space of the charge at the same time [
56].
According to the Gleny model, the flyer velocity is related to the flyer mass, and a flyer made of lighter material is beneficial to improve its speed. The flyer is mainly driven by the back-and-forth reflection of the shock wave in the flyer. When the charge structure remains unchanged, the flyer velocity decreases with increasing thickness. Chen et al. detected that the maximum flyer velocity is a power function of the flyer thickness [
57]. There is an optimal value for the flyer thickness of each material that maximizes the kinetic energy.
In addition, the barrel diameter should not be greater than the charge diameter under a certain charge structure. Considering the energy utilization rate, the barrel diameter is preferably equivalent to the charge diameter [
56].
Furthermore, Shu et al. studied the influence of submillimeter-sized gaps or cushions on the behavior of flyers propelled by the explosive detonation. According to the results, the jump-up velocity of the flyer under the effect of a submillimeter-sized cushion is lower than the case of the flyer attached to an explosive. However, the submillimeter-sized gap has a greater impact than the submillimeter-sized cushion [
58]. Li et al. obtained comparable results [
59].
Most of the existing work uses test or simulation methods to study the influence of a single factor on the flyer, and it is unable to grasp the correlation between the detonation structure parameters and the flyer effectiveness as a whole.
3.2.2. Light GAS Gun
According to the principle and physical assumptions of the first-stage gas gun, the formula of projectile velocity is as follows [
60]:
where
p0 is the initial air pressure of the air chamber,
V0 is the volume of the air chamber, m is the projectile mass,
ϕ is the virtual mass coefficient,
γ is the adiabatic index,
S is the cross-sectional area of the gas gun barrel, and
L is the barrel length.
In practical terms, increasing L after exceeding a certain value has little effect on the projectile velocity. Therefore,
L is generally (180~200)
D, where
D is the inner diameter of the barrel. Changing the chamber volume is also a feasible path, but the excessive increase will not only bring about many negative effects, such as increased gas consumption and prolonged gas filling time, but also lead to an unbearable environmental noise. It is economical and reasonable to reduce the mass for increasing the velocity. Usually, under certain other conditions, the desired speed can be obtained by controlling the projectile mass. Moreover, the friction of the projectile and the sealing ring, the acceleration of the gas molecules in front of the high-pressure gas, and other energy losses are inevitable, which will influence the projectile’s speed [
61].
The structures of a two-stage light gas gun and a three-stage light gas gun are complex, and there are many factors affecting the projectile speed. In the numerical simulation for analyzing the internal ballistic performance of the two-stage and three-stage light gas guns, some researchers considered the initial gas injection type and pressure, as well as temperature, powder charge, piston mass, projectile mass, pump tube diameter and length, diaphragm breaking force, high-pressure section taper, and piston shape [
62,
63].
It is undeniable that the launch performance is affected by the launch parameters and geometric dimensions of the light gas gun. Generally, the numerical simulation is economical to determine the best experimental effect.
3.2.3. Electrical Exploding Foil Accelerator
Zeng et al. simulated the velocity histories of flyers driven by exploding foils. The results showed that the flyer speed is mostly determined by the flyer mass, the bridge foil mass, and the burst current density. The calculated curves of flyer velocity history match the VISAR measurements nicely [
64]. However, the aforementioned code is not applicable to speed computation when the flyer’s edge effect does not match the one-dimensional criterion.
The traditional butterfly bridge wing structure will cause the electric explosion of the connection part between the bridge wing and the explosion zone, resulting in partial energy consumption in the bridge wing. Li et al. used the circular bridge wing to effectively improve the flyer speed, which contributes to enlarging the jump between the bridge wing and the blast zone, thus increasing the energy utilization rate [
65]. At the given charging voltage and flyer diameter, the bridge width descent leads to the increase in the current density within a certain range, which increases the flyer speed [
66]. Furthermore, the plasma energy generated by the electric explosion generally increases with the bridge’s thickness, which improves the flyer speed. However, the thick bridge foil may lead to a reduction in the electric energy absorbed, which will not provide enough expansion force to drive the flyer. Therefore, Fu et al. pointed out that “a critical foil thickness that relates to the maximum flyer velocity exists at a certain initiation energy” [
67].
In addition, when the charging voltage is low, the electric explosion can occur but be incomplete, resulting in the plasma temperature and electron density not being high enough to push the flyer. However, whether the flyer speed is linear with the charging voltage still needs further study [
68].
The flyer density also has a great influence on flyer velocity. With the increase in the flyer density, the flyer velocity noticeably decreases [
69].
3.2.4. Magnetically Accelerated Flyer
The speed of magnetically driven flyers can be expressed as follows [
70]:
where
ρ0 is the flyer material density,
D is the flyer thickness,
t is the time,
I0 is the peak current,
f(
t) is the time-dependent current waveform, and
S denotes the magnetic field scale factor. However, the above formula does not consider the ablation phenomenon accompanying the process of magnetically driven flyers, meaning that it does not consider the contribution of the expansion work of the ablation gas and does not consider the magnetic energy. Hence, the estimated result is less than the experimental measurement value of 10~15%.
In theory, the higher the rising rate of the drive current, the higher the flyer speed obtained. However, in fact, the high rising rate of the loading current will lead to forming an impact on the flyer, thus the flyer temperature will rise rapidly. Therefore, the internal energy will increase significantly, which causes a drop in the flyer speed [
71]. In addition, a reasonable reduction in the plate length can decrease the inductance and resistance of the load circuit, which will help to improve the flyer speed [
72].
3.2.5. Laser-Driven Flyer
The main parameters of the laser include wavelength, pulse width, the diameter of the focused spot, and laser power density. There is a noticeable shortage in wavelength [
73] and pulse width [
74] studies. Other parameters are essentially the distribution of laser energy in time and space. Brown et al. put forward that “the maximum attainable flyer speed with the larger laser varied from glass substrate to substrate” [
75]. However, there is currently no convincing explanation for this phenomenon.
The parameters of the metal film and transparent substrate cannot be ignored. In terms of metal film materials, it is generally believed that a flyer with a lower thickness, lower density, and smaller diameter has a faster speed under the condition without affecting the integrity and flatness of the flyer; this has been verified both experimentally and theoretically [
76]. The metal film used to launch high-speed flyers requires high density, good thickness uniformity, and high adhesion between the film and the substrate. The flyer target prepared by magnetron sputtering and ion beam sputtering has better quality than electron beam evaporation and field-assisted thermal diffusion. The experimental results show that the flyer target prepared by magnetron sputtering and ion beam sputtering can obtain higher flyer speeds [
77]. Moreover, the amount of laser energy allowed to penetrate the transparent substrate is limited. The substrate material may be damaged if the laser energy is too large, thus leading to a reduction in driving capacity. The thickness and strength of the substrate material directly affect the plasma confinement and the shock wave loss, which clearly limits the flyer speed. However, there are few literature reports on the effect of substrate materials on flyer speed [
78].
The optimal constraint and shear effect of the barrel will be formed when its diameter is basically the same as that of the ablation hole produced by the laser. Therefore, the effect of the barrel diameter on the flyer velocity is inconspicuous [
79]. Furthermore, the flyer velocity evidently decreases with the increase in the barrel length. Some studies suggest that the shock wave generated at the front of the flyer due to the presence of air will absorb the flyer’s energy, thus causing a drop in the flyer speed [
80].
In summary, research on the laws of various factors affecting laser-driven single-layer flyers has achieved certain results, but many of their aspects remain ambiguous or contentious, necessitating more study in both theoretical models and experimental designs.
The main factors affecting the flyer speed are summarized in
Table 3.
4. Research Progress of Flyer Morphology
4.1. Investigation of Flyer Morphology
4.1.1. Streak Photography
A high-speed streak camera can capture the side image of the flyer during flight. The integrity and one-dimensional planarity of the flyer are qualitatively judged by analyzing the obtained image. Due to the problems of real-time auto-focusing and depth of field change, it is difficult to obtain frontal images of the moving flyer.
As shown in
Figure 20, Watson et al. employed a Q-switched Nd: YAG laser to launch flyer plates and evaluated the integrity of the flyers based on threshold timings and distances prior to plasma penetration using streak photography and microscopy of the impacted flyers [
81].
4.1.2. Interferometer Technology
The multi-point VISAR and PDV are available for investigating the flyer’s planarity. The free-surface velocities of many locations on the different target radii are tracked simultaneously in the experiment. The displacement variations between the recorded positions at each moment reveal the flyer’s planarity vs. time. Although these approaches give surface fitting of displacements at various points, their spatial resolutions are limited. Li et al. used the multi-point VISAR to investigate the planarity of the explosion wave. An explosive element propelled the steel disk. The six fiber detectors were positioned at two different target radii. The displacement difference between the measured points clearly demonstrated that the planarity of the explosion wave was good during the primary movement but worsened over time [
82].
The free surface velocity profile of the flyer can also be measured by line-imaging VISAR, and the one-dimensional planarity during the flying process of the flyer is derived by the time dispersion of the fringe movement or the shape of a shock wave in the sample. Shui et al. used a line-imaging VISAR to observe the flyer velocity curve of a laser-driven flyer. The experimental results showed that for the dispersion of the flyer’s start time, the second and third acceleration times are far less than the flyer start time, indicating that the flying attitude of the flyer was maintained well [
13].
Two-dimensional imaging VISAR is the further development of line-imaging VISAR technology. It can bring about the velocity distribution measurement of the flyer surface at different times, providing more accurate and abundant information on the flyer’s planarity and integrity. Liu et al. developed a framing–imaging VISAR for measuring the integrity and planarity. The technique was employed to measure a two-dimensional spatial velocity field of a laser-driven Cu flyer, and to reveal the continuous evolution of the flyer [
83].
4.1.3. Shadowgraphy
Shadow-graphic imaging with ns time resolution has been used to investigate flyer flatness and integrity [
84]. The arrangement, as illustrated in
Figure 21, works in three modes: surface-parallel mode, transmission mode, and reflectivity mode. Back illumination is achieved by a probe laser pumping a fluorescent dye in various positions depending on the measuring mode. A CMOS camera [
85], CCD camera [
86], or intensified CCD (ICCD) camera [
18] is used to visualize the process. A digital pulse/delay generator controls the delay between the pump and probe laser pulses. A computer-controlled system can change the fluence, location, and time delay, as well as shoot a series of photographs. Each image is captured with a separate pulse and corresponds to a different location on the sample. However, shadowgraphy can only provide a rough outline of the flyer, and it is still one-dimensional information.
Ji et al. observed the transient shadow photograph of the flyer by the shadow photograph system. A detection beam parallel to the bottom side of the barrel was used to illuminate the flyer and the shadow was recorded by a high-speed CCD camera. The measured shadowgraphs clearly reflect the planarity and integrity of the flyer [
87].
4.1.4. Digital in-Line Holography (DIH)
The experimental configuration of DIH is shown in
Figure 22. A polarizing beam splitter is used to align the outputs of two particle image velocimetry (PIV) lasers onto a common path. Before traveling through the particle field, the combined beam is spatially filtered to produce an approximately Gaussian profile that is expanded and collimated. The resulting diffraction patterns are enlarged with a dual-port Infinity K2 Long Distance microscope, split with a polarizer, and imaged on two LaVision ProX interline transfer CCDs.
Yeager et al. investigated the three-dimensional morphology, position, and velocity distribution of detonator output flyers using the DIH diagnostic. The DIH technology photographs clearly show the visual contour and shock wave pattern of each flyer [
88].
4.1.5. X-Ray Diagnostic Method
Figure 23 depicts a typical X-ray diagnostic technique experimental design, which offers unique potential for ultra-fast measurements of investigating materials under impact loading with high temporal and spatial resolution [
89,
90]. The X-ray beam travels through a succession of fast/slow shutters and mechanical slits and interacts with the sample before colliding with a scintillator in the detecting system. Jensen et al. expounded the operation details of this technique [
91].
Willey et al. demonstrated the capacity to image and reconstruct three-dimensional (3D) pictures of exploding foil initiators in operation. A four-camera system acquired the images from successive X-ray pulses from each shot. A 3D image of the flyer was constructed using several captures at varied incidence angles and advanced computed tomography reconstruction methods [
92].
4.1.6. Optical Fiber Probe Method
As shown in
Figure 24, an intense optic pulse is created when the flyer collides with the fiber probe tip. An oscilloscope records the signal after the pulse is sent to a photodetector. The arrival times can be read, and the time disparities between positions can be fitted with a curved surface to acquire information about the flyer’s planarity. The fiber probe is passive and has electromagnetic interference immunity; its response time can reach the sub-nanosecond. This approach can directly measure metal and nonmetal materials. Several probes should be symmetrically placed out to precisely assess the flyer planarity. However, the thin flyer is easily destroyed by the probe.
Wang et al. developed a fiber-optic probe diagnostic system for measuring shock arrival time by utilizing the shock-induced luminescence of fused quartz. This system was used to measure the flatness of Mylar film loaded by electric blasting [
93].
4.1.7. Transient Imaging Displacement Interferometry (TIDI)
TIDI has been used to investigate surface morphological changes produced by laser ablation, and image reconstruction may be accomplished by data analysis utilizing a two-dimensional Fourier transform [
94]. Greenfield et al. described the TIDI operating principle in detail [
95] and utilized TIDI to obtain a full-field surface displacement image of the copper target. A displacement sensitivity of 10 nm and a lateral spatial resolution of 5 μm were achieved within a 1 mm
2 field-of-view. Eight displacement maps are permitted for a single loading event, making it possible to trace the progression of the surface motion [
96].
The aforementioned flyer morphology investigation technologies are compared in
Table 4.
4.2. Factors Affecting Flyer Morphology
4.2.1. Explosive-Driven Flyer
The detonation mode can affect the flyer morphology. If the charge is point initiation, the detonation wave has a spherical form and propagates along the charge axis. When the detonation wave reaches the flyer, the flyer center is accelerated first, and the outer side of the flyer lags behind affecting the flatness and integrity of the flyer. However, the above effect is not evident when the flyer diameter is small. Chen et al. calculated the process of HNS-IV explosive driving titanium alloy flyers of varying diameters and obtained the velocity and displacement distribution of flyers at different positions in the radius direction. The simulation results showed that the shock wave reflection drive is the main reason of the flat shape [
57].
For the MEMS booster train based on microcharges, the flyer morphology is closely related to the mechanical properties of the flyer material. The integrity of a metal flyer is mostly determined by the effective plastic failure strain, whereas the integrity of a non-metallic flyer is primarily determined by Young’s modulus. Guo et al. used numerical modeling and experimental methods to examine the impacts of several materials involving Ti, Cu, Al, and PI on flyer morphology; the results showed that only titanium flyers had good integrity [
97].
In addition, for ensuring a good flyer shape, the barrel diameter should not be greater than the charge diameter; otherwise, the flyer will be seriously bent and prone to fracture. Liu et al. obtained the following results through numerical simulation: as the barrel diameter increases, the kinetic energy of the flyer increases gradually, but the flyer breaks due to the excessive diameter [
56].
4.2.2. Light Gas Gun
The projectile’s end face will be inclined and bent after being propelled by the launch tube, which is caused mostly by the geometric precision of the muzzle, the clearance tolerance between the projectile and the launch tube, and improper installation [
62]. However, a quantitative assessment of the projectile plate’s impact angle is absent. With the advancement of precision machining technology, the projectile’s impact angle may be regulated within 10
−3 rad degrees, satisfying the requirements of a one-dimensional plane impact.
4.2.3. Electrical Exploding Foil Accelerator
Wang et al. investigated the integrality of a Mylar flyer propelled by an electric gun. The experimental results revealed that the barrel materials and the cutting-edge design have no discernible effect on the flyer’s integrality. Nevertheless, an intact flyer can be obtained when the barrel size is slightly smaller than that of the bridge foil [
98].
The flyer material has a significant impact on the flyer’s motion properties. Wang et al. observed that the metal/polyester film composite flyer is more conducive to sustaining the flyer’s flight attitude than the single polyester film flyer. The explanation for this might be that the metal layer is more ductile, robust, and mechanically strong than polyester film [
69].
4.2.4. Magnetically Accelerated Flyer
The planarity of magnetically accelerated flyers is directly connected to the driving pressure uniformity determined by the current density distribution. The main factors influencing the current density distribution are the panel arrangement and dimension.
Ao et al. investigated the cause of the nonuniformity of current distribution along the panels and identified optimal sample locations on the panel through 3D simulations. By lengthening the panel, a multiple sample panel was designed to decrease pressure nonuniformities. The current shaping notches at the panel’s base are used to reduce the non-uniformity of current on the panels. The notches efficiently direct magnetic field concentrations at the panel edges toward the central region of the panel. Tapering the width of the panel from the entrance end to the shorting end would be an alternate design to reduce panel nonuniformity. In addition, the panel widths were extended directly at the shorting contact to reduce the elevated magnetic field induced by the 180° hairpin turn of the current route at the current contact. The panel ears have been shown to efficiently smooth out magnetic field concentrations around the current contact [
99]. Zhang et al. improved the “notch” and “ear” structure sizes and compared the tapered panel design, resulting in a magnetic field with high uniformity [
72].
4.2.5. Laser-Driven Flyer
The flyer is severed due to velocity gradients caused by an uneven laser intensity distribution. Therefore, there is a strong relationship between laser beam profiles and flyer shape. Some studies show that the planarity and integrity of the flyer formed by the “top-hat” laser are superior to those formed by the “hot-spot” laser [
100]. As a result, it is critical to pick an appropriate optical device group in order to generate a uniform laser beam for producing complete and flat flyers.
The mechanical characteristics of the flyer are directly affected by the preparation process. Dong et al. examined four flyer production methods: field-induced thermal diffusion, adhesive film, coating membrane, and magnetron sputtering. The experimental results reveal that the flyer generated by magnetron sputtering is entirely broken due to its brittleness, whereas other techniques yield flyers with high integrity [
101]. Niu et al. pointed out that there is an ideal match relation between the foil’s adhesion to the substrate, shear strength, and tenacity for producing an excellent integrity flyer [
102]. The effect investigation of the preparation process is currently at the stage of simple comparison. Further study should clarify and quantitatively assess the structural characteristics of the flyer and connect them to the flyer’s flatness and integrity.
The integrity and flatness are inextricably linked with the extraordinarily sophisticated damage process of the flyer during flight. Nevertheless, given enough time and travel distance, a laser-driven flyer would fracture due to the combined action of plasma erosion, spall effect, and impact melting [
81]. The impact of plasma on flyers should be investigated further, as should the effect of the barrel on flyers.
The main factors affecting the flyer morphology are summarized in
Table 5.
5. Conclusions and Perspectives
Five common flyer-driving technologies are presented from the perspectives of the launch principle, research status, and technical characteristics. It can be deemed that the coupling of multiple driving principles is a development direction for next-generation flyer-driving technology. Moreover, research progress in flyer velocity and morphology is reviewed from the two aspects of characterization methods and interfering factors, respectively. After decades of development, the flyer velocity-determining technologies for point, line, or plane measurement are relatively comprehensive, and flyer morphology with 1D, 2D, or 3D information can also be acquired. However, some of these technologies are still a long way from being widely used. The flyer velocity is usually required for the condition of acceptable flyer morphology; therefore, these two parameters should be investigated at the same time if measurement conditions allow. Influencing factors are inspected from the aspects of pulse energy source, flyer characteristics, and the flight environment. The above test methods provide means for the study of influencing factors. However, the research methods are mainly limited to comparative research, and simulation analysis and influencing mechanisms are still superficial. In fact, the method for studying the same influencing factors can be used as a reference among different flyer-driving technologies.
In the future, there are still some problems to be further studied: (1) Develop a physical model that can more comprehensively and systematically describe the flight process and cover all kinds of influencing factors in the process, so as to better predict the flyer’s speed and achieve the purpose of guiding engineering design. (2) Determine the factors affecting the flatness and integrity of the flyer, obtain the physical laws of these factors acting on the flyer, and guide the design and preparation methods of the flyer. (3) Define a parameter system that can quantitatively describe the flatness and integrity of the flyers and develop an experimental system that can measure and calculate these parameters to obtain empirical formulas that can guide engineering practice.
Author Contributions
Conceptualization, G.Z.; investigation, C.F.; writing—original draft preparation, G.Z.; writing—review and editing, G.Z. and Y.Z. All authors have read and agreed to the published version of the manuscript.
Funding
This research was funded by Natural Science Basic Research Plan in Shaanxi Province of China, grant number 2022JQ-486 and China Postdoctoral Science Foundation, grant number 2020M680156.
Institutional Review Board Statement
Not applicable.
Informed Consent Statement
Not applicable.
Data Availability Statement
Data are contained within the article.
Conflicts of Interest
The authors declare no conflict of interest.
References
- Jing, F.; Chen, J. Principle and Technology of Dynamic High-Pressure, 1st ed.; National Defense Industry Press: Beijing, China, 2006. [Google Scholar]
- Venkataramudu, B.; Gautam, P.C.; Paman, A.; Madhu, V.; Gogia, A.K. Dynamic properties of RHA steel under planar shock loading using explosive driven plate impact system. Def. Sci. J. 2015, 65, 196–202. [Google Scholar] [CrossRef] [Green Version]
- Jin, K.; Xi, F.; Tan, Y.; Liu, X.; Dai, C.; Cai, L.; Wu, Q. Precise control technique for flatness of flyer under explosive loading. Chin. J. High Press. Phys. 2013, 27, 807–812. [Google Scholar]
- Xie, R.; Li, L.; Liu, L.; Ren, X.; Xue, Y. Study of design and performance of micro initiation train. Acta Armamentarii 2017, 3, 460–465. [Google Scholar]
- Glavier, L.; Nicollet, A.; Jouot, F.; Martin, B.; Barberon, J.; Renaud, L.; Rossi, C. Nanothermite/RDX-based miniature device for impact ignition of high explosives. Propellants Explos. Pyrotech. 2017, 42, 308–317. [Google Scholar] [CrossRef]
- Bogdanoff, D. Design of a two-stage light gas gun for muzzle velocities of 10–11km/s. In Proceedings of the 67th Meeting of the Aeroballistic Range Association, Toledo, Spain, 2–7 October 2016. [Google Scholar]
- Zheng, J.; Niu, J.; Zhong, H.; Gong, Z.; Cao, Y. Hypervelocity impact damage properties of solar arrays by using two-stage light gas gun. Acta Phys. Sin. 2019, 68, 220201. [Google Scholar] [CrossRef]
- Wang, G.; He, J.; Zhao, J.; Tan, F.; Sun, C.; Mo, J.; Xiong, X.; Wu, G. The techniques of metallic foil electrically exploding driving hypervelocity flyer to more than 10 km/s for shock wave physics experiments. Rev. Sci. Instrum. 2011, 82, 095105. [Google Scholar] [CrossRef] [PubMed]
- Pal, D.K.; Singh, S. Short duration high amplitude shock generation by thin flyer impact mechanism for initiation of explosives. In Proceedings of the 5th National Symposium on Shack Waves, Chandigarh, India, 26–28 February 2018. [Google Scholar]
- Lemke, R.W.; Knudson, M.D.; Davis, J.P. Magnetically driven hyper-velocity launch capability at the Sandia Z accelerator. Int. J. Impact Eng. 2011, 38, 480–485. [Google Scholar] [CrossRef] [Green Version]
- Wang, G.; Guo, S.; Shen, Z.; Zhang, Z.; Liu, C.; Li, J.; Zhang, Z.; Jia, Y.; Zhao, X.; Chen, H.; et al. Recent advances in hyper-velocity flyer launch experiments on PTS. Acta Phys. Sin. 2014, 63, 196201. [Google Scholar] [CrossRef]
- Okada, K.; Wakabayashi, K.; Takenaka, H.; Nagao, H.; Kondo, K.; Ono, T.; Takamatsu, K.; Ozaki, N.; Nagai, K.; Nakai, M.; et al. Experimental technique for launching miniature flying plates using laser pulses. Int. J. Impact Eng. 2003, 29, 497–502. [Google Scholar] [CrossRef]
- Shui, M.; Chu, G.; Xi, T.; Zhao, Y.; Fan, W.; He, W.; Shan, L.; Zhu, B.; Xin, J.; Gu, Y. Experimental progress of laser-driven flyers at the SG-III prototype laser facility. Acta Phys. Sin. 2017, 66, 064703. [Google Scholar] [CrossRef]
- Scholtes, J.; Prinse, W.; Bouma, R.; Meuken, B. Development of exploding foil initiators for future IM. In Proceedings of the 2007 Insensitive Munitions & Energetic Materials Technology Symposium (IMEMTS), Miami, FL, USA, 15–18 October 2007. [Google Scholar]
- Zhu, P.; Wang, K.; Wu, L.; Zhang, W.; Hu, Y.; Ye, Y.; Shen, R. Method and Device for Loading High-Speed Flyer Based on Electric Explosion and Laser Coupling. China Patent CN113675705A, 19 November 2021. [Google Scholar]
- Dolan, D. Extreme measurements with Photonic Doppler Velocimetry (PDV). Rev. Sci. Instrum. 2020, 91, 051501. [Google Scholar] [CrossRef] [PubMed]
- Zhu, Z.; Hu, Y.; Wu, L.; Ye, Y.; Shen, R. Investigation on flyer velocity driven by miniature detonators based on the PDV technology. Explos. Mater. 2016, 45, 56–61. [Google Scholar]
- Banishev, A.; Shaw, W.; Bassett, W.; Dlott, D. High-speed laser-launched flyer impacts studied with ultrafast photography and velocimetry. J. Dyn. Behav. Mater. 2016, 2, 194–206. [Google Scholar] [CrossRef] [Green Version]
- Brook, J. A frequency-shifted, time-multiplexed many-point PDV system. In Proceedings of the 6th Annual Photonic Doppler Velocimetry (PDV) Workshop held at Lawrence Livermore National Laboratory, Livermore, CA, USA, 3–4 November 2011. [Google Scholar]
- Charrett, T.; Bledowski, I.; James, S.; Tatam, R. Frequency-division multiplexing (FDM) for interferometric referencing and multi component measurements in Planar Doppler Velocimetry (PDV). In Proceedings of the 17th International Symposium on Application of Laser Techniques to Fluid Mechanics, Lisbon, Portugal, 7–10 July 2014. [Google Scholar]
- Ling, C. Research on Multi-Point Photonic Doppler Velocimetry and Its Applications on Shock Wave Physics. Master’s Thesis, University of Chinese Academy of Sciences, Beijing, China, 2014. [Google Scholar]
- Hodgin, R.; May, C.; Roos, E.; Hansen, D. Multiplexing PDV (MPDV-X16) heterodyning. In Proceedings of the 6th Annual Photonic Doppler Velocimetry (PDV) Workshop, Livermore, CA USA, 3–4 November 2011. [Google Scholar]
- Weng, J.; Tan, H.; Wang, X.; Ma, Y.; Hu, S.; Wang, X. Optical-fiber interferometer for velocity measurements with picosecond resolution. Appl. Phys. Lett. 2006, 89, 111101. [Google Scholar] [CrossRef]
- Wang, D.; Li, Z.; Peng, Q. Direction-judgable fiber displacement interferometer for vibration measurement. Opto-Electron. Eng. 2009, 36, 86–89. [Google Scholar]
- Wang, D.; Li, Z.; Wu, J.; Liu, S.; Liu, J.; Meng, J.; Peng, Q.; Chen, G.; Liu, Q. An optical-fiber displacement interferometer for measuring velocities of explosively-driven metal plates. Explos. Shock Waves 2009, 29, 105–108. [Google Scholar]
- Tan, K.; Han, Y.; Cao, L.; Wen, S.; Wang, X.; Ye, H. Effect of slight density change on short-duration shock initiation characteristics of TATB-based polymer bonded explosive. Acta Armamentarii 2018, 39, 468–473. [Google Scholar]
- Lefrancois, A.; Chanal, P.; Blanc, G.; Petit, J.; Avrillaud, G.; Delchambre, M. High-velocity flyer-plate developments on two high-pulsed-power generators based on a strip-line design (GEPI and CEPAGE). IEEE Trans. Plasma Sci. 2011, 39, 288–293. [Google Scholar] [CrossRef]
- Li, Z.; Yao, J. Signal loss and determination of lost fringe number in visar application. Explos. Shock Waves 1999, 19, 182–187. [Google Scholar]
- Chen, G.; Li, Z.; Liu, Y.; Ma, R.; Liu, J. Flyer velocity measurement using double-sensitivity VISAR. Chin. J. High Press. Phys. 2001, 15, 70–74. [Google Scholar]
- Dolan, D.; Specht, P. VISAR Analysis in the Frequency Domain. J. Dyn. Behav. Mater. 2017, 3, 407–411. [Google Scholar] [CrossRef]
- Yuan, S.; Peng, Q.; Yu, D.; Liu, J.; Ma, D. Multi-point dual sensitivity VISAR measurement of free surface velocity of metal flyer driven by detonation. Explos. Wave Shock Wave 2005, 3, 122–124. [Google Scholar]
- Wang, L.; Meng, X.; Lv, Z. Analysis of measuring error for AFVISAR system. Proc. SPIE-Int. Soc. Opt. Eng. 2008, 7128. [Google Scholar] [CrossRef]
- Hong, G.; Jia, B. All-fiber multipoint VISAR. Microw. Opt. Technol. Lett. 2007, 49, 122–124. [Google Scholar] [CrossRef]
- Bloomquist, D.; Sheffield, S. Optically recording interferometer for velocity measurements with sub-nanosecond resolution. J. Appl. Phys. 1983, 54, 1717–1722. [Google Scholar] [CrossRef]
- Lu, J.; Shan, Y.; Zhou, C.; Tang, X. Optically recording velocity interferometer system for measurement of equation of state. At. Energy Sci. Technol. 2006, 40, 129–132. [Google Scholar]
- Bloomquist, D.; Sheffield, S. Optically recording velocity interferometer system (ORVIS) for sub-nanosecond particle-velocity measurements in shock waves. In Proceedings of the 15th International Congress on High Speed Photography and Photonics, San Diego, CA, USA, 21–27 August 1983. [Google Scholar]
- Wu, Y.; Wang, F.; Li, Y.; Wang, Q.; Jiang, S. Research on a wide-angle diagnostic method for shock wave velocity at SG-III prototype facility. Nucl. Fusion 2018, 58, 076003. [Google Scholar] [CrossRef]
- Philpott, M.; George, A.; Whiteman, G.; De’Ath, J.; Millett, J. The application of line imaging velocimetry to provide high resolution spatially resolved velocity data in plate impact experiments. Meas. Sci. Technol. 2015, 26, 125204. [Google Scholar] [CrossRef]
- Liu, S.; Li, Z.; Peng, Q.; Chen, G.; Liu, J.; Meng, J.; Yuan, S. Line-imaging velocity interferometer for laser driven flyer diagnostics. High Power Laser Part. Beams 2010, 22, 2281–2284. [Google Scholar]
- Celliers, P.; Erskine, D.; Sorce, C.; Braun, D.; Landen, O.; Collins, G. A high-resolution two-dimensional imaging velocimeter. Rev. Sci. Instrum. 2010, 81, 035101. [Google Scholar] [CrossRef]
- Liu, S.; Lei, J.; Chen, G.; Liu, J.; Wen, W.; Yuan, S.; Peng, Q.; Li, Z. Simultaneous line imaging and plane framing imaging velocity interferometer for shock physics. Chin. J. Lasers 2014, 41, 0108007. [Google Scholar]
- Chen, G.; Liu, S.; Liu, Q.; Meng, J.; Li, Z.; Peng, Q.; Li, T.; Liu, J. Fabry-Perot interferometry for high-speed flyer velocities measurement. Laser Optoelectron. Prog. 2010, 47, 111201. [Google Scholar] [CrossRef]
- Saxena, A.; Kaushik, T.; Rawool, A.; Gupta, S. Equation of state measurements using single Fabry-Perot velocimeter. J. Phys. Conf. Ser. 2012, 377, 012049. [Google Scholar] [CrossRef]
- Goosman, D. The multibeam Fabry-Perot velocimeter: Efficient measurement of high velocities. Sci. Technol. Rev. 1996. Available online: https://www.osti.gov/biblio/376816 (accessed on 20 March 2023).
- Tang, X.; Li, J.; Zhang, D.; Tao, Y.; Liu, H. Measurement of high-speed flyer using F-P cavity interferometer. Laser Technol. 2007, 31, 172–174. [Google Scholar]
- Jia, X.; Tang, L.; Weng, J.; Ma, H.; Tao, T.; Liu, S.; Chen, L.; Zhang, L.; Wang, X. Microwave velocity interferometry for the parameter diagnosis of the interior ballistic of a two-stage light gas gun or powder gun. Explos. Shock Waves 2022, 42, 1–10. [Google Scholar]
- Belskii, V.; Mikhailov, A.; Rodionov, A.; Sedov, A. Microwave diagnostics of shock-wave and detonation processes. Combust. Explos. Shock Waves 2011, 47, 639–650. [Google Scholar] [CrossRef]
- Wang, W.; Chen, H.; Wang, X. Compact all fiber interior ballistic projectile velocity measurement system. J. Appl. Opt. 2011, 32, 723–729. [Google Scholar]
- Shi, S.; Chen, P.; Huang, Y. Velocity measurement of magnet induced system for projectile. Chin. J. High Press. Phys. 1991, 5, 205–214. [Google Scholar]
- Moody, R.; Konrad, C. Magnetic Induction System for Two-Stage Gun Projectile Velocity Measurements; Sandia Report, SAND84-0638, UC-13; National Technical Information Service U.S. Department of Commerce: Springfield, VA, USA, 1984.
- Gu, Z.; Sun, C.; Liu, C.; Zhang, N.; Luo, L. The measurement of the average velocity of flyer driven by mini size laser. High Power Laser Part. Beams 2001, 13, 309–312. [Google Scholar]
- Yin, Q.; Guo, F.; Zheng, H. Flyer velocity measurement using optical fiber and its application. In Proceedings of the 8th National Conference on Explosive Mechanics, Jiangxi, China, 19 September 2007. [Google Scholar]
- Greenaway, M.; Proud, W.; Field, J.; Goveas, S. A laser-accelerated flyer system. Int. J. Impact Eng. 2003, 29, 317–321. [Google Scholar] [CrossRef]
- Zhang, X.; Tang, R.; Hu, Z.; Zhou, G.; Shao, X.; Zhang, D.; Zhu, Y.; Wang, J. Application of flash X-ray system in the experiment of two-stage light gas gun. In Proceedings of the 2nd National Symposium on Experimental Techniques in Mechanics of Explosion, Henan, China, 5 August 2002. [Google Scholar]
- Jin, S.; Chen, Y.; Tang, T.; Peng, Q.; Meng, J. Comparison of multi-channel VISAR and electric probe technology in measuring free-surface velocity of metal flyer. Chin. J. High Press. Phys. 2012, 26, 571–576. [Google Scholar]
- Liu, R.; Nie, J.; Jiao, Q.; Xu, X. Simulation analysis of influencing factors of flyer driven by small-size JO-9C booster explosive. Acta Armamentarii 2020, 41, 246–253. [Google Scholar]
- Chen, Q.; Ma, T.; Li, Y. Numerical simulation of velocity and shape of the flyer driven by HNS-Ⅳ explosive. Chin. J. Energetic Mater. 2018, 10, 814–819. [Google Scholar]
- Shu, J.; Zhang, X.; Pei, H.; Zheng, X.; Liu, C. Influence of the submillimeter-sized gap or cushion on the behavior of flyer driven by detonation. Chin. J. Energetic Mater. 2021, 5, 381–388. [Google Scholar]
- Li, T.; Liu, M.; Wang, X.; Chen, H.; Wang, P. Effects of explosive device with foam cushion and air clearance on kinetic characteristic of steel flyer under detonation loading. Chin. J. High Press. Phys. 2018, 32, 044202. [Google Scholar]
- Fan, X.; Zhao, J.; Feng, Z.; Ma, C.; Li, M. Effect of chamber optimization of gas gun on the initial velocity of projectile. Mach. Des. Manuf. Eng. 2019, 2, 21–24. [Google Scholar]
- Zhang, X.; Zhou, G.; Zhang, D.; Jiang, X. Selection of structural parameters of first-stage gas gun. Explos. Shock Waves 2003, 23, 225–226. [Google Scholar]
- Yang, J. Simulation of space debris hyper-velocity impact using two stage light gas gun. Spacecr. Environ. Eng. 2006, 1, 16–22. [Google Scholar]
- Xiao, Y. Numerical Simulation and Optimization of Interior Ballistic Processes in the Three-Stage Light Gas Gun. Master’s Thesis, Nanjing University of Science and Technology, Nanjing, China, 2014. [Google Scholar]
- Zeng, Q.; Zhao, Y.; Liang, Q.; Yuan, S. Design and application of flyer velocity model accelerated by electric exploding foil. Chin. J. Explos. Propellants 2008, 31, 50–53. [Google Scholar]
- Li, Y.; Zhou, Q.; Wang, Y. Study on electrical characteristics and flyer velocity of exploding foil with different foil wing shapes. Initiat. Pyrotech. 2020, 4, 16–18. [Google Scholar]
- Wang, D.; Wang, K.; Wang, D.; Li, N. Influence of bridge foil size on electric initiation parameters of slapper. Initiat. Pyrotech. 2010, 6, 17–19. [Google Scholar]
- Fu, Q.; Jiang, X.; Guo, F.; Wang, L.; Wang, L. Effect of exploding foil size on flyer velocity. Acta Armamentarii 2010, 4, 434–436. [Google Scholar]
- Wang, Y.; Sun, X.; Guo, F.; Fu, Q. Study on electrical characteristic and flyer driven ability of Al/Ni exploding foil. Initiat. Pyrotech. 2016, 3, 5–8. [Google Scholar]
- Wang, X.; Tan, K.; Wen, S.; Liu, Q.; Ye, H. Influence of flyer materials on flyer velocity driven by electric explosion. Chin. J. Energetic Mater. 2014, 2, 259–262. [Google Scholar]
- Lemke, R.; Knudson, M.; Hall, C.; Haill, T.; Desjarlais, P.; Asay, P.; Mehlhorn, T. Characterization of magnetically accelerated flyer plates. Phys. Plasmas 2003, 10, 1092. [Google Scholar] [CrossRef] [Green Version]
- Wang, G.; Sun, C.; Jiang, J.; Mo, J.; Tan, F.; Zhang, N. Approximately theoretical resolution of the velocity of the metallic flyer plates driven by magnetic field. Chin. J. High Press. Phys. 2008, 22, 137–141. [Google Scholar]
- Zhang, X. Research on the Launch Technology of Magnetically Driven Ultra-High Speed Flyer. Master’s Thesis, China Academy of Engineering Physics, Mianyang, China, 2013. [Google Scholar]
- Wu, Y. The Research on Micro-Structure Driven by Laser Shock Wave. Master’s Thesis, Hua zhong University of Science and Technology, Wuhan, China, 2013. [Google Scholar]
- Paisley, D.; Swift, D.; Johnson, R.; Kopp, R.; Kyrala, G. Laser-launched flyer plates and direct laser shocks for dynamic material property measurements. AIP Conf. Proc. 2002, 620, 1343. [Google Scholar]
- Brown, K.; Shaw, W.; Zheng, X.; Dlottb, D. Simplified laser-driven flyer plates for shock compression science. Rev. Sci. Instrum. 2012, 83, 103901. [Google Scholar] [CrossRef]
- Cao, Y.; Gong, Z.; Dai, F.; Tong, J.; Niu, J.; Pang, H. Theoretical analysis on the velocity of laser-driven flyer. Spacecr. Environ. Eng. 2009, 26, 307–311. [Google Scholar]
- Cao, Y.; Niu, J.; Mou, Y.; Xu, K.; Ma, Z.; Gong, Z. Recent progresses of laser-driven flyer technique and micro-space debris hyper-velocity impact tests in China Academy of Space Technology. Spacecr. Environ. Eng. 2015, 2, 162–175. [Google Scholar]
- Curtis, A.; Banishev, A.; Shaw, W.; Dlotta, D. Laser-driven flyer plates for shock compression science:Launch and target impact probed by photon Doppler velocimetry. Rev. Sci. Instrum. 2014, 85, 043908. [Google Scholar] [CrossRef] [PubMed]
- Qin, W.; Wang, Z.; He, B.; Gao, Y.; Wang, Y.; Wang, L. Influence of barrel parameters on velocity and morphology of laser-driven flyer. Chin. J. Energetic Mater. 2020, 28, 99–104. [Google Scholar]
- Tan, Y.; Zhang, J.; Wang, G.; Zhang, X. Parameters design of the barrel of a small flyer initiating system. Chin. J. Explos. Propellants 2001, 24, 51–53. [Google Scholar]
- Watson, S.; John, E.; Dai, F. Integrity of thin, laser-driven flyer plates. J. Appl. Phys. 2000, 88, 3859–3864. [Google Scholar] [CrossRef]
- Li, Z.; Ma, R.; Chen, G.; Liu, J. Multi-point velocity interferometer system for any reflector. Rev. Sci. Instrum. 1999, 70, 3872. [Google Scholar] [CrossRef]
- Liu, S.; Wen, W.; Yuan, S.; Chen, G.; Liu, J.; Peng, Q.; Li, Z. Full field velocity measurement of laser-driven flyer using framing-imaging velocity interferometer system for any reflector. Acta Opt. Sin. 2013, 33, 0912007. [Google Scholar]
- Romain, F.; Matthias, N.; Frank, N.; Thomas, L.; Alexander, W. Shadowgraphy investigation of laser-induced forward transfer: Front side and back side ablation of the triazene polymer sacrificial layer. Appl. Surf. Sci. 2009, 255, 5430–5434. [Google Scholar]
- Fardel, R.; Nagel, M.; Nüesch, F.; Lippert, T.; Wokaun, A. Laser-induced forward transfer of organic LED building blocks studied by time-resolved shadowgraphy. J. Phys. Chem. C 2010, 114, 5617–5636. [Google Scholar] [CrossRef]
- Thomas, M.; James, S.; Christof, W.; Thomas, L.; Alexander, W. Laser induced forward transfer aluminum layers: Process investigation by time resolved imaging. Appl. Surf. Sci. 2012, 258, 9352–9354. [Google Scholar]
- Ji, X.; Qin, W.; Wu, X.; Wang, Y.; Gao, F.; Wang, L.; Hou, Y. Perfect metamaterial absorber improved laser-driven flyer. Nanophotonics 2021, 10, 2683–2693. [Google Scholar] [CrossRef]
- Yeager, J.; Bowden, P.; Guildenbecher, D.; Olles, J. Characterization of hypervelocity metal fragments for explosive initiation. J. Appl. Phys. 2017, 122, 035901. [Google Scholar] [CrossRef]
- Jensen, B.; Ramos, K.; Iverson, A.; Bernier, J.; Carlson, C.; Yeager, J.; Fezzaa, K.; Hooks, D. Dynamic experiments using IMPULSE at the Advanced Photon Source. J. Phys. Conf. Ser. 2014, 500, 042001. [Google Scholar] [CrossRef]
- Turneaure, S.; Gupta, Y.; Zimmerman, K.; Perkins, K.; Yoo, C.; Shen, G. Real-time microstructure of shocked LiF crystals: Use of synchrotron x-rays. J. Appl. Phys. 2009, 105, 053520. [Google Scholar] [CrossRef]
- Jensen, B.; Luo, S.; Hooks, K.; Fezzaa, K.; Ramos, K.; Yeager, J.; Kwiatkowski, K.; Shimada, T.; Dattelbaum, D. Ultrafast, high resolution, phase contrast imaging of impact response with synchrotron radiation. AIP Adv. 2012, 2, 012170. [Google Scholar] [CrossRef] [Green Version]
- Willey, T.; Champley, K.; Hodgin, R.; Lauderbach, L.; Bagge-Hansen, M.; May, C.; Sanchez, N.; Jensen, B.J.; Iverson, A.; Buuren, T. X-ray imaging and 3D reconstruction of in-flight exploding foil initiator flyers. J. Appl. Phys. 2016, 119, 235901. [Google Scholar] [CrossRef]
- Wang, R.; Li, Z.; Tian, J.; Wu, T.; He, L. Application of passive fiber-optic probe to detonation experiments. Opto-Electron. Eng. 2008, 35, 117. [Google Scholar]
- Furutani, H.; Fukumura, H.; Masuhara, H. Photothermal transient expansion and contraction dynamics of polymer films by nanosecond interferometry. J. Phys. Chem. 1996, 100, 6871–6875. [Google Scholar] [CrossRef]
- Greenfield, S.; Casson, J.; Koskelo, A. Nanosecond interferometric studies of surface deformations of dielectrics induced by laser irradiation. In Proceedings of the SPIE—The International Society for Optical Engineering, San Diego, CA, USA, 25–26 January 2001. [Google Scholar]
- Greenfield, S.; Luo, S.; Paisley, D.; Loomis, E.; Swift, D.; Koskelo, A. Transient imaging displacement interferometry applied to shock loading. AIP Conf. Proc. 2007, 955, 1093–1096. [Google Scholar]
- Guo, J.; Zeng, Q.; Li, M.; Li, B. Influence of Flyer Material on Morphology of Flyer Driven by Micro Charge. Chin. J. High Press. Phys. 2017, 31, 315–320. [Google Scholar]
- Wang, G.; Zhao, J.; Tang, X.; Tan, F.; Wu, G.; Kuang, X. Experimental study on the integrality of Mylar flyer driven by electric gun. J. Exp. Mech. 2006, 21, 454–458. [Google Scholar]
- Ao, T.; Asay, J.; Chantrenne, S.; Baer, M.; Hall, C. A compact strip-line pulsed power generator for isentropic compression experiments. Rev. Sci. Instrum. 2008, 79, 013903. [Google Scholar] [CrossRef] [PubMed]
- Wang, L.; Tang, D.; Ji, X.; Zhang, W.; Jiang, H.; Wang, Y.; Li, Y.; Qin, W. Influence of laser beam profiles on the performance of laser-driven flyers. Propellants Explos. Pyrotech. 2021, 46, 61–66. [Google Scholar] [CrossRef]
- Dong, H.; Tong, J.; Huang, B. Impact simulation of hypervelocity space debris in vacuum environment. Chin. J. Vac. Sci. Technol. 2004, 2, 109–112. [Google Scholar]
- Niu, J.; Gong, Z.; Cao, Y.; Dai, F.; Yang, J.; Li, Y. Experimental research on laser-driven flyer plates up to 8km/s. Explos. Shock Waves 2014, 2, 129–136. [Google Scholar]
Figure 1.
Schematic diagram of explosive-driven flyer.
Figure 1.
Schematic diagram of explosive-driven flyer.
Figure 2.
Schematic view of flyer driven by micro-charge detonation.
Figure 2.
Schematic view of flyer driven by micro-charge detonation.
Figure 3.
Schematic drawing of two-stage light gas gun.
Figure 3.
Schematic drawing of two-stage light gas gun.
Figure 4.
Schematic diagram of electrical exploding foil accelerator.
Figure 4.
Schematic diagram of electrical exploding foil accelerator.
Figure 5.
Schematic diagram of magnetically driven flyer.
Figure 5.
Schematic diagram of magnetically driven flyer.
Figure 6.
Schematic layout of laser-driven flyer.
Figure 6.
Schematic layout of laser-driven flyer.
Figure 7.
The basic geometry of PDV.
Figure 7.
The basic geometry of PDV.
Figure 8.
Schematic diagram of DISAR.
Figure 8.
Schematic diagram of DISAR.
Figure 9.
Schematic diagram of VISAR.
Figure 9.
Schematic diagram of VISAR.
Figure 10.
Optical configuration of an AFVISAR system.
Figure 10.
Optical configuration of an AFVISAR system.
Figure 11.
Interferometer configuration for ORVIS.
Figure 11.
Interferometer configuration for ORVIS.
Figure 12.
Schematic diagram of line-VISAR.
Figure 12.
Schematic diagram of line-VISAR.
Figure 13.
The main parts of FPI system.
Figure 13.
The main parts of FPI system.
Figure 14.
A schematic of five-beam Fabry–Perot velocimeter.
Figure 14.
A schematic of five-beam Fabry–Perot velocimeter.
Figure 15.
Schematic layout of FPI with optical resonator.
Figure 15.
Schematic layout of FPI with optical resonator.
Figure 16.
Schematic diagram of microwave interferometer.
Figure 16.
Schematic diagram of microwave interferometer.
Figure 17.
Schematic diagram of optical beam blocking.
Figure 17.
Schematic diagram of optical beam blocking.
Figure 18.
Schematic diagram of MAVIS.
Figure 18.
Schematic diagram of MAVIS.
Figure 19.
Schematic diagram of electric probe method.
Figure 19.
Schematic diagram of electric probe method.
Figure 20.
Streak photographs of flyers taken by scanning camera [
81].
Figure 20.
Streak photographs of flyers taken by scanning camera [
81].
Figure 21.
Schematics of the three different shadowgraphy modes: (
a) surface-parallel mode; (
b) reflectivity mode; (
c) transmission mode [
86].
Figure 21.
Schematics of the three different shadowgraphy modes: (
a) surface-parallel mode; (
b) reflectivity mode; (
c) transmission mode [
86].
Figure 22.
Digital in-line holography experimental configuration.
Figure 22.
Digital in-line holography experimental configuration.
Figure 23.
X-ray diagnostic experimental configuration.
Figure 23.
X-ray diagnostic experimental configuration.
Figure 24.
Optical fiber probe configuration.
Figure 24.
Optical fiber probe configuration.
Table 1.
Comparison of different flyer-driving technologies.
Table 1.
Comparison of different flyer-driving technologies.
Flyer Launch
Mechanism | Advantage | Disadvantage | Flyer Velocity |
|---|
| Explosive-driven flyer | Simple structure, small size, easy synchronization, large testing range, multiple sample layout | Limited ability to drive flyers | 3.5 km/s [2] |
| Light gas gun | precise adjustment of projectile velocity, smooth flying of the flyer, good data repeatability, high measurement accuracy | High cost, complex debugging | 15 km/s [6] |
| Electrical exploding foil accelerator | Compact structure, easy operation, available high strain rate (usually 104~106 s−1) | Dependent on pulsed high-voltage equipment | 14 km/s [8] |
| Magnetically accelerated flyer | Loading pressure approaching TPa level, available isentropic line, launches multiple samples simultaneously | High cost, the free surface of the flyer is easily ablated | 45 km/s [10] |
| Laser-driven flyer | Compact structure, small size flyer, imparts shocks in excess of TPa level with sub-nanosecond durations to materials | High requirements for laser power density control | 23 km/s [12] |
Table 2.
Comparison of different velocity measurement technologies.
Table 2.
Comparison of different velocity measurement technologies.
| Measurement Technology | Advantage | Disadvantage |
|---|
| Continuous method | Displacement interferometer | PDV | Compact, robust, strong speed measuring ability | Unable to distinguish direction |
| DISAR | Direction judgment, no fringe loss | Difficulty in system commissioning, low spatial resolution |
| Velocity interferometer | Discrete VISAR | Broad measurement range, high time resolution | Fringe loss, complex data processing |
| AFVISAR | Compact structure, short coherence Length, easy-to-adjust light path, any fringe constant | No spatial resolution |
| ORVIS | High time resolution, simplified data processing | Complex operation, no spatial resolution |
| Line-VISAR | μm-level spatial resolution, ps-level temporal resolution | Complex data processing |
| 2D-VISAR | Two-dimensional spatial velocity field | Complex data processing |
| FPI | Fast response, easy operation, compact structure, low cost, nanosecond level temporal resolution | Limited record length, no spatial resolution |
| Microwave interferometer | Radio transparent materials measurement, insensitive to surface roughness, low bandwidth requirement | Low time resolution, slightly low accuracy |
| Discrete method | Optical beam blocking | Simple structure, anti-vibration, high reliability | High requirement for laser beam distance measurement |
| MAVIS | Non-contact measurement, has high measurement accuracy | Complex structure and installation, limited to metallic flyer |
| Sensor method | Simple, strong operability, low cost | Large measurement error |
| High-speed photography | Simple operation, wide application, reliable results and moderate accuracy | High cost |
| Electric probe method | Simple and convenient for on-site installation | Not applicable to special-shaped flyers, non-metallic flyers, and ultra-low speed measurement |
Table 3.
Influence factors of flyer speed mentioned in the literature.
Table 3.
Influence factors of flyer speed mentioned in the literature.
| Flyer Launch Mechanism | Pulse Energy Source | Parameters Related to the Flyer | Flight Environment |
|---|
| Explosive-driven flyer | Charge density and size | Flyer thickness and mass;
submillimeter-sized gap and cushion | Barrel diameter |
| Light gas gun | Initial air pressure; air chamber volume; adiabatic index | Projectile mass; virtual mass coefficient | Cross-sectional area of the gas gun barrel; barrel length |
| Electrical exploding foil accelerator | Burst current density; charging voltage; bridge thickness, width and mass;
Bridge wing structure | Flyer mass and density | - |
| Magnetically accelerated flyer | Drive current; magnetic field Scale factor; magnetic
permeability | Flyer material density; flyer thickness; Plate length | - |
| Laser-driven flyer | Wavelength, pulse width,
diameter of the focused spot and power density of the laser | Thickness, density, diameter and preparation process of the flyer;
thickness and strength of the
substrate | Barrel diameter and length |
Table 4.
Comparison of different flyer morphology investigation technologies.
Table 4.
Comparison of different flyer morphology investigation technologies.
| Measurement Technology | Advantage | Disadvantage |
|---|
| Streak photography | Simple operation; wide application | Unable to obtain frontal images of the flyer |
| Interferometer technology | Synchronous with speed test | High requirements for probe layout |
| Shadowgraphy | Nanosecond level temporal resolution; multiple working modes | One-dimensional information |
| DIH | Complex and expensive device | Image washout caused by the ambient luminosity; complex structure |
| X-ray diagnostic method | High time resolution; 3D image | Complicated to operate |
| Optical fiber probe method | Electromagnetic interference immunity; fast response; low cost; simple structure | Dependent on probe layout |
| TIDI | High temporal and spatial resolution | High cost |
Table 5.
Influence factors of flyer morphology mentioned in the literature.
Table 5.
Influence factors of flyer morphology mentioned in the literature.
| Flyer Launch Mechanism | Pulse Energy Source | Parameters Related to the Flyer | Flight Environment |
|---|
| Explosive-driven flyer | Detonation mode | Flyer diameter and material | Barrel diameter |
| Light gas gun | - | Clearance tolerance between projectile and launch tube | Geometric accuracy of the muzzle; improper installation |
| Electrical exploding foil accelerator | - | Flyer material | Barrel material; barrel size; cutting edge |
| Magnetically accelerated flyer | - | Panel configuration and dimension | - |
| Laser-driven flyer | Laser intensity distribution | Preparation process of the flyer; adhesion of the metal foil to the substrate; shear strength and tenacity of the metal foil | Barrel length |
| Disclaimer/Publisher’s Note: The statements, opinions and data contained in all publications are solely those of the individual author(s) and contributor(s) and not of MDPI and/or the editor(s). MDPI and/or the editor(s) disclaim responsibility for any injury to people or property resulting from any ideas, methods, instructions or products referred to in the content. |
© 2023 by the authors. Licensee MDPI, Basel, Switzerland. This article is an open access article distributed under the terms and conditions of the Creative Commons Attribution (CC BY) license (https://creativecommons.org/licenses/by/4.0/).


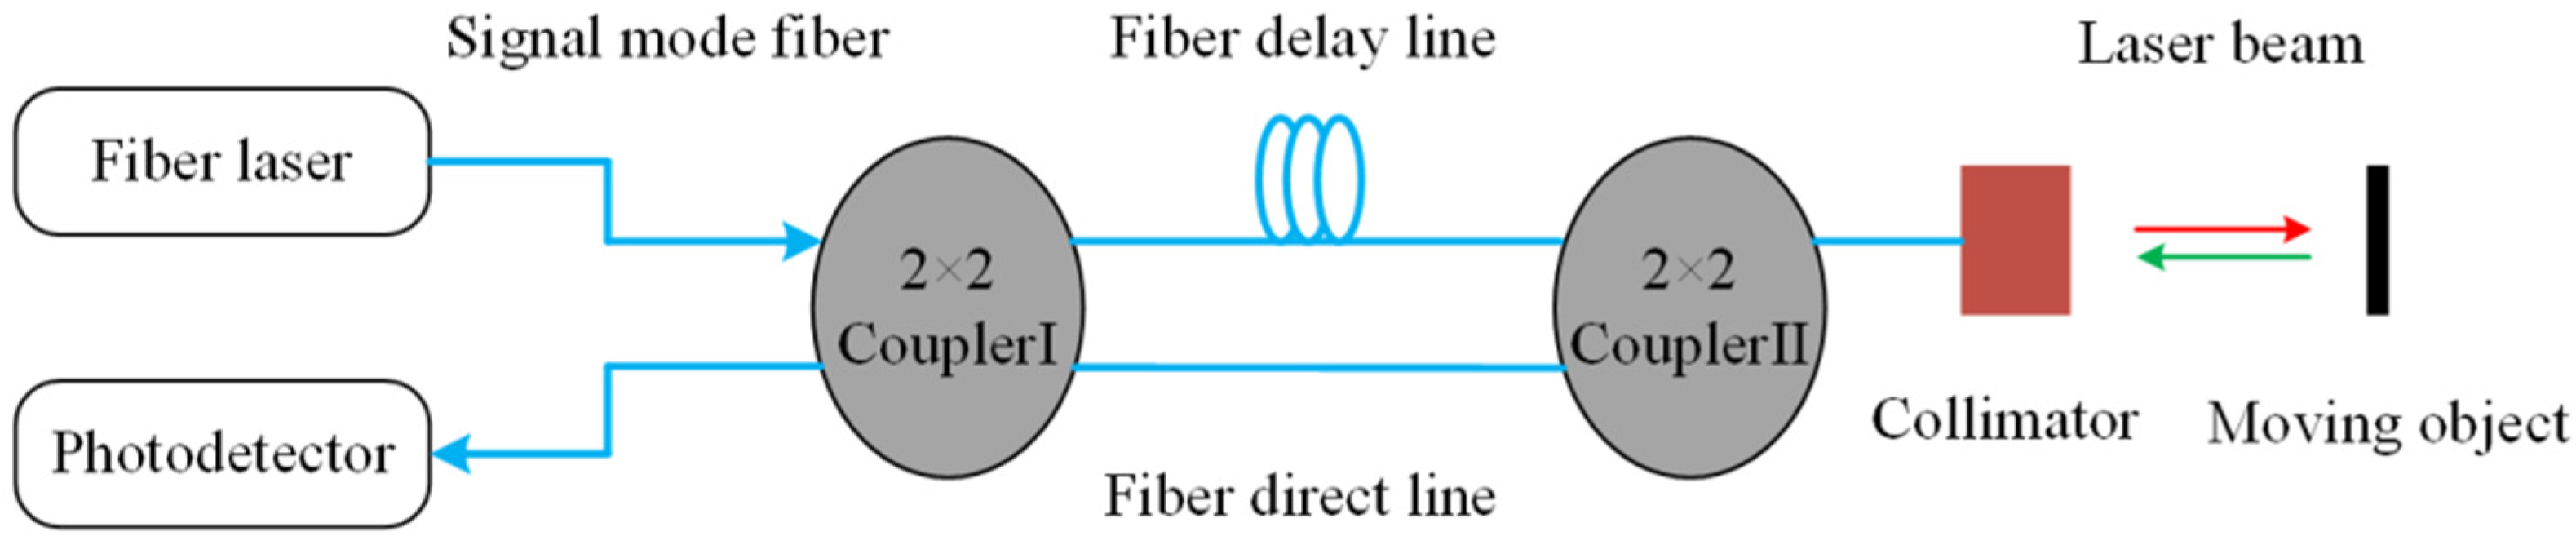
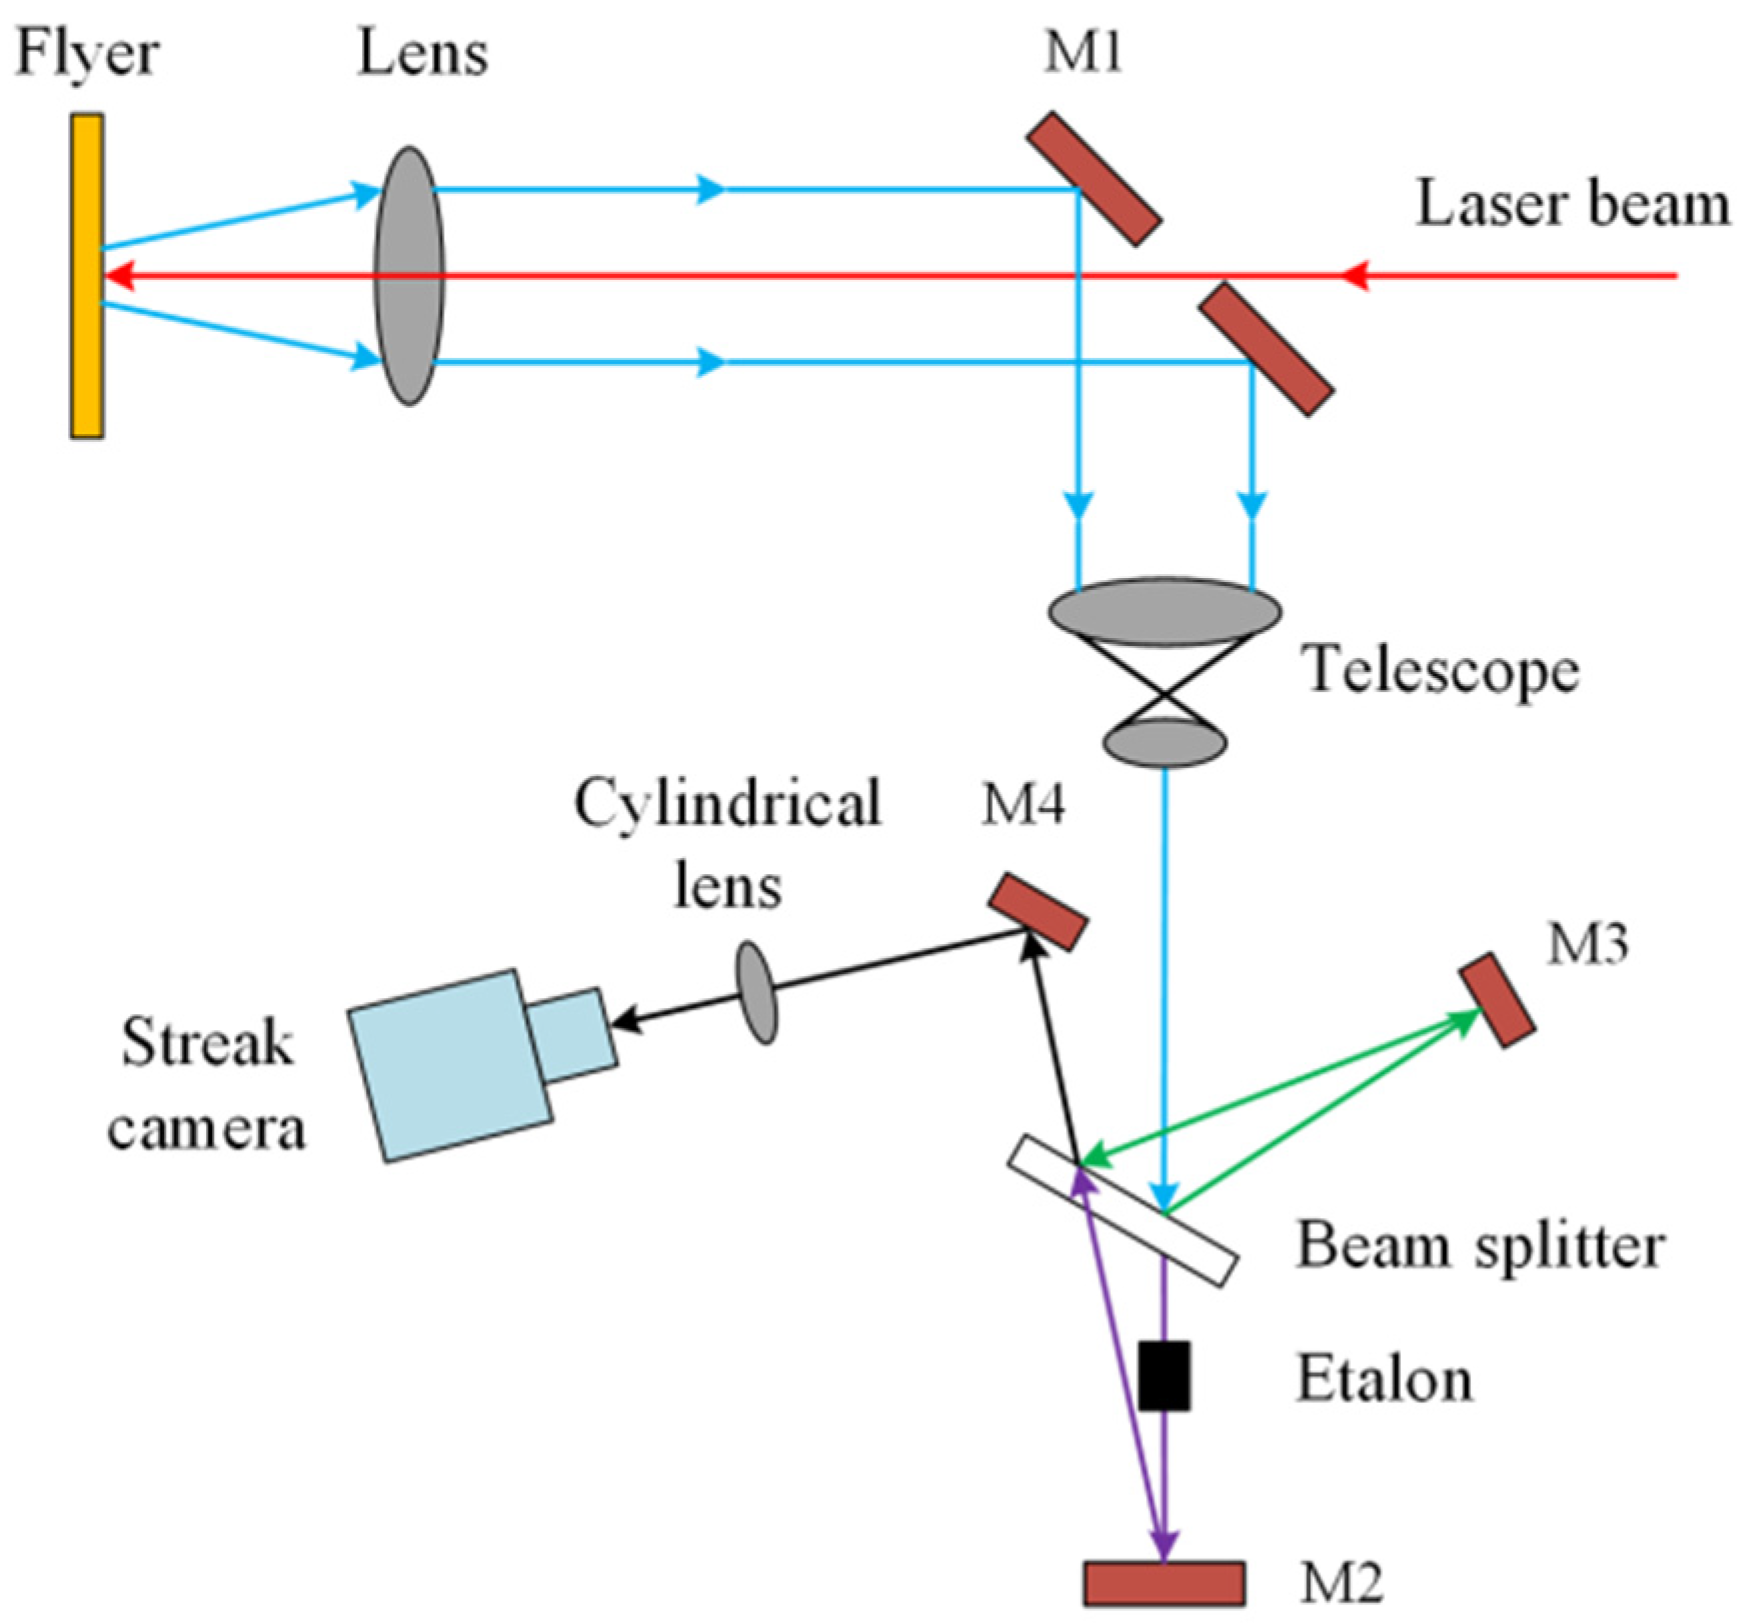
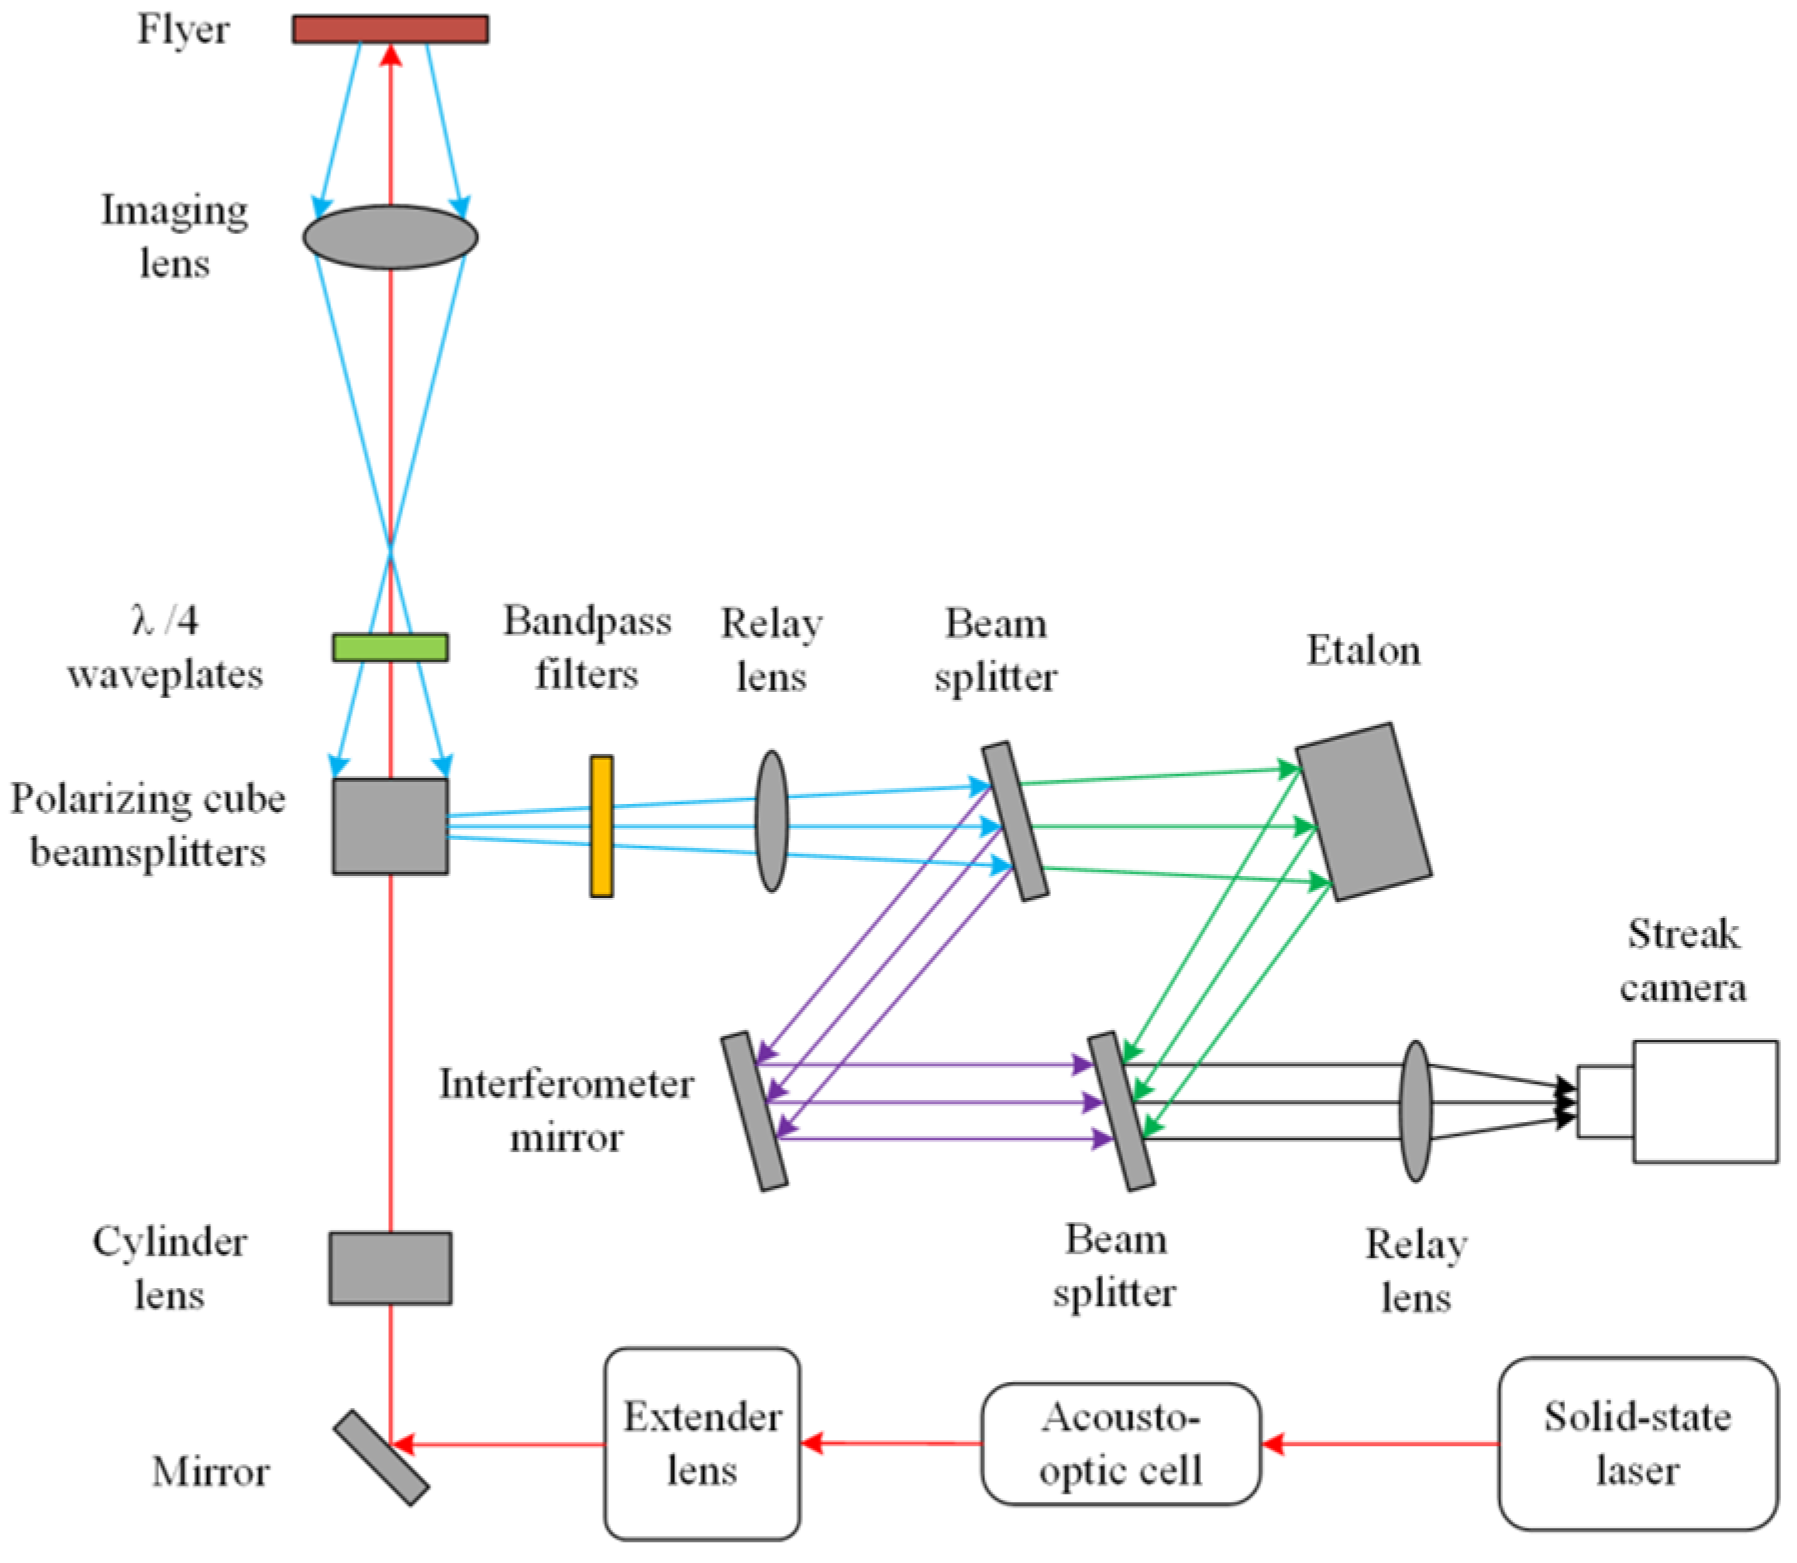
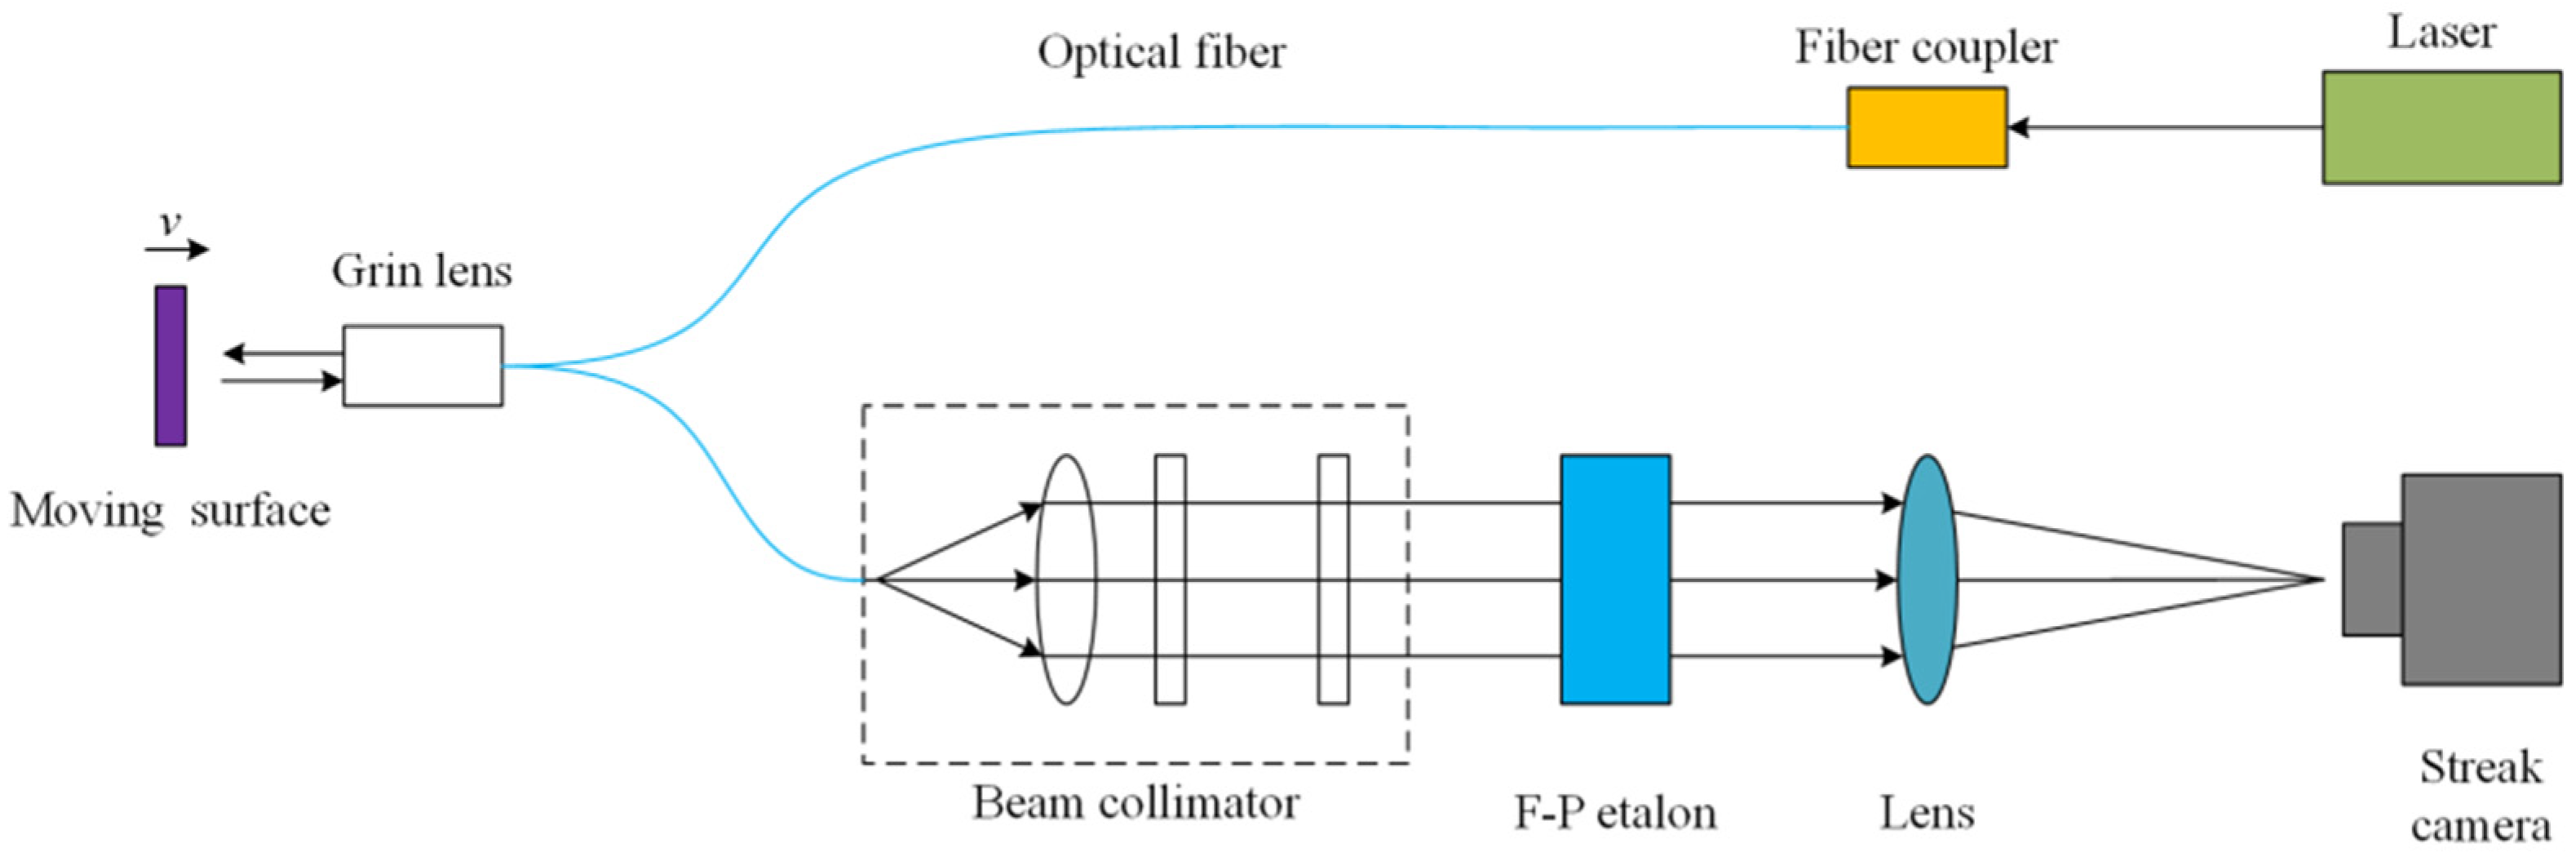