
Modified Equation of Shear Strength with Respect to Saturation

Abstract
:1. Introduction
2. Theory
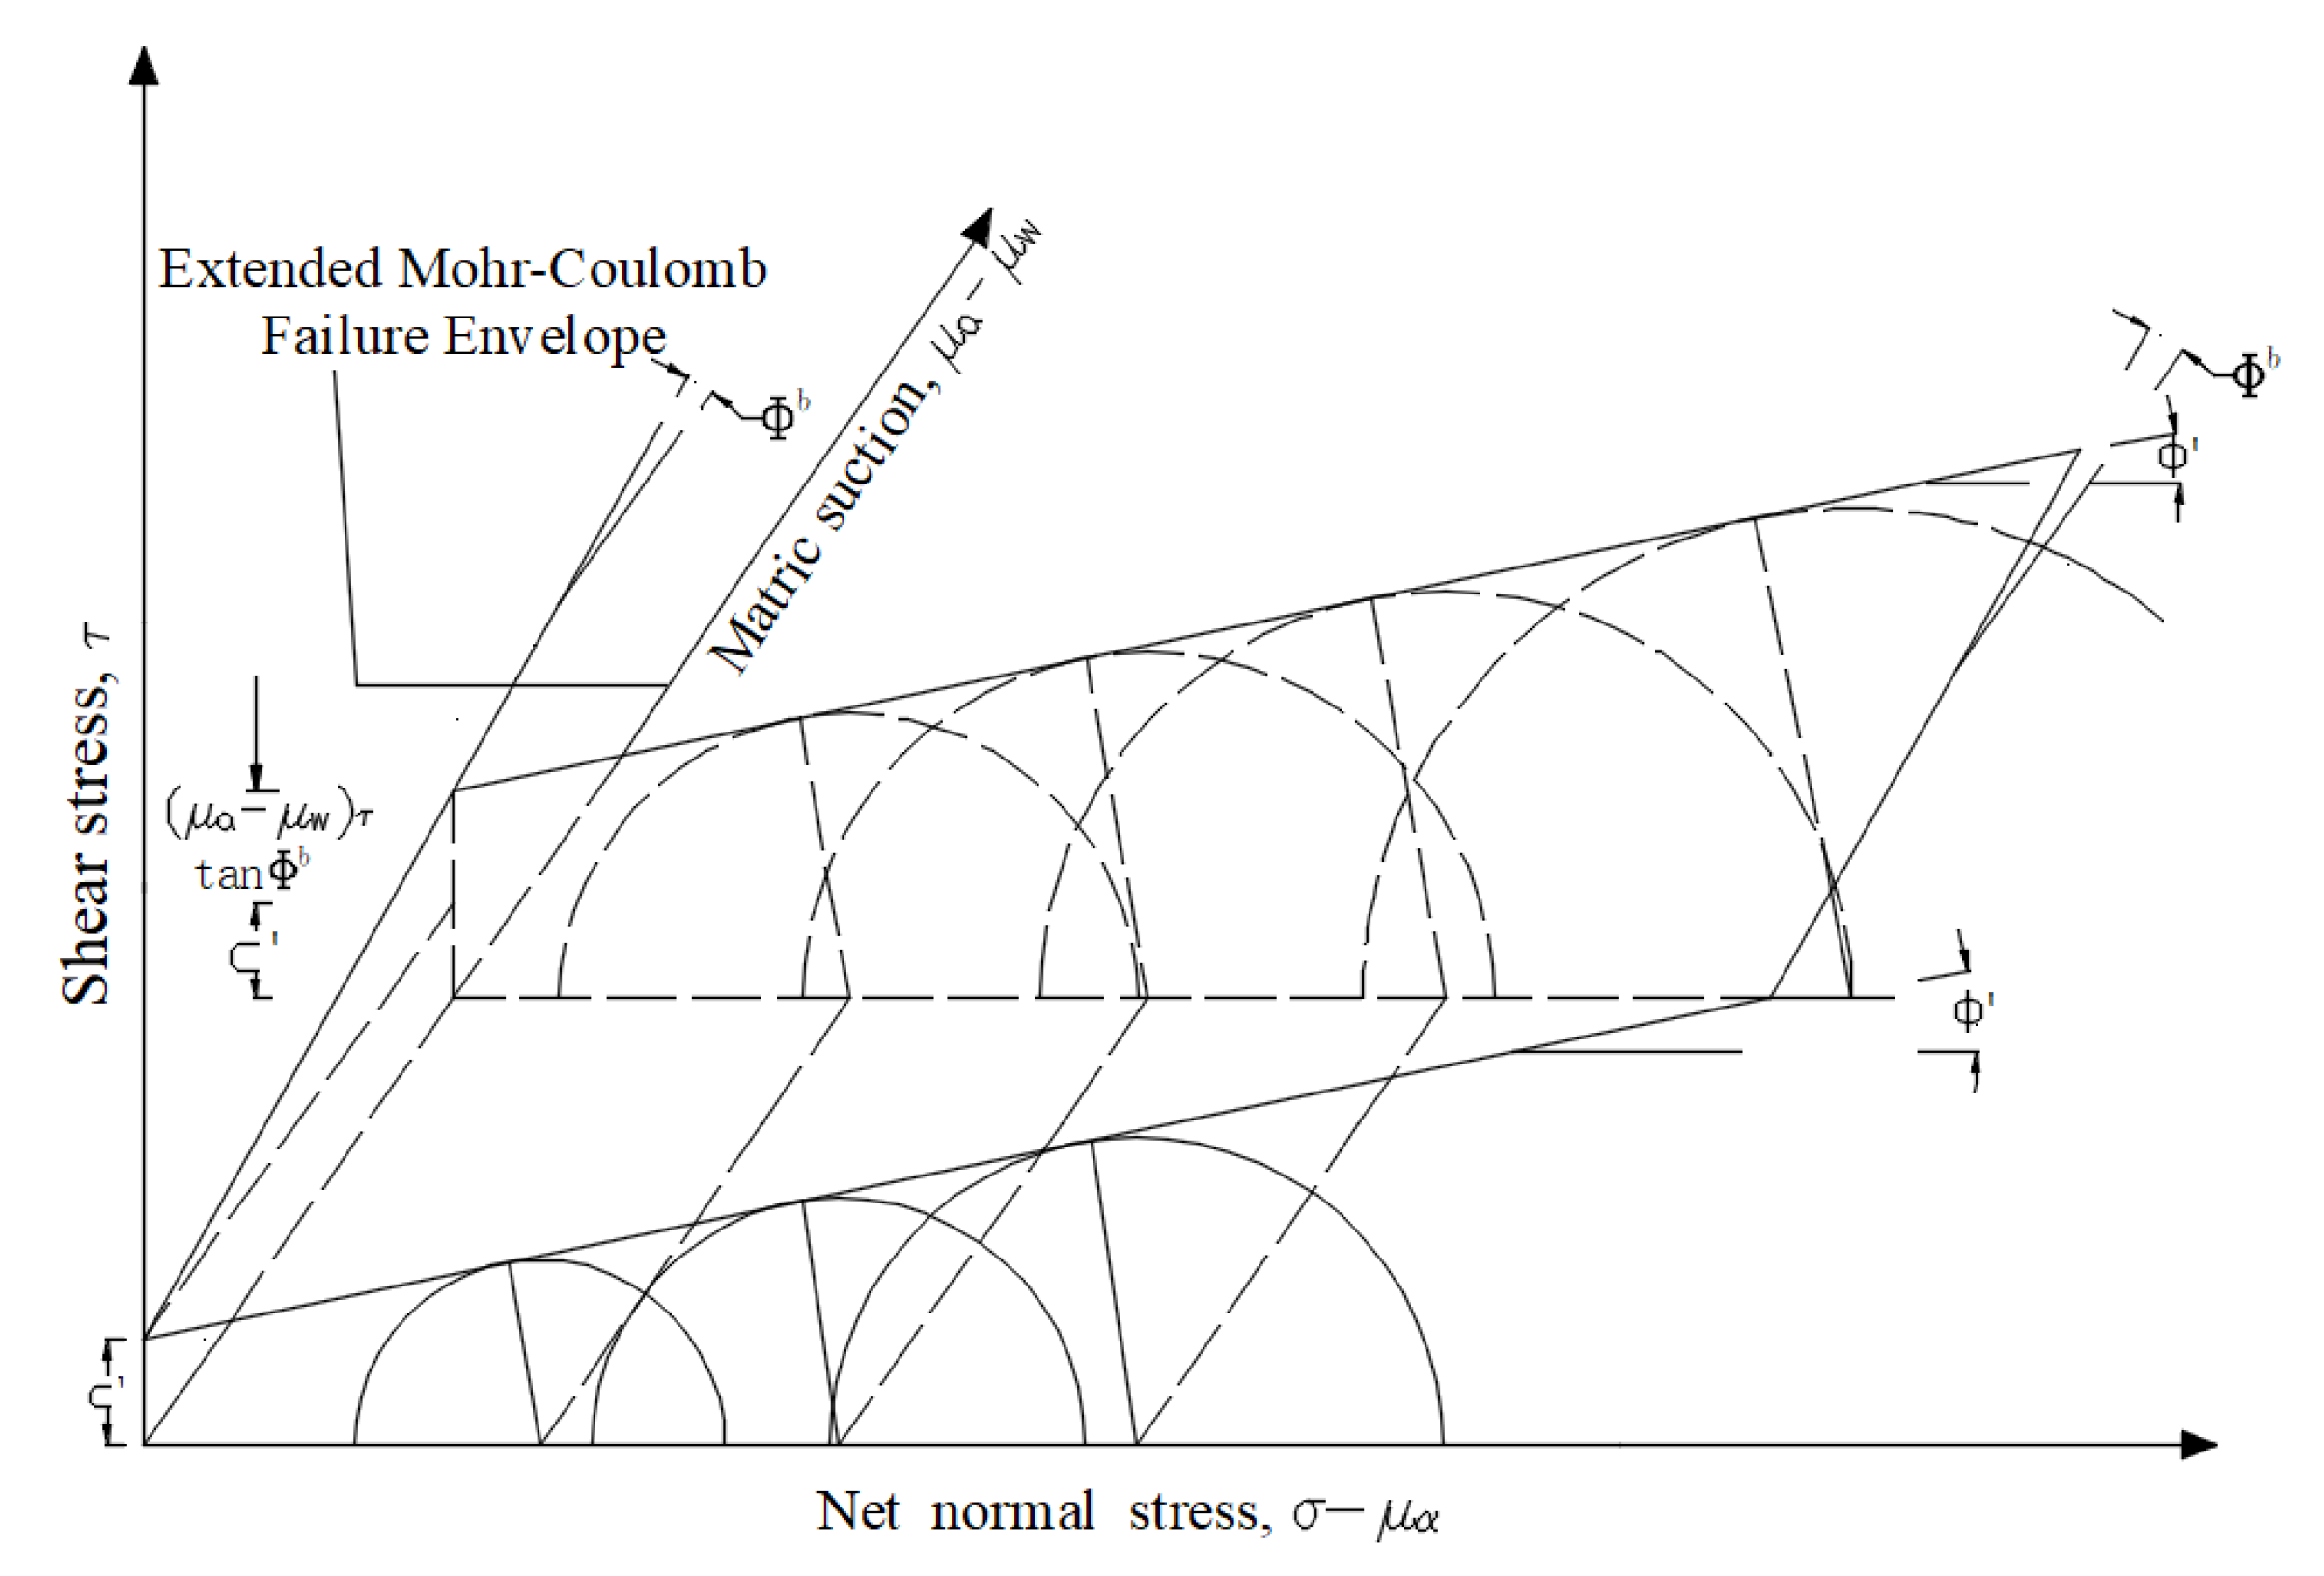
2.1. Bishop Shear Strength Model
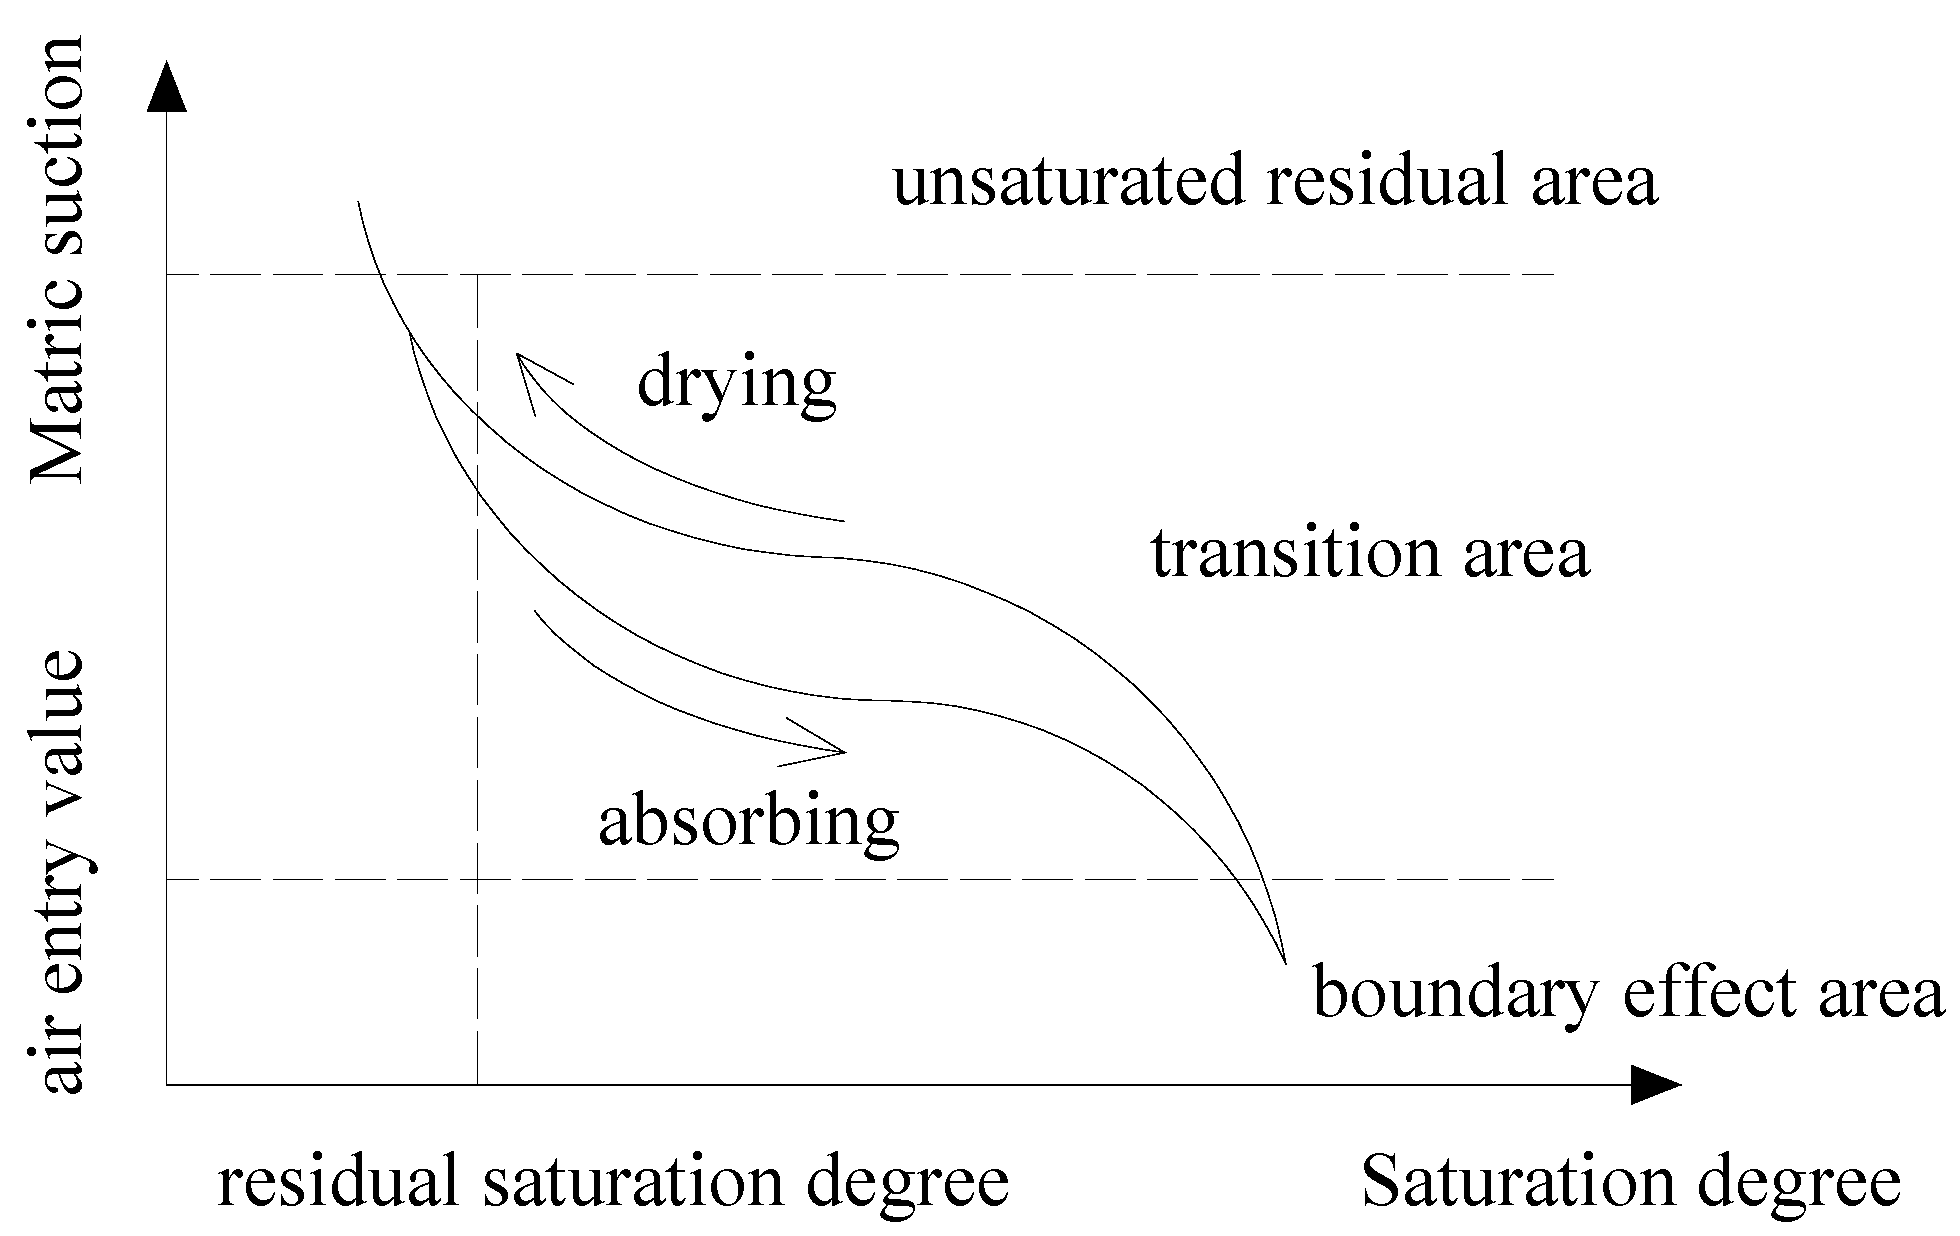
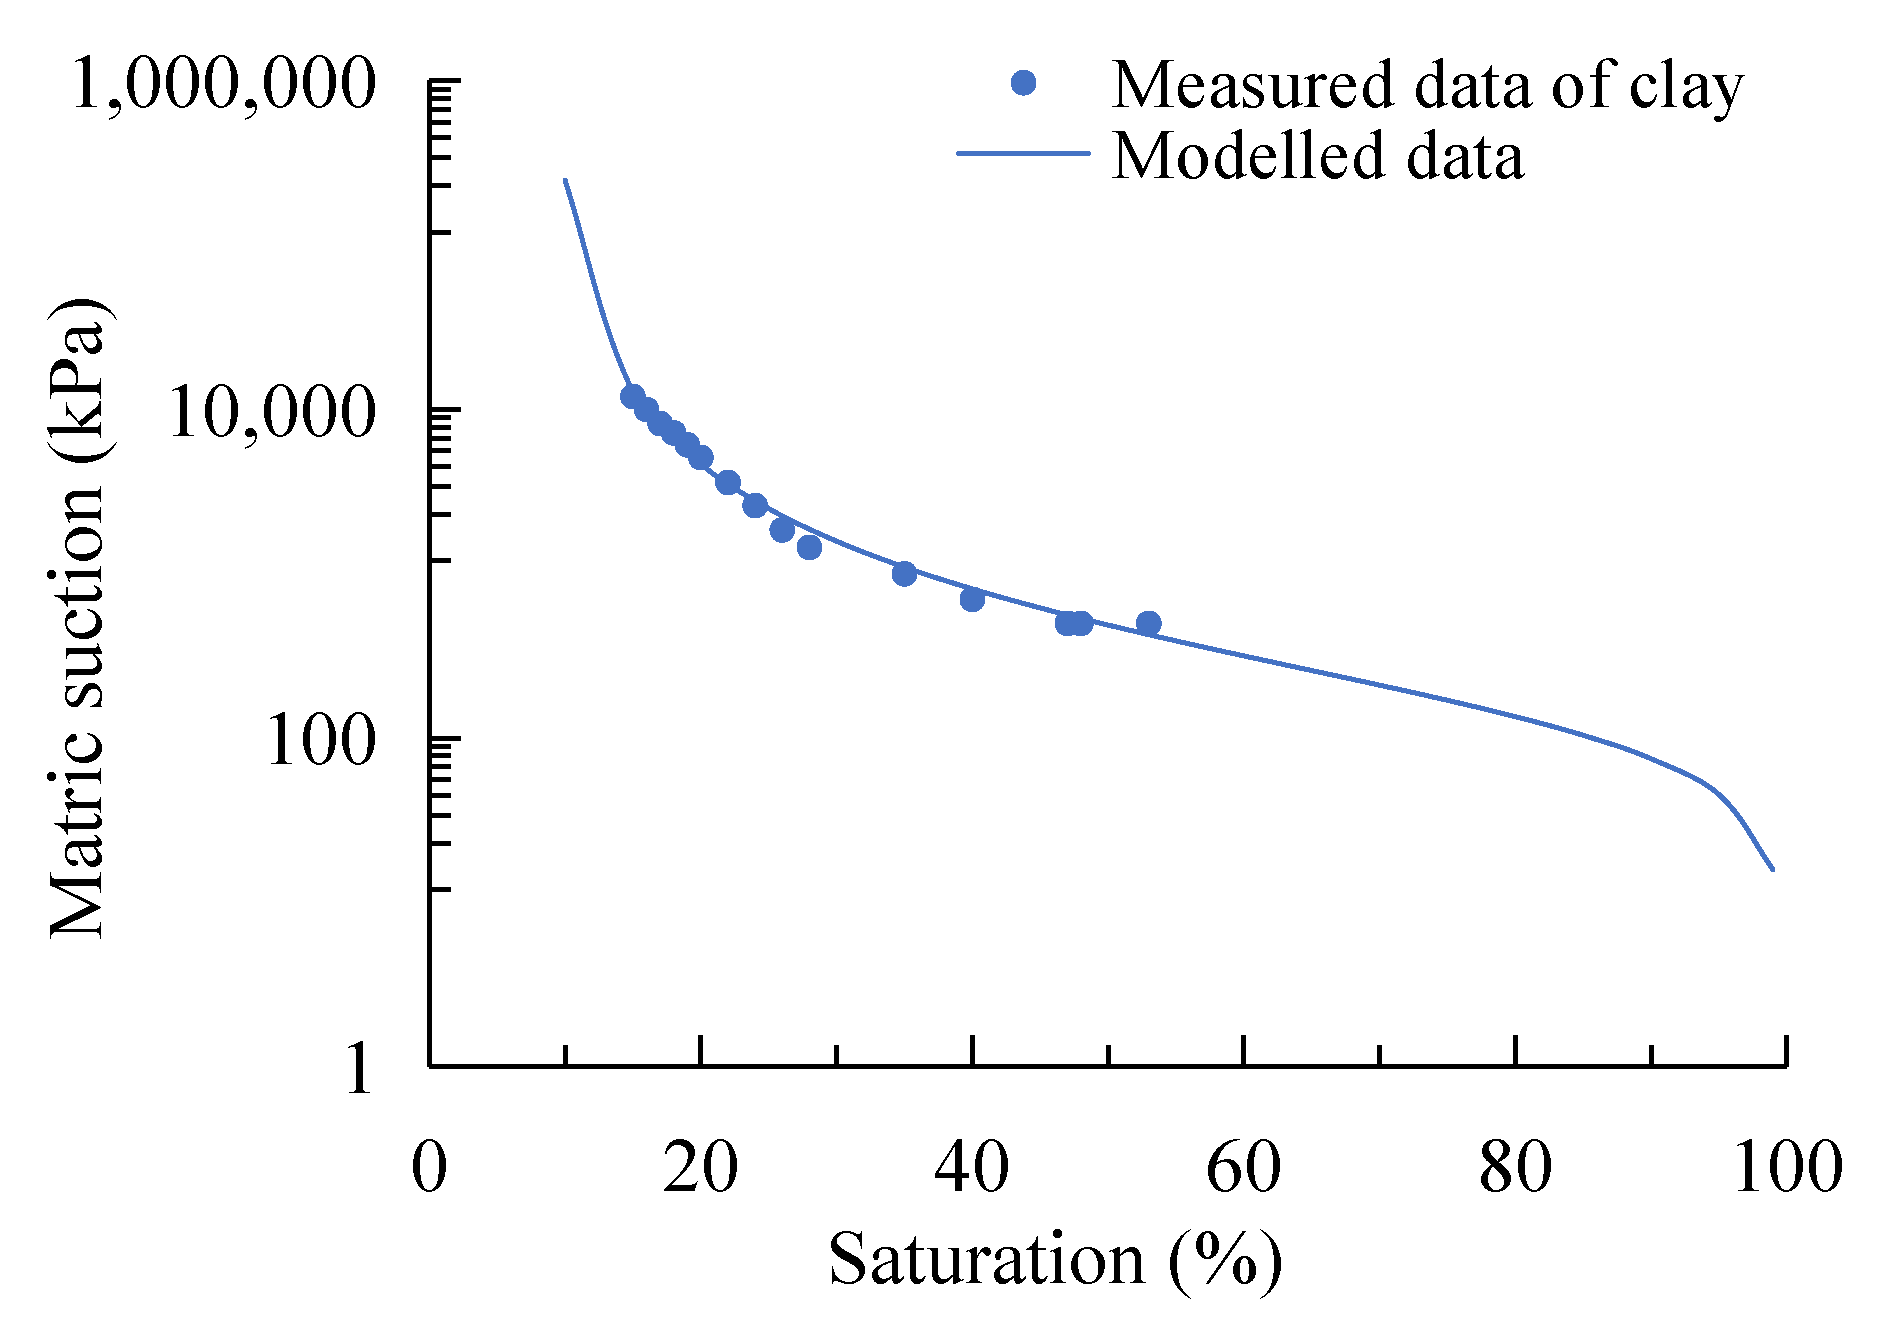
2.2. Van Genuchten SWCC Model
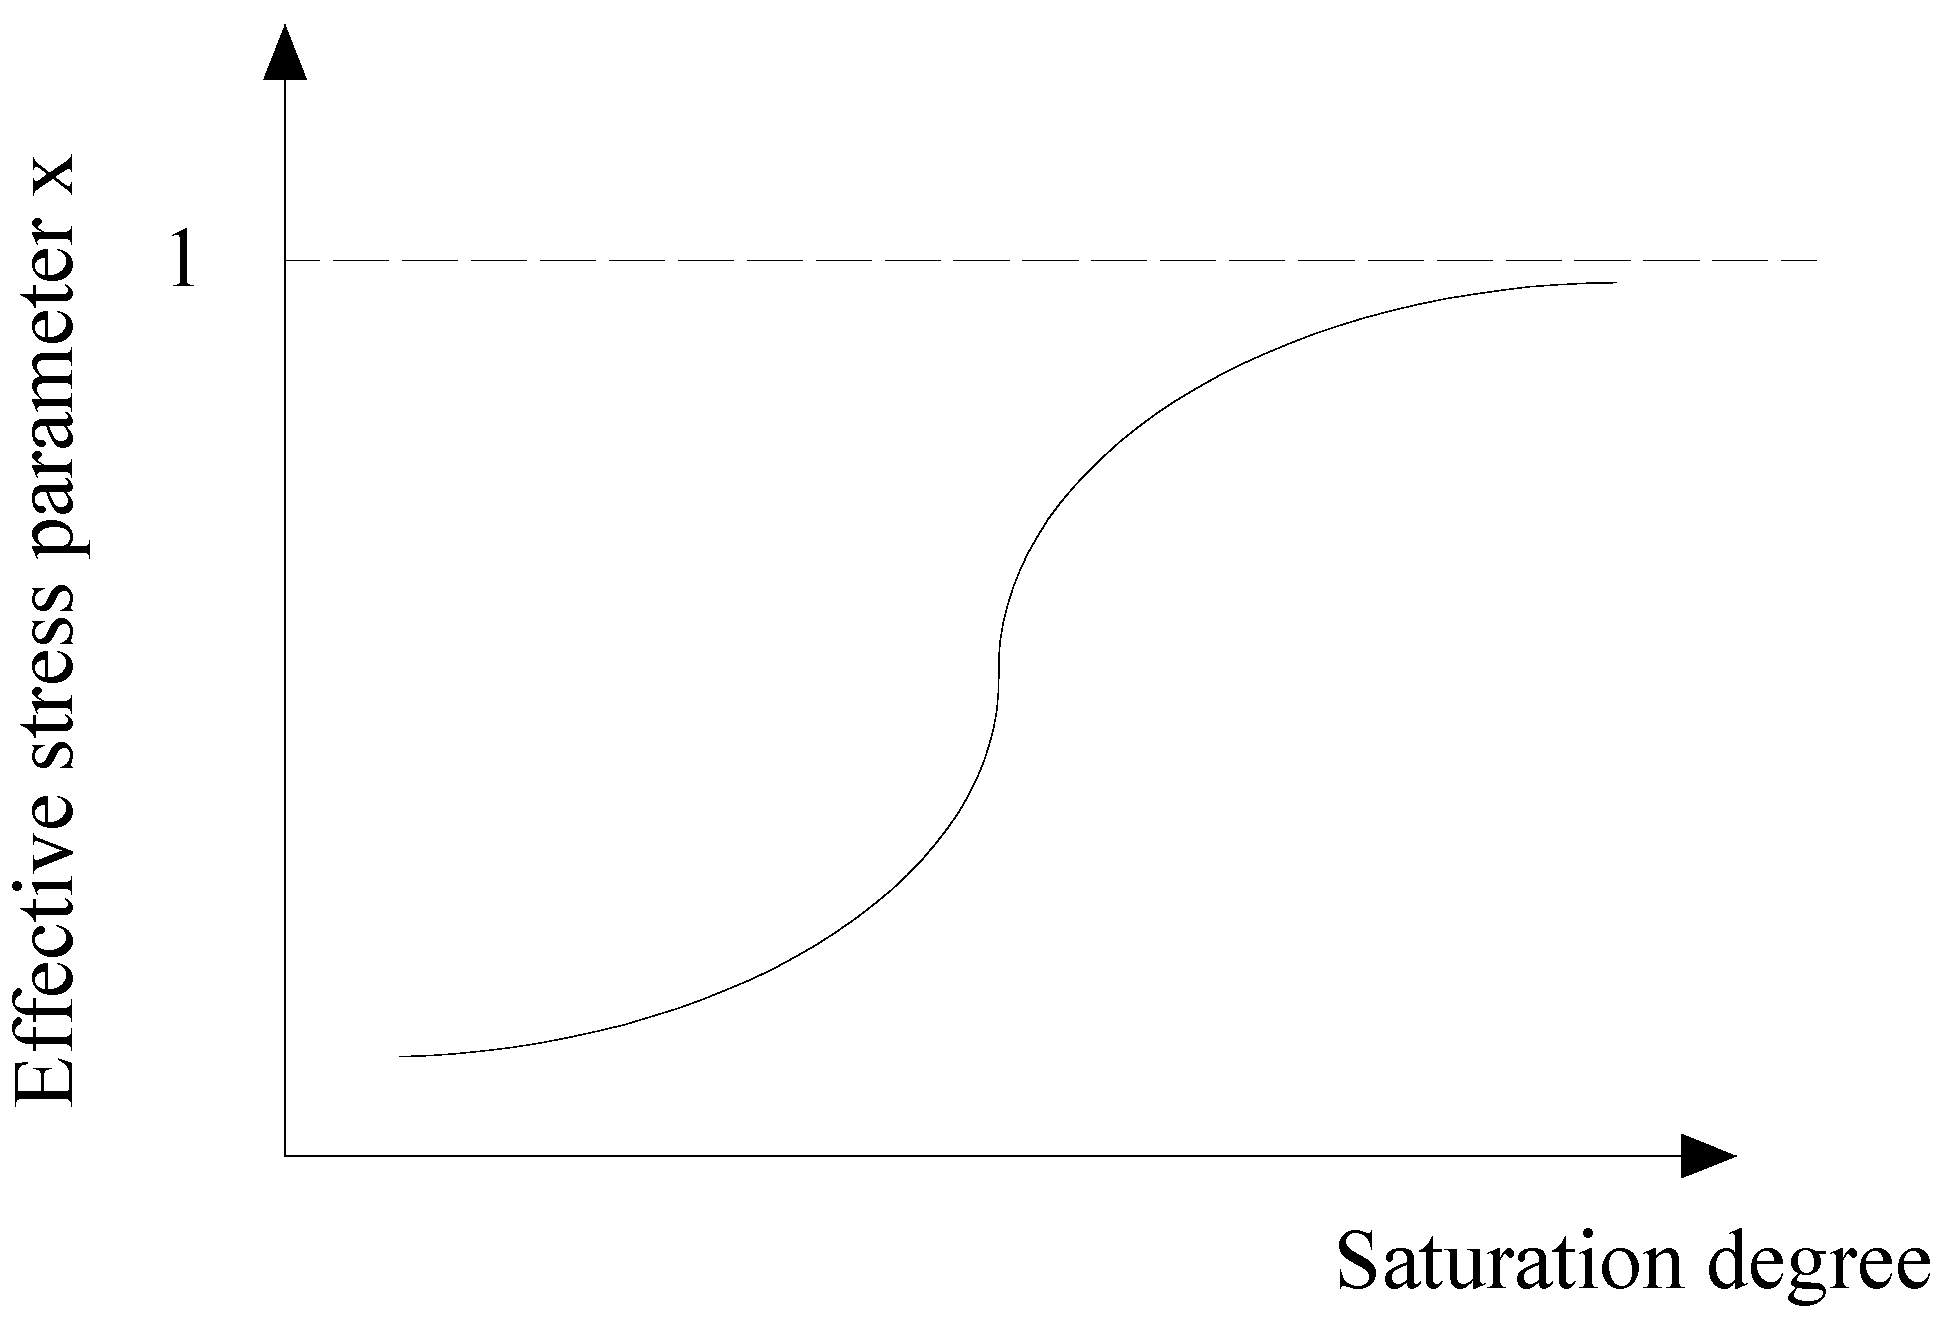
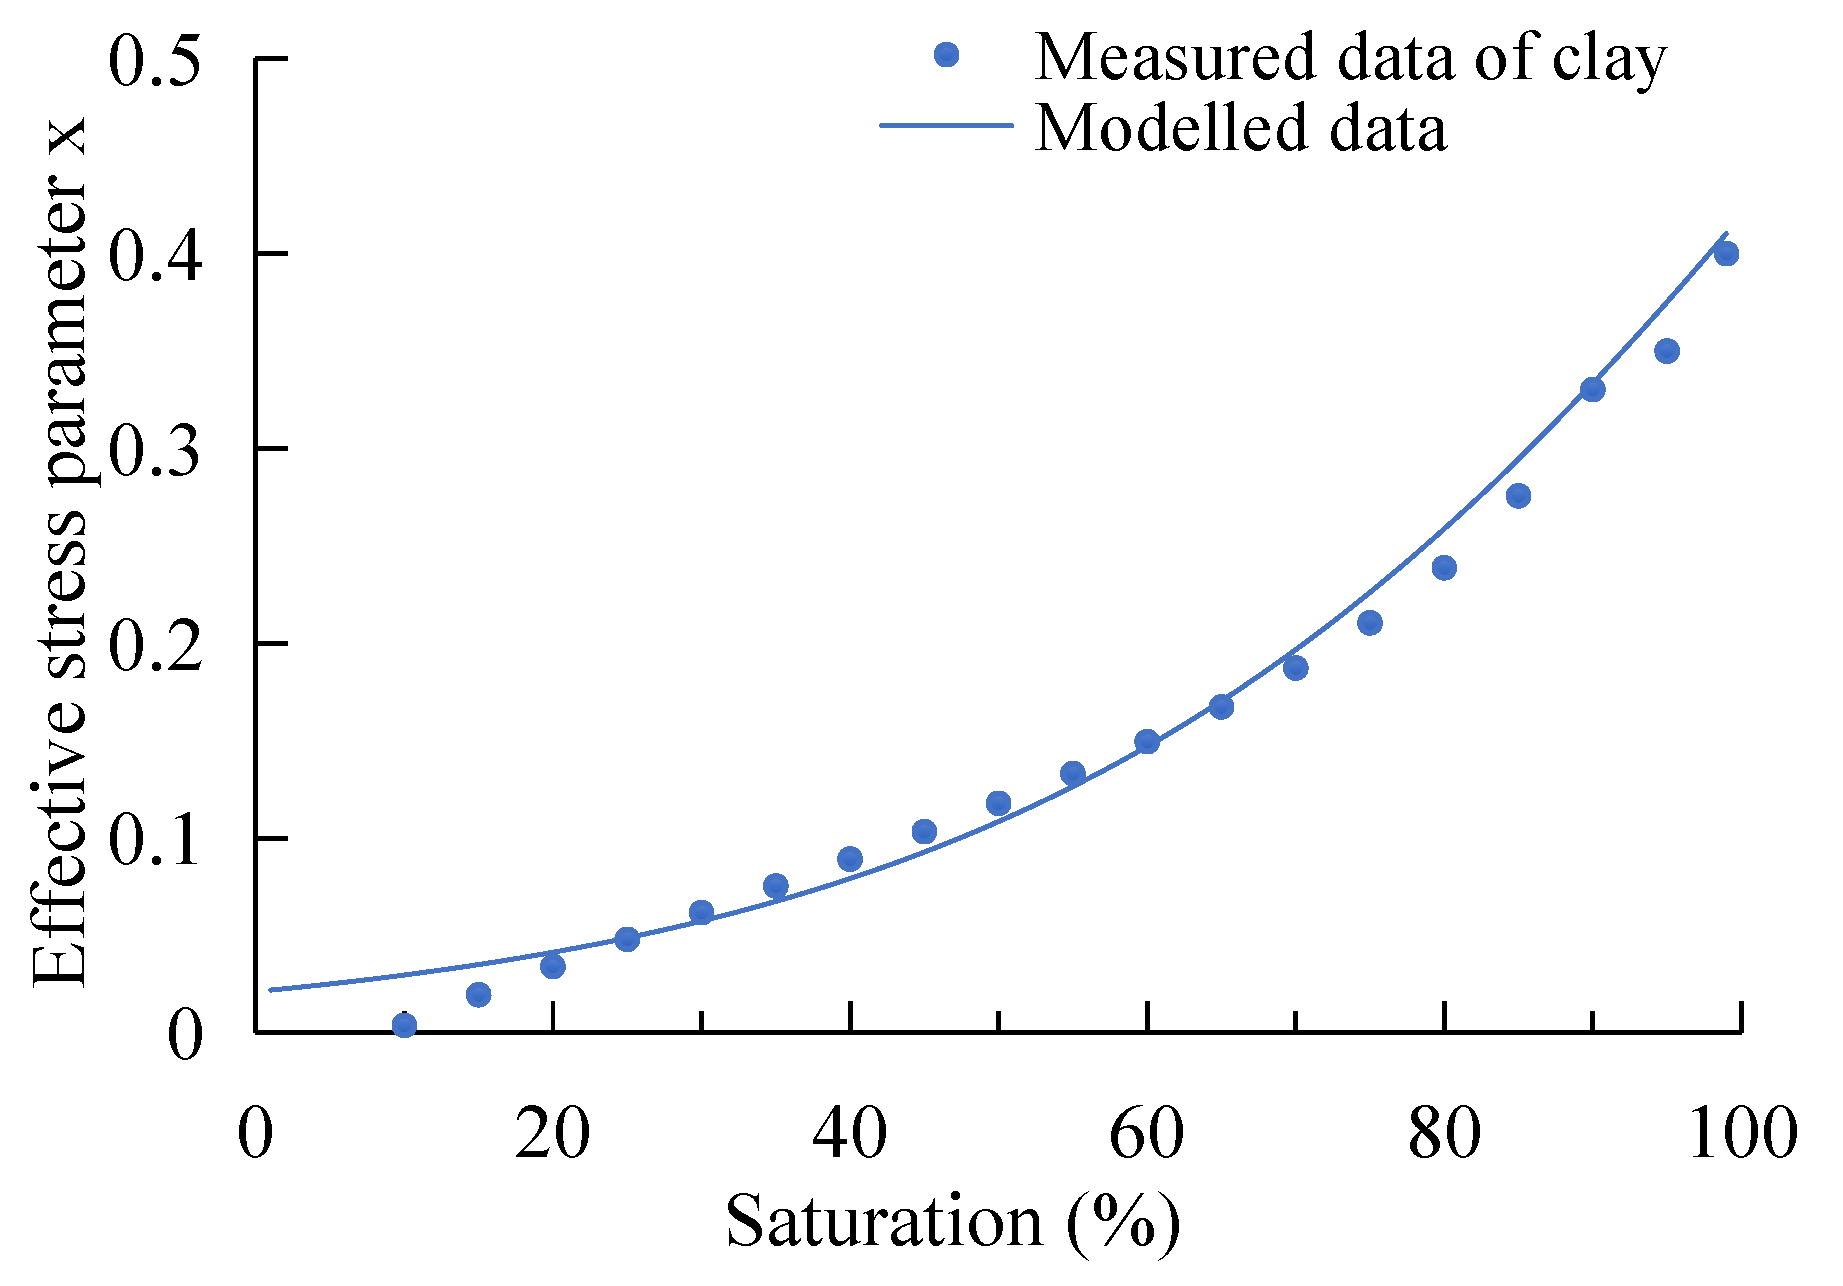
2.3. Khalili Model
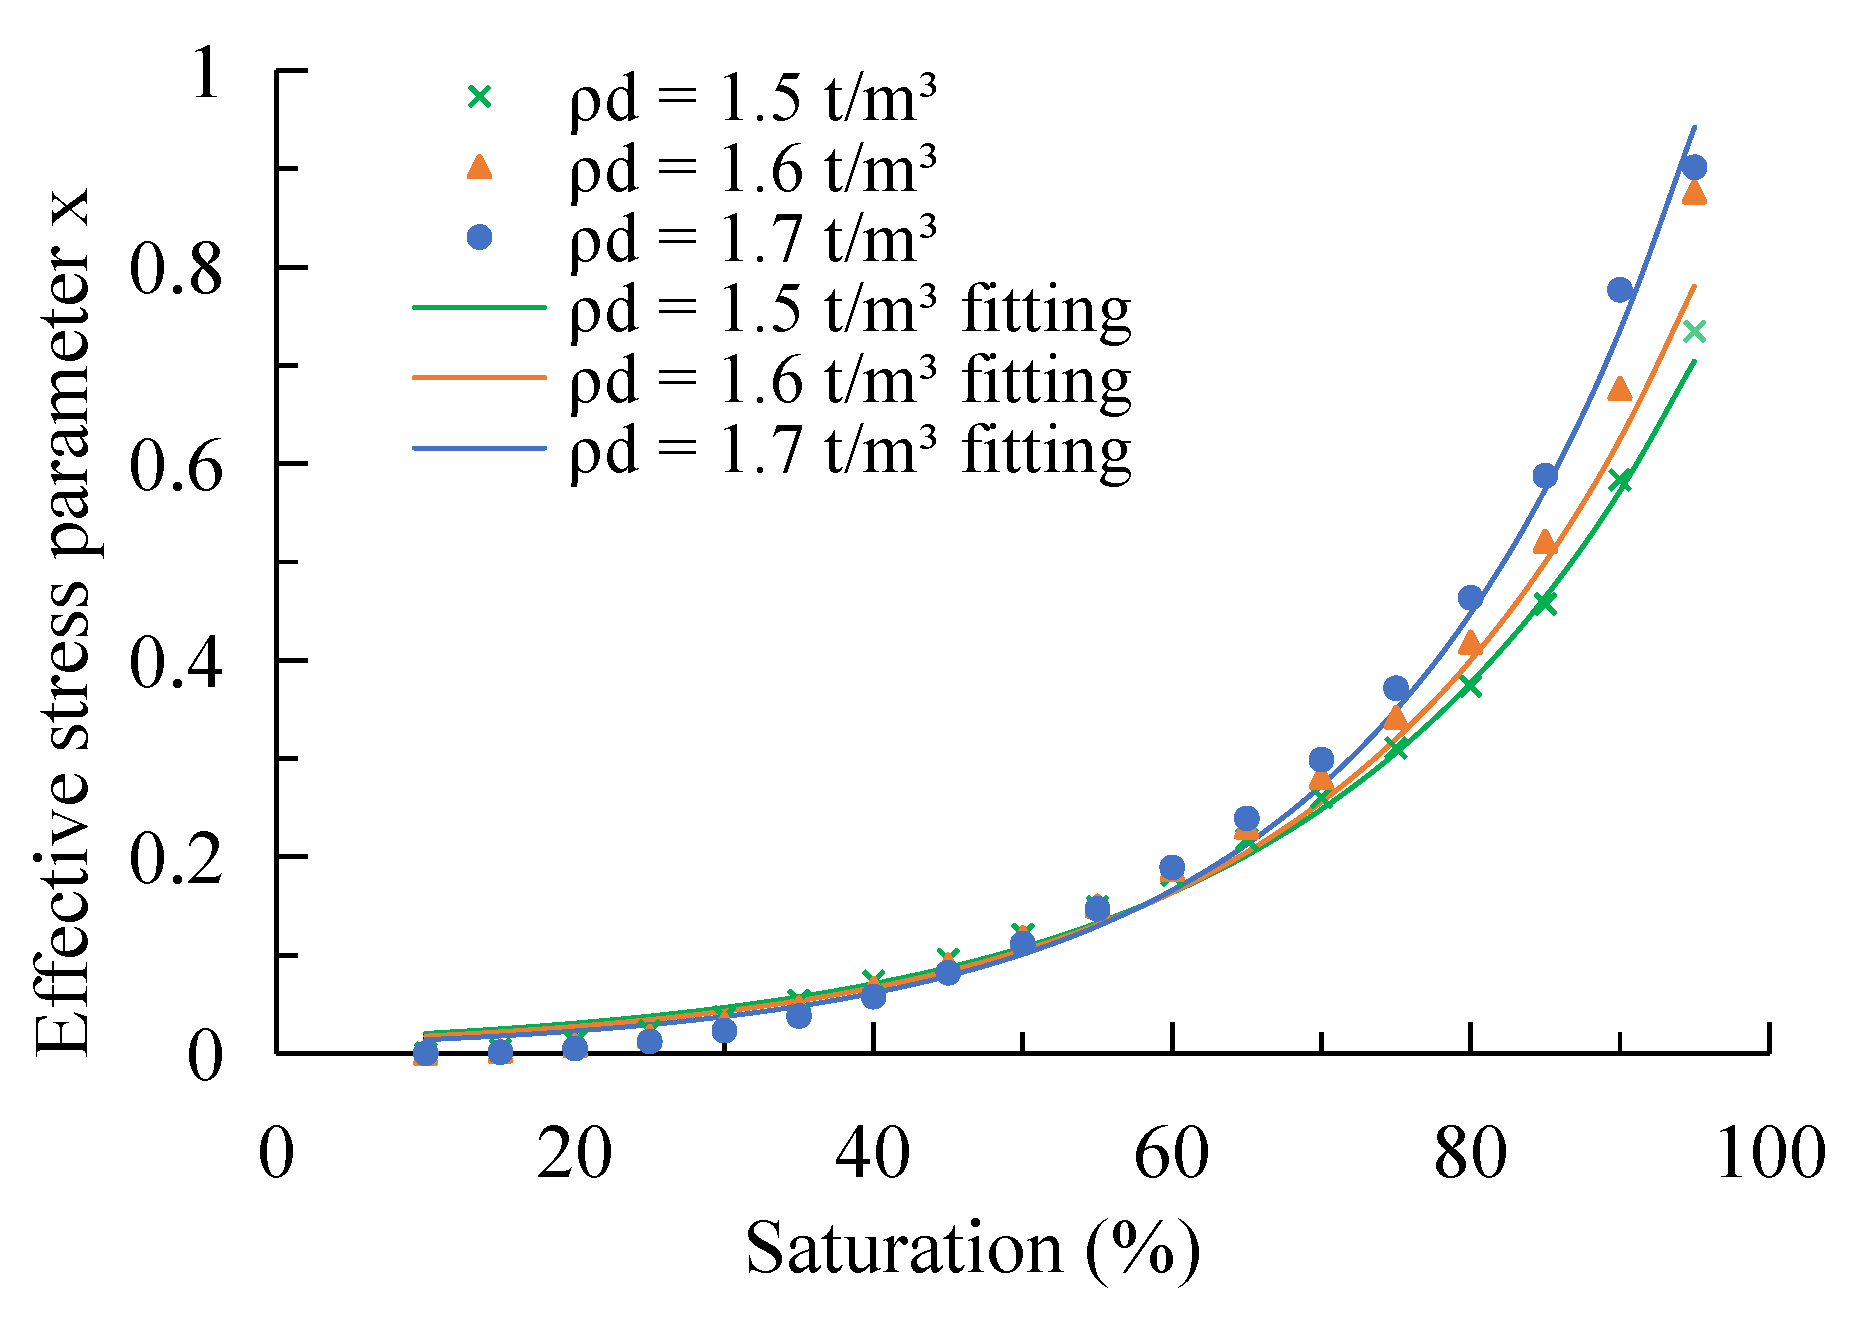
2.4. The New Model
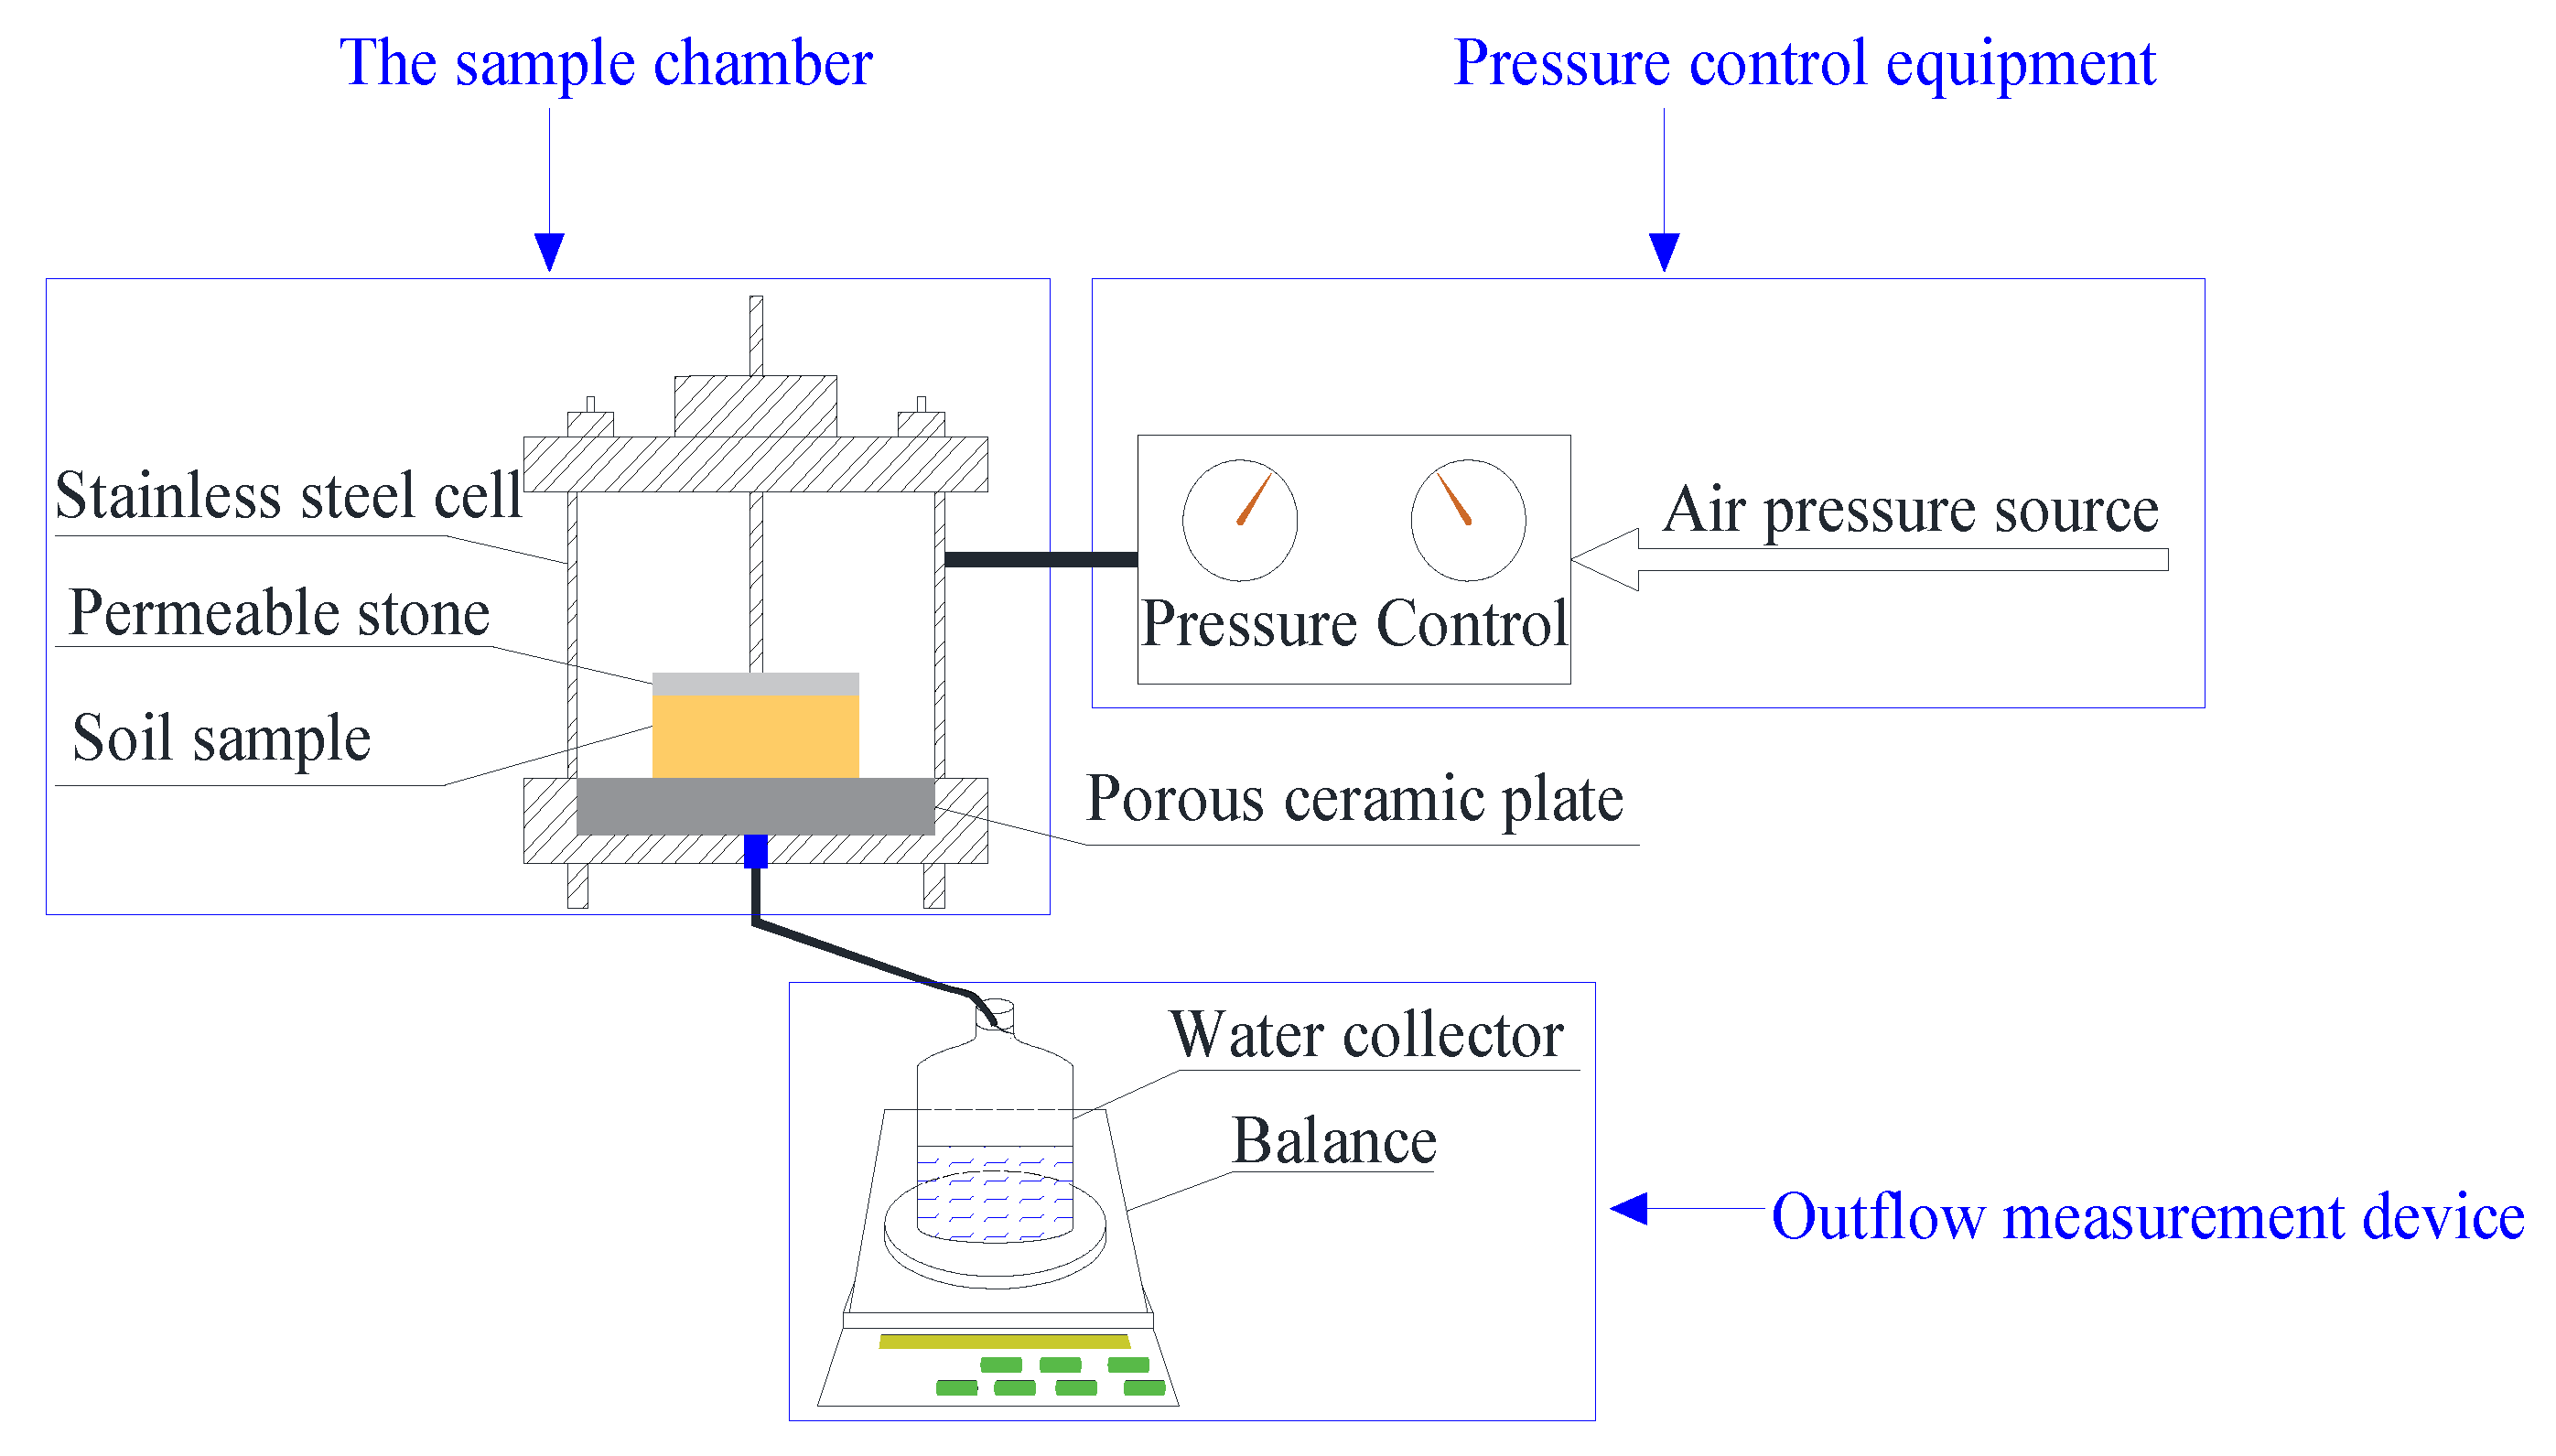
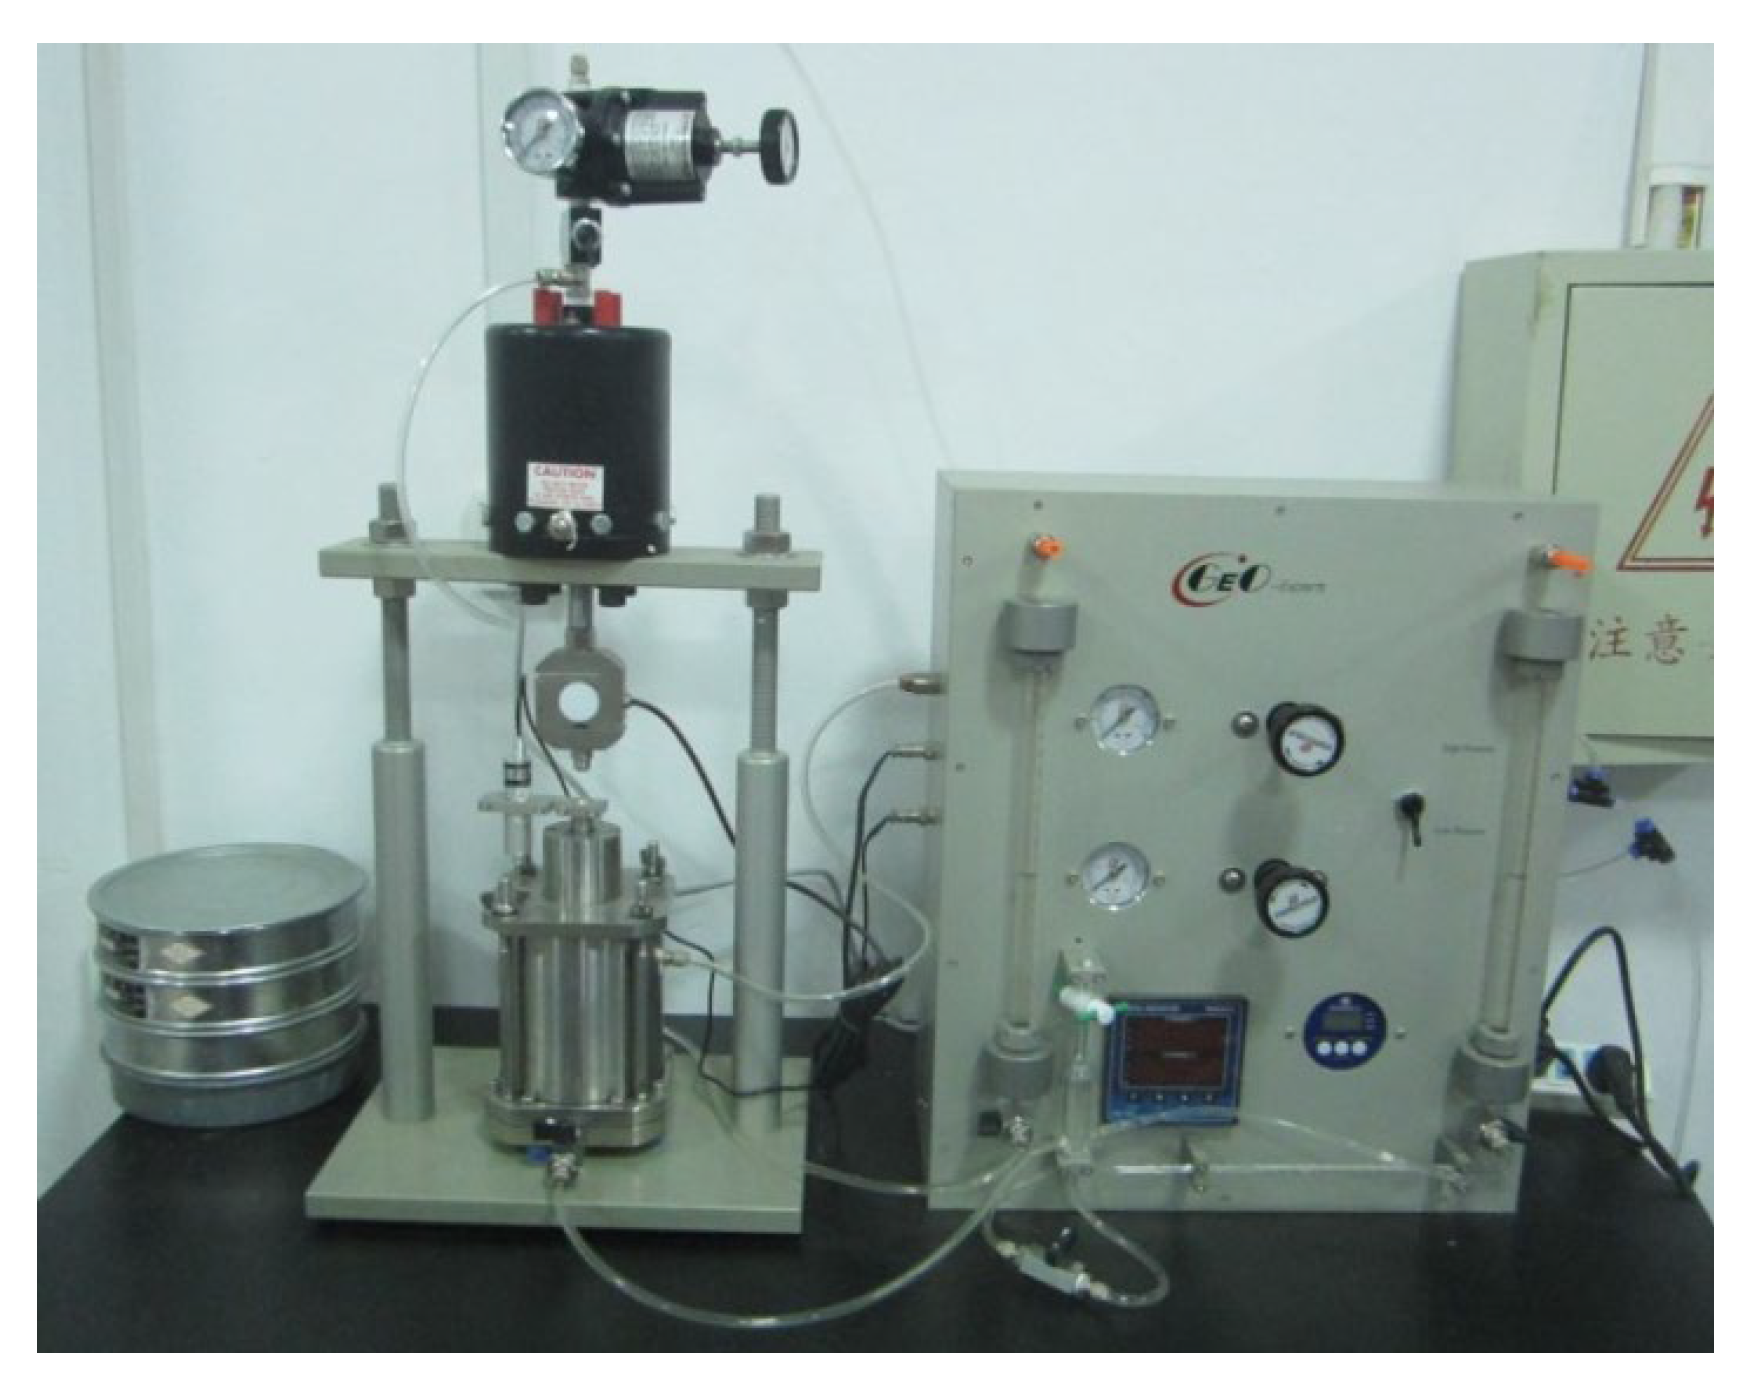
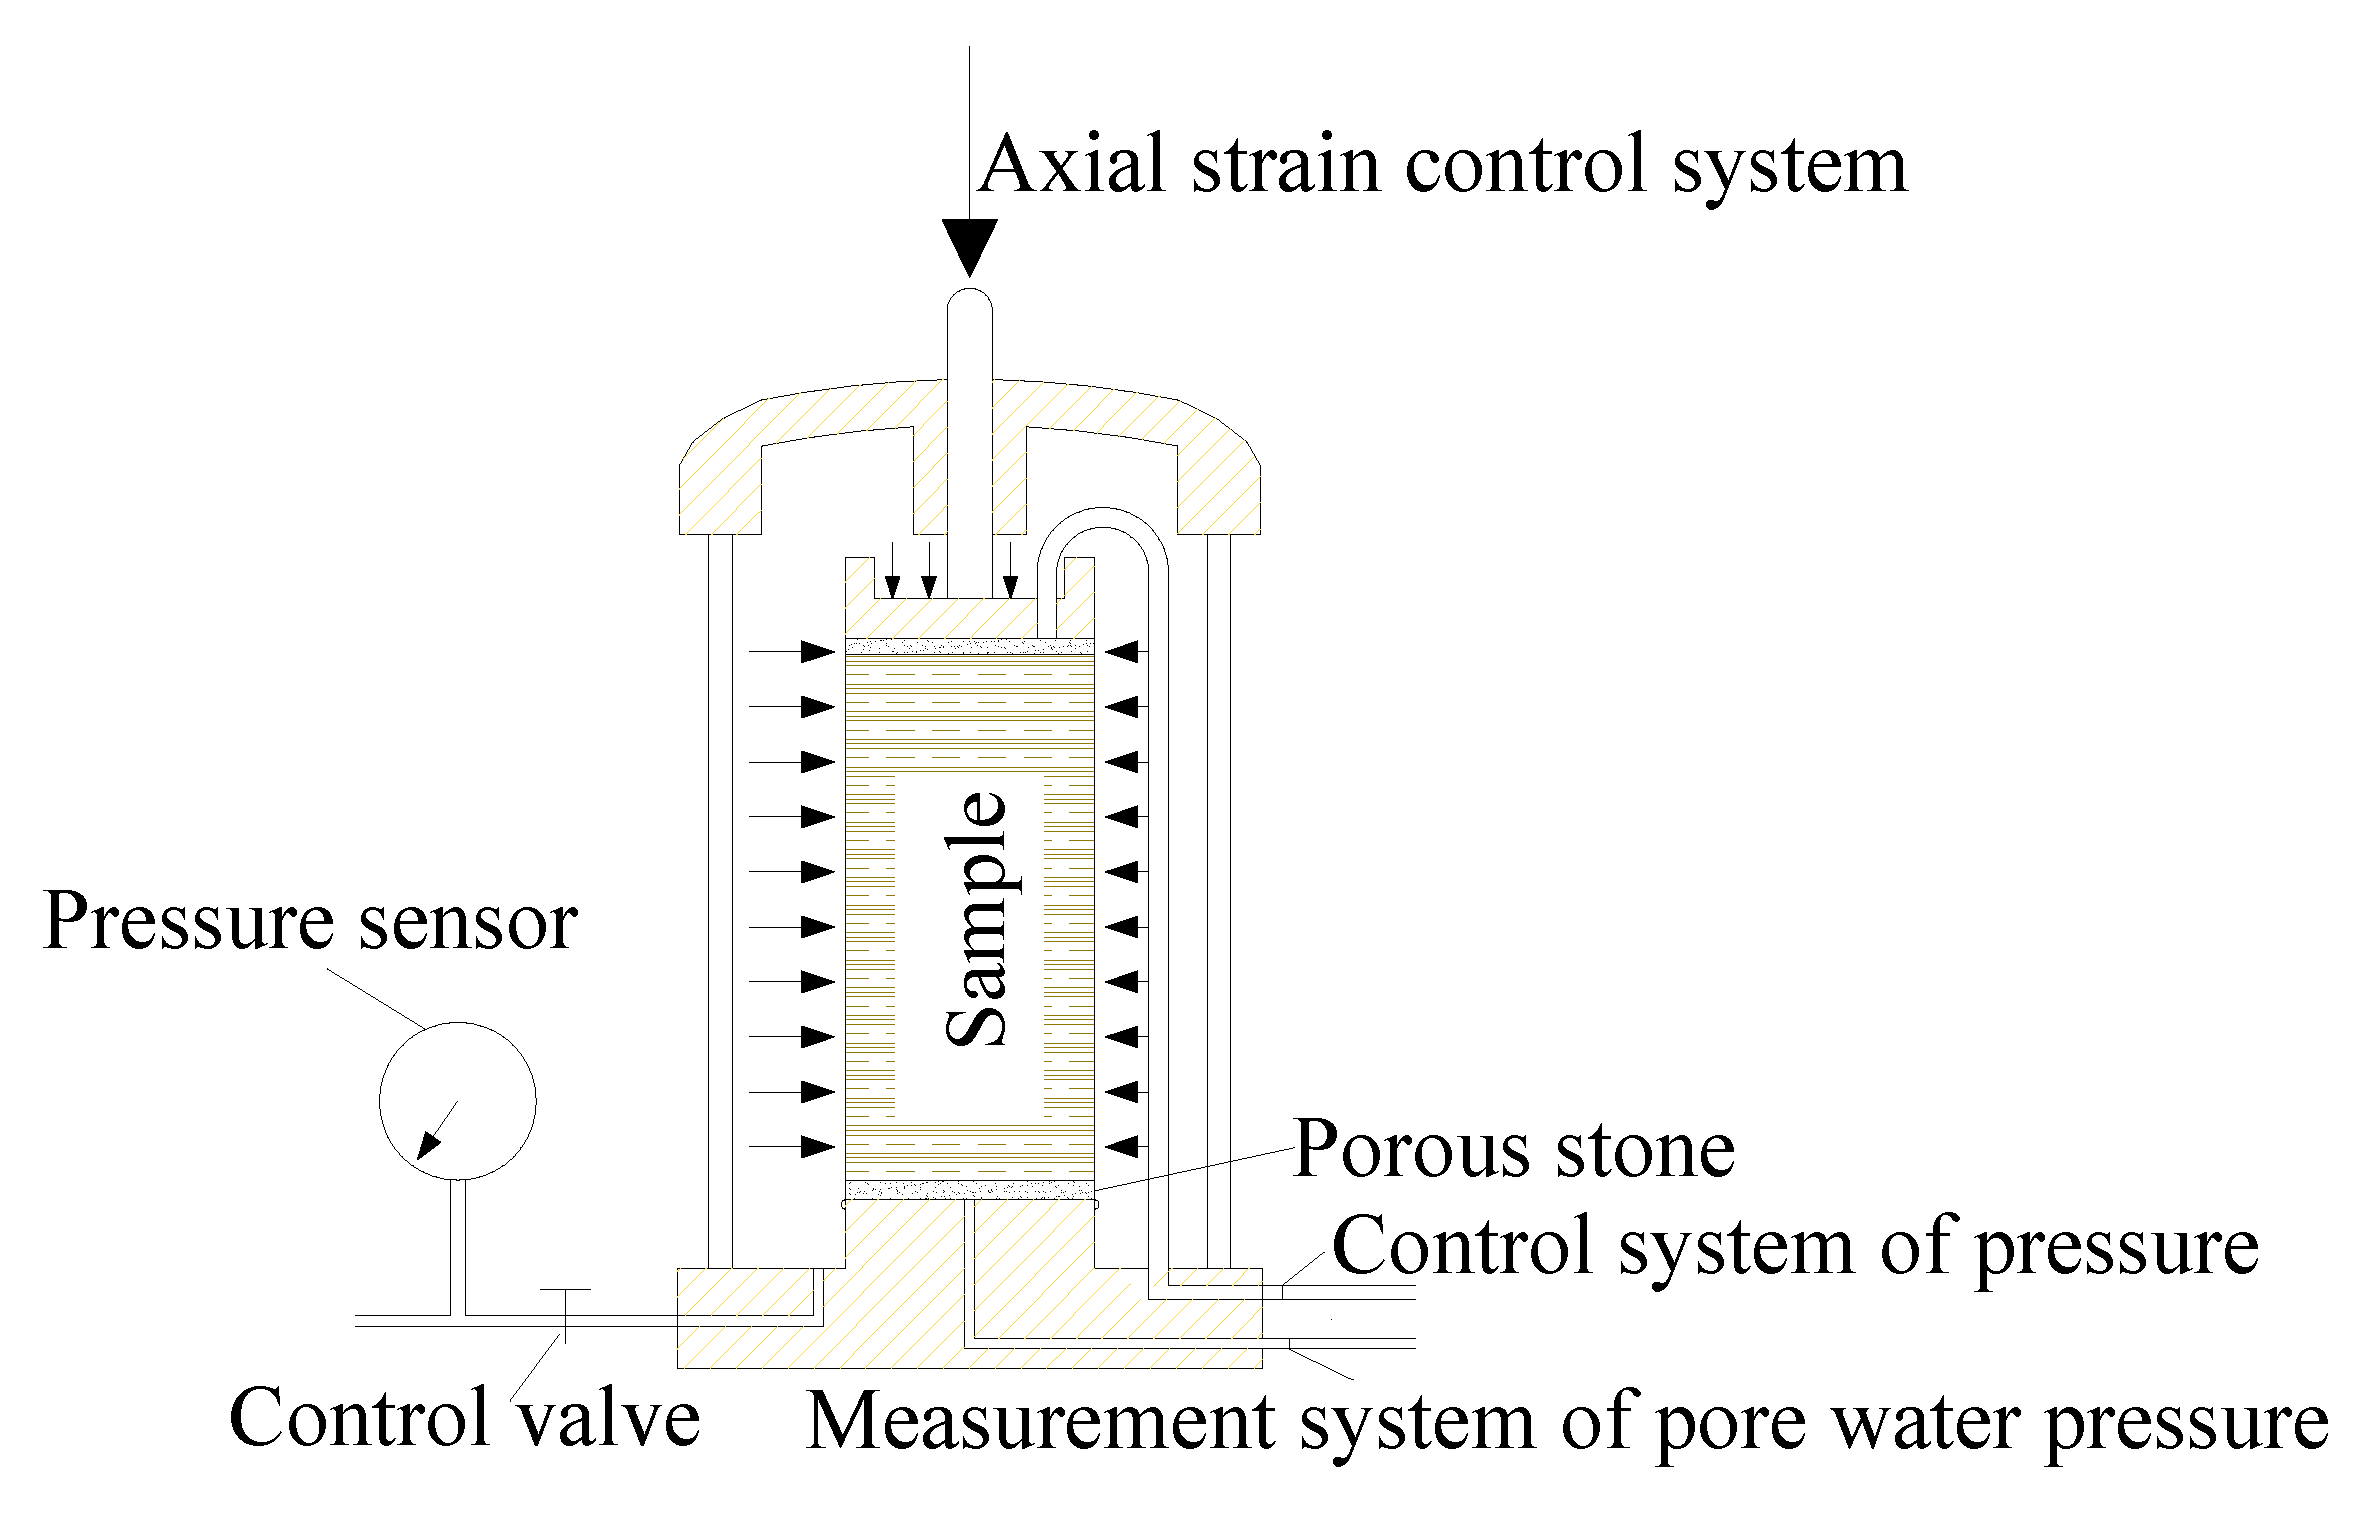
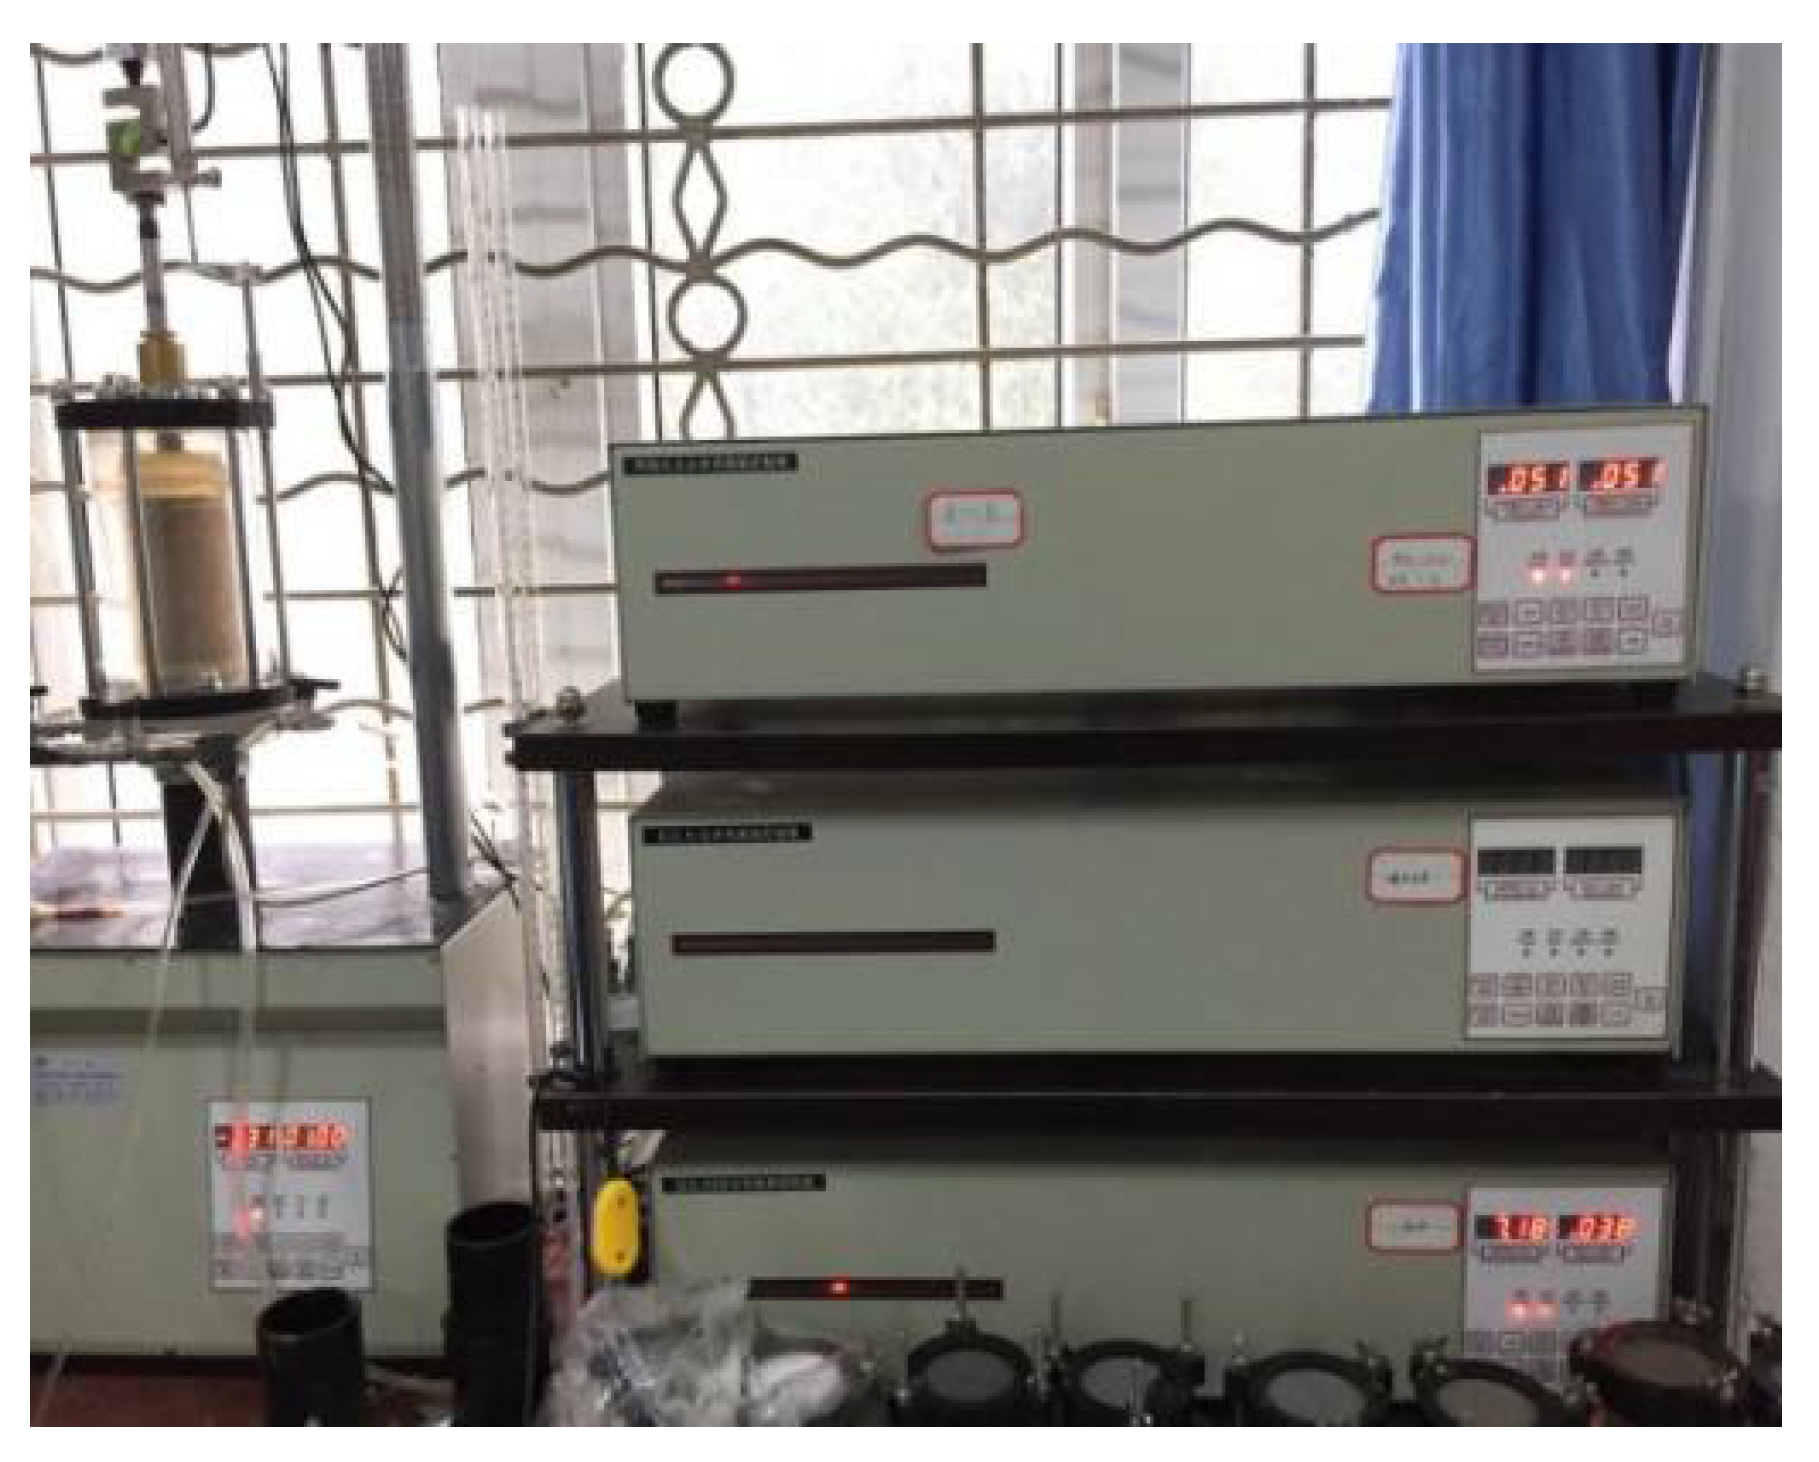
3. Materials and Experimental System
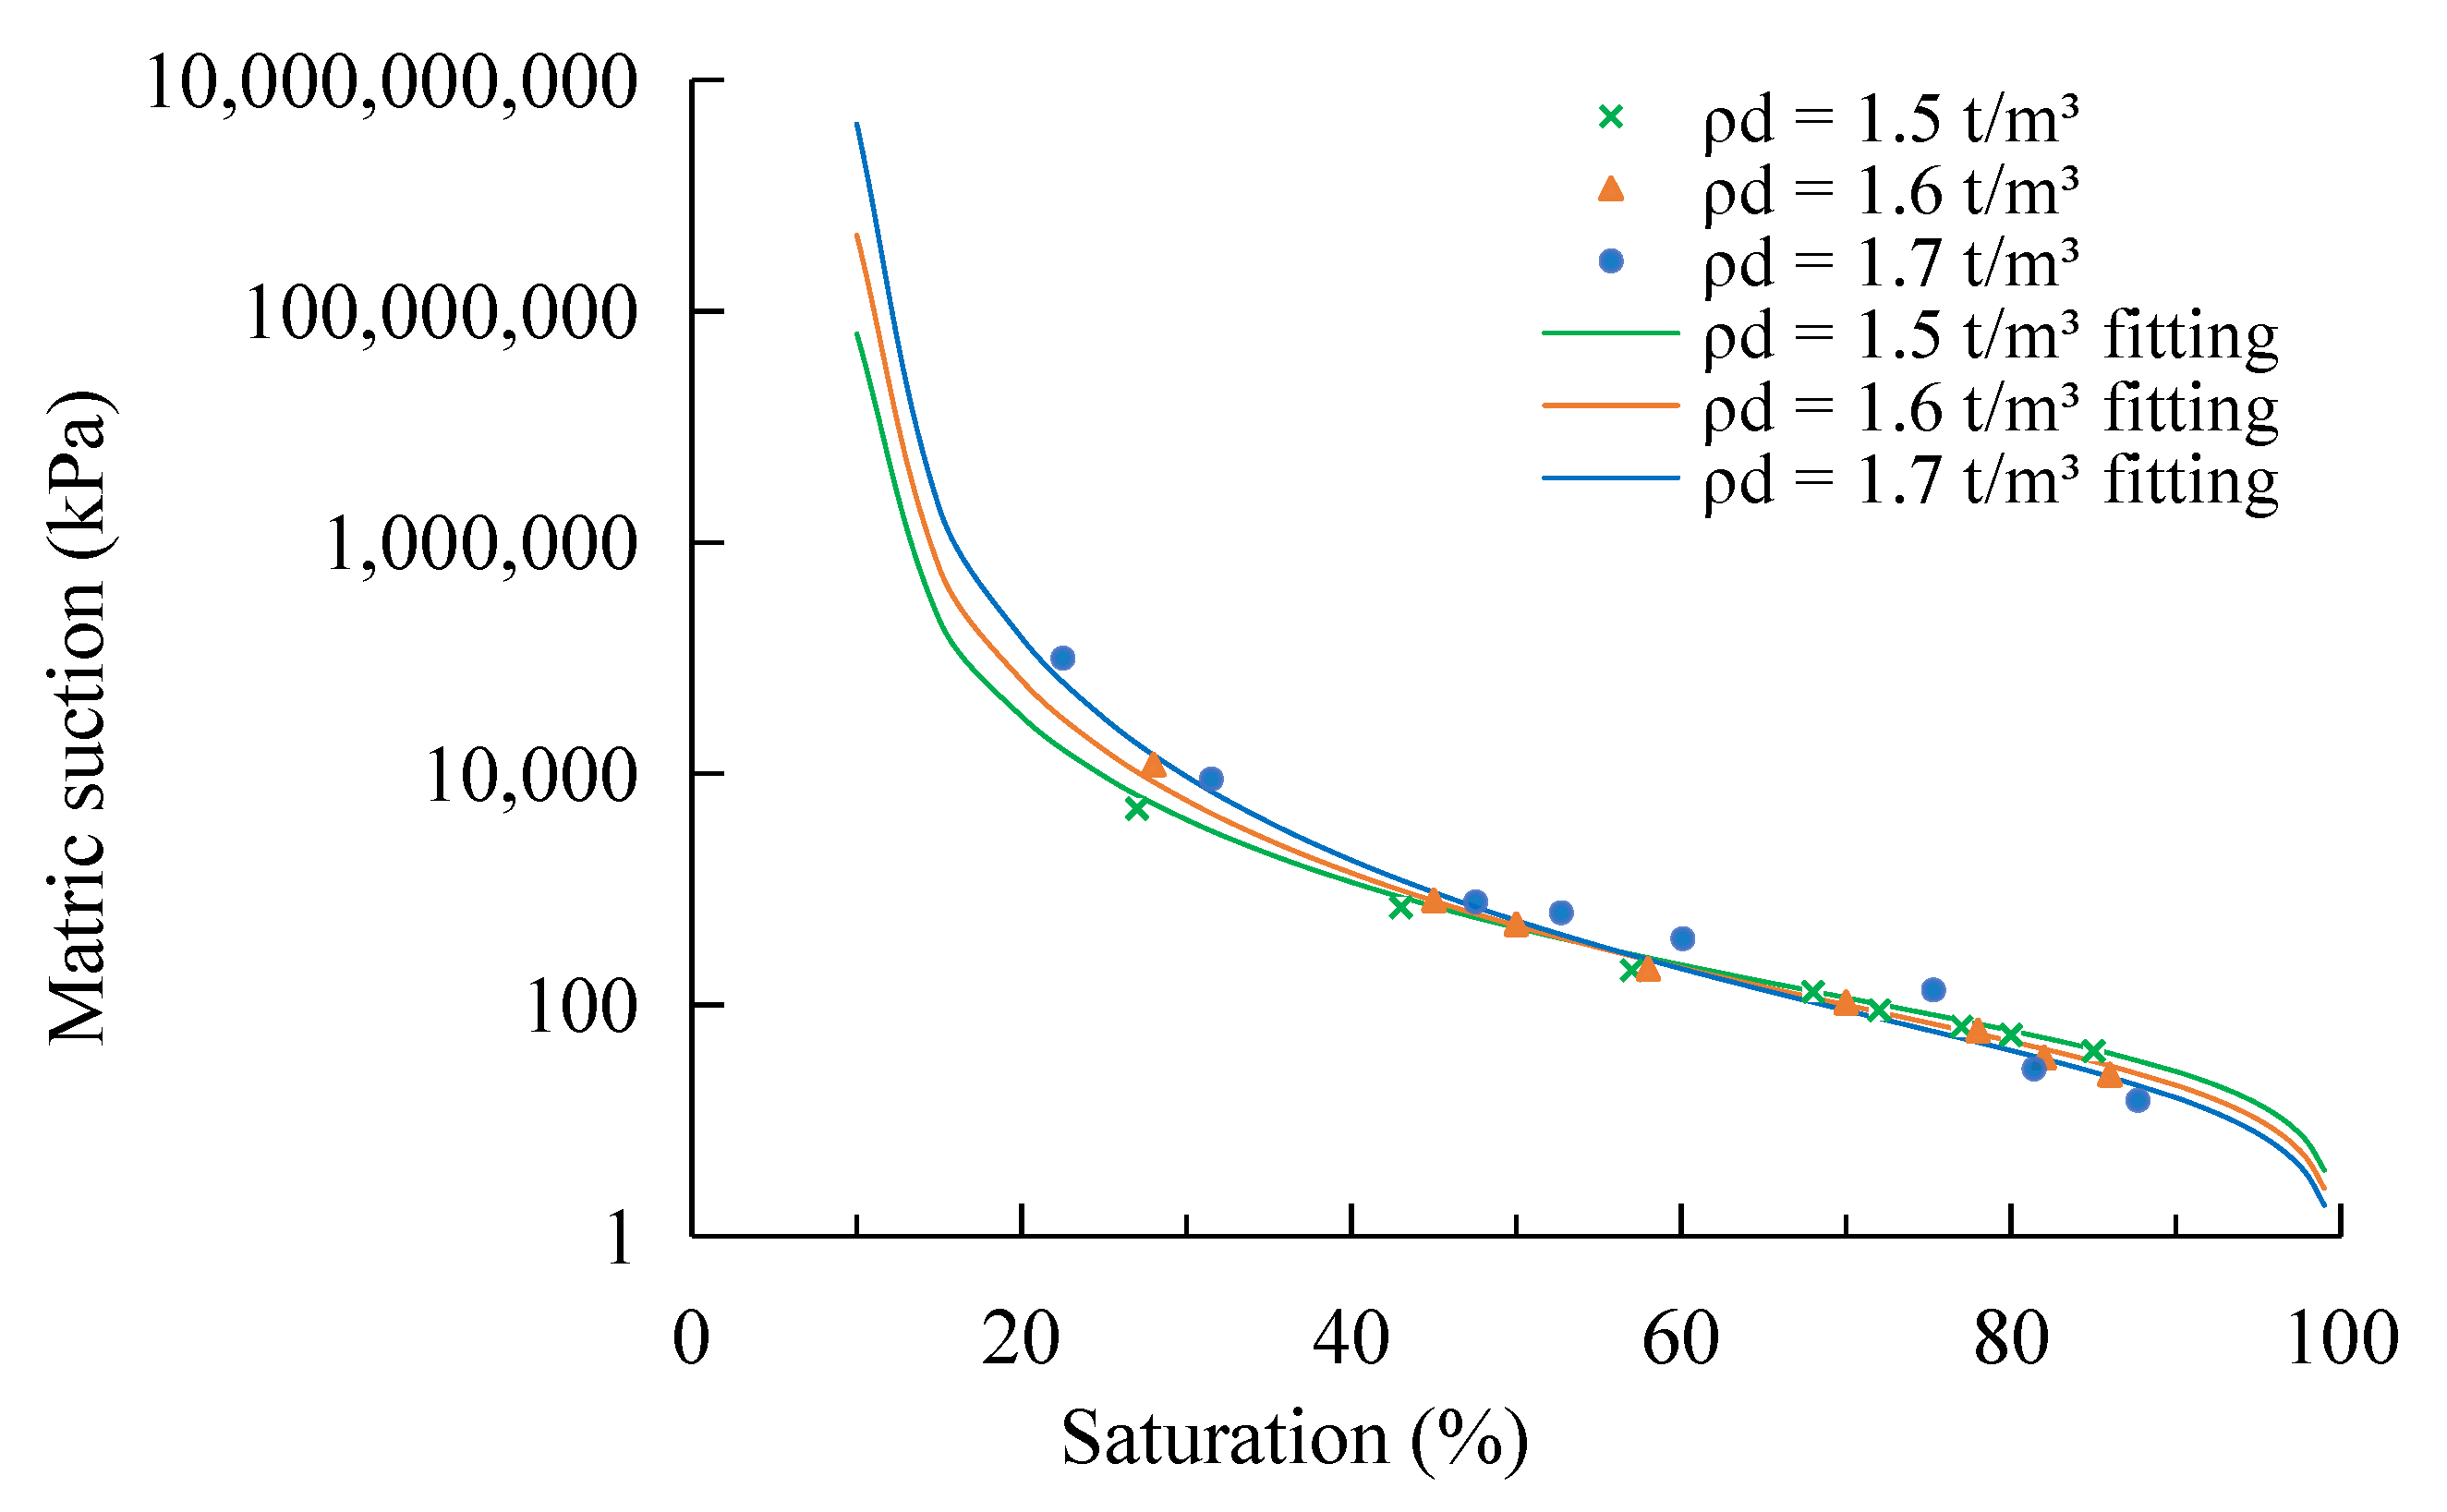
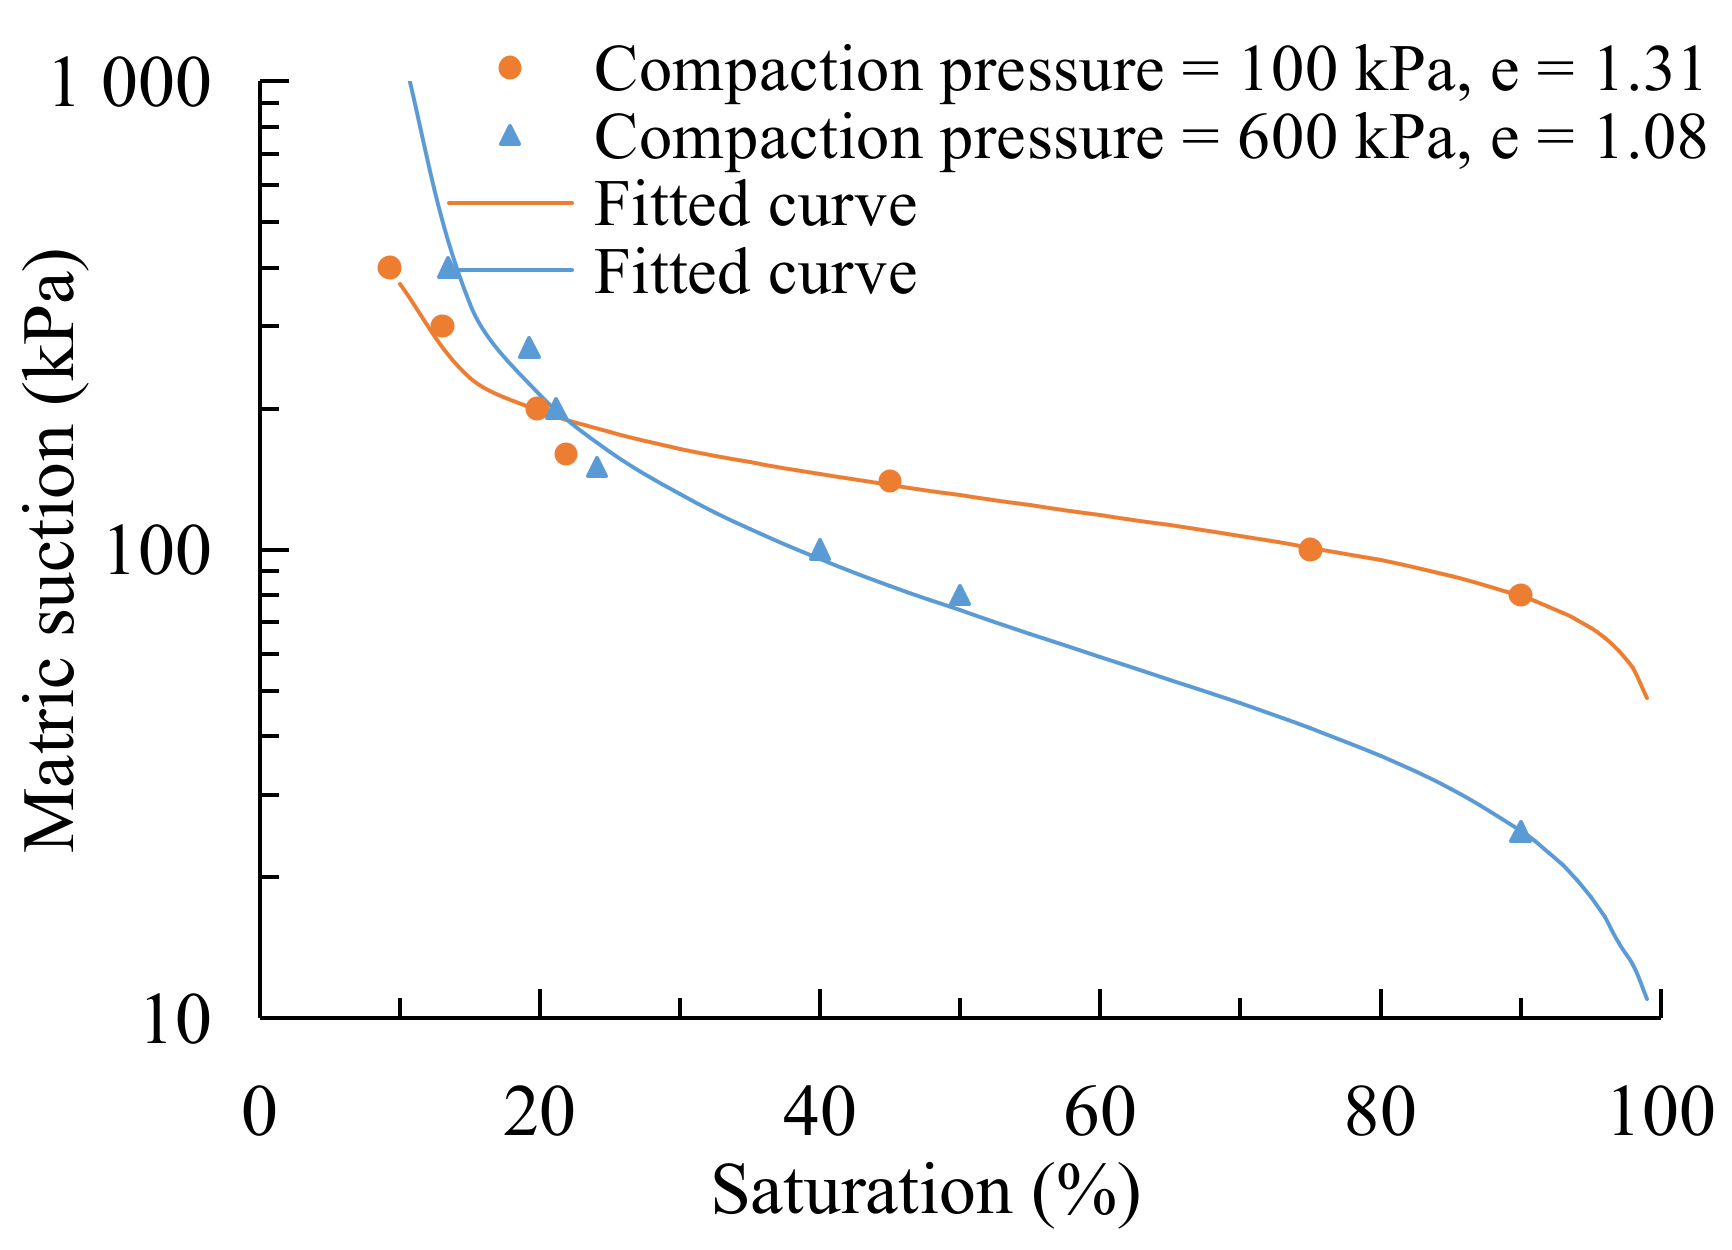
3.1. Soil–Water Characteristic Curve Test
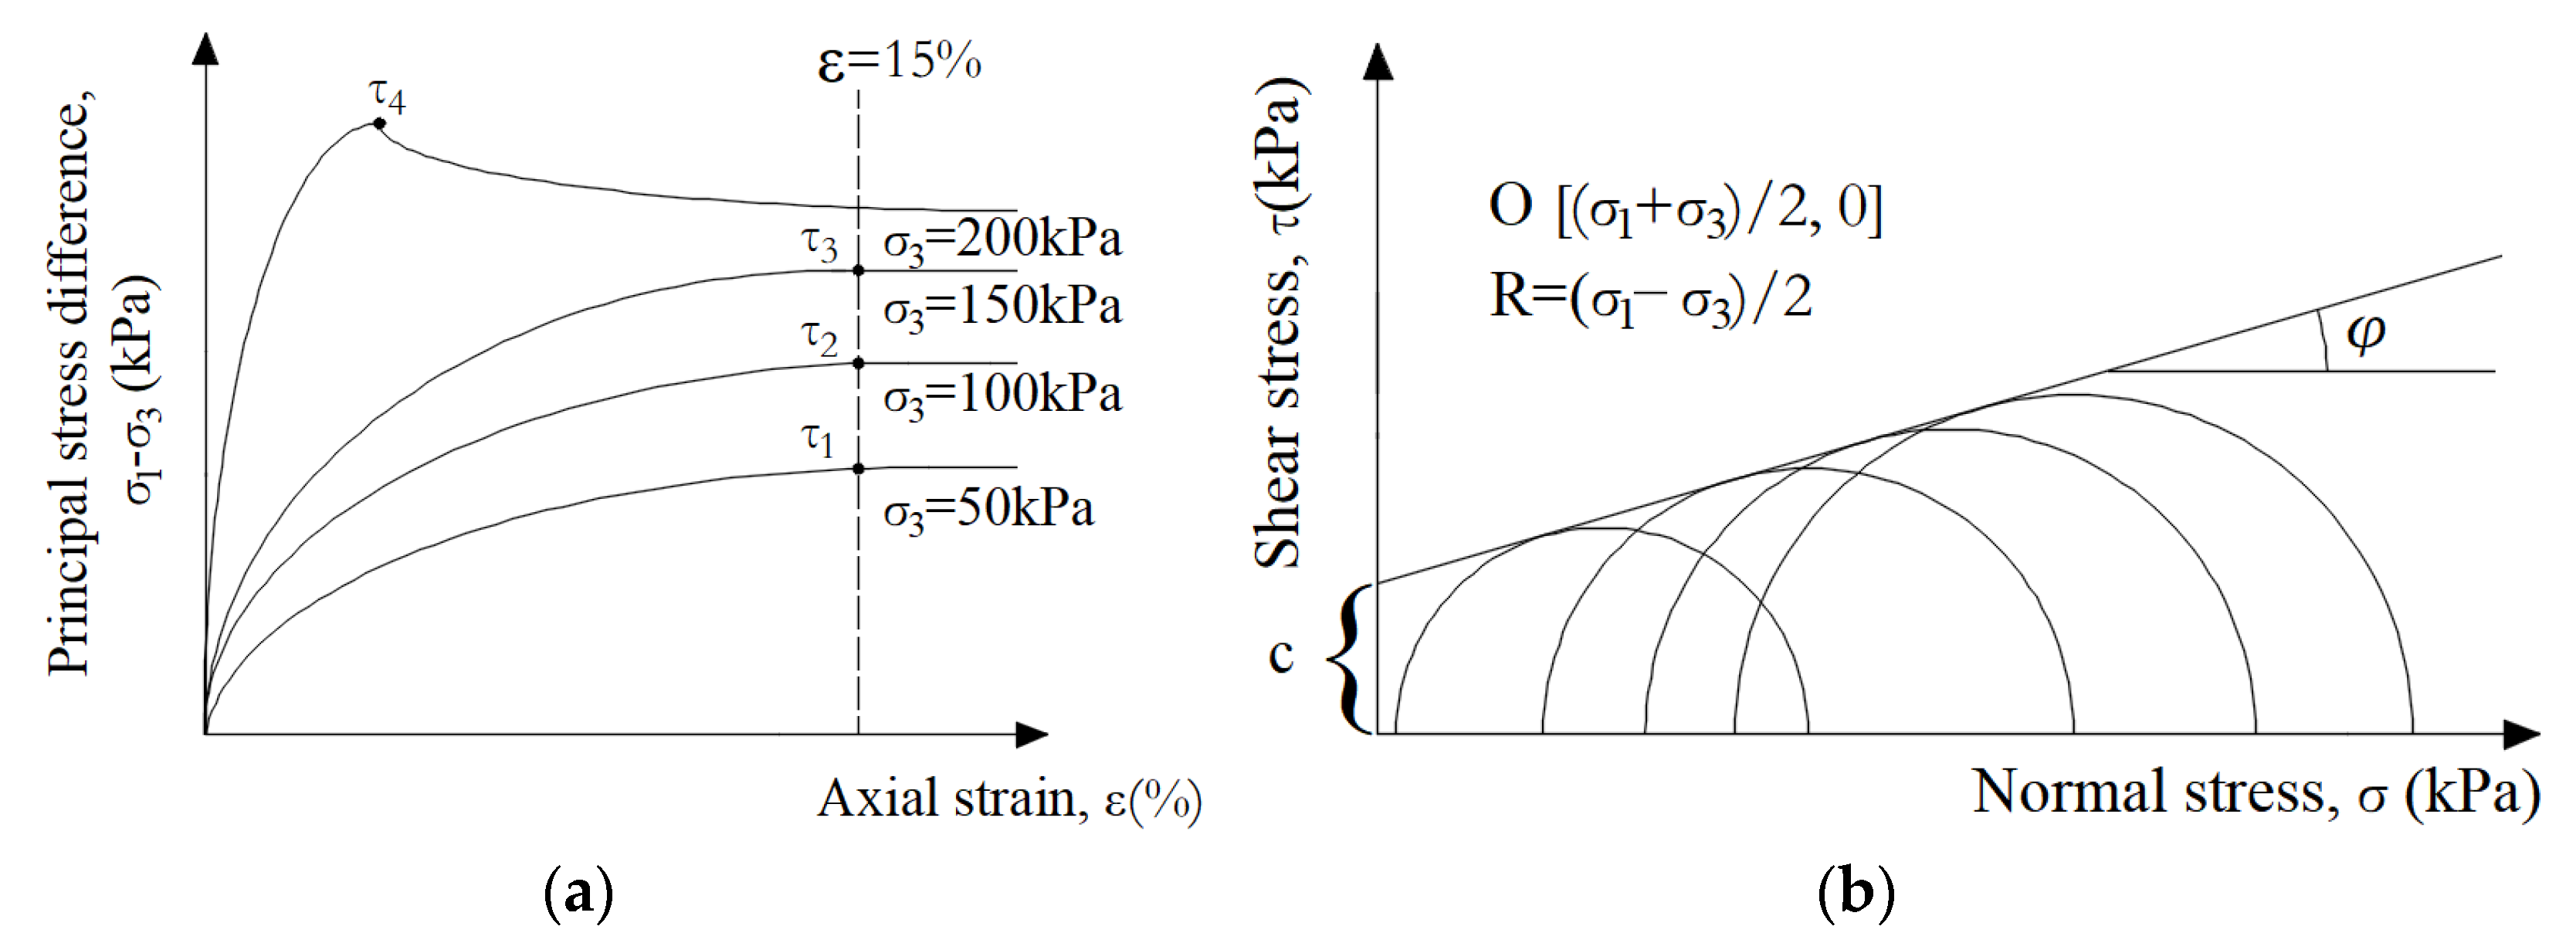
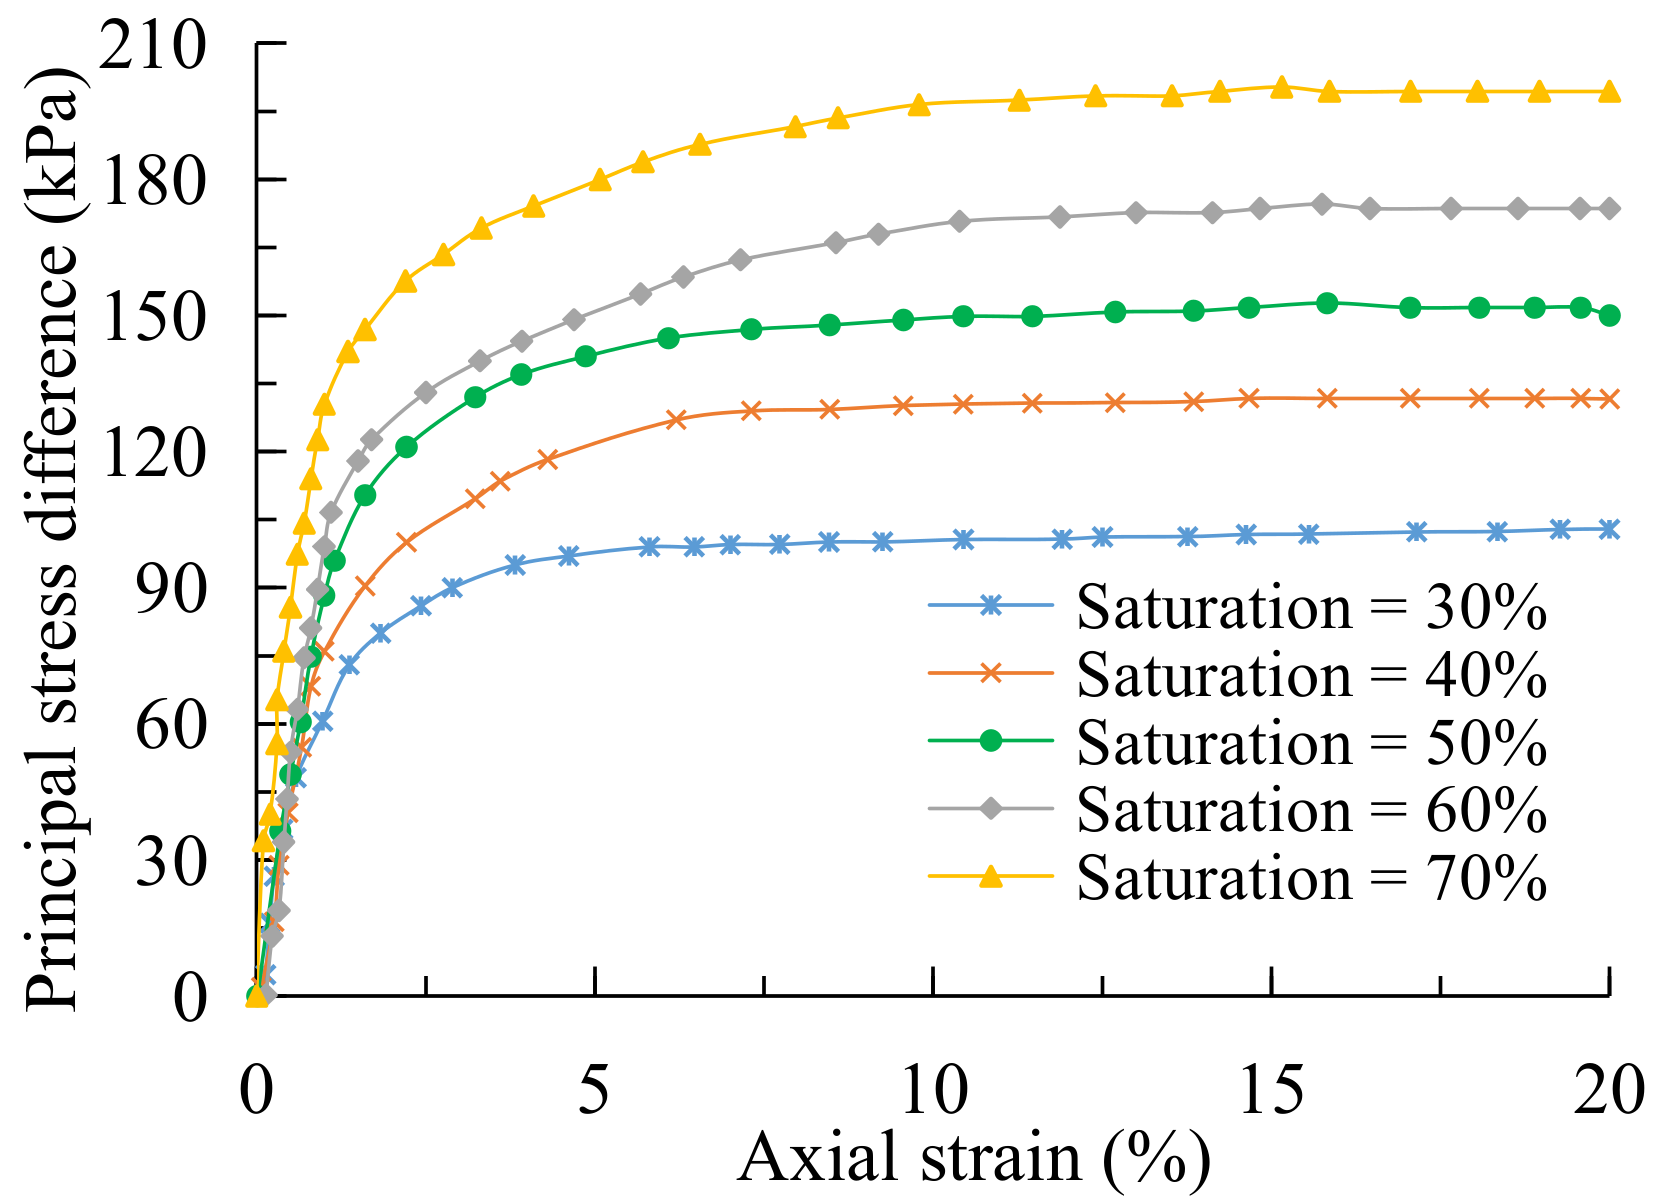
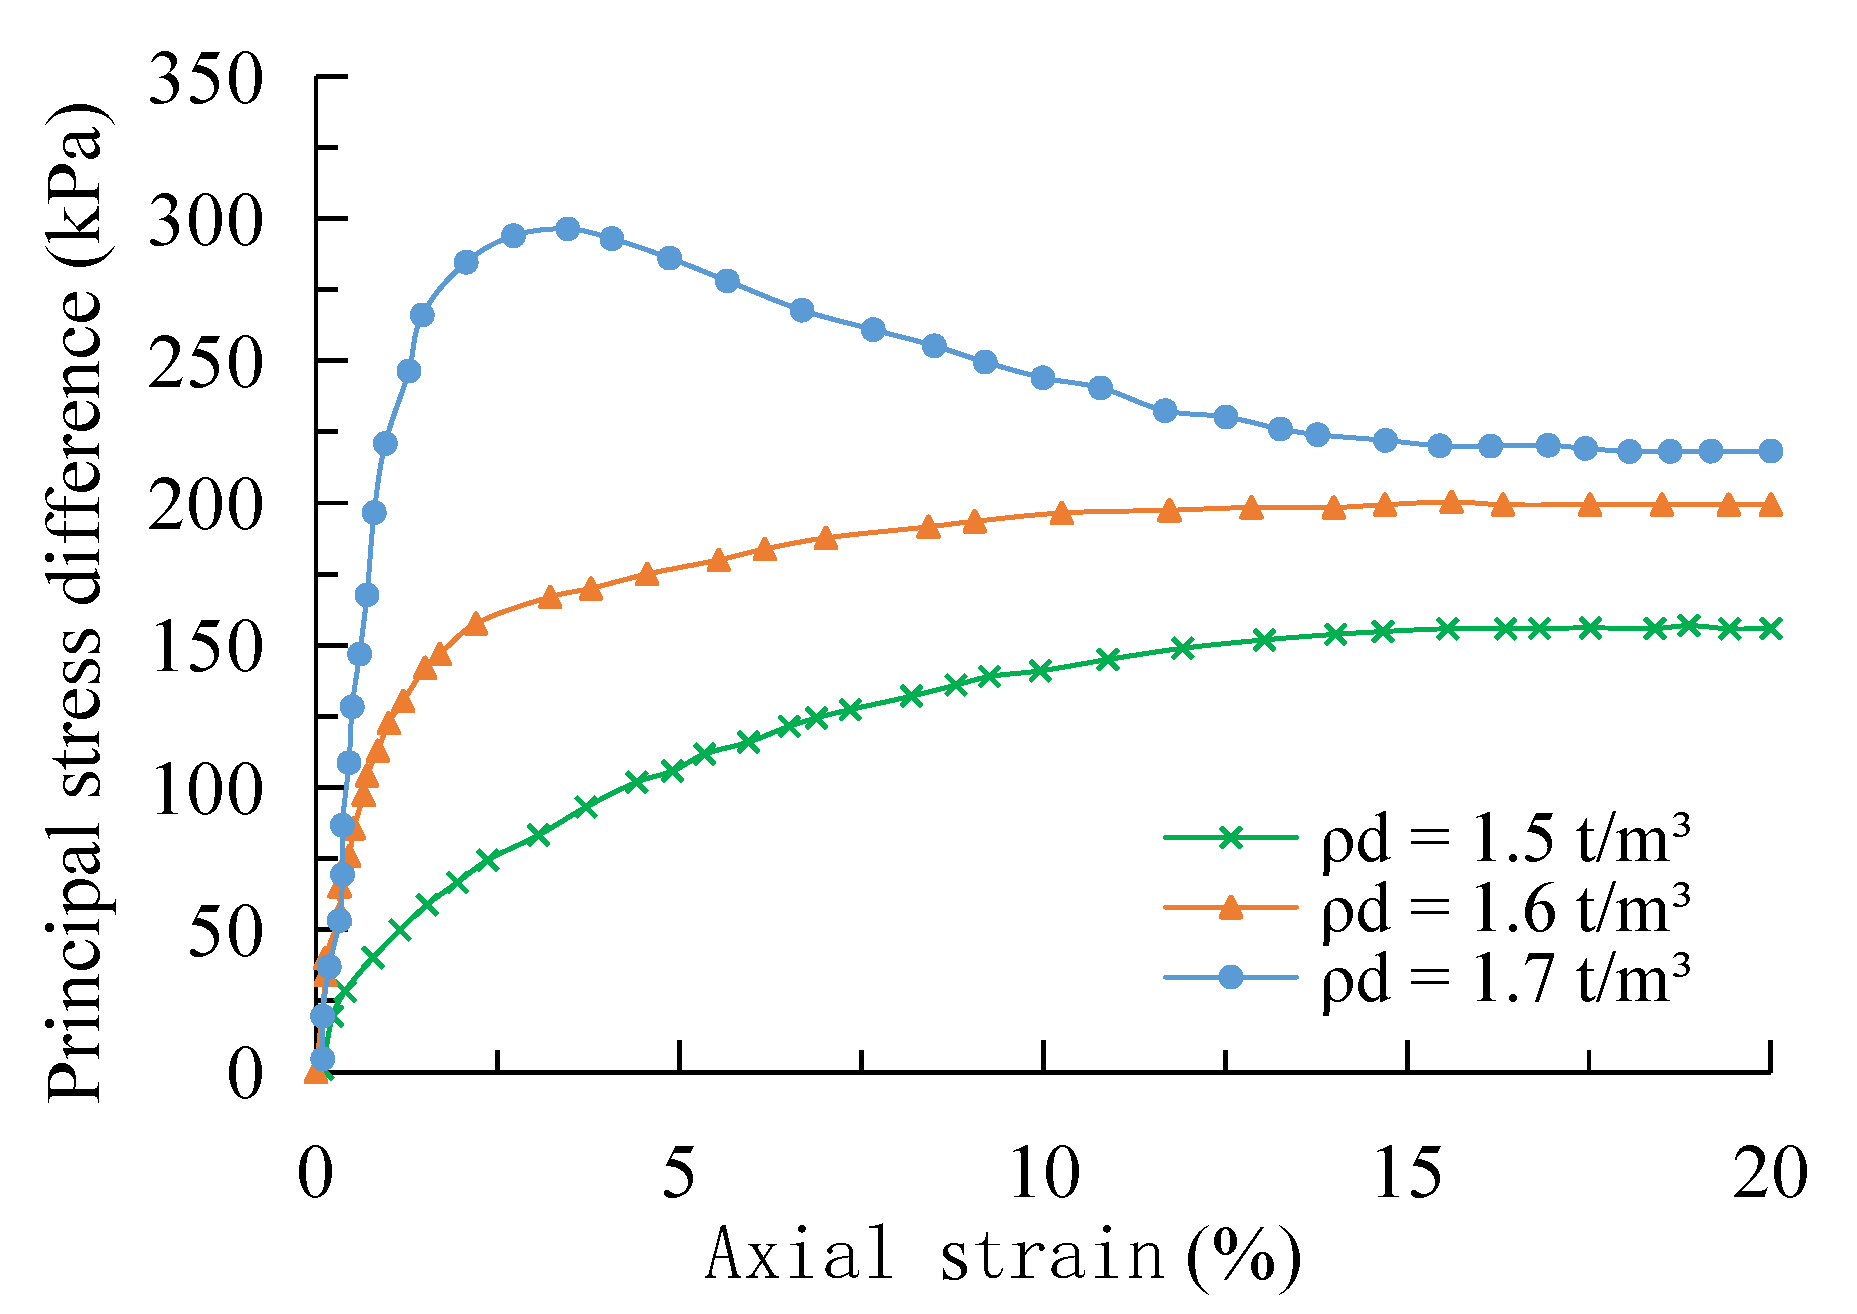
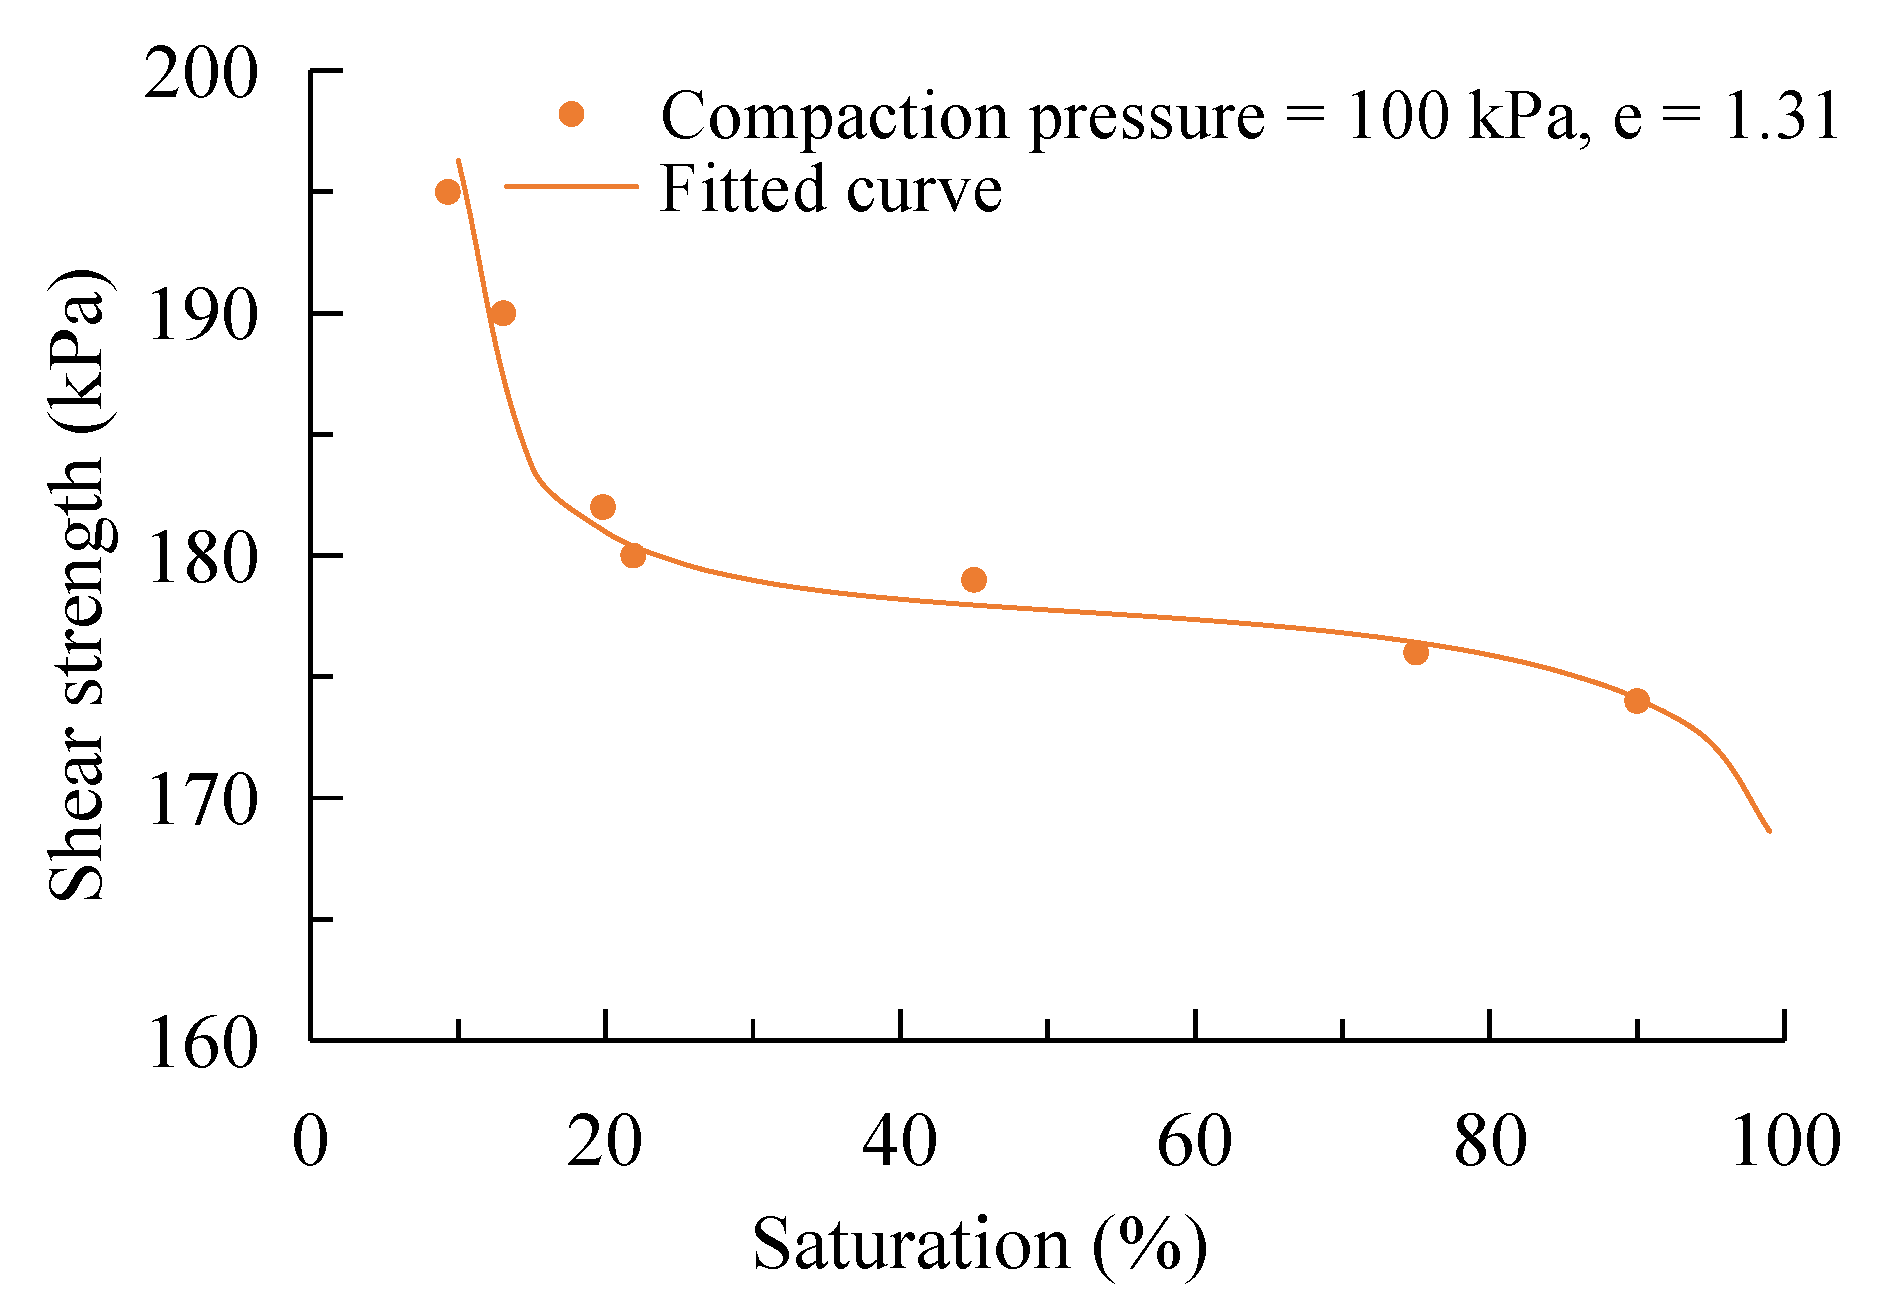
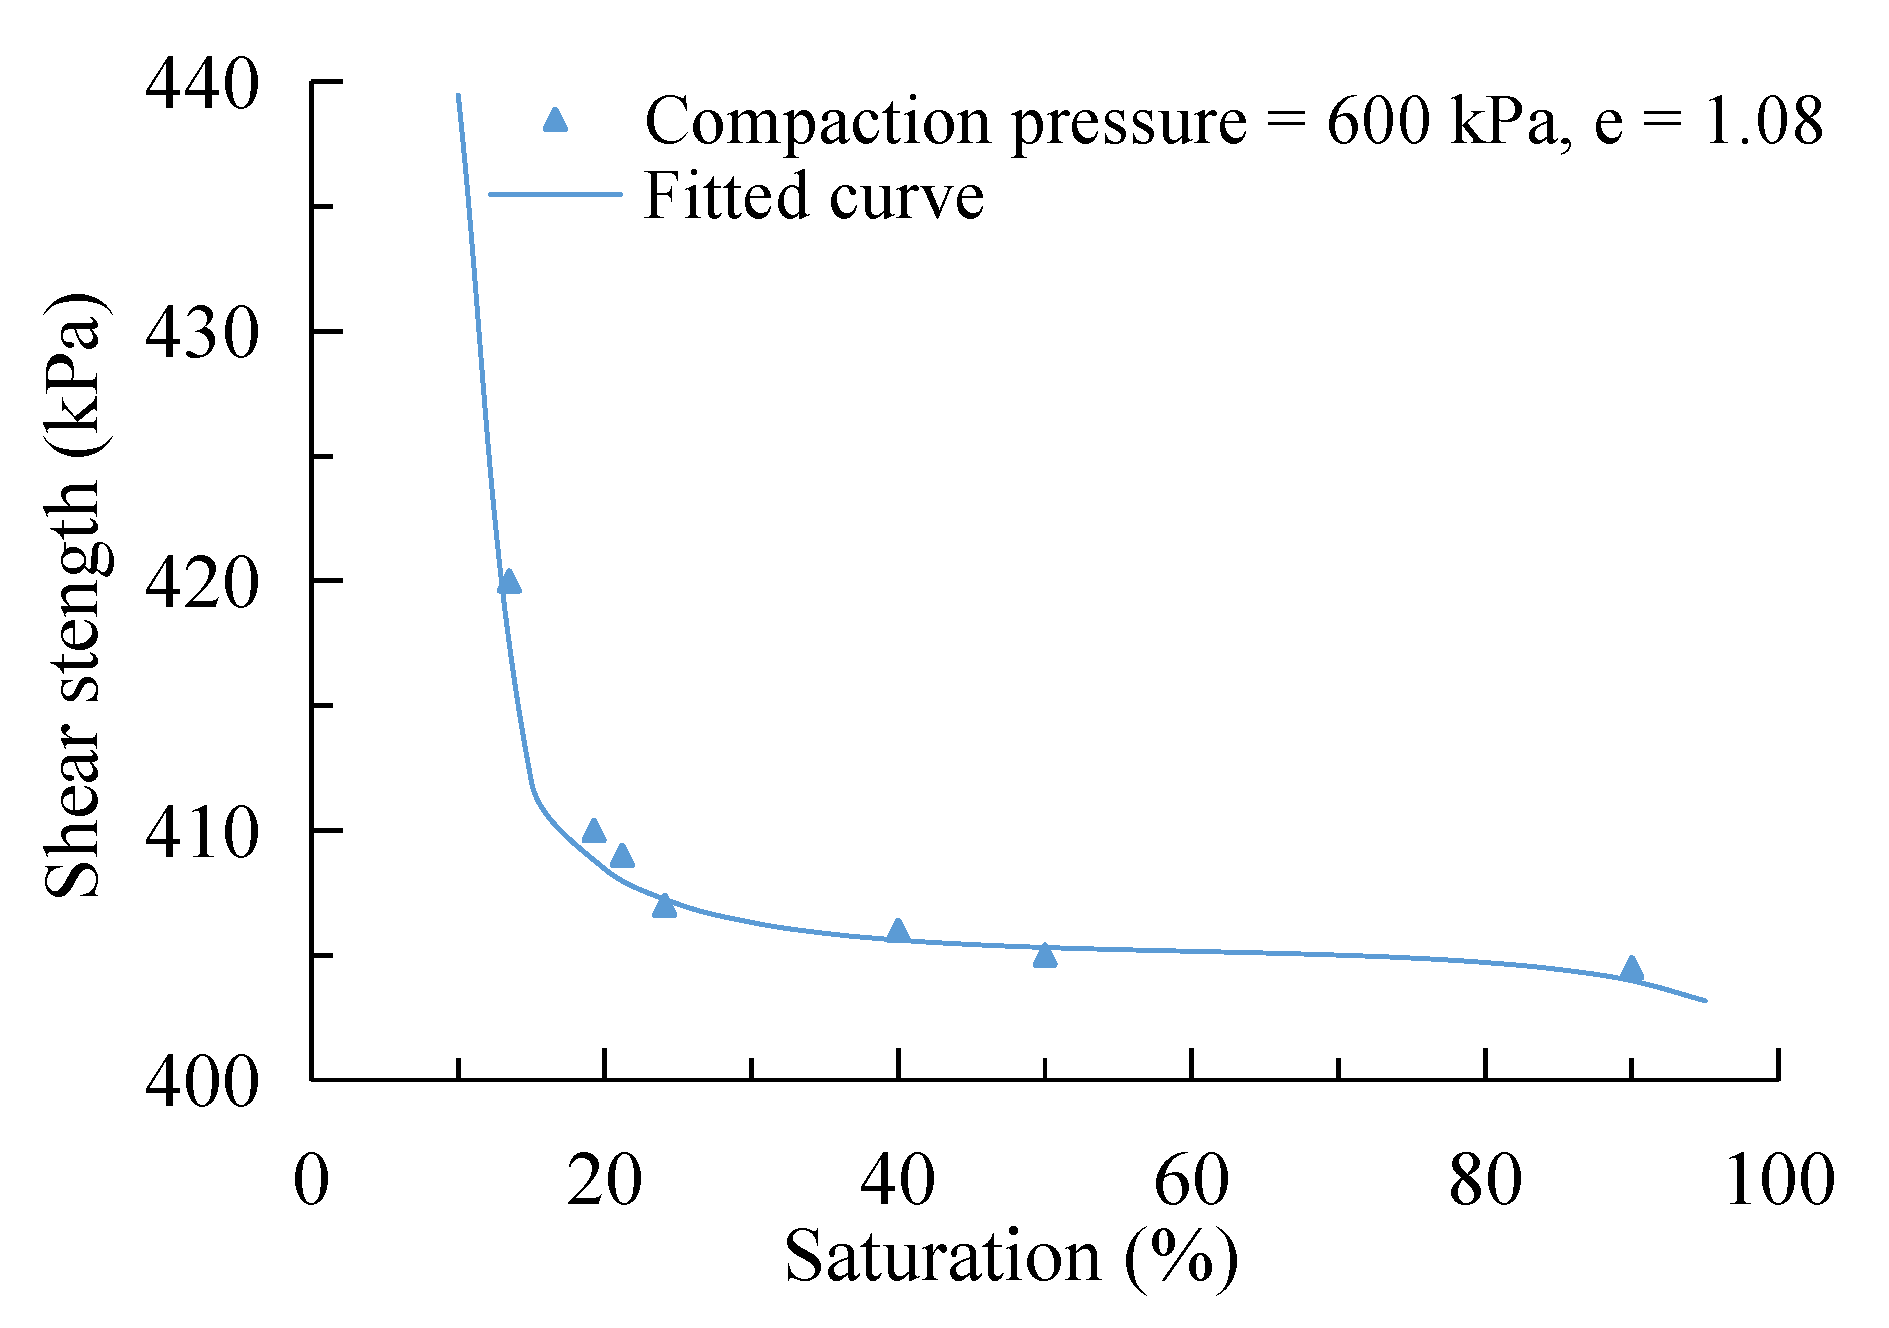
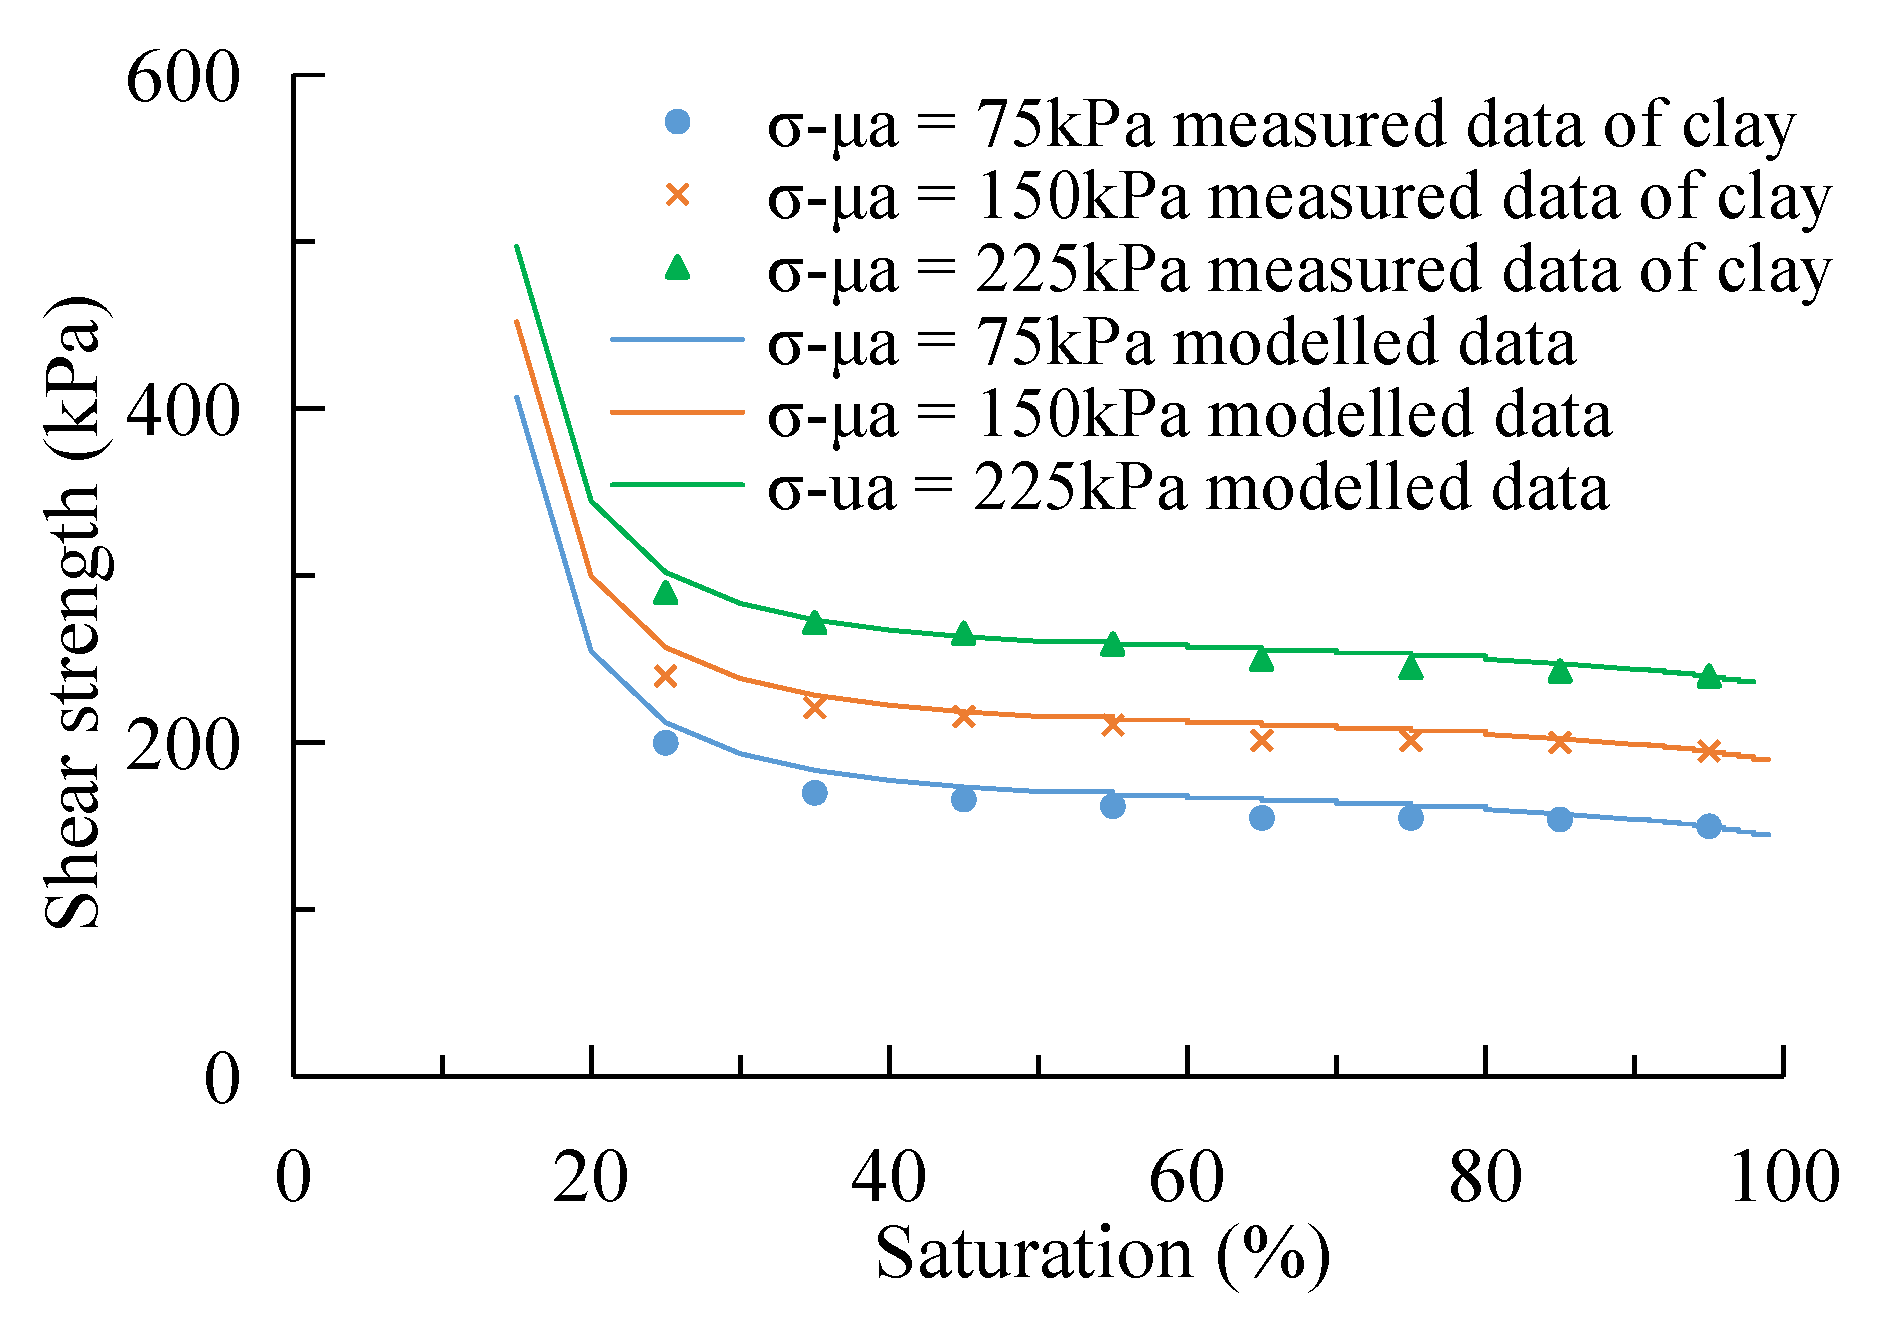
3.2. Shear Strength Test
4. Results and Discussion
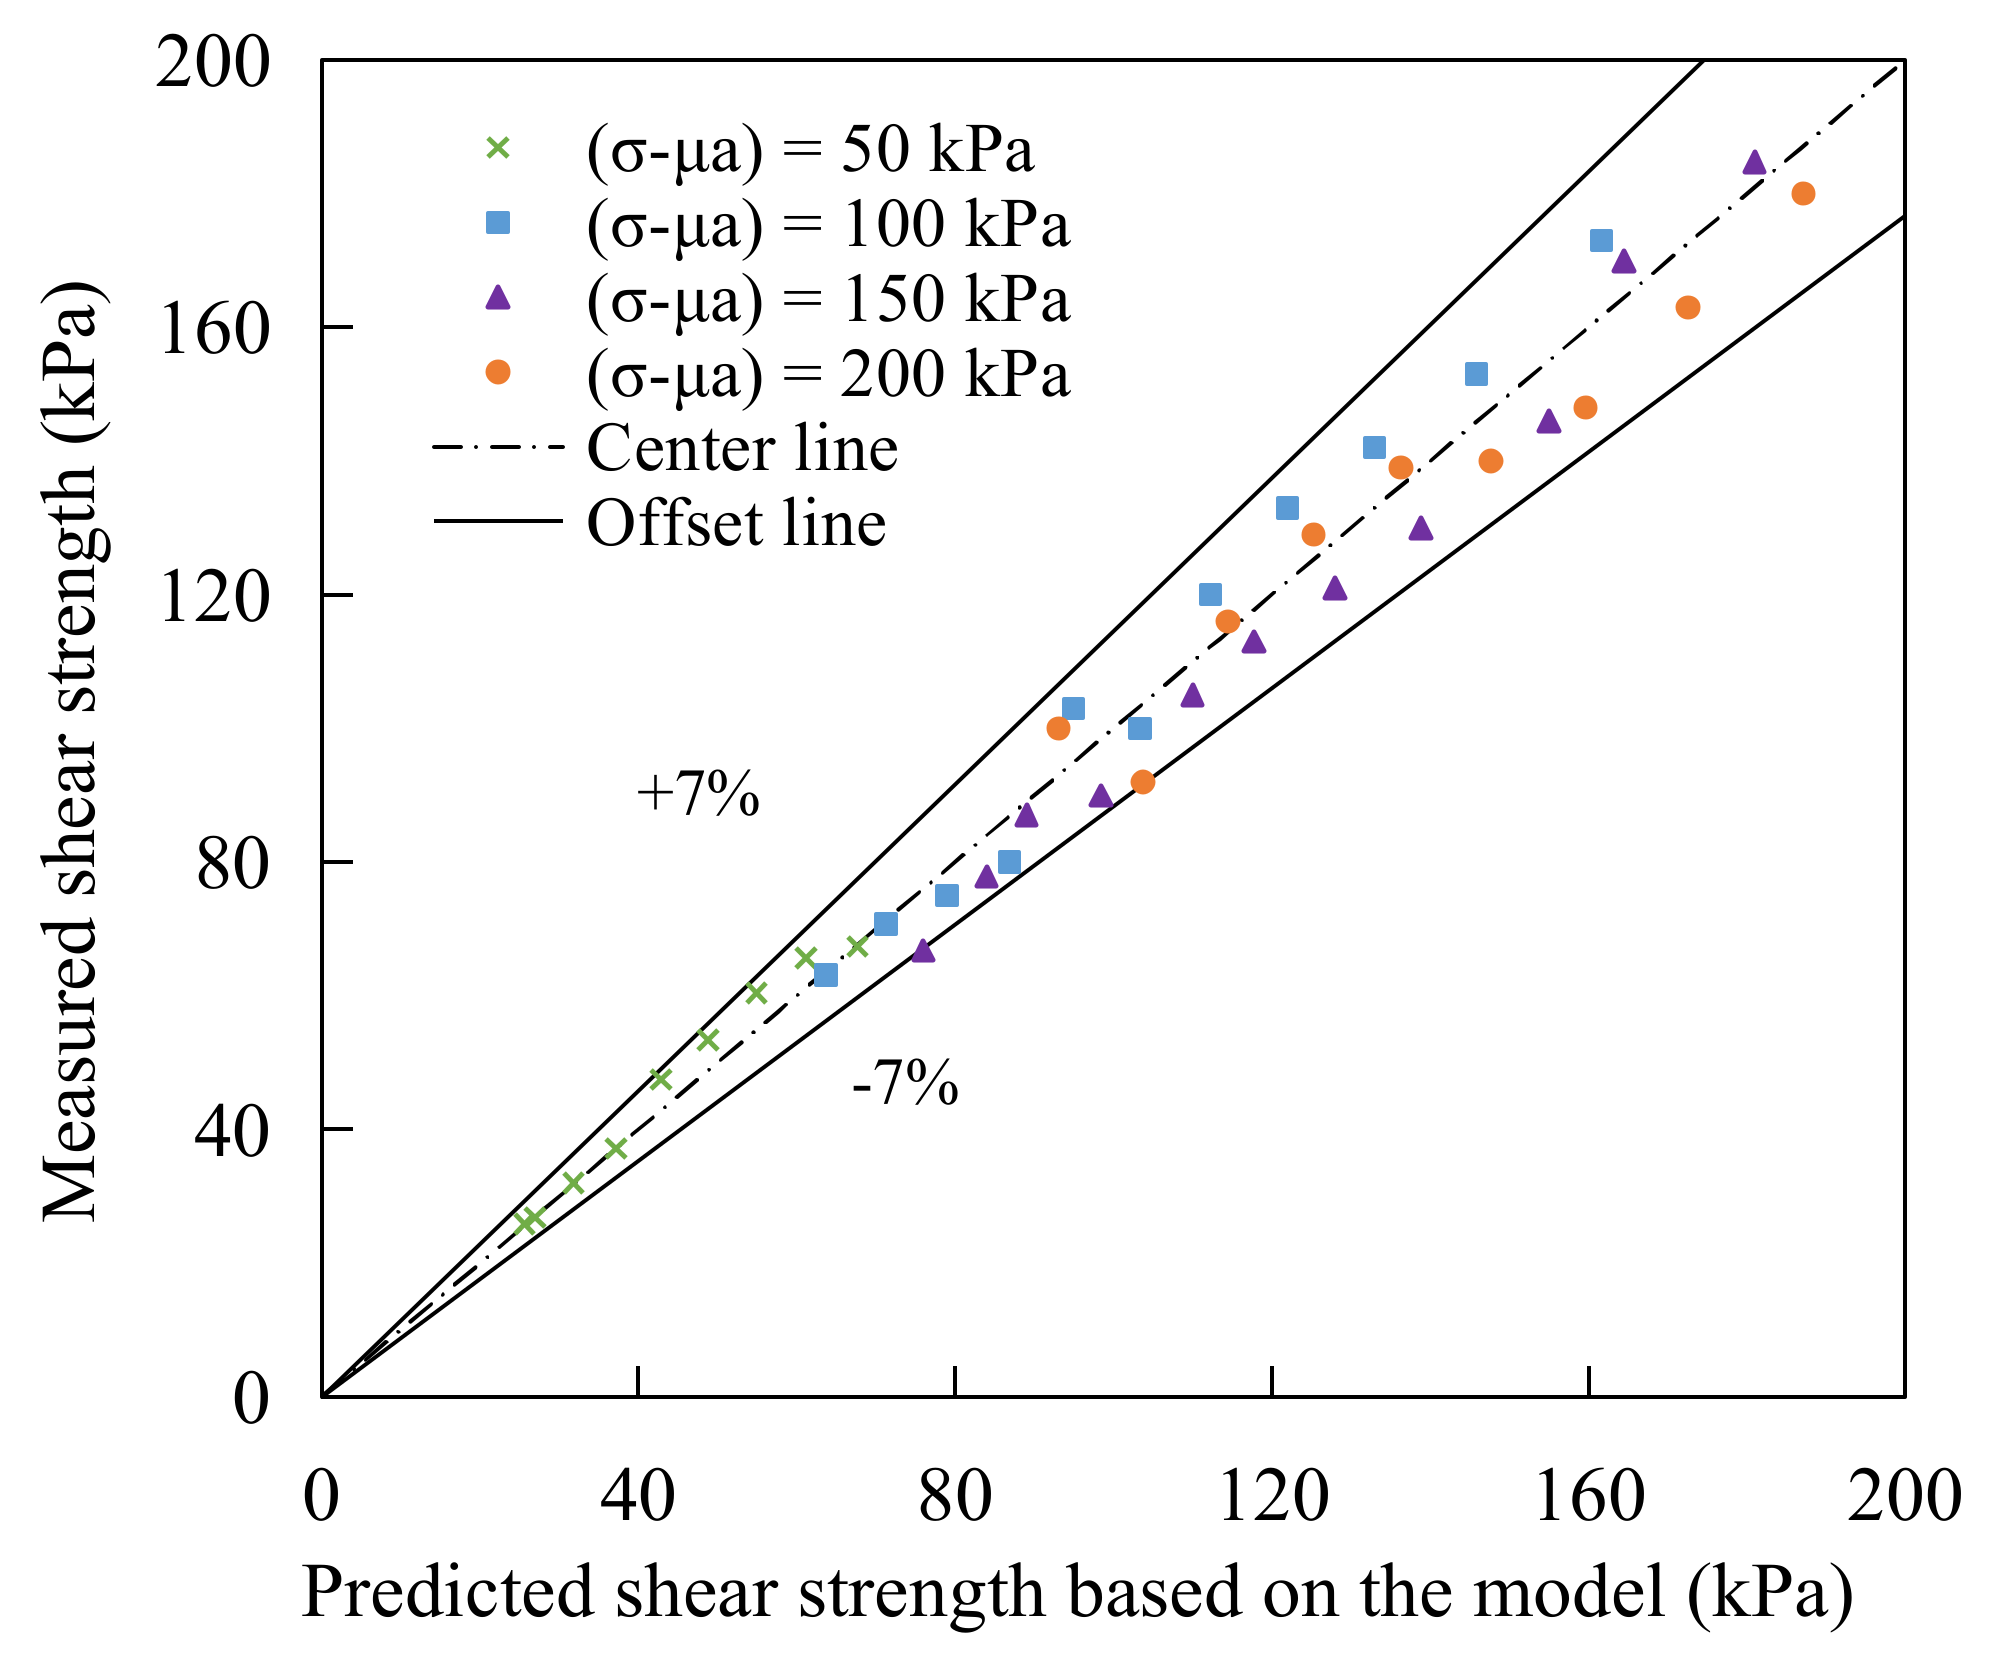
4.1. Comparison with Experimental Data
4.2. Comparison with Literature Data from Clayed-Silty Sand and Ankara Clay
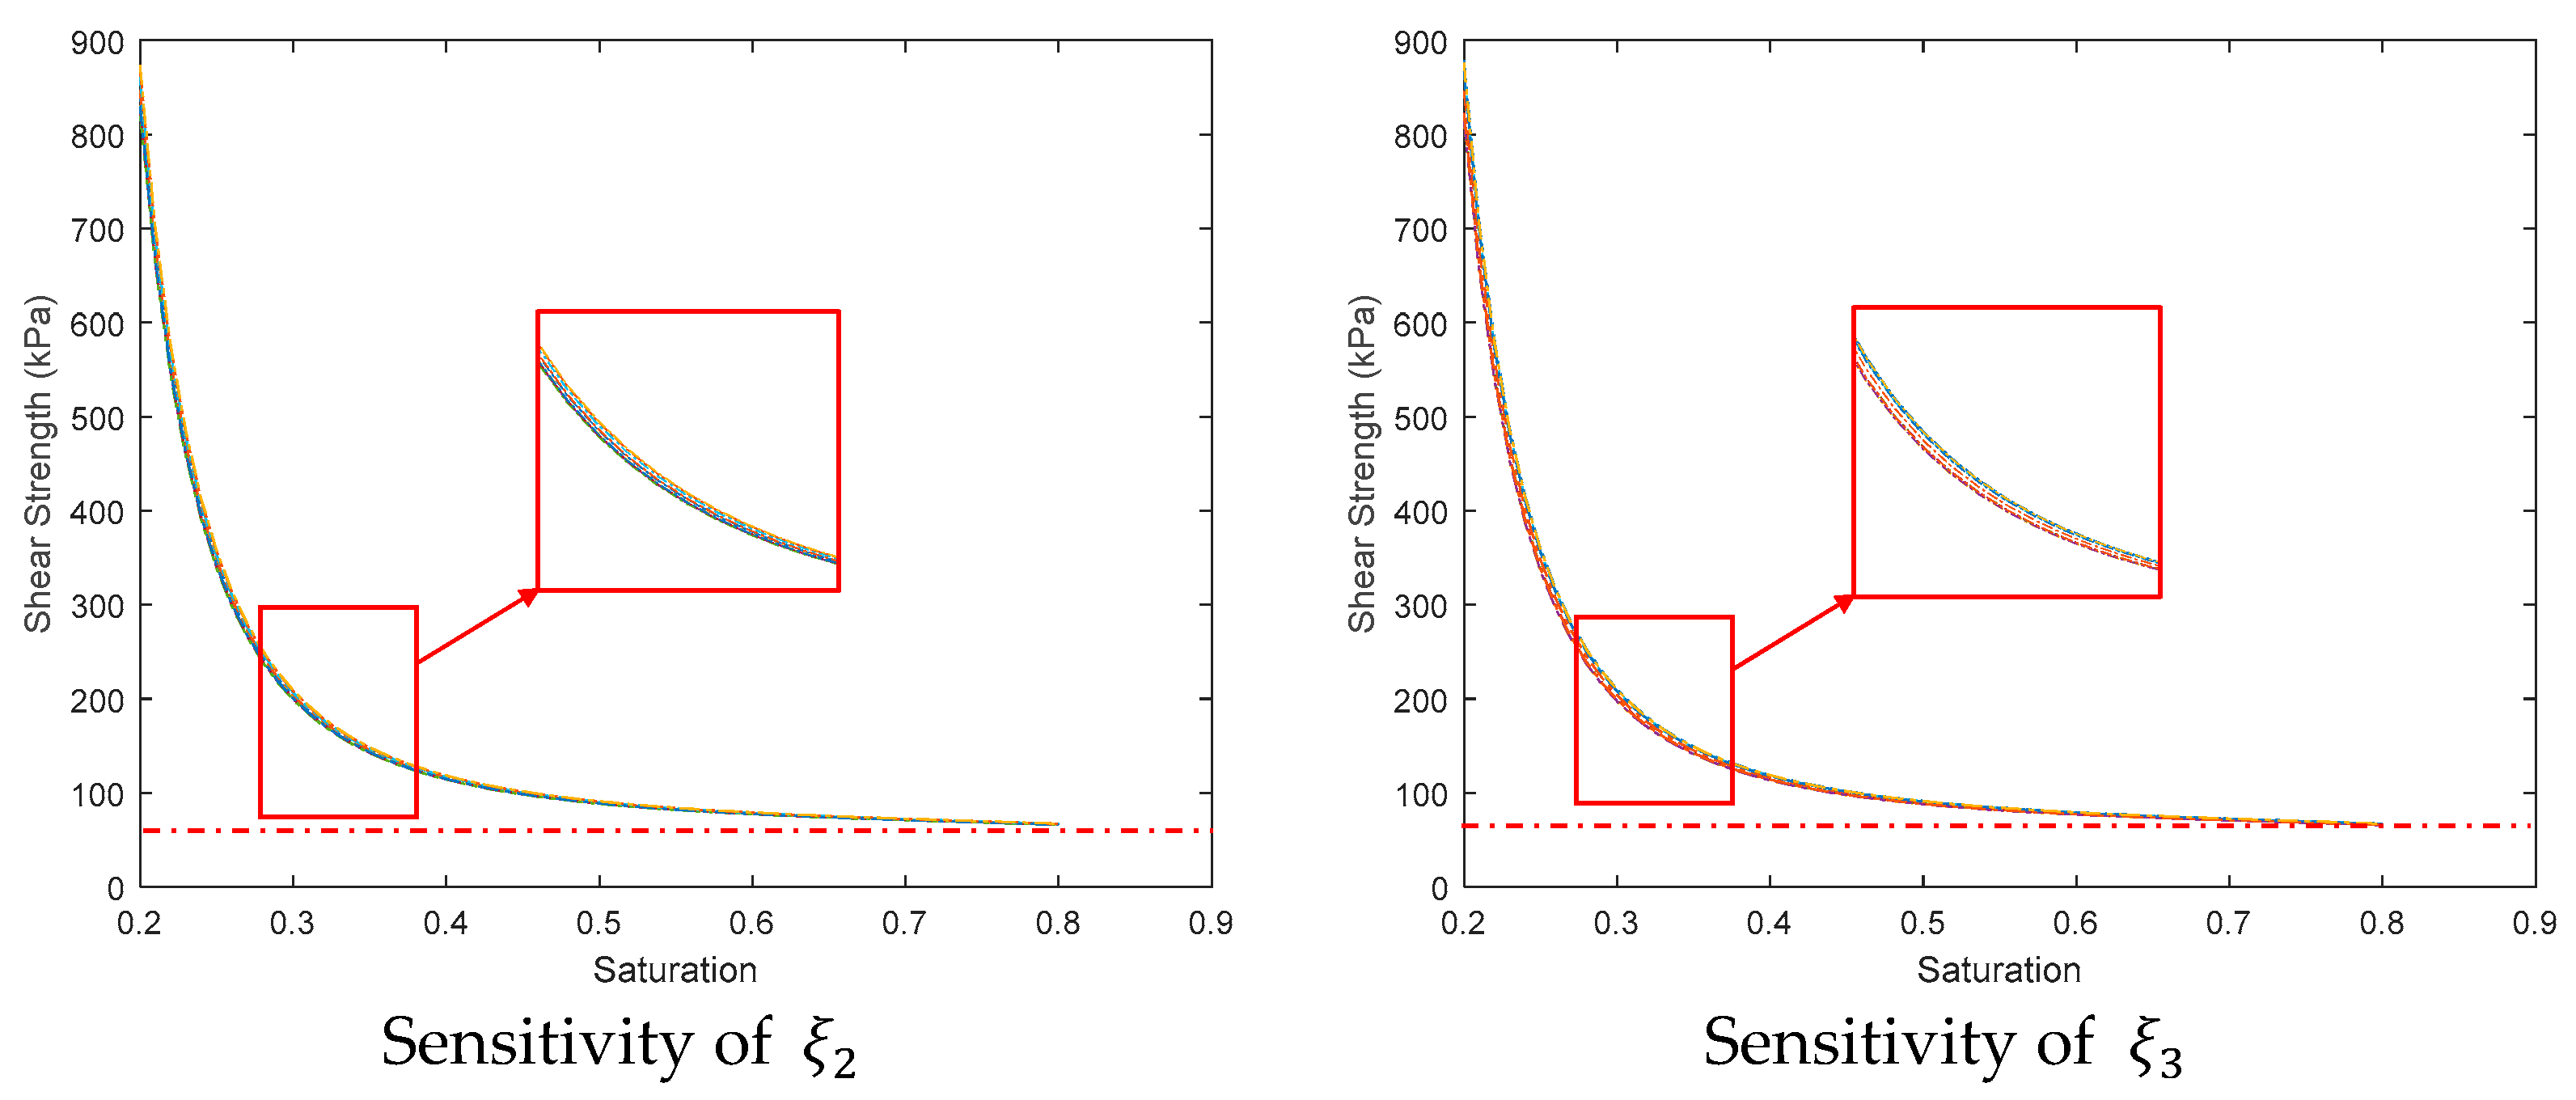
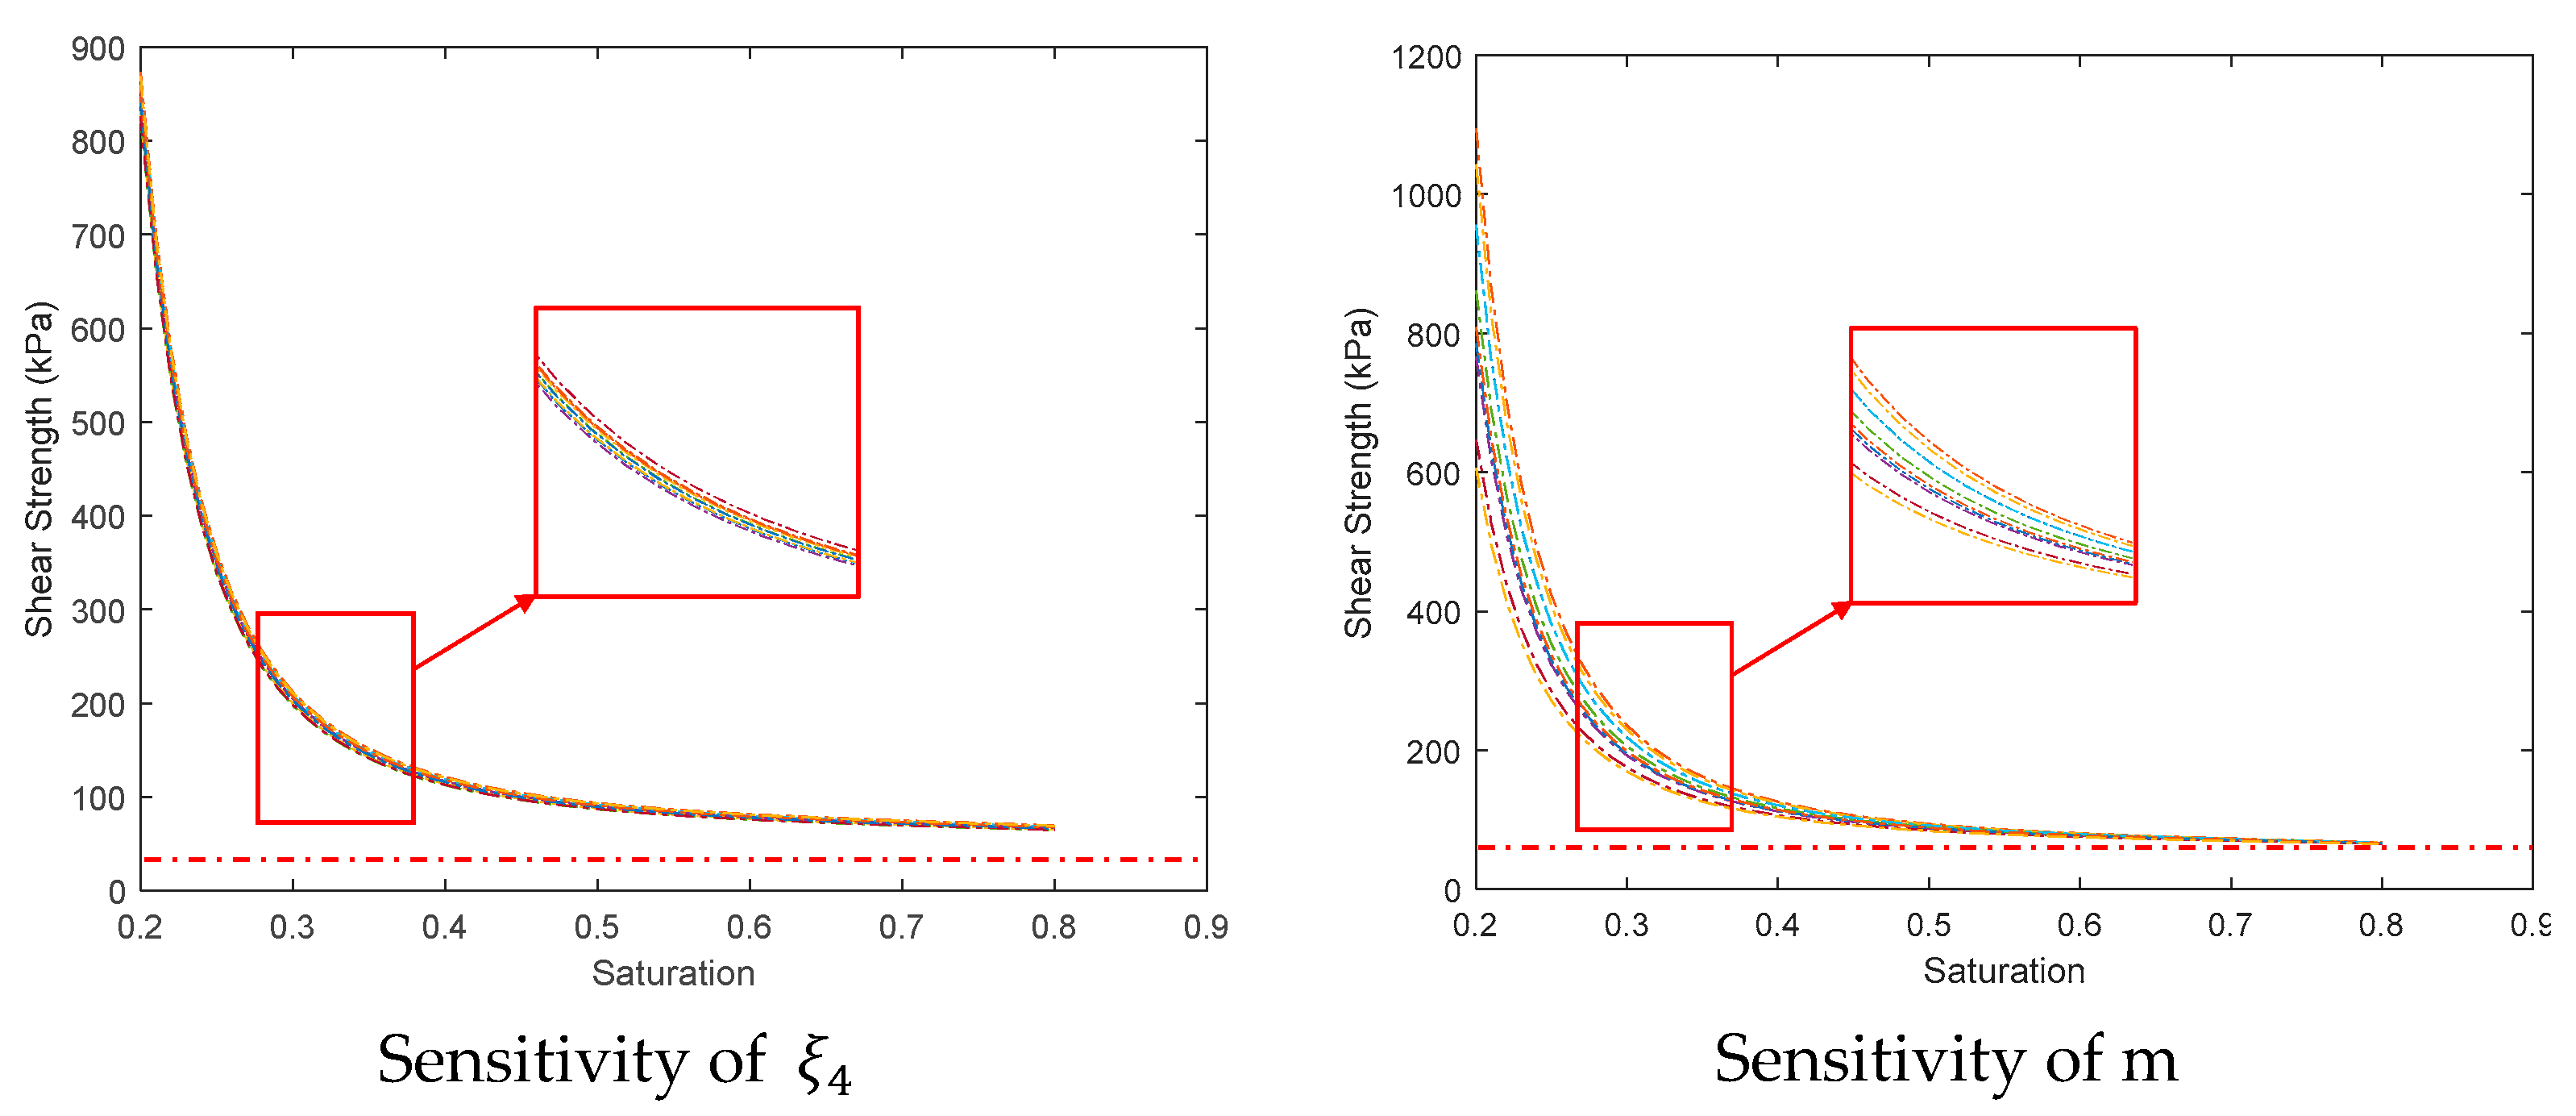
5. Sensitivity Analysis of Four Parameters
6. Conclusions
Author Contributions
Funding
Institutional Review Board Statement
Informed Consent Statement
Data Availability Statement
Conflicts of Interest
References
- Cho, S.E. Stability analysis of unsaturated soil slopes considering water-air flow caused by rainfall infiltration. Eng. Geol. 2016, 211, 184–197. [Google Scholar] [CrossRef]
- Hu, R.; Chen, Y.; Zhou, C. Modeling of coupled deformation, water flow and gas transport in soil slopes subjected to rain infiltration. Sci. China Technol. Sci. 2011, 54, 2561. [Google Scholar] [CrossRef]
- Xu, W.J.; Wang, Y.J.; Dong, X.Y. Influence of reservoir water level variations on slope stability and evaluation of landslide tsunami. Bull. Eng. Geol. Environ. 2021, 80, 4891–4907. [Google Scholar] [CrossRef]
- Liu, G.; Tong, F.; Tian, B. Influence of atmospheric temperature on shallow slope stability. Environ. Earth Sci. 2019, 78, 632. [Google Scholar] [CrossRef]
- Chen, G.; Meng, X.; Qiao, L. Response of a loess landslide to rainfall: Observations from a field artificial rainfall experiment in Bailong River Basin, China. Landslides 2018, 15, 895–911. [Google Scholar] [CrossRef]
- Hou, X.; Li, T.; Qi, S. Investigation of the cumulative influence of infiltration on the slope stability with a thick unsaturated zone. Bull. Eng. Geol. Environ. 2021, 80, 5467–5480. [Google Scholar] [CrossRef]
- Nguyen, T.S.; Likitlersuang, S. Reliability analysis of unsaturated soil slope stability under infiltration considering hydraulic and shear strength parameters. Bull. Eng. Geol. Environ. 2019, 78, 5727–5743. [Google Scholar] [CrossRef]
- Dou, H.Q.; Han, T.C.; Gong, X.N. Effects of the spatial variability of permeability on rainfall-induced landslides. Eng. Geol. 2015, 192, 92–100. [Google Scholar] [CrossRef]
- Li, B.; Tian, B.; Tong, F.G.; Liu, C. Effect of the Water-Air Coupling on the Stability of Rainfall-Induced Landslides Using a Coupled Infiltration and Hydromechanical Model. Geofluids 2022, 2022, 3036905. [Google Scholar] [CrossRef]
- Vanapalli, S.K.; Fredlund, D.G. Comparison of different procedures to predict unsaturated soil shear strength. In Advances in Unsaturated Geotechnics; Geotechnical Special Publication; American Society of Civil Engineers: Reston, VA, USA, 2000; pp. 195–209. [Google Scholar]
- Bishop, A.W. The principle of effective stress. Lecture delivered in Oslo. Tek. Ukebl. 1959, 39, 859–863. [Google Scholar]
- Bishop, A.W.; Alpan, I.; Blight, G.E.; Donald, I.B. Factors controlling the shear strength of partly saturated cohesive soils. In Proceedings of the 5th International Conference on Soil Mechanics Foundation Engineering, Paris, France, 17–22 July 1961. [Google Scholar]
- Bishop, A.W. The measurement of pore pressure in the triaxial test. Pore Pressure and Suction in Soils. In Proceedings of the Conference on Pore Pressure and Suction in Soils, London, UK, 30–31 March 1960. [Google Scholar]
- Fredlund, D.G.; Morgenstern, N.R.; Widger, R.A. The shear strength of unsaturated soils. Can. Geotech. J. 1978, 15, 313–321. [Google Scholar] [CrossRef]
- Fredlund, D.G.; Rahardjo, H. Soil Mechanics for Unsaturated Soils; John Wiley and Sons, Inc.: New York, NY, USA, 1993. [Google Scholar]
- Fredlund, D.G.; Xing, A.; Fredlund, M.D.; Barbour, S.L. Relationship of the unsaturated soil shear strength to the soil-water characteristic curve. Can. Geotech. J. 1996, 33, 440–448. [Google Scholar] [CrossRef]
- Abramento, C. Geotechnical parameters for the study of natural slopes instabiliza tion at ‘Serra do Mar’, Brazil. In Proceedings of the 12th International Conference on Soil Mechanics and Foundation Engineering, Rio De Janeiro, Brazil, 13–18 August 1989. [Google Scholar]
- Toll, D.G. A framework for unsaturated soils behavior. Géotechnique 1990, 40, 31–44. [Google Scholar] [CrossRef]
- Öberg, A.L.; Sällfors, G. Determination of Shear Strength Parameters of Unsaturated Silts and Sands Based on the Water Retention Curve. Geotech. Test. J. 1997, 20, 40–48. [Google Scholar] [CrossRef]
- Zhang, C.; Lu, N. Unified effective stress equation for soil. J. Eng. Mech. 2020, 146, 04019135. [Google Scholar] [CrossRef]
- Lu, N.; Godt, J.W.; Wu, D.T. A closed-form equation for effective stress in unsaturated soil. Water Resour. Res. 2020, 46, W05515. [Google Scholar] [CrossRef] [Green Version]
- Khalili, N.; Khabbaz, M.H. A unique relationship for χ for the determination of the shear strength of unsaturated soils. Géotechnique 1998, 48, 681–687. [Google Scholar] [CrossRef]
- Jiang, M.J.; Leroueil, S.; Konrad, J.M. Insight into shear strength functions of unsaturated granulates by DEM analyses. Comput. Geotech. 2004, 31, 473–489. [Google Scholar] [CrossRef]
- Tong, F.; Jing, L.; Bin, T. A Water Retention Curve Model for the Simulation of Coupled Thermo-Hydro-Mechanical Processes in Geological Porous Media. Transp. Porous Media 2012, 91, 509–530. [Google Scholar] [CrossRef]
- Abdulrahman, A.; Marwen, B.; Muzahim, A. Effect of long-term soaking and leaching on the behavior of lime-stabilized gypseous soil. Int. J. Pavement Eng. 2015, 16, 11–26. [Google Scholar] [CrossRef]
- Tomoyoshi, N.; Yasunari, H.; Fredlund, D.G.; Gan, J.K. Influence of stress history on the strength parameters of an unsaturated statically compacted soil. Can. Geotech. J. 1999, 36, 251–261. [Google Scholar] [CrossRef]
- Erdal, C.; Hüseyin, P.T. Shear strength-suction relationship of compacted Ankara clay. Appl. Clay Sci. 2010, 49, 400–404. [Google Scholar] [CrossRef]
- Brooks, R.J.; Corey, A.T. Hydraulic Properties of Porous Media. Ph.D. Thesis, Colorado State University, Fort Collins, CO, USA, 1965. [Google Scholar]
- Van Genuchten, M.T. A closed-form equation for predicting the hydraulic conductivity of unsaturated soils. Soil Sci. Soc. Am. 1980, 44, 898. [Google Scholar] [CrossRef] [Green Version]
- Bisong, E. Logistic Regression. In Building Machine Learning and Deep Learning Models on Google Cloud Platform; Apress: Berkeley, CA, USA, 2019. [Google Scholar] [CrossRef]
- Kim, D.N.; Chen, I.M.; Teck, C.N. Planning algorithms for s-curve trajectories. In Proceedings of the IEEE/ASME International Conference on Advanced Intelligent Mechatronics, Zurich, Switzerland, 4–7 September 2007. [Google Scholar]
- Liu, C.; Li, B.; Tong, F. Determination of soil-water retention curve from a transient air-water two-phase outflow experiment. Bull. Eng. Geol. Environ. 2020, 79, 2109–2118. [Google Scholar] [CrossRef]


| Specific Gravity (Gs) | ω (%) | Particle Composition (%) | ||||
|---|---|---|---|---|---|---|
| 0.05–2 (mm) | 0.002–0.05 (mm) | <0.002 (mm) | ||||
| 2.70 | 32.5 | 1.45 | 1.74 | 87.8 | 10.6 | 1.6 |
| 40,009.57 | −4.21 | 20,295.99 | 0.24 | |
| 40,017.51 | −4.51 | 11,675.79 | 0.21 | |
| 64,735.01 | −5.01 | 9886.80 | 0.20 |
| Clayed-silty sand (e = 1.31) | 2.63 | −1.42 | 6.52 | 0.82 |
| Clayed-silty sand (e = 1.08) | 89.07 | −1.79 | 551.05 | 0.58 |
| Ankara clay | 52.59 | −3.42 | 160.82 | 0.38 |
Disclaimer/Publisher’s Note: The statements, opinions and data contained in all publications are solely those of the individual author(s) and contributor(s) and not of MDPI and/or the editor(s). MDPI and/or the editor(s) disclaim responsibility for any injury to people or property resulting from any ideas, methods, instructions or products referred to in the content. |
© 2023 by the authors. Licensee MDPI, Basel, Switzerland. This article is an open access article distributed under the terms and conditions of the Creative Commons Attribution (CC BY) license (https://creativecommons.org/licenses/by/4.0/).
Share and Cite
Tian, W.; Peiffer, H.; Malengier, B.; Liu, G.; Cheng, L. Modified Equation of Shear Strength with Respect to Saturation. Appl. Sci. 2023, 13, 4305. https://doi.org/10.3390/app13074305
Tian W, Peiffer H, Malengier B, Liu G, Cheng L. Modified Equation of Shear Strength with Respect to Saturation. Applied Sciences. 2023; 13(7):4305. https://doi.org/10.3390/app13074305
Chicago/Turabian StyleTian, Wenjing, Herman Peiffer, Benny Malengier, Gang Liu, and Liangliang Cheng. 2023. "Modified Equation of Shear Strength with Respect to Saturation" Applied Sciences 13, no. 7: 4305. https://doi.org/10.3390/app13074305