1. Introduction
Historical maps were important tools that allowed people to imagine and understand other places when they had limited access to information about the world beyond their local communities. They were used for navigation, trade, and military planning and represented the known world at the time of their creation. Today, they are valuable historical artefacts that provide insight into the way people thought about the world in the past and help us understand our place in it.
In this paper, we examine how modern technologies such as 3D modelling and virtual reality (VR) can improve our understanding of ancient maps and their relevance to cultural heritage (CH) communication and promotion. We focus on the city of San Cristóbal de La Laguna, which was recognized by UNESCO [
1] as a world heritage site at the end of the last century due in part to its unique urban plan. This plan served as a model for the cities established by Spanish conquerors in the American colonies and was the first model of a non-fortified colonial city. The design of the city was based on the ideals of classical design and the new humanism of the Renaissance.
The oldest map of San Cristóbal de La Laguna was created by the engineer Leonardo Torriani in the late 16th century [
2]. Torriani was also responsible for the city plans of other locations in the Canary Islands, including Santa Cruz de Tenerife, Garachico, Las Palmas de Gran Canaria, Santa Cruz de La Palma, Betancuria, Teguise, and Telde. By examining this historical map and using modern technologies to create 3D models and virtual reality experiences, we can gain a better understanding of the city’s development and significance in history. This can enhance our appreciation of its CH and aid in its promotion and conservation.
This study exemplifies an increasing dedication to preserving and restoring CH while promoting its management, analysis, and dissemination. Over time, various processes and events, such as human actions, urban pressures, or natural disasters, can irreversibly deteriorate CH. Therefore, it is essential to maintain a permanent record of objects and places that contributes to their long-term preservation [
3]. The research, conservation, and restoration of cultural heritage artefacts and sites are complex endeavours that are usually approached from a multidisciplinary perspective, involving architects, archaeologists, art historians, artists, sociocultural managers, computer scientists, and engineers, among others.
The use of 3D digital models offers an effective solution to the ongoing need for documenting and conserving CH components. With the advancements in data capture methods and 3D representation, these models are widely used to facilitate the analysis of various factors related to CH. These factors may include population demographics, natural disasters, climate change, the effects of war, or urban evolution [
4]. In addition, 3D models have demonstrated their usefulness in creating interactive and immersive content that users can explore and manipulate. As a result, 3D models are an invaluable tool for communicating and promoting CH [
5,
6].
Geographical information has been widely used to analyse urban areas from historical periods, especially for periods not too far removed from the present. This method involves topographic surveys and aerial images, which allows the creation of 3D models that can be used to study urban transformations [
7]. These models are created by integrating information from various sources, including historical maps, photographs, drawings, and written descriptions of tangible heritage elements, along with 3D data. If visual information is lacking, textual descriptions from historians and archaeologists are often used to supplement it, as noted by [
8].
Currently, there are two main techniques for generating 3D models of cities: data-based and procedural generation techniques, which can also be combined. In data-based techniques, information is collected using sensors such as satellite or aerial images, LIDAR, or laser scans. Algorithms are then used to transform this information into polygons [
9,
10,
11]. Procedural generation techniques, on the other hand, start with a simple collection of elements that are replicated and combined using information about the overall structure of the object, which guides the process of model generation [
12,
13,
14].
Several studies have been conducted on the creation of 3D models of historical cities. For example, the Roma Reborn project generated various versions of a virtual ancient Rome in 320 AD. The Roma Reborn 2.0 project utilized the manual creation of detailed monument models by teams of computer graphics experts and archaeologists, while the urban environment comprising 7000 buildings was generated procedurally. The process involved starting from polyhedral volumes obtained by scanning a scale model of the city [
15]. Similarly, a 3D model of the city of Prague was generated using an algorithm of point segmentation applied to an existing scale model [
16]. Another case involves the reconstruction of French cities, Toul, Aire-Sur-la-Lys, and Saint-Omer, using images of city models from the collection of fortified cities in France made between the 17th and 19th centuries (plans-reliefs). Buildings were identified and reconstructed based on a parametric definition, with automated identification of building types, roof plans, chimneys, textures, and parameter values. A 4D model of the city of Hamburg utilized data sources from a wooden model from 1644 and one of the first official plans of the city from 1859. The reconstruction process involved the automated generation of building plans, followed by the facade, roofs and building components. The typology of gabled roofs and buildings with four basic faces was assumed for the automation of the reconstruction [
17]. Additionally, a recreation of the city of Nafplio in the 19th century was developed for an educational application. The authors addressed the challenge of modelling buildings that no longer exist today from graphic documents such as photographs, drawings, and paintings, as well as buildings that have undergone interventions after the recreated period [
18].
The European Union has recognized the importance of this research area and funded several projects that promote the creation of digital content that primarily reconstructs archaeological spaces, historical places, or objects that are difficult to access or no longer exist [
18].
This work focuses on the 3D reconstruction of the city of San Cristóbal de La Laguna based on a map created by Leonardo Torriani. While there have been previous 3D reconstructions related to cultural heritage in the city (a convent [
19] and a house [
20]), our project is the first historical 3D reconstruction of an entire city in the Canary Islands.
We complemented Torriani’s map with other historical sources to form a visual description of the city in 1588 that can be extended to the rest of the cartography of that time in the Canary Islands as well as other cities. We present our workflow, the difficulties encountered, and the solutions provided. Our approach is different from other map-based reconstruction workflows [
21], as it deals with maps from a time when topographical techniques were not yet developed.
The main contributions of our work are:
A 3D reconstruction of the UNESCO world heritage city of San Cristóbal de La Laguna in the 16th century.
A workflow for the 3D reconstruction process where the unique source of visual information is a map, and several modelling techniques have to be integrated.
A decomposition of the houses in the map in terms of basic constructive elements and a generative model of the houses in the city in terms of these elements.
A house placement method using the block shapes of the city.
The rest of the work is structured as follows: in
Section 2, the methodology used to build the 3D reconstruction is presented, including a detailed discussion of all its steps. In
Section 3, the results of the reconstruction of the city and its surroundings are shown, while in
Section 4, a discussion of the work is given and some future works are presented. Finally, in
Section 5, we outline the conclusions of this work.
2. Materials and Methods
As mentioned in the previous section, one of the objectives of this project was to create a 3D virtual reconstruction of the city of San Cristóbal de La Laguna, based on the oldest known map of the city by the Italian engineer Leonardo Torriani, who stayed in the city for several months in 1588. The map and the city description were used as a starting point for the reconstruction process, which involved resolving many difficulties. None of the buildings from Torriani’s time remains unchanged, so it was necessary to supplement the map with all available information about the city at that time, including parcelling methods, construction techniques, the different types of houses and their location in the city, the distribution of social strata in the city, and the importance of each street in the urban layout. Additionally, the singular buildings of the city only appear as ground outlines on the map, and there are no reliable descriptions of their appearance at that time, so they had to be recreated using indirect documentary sources. This section is divided into several parts. First, we show the full workflow of the reconstruction process, and then in the following parts, we detail its main steps: documentation, 2D and 3D modelling, and the procedural generation of the city.
2.1. Workflow of the Reconstruction Process
As indicated previously, one of the goals of this project was to generate a general work methodology that can be applied to other maps from that time. This section will describe the main parts of this methodology divided into documentation, 2D and 3D processing and modelling, procedural generation, and visualization. The relationships between all the preceding elements are illustrated in
Figure 1.
As shown in
Figure 1, the starting point of this project was the digitized map and all relevant historical information related to the city at that time. The map was vectorized to generate a set of polygonal and point 2D layers for blocks, streets, and other features. The vectorization of houses provided a geometric description of their main elements. Using the georeferencing process, these layers were transformed into 2D geographical coordinates. The assignment of the 3D height component began with a digital elevation model of the area, which was adjusted with the georeferenced 2D layers to generate the 3D model of the terrain at the time of the map’s production. All of this information was then used as input for the procedural city generation task, which generated the full 3D model of the city. Finally, this city model and the 3D characters of its inhabitants served as the basis for the rendering process that generated the visualization of the city. We will detail each of these elements in the following sections.
To carry out all the tasks in the workflow in
Figure 1 we used the set of software programs that are detailed in
Table 1.
2.2. Documentation
In designing the virtual reconstruction, the first step was to focus on the remains of the city that still exist from that time. This is the most important constraint to ensure that the reconstruction is as accurate as possible. However, since remains are scarce and the visual documentation of the city is limited to Torriani’s map, other sources have been used to describe it. These sources can be direct (providing a description of the city) or indirect (providing clues to the reconstruction by examining loosely related information).
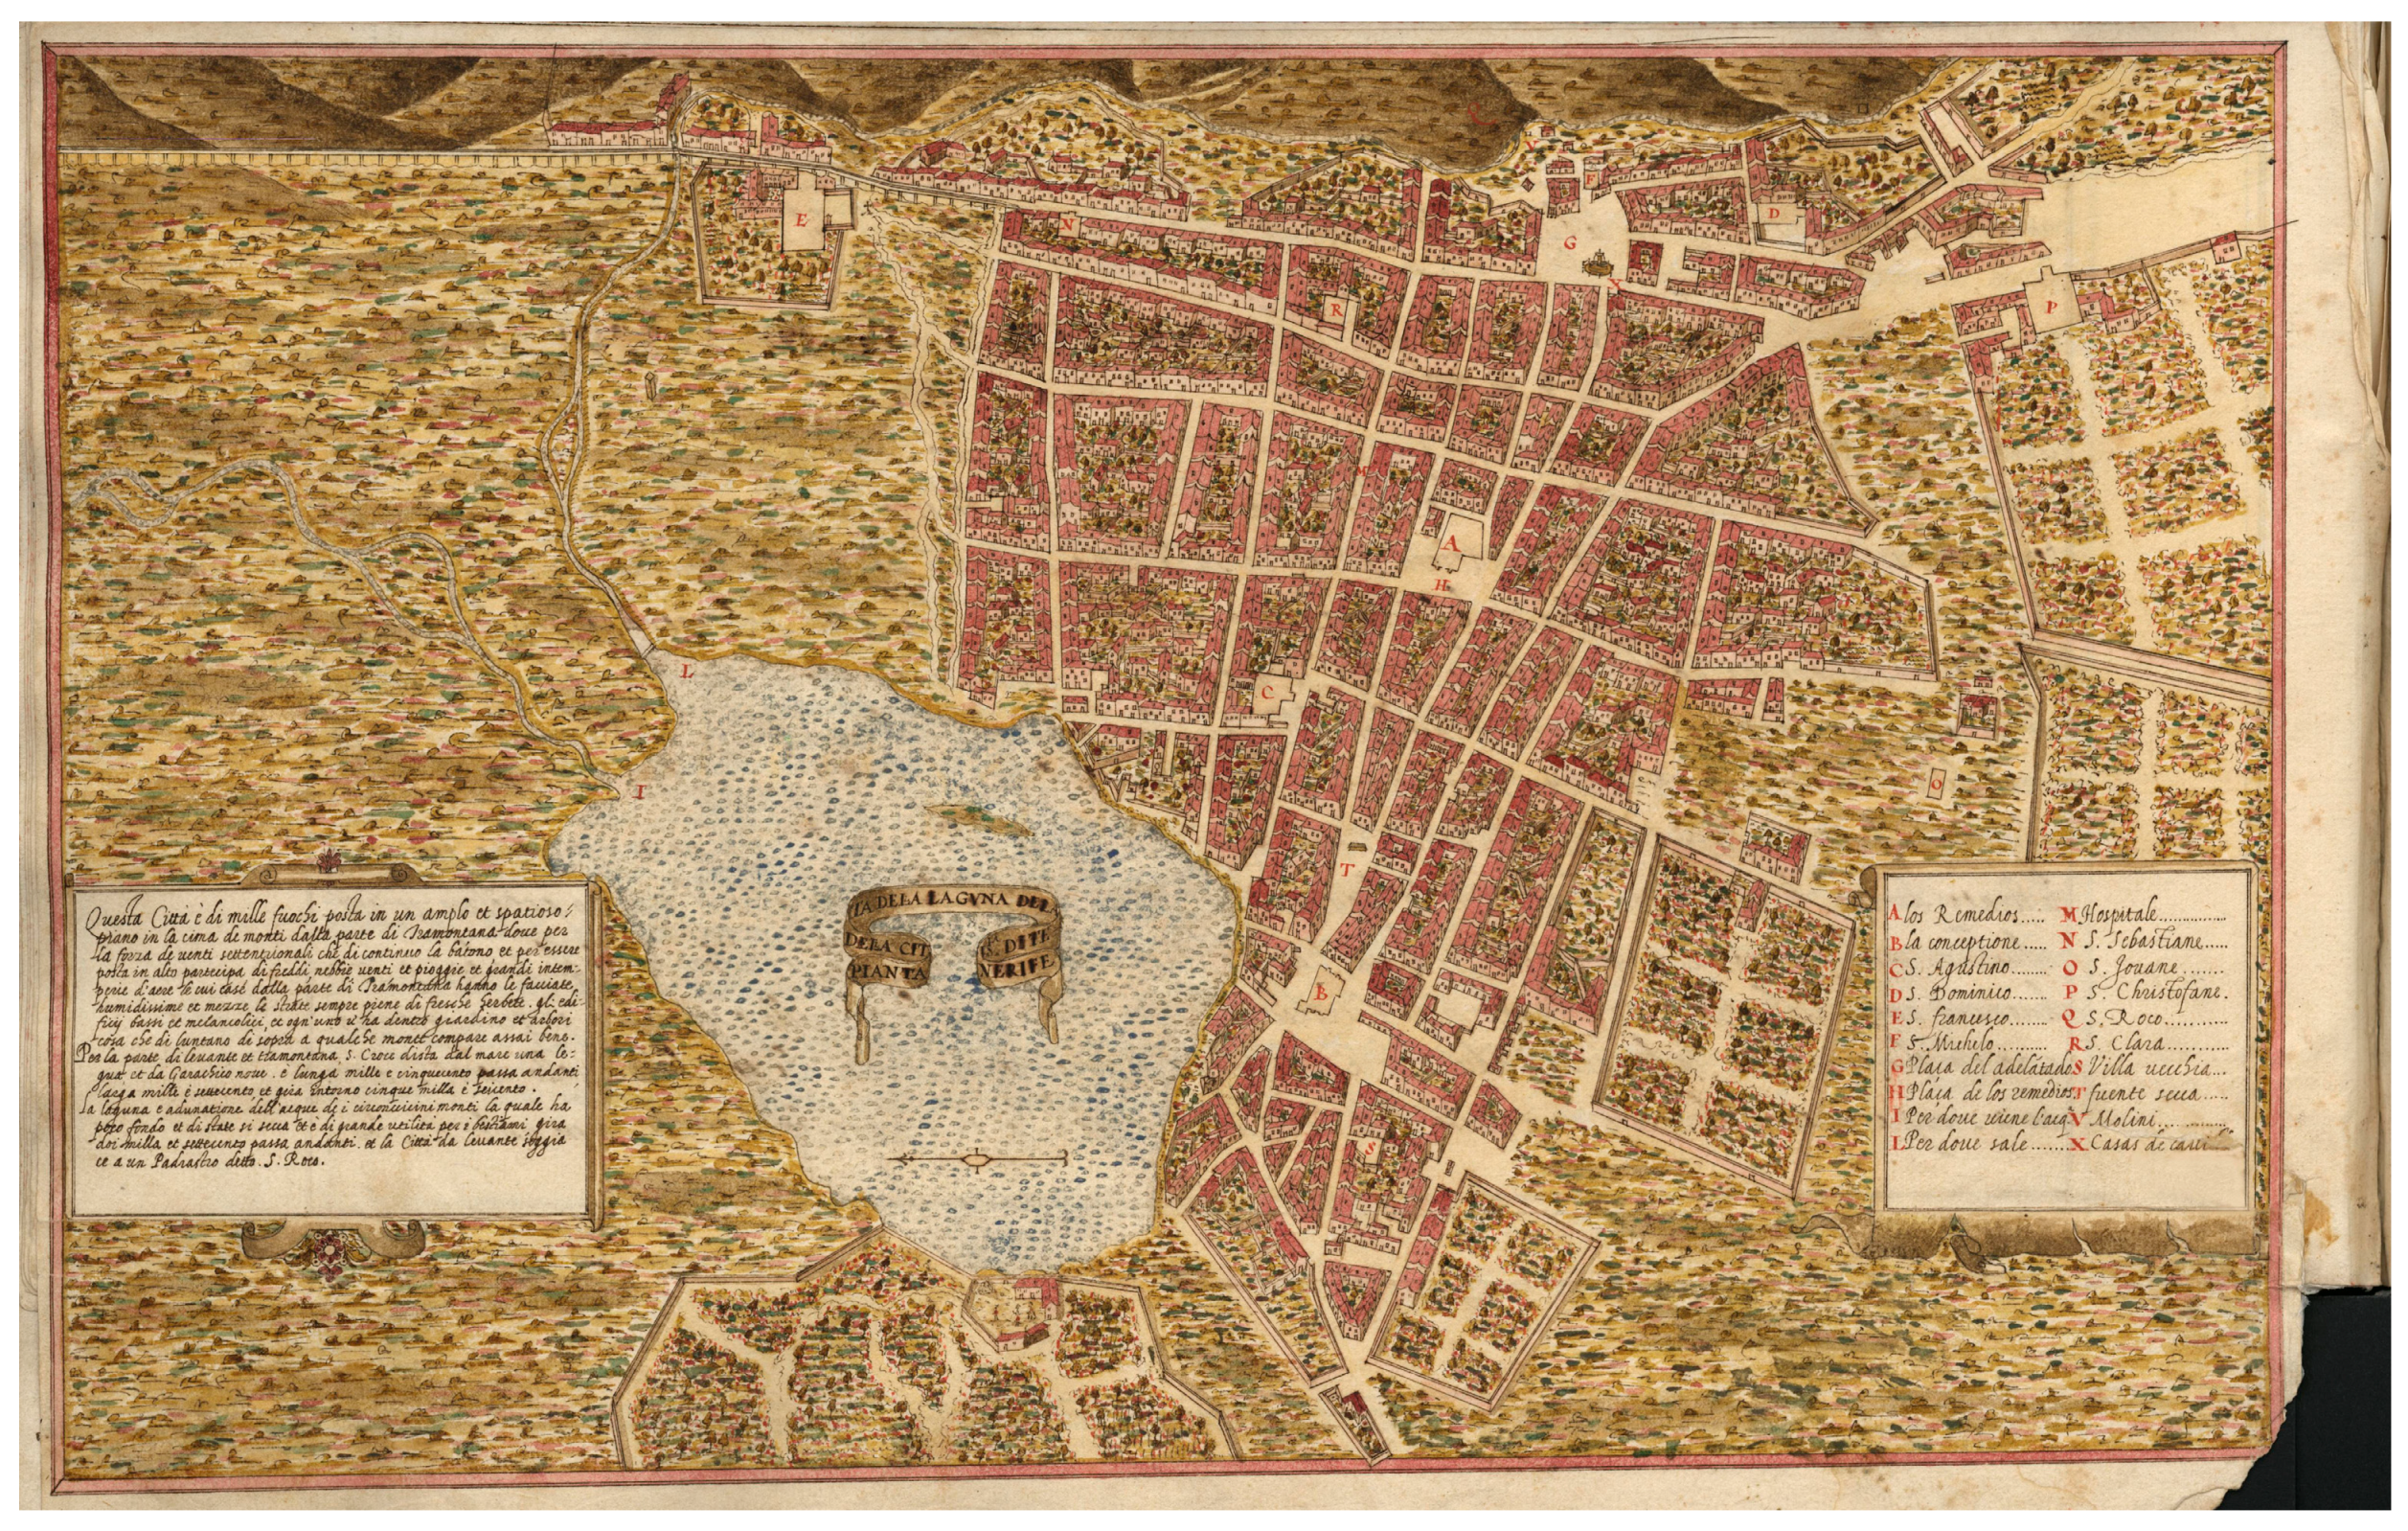
2.2.1. The Map of San Cristobal de La Laguna by Leonardo Torriani in 1588
The 3D reconstruction of the city is based on the oldest map of the city, dated 1588, and created by the Italian engineer Leonardo Torriani (Cremona, 1559–Lisbon, 1628) [
2].
The engineer uses an aerial view which is utilized to highlight the urban area, the meadow, and the lagoon that make up the territory where the city is located (
Figure 2).
The map is not limited to presenting the regular urban layout of the city but also highlights important features such as squares, buildings associated with power (such as singular buildings), and everyday elements, such as fountains, mills, water troughs, and the water supply system. The map also emphasizes the representation of vegetable gardens and plots, including their surrounding walls, annexed small buildings, and vegetation. The singular buildings are integrated into the urban layout through their ground shape, while objects such as fountains are depicted through conventional imagery and houses are shown in perspective. Additional information about the elements shown on the map can be found in
Table 2, which is indicated in the legend on the right side of the map.
We proceed now to detail the complementary information that was obtained to guide the reconstruction as shown in the workflow in
Figure 1.
2.2.2. General Descriptions of the City and Its Surroundings
The city of San Cristóbal de La Laguna was established in 1496 by Alonso Fernández de Lugo, the “Adelantado” (royal commissioner) and conqueror of Tenerife. The city is located on a plain meadow that is partially surrounded by hills, which act as natural defensive walls. The presence of forests and a lagoon, as well as its strategic location on the island, were key factors in selecting the city’s placement. The city is described by Torriani [
2] as the largest and most inhabited in the Canary Islands, with over a thousand houses, each with a large yard filled with orange trees and other beautiful plants. The lagoon is described as shallow, disappearing during the dry season, and useful for cattle grazing. The city was surrounded by a mix of pastures and cultivated areas, as depicted in Torriani’s map. Other descriptions of the city at that time can be found in [
22]. The inhabitants of the city were also described by Torriani and included those related to justice and government, as well as wealthy gentlemen and merchants from Spain, France, Flanders, England, and Portugal, along with local inhabitants. Direct sources describing the city at that time are limited, so indirect sources were used to obtain visual cues. These included a physical model of the city located at the entrance of the convent of Santo Domingo (see
Figure 3), the remaining maps of the Canary Islands by Torriani [
2], other maps from that time in the
Civitates Orbis Terrarum [
23,
24] and the Teixeira map of Madrid of 1656 [
25]. Drawings and archival photos were also used as indirect sources, even though they were made or taken much later than the 16th century.
2.2.3. Descriptions of City Elements
We will now present complementary information related to the main elements that made up the city: buildings and streets.
The search for information on buildings in the Canary Islands presents significant challenges, as few remaining structures have remained unchanged since their construction. Archaeological investigations have also yielded limited relevant information. Therefore, the analysis of houses has been carried out primarily through written documentation.
The Adelantado and many of the settlers came from Andalusia (southern Spain) to the Canary Islands and attempted to replicate the typological and constructive models of their places of origin [
26]. However, the difficulties at the time imposed a process of simplification, resulting in the removal of many formal or artistic elements, leaving only technical or structural features.
To estimate the dimensions of the buildings, various documentary sources were studied, including the distribution of properties after the conquest of Tenerife, the study of the evolution of lots due to purchases or sales, and the historical catalogue of the city of San Cristóbal de La Laguna. The chronologically closest source was the catalogue, which estimated the base of houses at 12.9 × 7.6 m, with a floor height of 3.6 m, and a roof angle of 26.9 degrees. The houses were usually developed around a single “crujía” (corridor) with a longitudinal axis parallel to the street. The interior layout was simple, and a large vegetable garden was common [
27]. The kitchen was usually a separate construction [
26], attached to or separated from the house and located on the side most protected from the wind.
The main building system for facades was masonry [
26], which involved superimposing unworked stones forming rows of varying width and height. Two types of masonry were present on the island: ordinary masonry which used mortar or cement to join the stones and dry masonry which did not. Lime was also used in wall coating, either alone or with the addition of clay and pigments. While the colour of the houses is not directly mentioned, in his book [
2] Torriani describes the city of Santa Cruz de la Palma as having “white houses”, which can serve as an indirect reference. Windows were scarce, with their presence being more common on the upper floors with shutters used to close them. Roofs were inclined and generally gabled, covered with tile [
26].
Distinct compositions of facades, doors, windows, and roofing allowed for the identification of five architecturally-functional types developed by civil architecture in San Cristóbal de La Laguna since the conquest period: terrera (single-story house), granero (the house-barn), sobradada (multi-story house), comercial (commercial house), and armera (armoury house) [
28] (see
Figure 4 from [
29]). These types were differentiated based on the city’s economic activities.
The main features of the five typologies are the following [
28]:
Terrera: a type of house that has only one floor. Its features varied depending on the economic status of the owner. It is generally located in the oldest part of the city, in the back streets of the main streets and on the periphery of the city.
Granero: a house generally with two floors, with the upper floor intended for the storage of cereal to protect it from moisture.
Sobradada: usually intended for the residence of the landowner who rents it out and occasionally performs some other activity.
Comercial: a two-story house with a mezzanine that facilitates access to the public visiting the house for commercial reasons.
Armera: a house located on the main streets as a sign of the importance of its inhabitants. Some examples have stonework on the facade that frames doors and windows.
These houses were placed on streets that were either made of dirt or paved. By examining documents from that period [
30], it is possible to determine the distribution of both types.
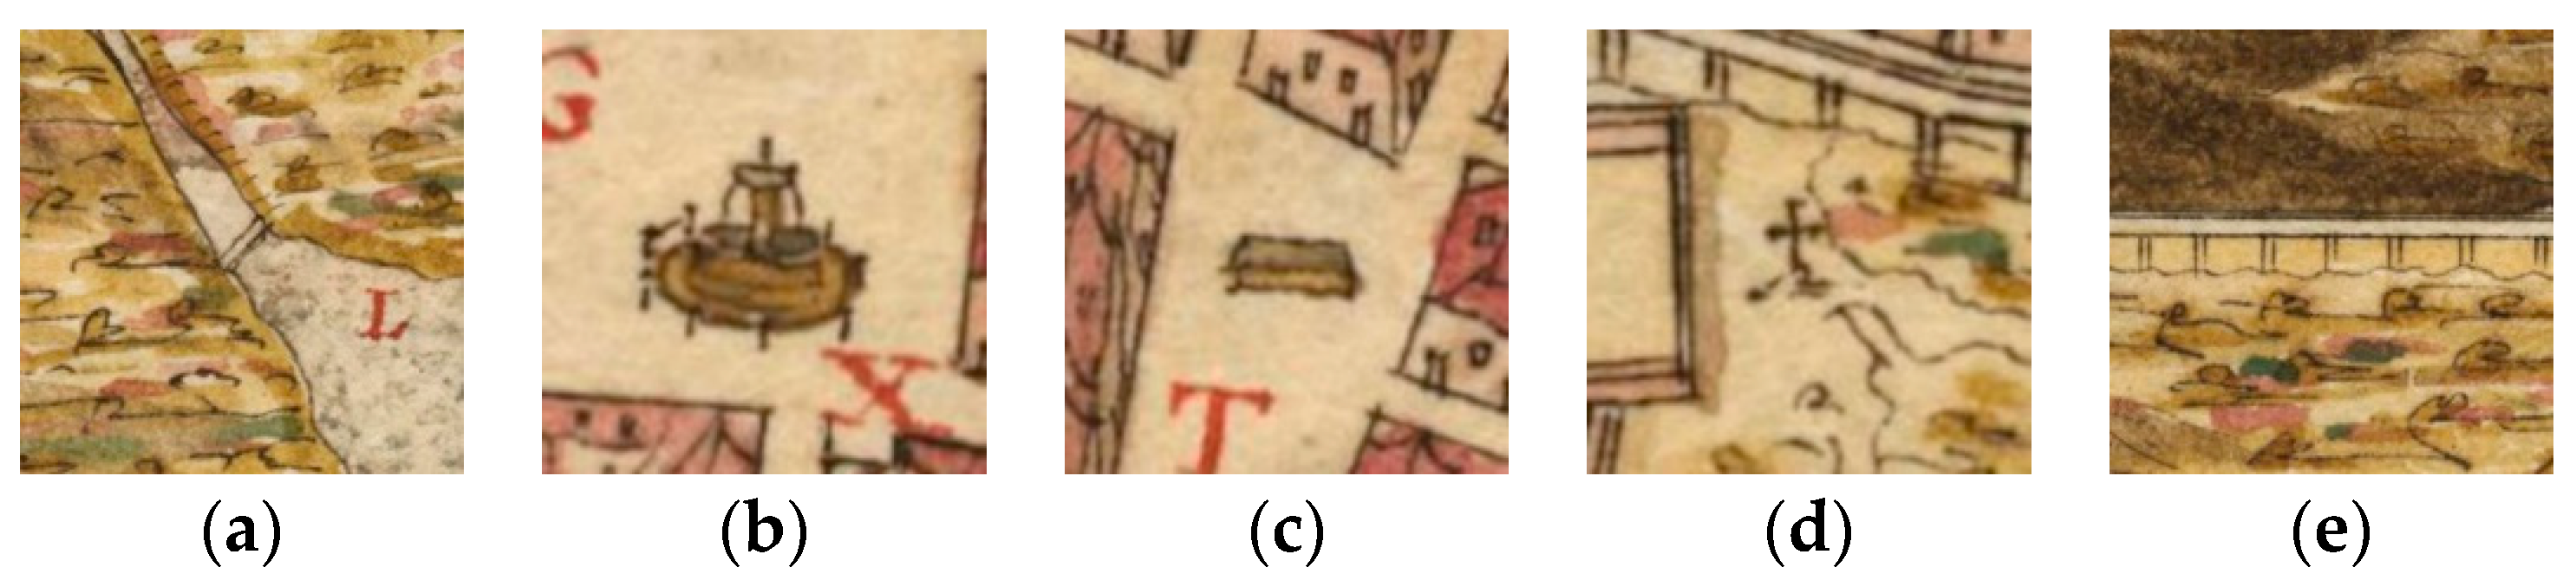
2.2.4. Descriptions of Other Map Elements
Other elements in Torriani’s map have been included in the 3D reconstruction: bridges, fountains, troughs, religious crosses, or a water conduit that spans several kilometres as seen in
Figure 2 and
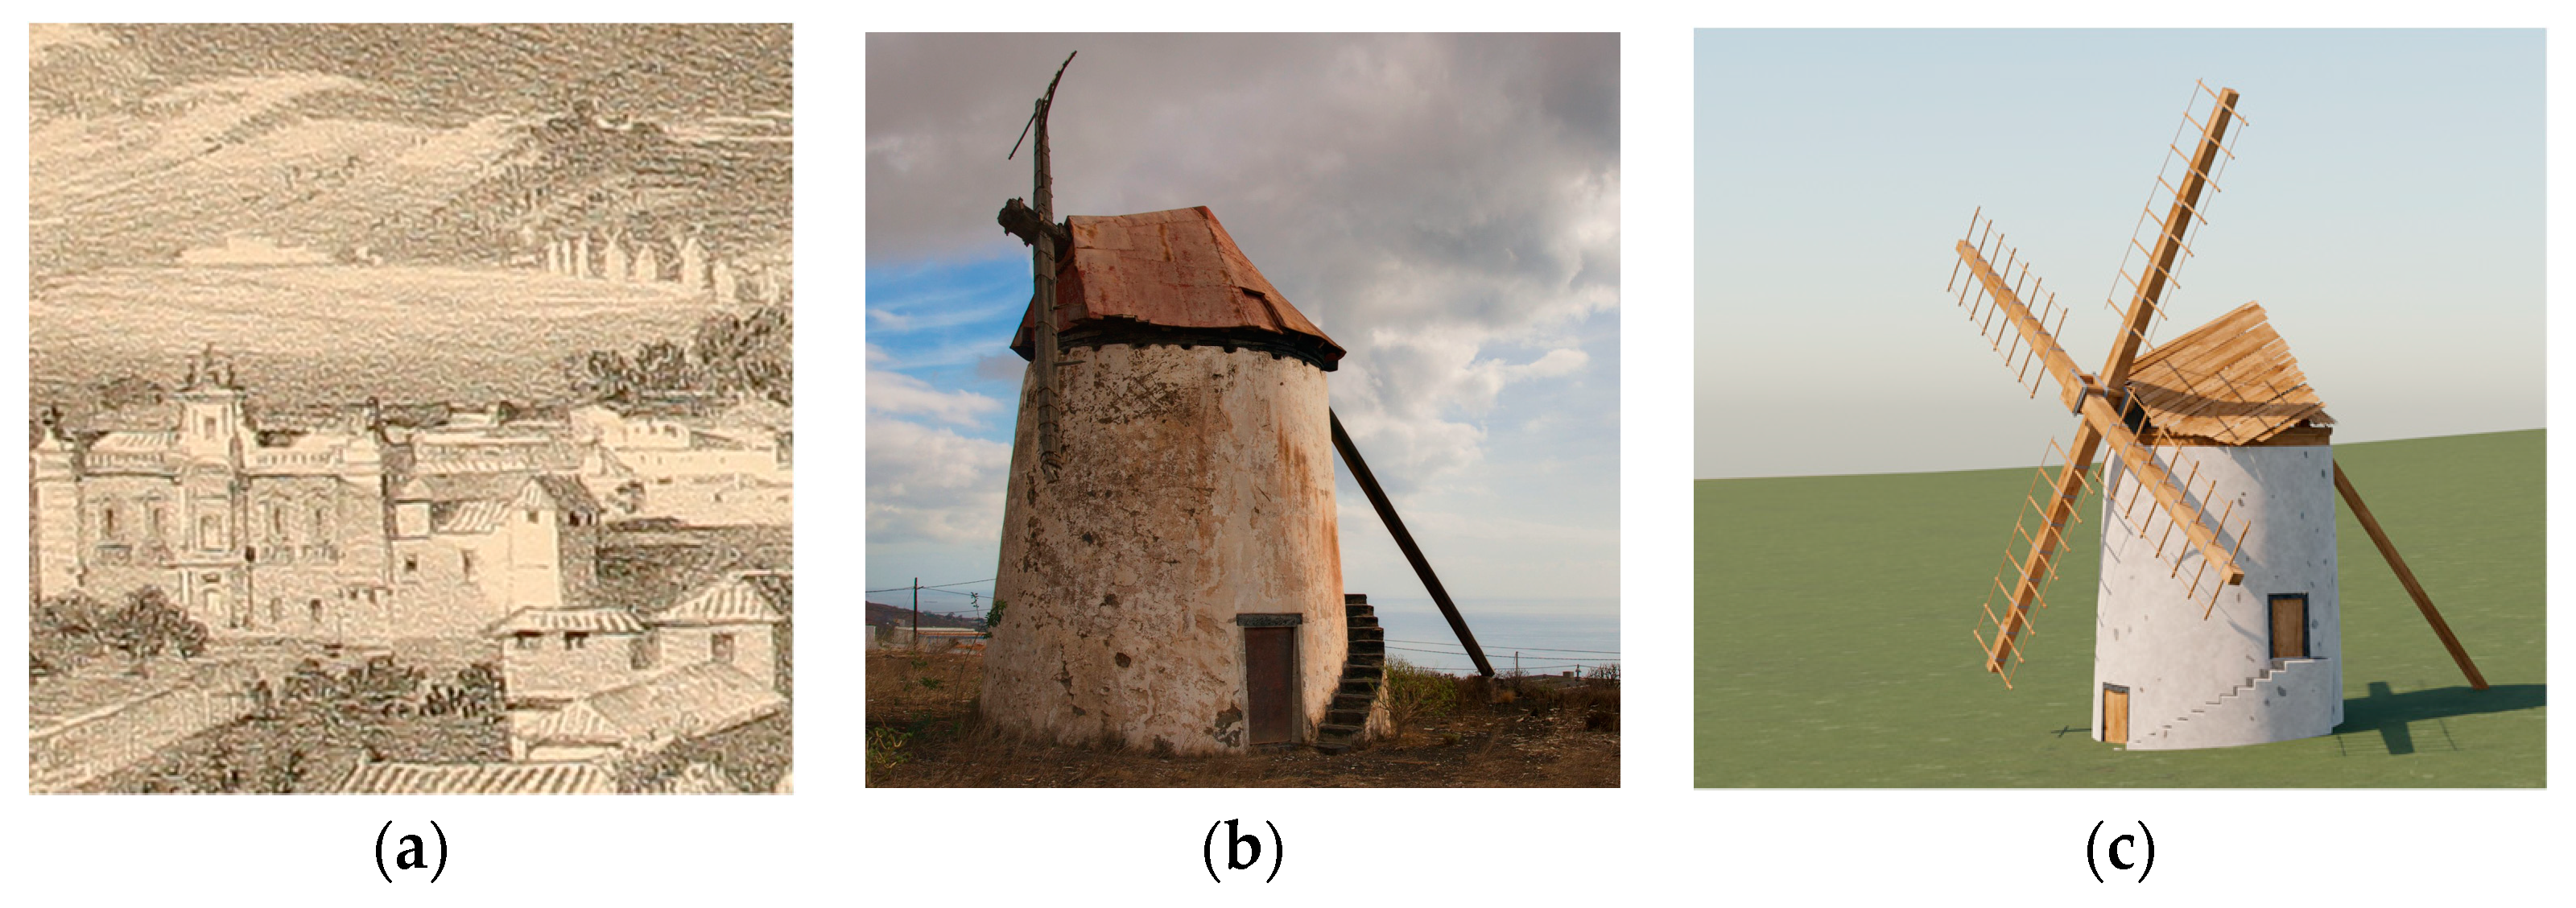
Figure 5. Their reconstruction has been based on the map drawings and pictures made at that time. It is also known that there were some windmills outside the city in those years [
31]. They have also been modelled using some indirect references to their look at that time.
2.2.5. Distribution of Social Strata in the City
To reproduce the spatial distribution of the different types of houses in
Section 2.2.3, we need to study the distribution of social strata in the city. Like many cities at that time, its layout did not present a homogeneous landscape, but rather a stratified and hierarchical order. The city was divided into three main zones: the central, elitist, and governmental area, the intermediate urban zone, and the periphery or suburbs.
The central zone was made up of three main streets: Real, Carrera, and del Agua, which were surrounded by the residences of knights, noble landowners, clergy, merchants, and traders. However, other working-class and artisanal professionals also lived in this zone, particularly in secondary streets such as Herradores, Caza, and Oficios.
The intermediate urban zone was less rigid and consisted of second-order wealthy families, middle-class artisans, merchants, and liberal professionals. Finally, the periphery and its neighbourhoods were the natural areas for the working and artisan classes.
The typologies of the urban houses, their structure, the size of plots, the height of buildings, and the quality of construction materials varied according to the social and professional division of the city. In the central zone, the dominant types of houses were armera, comercial, or sobradada. Moving away from the centre, there was a greater abundance of granero houses, while on the periphery, the most common type of house was the humble single-story terrera house.
2.2.6. Description of the Singular Buildings
We will designate as singular buildings the elements in
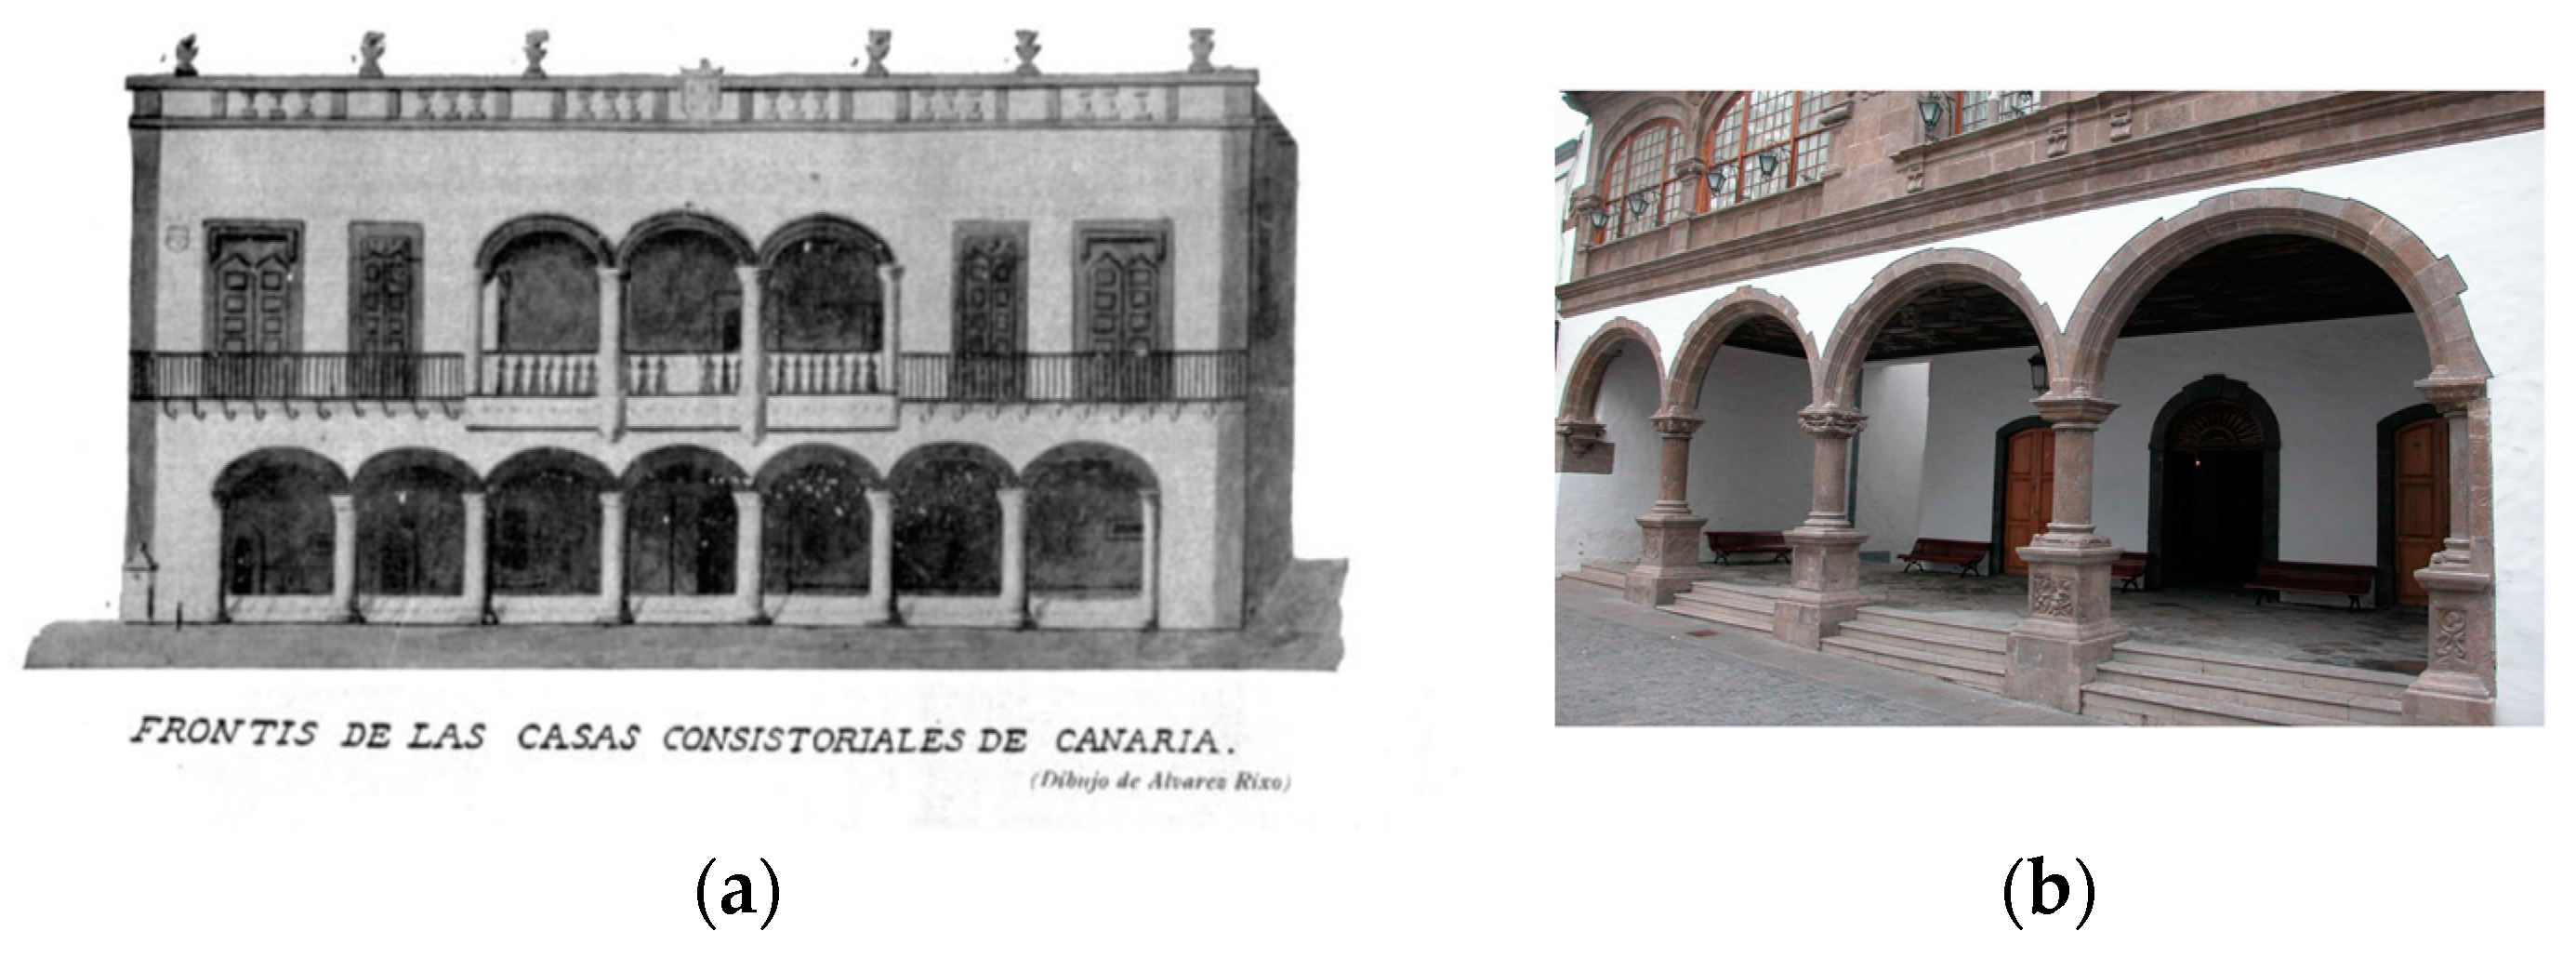
Table 2 related to public or civil constructions. In addition, other constructions will be added to this list as will be shown later. One of the main difficulties in the 3D reconstruction of the city is related to the fact that Torriani’s map only shows the ground outline of those buildings so their form must be hypothesized from indirect sources. The base plan of the singular buildings drawn by Torriani suggests some architectural elements and modules (naves, towers, chapels, buttresses, in the form of rounded or square projections), but little more. The buildings that Torriani contemplated in 1588, present, as a rule, marked differences in the plan, elevation, and roofs in comparison to their current state. This is the result of a long series of modifications that were completed over the subsequent centuries, with successive extensions and partial or total remodelling and demolitions that in some cases have made the pre-existing construction disappear completely.
For the reasons stated, the reconstruction of the singular buildings should be considered as an approximation, adjusted to the documentary, graphic, and bibliographic information available given the current state of historical research [
26]. The reconstruction method has also considered, in the absence of other sources of information, architectural analogies with other contemporary buildings, Canarian or American, or those represented by Torriani himself in other cities of the Canary Islands, which served as an aid in the design of architectural elements [
32,
33,
34].
2.2.7. Digital Elevation Model around the City
To obtain the global 3D coordinate of each element in the city, we need to use a digital elevation model (DEM) that takes into account the terrain elevation. However, in our case, the true elevation of the terrain is not available as it has undergone significant changes over the centuries, such as the desiccation of the lagoon in 1839 and the construction of city elements over some small ravines. Therefore, we have used an up-to-date elevation model with a resolution of 1 m and covering an area of approximately 3.7 × 4.6 km. This model was obtained from CityEngine and has been processed to reflect the terrain situation in 1588, as we will explain later.
Furthermore, the city’s location on the island allows the observation of elements such as the Teide volcano, which is more than 50 kilometres away. As a result, we have also used a second DEM for the rest of the island that surrounds the first DEM, as we will demonstrate later.
2.2.8. Description of the City Inhabitants
The socio-economic status of the city inhabitants was discussed in
Section 2.2.5; we will now document their appearance through their clothing. There are no direct sources to study the look of the city inhabitants since there are no examples of complete garments, but only some loose pieces or reconstructions in museums. The main reference regarding clothing used in Spain at that time can be found in [
35]. That work discusses the various types of clothing worn by different social strata and occupations around that time, accompanied by illustrations from the artwork of that period. It also includes scale reconstructions of garment patterns based on information from tailor’s books, which can be used in dress-modelling software. The clothing covered in the book includes that worn by males, females, and children, as well as clothing specific to religious orders, the military, and men of science and literature. In many cases, the clothing worn by different groups consisted of similar pieces with differences in fabric quality and ornamentation. For other details of the clothing, pictorial works of that time were consulted.
2.3. 2D Modelling
In this section, we will describe the 2D modelling part of the workflow, including 2D layers and positional information for city blocks, vegetable gardens, singular buildings, and other city elements.
2.3.1. Extraction of 2D Map Information
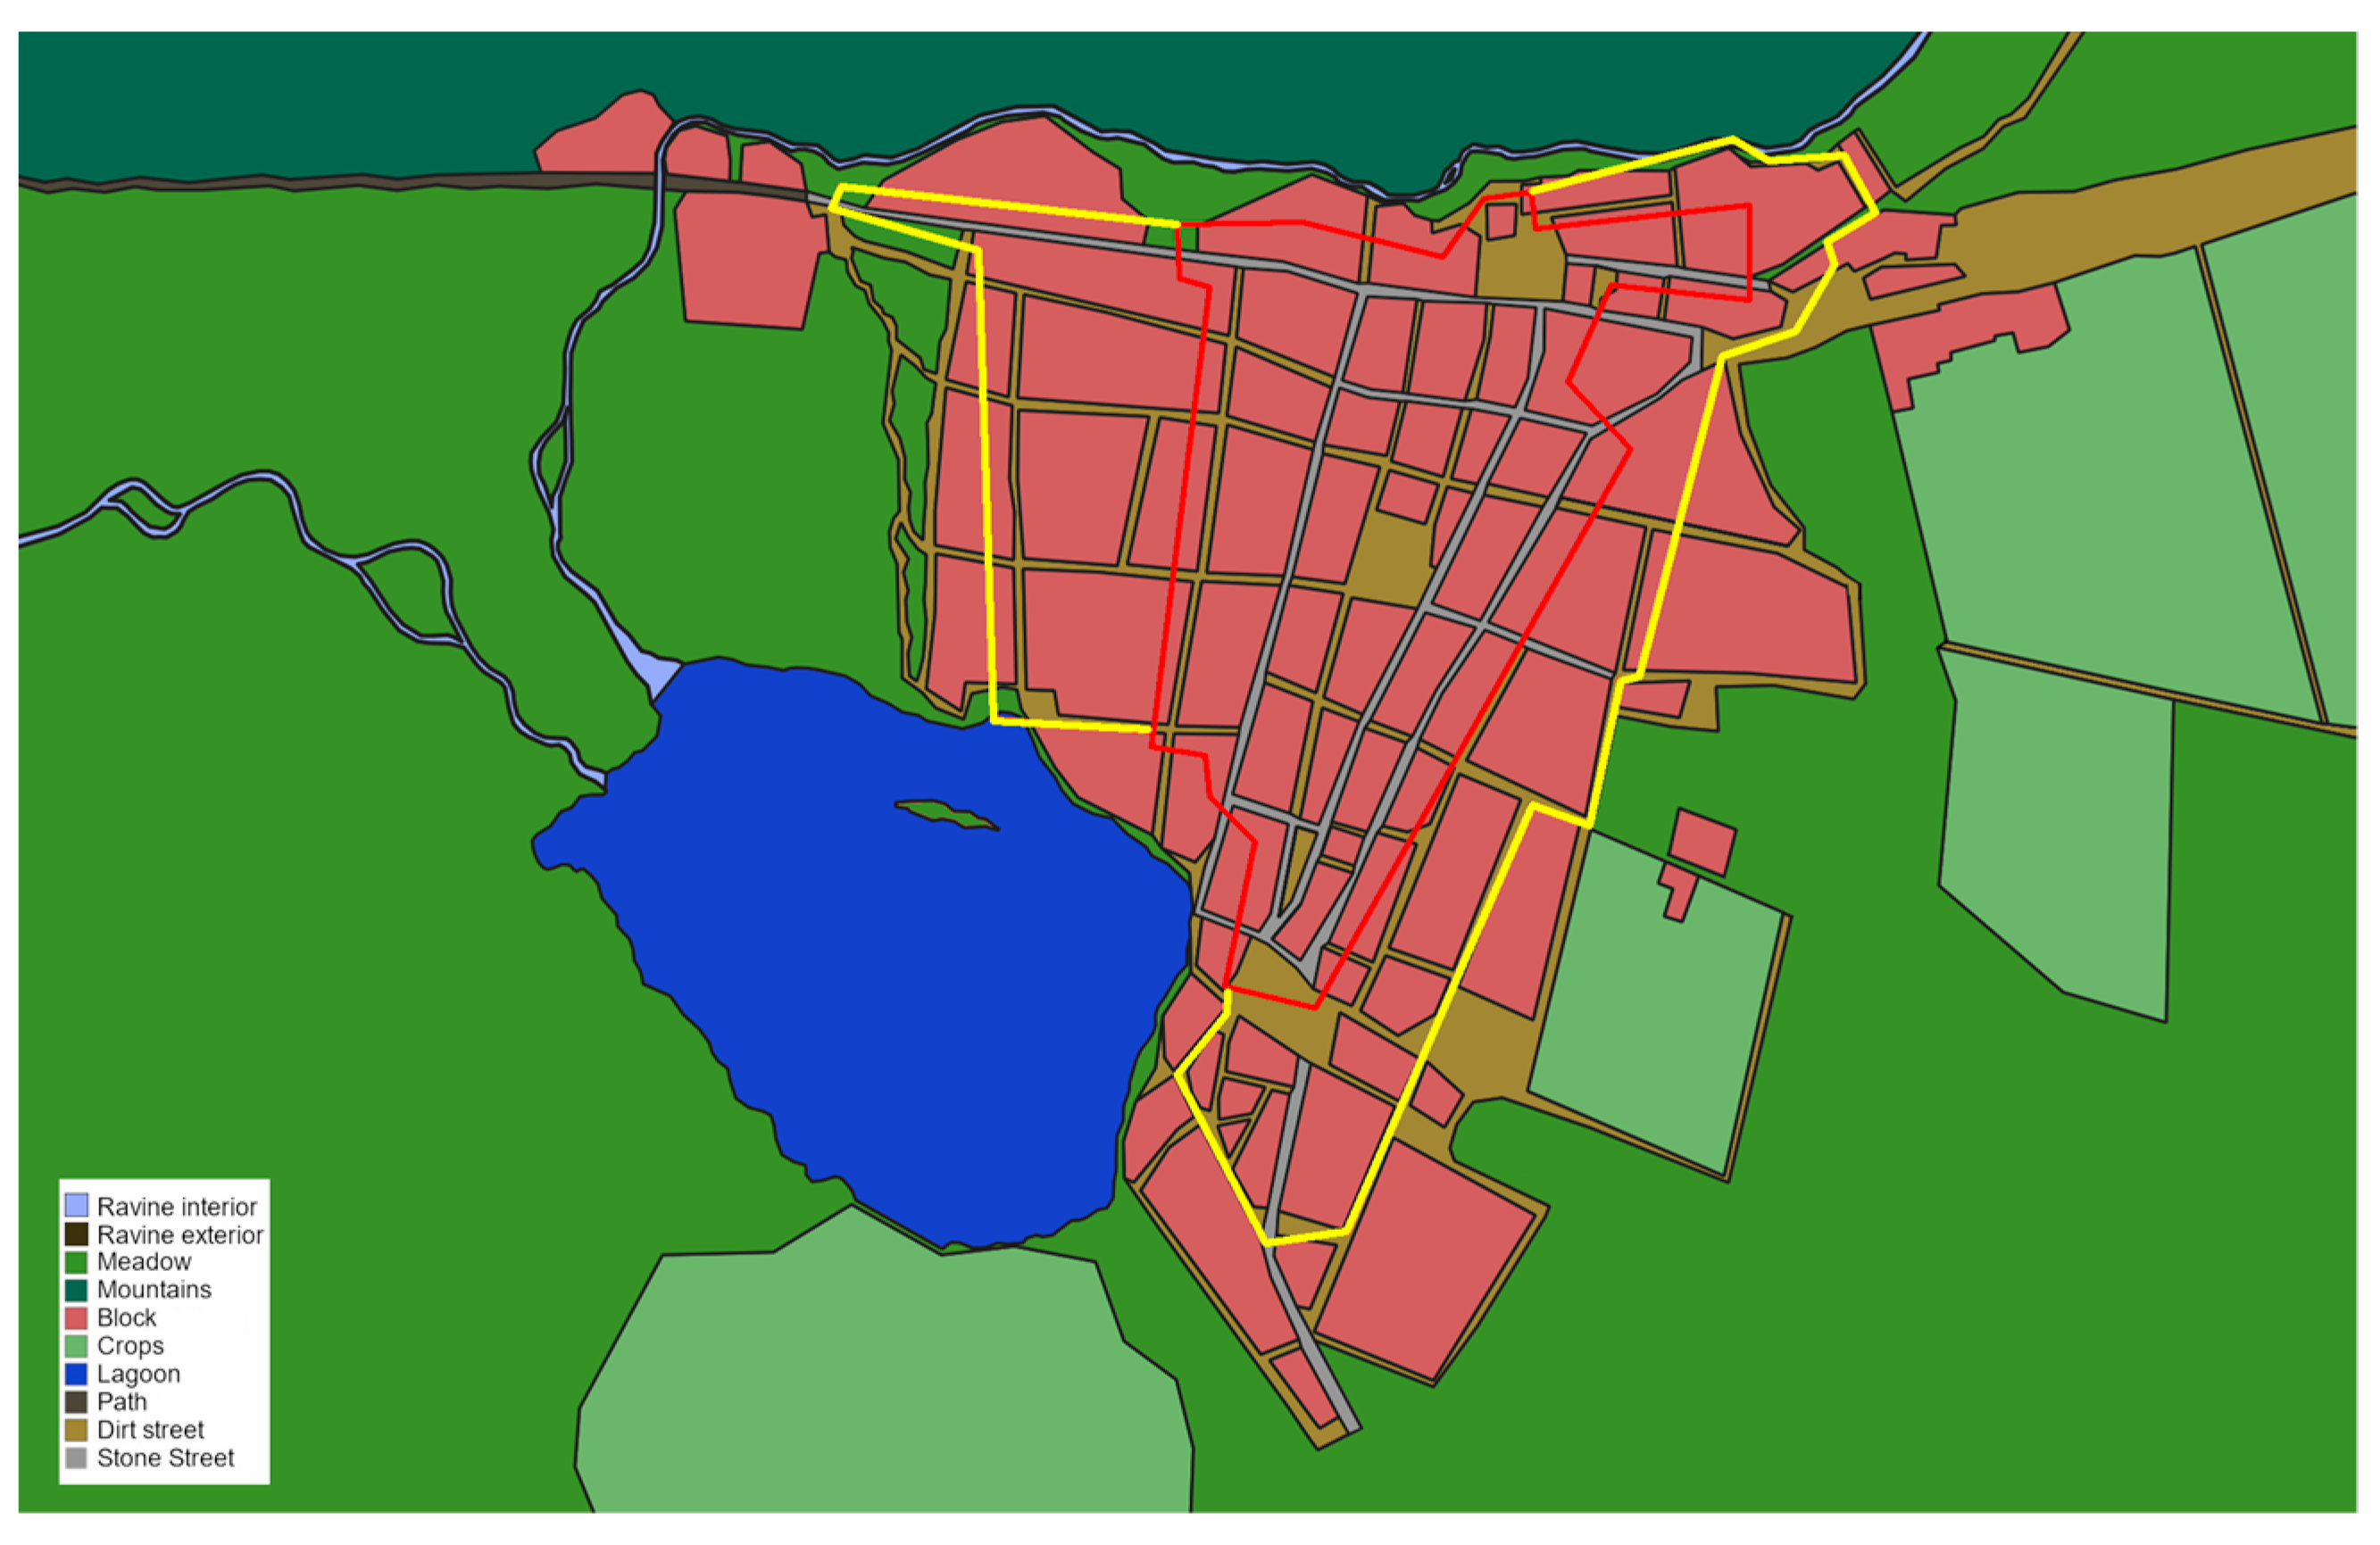
The first step in the reconstruction process is the modelling of the elements in the map. To do this, a series of 2D layers were digitized with the positional and geographic distribution of the city’s elements and its environment: blocks, streets, vegetable gardens and plots, lagoon, meadows, etc. Another 2D layer was also created with the spatial distribution of social strata: a red central zone, a yellow intermediate zone, and the rest corresponding to the peripheral zone. The 2D layers related to the terrain are shown in
Figure 6.
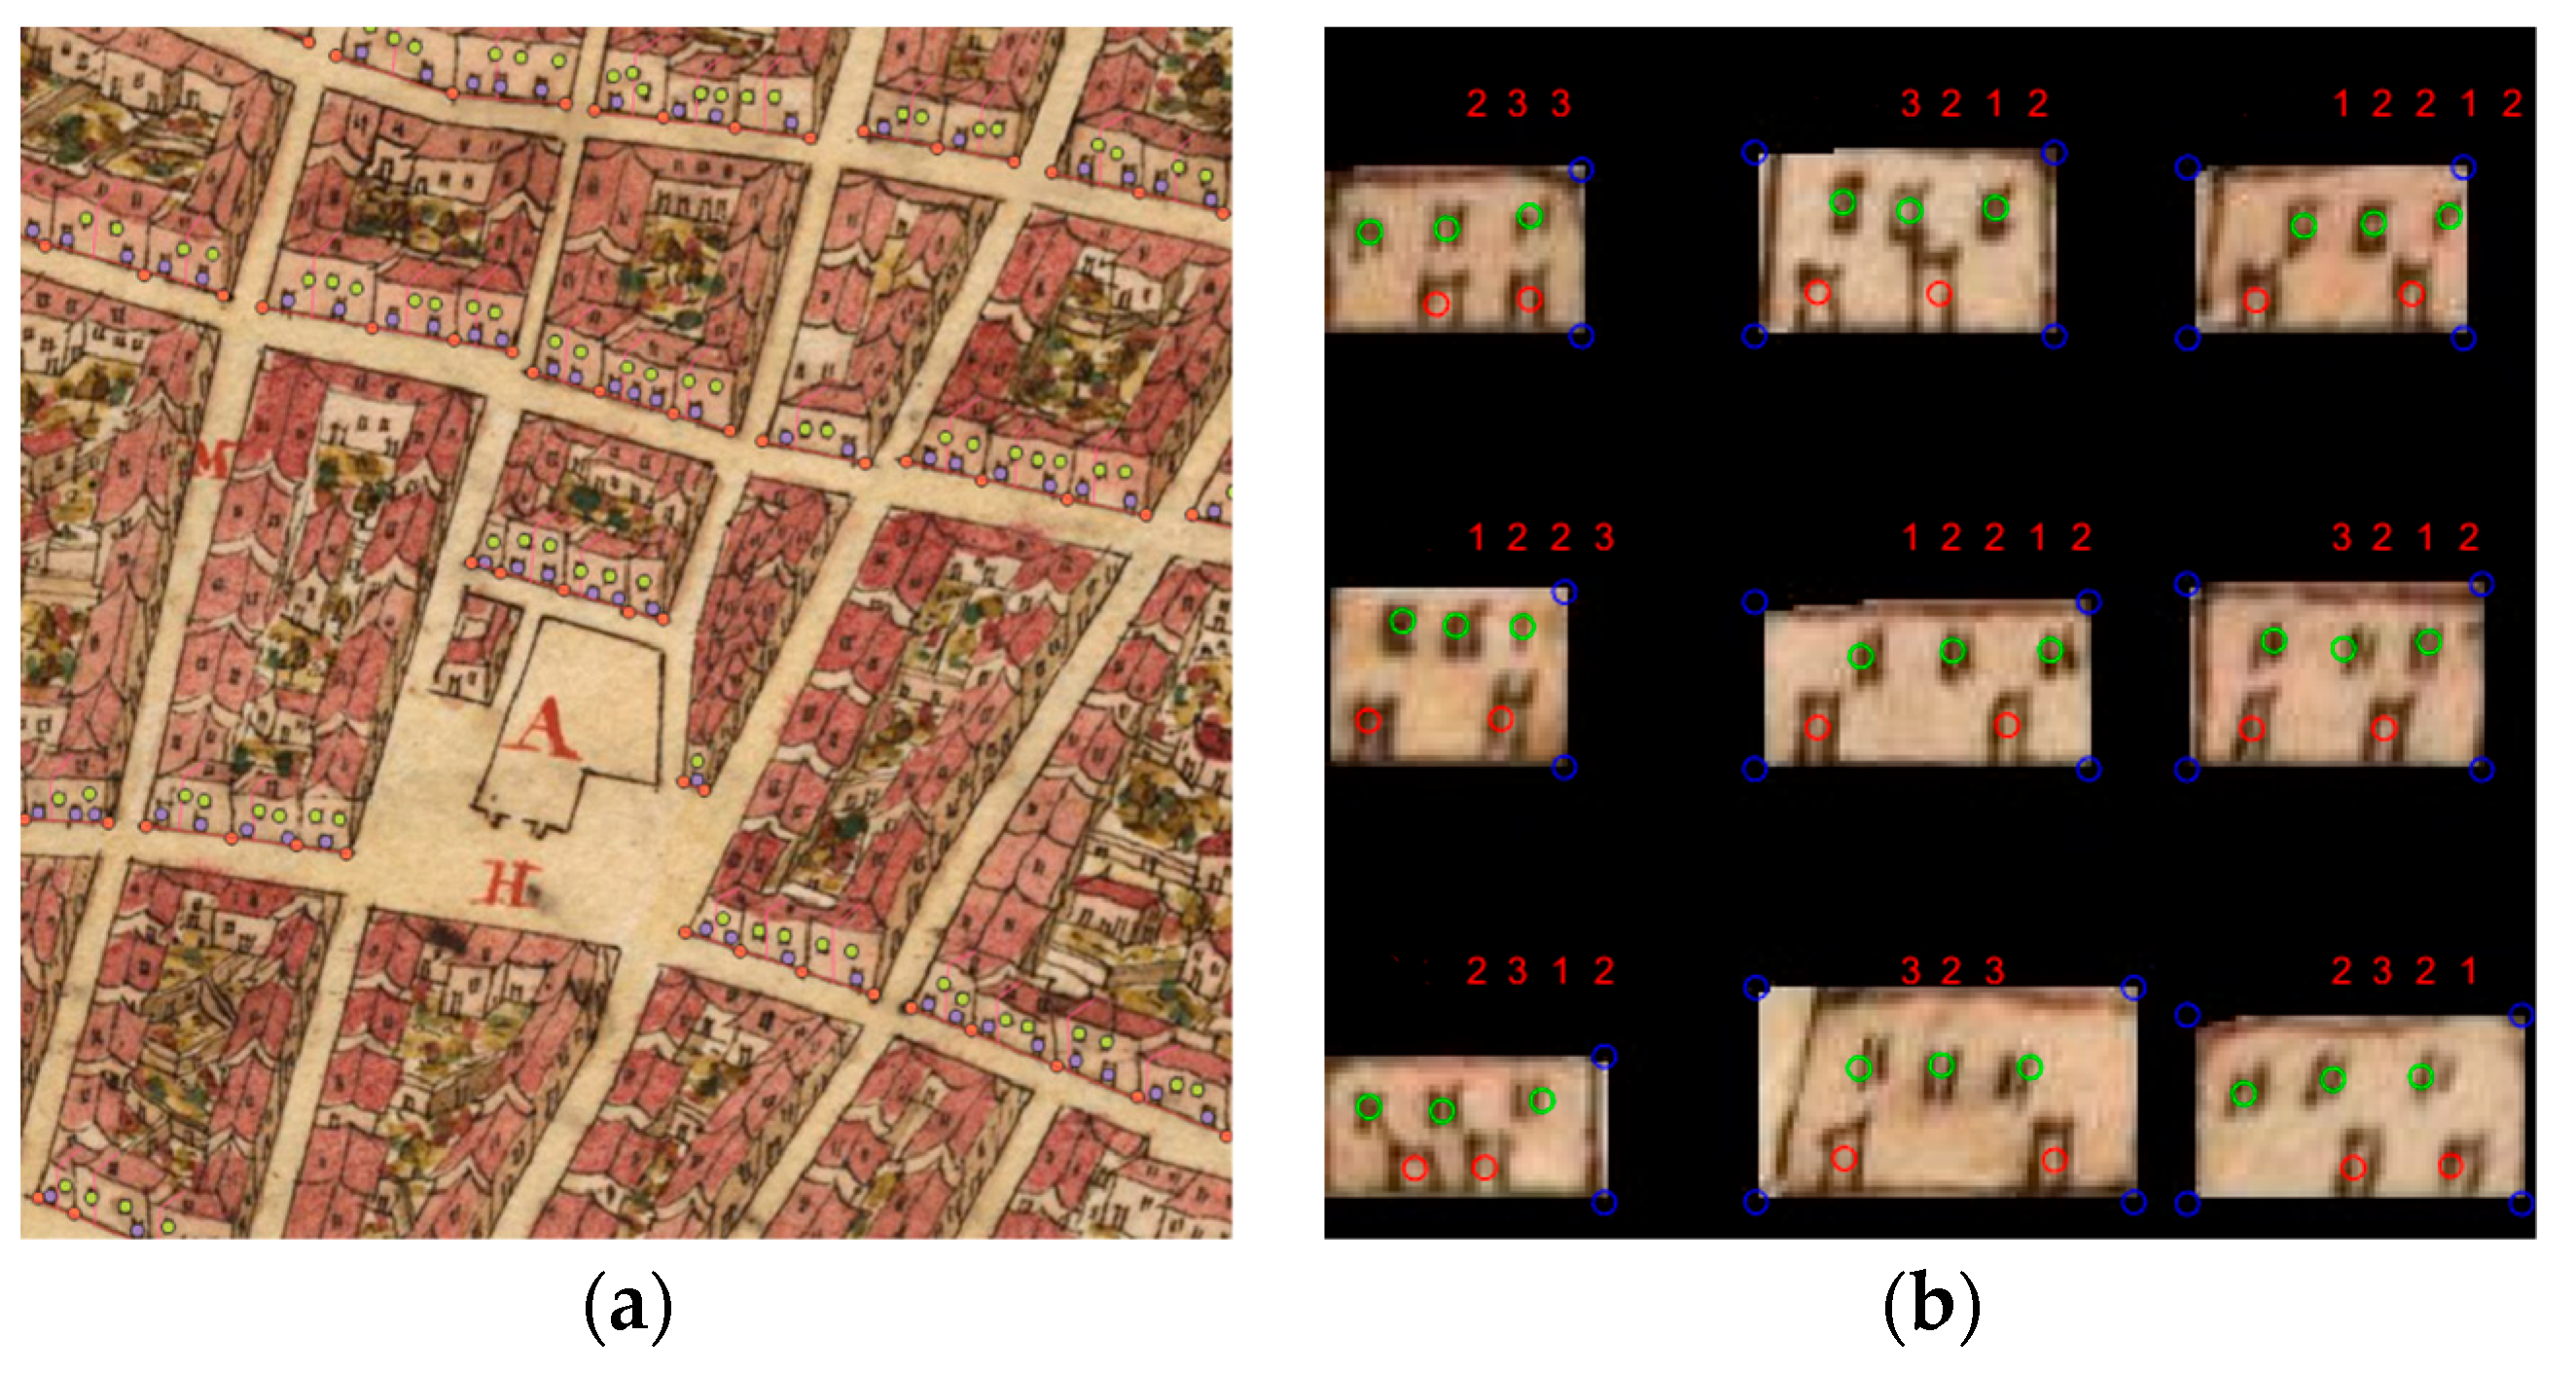
Given the lack of remains of houses from that time in the city, to model the over 1000 houses in the city the facades from the Torriani plan were used as a base. As a simplification, it was assumed that each facade could be constructed using a combination of 3 slots, numbered from 1 to 3 as seen in
Figure 7.
To study the statistical distribution of the slots, a sample of the doors and windows of the houses in Torriani’s plan was identified, as shown in
Figure 8a, indicating the number of floors, the doors, and windows, as well as the beginning and end of the facade. In this way, it is possible to assign a
fcode to each house facade as a concatenation of the numbers of the corresponding slots, as shown in
Figure 8b.
The
fcode shows the arrangement of the elements on the facade, but to obtain the geometry of the house it is necessary to define the size of the facade and the slots. In principle, an alternative could be to estimate their sizes from the houses on the map. However, this is not possible because similar houses vary in size along the map. To obtain an estimate of the size of the slots, the houses in the historical catalogue of the city from the 16th century, referenced in
Section 2.2.3, have been used. Their lengths and number of slots have been examined, obtaining an average of 3.3 slots and 3.5 m per slot. In the same way, examining the data from the catalogue has resulted in an average of 2.1 floors and 3.5 m per floor. We also assume that the beginning and end of the facade correspond to a wall whose length has been fixed at 0.6 m [
25].
Finally, for each facade fcode another code, named htype, is generated indicating the subset of the house types (terrera, granero, sobradada, comercial, armera) that are compatible with a particular code.
2.3.2. 2D Map Processing into Geographical Coordinates
The project workflow continued by transforming the original 2D map layers to 2D geographical coordinates. This was accomplished through georeferencing [
36] which relates the digitized image of a map or aerial photo to a geographic coordinate system. A set of common locations was established for both coordinate systems to share, indicating that those two points are geographically the same. In [
37], a total of 221 ground control points (GCPs) were located on Torriani’s map, mostly at the corners of the city blocks. Non-parametric natural transformation interpolation was used, resulting in a global mean error of 4.9 m, reduced to 3.2 m in the historical city centre. However, this error does not guarantee streets with parallel sides since the width of a typical street in the city is in the range of 4 to 8 m. To further improve accuracy, GCPs were added to include all points in the city blocks and crop limits for a total of 563 points. The corresponding pairs of the old map were located in modern cartography using OpenStreetMap data [
38] and the PNOA orthophoto for the city [
39]. These points were triangulated to define a piecewise affine transform between the map and the geographic coordinate system. Once the transformation is obtained, it is possible to obtain the 2D layers defined on the map in a geographic coordinate system. Although the accuracy of the blocks and crop layers is optimal, manual post-processing is required to make changes to certain layers, such as adding paths leading out of the city or adjusting layers related to mountains or ravines. For this latter adjustment, the 1874 city plan of the Topographic Brigade [
40] and the PNOA orthophoto [
39] were mainly used.
2.4. 3D Modelling
2.4.1. 3D Model of Houses
In this section, we describe the process of generating 3D models for houses in the city using a probabilistic graphical model (PGM). As there are no remaining houses from the study period, we rely on the PGM, which is defined by the variables in
Table 3, the graph in
Figure 9, and its corresponding conditional probability distributions. To generate a specific house, we condition the variable ZON and sample the others. The process proceeds as follows: the location of a house in the city determines a value for the variable ZON. From there, we probabilistically generate one of the five types of houses using variable TIP, which in turn generates a compatible facade code,
fcode, for the variable COD. We then use
fcode to compute the number of tiles of the house for the variable NTIL. Each zone in the city also defines a slot length for the variable LTIL, which, along with the length of the walls (0.6 m) and the number of slots in NTIL, determines the final length of the house in the variable LENF. This generative model provides a means for defining the essential elements of the house’s construction, including the type of house, the arrangement of doors and windows on the facade, the length and number of tiles, and the overall length of the house. The conditional probabilistic distribution (CPD) of NTIL is deterministic from the number of elements in the
fcode. The CPD of LENF is also deterministic and equal to 0.6 × 2 + TIL × NTIL, where 0.6 is the length of the house walls. The rest of the CPDs are estimated using the historical documentation in
Section 2.2.3.
After designing the basic structure of the house, the next step is to determine its spatial position within a city block. The process of modelling the plots begins with vectorizing the blocks (see
Figure 6), which have already been transformed into geographic coordinates through georeferencing. In the literature, there are various techniques for block partitioning [
41], including those based on the straight skeleton (SS) and recursive subdivisions (RS). In this work, both techniques were used, with SS being used to partition the edges of the blocks due to its greater control over the length of the plots, while RS was used for the interior of the plots to produce results similar to those of the map.
The SS method [
41] is based on the partitioning of the block edge and its subsequent subdivision into plots. However, the original algorithm had to be modified to consider several aspects. One of the key observations in Torriani’s map is that it is not always necessary to partition each block entirely. This is because the presence of certain elements, such as empty block spaces and walls, can effectively act as natural partitions. Second, the length of the plot fronts generated through a normal distribution in [
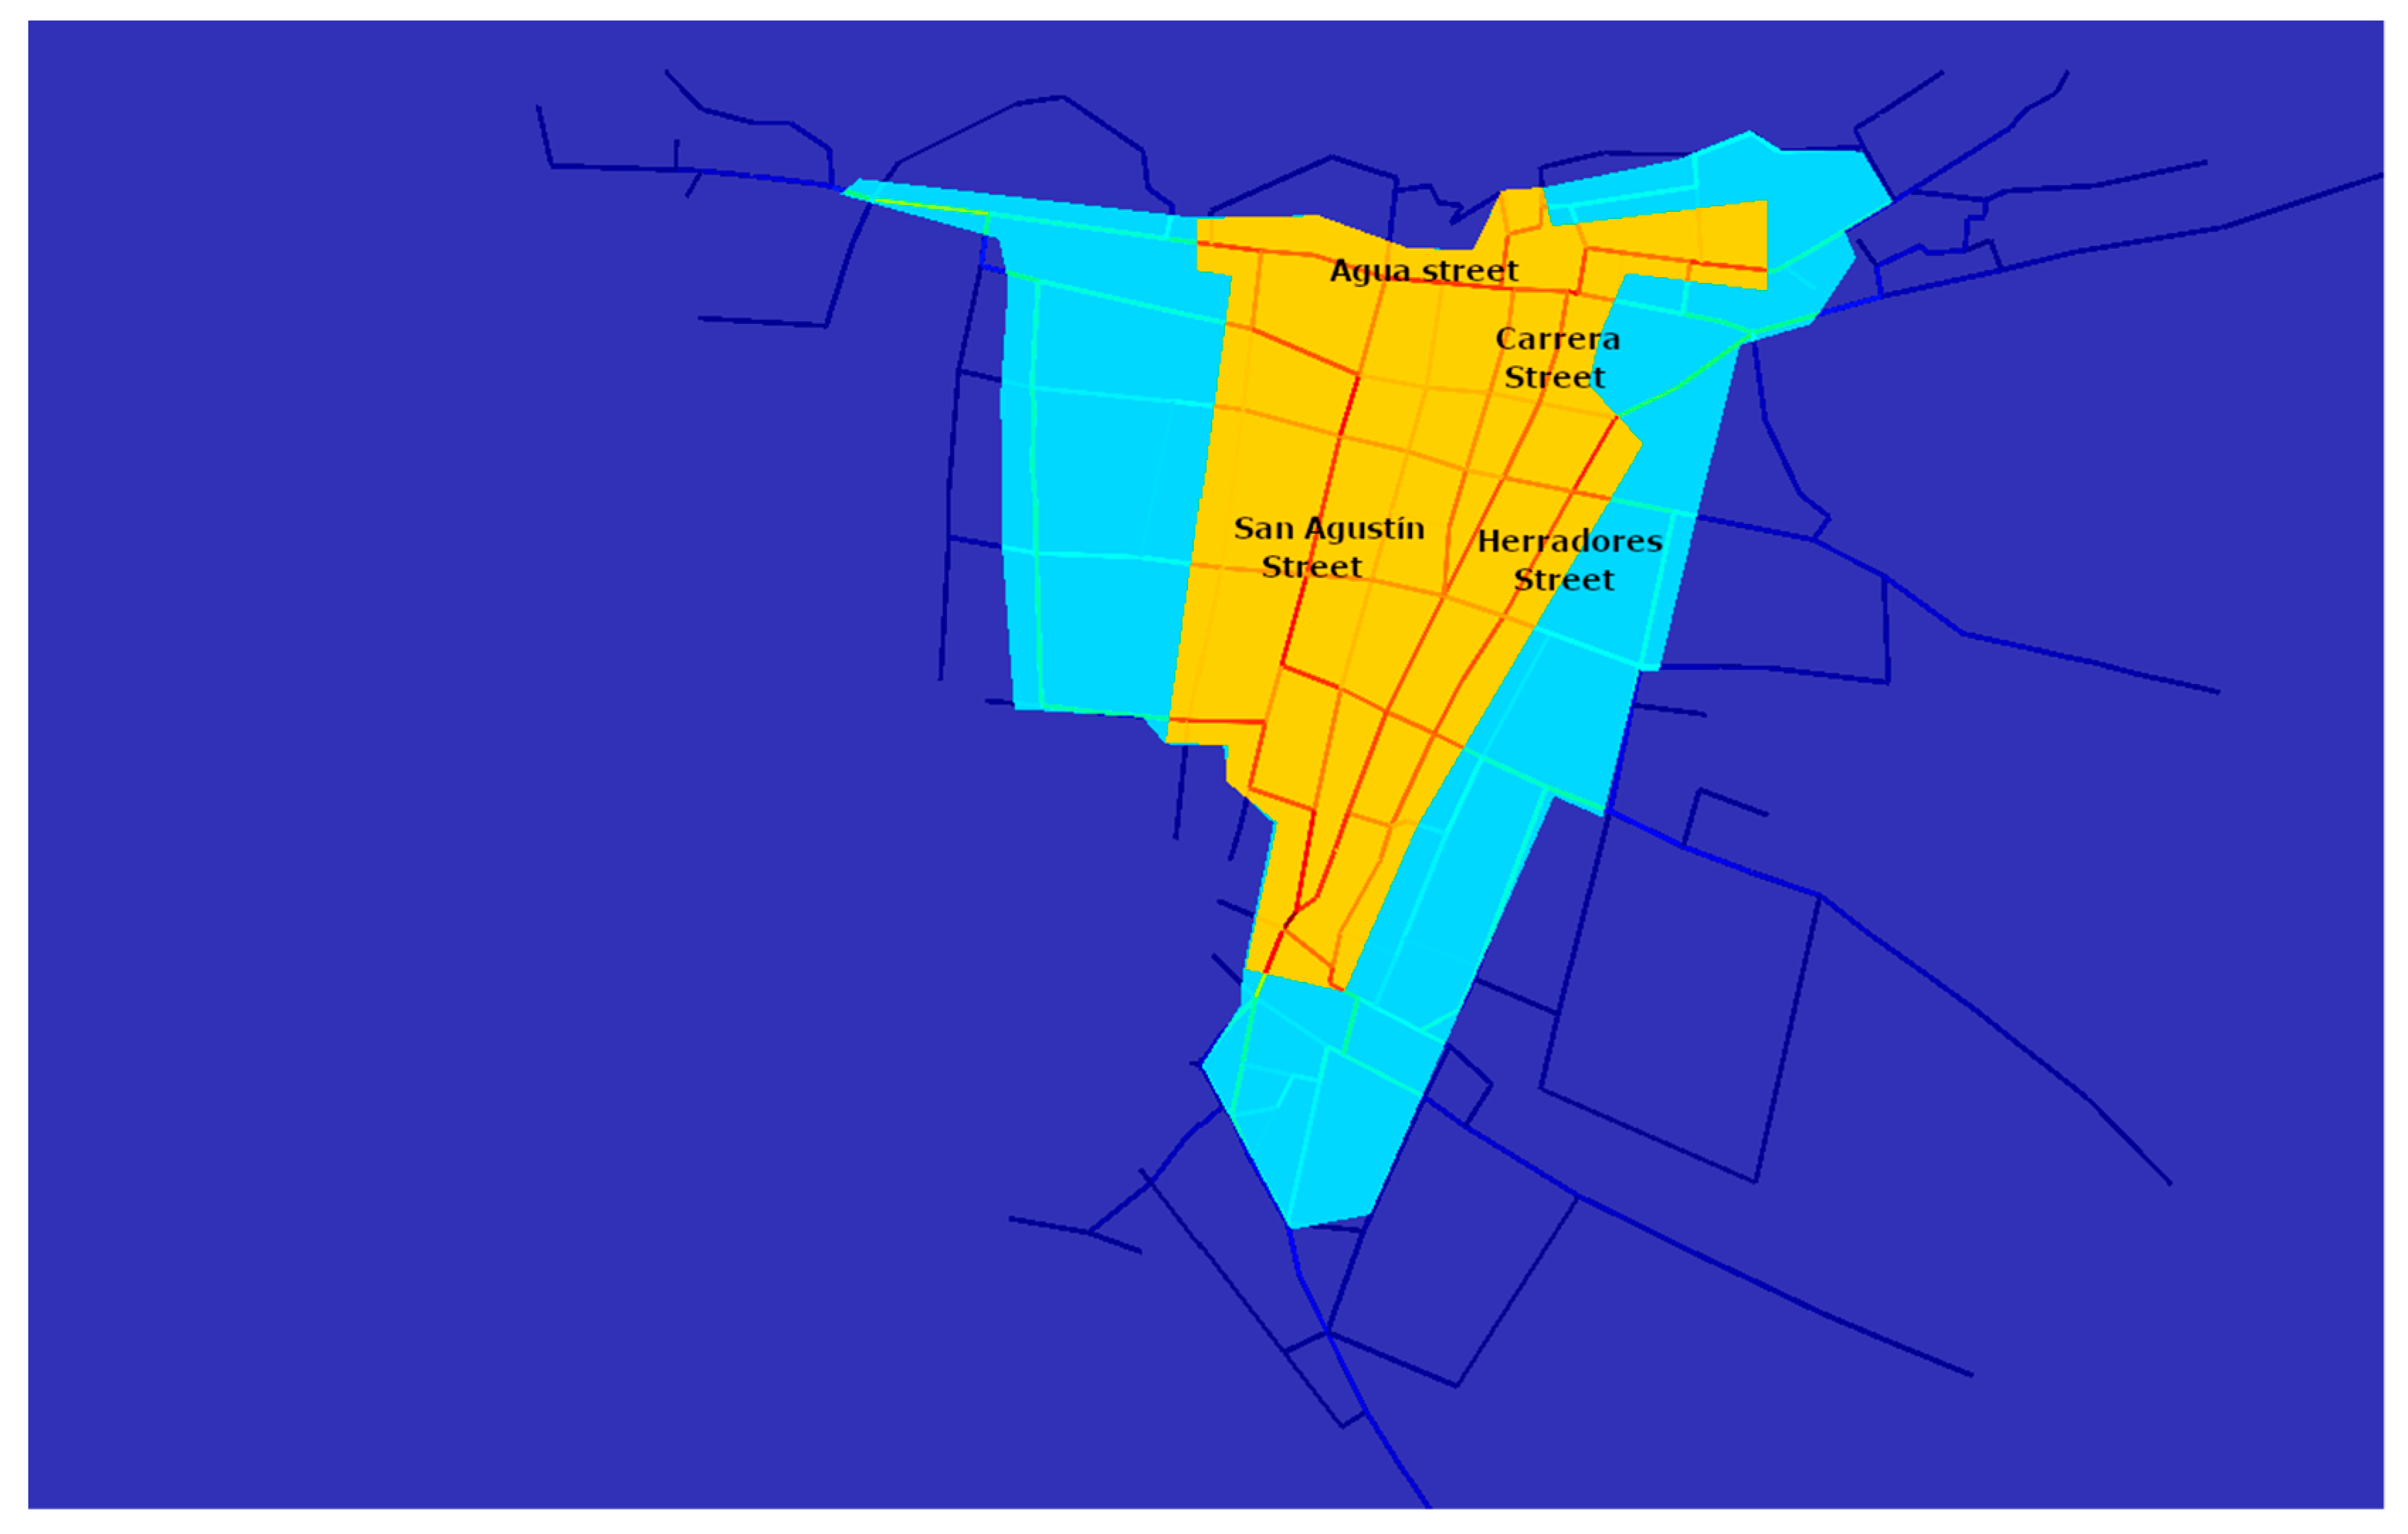
41] is replaced in this case by the LENF variable in the PGM model described earlier. Finally, the processing of the sides of the blocks is performed by studying the collinearity of their vertices rather than their belonging to logical streets due to the absence of information about the complete street layout of the city in 1588. The importance of each side of the block is calculated using the betweenness centrality (BC), which is a measure widely used in the study of the spatial distribution of cities [
42]. The BC is combined with the information on the division of the layer into zones to capture the importance of the royal streets in the city (Carrera, Herradores, San Agustín, del Agua) as seen in
Figure 10.
The application of the modified SS algorithm is shown in
Figure 11. To define the initial split for a block B, the user defines a perpendicular distance
doffset from block contour C(B) to an inwards offset contour C′(B). In our case,
doffset is defined by the interior rectangular side of the plot. The contour C′(B) is calculated by the application of the straight skeleton to C(B) [
43]. The arcs of the skeleton application specify the division of the region between C(B) and C′(B) into a set of strip polygons that are referred to
α-strips. These polygons are of three types: empty space, walls, or building land as seen in
Figure 11a. Strips from empty spaces and walls are fixed throughout the algorithm. The
α-strips from building land are first joined based on collinearity. Then, triangular regions are transferred from adjacent strips with lower BC to those with higher BC as seen in
Figure 11b. These corrected strips are referred to as
β-strips. Finally, the
β-strips are subdivided using the length of plot fronts as seen in
Figure 11c, and the modified SS algorithm ends. The detailed pseudocode of the algorithm can be found in
Appendix A.
To perform the division of the interior of the blocks, the RS method in [
41] has been used, which performs an adaptive spatial partitioning of the block boundary using oriented bounding boxes (OBBs). In our case, the division of the blocks reaches the walls of the block or the edge of the houses, as shown in
Figure 11. This block division corresponds to the internal walls of the blocks in Torriani’s map. Small constructions in the map are placed on the rectangles beside the internal walls that define the block’s subdivisions, as shown in
Figure 11d.
Upon completion of block subdivision, a collection of plots is obtained, each defined by a specific spatial location and a basic house description denoted by its
fcode and
ftype. To produce a complete geometric model of each house, additional geometric features are incorporated, such as its shape evolution (e.g., elongation or with protrusions in various configurations) as described in [
40], as well as whether or not an attached construction is present (a common occurrence in Torriani’s map). The model also includes details about textures used for facades, wooden elements, or roofs. By incorporating these features, we produce an implicit 3D model of each house, as outlined in
Table 4. We intend to preserve both the geometric and textural features independently of any software tools employed to obtain explicit 3D reconstructions.
2.4.2. 3D Model of the Terrain
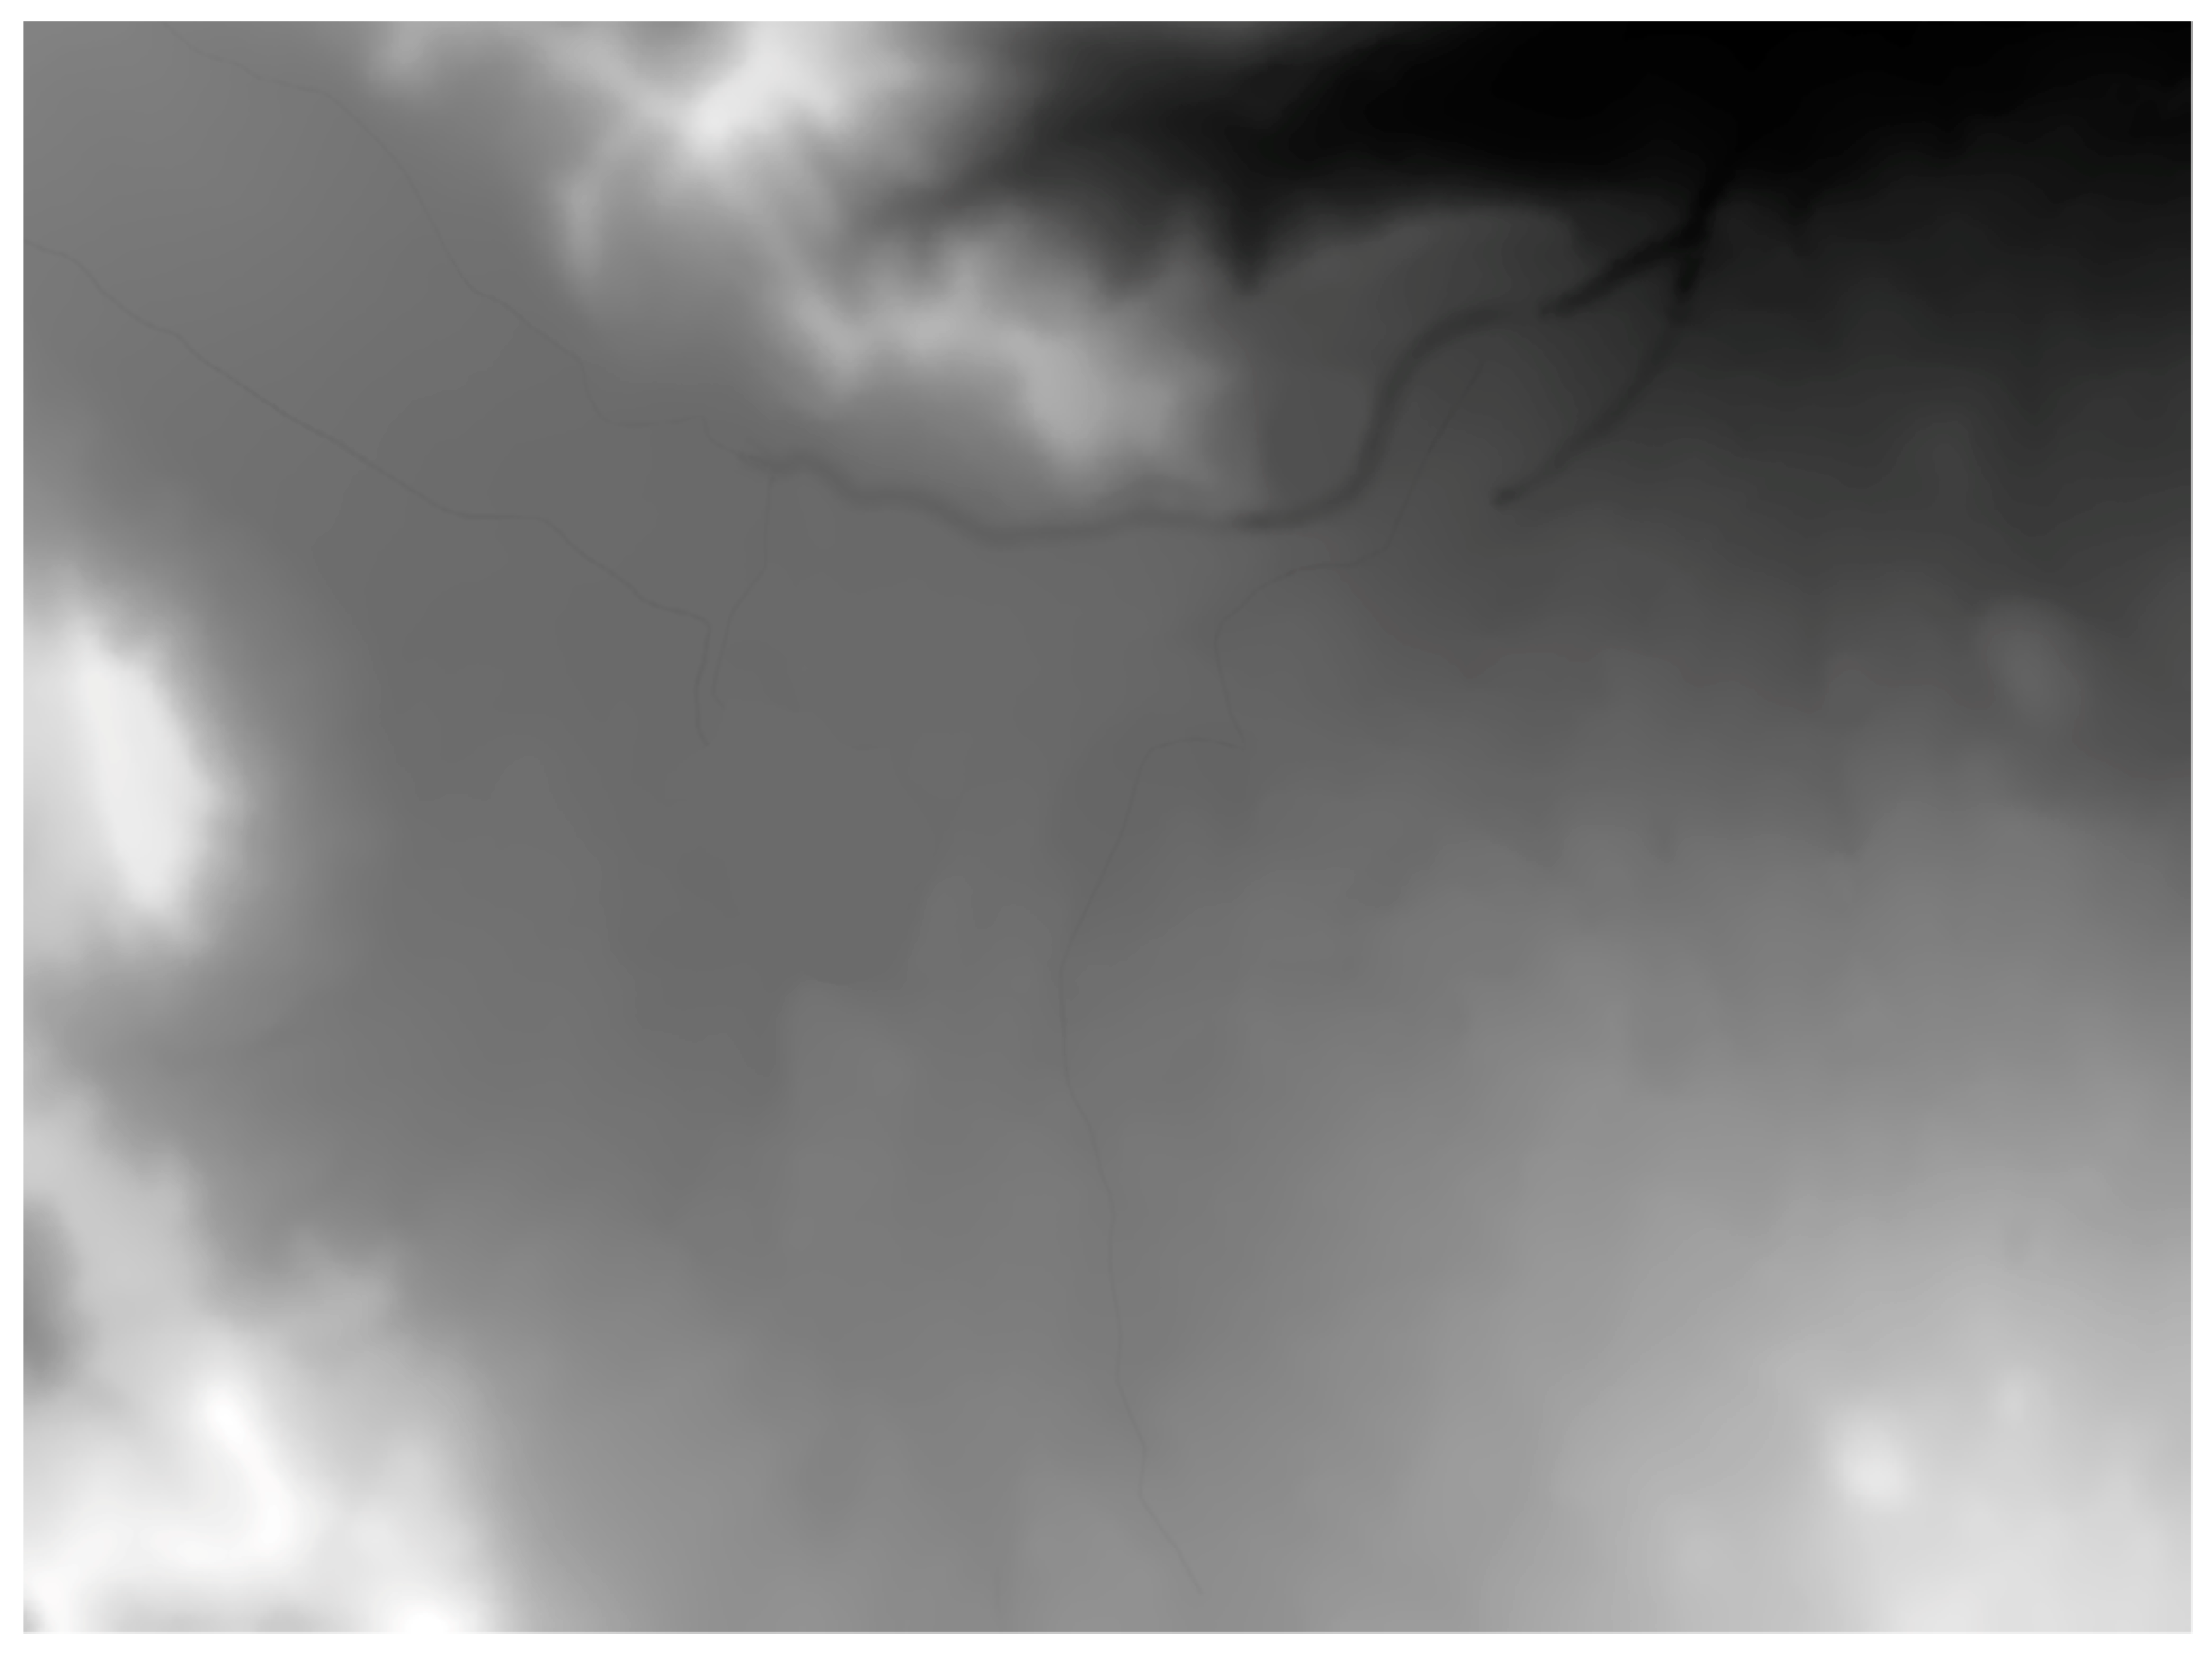
To accurately describe the terrain as it existed in 1588, we modified the original DEM described in
Section 2.2.7 using the georeferenced 2D layers outlined in
Section 2.3.2. This involved adding elements present in 1588, such as the lagoon and ravines surrounding the city, while modifying areas that exist today but not at that time, such as the airport near the city. The resulting modified DEM is depicted in
Figure 12.
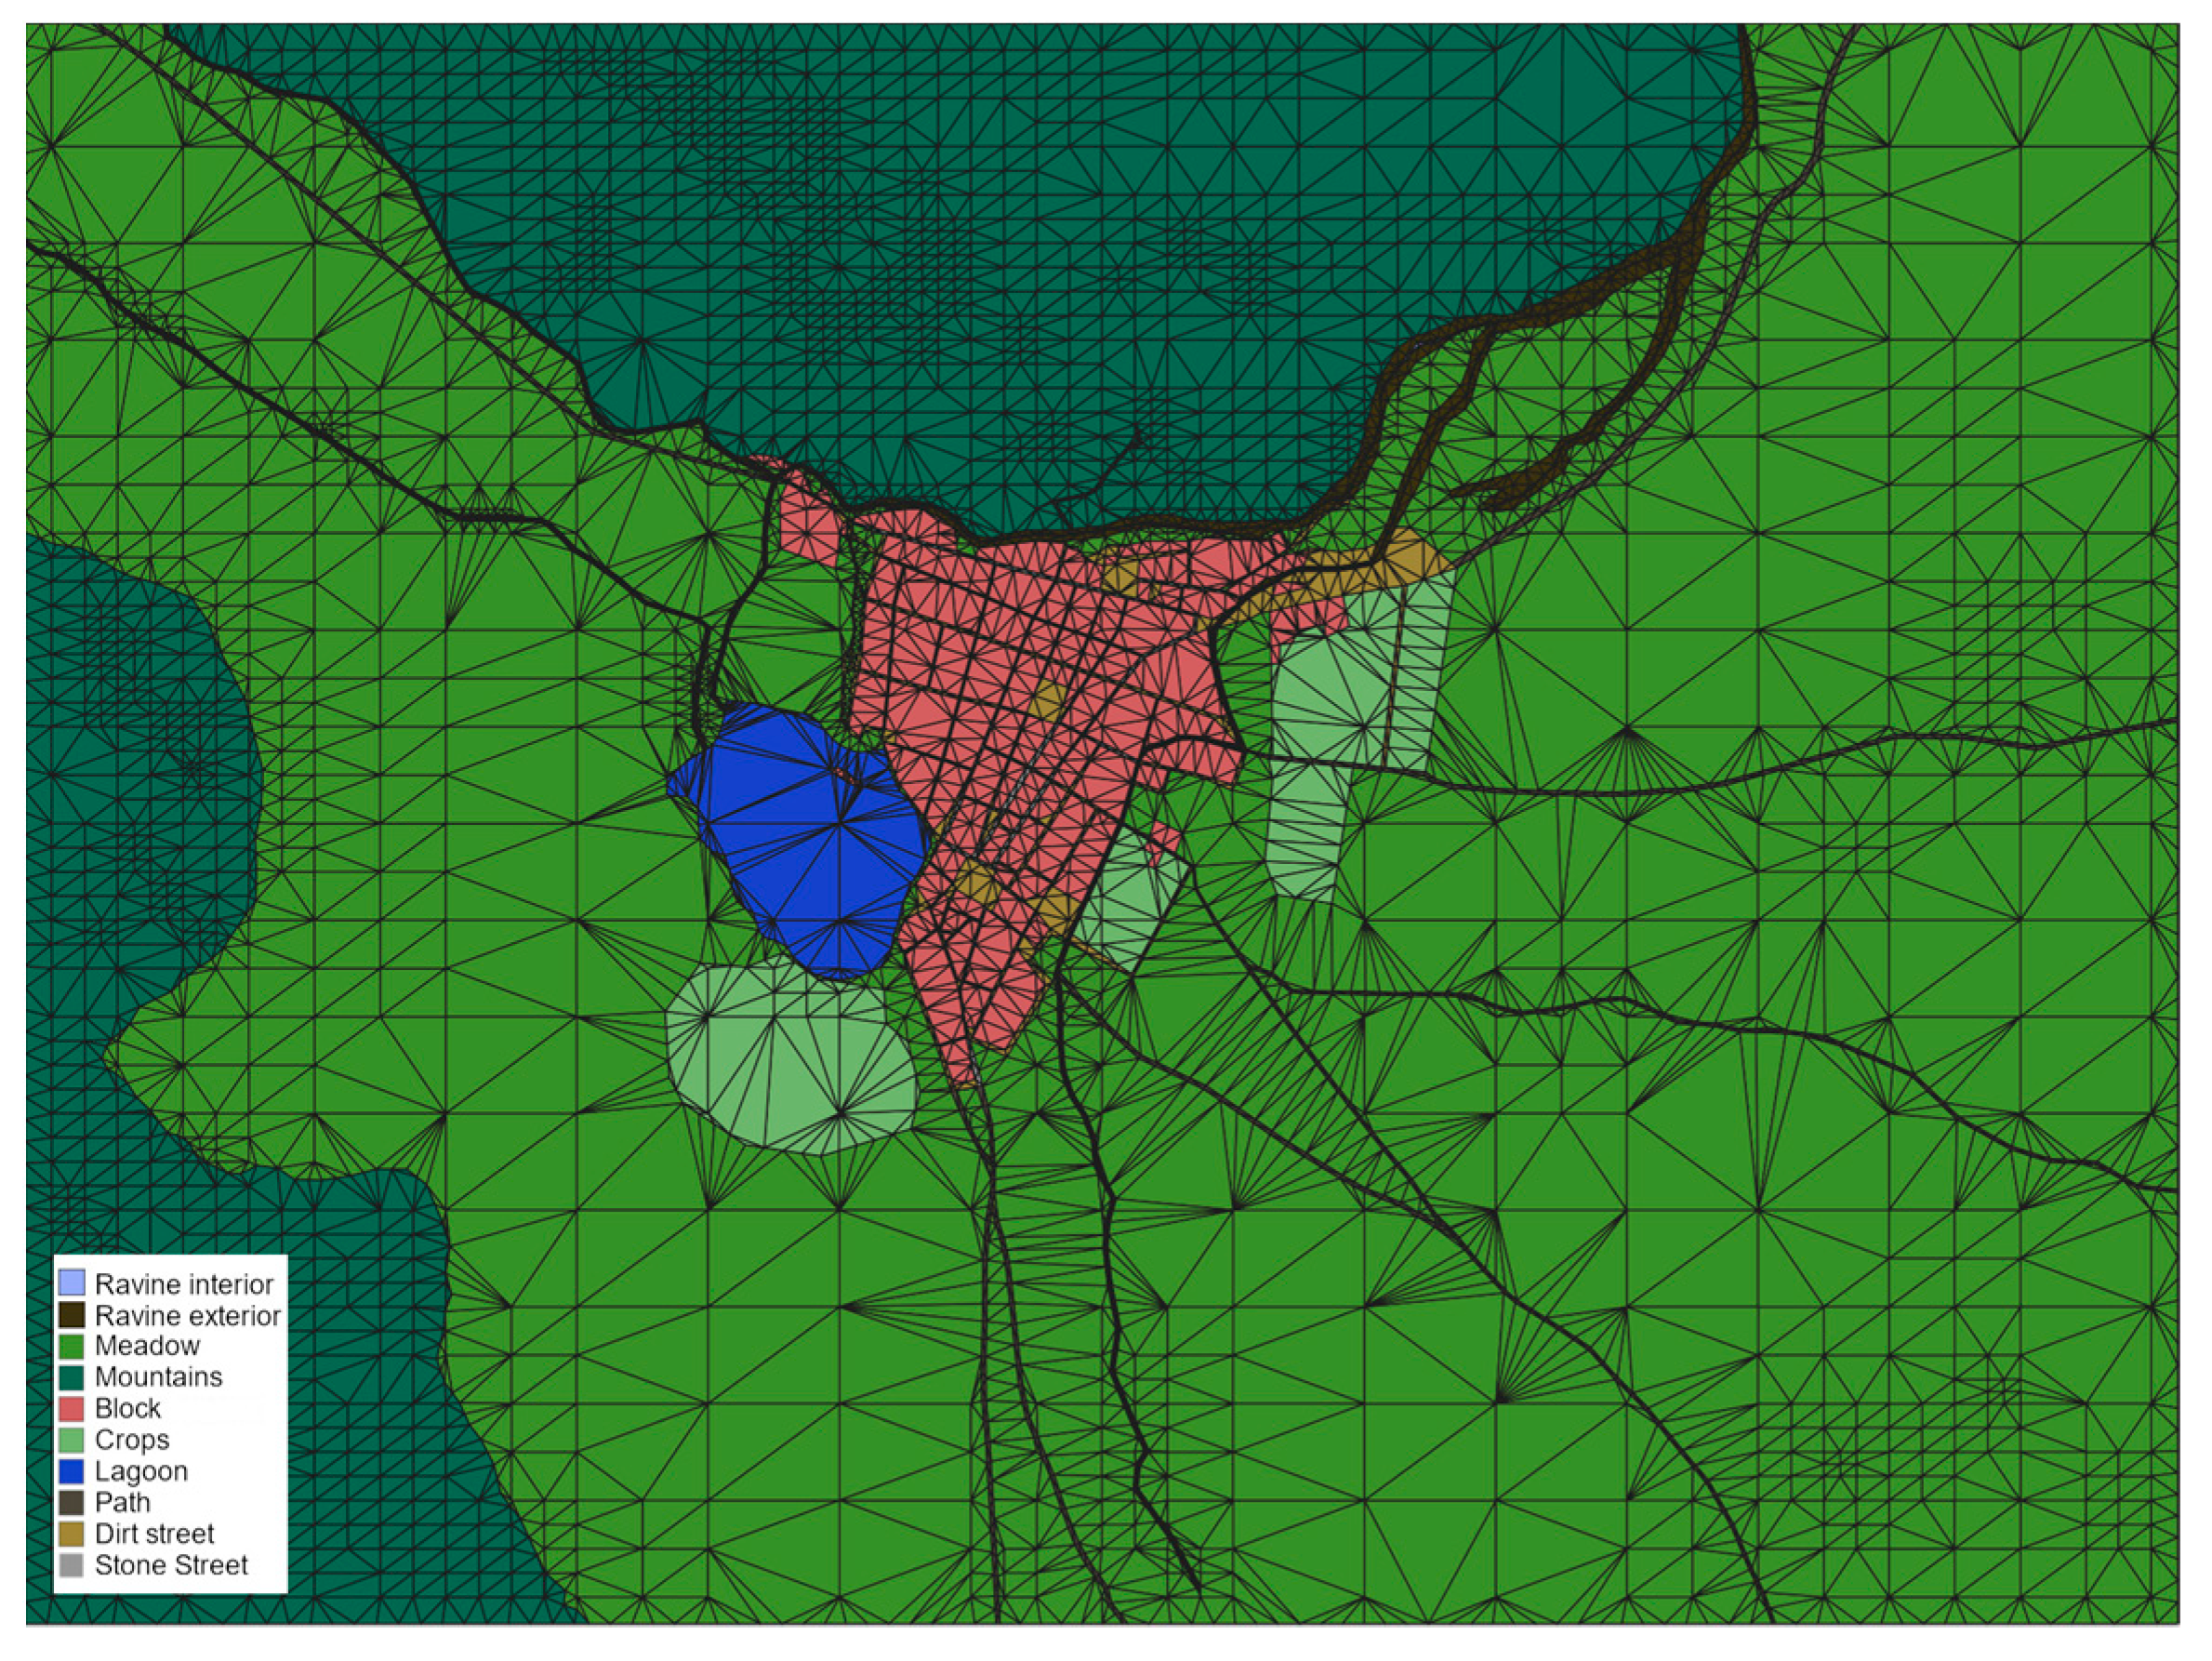
Using this modified DEM, we generated a simplified 3D model of the terrain as follows. First, we triangulated the DEM mesh recursively until its difference with the modified DEM was less than a tolerance level. Next, we generated a restricted triangulation that incorporated the contours of the georeferenced 2D layers related to the terrain and added vertices from the previously triangulated DEM. The final triangulation, which forms the 3D model of the terrain, assigns Z height coordinates to vertices based on the modified DEM. The resulting 3D model of the terrain is shown in
Figure 13.
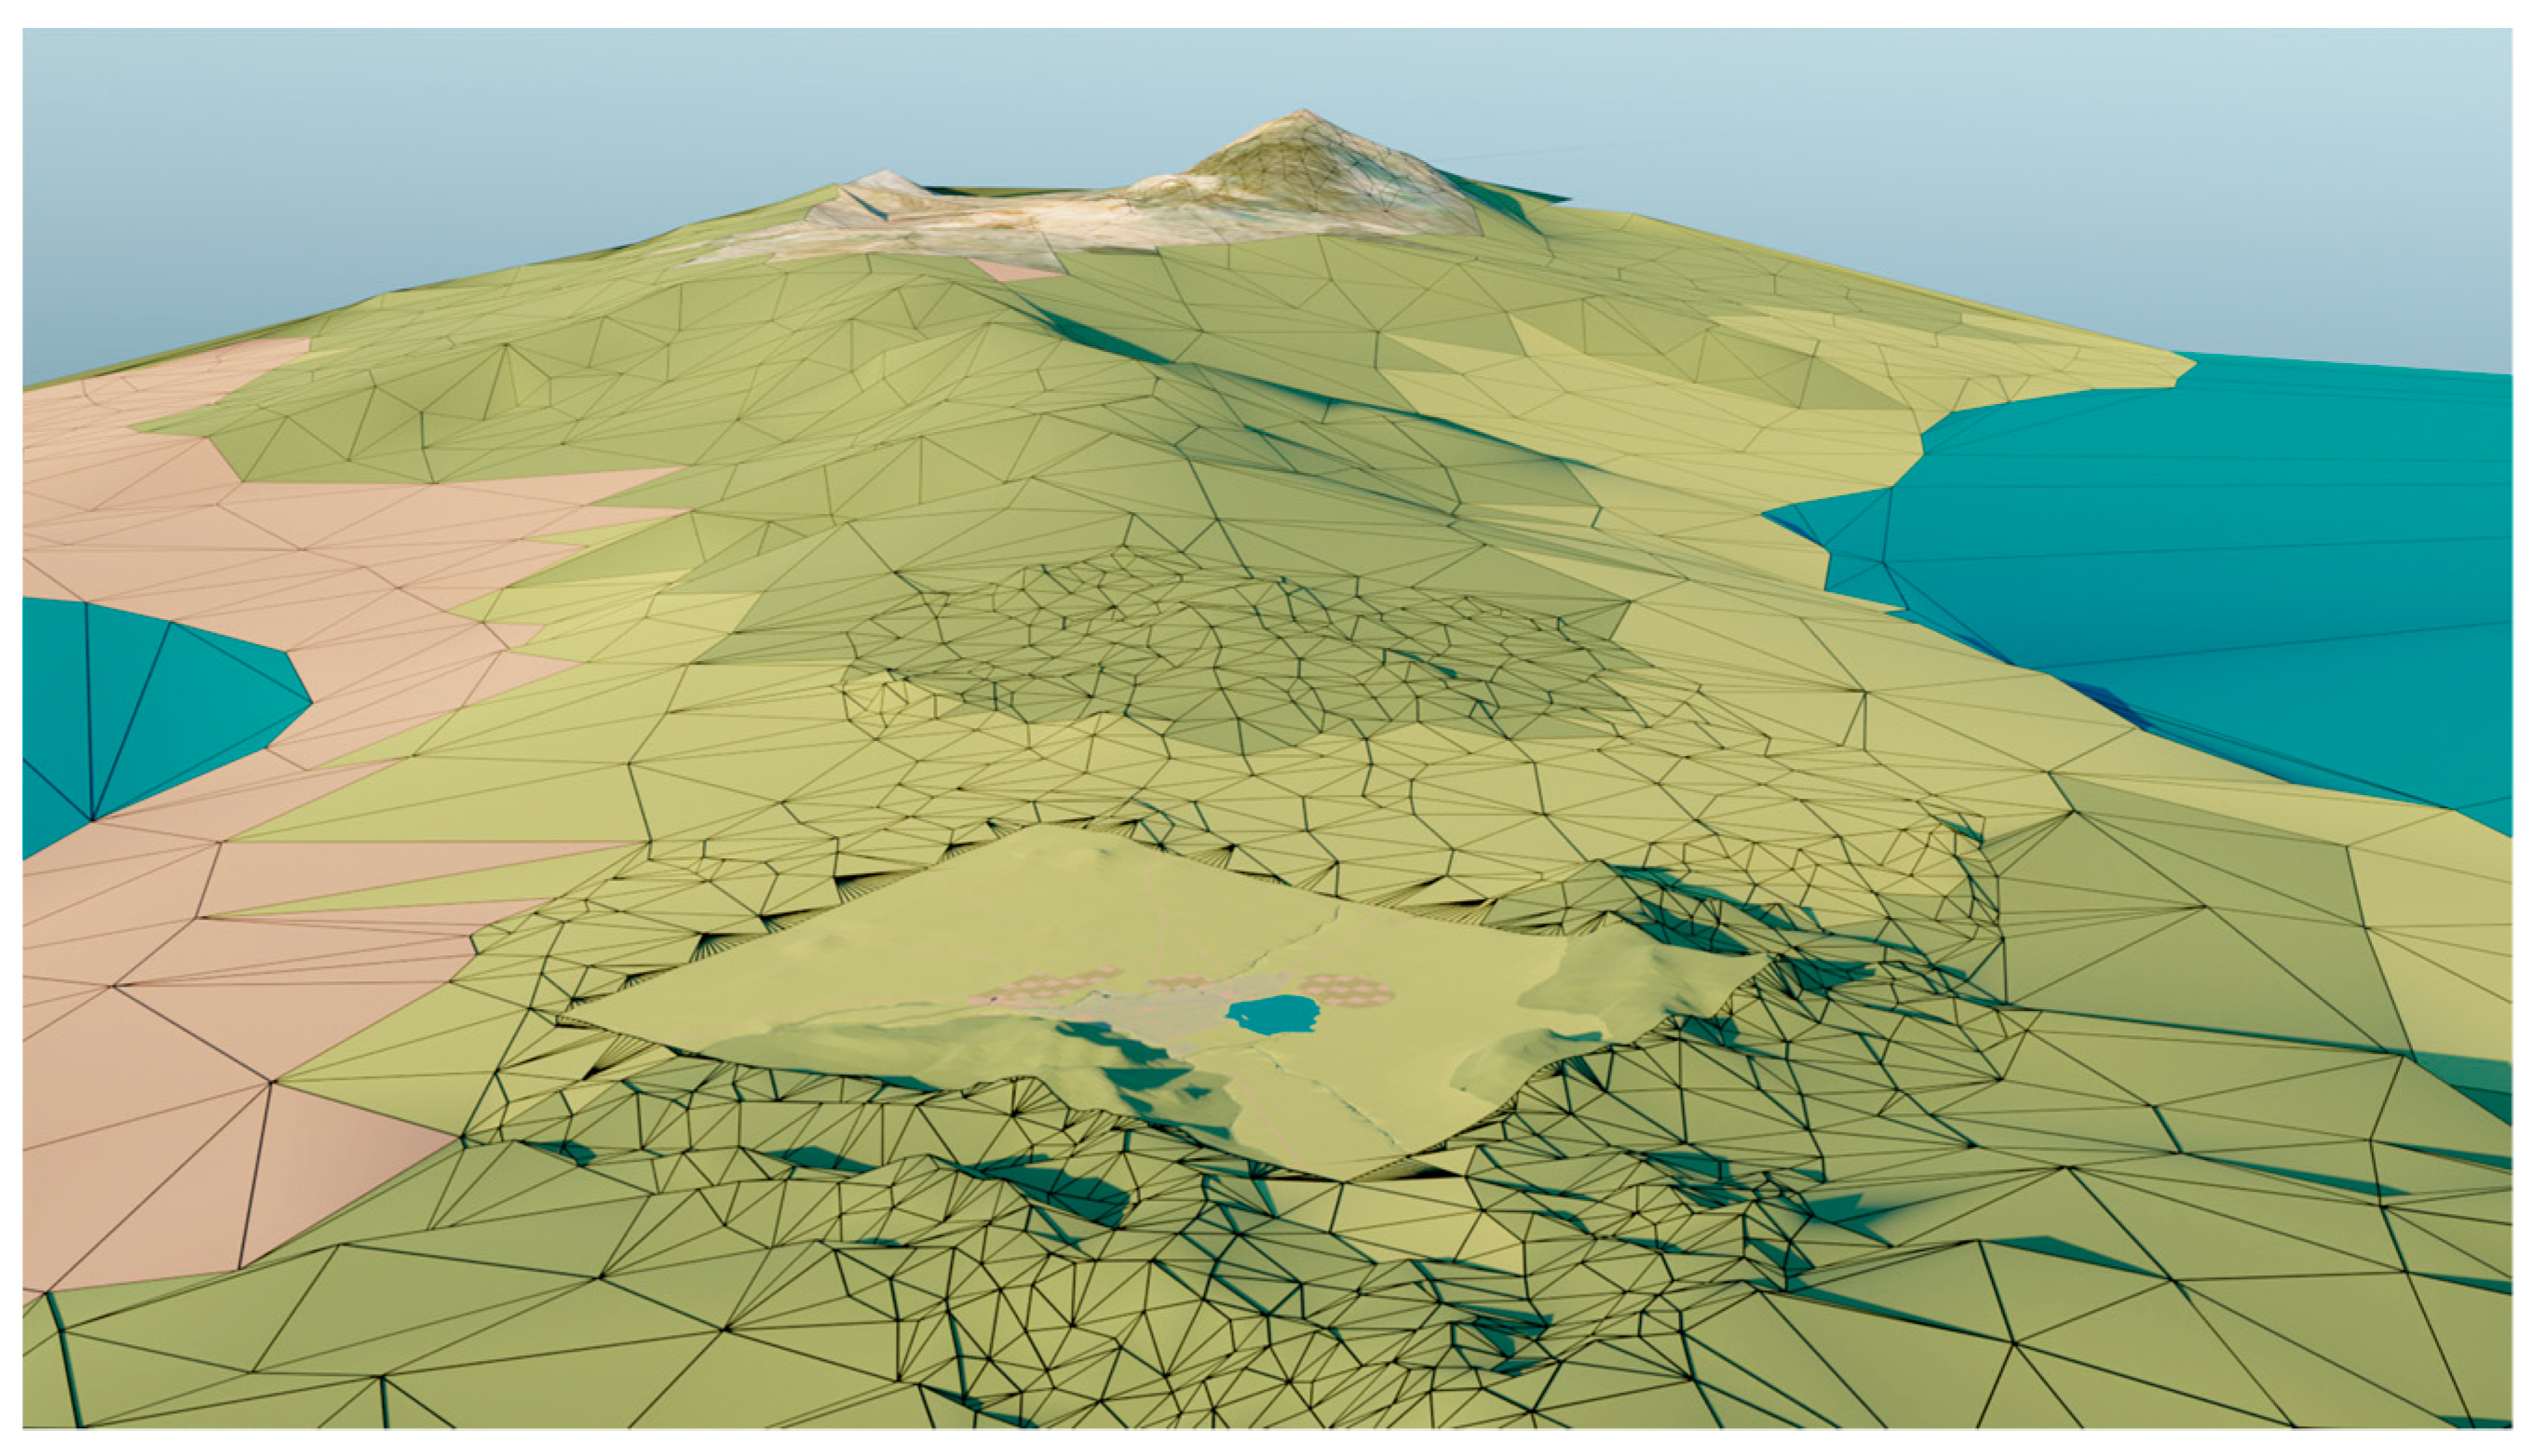
While the modified DEM shown in
Figure 12 provides an accurate representation of the terrain as it existed in 1588, it is not sufficient for visualization purposes. This is because the height of Mount Teide, located in the centre of the island, is visible from San Cristóbal de La Laguna. To provide a realistic extended view of the city and its surroundings, a DEM of the island surrounding San Cristóbal de La Laguna was used, as described in
Section 2.2.7. The DEM has also been triangulated with a variable resolution, higher near the city and on the Teide volcano to obtain precise textures and lower in the rest of the island (see
Figure 14).
2.4.3. 3D Models of Singular Buildings
The technical process of 3D modelling of the singular buildings followed a planning whose first step consisted of the parametric generation of the building structure using the 3D/BIM architectural design software Edificius. The initial data for the creation of the buildings were based on the interpretation of the ground outlines represented by Torriani on the city plan. To define a first approximation of the building, the georeferenced information of the shape of the current buildings available in the cadastre [
44] was used, in addition to the LIDAR data in the Canary Islands spatial data infrastructure (IDE Canarias) [
45] to estimate the heights. In this way, the first version obtained was later refined by a team made up of a historian and experts in graphic expression in architecture and graphic computing. Throughout this multidisciplinary and iterative process, the geometric characteristics were modified according to the documentation available in
Section 2.2.6. In this process, the position and morphology of a building may need to be adjusted or completely modified during reconstruction, especially when the original building no longer exists or only a small part of it is available. Also relevant in this phase of the work was the use of drawings and photographs that helped in the design of the model (
Figure 15).
The result of this process is a collection of singular buildings whose structure and ornamental elements are based on the architectural style prevailing in the 16th century in the Canary Islands. The generated models are exported from the Edificius software for their use in the procedural generation process of the city. However, we encountered several issues during the automatic export process, including an excessive number of triangles, acute triangles with near-zero angles, and alterations in the face normals. To address these issues, we employed the Blender software to post-process the models and improve their topologies. We conducted a retopology of the meshes to correct geometric problems, and we inserted details in the doors and windows using reference images as shown in
Figure 16. Moreover, we adjusted the normals and textures to optimize their use in the new models. The result is a set of optimized 3D models of the singular buildings featured in the legend of the Torriani map and detailed in
Table 2. In addition, we reconstructed other elements from that time given their significance, such as the house of the Adelantado and the churches of San Benito or San Lázaro, and added them to the 3D model of the city. The results of the 3D reconstruction of the singular buildings can be seen in
Figure 17.
2.4.4. 3D Model of the City Inhabitants
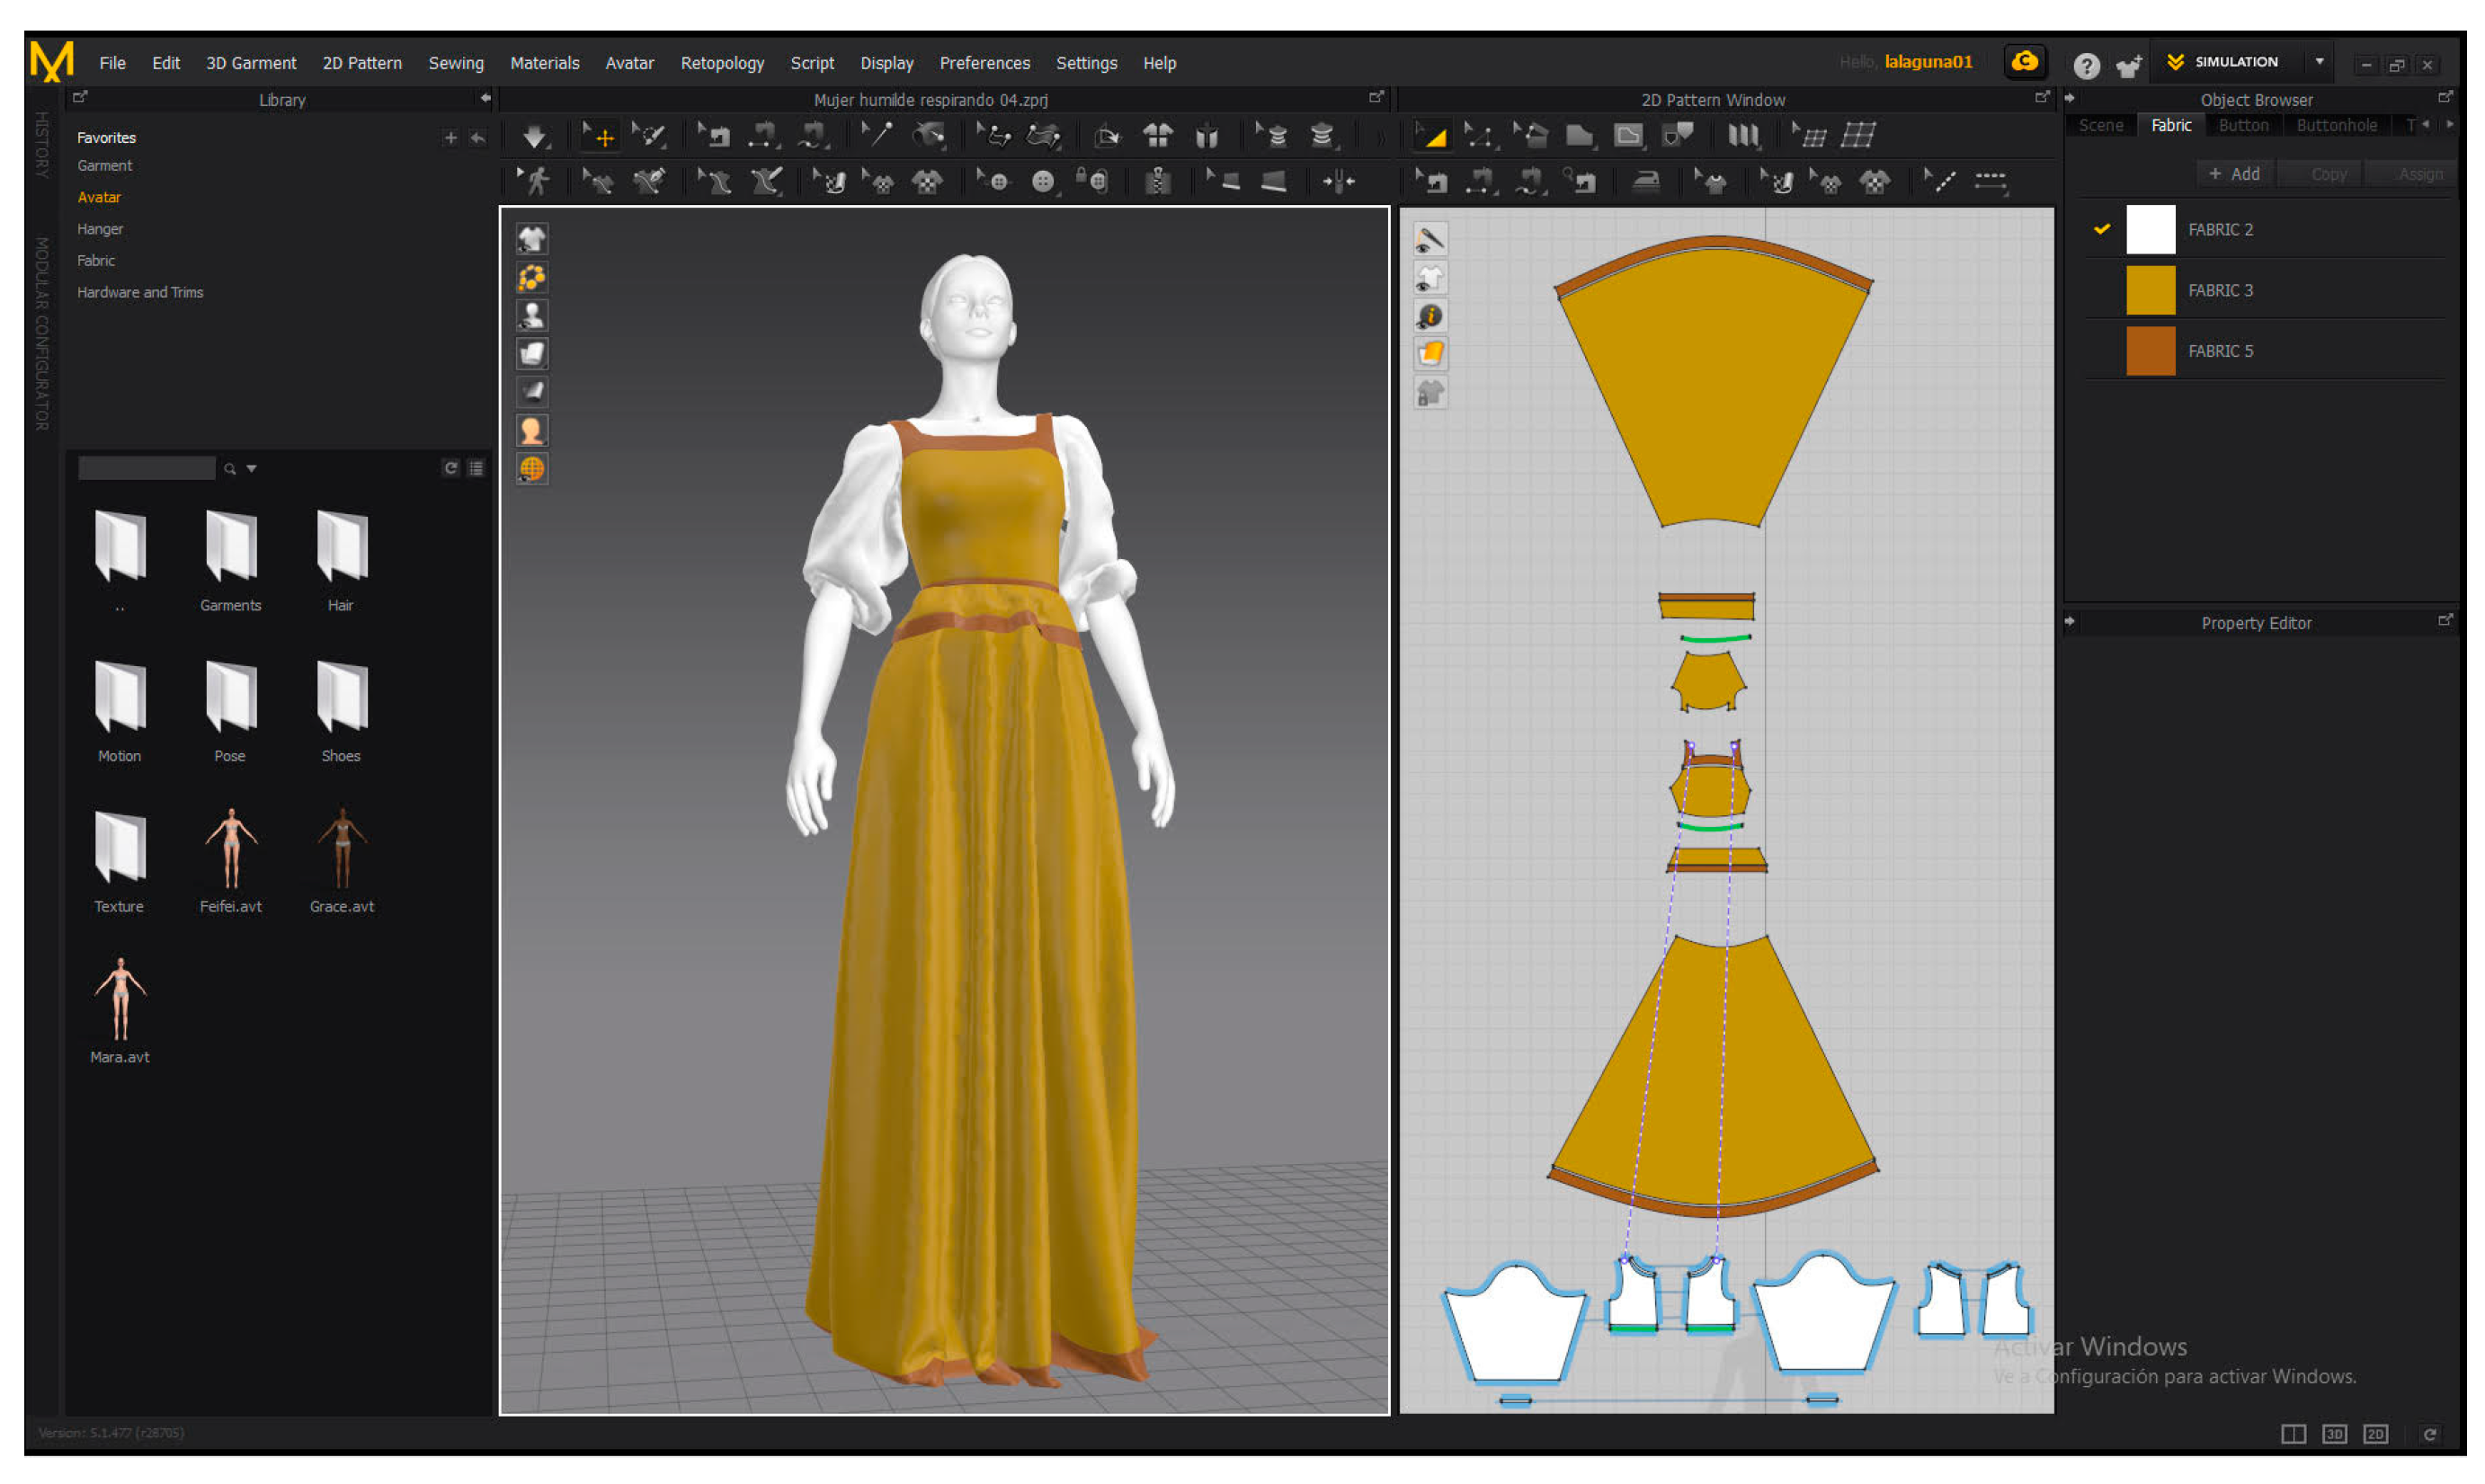
During the creation of 3D models of characters for historical reconstructions, their clothing played a major role in the design process. The Marvelous Designer program was employed to create clothing for the models. This tool is commonly used in the fashion design and entertainment industry, allowing the creation of clothing that mimics the physical qualities of fabrics automatically from a pattern drawing [
46]. The program can customize already incorporated characters, and render variations in colour, shape, texture, and details such as buttons, varying cuts, and different part lengths.
Before designing the clothing, a custom avatar was created using the MakeHuman program. Then, the avatar was imported into the Mixamo application to add a human skeleton to the character automatically and to select a movement from an extensive library of animations. The avatar was adjusted to the T-Pose posture which is necessary to apply the clothing correctly in the Marvelous Designer program [
47].
The first step to creating the clothing for the 3D characters involves importing the pattern of the cloth into Marvelous Designer. Once the pattern is available, the main pieces of clothing are redrawn based on the pattern. The measurements of the clothing pieces are then corrected and adjusted to the proportions of the avatar. Once the different parts of the pattern are in place, they are virtually sewn together to create the complete garment. In addition, the fabric properties of the clothing are selected to ensure the clothing fits with the desired texture and colour on the model’s body (see
Figure 18).
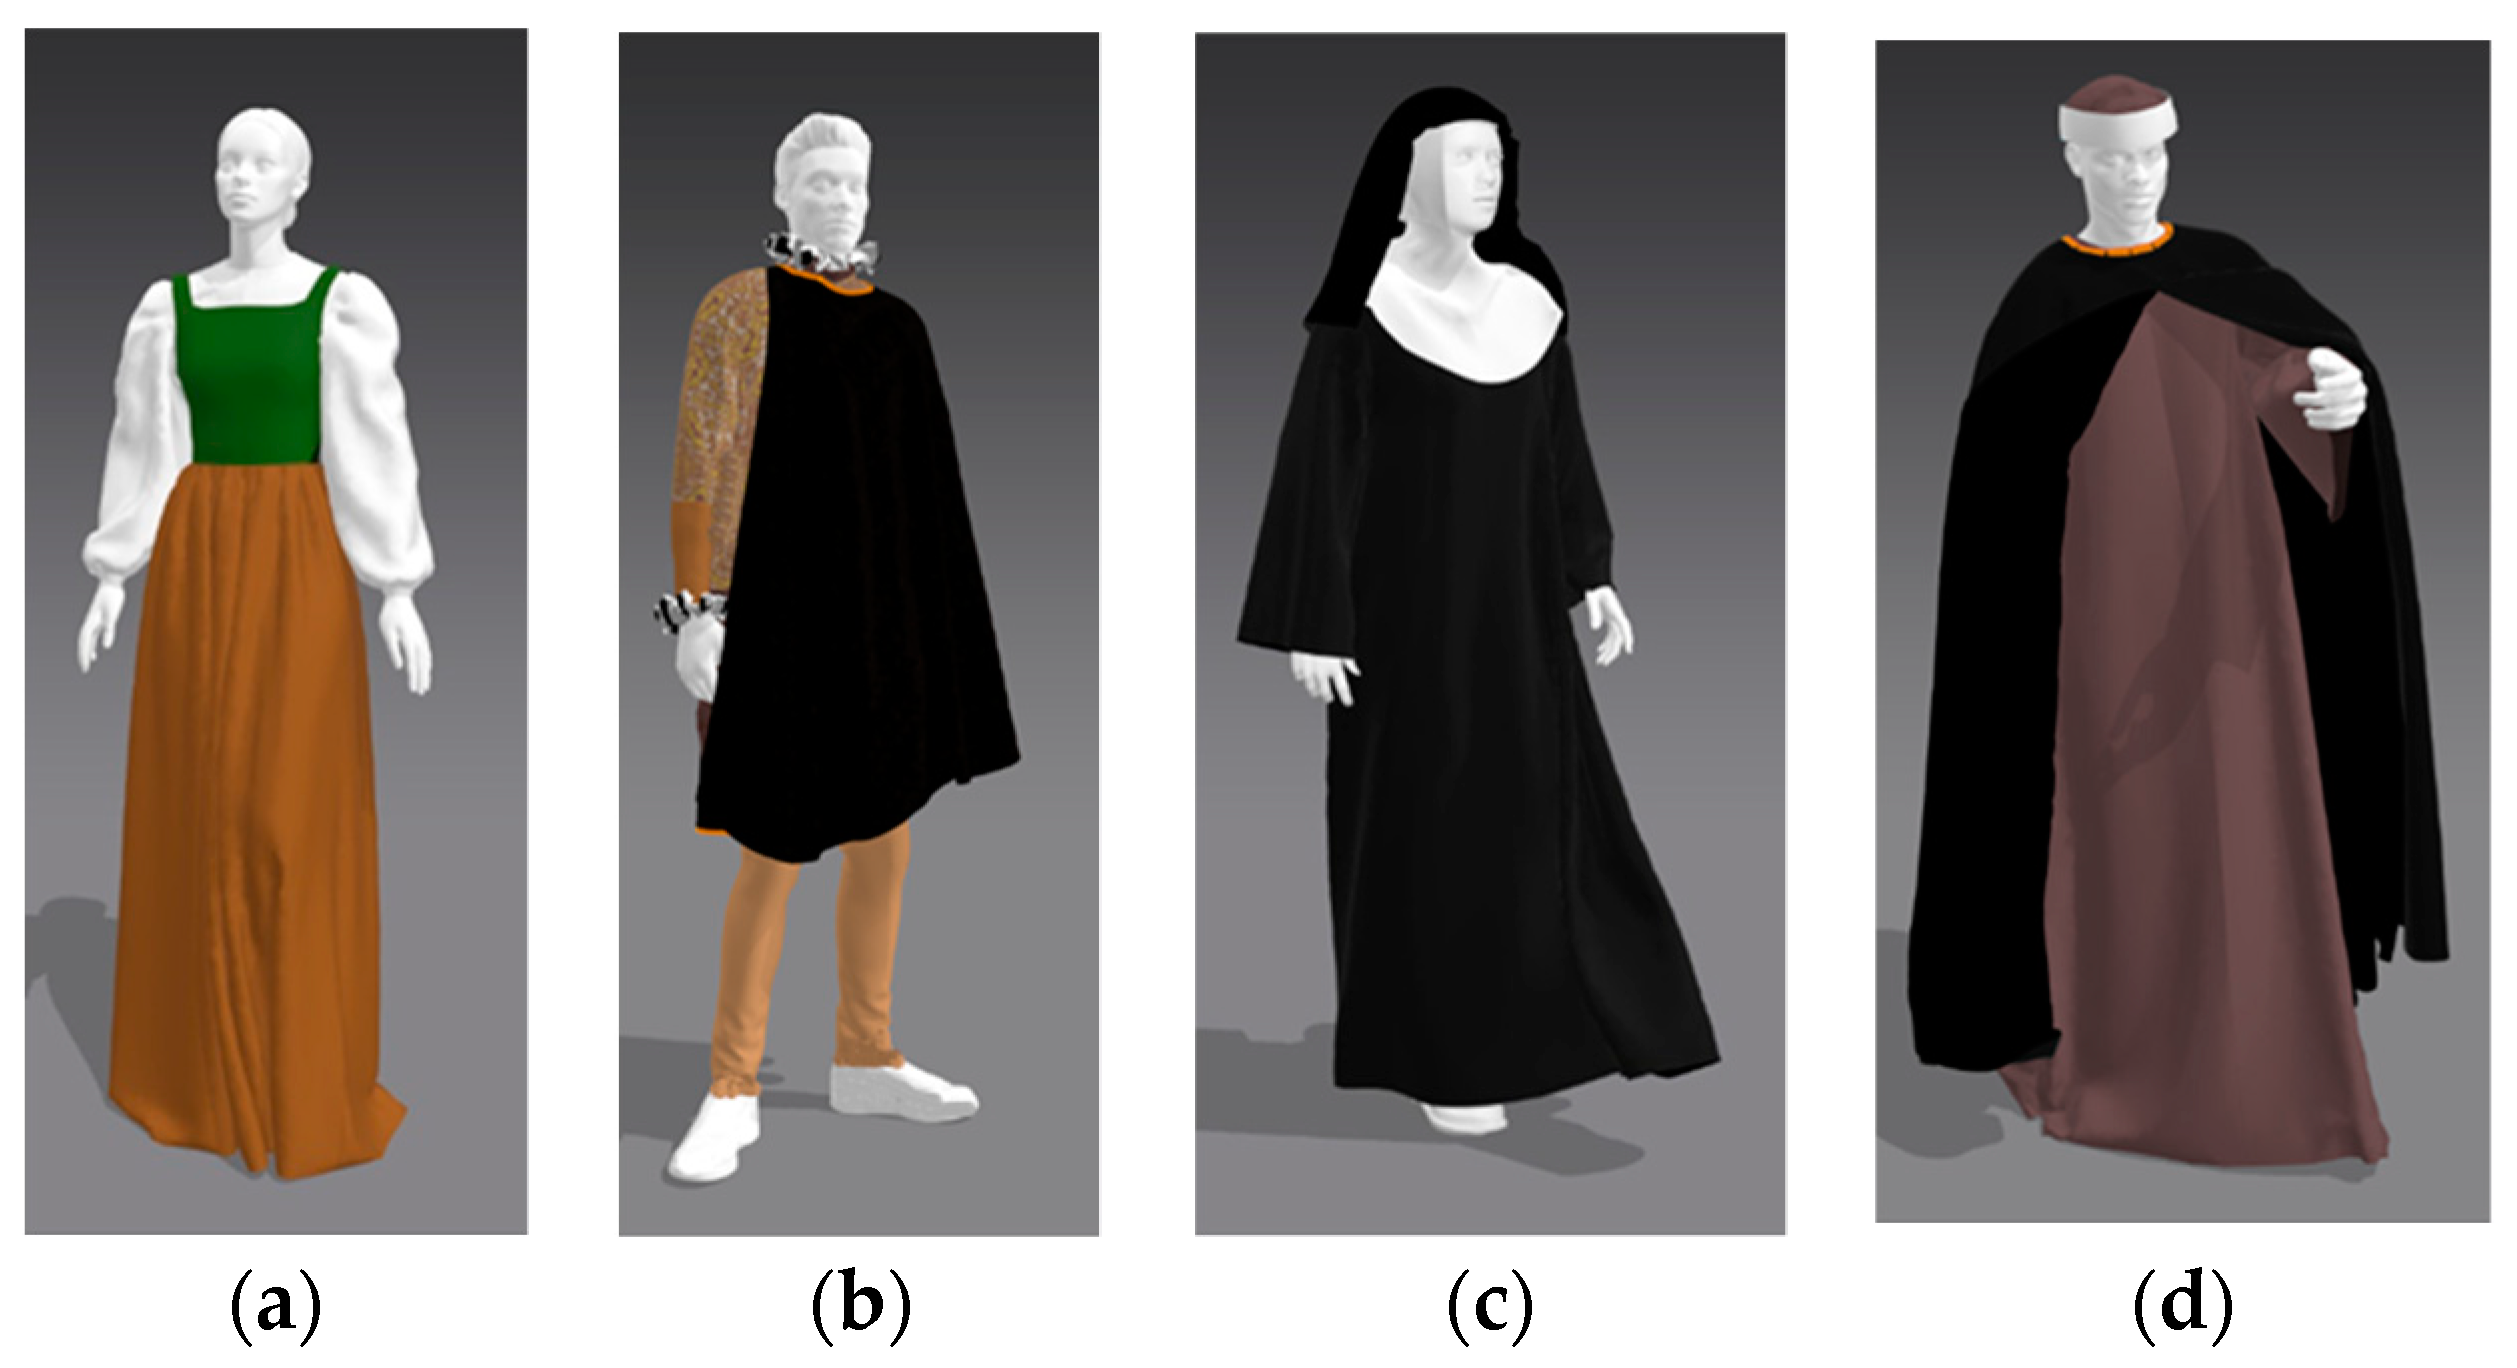
Creating more complex clothing, such as dresses for the noble social strata, requires additional design work and can cause issues when animating the character or incorporating it into the 3D city model. To simplify the designs, some details are eliminated, such as seams, embroidery, and other ornamental features. Instead, a texture is created using image editing programs and applied to flat fabrics to achieve the desired look.
In total, twenty different characters were created, including a guard officer, a Spanish armoured knight, a nurse, a doctor, two women from the middle social strata, two women, a boy and a girl from the less favoured strata, a nun, a Franciscan friar, a Dominican monk, a Cistercian monk, a Carthusian monk, a cleric with a “galdress” cape, two men, and two noble women (see
Figure 19).
2.4.5. 3D Models of Other Elements
The 3D reconstruction of Torriani’s map encompasses not only buildings, terrain, characters, and clothing but also other elements such as walls, bridges, fountains, troughs, religious crosses, and a water conduction system spanning several kilometres as depicted in
Figure 2. This reconstruction process involves the collaboration of a team consisting of a historian and experts in graphic expression, architecture, and graphic computing. The first versions of the models are obtained from Torriani’s map and then refined iteratively to modify geometric characteristics and appearance based on the documentation available in
Section 2.2.4. Drawings or photographs are also used to aid in the design of the models, as shown in
Figure 20.
2.5. Procedural Generation of the City and Visualization
The full 3D description of the city was generated using procedural modelling, a process that utilizes a formal grammar with parameterized production rules to generate detailed 3D objects from simple geometric features [
50,
51]. The process begins by extruding the initial shape to create a 3D model that is subsequently divided into shapes, such as facades and roofs. To create a high-level model, the shapes are further decomposed into several elements such as windows and doors, and textures or colours can be added to these elements. In this project, the CityEngine (CE) software was used for procedural modelling. This program utilizes a computer-generated architecture (CGA) shape grammar that can be further detailed by incorporating external 3D models. Since its initial implementation, CityEngine has been widely used for the procedural modelling of historical cities [
52].
Due to the large area of interest covering approximately 15 km2 and containing around 1300 procedurally generated houses and 16 singular 3D buildings, the houses in the model were kept simple with minimal geometric detail. This was necessary to manage the high volume of data. To compensate for the lack of geometric detail, high-quality textures were applied to the models.
An example of a CGA rule for the house creation process is provided, which includes parametric attributes for the procedural 3D reconstruction of a house as defined in
Table 4. The @enum tag indicates the possible values for the attribute. Then, in the Set_Shape rule, from a general plot shape and depending on several conditions, one of the rules for houses with I form (Ishape), L form (Lshape), L with attached construction form (LC shape), U form (UShape), and O form (Oshape) is fired. Finally, below we can see the rule for IShape that states that a plot for an Ishape house should be subdivided into a base front for the house with depth profC and the remainder of the plot. Then, to generate the base front, the IShapeC rule should be fired, and to generate the back, the remI rule should be fired.
![Applsci 13 04293 i001]()
In our case, CGA rules generate the 3D model of the house according to the parameters defined in
Table 4. The result of the application of the CGA rules for random samples of the five types of houses defined in
Section 2.2.3 is shown in
Figure 21.
The process of generating more than a thousand houses and placing them on city blocks was carried out using procedural modelling. The 3D terrain model surrounding the city was imported, followed by the insertion and placement of singular buildings and other elements of the city. The CE software enabled the integrated generation and manipulation of all 3D elements. However, the rendering abilities of CE are not as advanced as those of specialized rendering software. Therefore, the final scene was exported to Blender to generate all the rendered results.
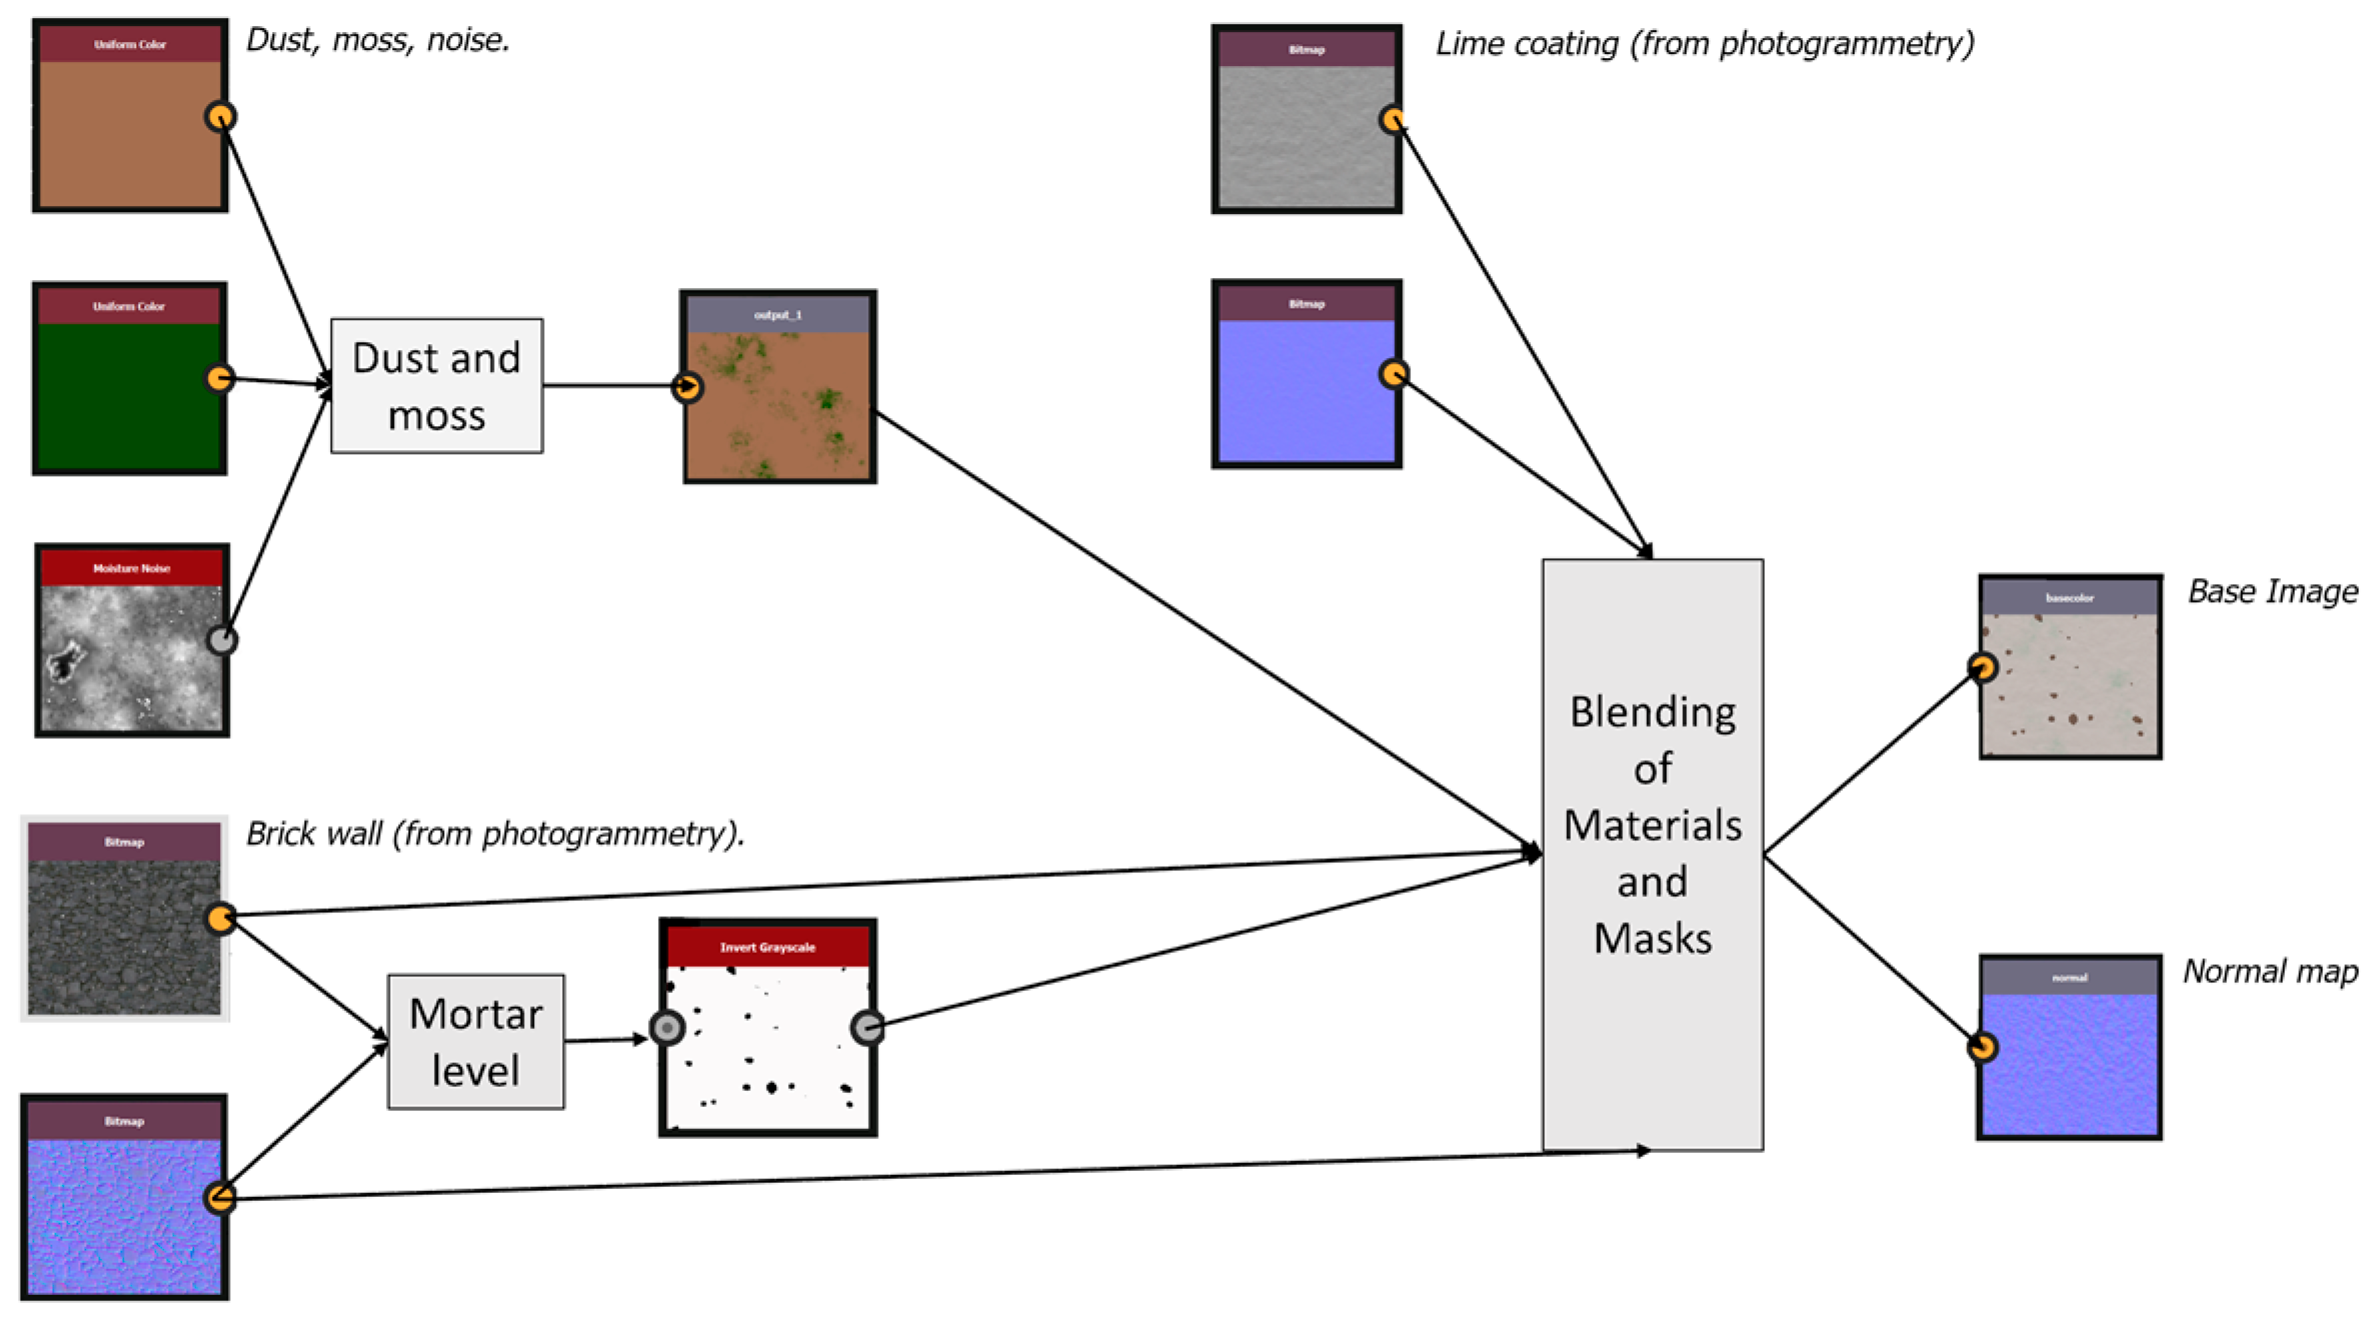
2.6. Texture Generation
To improve the realism of the 3D models, the use of high-quality textures is crucial. The first step to creating textures involves documentation to obtain reference images, 3D models of surfaces, or descriptions of materials to replicate. Two primary texturing techniques were utilized: procedural and image-based texturing. Procedural texturing generates complex textures by combining pre-existing images, synthetic images such as noise and turbulence, and mathematical operators using a set of rules (see
Figure 22). On the other hand, image-based texturing models simpler textures by using pre-existing images as a base and applying a cascade of filters. Each technique was chosen based on the complexity of the texture to be created. After defining the set of textures, UV maps were created to apply them to the 3D models. These maps were procedurally created in CE and the UV editing tools in the 3D modelling software.
3. Results
This project’s results include several 3D and VR visualizations of the city of San Cristóbal de La Laguna. These visualizations were presented at Heritage Night, a national event for all UNESCO world heritage cities in Spain. The event took place at the Convento de Santo Domingo in San Cristóbal de La Laguna on 17 September 2022 [
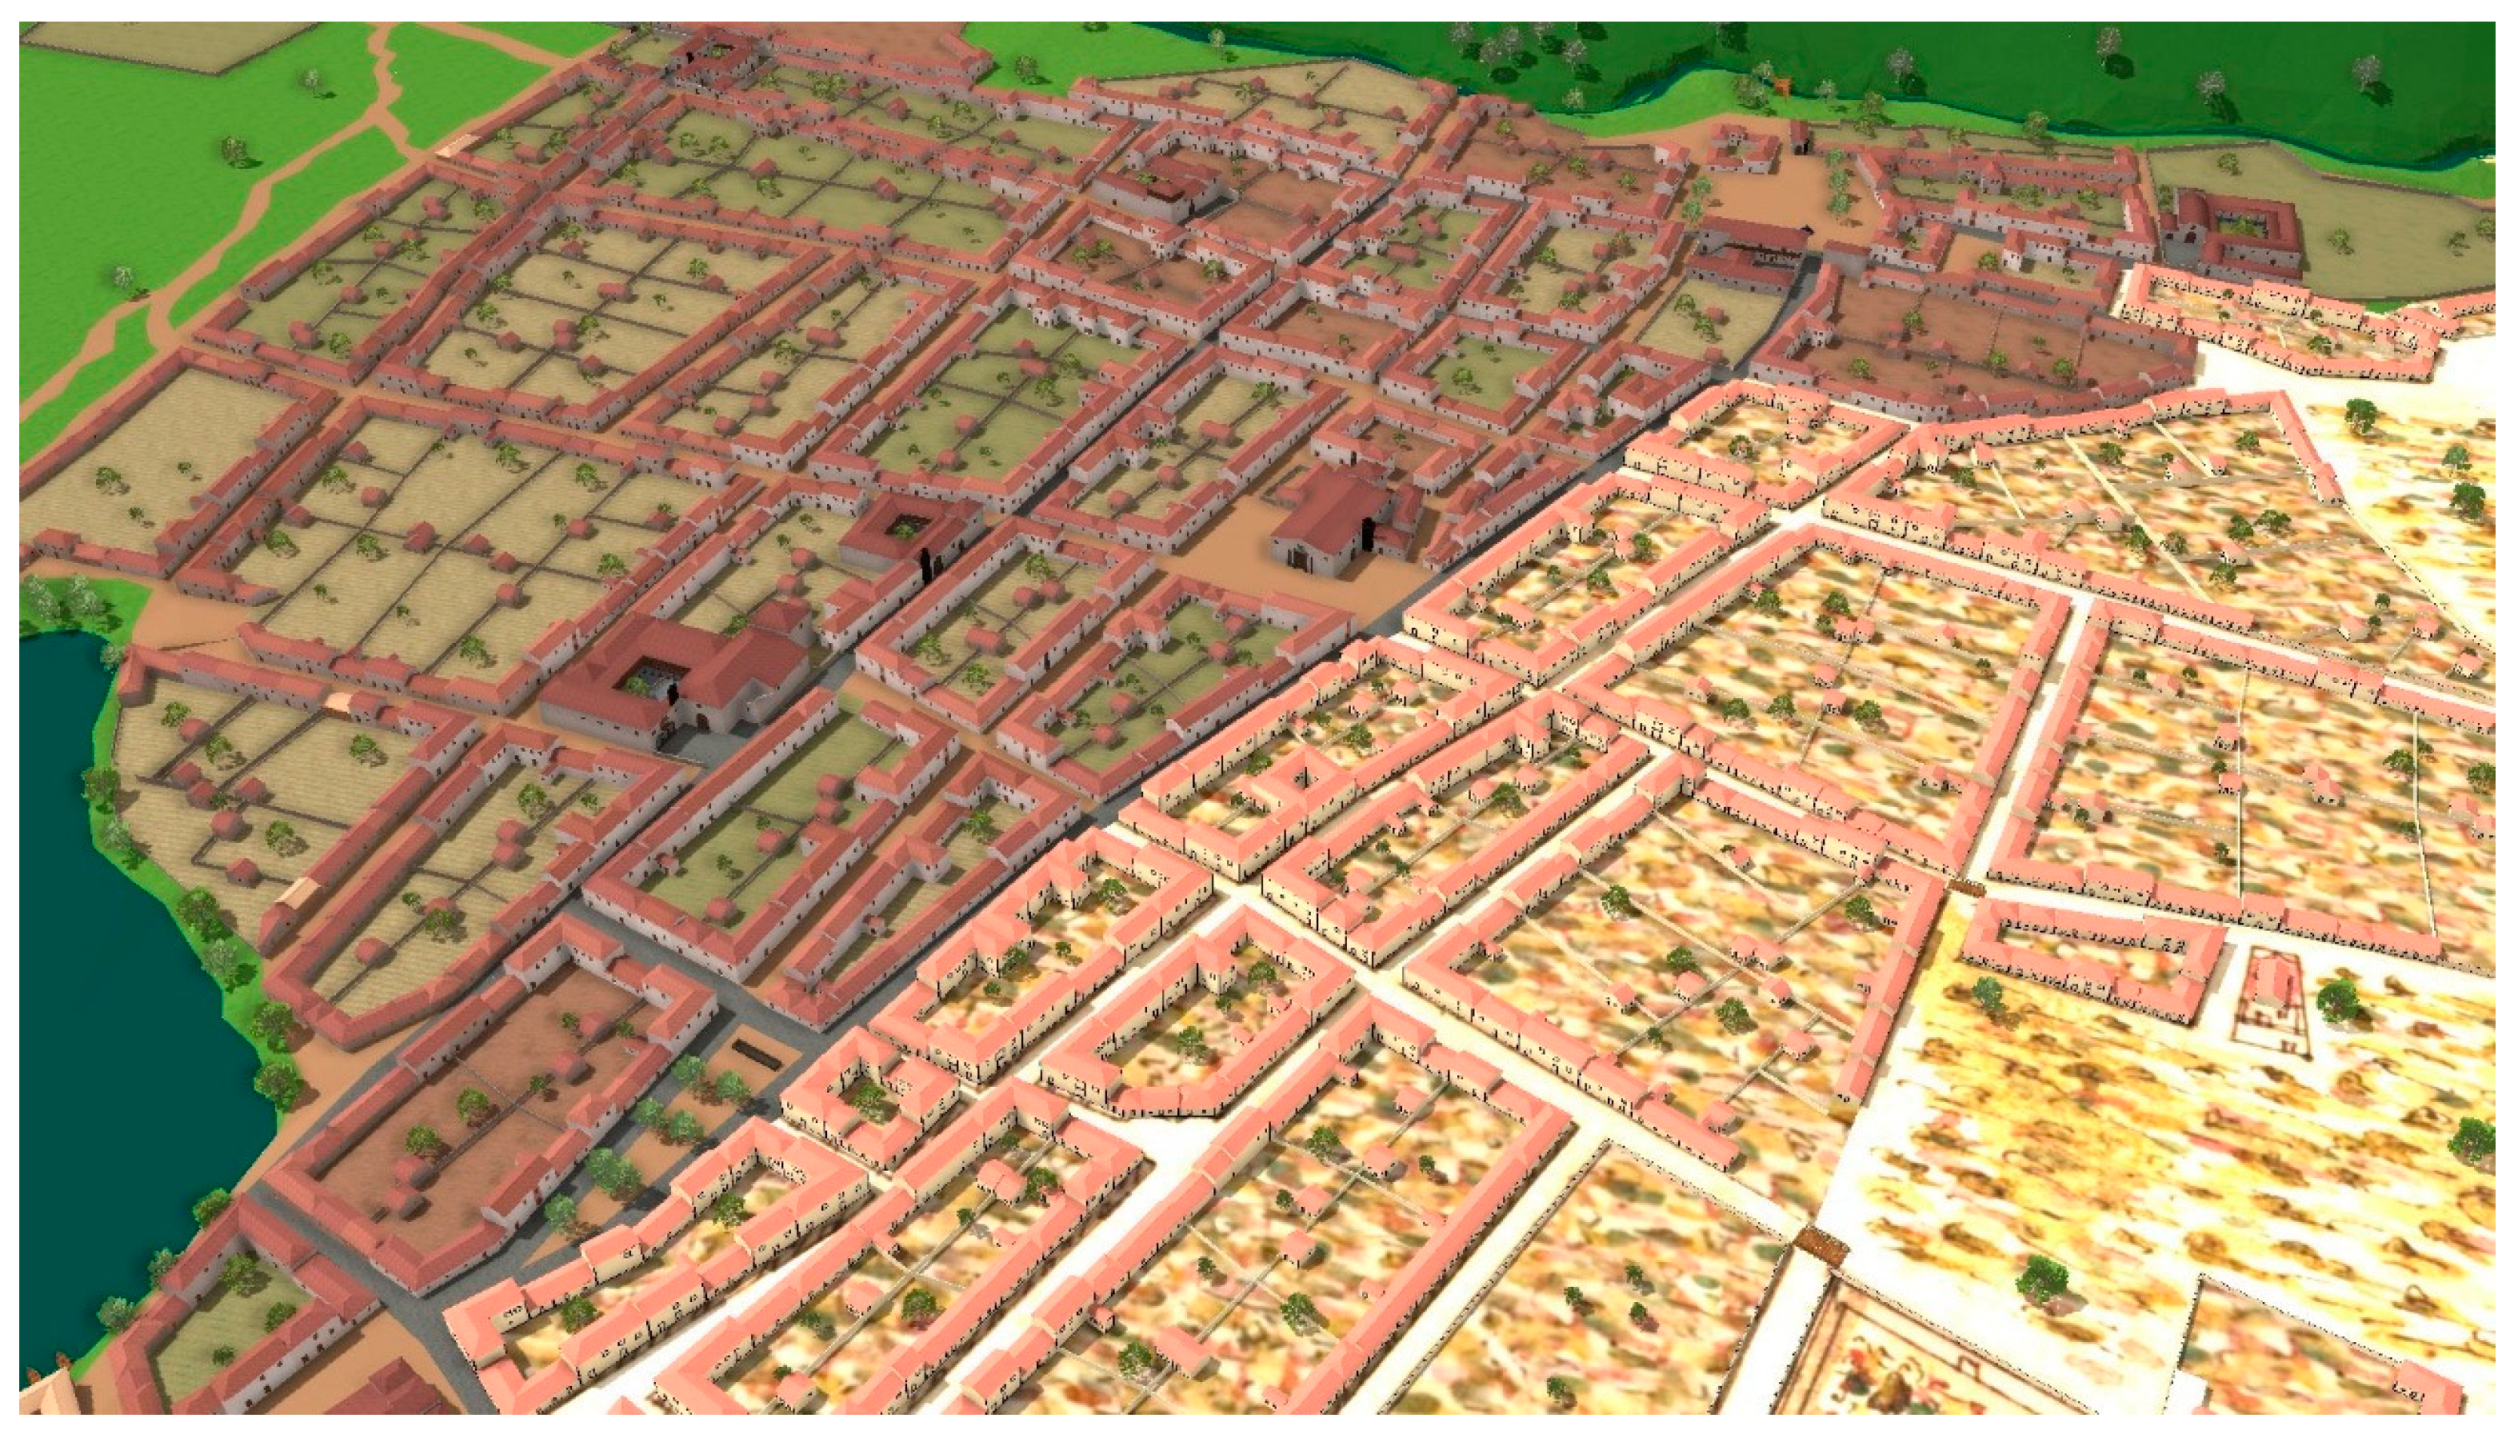
53]. The exhibition comprised several images and videos showing the 3D reconstruction, and the project’s web page was made available at torriani.iaas.ull.es. A rendered image of the complete city reconstruction is shown in
Figure 23 below.
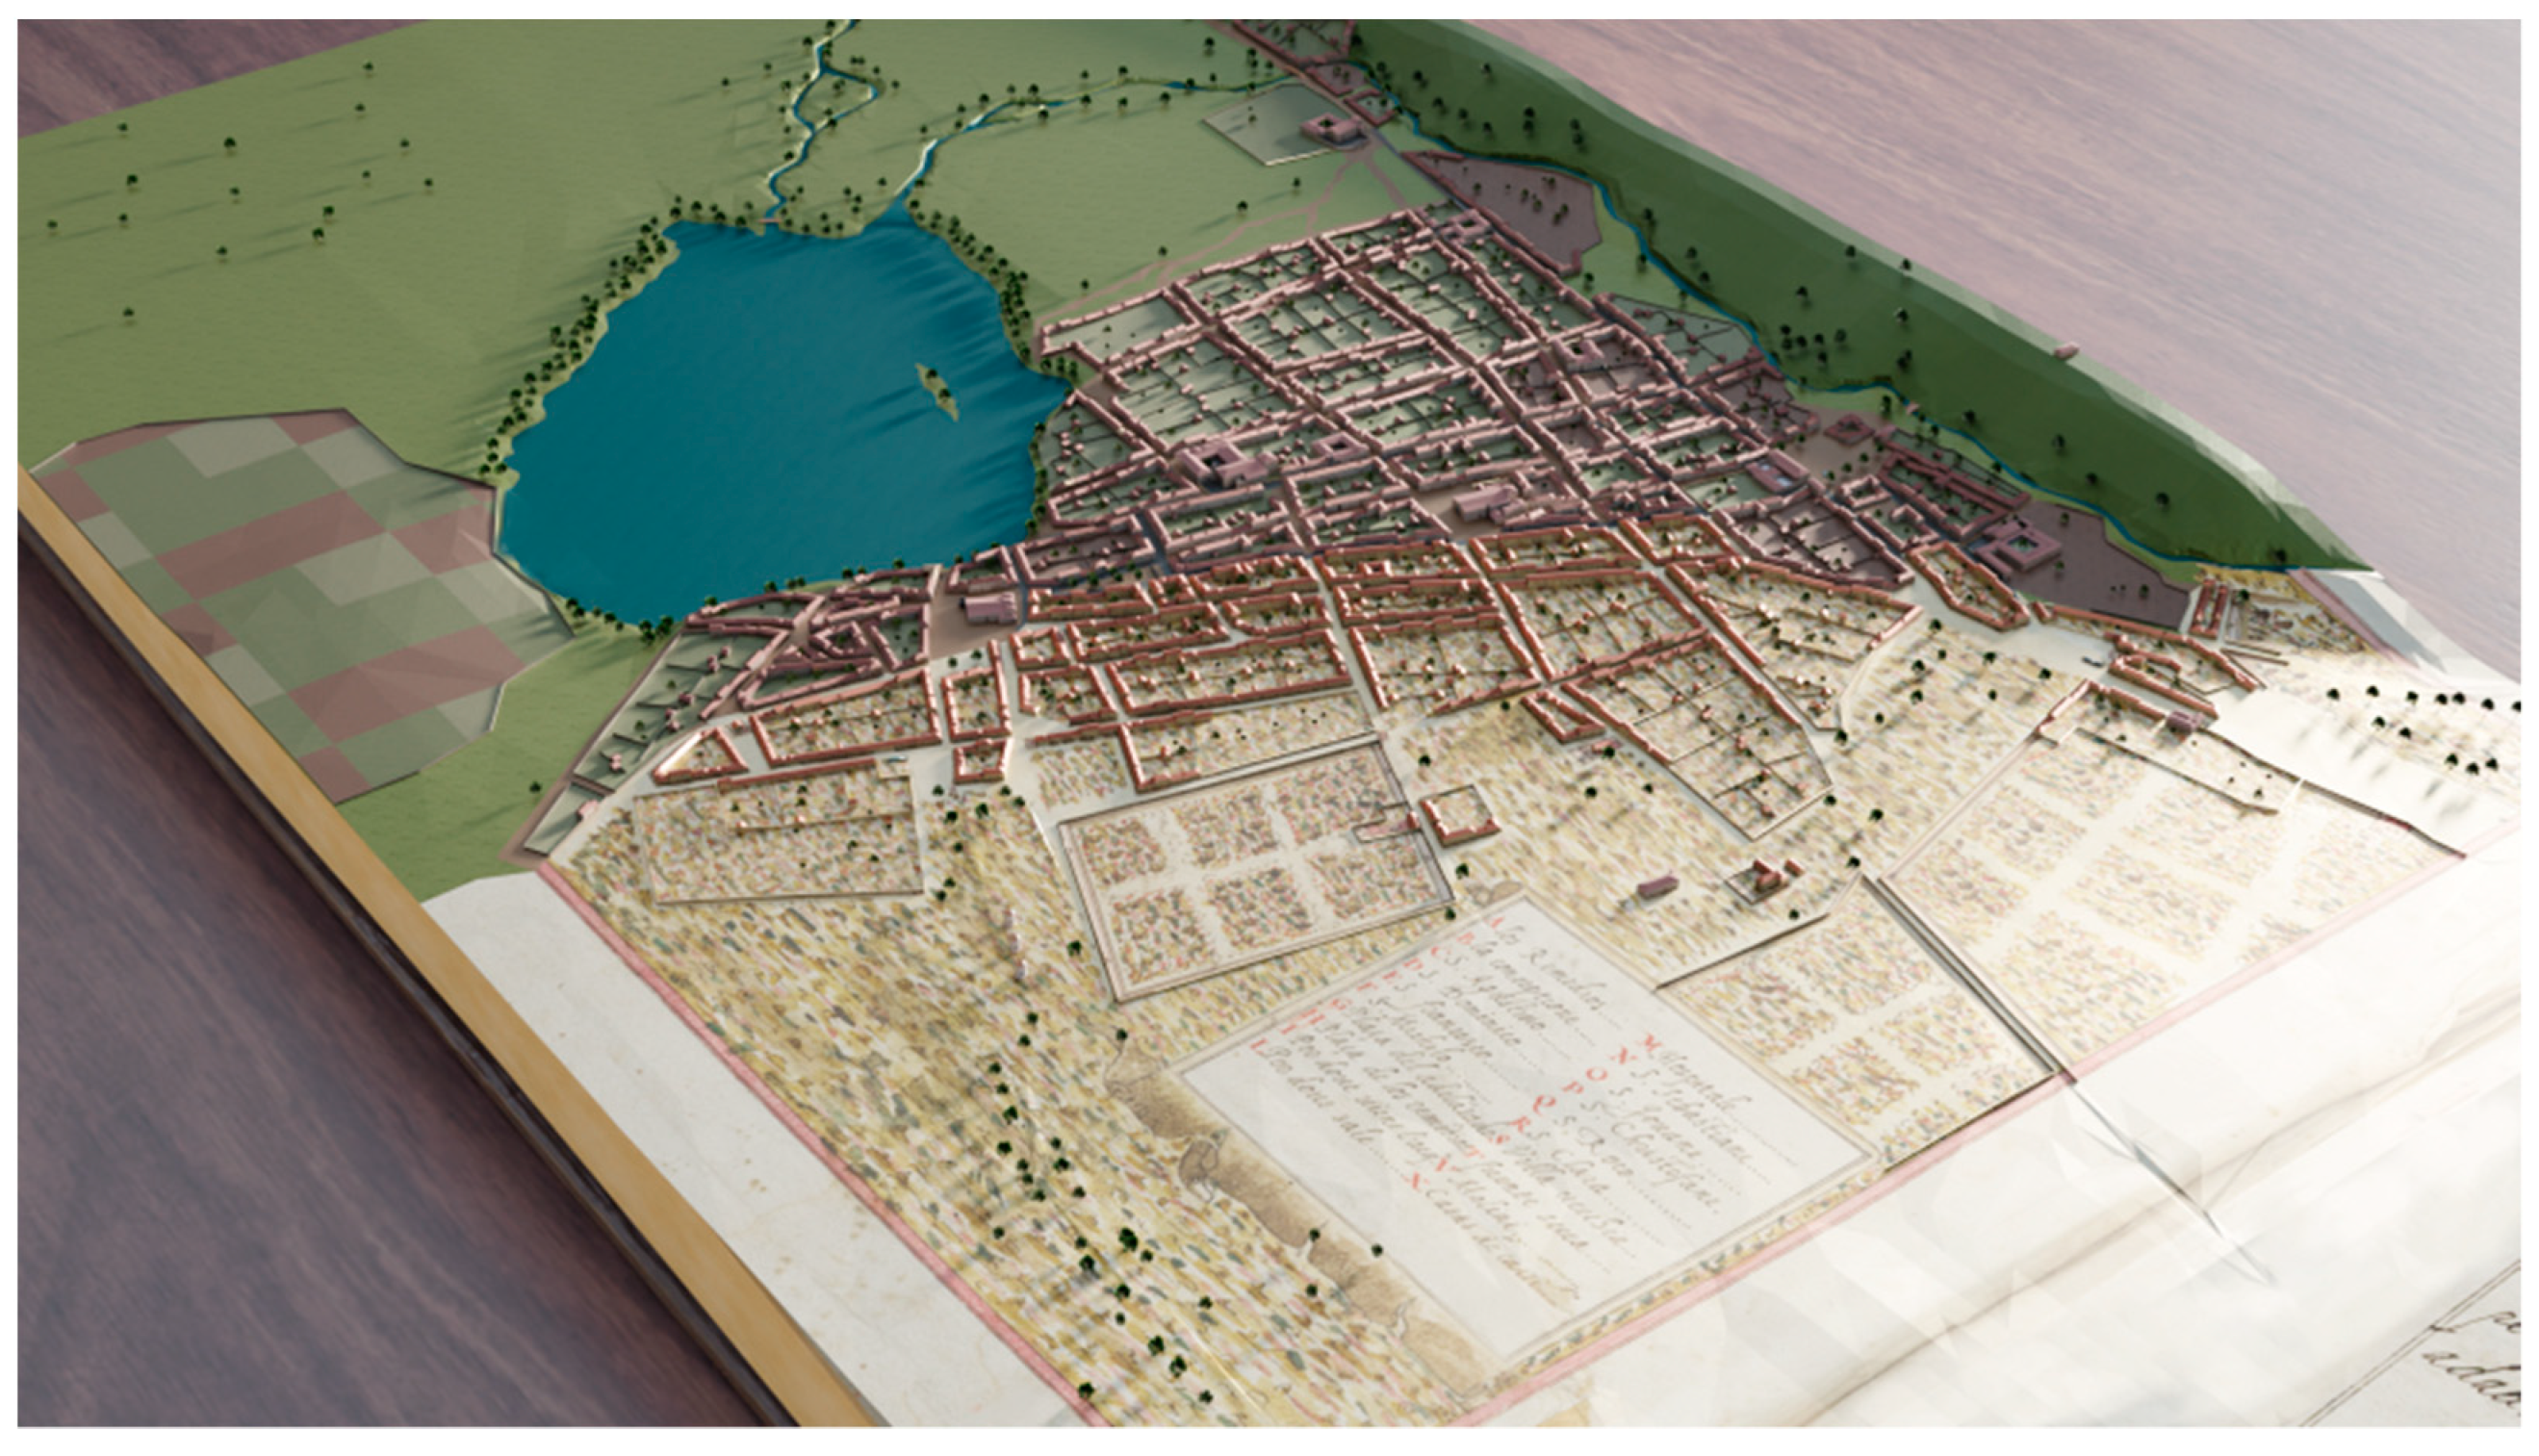
Moreover, since our project is a map-based 3D reconstruction, we wanted to generate some images that highlighted the importance of Torriani’s map in the heritage of the city and its role in the project. We composed a recreation of the page of Torriani’s book [
2] with the map of the city and combined it with our 3D model, as seen in
Figure 24.
One of our objectives was to promote the city’s heritage by emphasizing its layout, which is one of the primary attributes contributing to its UNESCO world heritage city designation. In
Figure 25, we show how the buildings have evolved over five centuries, while the street layout has remained intact.
These general images of the city are complemented on the project webpage by several rendered fly-through videos of the city in 1588.
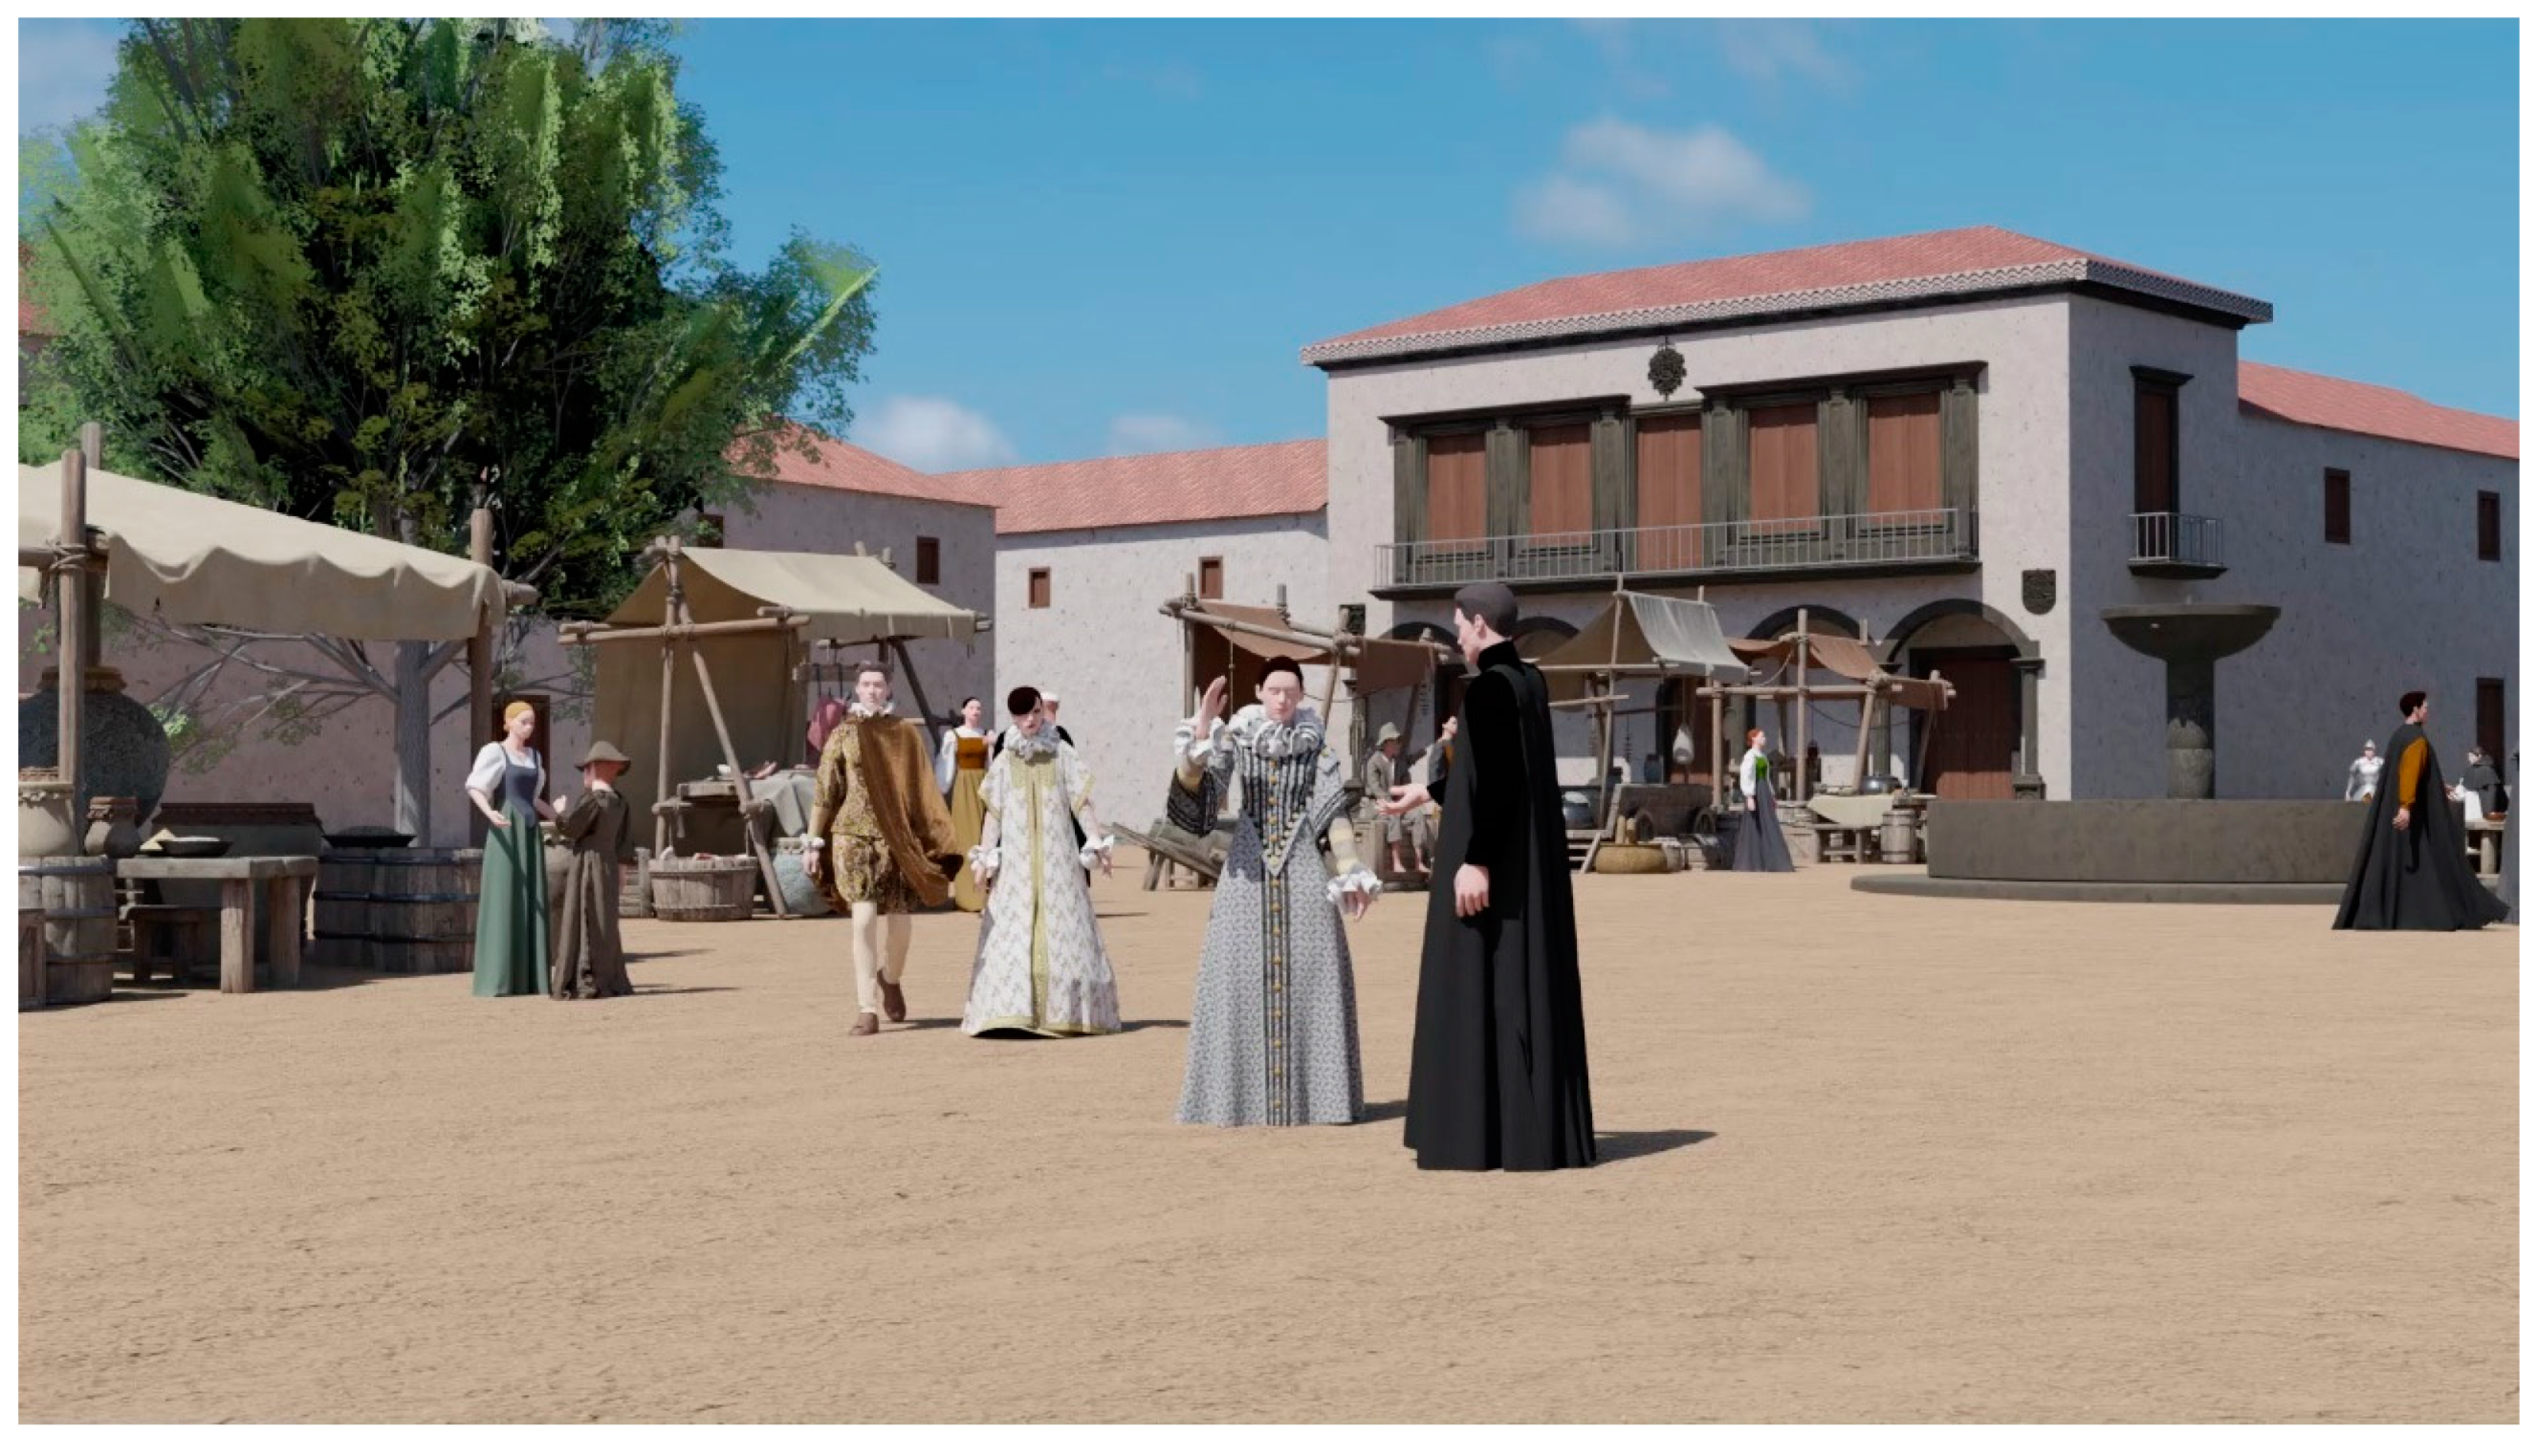
In this project, we wanted not only to provide a general view of the city but also to show a closer view of its buildings and inhabitants. Therefore, we used the characters designed in
Section 2.4.4 and placed them in the city as shown, generating several rendered images and videos, as can be seen in
Figure 26.
The 3D model of the city allows us to easily change several parameters of the rendering process. The weather in the city has not changed too much from Torriani’s time and we wanted to recreate the impression of the city shrouded in cold and fog that is common in winter. This rendered image is shown in
Figure 27.
We aimed to provide users with unrestricted interaction with the 3D model, so we exported the entire 3D scene as a single 3WS file using the CE software and made it available on the project’s web page through the CE Web Viewer (CEWV).
Figure 28 depicts a composition of Torriani’s map and the city during that time, as seen in the 3D viewer. Although other options such as Unity or Unreal Engine offer more comprehensive 3D and VR visualization, the CEWV is better suited for displaying large and complex 3D city models, and its ability to define city landmarks and layers, and simple file handling were also a factor. However, the rendering engine’s simplicity, limited interaction, and the need to preload the entire scene before viewing are the primary drawbacks. The 3D scene’s size is 120 MB, which may result in significant previsualization time. For more complex applications with the 3D model, a more potent solution than CEWV is required. The future works section offers several examples of applications under development that use Unity.
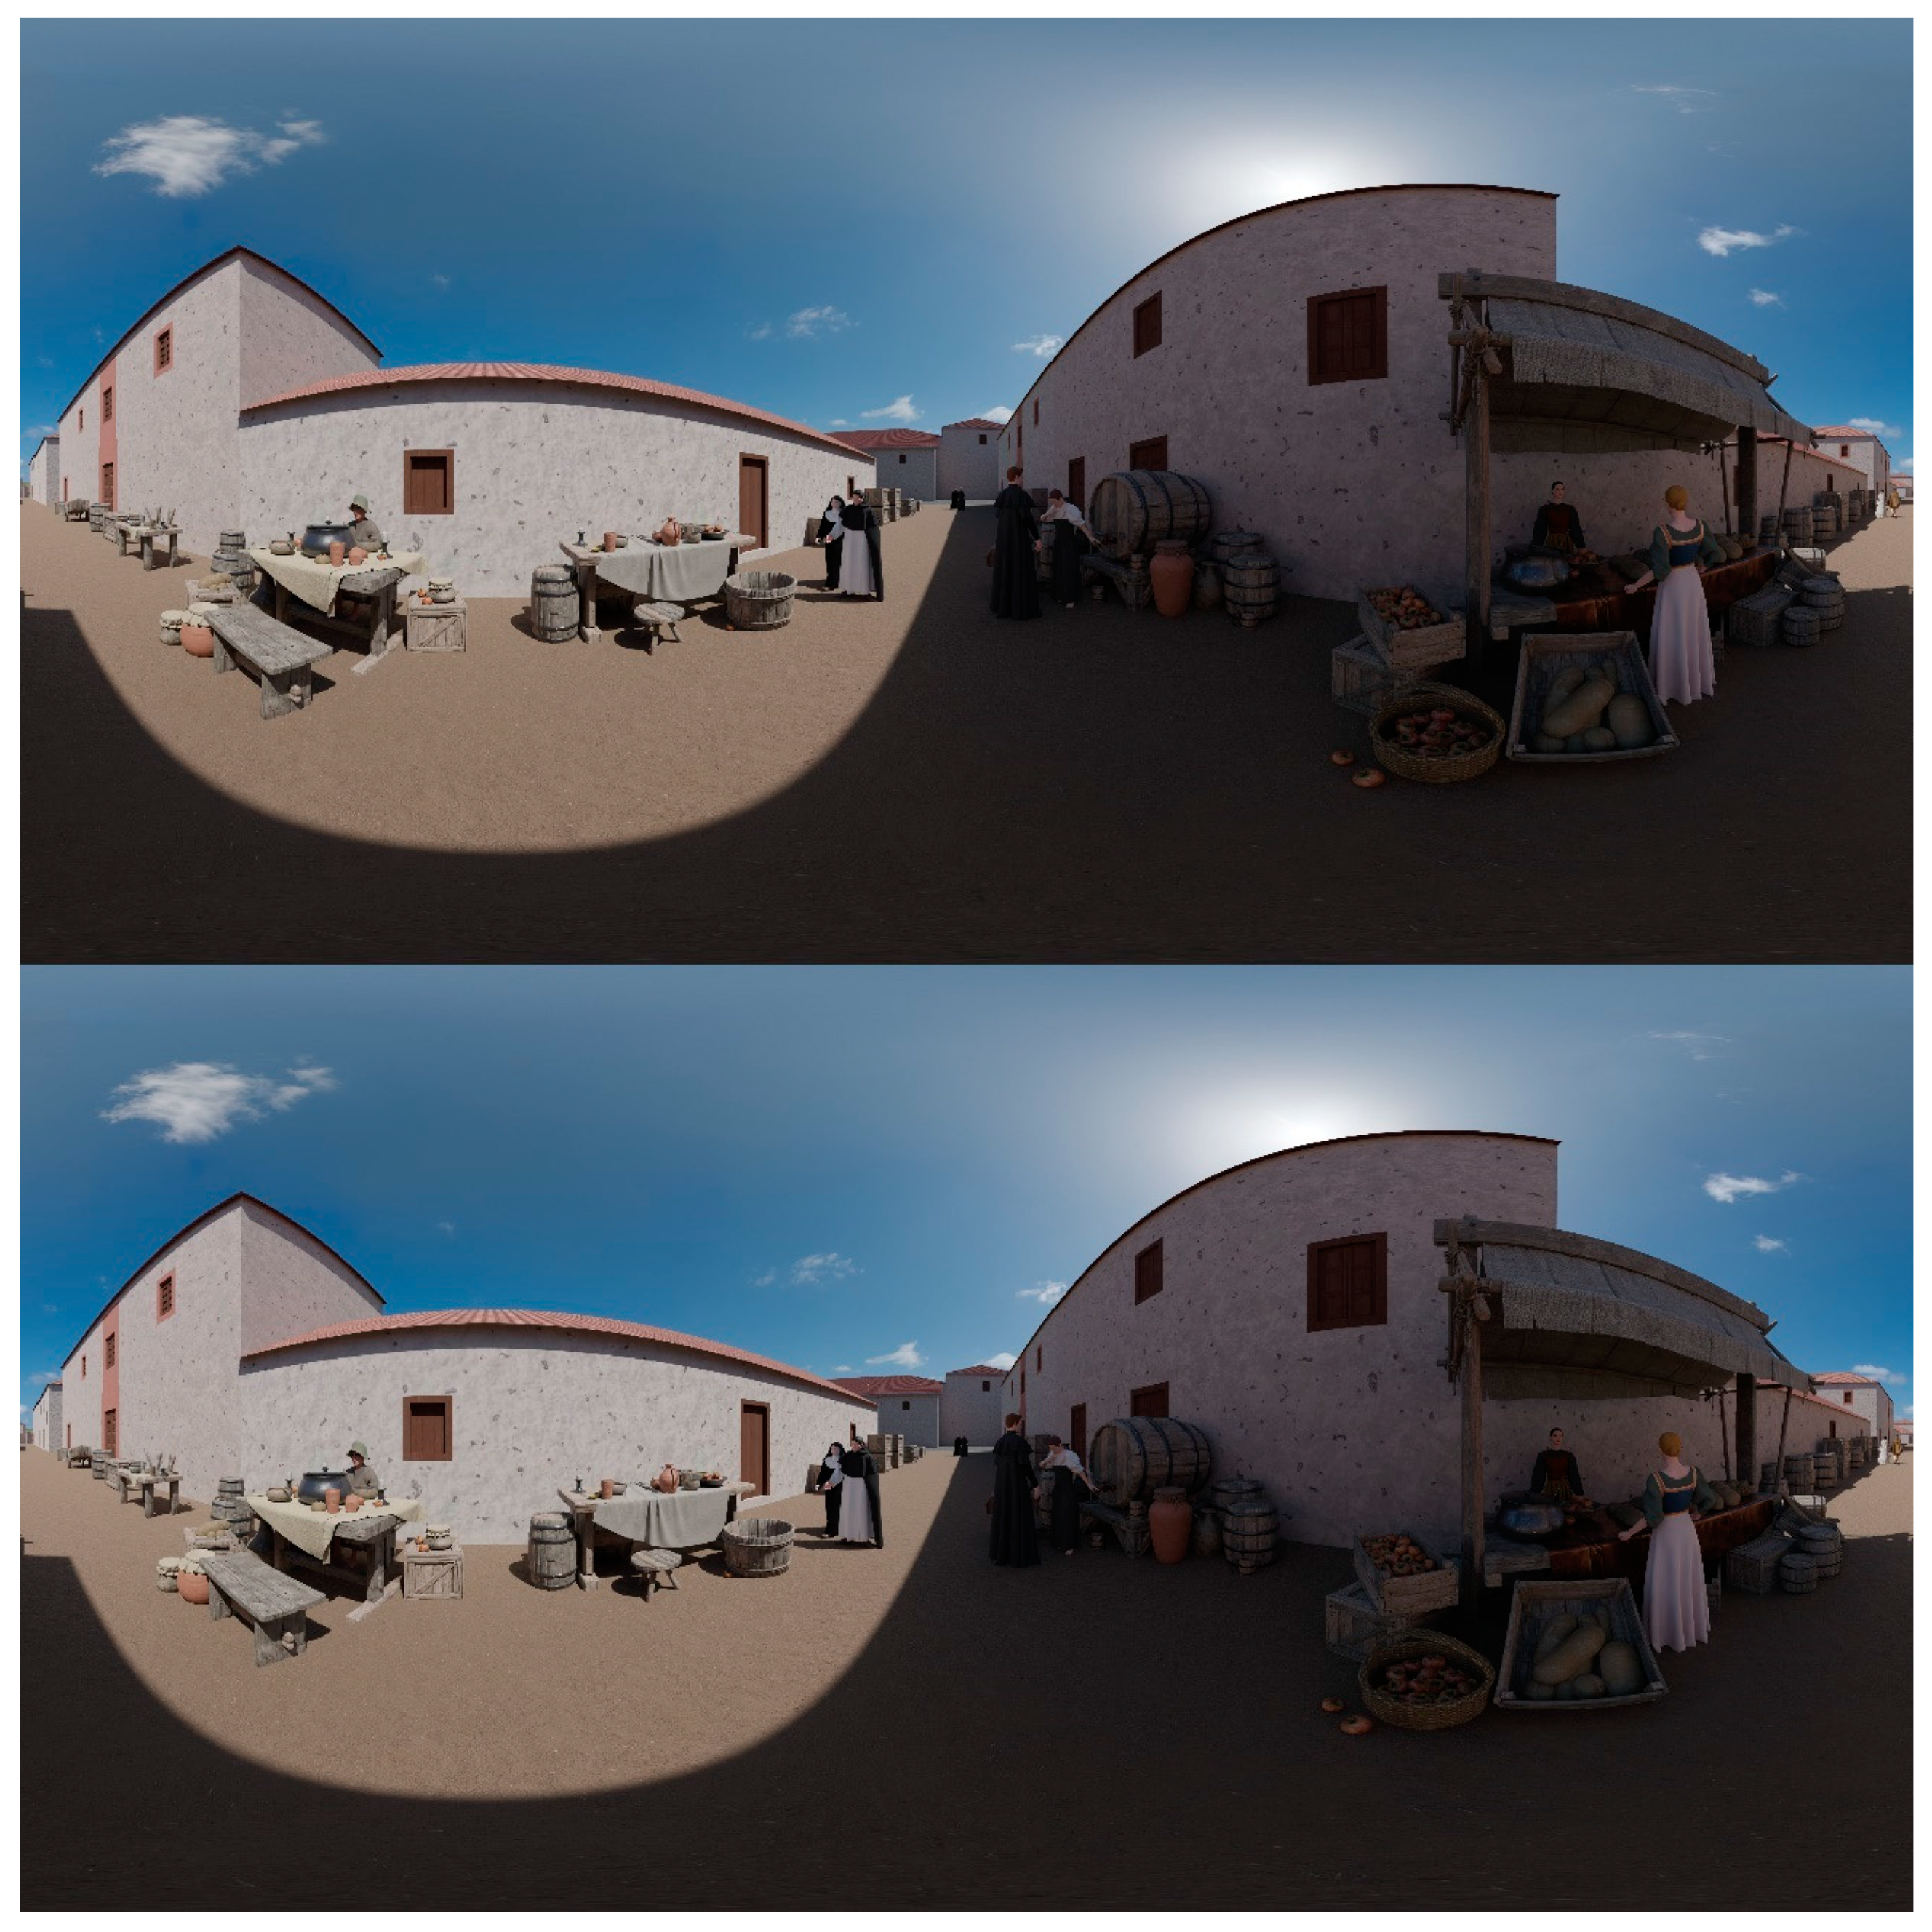
The 3D images and videos created in the project are accessible to the public through web browsers, but they only provide limited immersion in the historical environment. To address this limitation, we generated a set of 360° image and video renderings suitable for presentation in VR headsets [
54]. These headsets consist of a head-mounted display and two controllers that sense head and hand movements, providing a more immersive experience than images and videos. The Meta Quest 2 headset was used in this project, and an example of the results can be seen in
Figure 29.
The impact of the project results has been significant, as the reconstructed videos have helped to disseminate the city’s heritage through coverage on national and regional radio and television networks. The rendered images have also been used in various newspapers to accompany project explanations. Finally, the VR images were presented with a VR headset at the European Researchers’ Night in San Cristóbal La Laguna [
55].
4. Discussion and Future Works
4.1. Discussion
This project is centred around San Cristóbal de La Laguna and its surrounding area during the 16th century. It is significant as it represents the first historical 3D reconstruction of a city in the Canary Islands. The project proposes a methodology for reconstructing historical cities that primarily relies on graphic documentation, consisting of a map from the period. Several crucial methodological issues are highlighted, with initial emphasis placed on the documentation phase. This phase provides essential information on the historical and geographical context, building design and construction techniques, and the appearance of the inhabitants. Such knowledge is essential for ensuring the most accurate recreation possible, especially when direct remains are scarce.
The modelling process is also a fundamental element of the methodology. It involves a 2D layer decomposition of the spatial elements found on the historical map, such as blocks, streets, and vegetable gardens. However, the use of historical maps inevitably creates a lack of metric correspondence with the coordinates on the ground. This issue is resolved by georectifying the map, resulting in a geographic model based on 2D layers with geographic coordinates.
To reconstruct the city, we have developed a probabilistic generative model for the houses, which is guided by the graphic study of the houses on Torriani’s map and available historical information. Our generative model has desirable characteristics such as generality, variability, and faithfulness, which enable it to generate the five types of houses in the city, a large number of different houses for each type, and be faithful to the model of buildings at that time. We have also addressed the placement of the houses on the city blocks extending existing algorithms to cope with plot subdivision constraints defined by walls from other plots or empty spaces.
Modelling singular buildings, the most significant ones in the city, has been another critical aspect. In our case, we generated these buildings based solely on the ground outline that appears on the map. The documentation process has been crucial in generating hypotheses about their appearance, employing drawings, old photographs, and the appearance of current buildings.
In addition to the focus on reconstructing the physical city, this project also emphasizes the importance of capturing the daily life of its inhabitants. To achieve this, we have created models of various characters to be incorporated into the 3D model, allowing the recreation of everyday scenes. This approach provides a more complete and integrated description of what the city was like during the 16th century.
In a project as complex as this one, it is necessary to use various software programs, as detailed in
Table 1. Choosing the correct software tools offers important advantages in terms of efficiency, although some interoperability problems between different programs and formats need to be solved.
To reconstruct a city, several types of 3D modelling tools have been used. The use of a procedural generation program is inevitable given the large number of houses in the city, making their manual elaboration costly. Procedural modelling offers the advantage of being parametric, allowing the verification of different historical hypotheses by varying the characteristics of the elements in the reconstructions. However, it can be challenging to describe complex buildings using CGA rules, and it has a steep learning curve.
For modelling complex buildings, a BIM program was used due to its more advanced parametric capabilities compared to traditional modelling techniques. Building elements can be parametrically linked to other elements in BIM, allowing changes to be automatically updated throughout the model. This saves time when additional documentary sources induce changes that affect multiple parts of the building. However, BIM makes extensive use of standard libraries for construction elements, and non-standard elements such as doors or windows in singular buildings are easier to model using traditional techniques.
The project has demonstrated the potential of modern technologies to significantly enhance our understanding of ancient maps. By using 3D modelling software, we can create digital representations of these maps that offer a more detailed and complete view of them. For instance, in the case of Torriani’s map, we have added reconstructions of houses and singular buildings, which have enhanced our comprehension of their construction and use. The detailed documentation and models used in the reconstruction provide a visual hypothesis for the historical debate about the design, dimensions, materials, or construction systems of the period in question.
Furthermore, 3D modelling can be used to analyse the techniques and tools used to create ancient maps. It is possible to study and correct the geometric and historical inaccuracies of these maps. For example, in our case, we corrected the position of the mountains surrounding the city and moved one of the singular buildings wrongly placed by Torriani to its correct position. Comparing ancient maps with modern maps using 3D modelling and other technologies can provide insights into how the geography of a region has changed over time and how people related to their environment. For instance, in our case, the presence of the lagoon in the reconstruction helped us understand its relationship with the city and the changes in the development of that city area when it was desiccated.
Finally, with the use of VR technology, we can create immersive experiences that allow us to explore the city and its landscapes in a more engaging way. The VR images and videos of the city provide a more immersive experience of the city’s layout and architecture than simply examining a 2D map or photo.
4.2. Future Works
The 3D model of San Cristóbal de La Laguna which has been created will serve as a basis for creating cultural heritage applications. Two different products are currently in development.
The first product is a VR-guided tour of San Cristóbal de La Laguna, based on the map from 1588. Users will have the ability to explore various parts of the city and receive information from virtual characters about its history and important features. The tour will offer multiple modes of navigation, including free movement, teleportation, and guided options. The visit will be divided into different scenarios, with a subset of virtual characters in each scenario, depending on the context.
The second product is an augmented reality mobile application that combines the 16th-century city with the present one. The application will use location and orientation sensors on mobile devices to superimpose the 3D model over the current city, illustrating the changes over time. The application will have a guidance system that visually directs users to various points of interest based on their location. When users arrive at these points, the virtual characters present in the city at that time will narrate information related to them.
5. Conclusions
Our paper details a methodology for reconstructing historical cities when a map is the primary visual resource and archaeological remains are scarce. We applied this methodology to the 16th-century map of San Cristóbal de Laguna and divided the workflow into documentation, 2D and 3D processing and modelling, procedural generation, and visualization. Through our experience, we found that historical documentation is crucial, and a multidisciplinary team is necessary to overcome the challenges caused by the transformation of the city over time. Usually, it is unfeasible to digitize versions corresponding to the period of interest for buildings, urban elements, landscapes, clothing, etc. This lack of sources of direct information needs to be compensated for by information from historical professionals and knowledge from construction experts and engineers to obtain a precise approximation of the configuration of the city at that time. Given the large number of software programs required for a project of this complexity, experts in computer science are necessary for their use, adjustment, and interoperability. These programs have been used to transfer the city characteristics defined in the documentation to a visual 3D model using procedural generation. Finally, experts in computer graphics are needed to generate the final results by rendering the 3D model to obtain images, videos, and virtual reality results.
Our methodology’s utility and its application to San Cristóbal de Laguna have been validated by the positive response that the project results have received in scientific and dissemination forums. Our 3D reconstruction provides visual results such as images, videos, or 3D web viewers that can be accessed on the project website to promote the city’s heritage. It also raises the possibility of creating 3D content in forms of special relevance in the dissemination of cultural heritage, such as AR and VR products. Our methodology can guide the reconstruction of other cities from the same or later periods, provided there is a map available as a starting point.


 ,
, 


