
A Hybrid CNN-LSTM Random Forest Model for Dysgraphia Classification from Hand-Written Characters with Uniform/Normal Distribution


 , and
, and
Abstract
:1. Introduction
2. Literature Review
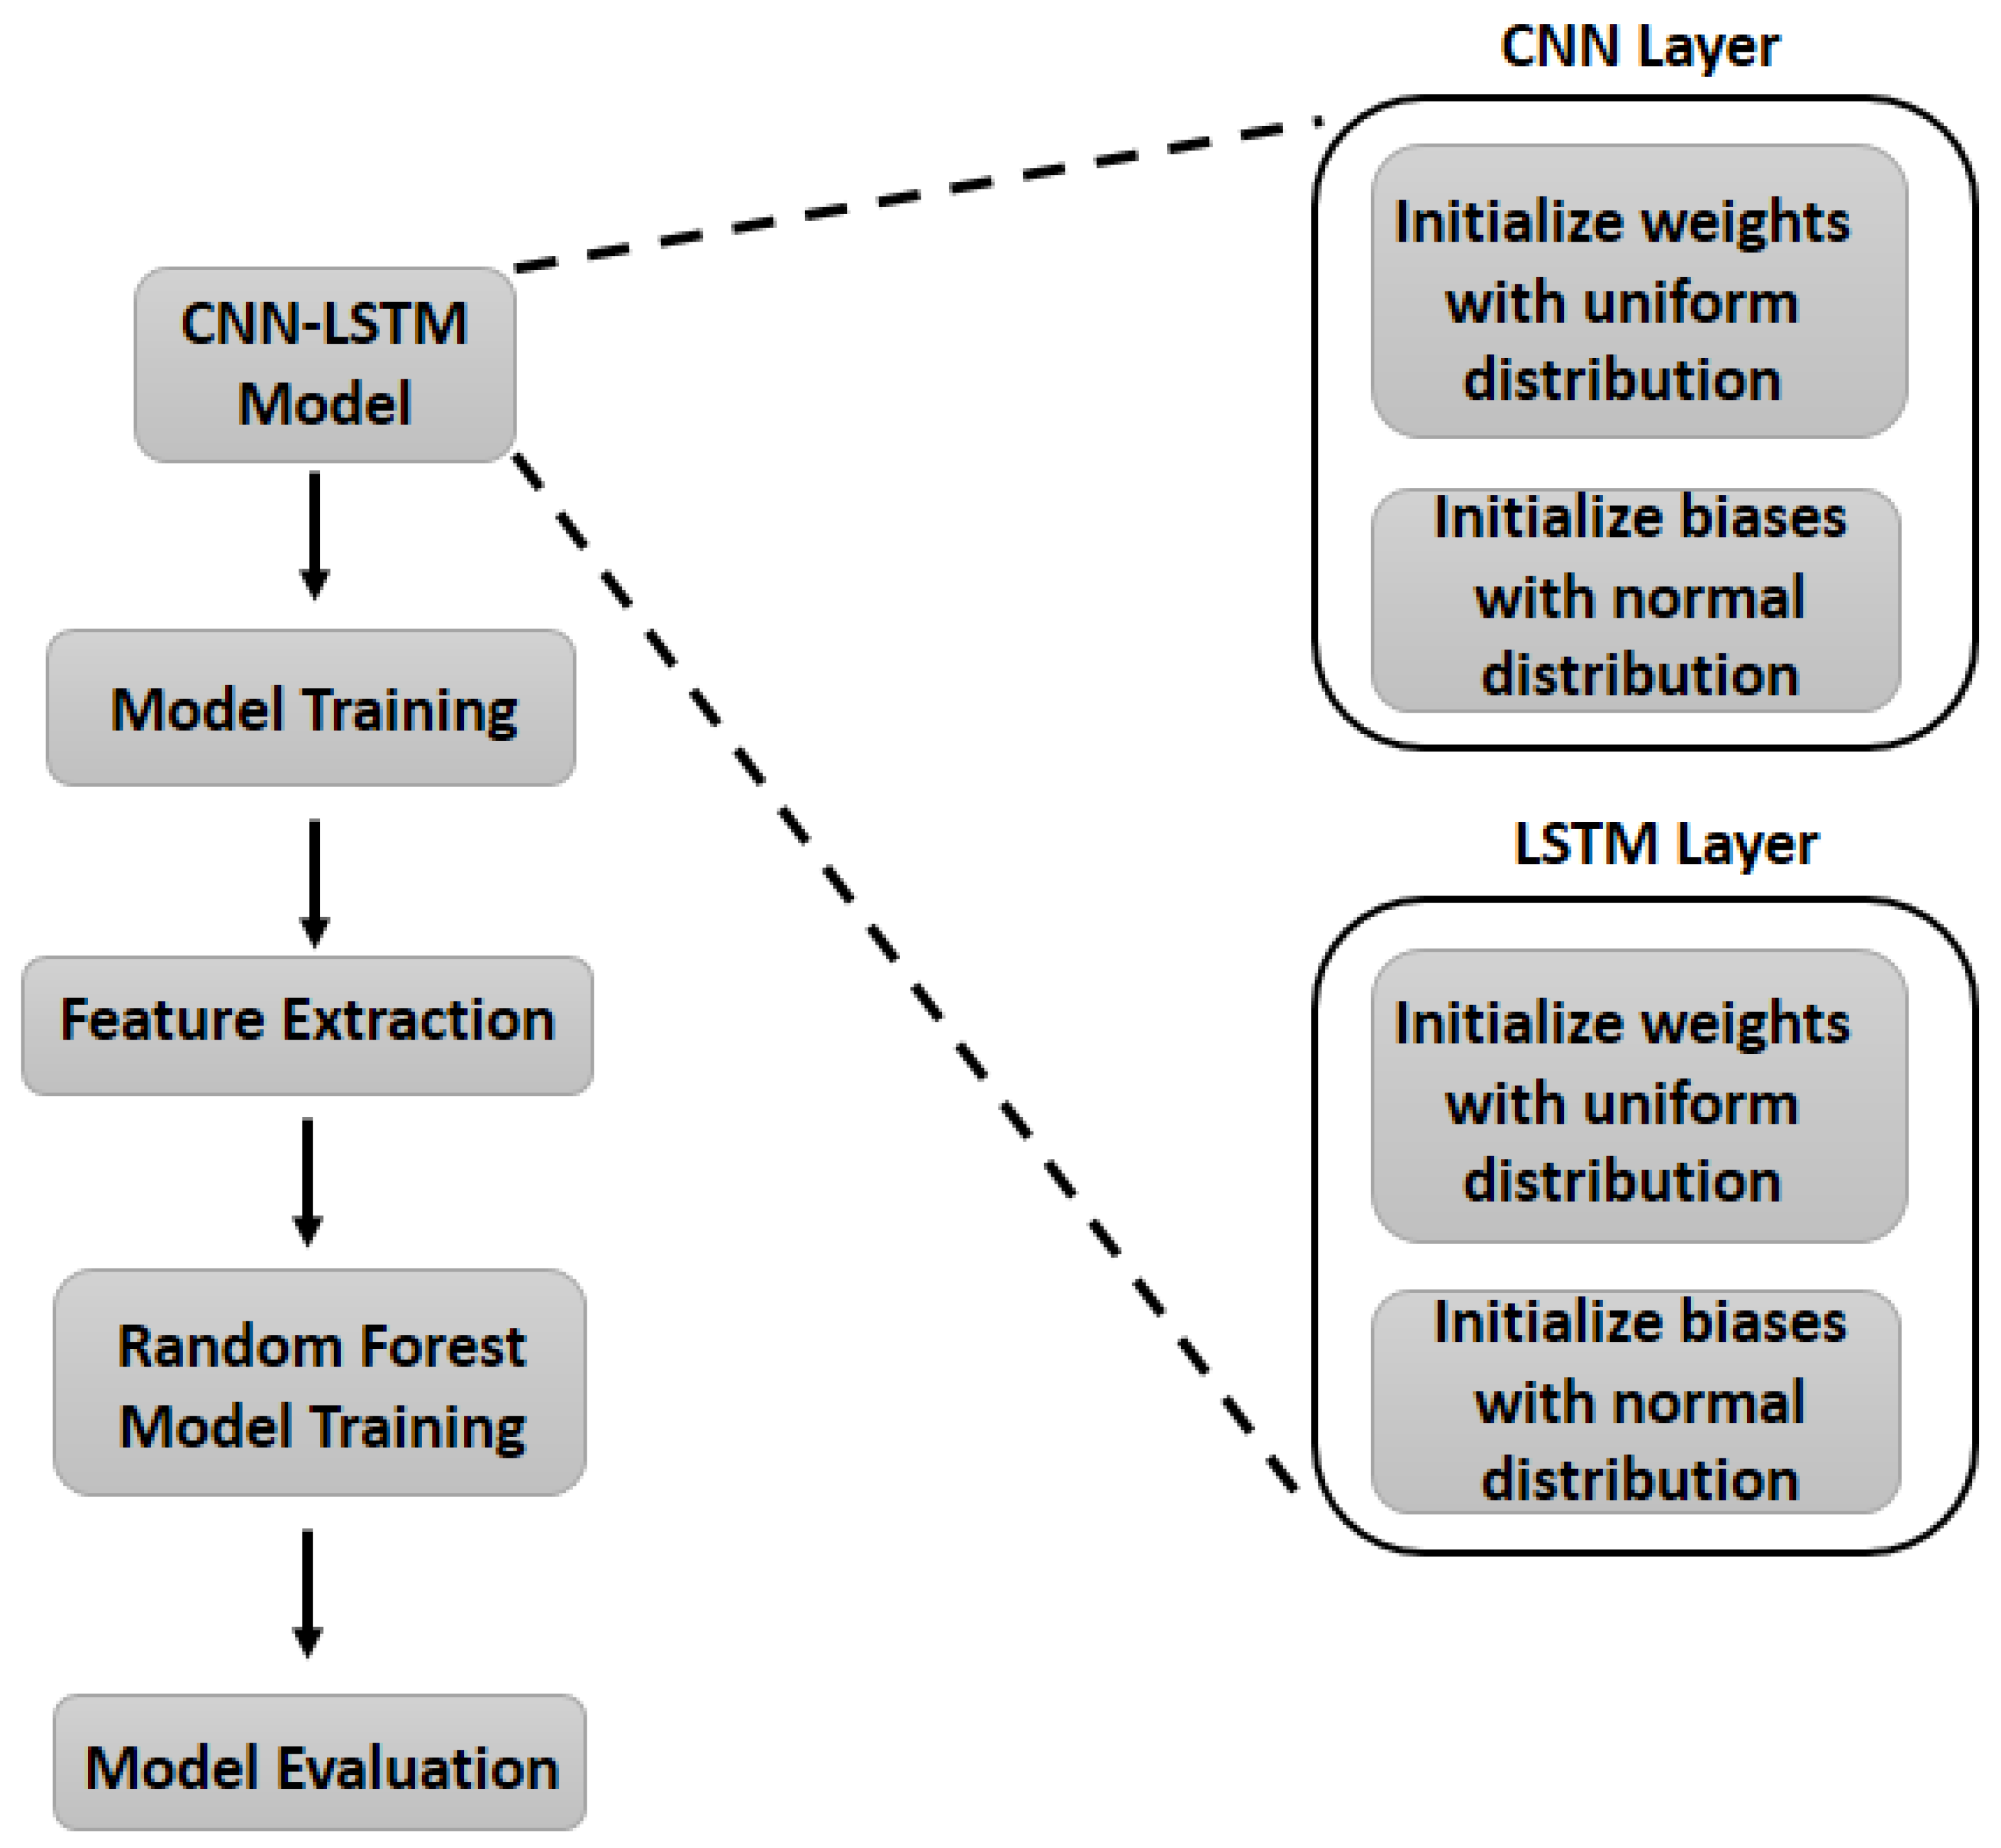
3. Materials and Methods
3.1. Data Collection
3.2. Uniform and Normal Distributions
3.3. Convolutional Neural Network
3.4. Long Short-Term Memory
3.5. Feature Extraction
3.6. Classification
3.7. Random Forest
4. Results and Discussion
4.1. Implementation Details
4.2. Selection of Hyperparameters
4.3. Result Analysis
5. Conclusions and Future Work
Author Contributions
Funding
Institutional Review Board Statement
Informed Consent Statement
Data Availability Statement
Acknowledgments
Conflicts of Interest
Abbreviations
| CNN | Convolutional Neural Network |
| LSTM | Long Short Term Memory |
| DNN | Deep Neural Network |
References
- Engel-Yeger, B.; Nagauker-Yanuv, L.; Rosenblum, S. Handwriting performance, self-reports, and perceived self-efficacy among children with dysgraphia. Am. J. Occup. Ther. 2009, 63, 182–192. [Google Scholar] [CrossRef] [PubMed] [Green Version]
- Rosenblum, S.; Dvorkin, A.Y.; Weiss, P.L. Automatic segmentation as a tool for examining the handwriting process of children with dysgraphic and proficient handwriting. Hum. Mov. Sci. 2006, 25, 608–621. [Google Scholar] [CrossRef] [PubMed]
- Richards, R.G. Te Source for Dyslexia and Dysgraphia, LinguiSystems; LinguiSystems, Inc.: East Moline, IL, USA, 1999. [Google Scholar]
- Nicolson, R.I.; Fawcett, A.J. Dyslexia, dysgraphia, procedural learning and the cerebellum. Cortex 2011, 47, 117–127. [Google Scholar] [CrossRef] [PubMed]
- Prunty, M.; Barnett, A.L. Understanding handwriting difculties: A comparison of children with and without motor impairment. Cogn. Neuropsychol. 2017, 34, 205–218. [Google Scholar] [CrossRef] [PubMed] [Green Version]
- Prunty, M.M.; Barnett, A.L.; Wilmut, K.; Plumb, M.S. Handwriting speed in children with developmental coordination disorder: Are they really slower? Res. Dev. Disabil. 2013, 34, 2927–2936. [Google Scholar] [CrossRef] [Green Version]
- Berninger, V.W.; Richards, T.; Abbott, R.D. Differential diagnosis of dysgraphia, dyslexia, and owl ld: Behavioral and neuroimaging evidence. Read. Writ. 2015, 28, 1119–1153. [Google Scholar] [CrossRef] [Green Version]
- Zoccolotti, P.; Friedmann, N. From dyslexia to dyslexias, from dysgraphia to dysgraphias, from a cause to causes: A look at current research on developmental dyslexia and dysgraphia. Cortex 2010, 46, 1211–1215. [Google Scholar] [CrossRef]
- Asselborn, T.; Gargot, T.; Kidzinski, Ł.; Johal, W.; Cohen, D.; Jolly, C.; Dillenbourg, P. Automated human-level diagnosis of dysgraphia using a consumer tablet. NPJ Digit. Med. 2018, 1, 42. [Google Scholar] [CrossRef] [Green Version]
- McCloskey, M.; Rapp, B. Developmental dysgraphia: An overview and framework for research. Cogn. Neuropsychol. 2017, 34, 65–82. [Google Scholar] [CrossRef]
- Letanneux, A.; Danna, J.; Velay, J.L.; Viallet, F.; Pinto, S. From micrographia to Parkinson’s disease dysgraphia. Mov. Disord. 2014, 29, 1467–1475. [Google Scholar] [CrossRef] [Green Version]
- Drotar, P.; Mekyska, J.; Rektorova, I.; Masarova, L.; Smekal, Z.; Faundez-Zanuy, M. Decision support framework for Parkinson’s disease based on novel handwriting markers. IEEE Trans. Neural Syst. Rehabil. Eng. 2014, 23, 508–516. [Google Scholar] [CrossRef] [PubMed]
- Espana-Boquera, S.; Castro-Bleda, M.J.; Gorbe-Moya, J.; Zamora-Martinez, F. Improving offline handwritten text recognition with hybrid HMM/ANN models. IEEE Trans. Pattern Anal. Mach. Intell. 2010, 33, 767–779. [Google Scholar] [CrossRef] [PubMed]
- Dutta, K.; Krishnan, P.; Mathew, M.; Jawahar, C.V. Improving CNN-RNN hybrid networks for handwriting recognition. In Proceedings of the 324 16th International Conference on Frontiers in Handwriting Recognition (ICFHR), Niagara Falls, NY, USA, 5–8 August 2018; pp. 80–85. [Google Scholar]
- Fawad, M.; Masood, J.; Zahir, H.; Driss, K.; Mehmood, N.; Farooq, H. Novel Approach to Evaluate Classification Algorithms and Feature Selection Filter Algorithms using Medical Data. J. Comput. Cogn. Eng. 2022, 2, 57–67. [Google Scholar] [CrossRef]
- Zhang, Z.; Luca, G.D.; Archambault, B.; Chavez, J.; Rice, B. Traffic Dataset for Dynamic Routing Algorithm in Traffic Simulation. J. Artif. Intell. Technol. 2022, 2, 111–122. [Google Scholar] [CrossRef]
- Chen, Z. Research on Internet Security Situation Awareness Prediction Technology based on Improved RBF Neural Network Algorithm. J. Comput. Cogn. Eng. 2022, 1, 103–108. [Google Scholar]
- Yang, X.; Qiu, T.T. Human activity recognition and embedded application based on convolutional neural network. J. Artif. Intell. Technol. 2021, 1, 51–60. [Google Scholar]
- Arora, R.; Basu, A.; Mianjy, P.; Mukherjee, A. Understanding deep neural networks with rectified linear units. arXiv 2016, arXiv:1611.01491. [Google Scholar]
- Paz-Villagran, V.; Danna, J.; Velay, J.L. Lifs and stops in profcient and dysgraphic handwriting. Hum. Mov. Sci. 2014, 33, 381–394. [Google Scholar] [CrossRef]
- Danna, J.; Paz-Villagran, V.; Velay, J.L. Signal-to-noise velocity peaks diference: A new method for evaluating the handwriting movement fuency in children with dysgraphia. Res. Dev. Disabil. 2013, 34, 4375–4384. [Google Scholar] [CrossRef]
- Mekyska, J.; Faundez-Zanuy, M.; Mzourek, Z.; Galaz, Z.; Smekal, Z.; Rosenblum, S. Identification and rating of developmental dysgraphia by handwriting analysis. IEEE Trans. Hum.-Mach. Syst. 2016, 47, 235–248. [Google Scholar] [CrossRef]
- Rosenblum, S.; Dror, G. Identifying developmental dysgraphia characteristics utilizing handwriting classifcation methods. IEEE Trans. Hum.-Mach. Syst. 2017, 47, 293–298. [Google Scholar] [CrossRef]
- Kurniawan, D.A.; Sihwi, S.W.; Gunarhadi. An expert system for diagnosing dysgraphia. In Proceedings of the 2017 2nd International Conferences on Information Technology, Information Systems and Electrical Engineering (ICITISEE), Yogyakarta, Indonesia, 1–2 November 2017; pp. 468–472. [Google Scholar]
- Samodro, P.W.; Sihwi, S.W.; Winarno. Backpropagation implementation to classify dysgraphia in children. In Proceedings of the 2019 International Conference of Artifcial Intelligence and Information Technology (ICAIIT), Yogyakarta, Indonesia, 13–15 March 2019; pp. 437–442. [Google Scholar]
- Kariyawasam, R.; Nadeeshani, M.; Hamid, T.; Subasinghe, I.; Samarasinghe, P.; Ratnayake, P. Pubudu: Deep learning based screening and intervention of dyslexia, dysgraphia and dyscalculia. In Proceedings of the 2019 14th Conference on Industrial and Information Systems (ICIIS), Kandy, Sri Lanka, 18–20 December 2019; pp. 476–481. [Google Scholar]
- Zvoncak, V.; Mucha, J.; Galaz, Z.; Mekyska, J.; Safarova, K.; Faundez-Zanuy, M.; Smekal, Z. Fractional order derivatives evaluation in computerized assessment of handwriting difficulties in school-aged children. In Proceedings of the 2019 11th International Congress on Ultra Modern Telecommunications and Control Systems and Workshops (ICUMT), Dublin, Ireland, 28–30 October 2019; pp. 1–6. [Google Scholar]
- Zvoncak, V.; Mekyska, J.; Safarova, K.; Smekal, Z.; Brezany, P. New approach of dysgraphic handwriting analysis based on the tunable q-factor wavelet transform. In Proceedings of the 2019 42nd International Convention on Information and Communication Technology, Electronics and Microelectronics (MIPRO), Opatija, Croatia, 20–24 May 2019; pp. 289–294. [Google Scholar]
- Simard, P.Y.; Steinkraus, D.; Platt, J.C. Best practice for convolutional neural networks applied to visual document analysis. In Proceedings of the Seventh International Conference on Document Analysis and Recognition (ICDAR), Edinburgh, UK, 6 August 2003; pp. 3–6. [Google Scholar]
- Wang, T.; Wu, D.J.; Coates, A.; Ng, A.Y. End-to-end text recognition with convolutional neural networks. In Proceedings of the 21st International Conference on Pattern Recognition (ICPR2012), Tsukuba, Japan, 11–15 November 2012. [Google Scholar]
- Long, J.; Shelhamer, E.; Darrell, T. Fully convolutional networks for semantic segmentation. In Proceedings of the IEEE Conference on Computer Vision and Pattern Recognition, Boston, MA, USA, 7–12 June 2015. [Google Scholar]
- Chen, L.-C.; Papandreou, G.; Kokkinos, I.; Murphy, K.; Yuille, A.L. DeepLab: Semantic image segmentation with deep convolutional nets, atrous convolution, and fully connected CRFs. IEEE. Trans. 2018, 40, 834–848. [Google Scholar] [CrossRef] [PubMed] [Green Version]
- Noh, H.; Hong, S.; Han, B. Learning deconvolution network for semantic segmentation. In Proceedings of the IEEE International Conference on Computer Vision, Araucano Park, Las Condes, Chille, 11–18 December 2015. [Google Scholar]
- Gupta, A.; Sarkhel, R.; Das, N.; Kundu, M. Multiobjective optimization for recognition of isolated handwritten Indic scripts. Pattern Recognit. Lett. 2019, 128, 318–325. [Google Scholar] [CrossRef]
- Cui, H.; Bai, J. A new hyperparameters optimization method for convolutional neural networks. Pattern Recognit. Lett. 2019, 125, 828–834. [Google Scholar] [CrossRef]
- Tso, W.W.; Burnak, B.; Pistikopoulos, E.N. Hyperparameter optimization of machine learning models through parametric programming. Comput. Chem. Eng. 2020, 139, 106902. [Google Scholar] [CrossRef]
- Christian, S.; Wei, L.; Yangqing, J.; Pierre, S.; Scott, R.; Dragomir, A.; Andrew, R. Going deeper with convolutions. In Proceedings of the IEEE Conference on Computer Vision and Pattern Recognition, Boston, MA, USA, 7–12 June 2015. [Google Scholar]
- Krizhevsky, A.; Sutskever, I.; Hinton, G.E. ImageNet classification with deep convolutional neural networks. Adv. Neural Inf. Process. Syst. 2012, 25, 1097–1105. [Google Scholar] [CrossRef] [Green Version]
- Simonyan, K.; Zisserman, A. Very deep convolutional networks for large-scale image recognition. In Proceedings of the International Conference on Learning Representations, San Diego, CA, USA, 7–9 May 2015. [Google Scholar]
- Khan, L.; Amjad, A.; Afaq, K.M.; Chang, H.-T. Deep Sentiment Analysis Using CNN-LSTM Architecture of English and Roman Urdu Text Shared in Social Media. Appl. Sci. 2022, 12, 2694. [Google Scholar] [CrossRef]
- Madan, P.; Singh, V.; Chaudhari, V.; Albagory, Y.; Dumka, A.; Singh, R.; Gehlot, A.; Rashid, M.; Alshamrani, S.S.; AlGhamdi, A.S. An Optimization-Based Diabetes Prediction Model Using CNN and Bi-Directional LSTM in Real-Time Environment. Appl. Sci. 2022, 12, 3989. [Google Scholar] [CrossRef]
- Fiaz, M.A.; Ashraf, M.A.; Rizvi, A.A. Average scattered field from a random PEC cylinder buried below a slightly rough surface. Waves Random Complex Media 2017, 1, 60–75. [Google Scholar] [CrossRef]
- Masood, F.; Fiaz, M.A. Evaluation of average cross-polarised scattered field from a PEMC cylinder of the random radius with uniform/normal distribution. IET Microw. Antennas Propag. 2019, 13, 804–812. [Google Scholar] [CrossRef]
- Kunhoth, J.; Al-Maadeed, S.; Kunhoth, S.; Akbari, Y. Automated Systems For Diagnosis of Dysgraphia in Children: A Survey and Novel Framework. arXiv 2022, arXiv:2206.13043. [Google Scholar]
- Staudemeyer, R.C.; Morris, E.R. Understanding LSTM–a tutorial into long short-term memory recurrent neural networks. arXiv 2019, arXiv:1909.09586. [Google Scholar]
- Chen, H.; Wu, L.; Chen, J.; Lu, W.; Ding, J. A comparative study of automated legal text classification using random forests and deep learning. Inf. Process. Manag. 2022, 59, 102798. [Google Scholar] [CrossRef]
- Zhu, J.; Chen, H.; Ye, W. A Hybrid CNN-LSTM Network for the Classification of Human Activities Based on Microdoppler Radar. IEEE Access 2008, 8, 24713–24720. [Google Scholar] [CrossRef]
- Drotar, P.; Dobes, M. Dysgraphia detection through machine learning. Sci. Rep. 2020, 10, 21541. [Google Scholar] [CrossRef]
- Ghouse, F.; Paranjothi, K.; Vaithiyanathan, R. Dysgraphia Classification based on the Non-Discrimination Regularization in Rotational Region Convolutional Neural Network. Int. J. Intell. Eng. Syst. 2022, 15, 55–63. [Google Scholar]


| Kernel Size (-) | Width (C-2C-) | Depth | Accuracy | Accuracy | Accuracy |
|---|---|---|---|---|---|
| 5-3 | 16-32-16 | 3 | 90.3% | 90.7% | 90.5% |
| 5-3 | 16-32-32 | 3 | 90.6% | 91.4% | 90.9% |
| 5-3 | 32-64-32 | 3 | 90.9% | 91.9% | 91.4% |
| 5-3 | 32-64-64 | 3 | 91.4% | 92.3% | 91.8% |
| 5-3 | 64-128-64 | 3 | 91.7% | 92.6% | 92.1% |
| 5-3 | 64-128-128 | 3 | 92.3% | 92.9% | 92.6% |
| 5-3 | 128-256-128 | 3 | 93.3% | 94.6% | 93.9% |
| 5-3 | 128-256-256 | 3 | 95.1% | 96.1% | 95.6% |
| 5-3 | 256-512-256 | 3 | 96.1% | 97.6% | 96.8% |
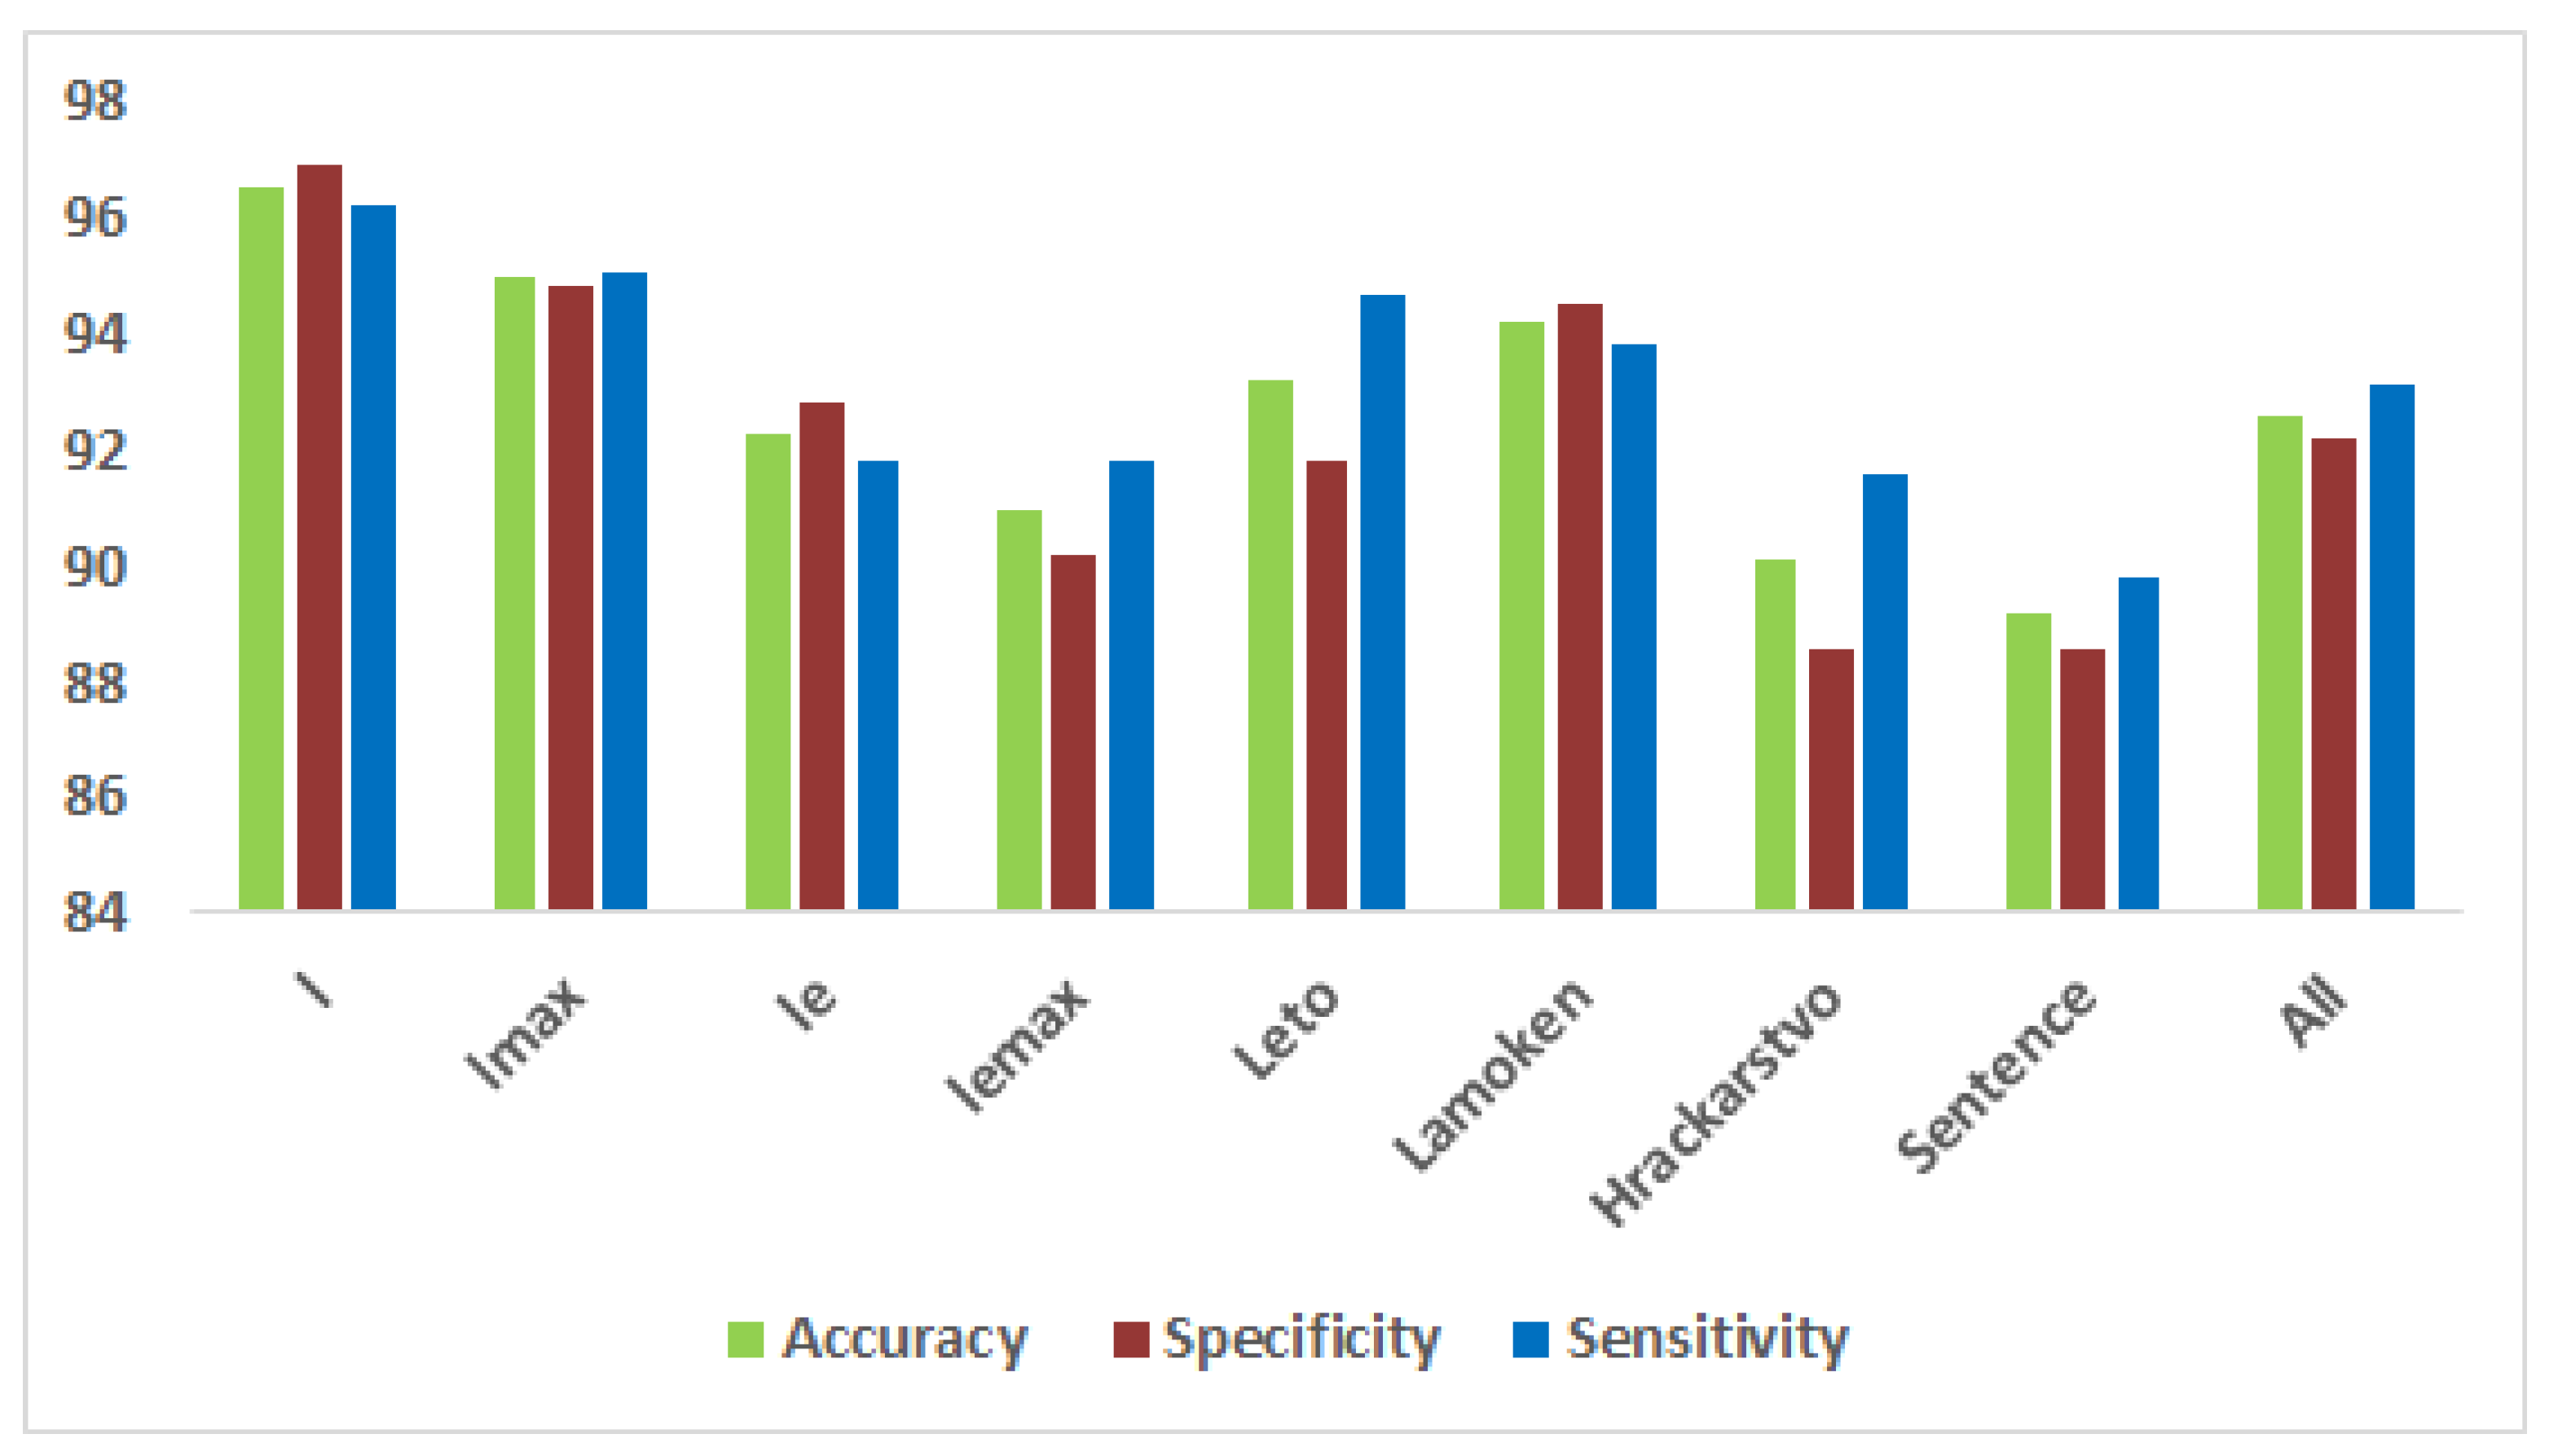
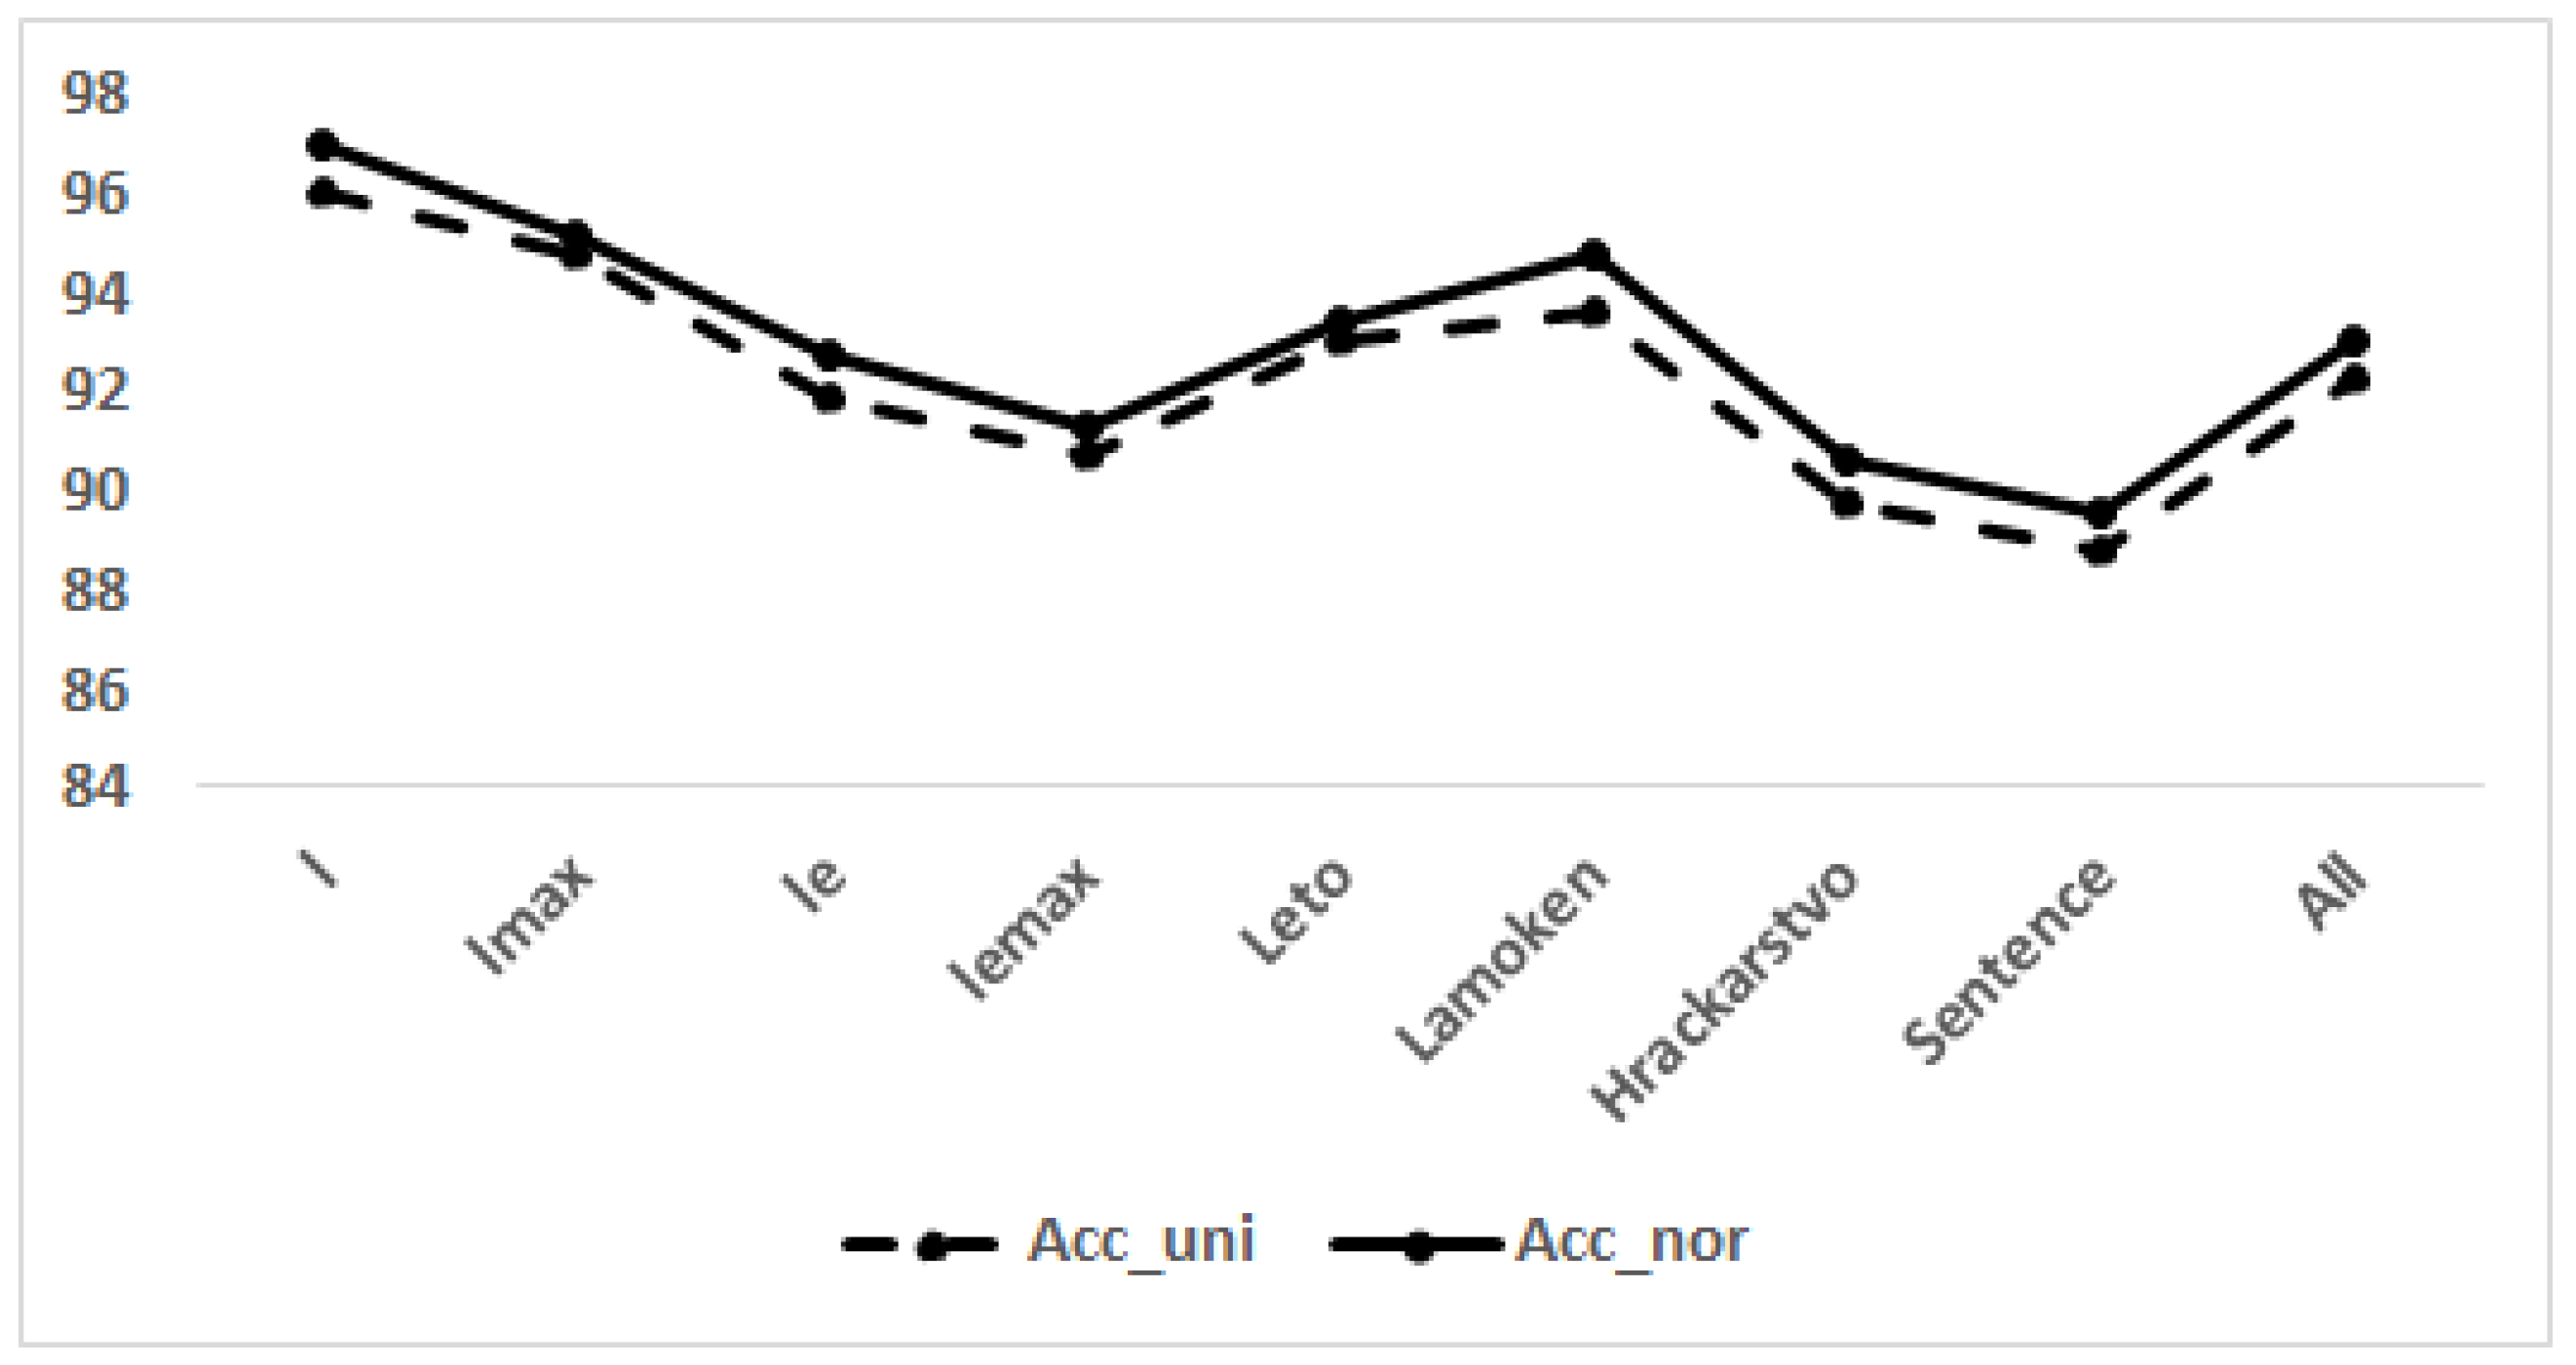
| Task | Accuracy | Accuracy | Accuracy | Specificity | Sensitivity |
|---|---|---|---|---|---|
| l | 96.0 | 97.0 | 96.5 | 96.9 | 96.2 |
| l | 94.8 | 95.2 | 95.0 | 94.8 | 95.1 |
| le | 91.9 | 92.7 | 92.3 | 92.8 | 91.8 |
| le | 90.7 | 91.3 | 91.0 | 90.2 | 91.8 |
| Leto | 93.0 | 93.4 | 93.2 | 91.8 | 94.7 |
| Lamoken | 93.6 | 94.8 | 94.2 | 94.5 | 93.8 |
| Hrackarstvo | 89.7 | 90.6 | 90.1 | 88.6 | 91.6 |
| Sentence | 88.8 | 89.6 | 89.2 | 88.6 | 89.8 |
| All | 92.3 | 93.0 | 92.6 | 92.2 | 93.1 |
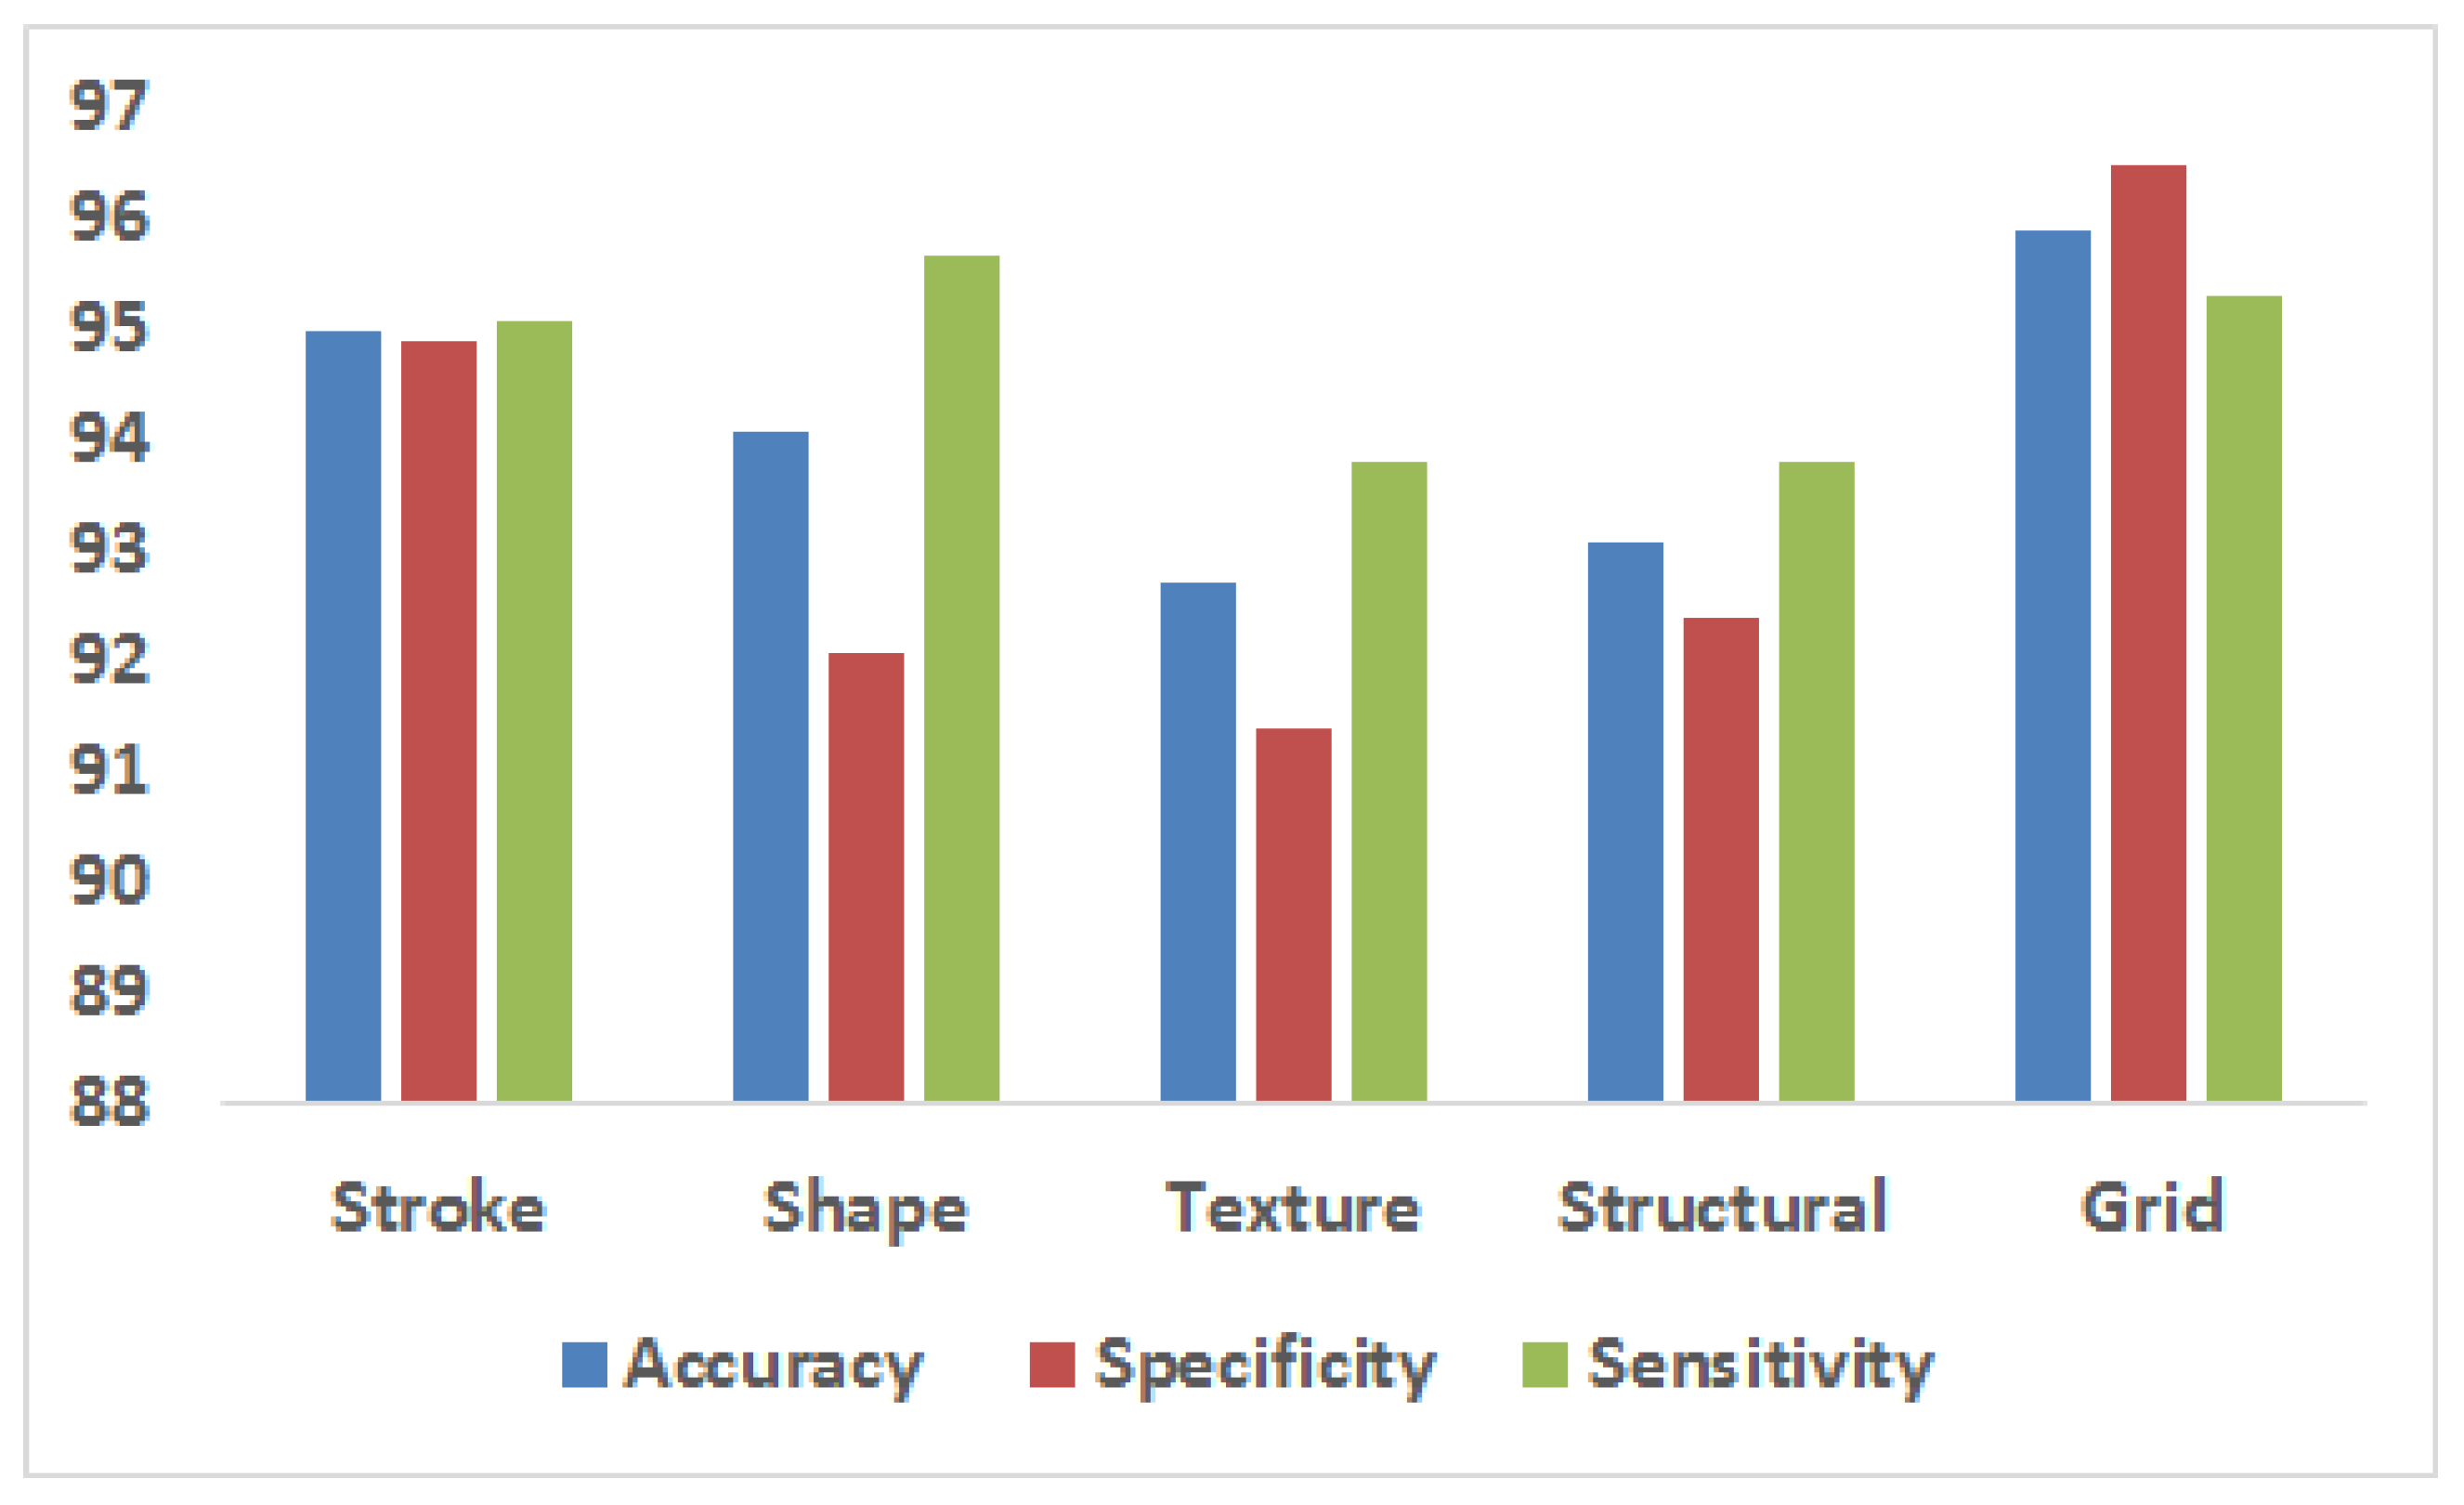
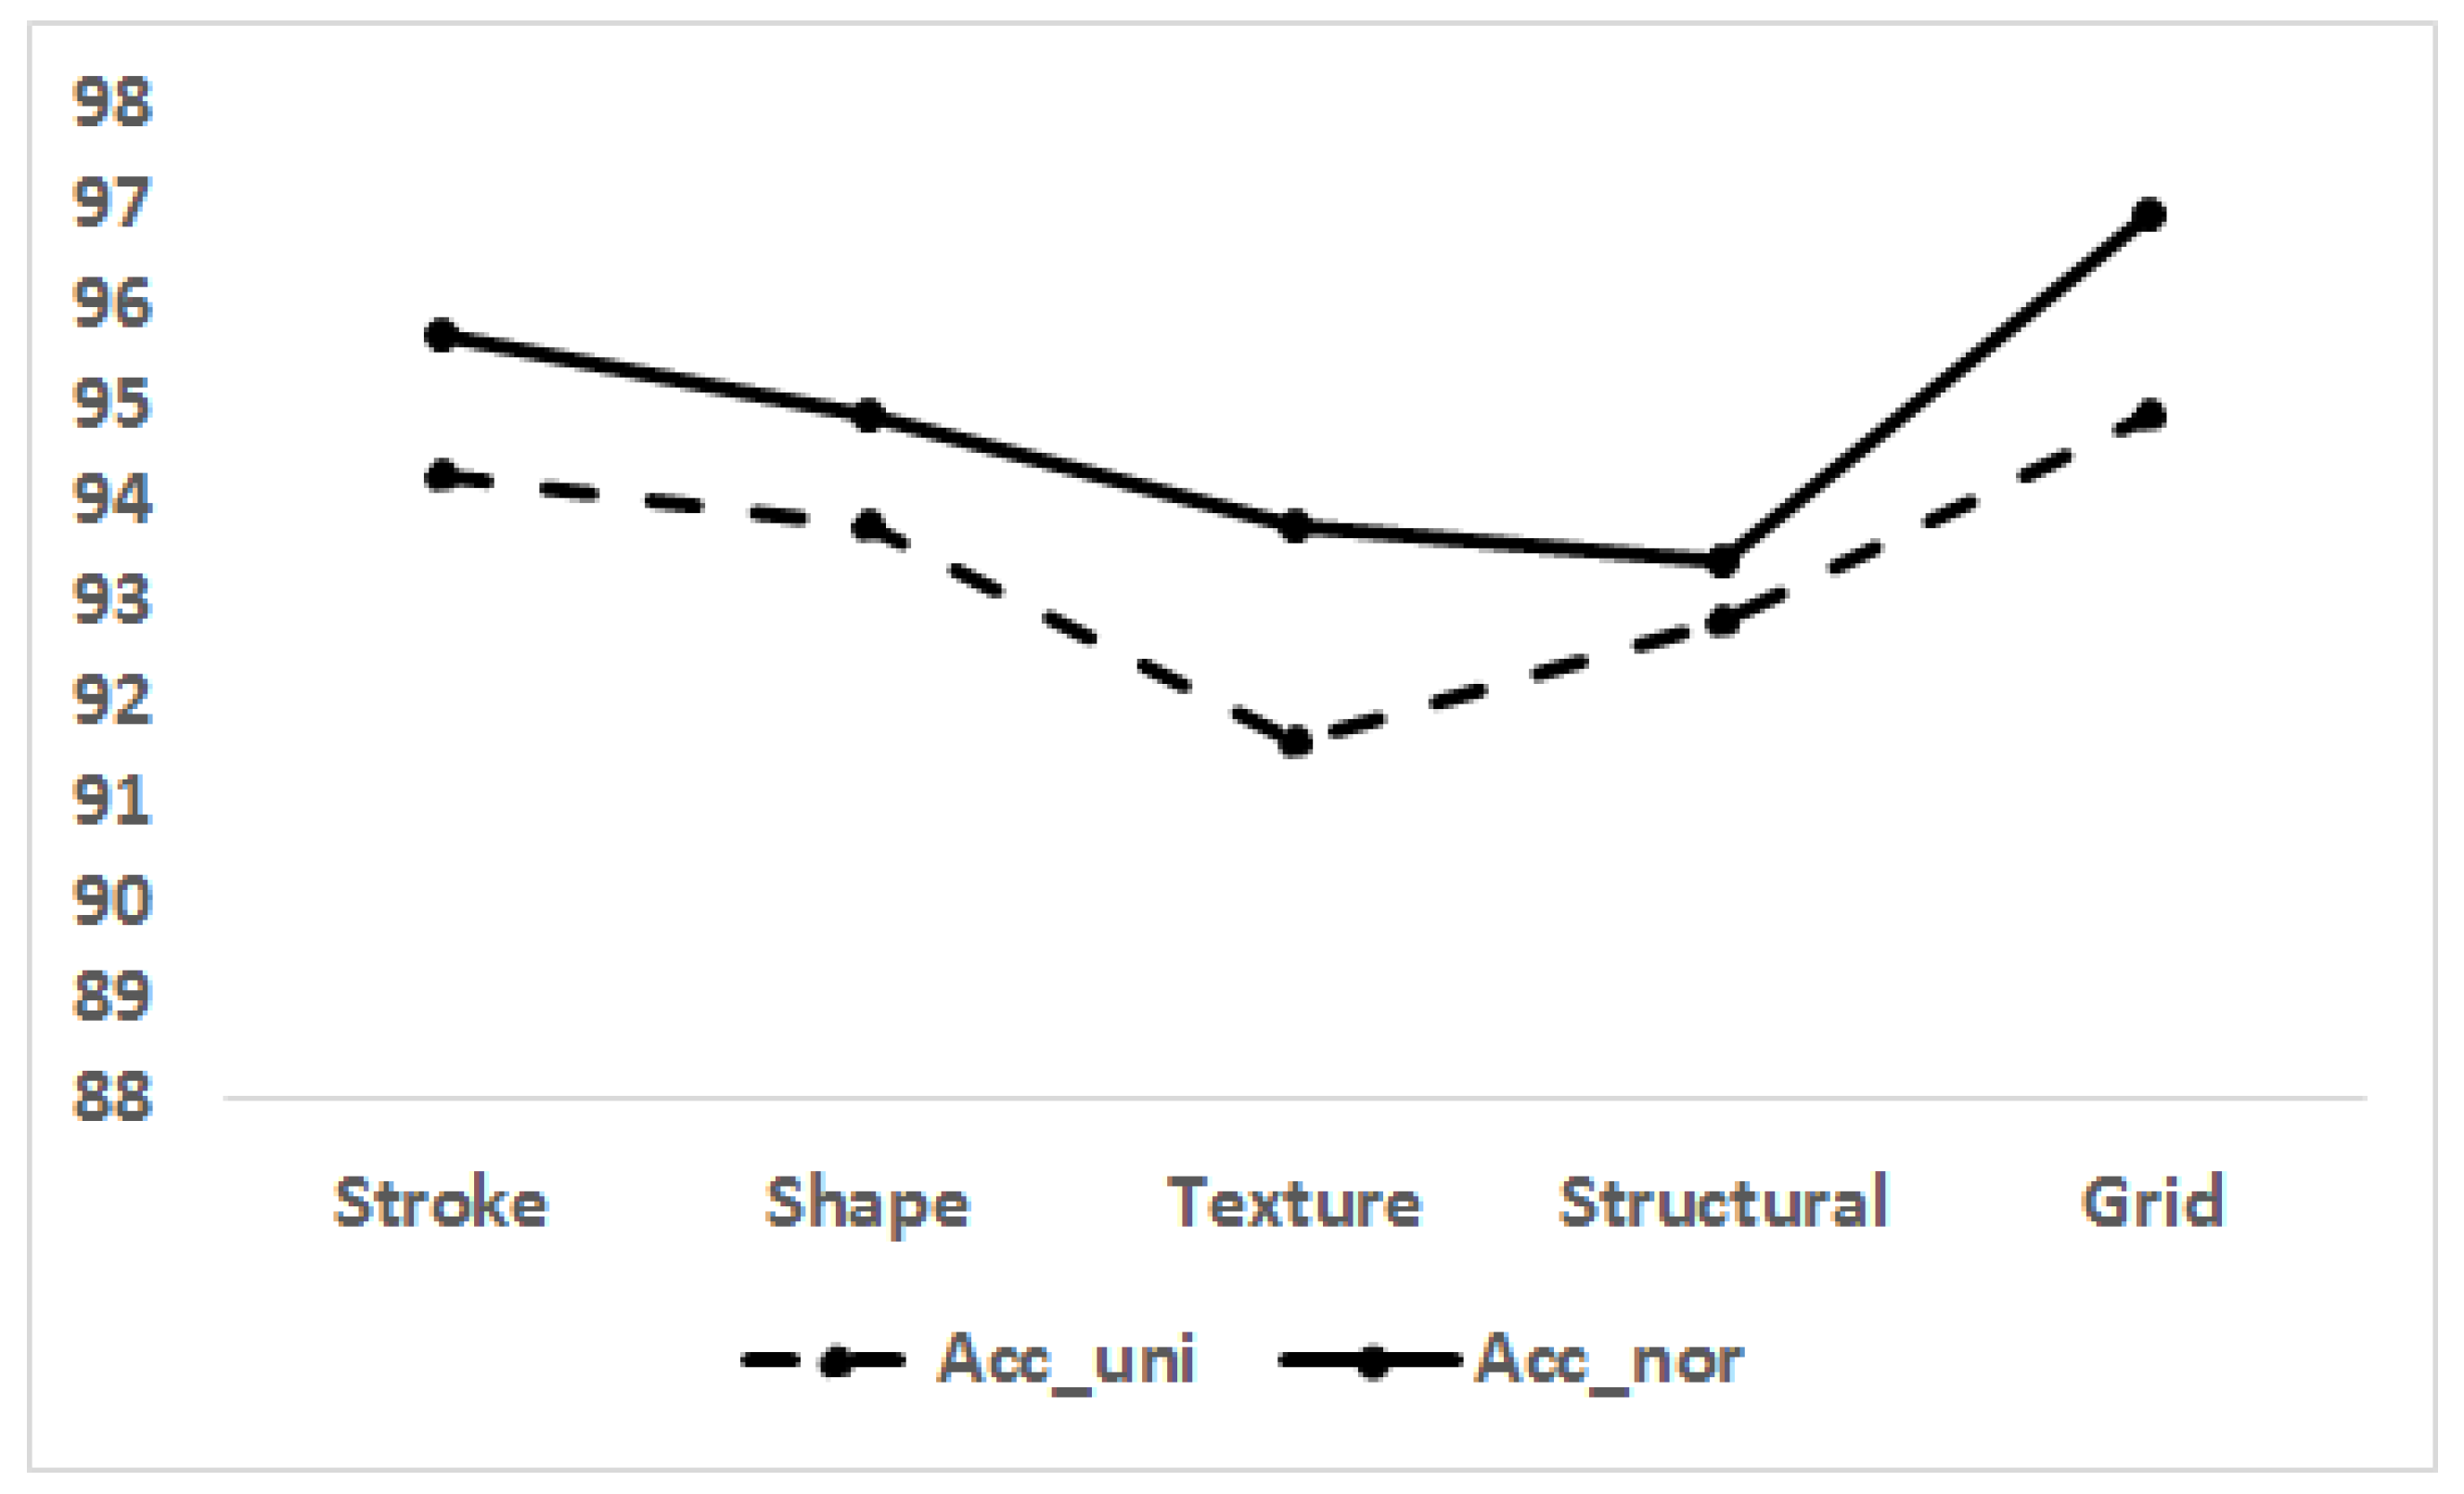
| Task | Accuracy | Accuracy | Accuracy | Specificity | Sensitivity |
|---|---|---|---|---|---|
| Stroke | 94.3 | 95.7 | 95.0 | 94.9 | 95.1 |
| Shape | 93.8 | 94.4 | 94.1 | 92.1 | 95.7 |
| Texture | 91.6 | 93.8 | 92.7 | 91.4 | 93.8 |
| Strutural | 92.8 | 93.4 | 93.1 | 92.4 | 93.8 |
| Grid | 94.9 | 96.9 | 95.9 | 96.5 | 95.3 |
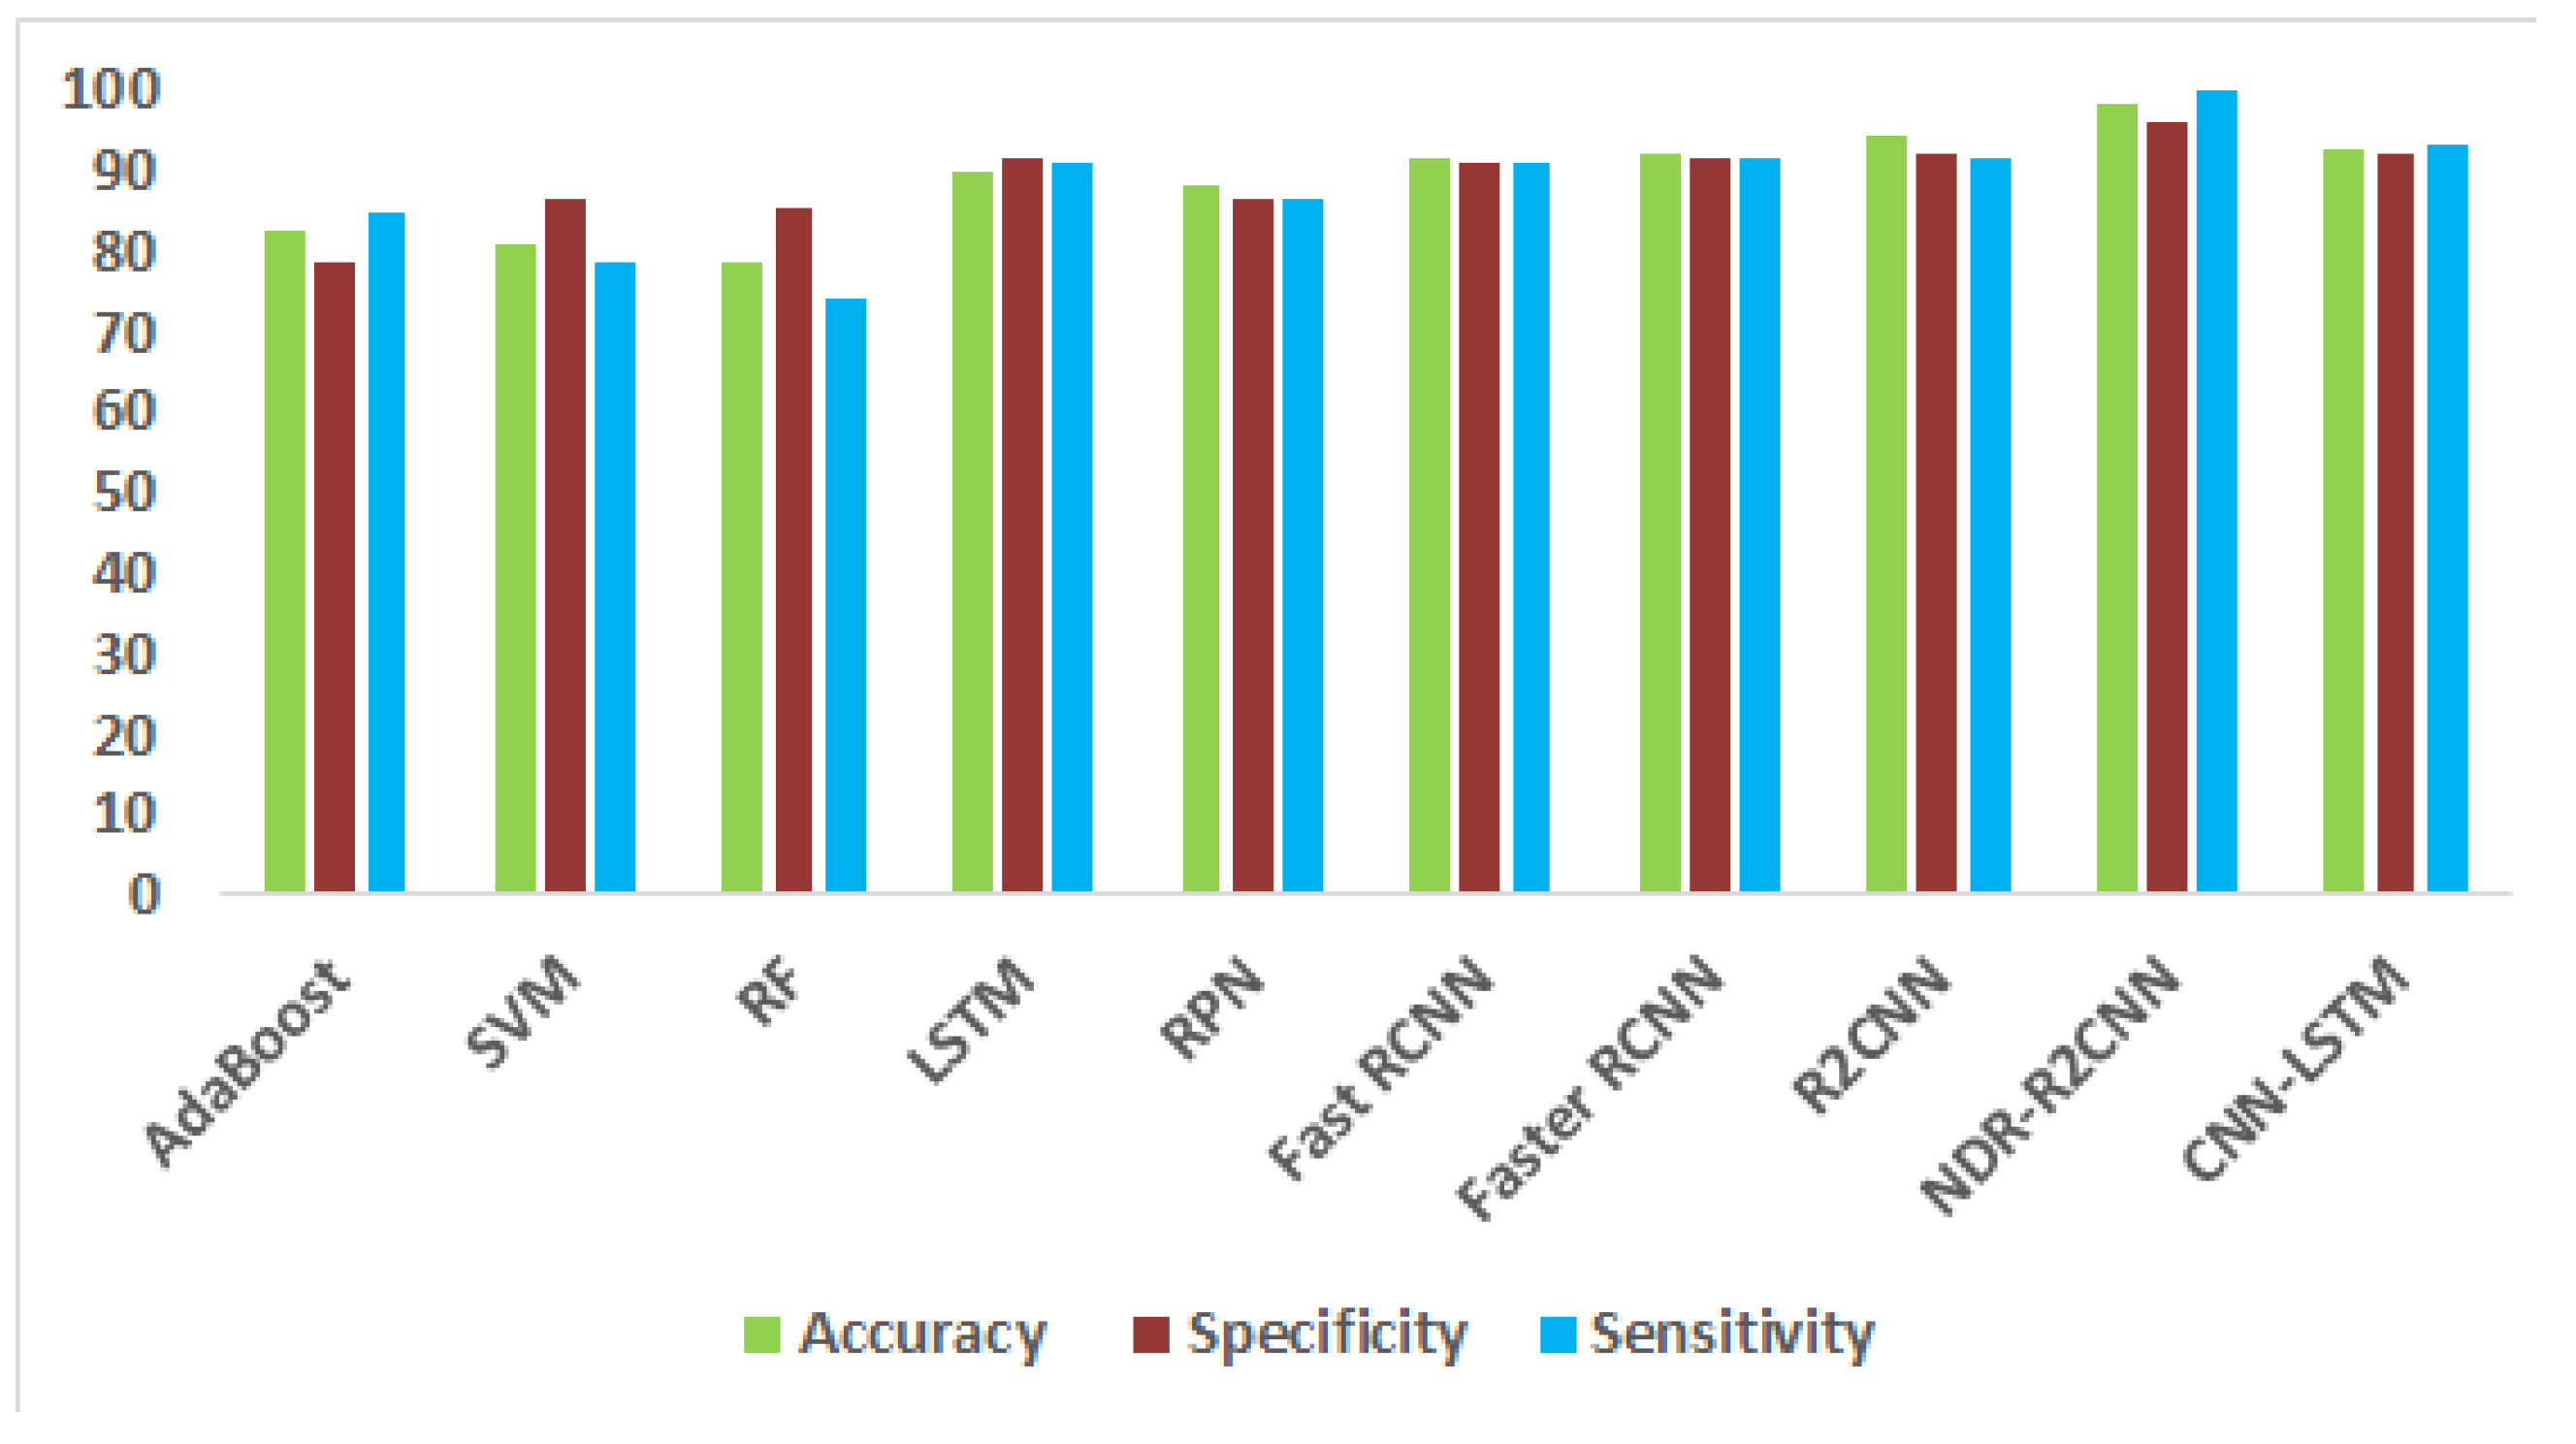
| Methods | Accurcay | Specificity | Sensitivity |
|---|---|---|---|
| Adaboost | 82.5 | 78.7 | 84.7 |
| SVM | 80.8 | 86.4 | 78.5 |
| RF | 78.6 | 85.3 | 74.4 |
| LSTM | 90.1 | 91.4 | 91.3 |
| RPN | 88.2 | 86.5 | 86.3 |
| Fast RCNN | 91.8 | 91.2 | 91.1 |
| Faster RCNN | 92.1 | 91.7 | 91.5 |
| R2CNN | 94.2 | 92.1 | 91.5 |
| NDR-R2CNN | 98.2 | 96.4 | 100 |
| CNN-LSTM | 92.6 | 92.2 | 93.1 |
Disclaimer/Publisher’s Note: The statements, opinions and data contained in all publications are solely those of the individual author(s) and contributor(s) and not of MDPI and/or the editor(s). MDPI and/or the editor(s) disclaim responsibility for any injury to people or property resulting from any ideas, methods, instructions or products referred to in the content. |
© 2023 by the authors. Licensee MDPI, Basel, Switzerland. This article is an open access article distributed under the terms and conditions of the Creative Commons Attribution (CC BY) license (https://creativecommons.org/licenses/by/4.0/).
Share and Cite
Masood, F.; Khan, W.U.; Ullah, K.; Khan, A.; Alghamedy, F.H.; Aljuaid, H. A Hybrid CNN-LSTM Random Forest Model for Dysgraphia Classification from Hand-Written Characters with Uniform/Normal Distribution. Appl. Sci. 2023, 13, 4275. https://doi.org/10.3390/app13074275
Masood F, Khan WU, Ullah K, Khan A, Alghamedy FH, Aljuaid H. A Hybrid CNN-LSTM Random Forest Model for Dysgraphia Classification from Hand-Written Characters with Uniform/Normal Distribution. Applied Sciences. 2023; 13(7):4275. https://doi.org/10.3390/app13074275
Chicago/Turabian StyleMasood, Fahad, Wajid Ullah Khan, Khalil Ullah, Ahmad Khan, Fatemah H. Alghamedy, and Hanan Aljuaid. 2023. "A Hybrid CNN-LSTM Random Forest Model for Dysgraphia Classification from Hand-Written Characters with Uniform/Normal Distribution" Applied Sciences 13, no. 7: 4275. https://doi.org/10.3390/app13074275