Article

Applying Deep Learning Methods for Mammography Analysis and Breast Cancer Detection

1
Doctoral School of Automatic Control and Computers, University Politehnica Bucharest, 060042 Bucharest, Romania
2
National Institute for Research and Development in Informatics, 011455 Bucharest, Romania
*
Author to whom correspondence should be addressed.
Appl. Sci. 2023, 13(7), 4272; https://doi.org/10.3390/app13074272
Submission received: 28 February 2023 / Revised: 18 March 2023 / Accepted: 23 March 2023 / Published: 28 March 2023

Abstract

:
Breast cancer is a serious medical condition that requires early detection for successful treatment. Mammography is a commonly used imaging technique for breast cancer screening, but its analysis can be time-consuming and subjective. This study explores the use of deep learning-based methods for mammogram analysis, with a focus on improving the performance of the analysis process. The study is focused on applying different computer vision models, with both CNN and ViT architectures, on a publicly available dataset. The innovative approach is represented by the data augmentation technique based on synthetic images, which are generated to improve the performance of the models. The results of the study demonstrate the importance of data pre-processing and augmentation techniques for achieving high classification performance. Additionally, the study utilizes explainable AI techniques, such as class activation maps and centered bounding boxes, to better understand the models’ decision-making process.

1. Introduction

Being the most common type of cancer in the world, breast cancer (BC) caused over 2.3 million cases and more than 685,000 deaths in 2020 [1]. It continues to have a profound impact on the global number of deaths caused by a type of cancer as it is one of the most prevalent forms of this condition [2], especially for women.
BC corresponds to cell alteration in the breast tissue, dividing irregularly, resulting in tumors; it is mostly perceived as a painless protuberance or a thickened region in the breast. There are three main categories of BC: “Invasive Carcinoma”, which is the most predominant type, “Ductal Carcinoma” and “Invasive Lobular Carcinoma”. An early detection of any abnormal sign or any potential symptom can drastically influence the treatment of BC.
BC is considered a challenging condition as it is correlated to multiple factors, such as gender, genetics, climate or daily activities. Early screening of this disease is the most effective path towards fighting it; embedding AI technologies into the screening methods may drastically influence the early diagnosis and increase the treatment success rate.
In the recent years, there has been a continuous interest in this domain that may materialize into an encouraging future. ML, a subtype of AI, comprises a series of computational algorithms that integrate extracted image features in order to assist the disease outcomes. DL is the most recent domain of ML and it is based on artificial neural networks for classifying and recognizing images.
Medical imaging methods play a critical role in the early diagnosis of BC and in reducing the number of deaths caused by this disease. Different screening programs have been established in order to detect breast cancer in the early stages, facilitating an enhanced treatment along with increased survival rates. Additionally, BC imaging methods are crucial for monitoring or assessing the treatment and represent an essential part in clinical protocols as they can provide a broad range of relevant information based on the changes in morphology, structure, metabolism or functionality levels.
The contribution of this paper to the literature is twofold: (a) To provide a critical review of medical imagining techniques for BC detection, as well as the deep learning methods for BC detection and classification; (b) To present the experimental study proposed for the detection of BC based on several deep learning techniques on mammograms.
The innovative approach is represented by the generation of synthetic images which involves augmenting the dataset with realistic digital breast images using ML algorithms that can mimic the appearance of actual mammograms. By training the algorithm on a large dataset of real mammograms, it can learn to create new images that have similar characteristics to real images, including breast density and tissue structures. This approach proved its potential for improving the accuracy of breast cancer classification.
The content of the paper is organized as follows: A critical review of the current methods for the early detection of BC is presented in Section 2. The materials and methods used for the study are presented in Section 3, followed by the results in Section 4. Section 5 encompasses the discussion of the main findings of our paper and some conclusions are drawn in Section 6. The references are also included at the end of the manuscript.

2. Review of Medical Imaging Techniques for BC Detection

As medical imaging techniques are a valuable source for BC detection, there is an enormous interest in the use of digital technologies to sustain an early diagnosis of this condition. The most used methods for BC identification are based on the detection of calcifications which are represented by calcium deposits inside the breast tissue [3]. We analyze below the most common types of medical imaging techniques for BC diagnosis, as well as deep learning methods for BC detection and classification.

2.1. Medical Imaging Techniques for BC Diagnosis
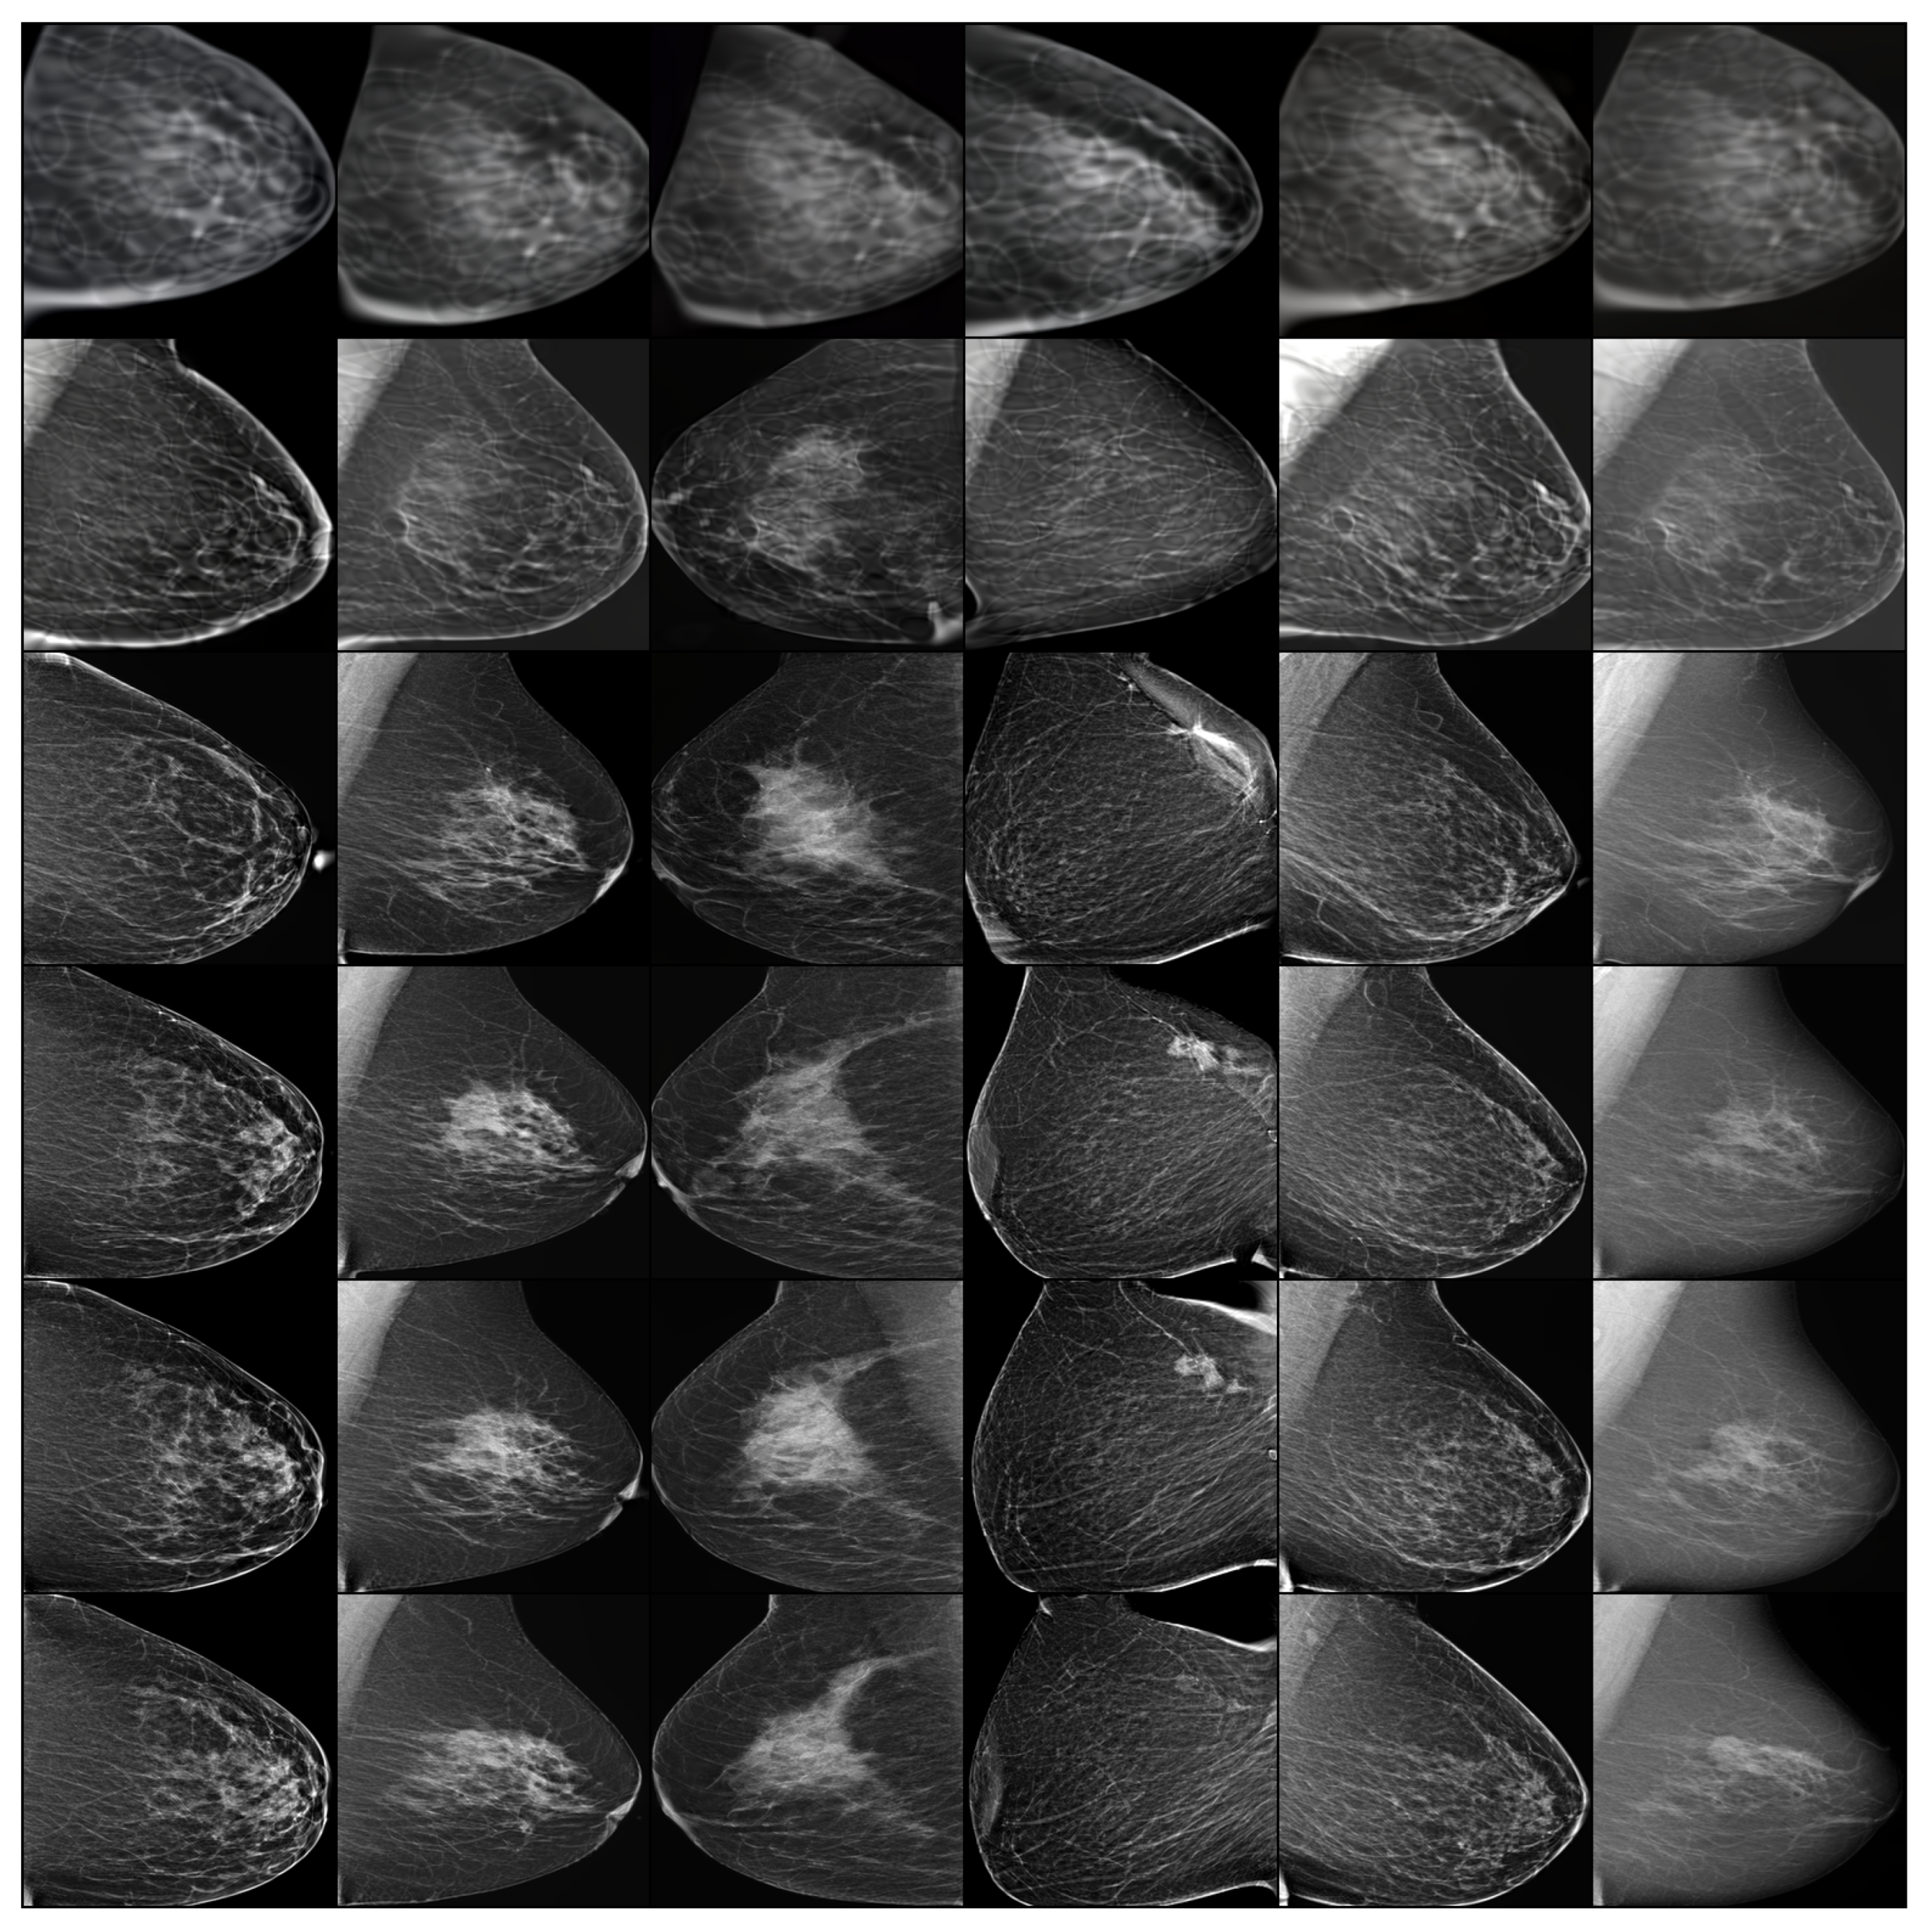
2.1.1. Mammography

Considering its sensitivity to breast calcifications, mammography, one of the most accurate screening procedures, reached superior results in identifying micro-calcifications or agglomerations of calcifications. The detection of suspicious micro-calcifications using mammography represents one of the earliest signs of a malignant breast tumor. A mammogram is a low-dose X-ray technique that is able to detect the subtle changes, including structural deformations and bi-lateral asymmetry together with other anomalies (e.g., calcifications, nodules, densities) [4].
The mammography procedure is considered an essential tool for screening and for diagnostics. A screening mammogram comprises two visualizations of each breast, and it is highly recommended for women aged 40 years old or over. If suspicious regions are detected in the mammogram, additional mammograms need to be considered. A screening mammogram is performed in order to assess the breast tissue for any abnormalities and to establish a foundation for future investigations.
Compared to screening, a diagnostic mammogram is applied when there is a need for an accurate diagnosis. In this case, when there is any evidence of a lump or small tumor, a more focused investigation is conducted. A diagnostic mammogram is also performed when a specific region of the breast is being followed over a period of time [5]. Diagnostic mammograms provide much more information based on the acquired additional images that also include spot compression or spot compression with magnification [6] and can also offer a broader insight into the detected malformations during the screening phase.

2.1.2. Ultrasound

Compared to the previous medical imaging technique, ultrasound images are monochrome, with low resolution and can effectively differentiate cysts from solid masses, whereas mammography cannot. However, the malignant areas in ultrasound imaging are visualized as irregular shapes with blurred edges. The presence of speckle noise, an underlying property of the ultrasound imaging technique, also downgrades the images’ performance as it reduces their resolution and contrast [7].

2.1.3. Magnetic Resonance Imaging (MRI)

MRI is a non-invasive medical imaging technique that uses a magnetic field and radio waves to produce detailed cross-sectional images of the organs and monitored tissues. Breast MRI is recognized as the technique with the greatest sensitivity when compared to other screening tests as it projects the shape, size, and position of the specific tumors. However, it is a time-consuming and expensive procedure.

2.1.4. Histopathology

Histopathological evaluation is a microscopic examination of the organ’s tissue [8]. It is considered the gold standard for BC assessment as it provides the phenotypic information which is crucial for BC diagnosis and treatment. At the same time, there are constraints regarding histopathology images for breast cancerous cells in terms of high coherence, high intra-class and low inter-class differences.

2.1.5. Thermography

Another medical imaging model is represented by breast thermography. It is based on the increased quantity of heat produced by the malignant cells which may indicate significant anomalies at the breast level. Thermal imaging is considered a non-invasive and non-contact technique and is efficient in early detection of BC. Additionally, it was observed that this imaging modality can help in advancing the diagnosis of BC 8–10 years earlier than other medical imaging techniques. However, it only alerts the patient regarding certain changes, but the proper diagnosis is efficiently performed afterwards.
Nevertheless, in most cases, BC is often detected after the symptoms appear which delays the adoption of the proper treatment. This may lead to reaching an advanced phase and increasing the risk of BC degeneration. Thus, a series of strategies and studies have been continuously developed in order to detect BC early.

2.2. Deep Learning Methods for BC Detection and Classification

Artificial intelligence (AI) has started to play a major role in diagnosis and decision-making procedures in the medical field. Many applications are based on machine learning (ML) or deep learning (DL) techniques for classification, identification or segmentation of BC. While mammography is the most commonly used screening method, it has limitations, such as low sensitivity, particularly for women with dense breast tissue. To address this issue, researchers have explored the use of synthetic images generation to improve breast cancer detection.
DL techniques can handle large amounts of data and automatically extract features by analyzing high-dimensional and correlated data efficiently. DL models have been utilized and evaluated for the identification and prognosis of BC, and have shown promising results. Therefore, AI in BC screening and diagnosis involves object segmentation and tumor classification (benign or malignant); it has proved to be an impressive tool for cancer treatment. The reviewed studies are divided into three categories, based on their proposed approaches—transfer learning & data augmentation, feature extraction & multiple model-based architectures and generative adversarial networks.

2.2.1. Transfer Learning and Data Augmentation

Boudouh et al. [9] proposed a tumor detection model using transfer learning and data augmentation to prevent overfitting. They used three pre-trained CNN architectures: AlexNet, VGG16, and VGG19 on a dataset of 4000 pre-processed images from two databases (Digital Database for Screening Mammography—DDSM and Chinese Mammography Database—CMD). A data augmentation approach was applied to improve model quality. AlexNet and VGG16 achieved great performances: between 99.5% and 100% accuracy, respectively, with trainable layers. However, using the models without training the specified layers led to poor performances and insufficient results.
An end-to-end training technique with a DL-based algorithm to classify local image patches was proposed in [10]. They trained a patch classifier using DDSM, a fully annotated dataset with regions of interest (ROI), and then transferred the learning to the INbreast dataset [11]. VGG-16 and ResNet-50 were used as classifier models in two steps: patch classifier training followed by whole-image classifier training. Transfer learning on the INbreast test set resulted in the best performance, with an area under the receiver operating characteristics curve (AUC) of 0.95.
A framework for BC image segmentation and classification to assist radiologists in early detection and improve efficiency is proposed in [12]. This utilizes multiple DL models including InceptionV3, DenseNet121, ResNet50, VGG16, and MobileNetV2, to classify mammographic images as benign or malignant. Additionally, a modified U-Net model is used for breast area segmentation in Cranio Caudal (CC) and Mediolateral Oblique (MLO) views. Transfer learning and data augmentation are used to overcome the challenge of the lack of tagged data.
The challenges of training DL models for medical imaging due to the limited size of freely accessible biomedical image datasets and privacy/legal issues are highlighted in [13]. Overfitting is a common problem due to the lack of generalized output. Data augmentation is used to increase the training set size using various transformations. The manuscript surveys different data augmentation techniques for mammogram images to provide insights into basic and DL-based augmentation techniques.
Another proposed approach for BC detection and classification comprises five stages including contrast enhancement, TTCNN architecture, transfer learning, feature fusion, and feature selection [14]. The method achieved high accuracies of 99.08%, 96.82%, and 96.57% on DDSM, INbreast, and MIAS datasets, respectively, but performance may vary on different images due to factors such as background noise or overfitting.
In addition to the previous related studies, BreastNet18 is a method proposed in [15] and it is based on a fine-tuned VGG16 with customized hyper-parameters and layer structures on a previously augmented CBIS-DDSM dataset [16]. An ablation study was also performed on the results, testing different batch sizes, flattening layers, loss functions or optimizers, followed by the most representative parameters. Transfer learning was also applied in [17]. The conducted study proposes a DL method using CNN to classify mammography regions, achieving an accuracy of 97.8%. Data cleaning, preprocessing, and augmentation improved the accuracy of mass recognition. Two experiments were conducted to validate the consistency of the model, using five different deep convolutional neural networks and a support vector machine algorithm.
A standard system that describes the mammogram output is represented by the breast imaging reporting and data system (BI-RADS). A DNN-based model that accurately classifies mammograms into eight BI-RADS categories (0, 1, 2, 3, 4A, 4B, 4C, 5) is presented by Tsai et al. [18]. The model was trained using block-based images and achieved an overall accuracy of 94.22%, an average sensitivity of 95.31%, an average specificity of 99.15%, and an AUC of 0.9723. This work is the first to completely classify mammograms into all eight BI-RADS categories.
Another study that involved the BI-RADS categories was presented by Dang et al. [19] and it involved 314 mammograms. Twelve radiologists interpreted the examinations in two sessions: the first one, without AI, and the second one, with the help of AI. In the second session, the radiologists improved their ability to assign mammograms to the correct BI-RADS category without slowing down the interpretation time.
Transfer learning and data augmentation are crucial techniques for improving the performance of deep learning models. They are effective in preventing overfitting, enhancing the model’s generalization ability, and achieving better performance on smaller datasets with limited computational resources. However, using transfer learning without the proper cautions, may lead to overfitting of the new data if the new data are significantly different from the original dataset on which the model was trained. Additionally, data augmentation techniques may require generating additional training data, which can be time-consuming and computationally intensive; it may also generate irrelevant or unrealistic data.

2.2.2. Feature Extraction and Multiple Model-Based Architectures

Advancements in radiographic imaging (mammograms, CT scans, MRI) have made it possible to diagnose breast cancer at an early stage, but analysis by experienced radiologists and pathologists can be costly and error-prone [20]. Computer vision and ML, particularly DL, show potential in detecting and classifying BC using these images, as they can efficiently handle large amounts of data and automatically extract features.
In order to achieve a robust model for accurately detecting BC, Wang et al. [21] used a well-established dataset of multi-instance mammography images to train multiple models (AlexNet, VGG-16, VGG-19, ResNet-18, ResNet-34, ResNet-50, ResNet-101), ResNet-18 being the one with the best results. It is accompanied by some custom layers for feature extraction and a feature fusion module. A three-layer fully connected network was used as the classifier, achieving an accuracy of 85.48% and an AUC of 0.884. The study showed the effectiveness of using multi-instance mammography datasets for BC detection, but additional images could improve the results.
An ensemble model for BC diagnosis based on mammography images was described by Melekoodappattu et al. [22] as they used a CNN and a feature extraction technique. The preprocessing part encompassed the median filter for noise removal as well as image enhancement for improving the contrast. The ensemble of a nine-layer CNN and the feature extraction method (identifying the texture features and diminishing their dimensions based on uniform manifold approximation and projection—UMAP technique) had good performances: an accuracy of 96.00% for the Mammographic Image Analysis Society (MIAS) repository and 97.90% accuracy for the DDSM dataset.
A simplified CNN architecture for feature learning and fine-tuning was proposed by Altan et al. [23] to classify mammography images into normal or malignant. The DDSM repository was used as it contains 2260 images which were fed into the proposed CNN architecture that consists of 18 layers. Considering its simple CNN architecture, the model achieved good performance with an accuracy of 92.84%.
Another evaluation of DL-based AI techniques for detecting BC on digital mammogram images was performed by Frazer et al. [24], testing the effect of different data-processing strategies and backbone DL models. The best result achieved an AUC of 0.8979 and an accuracy of 0.8178 by using certain DL models, combining global and local features, and leveraging background cropping, text removal, contrast adjustment, and more training data.
Eroǧlu et al. [25] proposed a CNN hybrid system for breast ultrasonography image classification. The system was based on the Alexnet, MobilenetV2, and Resnet50 models, which were used for feature extraction. Further, the features were concatenated, and the mRMR (Minimum Redundancy Maximum Relevance) algorithm was applied for feature selection. Finally, the classification step was performed through SVM and KNN classifiers.
DL-based techniques have shown promising results in many medical image analysis applications. Feature extraction techniques can help in identifying the most relevant features that have the greatest impact on the output, thereby improving the overall performance of the model and its generalization by reducing overfitting and increasing the model’s ability to generalize to new and unseen data.
Training and testing multiple model-based architectures can help improve the performance, generalization, and adaptability of models by identifying the proper model that best understands the data and is the most robust to changes in the data distribution. However, it is also important to consider the potential disadvantages and trade-offs involved in their use, such as loss of information or bias in feature selection; they are also time-consuming and at risk of overfitting.

2.2.3. Generative Adversarial Networks

In ML, generative modeling refers to the task of discovering and understanding the patterns or regularities in input data without any supervision. The objective is to develop a model that can create or produce new instances that are similar to the original dataset. One way to accomplish this is through the use of generative adversarial networks (GANs).
One of the challenges in BC detection is the limited availability of large-scale datasets, which can make it difficult to train accurate ML models. GANs can overcome this challenge by generating synthetic images that closely resemble real medical images. The synthetic images can be used to augment the dataset, increasing the sample size and improving the accuracy of the models trained on the augmented dataset. Additionally, GANs can be used to generate different views or angles of a breast tumor, which can help in detecting cancerous regions that might be difficult to see in traditional 2D medical images. GANs can also be used to simulate different imaging modalities, such as ultrasound [26], and MRI [27], which can provide additional information and improve the accuracy of breast cancer diagnosis.
Simulated mammograms can be created with GANs [28]. The study aimed to detect mammographically-occult (MO) cancer in women with dense breasts and a conditional generative adversarial network (CGAN) was developed to simulate a mammogram with normal appearance; a CNN was trained to detect MO cancer. The study found that using CGAN-simulated mammograms improved the MO cancer detection when compared to using only real or simulated mammograms.
Another study that emphasized the use of GANs for mammographic images augmentation is described in [29]. The GAN-generated images were compared with affine transformation augmentation methods, and the results showed that the GAN approach performed better in preventing overfitting and improving classification accuracy. However, the study also highlighted that GAN-generated or augmented images should not substitute real images in training CNN classifiers due to the risk of overfitting.
The gap in the availability of training datasets is overcome by using GAN to synthesize data similar to real sample images in [30]. However, current publicly available datasets for characterizing abnormalities in digital mammograms do not contain sufficient data for some abnormalities. This paper proposes a GAN model, named ROImammoGAN, which synthesizes ROI-based digital mammograms to learn a hierarchy of representations for abnormalities in digital mammograms. The proposed GAN model was applied to MIAS datasets, and the performance evaluation yielded a competitive accuracy for the synthesized samples.
Another study that synthetized high-resolution mammograms, enabling user-controlled global and local attribute-editing of the generated images is presented in [31]. The model was evaluated in a double-blind study by expert mammography radiologists, achieving an average AUC of 0.54 and indicating the potential use of the synthesized images in advancing and facilitating medical education.
To overcome the challenges of limited size and class imbalance of publicly available mammography datasets, the study in [32] proposed a synthetically augmented the dataset by adding lesions onto healthy screening mammograms. The authors trained a class-conditional GAN to perform contextual in-filling and experimentally evaluated its effectiveness in improving BC classification performance using a ResNet-50 classifier. The results show that GAN-augmented training data improves the AUC compared to traditionally augmented data, demonstrating the potential of this approach.
However, there are some limitations in using GAN towards BC applications, such as data availability, as GANs require large amounts of high-quality data to train effectively. GANs can also be notoriously difficult to interpret, and it can be challenging to understand how the network arrived at its decision; this can be difficult for a medical-related application. Additionally, the class imbalance can lead to the GANs bias towards the majority class (mostly negative cases), thus leading to false negatives; they can also struggle with generalization on new and unseen data.

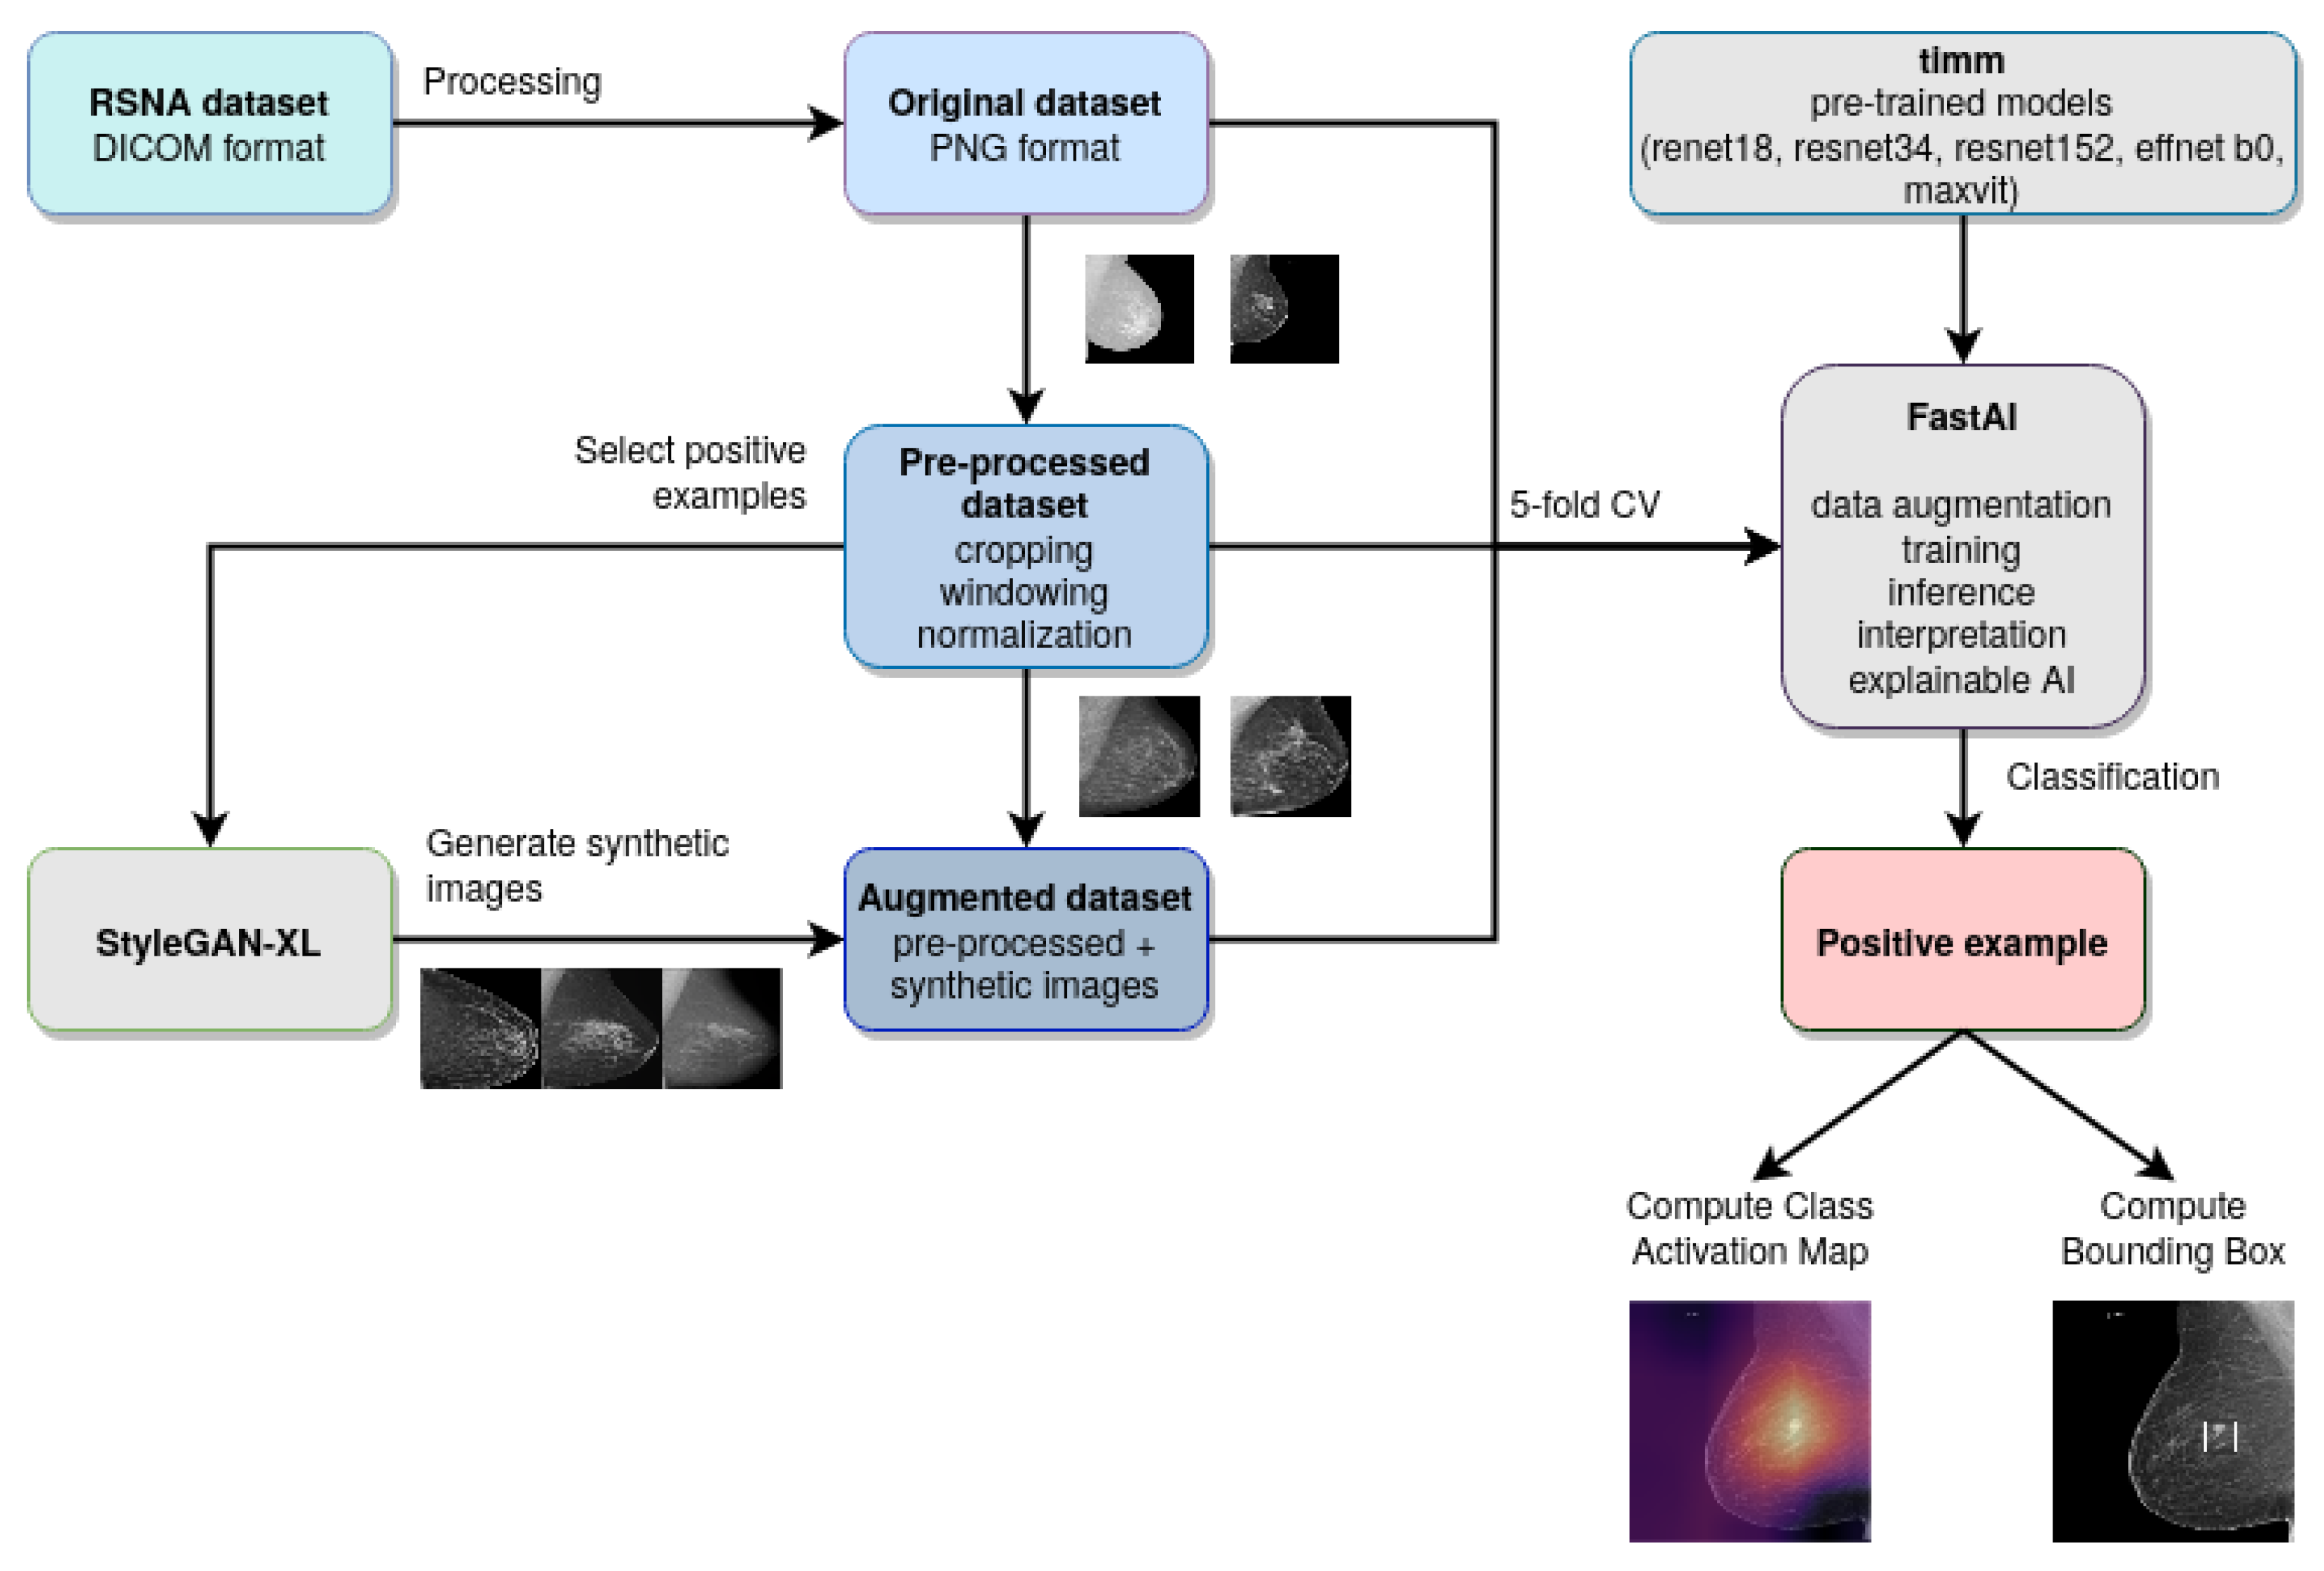
3. Materials and Methods

In this study, we aim to experiment with deep learning-based techniques for detecting cancer in mammograms. For this, we use the dataset provided by the Radiological Society of North America (RSNA) in a Kaggle competition [33]. Its aim was to detect instances of breast cancer in mammograms obtained during screening examinations.
The dataset used in this competition was based on the ADMANI dataset [34], which contains annotated digital mammograms and non-image data, and is possibly the most extensive and diverse mammography dataset documented in the literature. The dataset incorporates a total of 28,911 instances of breast cancer, out of which 22,270 were detected during screening and 6641 were interval cases, significantly more than any other dataset published so far. The dataset also consists of a large number of examinations (1,048,345) and patients (629,863), making it one of the largest datasets reported to date [35]. However, the training set for this public competition consists of 11,913 examinations, out of which 486 are cancer cases, making it a very unbalanced dataset.
The experimental process took place in three stages. The raw images from the RSNA dataset were used in the first stage, scaled to 256 × 256 and 512 × 512 resolution. In the second stage, pre-processing techniques were used, such as cropping, windowing, and normalization. The windowing process, which is used before normalization, involves brightness adjustment and gives a much greater contrast between soft and dense tissues, enhancing the visualization of specific anatomical structures or pathological features within an image.
In order to overcome the class imbalance, we over-sample the positive examples in a ratio of 5:1 and investigate the generation of synthetic images for the positive class. Therefore, 1000 synthetic images were generated as positive examples using the StyleGAN-XL model [36] in the third stage. The experimental methodology is presented in Algorithm 1.
One of the key innovations of the StyleGAN-type models is their ability to generate high-resolution images with impressive detail and realism, including photorealistic portraits of human faces. It achieves this by using a progressive growing strategy, in which the resolution of the generated images is gradually increased as the network learns to capture more complex visual patterns.
The training process for the StyleGAN-XL model was executed progressively, starting from training a model for images of a size of 16 × 16 pixels. In the second step, based on this model, a new model was trained to generate 32 × 32 images. Finally, the model was scaled to generate images of 256 × 256 pixels. The model was trained so that the discriminator could see 3 million images. In the end, the FID50k score was 9.8. The improvement of the synthetic image generator is presented in Figure 1.
We have also trained the StyleGAN-XL model to generate images with a resolution of 512 × 512 pixels. Using the previous best model, which was trained for the 256 × 256 resolution as the stem, we trained for 400 k images and obtained a FIDK50 score of 13.66.
All the trained models’ weights and associated data files are available in Supplementary Material.
FID50K stands for Fréchet inception distance (FID) on the dataset of 50,000 generated images. It is a metric for evaluating the quality of generated images produced by generative models such as GANs, and has been shown to correlate well with human perception of image quality.
The specific parameters for training the StyleGAN-XL model are given in Table 1.
Because the training set was small and had only one class of images, the model size was reduced to improve the training speed. Therefore, the initial model used as a stem had 7 layers (syn_layers), and then in later stages, 4 more layers were added (head_layers). The generator had a capacity factor of 16384 (cbase), and the feature maps size was 256 (cmax).    
Algorithm 1: Experimental methodology
Applsci 13 04272 i001
For experimentation, the dataset was split into train/validation sets using a 5-fold stratified cross-validation strategy so that each fold had approximately the same proportion of positive and negative samples as the original dataset and to ensure that the model is trained and validated on a representative subset of the entire dataset. A visual representation of the experiment setup to better understand the methodology used in the study is presented in Figure 2.

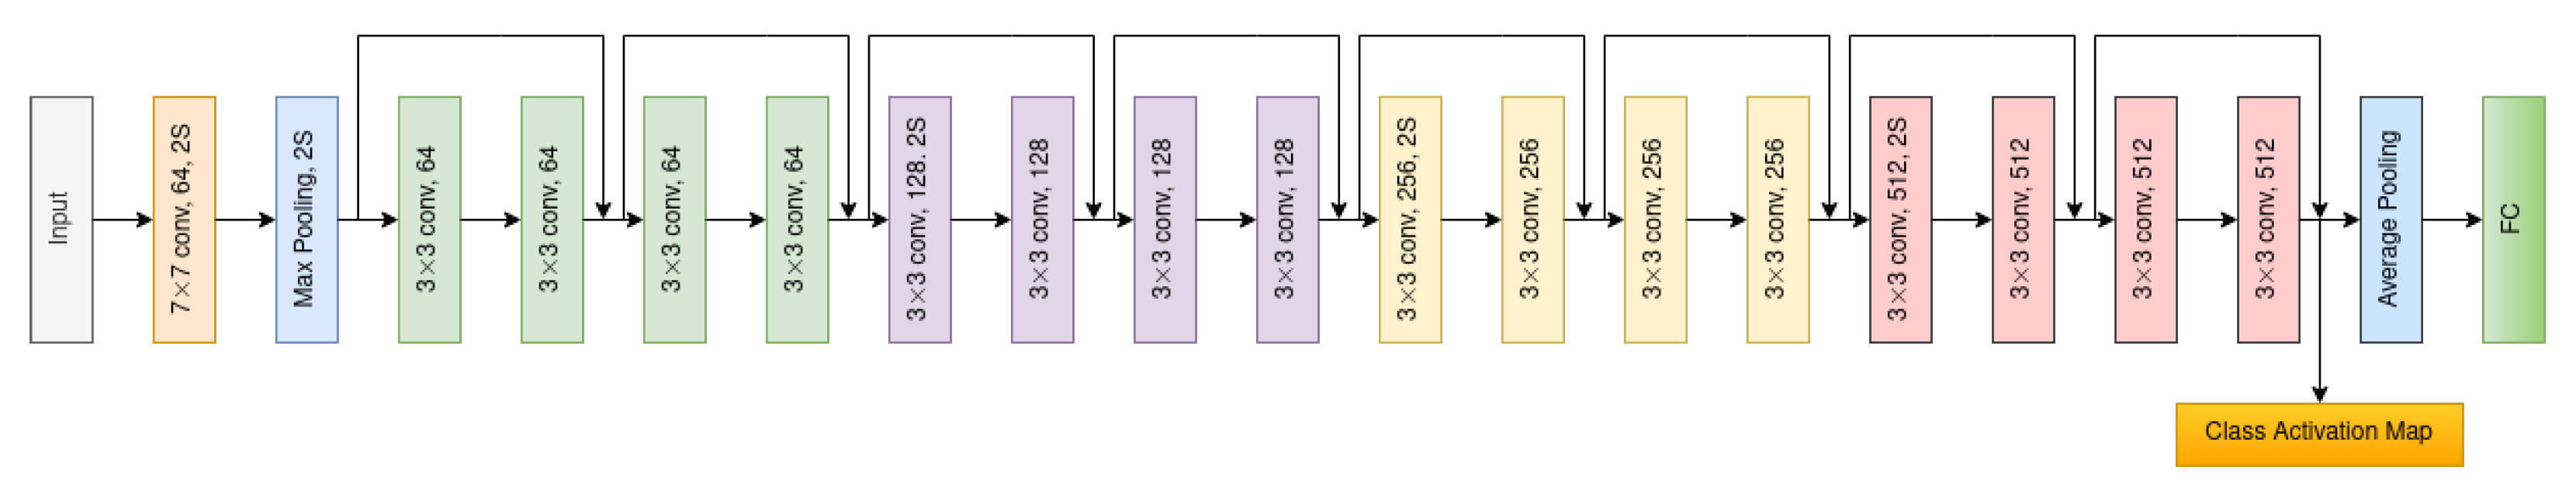
3.1. Computer Vision Models
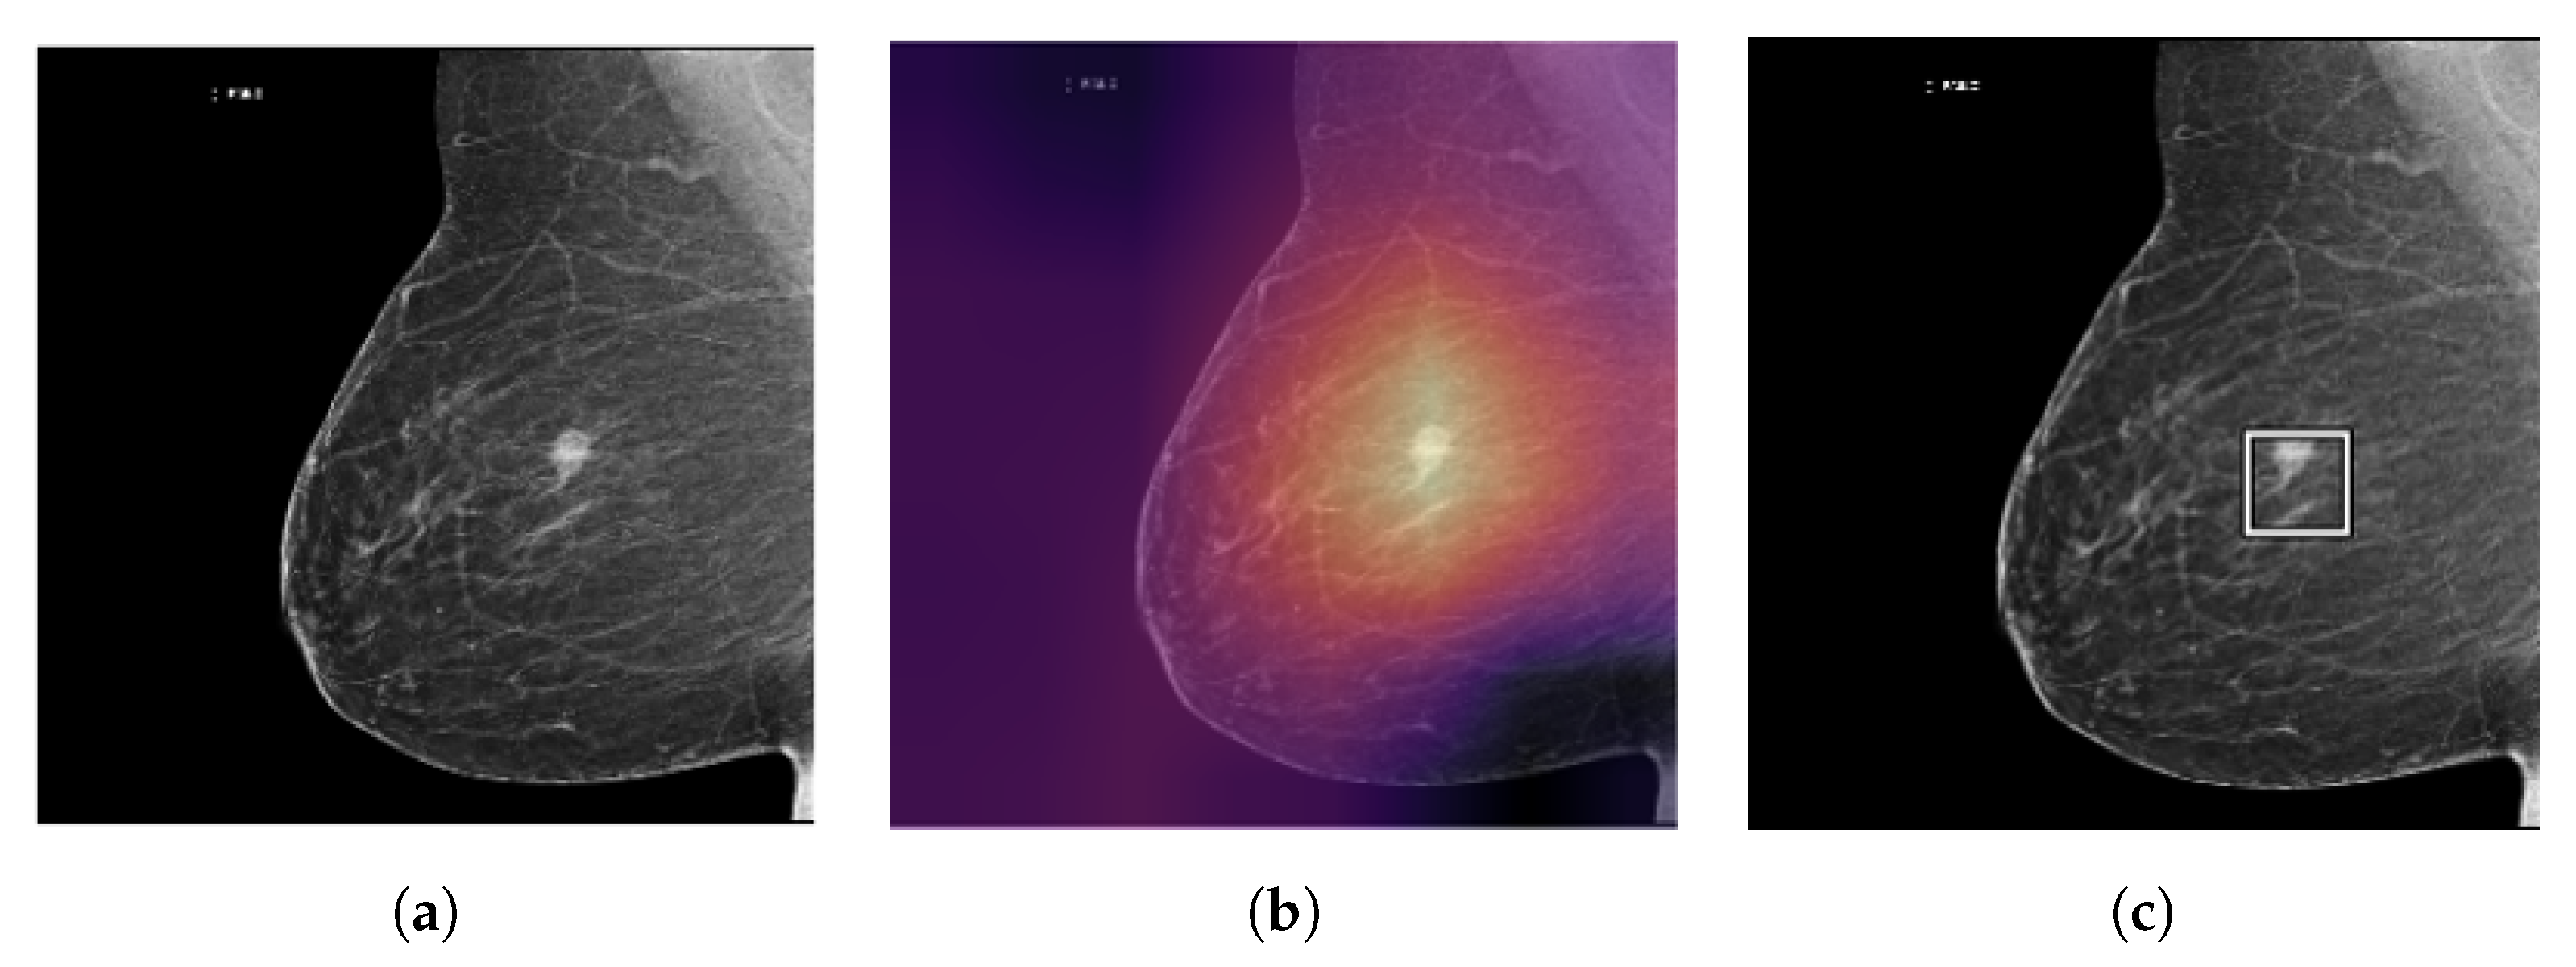
We experimented with several deep learning models based on CNN and ViT architectures, such as ResNet [37] or EfficientNet [38], and MaxViT [39].
ResNet is a type of CNN that was introduced by researchers at Microsoft in 2015. ResNet is designed to address the problem of vanishing gradients in deep neural networks by introducing residual connections.
The idea behind residual connections is to add a shortcut connection between the input and output of a block of layers, allowing the network to learn residual functions that map the input directly to the output. This helps to mitigate the vanishing gradient problem, which can occur when training very deep neural networks. In ResNet, residual connections are introduced every few layers, allowing the network to learn increasingly complex functions without suffering from degradation in performance.
The ResNet architecture consists of multiple blocks of convolutional layers with batch normalization and activation functions, followed by a global average pooling layer and a fully connected output layer. The number and type of layers can be varied depending on the specific application, but the basic building block is the residual block with two or more convolutional layers.
EfficientNet is also a family of CNN architectures that was introduced in 2019 by researchers at Google. The main goal of EfficientNet is to achieve high accuracy on image classification tasks while minimizing the computational cost and number of parameters needed. It achieves this by using a compound scaling method that scales the width, depth, and resolution of the network in a systematic manner. This approach ensures that the network is both efficient and effective, as it balances the trade-off between accuracy and computational cost.
Specifically, the EfficientNet architecture combines three techniques: (a) Efficient scaling up or down the width, depth, and resolution of the network in a systematic way; (b) Use of a new mobile inverted bottleneck convolution (MBConv) block, which reduces computation and increases accuracy; (c) Use of a compound coefficient that controls the network scaling uniformly, making it easier to scale up or down the network for different resource constraints.
The result is a family of CNN architectures that is highly efficient and has achieved state-of-the-art results on several image classification tasks, including the ImageNet dataset. The EfficientNet family includes seven models, labeled EfficientNet B0 through EfficientNet B7, with B0 being the smallest and B7 the largest and most computationally expensive. The EfficientNet models have also been adapted for other computer vision tasks such as object detection and semantic segmentation.
MaxViT is based on the ViT architecture and has introduced a new attention model, named multi-axis attention, that is both efficient and scalable. This model has two components: blocked local attention and dilated global attention, which allow for global-local spatial interactions on any input resolution while maintaining linear complexity. In addition, a new architectural element integrates the attention model with convolutions, resulting in a simple hierarchical vision backbone that can be easily repeated over multiple stages.
The main difference between ViT and CNN architectures is their approach to processing visual information.
CNNs are a type of neural network that are specifically designed to process images and other 2D data, such as video frames. They use convolutional layers to extract features from the input image, followed by pooling layers to downsample the feature maps and reduce their spatial dimensionality. This process is repeated multiple times to gradually extract higher-level features that capture increasingly complex patterns in the input image. Finally, the extracted features are flattened and passed through one or more fully connected layers to generate the final output.
In contrast, Vision Transformers (ViT) rely on the transformer architecture, which was originally developed for natural language processing (NLP) tasks. Instead of using convolutional layers to extract features from the input image, ViT applies a self-attention mechanism to capture global dependencies between all pairs of pixels in the image. This attention-based mechanism allows the model to attend to relevant regions of the image and integrate information across the entire image, enabling it to learn complex patterns and relationships.
As opposed to CNNs, the ViT is designed to capture global dependencies in the input image using self-attention, whereas CNNs use convolutional layers to extract features from local regions of the image and gradually combine them to capture higher-level patterns. ViT has shown promising results on certain image classification tasks, but CNNs are still widely used and often perform better on other tasks, such as object detection and segmentation

3.2. Explainable AI

Explainable AI (XAI) is particularly important for medical image analysis, and specifically for mammography, because decisions based on AI can have a significant impact on patients’ lives. In order to gain trust and acceptance of AI systems in healthcare, it is important that the reasoning behind the decisions made by these systems can be understood and validated by healthcare professionals.
The interpretation of mammograms requires specialized expertise and can be highly subjective. By providing explanations for the decisions made by AI systems analyzing mammograms, healthcare professionals can better understand and interpret the results, and potentially reduce the risk of missed or false diagnoses.
However, mammograms can be complex and difficult to interpret, even for experts in the field. Providing explanations for AI-based decisions can help identify the specific features or patterns in the image that were used to make the decision, and potentially improve the accuracy and consistency of the interpretation.
XAI can also help to identify biases or errors in the AI model’s decision-making process. For example, it can help identify features in the image that are disproportionately influencing the decision, or highlight cases where the model may be making incorrect or biased decisions.
For computer vision applications, there are several techniques that can be used to achieve explainability:
  • Saliency maps: Saliency maps highlight the regions of an input image that are most important for the model’s prediction. These maps can be generated using techniques such as gradient-based methods or activation maximization, which analyze the gradients or activations of the model’s layers to determine which parts of the image are most relevant;
  • Class activation maps: Class activation maps (CAM) are a type of saliency map that focuses specifically on the regions of an image that correspond to a specific class label. CAMs can be used to visualize which parts of the image are most responsible for the model’s classification decision.
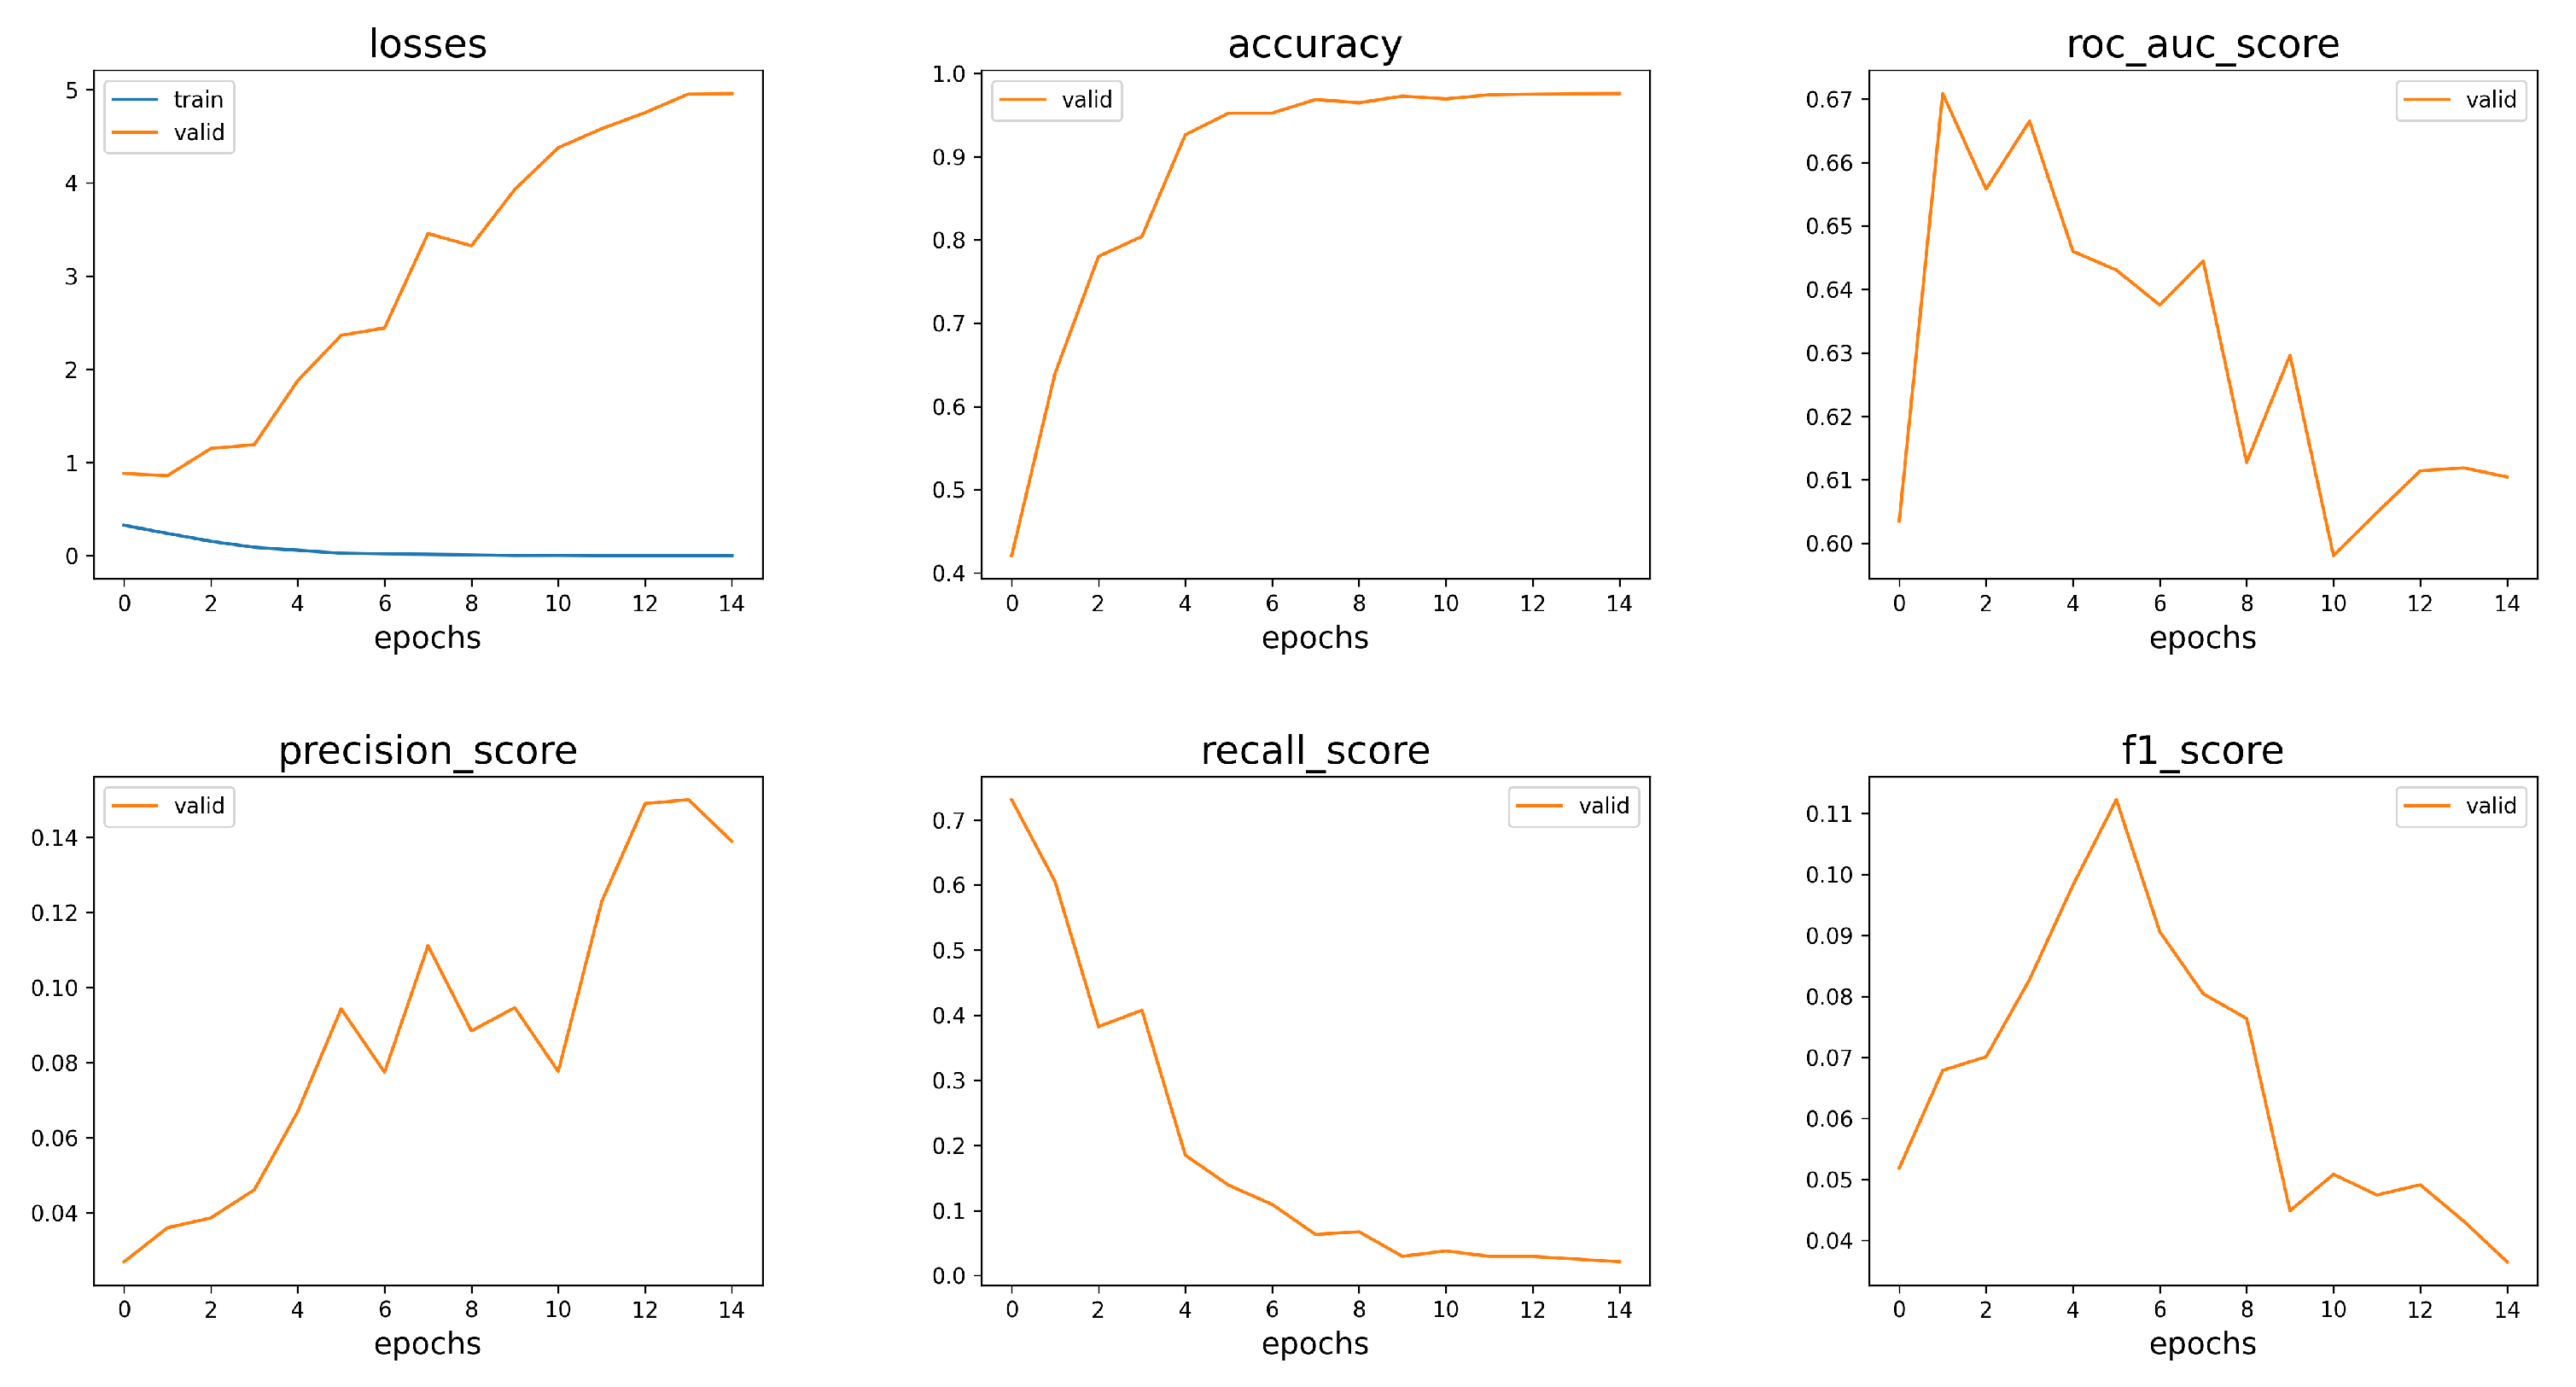
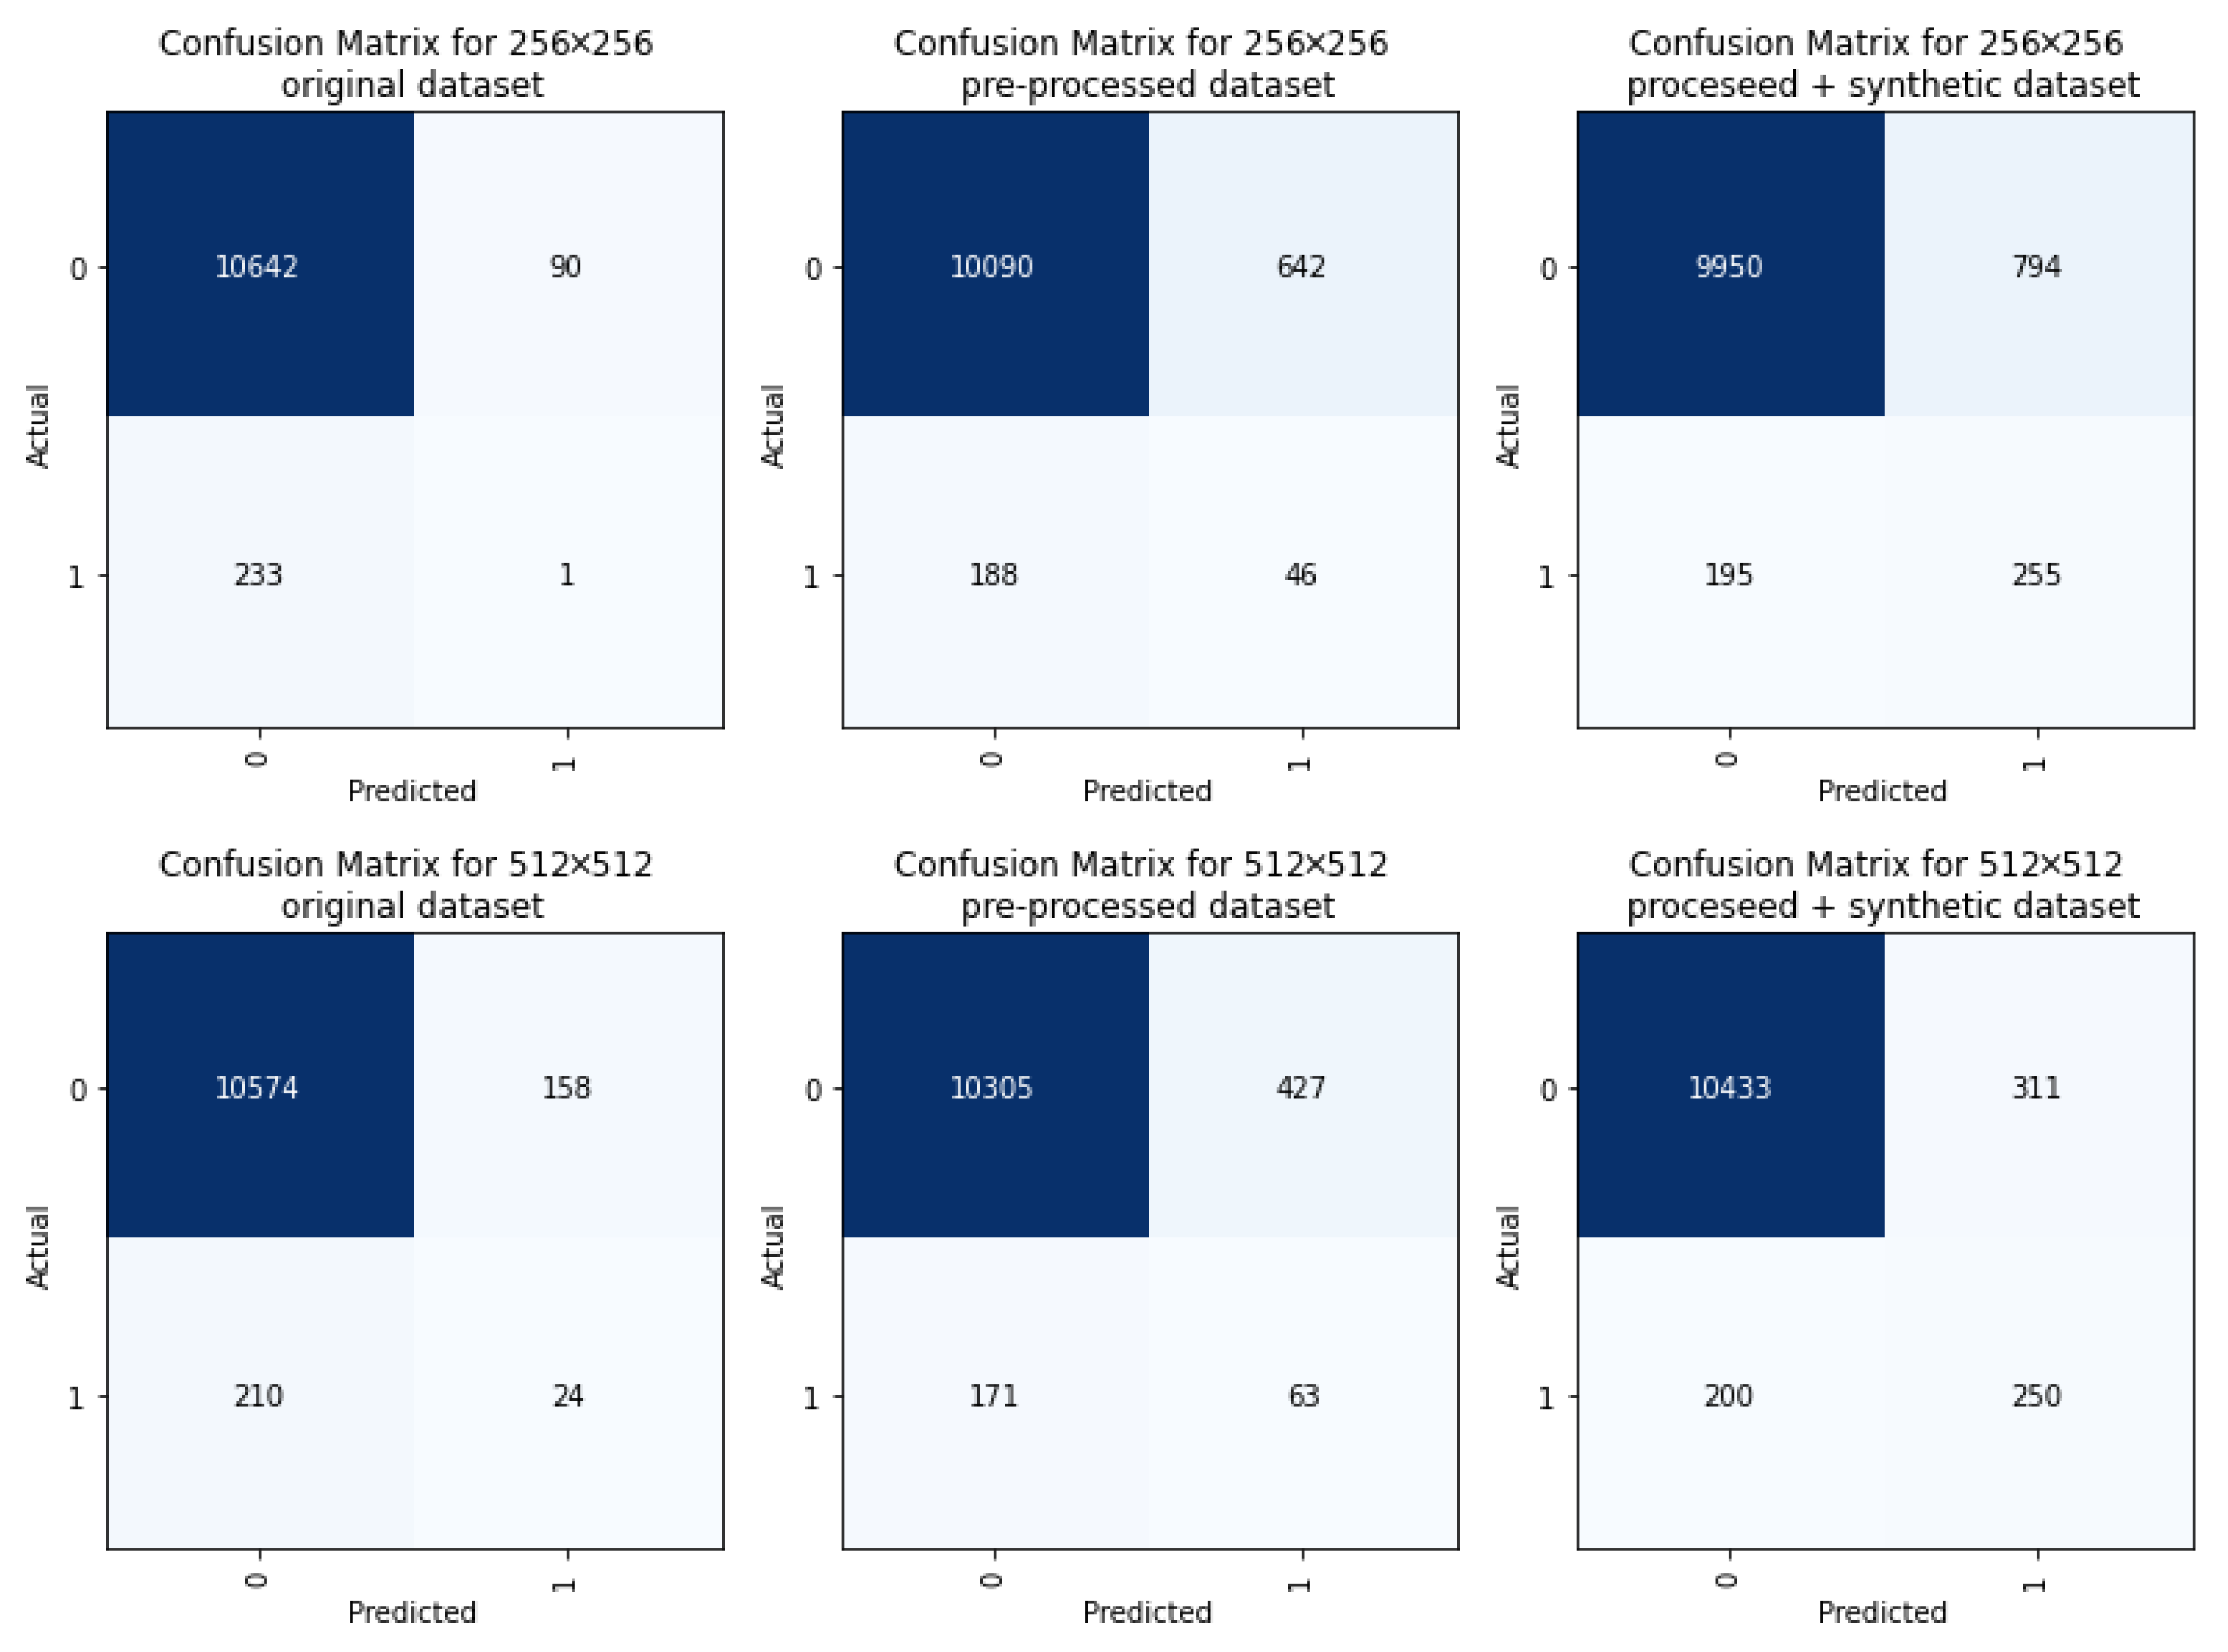
Fastai [40] provides a Grad-CAM (gradient-weighted class activation mapping) solution [41] for visualizing the regions of an input image that are most important for a model’s prediction. Grad-CAM [42] is a popular technique for generating heatmaps that highlight the regions of an image that are most important for a particular class, and has been used in a variety of computer vision applications.
The class activation map uses the output of the last convolutional layer together with the weights of the fully connected layer that corresponds to the predicted class. It calculates their dot product so that for each position in the feature map it is possible to get the score of the feature used for the prediction.
The Grad-CAM implementation in Fastai can be used with any PyTorch model and is based on the hook functionality of PyTorch. For example, in Figure 3, we present the architecture of the ResNet18 model and show the position just before the average pooling layer, where the hook should be inserted, to calculate the class activation map.

4. Results

For experimentation, the images from the dataset were first resized to a uniform size of 256 × 256 and 512 × 512 pixels, in order to facilitate their processing and analysis. Additionally, a range of pre-trained models from the timm library [43] were utilized, such as “resnet18”, “resnet34”, “resnet152”, “efficientnet_b0”, and “maxvit_nano_rw_256”. These pre-trained models can be fine-tuned to specific image recognition tasks. The Fastai framework was used to implement the models and to streamline the training process. The results are presented in Table 2.
During training, we used a batch size of 64. The training process was repeated for three epochs, and a learning rate of 1e-4 was used to control how quickly the model updates its parameters during training.
The performance of the models was evaluated using accuracy, AUC, precision, recall, and the F1 score. Accuracy measures the proportion of correct predictions made by the model, while AUC measures the model’s ability to distinguish between positive and negative examples; the F1 score is a measure of the model’s precision and recall. An important aspect is that the training process was only performed with a small number of epochs because it was found that models started to overfit very quickly. This can be seen in Figure 4, which shows the evolution metrics used for training.
It should also be noted that although the accuracy obtained in the third stage was slightly weaker than that achieved in the second stage, the values of the AUC metric and the F1 metric were significantly higher. This indicates that the models were able to better distinguish between positive and negative examples, which is crucial for many computer vision applications. This can be better seen in Figure 5 where the confusion matrices for the ResNet18 model experiments are represented.
The performance of relatively simple CNN models, such as ResNet18, was almost as good as larger models such as ResNet152 or EfficientNet B0. Furthermore, the performance of the CNN models was found to be comparable to that of the model based on visual transformer architecture.
However, what made the most significant difference was the pre-processing of the dataset, specifically the augmentation of the dataset using synthetically generated images. This pre-processing technique helped to improve the overall performance of the models, resulting in better evaluation metrics.
The results suggest that while larger and more complex models may not always be necessary, careful pre-processing and data augmentation techniques can significantly improve the performance of even simple models. This highlights the importance of optimizing the pre-processing steps and the potential of synthetically generated data to enhance the performance of models in computer vision tasks.
After the deep learning model made a classification decision on an image, two visualization techniques were applied to better understand how the model made its decision.
The first visualization technique involved generating class activation maps. This technique was used to identify the regions of the input image that were most important for the model’s classification decision. A corresponding layer was applied to the model output to generate the class activation maps. These maps highlighted the specific areas of the image that the model used to make its decision and provided visual evidence of the model’s reasoning.
The second visualization technique involved generating a centered bounding box around the area of the image that was most important for the classification decision. This technique provided a more intuitive way of understanding the model’s decision-making process by highlighting the specific area of the image that was most relevant for the classification.
The area with the highest activation value was identified and a centered bounding box was generated around that area. The resulting bounding box was presented in Figure 6, providing a clear visual representation of the area of the image that the model used to make its decision.
These visualization techniques provided a useful way of understanding how the deep learning model classified images as positive or negative. They helped to identify the specific areas of the image that the model used to make its decision and provided a more intuitive way of interpreting the model’s output. These techniques can be valuable tools for analyzing and interpreting the behavior of deep learning models.

5. Discussion

One limitation of the study is that the images were scaled to a resolution of 256 × 256 and 512 × 512 pixels, which may have limited the classification performance. While this choice of image resolution offered the advantage of reducing the need for computing resources during experimentation, it is possible that the performance of the models could be improved by using images with a higher resolution.
Furthermore, the classification process was performed on a single image, even though each person in the dataset had at least four images. One possible way of improving the classification process could be to simultaneously classify multiple images of the same person using techniques such as the one presented in [44] in order to improve the accuracy of the classification results.
Another limitation of the study is that only positive examples were used to generate the synthetic images. This approach was taken in order to balance the dataset and prevent bias towards the negative class. However, a new possibility for experimentation could be to use two classes of images, both for positive and negative examples, in order to explore the performance of the models in a more realistic scenario.

6. Conclusions

Breast cancer is the most common type of cancer among women, and early detection is essential for successful treatment. Deep learning techniques can be used to improve the accuracy and efficiency of breast cancer screening workflows by analyzing images obtained from various screening methods, such as mammography, thermography, ultrasound, and magnetic resonance imaging (MRI).
Recently, the introduction of AI technology has shown promise in the field of automated breast cancer detection in digital mammography, and studies have shown that these AI algorithms are on par with human-performance levels in retrospective data sets.
As early diagnosis and prevention of breast cancer are critical for effective treatment and reducing the number of deaths, the incorporation of AI into breast cancer screening is a new and emerging field that shows promise in the early detection of breast cancer, leading to a better prognosis for the condition.
The aim of this study was to explore the use of deep learning methods for analyzing mammograms, and the results of the study demonstrated the importance of proper data pre-processing and augmentation techniques. By using synthetic data generation techniques, the classification performance of the models was significantly improved, demonstrating the potential for these techniques in improving the accuracy of deep learning models in image classification tasks.

Supplementary Materials

StyleGAN-XL Model Weights and Data Files. This supplementary material contains the StyleGAN-XL model weights and data files used to generate the synthetic images in this study. The files are available for download at https://zenodo.org/record/7794274 (accessed on 17 March 2023). These resources can be used to reproduce the results presented in the paper and facilitate further research in the area.

Author Contributions

Conceptualization, M.P., E.P. and A.S.; methodology, M.P., E.P. and A.S.; software, A.S.; validation, A.S.; investigation, M.P., E.P. and A.S.; resources, M.P. and A.S.; writing—original draft preparation, E.P. and A.S.; writing—review and editing, M.P., E.P. and A.S.; visualization, A.S.; supervision, A.S.; project administration, A.S. All authors have read and agreed to the published version of the manuscript.

Funding

The results presented in this article have been funded by the Ministry of Investments and European Projects through the Human Capital Sectoral Operational Program 2014–2020, Contract no. 62461/03.06.2022, SMIS code 153735. E.P. and A.S. acknowledge the support given by the project “PN 23 38 05 01: Advanced Artificial Intelligence techniques in science and applied domains.”

Institutional Review Board Statement

Not applicable.

Informed Consent Statement

Not applicable.

Data Availability Statement

StyleGAN-XL model weights and data files presented in this study are available in Supplementary Material.

Acknowledgments

The results presented in this article have been funded by the Ministry of Investments and European Projects through the Human Capital Sectoral Operational Program 2014–2020, Contract no. 62461/03.06.2022, SMIS code 153735. E.P. and A.S. acknowledge the support given by the project “PN 23 38 05 01: Advanced Artificial Intelligence techniques in science and applied domains.”

Conflicts of Interest

The authors declare no conflict of interest.

References

  1. Arnold, M.; Morgan, E.; Rumgay, H.; Mafra, A.; Singh, D.; Laversanne, M.; Vignat, J.; Gralow, J.R.; Cardoso, F.; Siesling, S.; et al. Current and future burden of breast cancer: Global statistics for 2020 and 2040. Breast 2022, 66, 15–23. [Google Scholar] [CrossRef] [PubMed]
  2. WHO. Breast Cancer. Available online: https://www.who.int/news-room/fact-sheets/detail/breast-cancer. (accessed on 27 February 2023).
  3. Clinic, M. Breast Calcifications: When to See a Doctor. Available online: https://www.mayoclinic.org/symptoms/breast-calcifications/basics/definition/sym-20050834. (accessed on 27 February 2023).
  4. Altameem, A.; Mahanty, C.; Poonia, R.C.; Saudagar, A.K.J.; Kumar, R. Breast Cancer Detection in Mammography Images Using Deep Convolutional Neural Networks and Fuzzy Ensemble Modeling Techniques. Diagnostics 2022, 12, 1812. [Google Scholar] [CrossRef] [PubMed]
  5. Health, U. Breast Cancer Diagnosis. Available online: https://www.ucsfhealth.org/Conditions/BreastCancer/Diagnosis. (accessed on 27 February 2023).
  6. Case, A. Differences between Screening & Diagnostic Mammograms. 2020. Available online: https://www.midstateradiology.com/blog/breast-imaging/screening-diagnostic-mammograms/, (accessed on 27 February 2023).
  7. Michailovich, O.; Tannenbaum, A. Despeckling of medical ultrasound images. IEEE Trans. Ultrason. Ferroelectr. Freq. Control 2006, 53, 64–78. [Google Scholar] [CrossRef] [PubMed]
  8. Rulaningtyas, R.; Hyperastuty, A.S.; Rahaju, A.S. Histopathology Grading Identification of Breast Cancer Based on Texture Classification Using GLCM and Neural Network Method. J. Physics: Conf. Ser. 2018, 1120, 012050. [Google Scholar] [CrossRef]
  9. Boudouh, S.S.; Bouakkaz, M. Breast Cancer: Breast Tumor Detection Using Deep Transfer Learning Techniques in Mammogram Images. In Proceedings of the 2022 International Conference on Computer Science and Software Engineering (CSASE), Duhok, Iraq, 15–17 March 2022; IEEE: Duhok, Iraq, 2022; pp. 289–294. [Google Scholar] [CrossRef]
  10. Shen, L.; Margolies, L.R.; Rothstein, J.H.; Fluder, E.; McBride, R.; Sieh, W. Deep Learning to Improve Breast Cancer Detection on Screening Mammography. Sci. Rep. 2019, 9, 12495. [Google Scholar] [CrossRef]
  11. Moreira, I.C.; Amaral, I.; Domingues, I.; Cardoso, A.; Cardoso, M.J.; Cardoso, J.S. INbreast. Acad. Radiol. 2012, 19, 236–248. [Google Scholar] [CrossRef]
  12. Salama, W.M.; Aly, M.H. Deep learning in mammography images segmentation and classification: Automated CNN approach. Alex. Eng. J. 2021, 60, 4701–4709. [Google Scholar] [CrossRef]
  13. Oza, P.; Sharma, P.; Patel, S.; Adedoyin, F.; Bruno, A. Image Augmentation Techniques for Mammogram Analysis. J. Imaging 2022, 8, 141. [Google Scholar] [CrossRef]
  14. Maqsood, S.; Damaševičius, R.; Maskeliūnas, R. TTCNN: A Breast Cancer Detection and Classification towards Computer-Aided Diagnosis Using Digital Mammography in Early Stages. Appl. Sci. 2022, 12, 3273. [Google Scholar] [CrossRef]
  15. Montaha, S.; Azam, S.; Rafid, A.K.M.R.H.; Ghosh, P.; Hasan, M.Z.; Jonkman, M.; De Boer, F. BreastNet18: A High Accuracy Fine-Tuned VGG16 Model Evaluated Using Ablation Study for Diagnosing Breast Cancer from Enhanced Mammography Images. Biology 2021, 10, 1347. [Google Scholar] [CrossRef]
  16. Lee, R.S.; Gimenez, F.; Hoogi, A.; Miyake, K.K.; Gorovoy, M.; Rubin, D.L. A curated mammography data set for use in computer-aided detection and diagnosis research. Sci. Data 2017, 4, 170177. [Google Scholar] [CrossRef]
  17. Mahmood, T.; Li, J.; Pei, Y.; Akhtar, F. An Automated In-Depth Feature Learning Algorithm for Breast Abnormality Prognosis and Robust Characterization from Mammography Images Using Deep Transfer Learning. Biology 2021, 10, 859. [Google Scholar] [CrossRef]
  18. Tsai, K.J.; Chou, M.C.; Li, H.M.; Liu, S.T.; Hsu, J.H.; Yeh, W.C.; Hung, C.M.; Yeh, C.Y.; Hwang, S.H. A High-Performance Deep Neural Network Model for BI-RADS Classification of Screening Mammography. Sensors 2022, 22, 1160. [Google Scholar] [CrossRef]
  19. Dang, L.A.; Chazard, E.; Poncelet, E.; Serb, T.; Rusu, A.; Pauwels, X.; Parsy, C.; Poclet, T.; Cauliez, H.; Engelaere, C.; et al. Impact of artificial intelligence in breast cancer screening with mammography. Breast Cancer 2022, 29, 967–977. [Google Scholar] [CrossRef]
  20. din, N.M.u.; Dar, R.A.; Rasool, M.; Assad, A. Breast cancer detection using deep learning: Datasets, methods, and challenges ahead. Comput. Biol. Med. 2022, 149, 106073. [Google Scholar] [CrossRef]
  21. Wang, Y.; Zhang, L.; Shu, X.; Feng, Y.; Yi, Z.; Lv, Q. Feature-Sensitive Deep Convolutional Neural Network for Multi-Instance Breast Cancer Detection. IEEE/ACM Trans. Comput. Biol. Bioinform. 2022, 19, 2241–2251. [Google Scholar] [CrossRef]
  22. Melekoodappattu, J.G.; Dhas, A.S.; Kandathil, B.K.; Adarsh, K.S. Breast cancer detection in mammogram: Combining modified CNN and texture feature based approach. J. Ambient Intell. Humaniz. Comput. 2022. [Google Scholar] [CrossRef]
  23. Altan, G. Deep Learning-based Mammogram Classification for Breast Cancer. Int. J. Intell. Syst. Appl. Eng. 2020, 8, 171–176. [Google Scholar] [CrossRef]
  24. Frazer, H.M.; Qin, A.K.; Pan, H.; Brotchie, P. Evaluation of deep learning-based artificial intelligence techniques for breast cancer detection on mammograms: Results from a retrospective study using a BreastScreen Victoria dataset. J. Med Imaging Radiat. Oncol. 2021, 65, 529–537. [Google Scholar] [CrossRef]
  25. Eroğlu, Y.; Yildirim, M.; Çinar, A. Convolutional Neural Networks based classification of breast ultrasonography images by hybrid method with respect to benign, malignant, and normal using mRMR. Comput. Biol. Med. 2021, 133, 104407. [Google Scholar] [CrossRef]
  26. Zhai, D.; Hu, B.; Gong, X.; Zou, H.; Luo, J. ASS-GAN: Asymmetric semi-supervised GAN for breast ultrasound image segmentation. Neurocomputing 2022, 493, 204–216. [Google Scholar] [CrossRef]
  27. Haq, I.U.; Ali, H.; Wang, H.Y.; Cui, L.; Feng, J. BTS-GAN: Computer-aided segmentation system for breast tumor using MRI and conditional adversarial networks. Eng. Sci. Technol. Int. J. 2022, 36, 101154. [Google Scholar] [CrossRef]
  28. Lee, J.; Nishikawa, R.M. Identifying Women With Mammographically- Occult Breast Cancer Leveraging GAN-Simulated Mammograms. IEEE Trans. Med Imaging 2022, 41, 225–236. [Google Scholar] [CrossRef] [PubMed]
  29. Guan, S. Breast cancer detection using synthetic mammograms from generative adversarial networks in convolutional neural networks. J. Med Imaging 2019, 6, 1. [Google Scholar] [CrossRef] [PubMed]
  30. Oyelade, O.N.; Ezugwu, A.E.; Almutairi, M.S.; Saha, A.K.; Abualigah, L.; Chiroma, H. A generative adversarial network for synthetization of regions of interest based on digital mammograms. Sci. Rep. 2022, 12, 6166. [Google Scholar] [CrossRef]
  31. Zakka, C.; Saheb, G.; Najem, E.; Berjawi, G. MammoGANesis: Controlled Generation of High-Resolution Mammograms for Radiology Education. arXiv 2020, arXiv:2010.05177. [Google Scholar]
  32. Wu, E.; Wu, K.; Cox, D.; Lotter, W. Conditional Infilling GANs for Data Augmentation in Mammogram Classification. In Image Analysis for Moving Organ, Breast, and Thoracic Images; Stoyanov, D., Taylor, Z., Kainz, B., Maicas, G., Beichel, R.R., Martel, A., Maier-Hein, L., Bhatia, K., Vercauteren, T., Oktay, O., Eds.; Series Title: Lecture Notes in Computer Science; Springer International Publishing: Cham, Switzerland, 2018; Volume 11040, pp. 98–106. [Google Scholar] [CrossRef]
  33. Carr, C.; Kitamura, F.; Kalpathy-Cramer, J.; Mongan, J.; Andriole, K.; Vazirabad, M.; Riopel, M.; Ball, R.; Dane, S. RSNA Screening Mammography Breast Cancer Detection. 2022. Available online: https://kaggle.com/competitions/rsna-breast-cancer-detection (accessed on 27 February 2023).
  34. Frazer, H.M.L.; Tang, J.S.N.; Elliott, M.S.; Kunicki, K.M.; Hill, B.; Karthik, R.; Kwok, C.F.; Peña-Solorzano, C.A.; Chen, Y.; Wang, C.; et al. ADMANI: Annotated Digital Mammograms and Associated Non-Image Datasets. Radiol. Artif. Intell. 2023, 5, e220072. [Google Scholar] [CrossRef]
  35. Cadrin-Chênevert, A. Unleashing the Power of Deep Learning for Breast Cancer Detection through Open Mammography Datasets. Radiol. Artif. Intell. 2023, 5, e220294. [Google Scholar] [CrossRef]
  36. Sauer, A.; Schwarz, K.; Geiger, A. StyleGAN-XL: Scaling StyleGAN to Large Diverse Datasets. arXiv 2022, arXiv:2202.00273. [Google Scholar]
  37. Targ, S.; Almeida, D.; Lyman, K. Resnet in Resnet: Generalizing Residual Architectures. arXiv 2016, arXiv:1603.08029. [Google Scholar]
  38. Tan, M.; Le, Q.V. EfficientNet: Rethinking Model Scaling for Convolutional Neural Networks. arXiv 2020, arXiv:1905.11946. [Google Scholar]
  39. Tu, Z.; Talebi, H.; Zhang, H.; Yang, F.; Milanfar, P.; Bovik, A.; Li, Y. MaxViT: Multi-Axis Vision Transformer. arXiv 2022, arXiv:2204.01697. [Google Scholar]
  40. Howard, J.; Gugger, S. Fastai: A Layered API for Deep Learning. Information 2020, 11, 108. [Google Scholar] [CrossRef]
  41. Howard, J.; Gugger, S. Deep Learning for Coders with Fastai and Pytorch: AI Applications Without a PhD. 2020. Available online: https://github.com/fastai/fastbook (accessed on 27 February 2023).
  42. Selvaraju, R.R.; Cogswell, M.; Das, A.; Vedantam, R.; Parikh, D.; Batra, D. Grad-CAM: Visual Explanations from Deep Networks via Gradient-based Localization. Int. J. Comput. Vis. 2020, 128, 336–359. [Google Scholar] [CrossRef]
  43. Wightman, R.; Raw, N.; Soare, A.; Arora, A.; Ha, C.; Reich, C.; Guan, F.; Kaczmarzyk, J.; MrT23; Mike; et al. Pytorch Image Models. 2023. Available online: https://zenodo.org/record/4414861 (accessed on 27 February 2023). [CrossRef]
  44. Sriram, A.; Muckley, M.; Sinha, K.; Shamout, F.; Pineau, J.; Geras, K.J.; Azour, L.; Aphinyanaphongs, Y.; Yakubova, N.; Moore, W. COVID-19 Prognosis via Self-Supervised Representation Learning and Multi-Image Prediction. arXiv 2021, arXiv:2101.04909. [Google Scholar]
Figure 1. Generation of synthetic images. The results obtained after a certain number of iterations. first row—after 40 k images; second row—after 120 k images third row—after 1000 k images; fourth row—after 2000 k images; fifth row—after 2500 k images; sixth row—after 3000 k images.
Applsci 13 04272 g001
Figure 2. The conceptual model of the experimental study.
Applsci 13 04272 g002
Figure 3. ResNet 18 Architecture.
Applsci 13 04272 g003
Figure 4. ResNet18 training metrics evolution.
Applsci 13 04272 g004
Figure 5. Confusion matrices for the experimentation of the ResNet18 model.
Applsci 13 04272 g005
Figure 6. Explaining the results. (a) The original image. (b) The application of class activation maps. (c) The application of a bounding box.
Applsci 13 04272 g006
Table 1. StyleGAN-XL training parameters.
ParameterValue
cbase16,384
cmax256
syn_layers7
head_layers4
Table 2. Experimental results.
Mammograms with 256 × 256 resolution
ModelAccuracyAUCPrecisionRecallF1
Original images
ResNet180.960.610.060.040.04
ResNet340.960.630.080.060.06
ResNet1520.890.580.030.170.06
EfficientNetB00.960.590.030.020.02
MaxViT0.950.660.090.150.11
Processed images
ResNet180.920.670.070.220.11
ResNet340.930.670.090.210.13
ResNet1520.820.640.040.330.07
EfficientNetB00.950.630.080.110.09
MaxViT0.930.670.090.210.13
Processed images + synthetic images
ResNet180.920.830.260.580.36
ResNet340.940.820.340.560.42
ResNet1520.840.80.150.630.24
EfficientNetB00.950.80.390.520.45
MaxViT0.90.850.230.630.34
Mammograms with 512 × 512 resolution
ModelAccuracyAUCPrecisionRecallF1
Original images
ResNet180.970.660.160.090.12
ResNet340.970.660.160.090.12
ResNet1520.830.590.030.260.06
EfficientNetB00.960.640.10.060.08
MaxViT0.950.690.110.180.14
Processed images
ResNet180.930.720.10.260.15
ResNet340.940.710.130.240.16
ResNet1520.830.690.050.40.09
EfficientNetB00.950.690.120.180.14
MaxViT0.890.770.080.430.14
Processed images + synthetic images
ResNet180.940.850.350.590.44
ResNet340.950.840.40.580.47
ResNet1520.830.820.140.660.23
EfficientNetB00.950.840.470.550.51
MaxViT0.890.880.220.720.34
Disclaimer/Publisher’s Note: The statements, opinions and data contained in all publications are solely those of the individual author(s) and contributor(s) and not of MDPI and/or the editor(s). MDPI and/or the editor(s) disclaim responsibility for any injury to people or property resulting from any ideas, methods, instructions or products referred to in the content.

