Article

Microalgal Systems, a Green Solution for Wastewater Conventional Pollutants Removal, Disinfection, and Reduction of Antibiotic Resistance Genes Prevalence?

1
LEPABE—Laboratory for Process Engineering, Environment, Biotechnology and Energy, Faculty of Engineering, University of Porto, Rua Dr. Roberto Frias, 4200-465 Porto, Portugal
2
ALiCE—Associate Laboratory in Chemical Engineering, Faculty of Engineering, University of Porto, Rua Dr. Roberto Frias, 4200-465 Porto, Portugal
*
Authors to whom correspondence should be addressed.
Appl. Sci. 2023, 13(7), 4266; https://doi.org/10.3390/app13074266
Submission received: 25 January 2023 / Revised: 20 February 2023 / Accepted: 25 March 2023 / Published: 28 March 2023

Abstract

:
The low-efficiency rate of urban wastewater (UWW) treatment generates tons of discharged water with a high concentration of pollutants, pathogens and antibiotic-resistance genes (ARGs). Microalgal systems may be a green alternative to be implemented as a UWW polishing treatment. This study assessed the ability of Chlorella vulgaris and UWW autochthonous microalgal species (AMS) to simultaneously remove PO4–P, and reduce the proliferation of coliforms and ARGs. AMS seems to be more promising due to: (i) the higher specific growth rate, μmax (0.687 ± 0.065 d−1); (ii) efficient PO4–P removal (92.62 ± 0.10%); (iii) faster reduction of coliforms proliferation achieving concentrations below the limits of quantification (6 d); (iv) the reduction of intl1 and the ARGs sul1 and blaTEM abundance in ca. of 70.4%, 69.2%, and 75.7%, respectively (9 d); and (v) the additional reduction of these genes in ca. of 97.1%, 94.2%, and 99.9%, respectively, after 5 d storage in the dark and at room temperature. Results also revealed that the high pH values in both microalgal systems (due to microalgal growth) were highly correlated with a reduction in the proliferation of coliforms, including Escherichia coli. In conclusion, using AMS as a final polishing treatment of UWW seems to be very promising.

1. Introduction

Massive anthropogenic activities generate 359.4 × 10⁹ m3 of wastewater annually, and only 52% is treated before its discharge into natural water bodies [1]. The existing treatment methods in urban wastewater treatment plants (UWWTPs) are not effective either because [2,3,4,5,6]: (i) the conventional secondary treatments are ineffective in the reduction of contaminants of emerging concern, such as heavy metals, pharmaceuticals, and antibiotic-resistant bacteria and their genetic determinants (ARB&Gs); (ii) the implementation of tertiary treatments require high energy demands and thus are cost-effective; or (iii) some of the existent disinfection processes (such as chlorination or ozonation) imply the use of additional chemicals or the generation of other harmful by-products, some of them classified as carcinogenic compounds [7,8,9]. Hence, the continuous disposal of wastewater containing high concentrations of chemical pollutants, pathogens, and ARGs, can severely put freshwater quality at risk and jeopardize public health [1,10,11,12,13]. Reutilizing treated wastewater is seen as an alternative to reducing water demand, particularly in world regions that are affected by water scarcity. Treated UWW reutilization almost always implies a storage period for transportation or temporal need. Reports show that treated water storage may induce the regrowth of bacteria, namely ARB&Gs [14].
Therefore, the great challenge has been the development of reliable, effective, low-cost, and environmental-friendly strategies for pollutant removal and reduction of ARB&Gs proliferation in UWWTP effluents that allows a safe reutilization of treated water. Biological final treatments, namely with microalgae technology, appear as a more environmentally friendly alternative, particularly due to their high metabolic flexibility and the non-generation of toxic by-products. Additionally, the biomass obtained at the end of the process can be converted to commercially valued products, such as biofuels or biofertilizers, paying off the photobioreactor implementation’s costs [15,16]. Moreover, the operational conditions inherent to microalgal production (such as pH, dissolved oxygen and carbon dioxide concentrations, light exposure, and hydraulic retention time), were described to create hostile conditions for some potentially harmful bacteria, such as faecal coliforms [4,17,18,19,20]. Particularly, light exposure above 115 μmol m−2 s−1 has a crucial role in E. coli removal, in combination with DO values between 1.2–8.18 mg L−1 and alkaline pH (above 8.5) [21,22]. Besides, some physiological characteristics of microalgae may have a role in the reduction of pathogens’ proliferation, including [18,20,23]: (i) the production of toxins and antimicrobial compounds; (ii) the content in extracellular polymeric substances (EPS), from which humic substances are part of the composition, and (iii) the capacity of co-sedimentation with bacteria.
The possibility of forming a consortium between microalgae and bacteria has several reported benefits related to cooperative interactions in nutrient uptake, microalgal growth, environmental resistance, and pathogens reduction. Pieces of evidence show that Chlorella vulgaris in consortium with bacteria from activated sludge improved the reduction of the abundance of Pseudomonas aeruginosa, Escherichia coli, and Enterococcus faecalis in 59, 56, and 55% when compared to the single-use of activated sludge. Moreover, a recent study highlighted the potential of C. vulgaris and a C. vulgaris -Bacillus licheniformis consortium to remove exogenous plasmids carrying ARGs, such as sul1, while keeping an efficient uptake of phosphate-phosphorus (PO4–P) [24].
Even though several studies report the effective use of C. vulgaris for conventional pollutants removals, such as nitrogen and phosphorus [25,26], few are related to disinfection and ARGs reduction of abundance [4,20,24]. To the authors’ knowledge, none has evaluated the removal of conventional pollutants and the reduction of pathogens proliferation and ARGs abundance in the same system. Therefore, this study innovates by exploring the applicability and the dynamics of using microalgal systems for urban wastewater (UWW) polishing treatment to simultaneously remove conventional pollutants, reduce the proliferation of coliforms and reduce the abundance of ARGs.

2. Materials and Methods

2.1. Urban Wastewater Physicochemical Characterization

Experiments were performed using UWW freshly collected from the secondary clarifier from a conventional UWWTP located in Northern Portugal. This UWWTP has three treatment steps: (i) preliminary treatment (screening and grit removal); (ii) primary treatment (decantation); and (iii) biological treatment (activated sludge). It serves a population of less than 100,000 inhabitants and has a maximum daily average flow of approximately 2800 m3 d−1 and 6300 m3 d−1 of domestic and industrial wastewater, respectively. All samples were collected in sterile glass bottles, immediately transported to the laboratory, and processed.
UWW was characterized in terms of the following physicochemical parameters (Table 1): (i) pH, using a Consort’s C6010 electrochemical analyzer (Brussels, Belgium); (ii) chemical oxygen demand (COD); following the 5220-D Standard Methods for the Examination of Water and Wastewater [27]; (iii) PO4–P concentration, quantified according to the ascorbic acid colorimetric method described by Lee et al. [28]; (iv) nitrogen concentration based on nitrate–nitrogen levels (NO3–N), according to the United States Environmental Protection Agency (USEPA)-approved Brucine Colorimetric Method [29], and (v) humic acids (HA) concentration, indirectly determined by UV spectroscopy at 254 nm (PG Instruments Ltd., T80 UV/VIS Spectrometer) [30]. COD, PO4–P, NO3–N and HA concentrations were determined, in triplicate, through calibration curves, after a dilution series with potassium hydrogen phthalate (Merck, Germany), potassium dihydrogen phosphate (Aldrich, Germany), and humic acid sodium salt standard (Aldrich, Germany), respectively. Results are expressed in mg O2 L−1 (COD) and mg L−1 (NO3–N, PO4–P and HA).

2.2. Photobioreactors Setup

C. vulgaris CCAP 211/11B obtained from the Culture Collection of Algae and Protozoa (CCAP, Oban, UK) was kept and grown in Organization for Economic Co-operation and Development (OECD) culture medium, under a light intensity of 250 µmol m−2 s−1 with a photoperiod of 24:0 light: dark cycle (LDC).
The experiment was carried out in 1-L photobioreactors (PBRs), using a working volume of 800 mL of UWW, and operated in batch mode, as depicted in Figure 1. The UWW treatment with C. vulgaris (CV) was tested in duplicate, and positive (C+, C. vulgaris + autoclaved UWW) and negative (C-, raw UWW) controls were used to validate the results. For the inoculation of the CV and C+ reactors, a pre-inoculum of C. vulgaris grown in OECD was cultured for 5 d to guarantee that cells were in the exponential phase. PBRs were inoculated for an initial microalgal cell concentration (MCC) of 4 × 10⁴ cells mL−1. All reactors were operated under a white light-emitting diode (LED, 4000 K), with a light intensity of 250 µmol m−2 s−1 and a photoperiod of 24:0 LDC, atmospheric air bubbling at 0.3 VVM (Sicce Airlight 3300, Pozzoleone, Italy), and at room temperature (20.0 ± 2.7 °C) for 9 d. Evaporation effects were restored daily by adding deionized sterilized water. CV and C+ PBRs suffered dilution effects of around 15%, due to the addition of pre-inoculum.

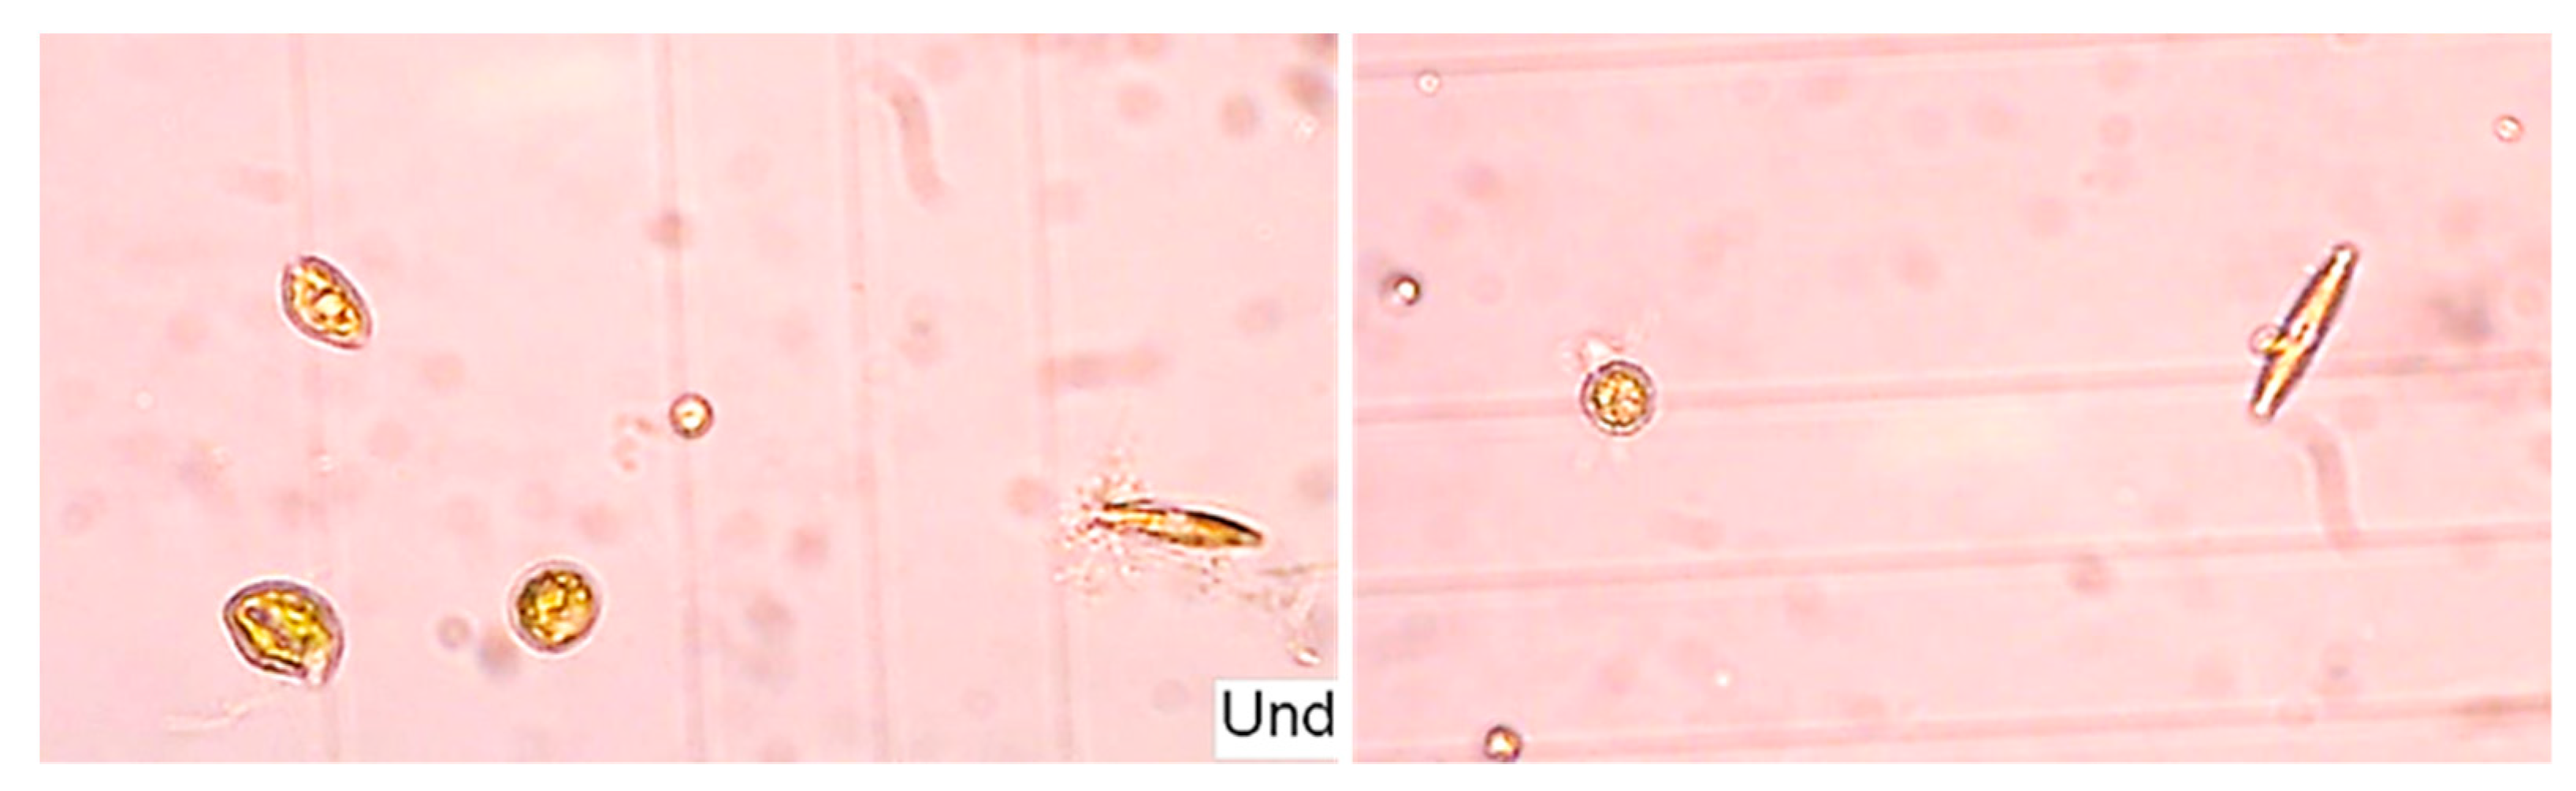
2.3. Microalgal Biomass Quantification and Microalgae Identification

The microalgal biomass was monitored and quantified over time. For each reactor, samples of 100 μL were taken on days 0, 3, 6, and 9 in duplicate, and biomass was quantified in duplicate by microscopic determination of the MCC using a Neubauer chamber (LEICA, DMLB, and Blau Brand, Steinheim, Germany).
In the different PBR conditions, the microalgal growth was evaluated and calculated, as before [26,31], in terms of: (i) maximum MCC (MCCmax), expressed in the number of cells per millilitre; (ii) specific growth rate (μmax), determined by numerical regression of the experimental data at the exponential phase (between 3rd and 9th day) and expressed in d−1; and (iii) average biomass productivities (PX,avg), expressed in cells per volume per day. Autochthonous microalgal classes of C− PBR were identified by microscopic observation with an amplification of 40× (LEICA MC 120), according to their morphology.

2.4. Microalgal Pollutants Removal

Microalgal removal of pollutants from UWW was monitored over time at days 0, 1, 2, 3, 6, and 9 of the treatment assay. Samples, 7 mL, taken in duplicate for each PBR, were centrifuged at 1431× g (Eppendorf 5804 R centrifuge, Hamburg, Germany) for 10 min, and the supernatants were frozen at −20 °C until further analysis. Supernatants were characterized, in duplicate, in terms of pH (before frozen) and concentrations of COD, PO4–P, according to the methods described in Section 2.1. Since the concentration of NO3–N in the raw wastewater was below the limit of detection (<0.2 mg L−1) it was not quantified during the experiment. Microalgal phosphorus removal was analyzed for all PBR conditions (CV, C+, and C−) in terms of mass removal (MR) and nutrient removal efficiencies (RE), as calculated before [25].

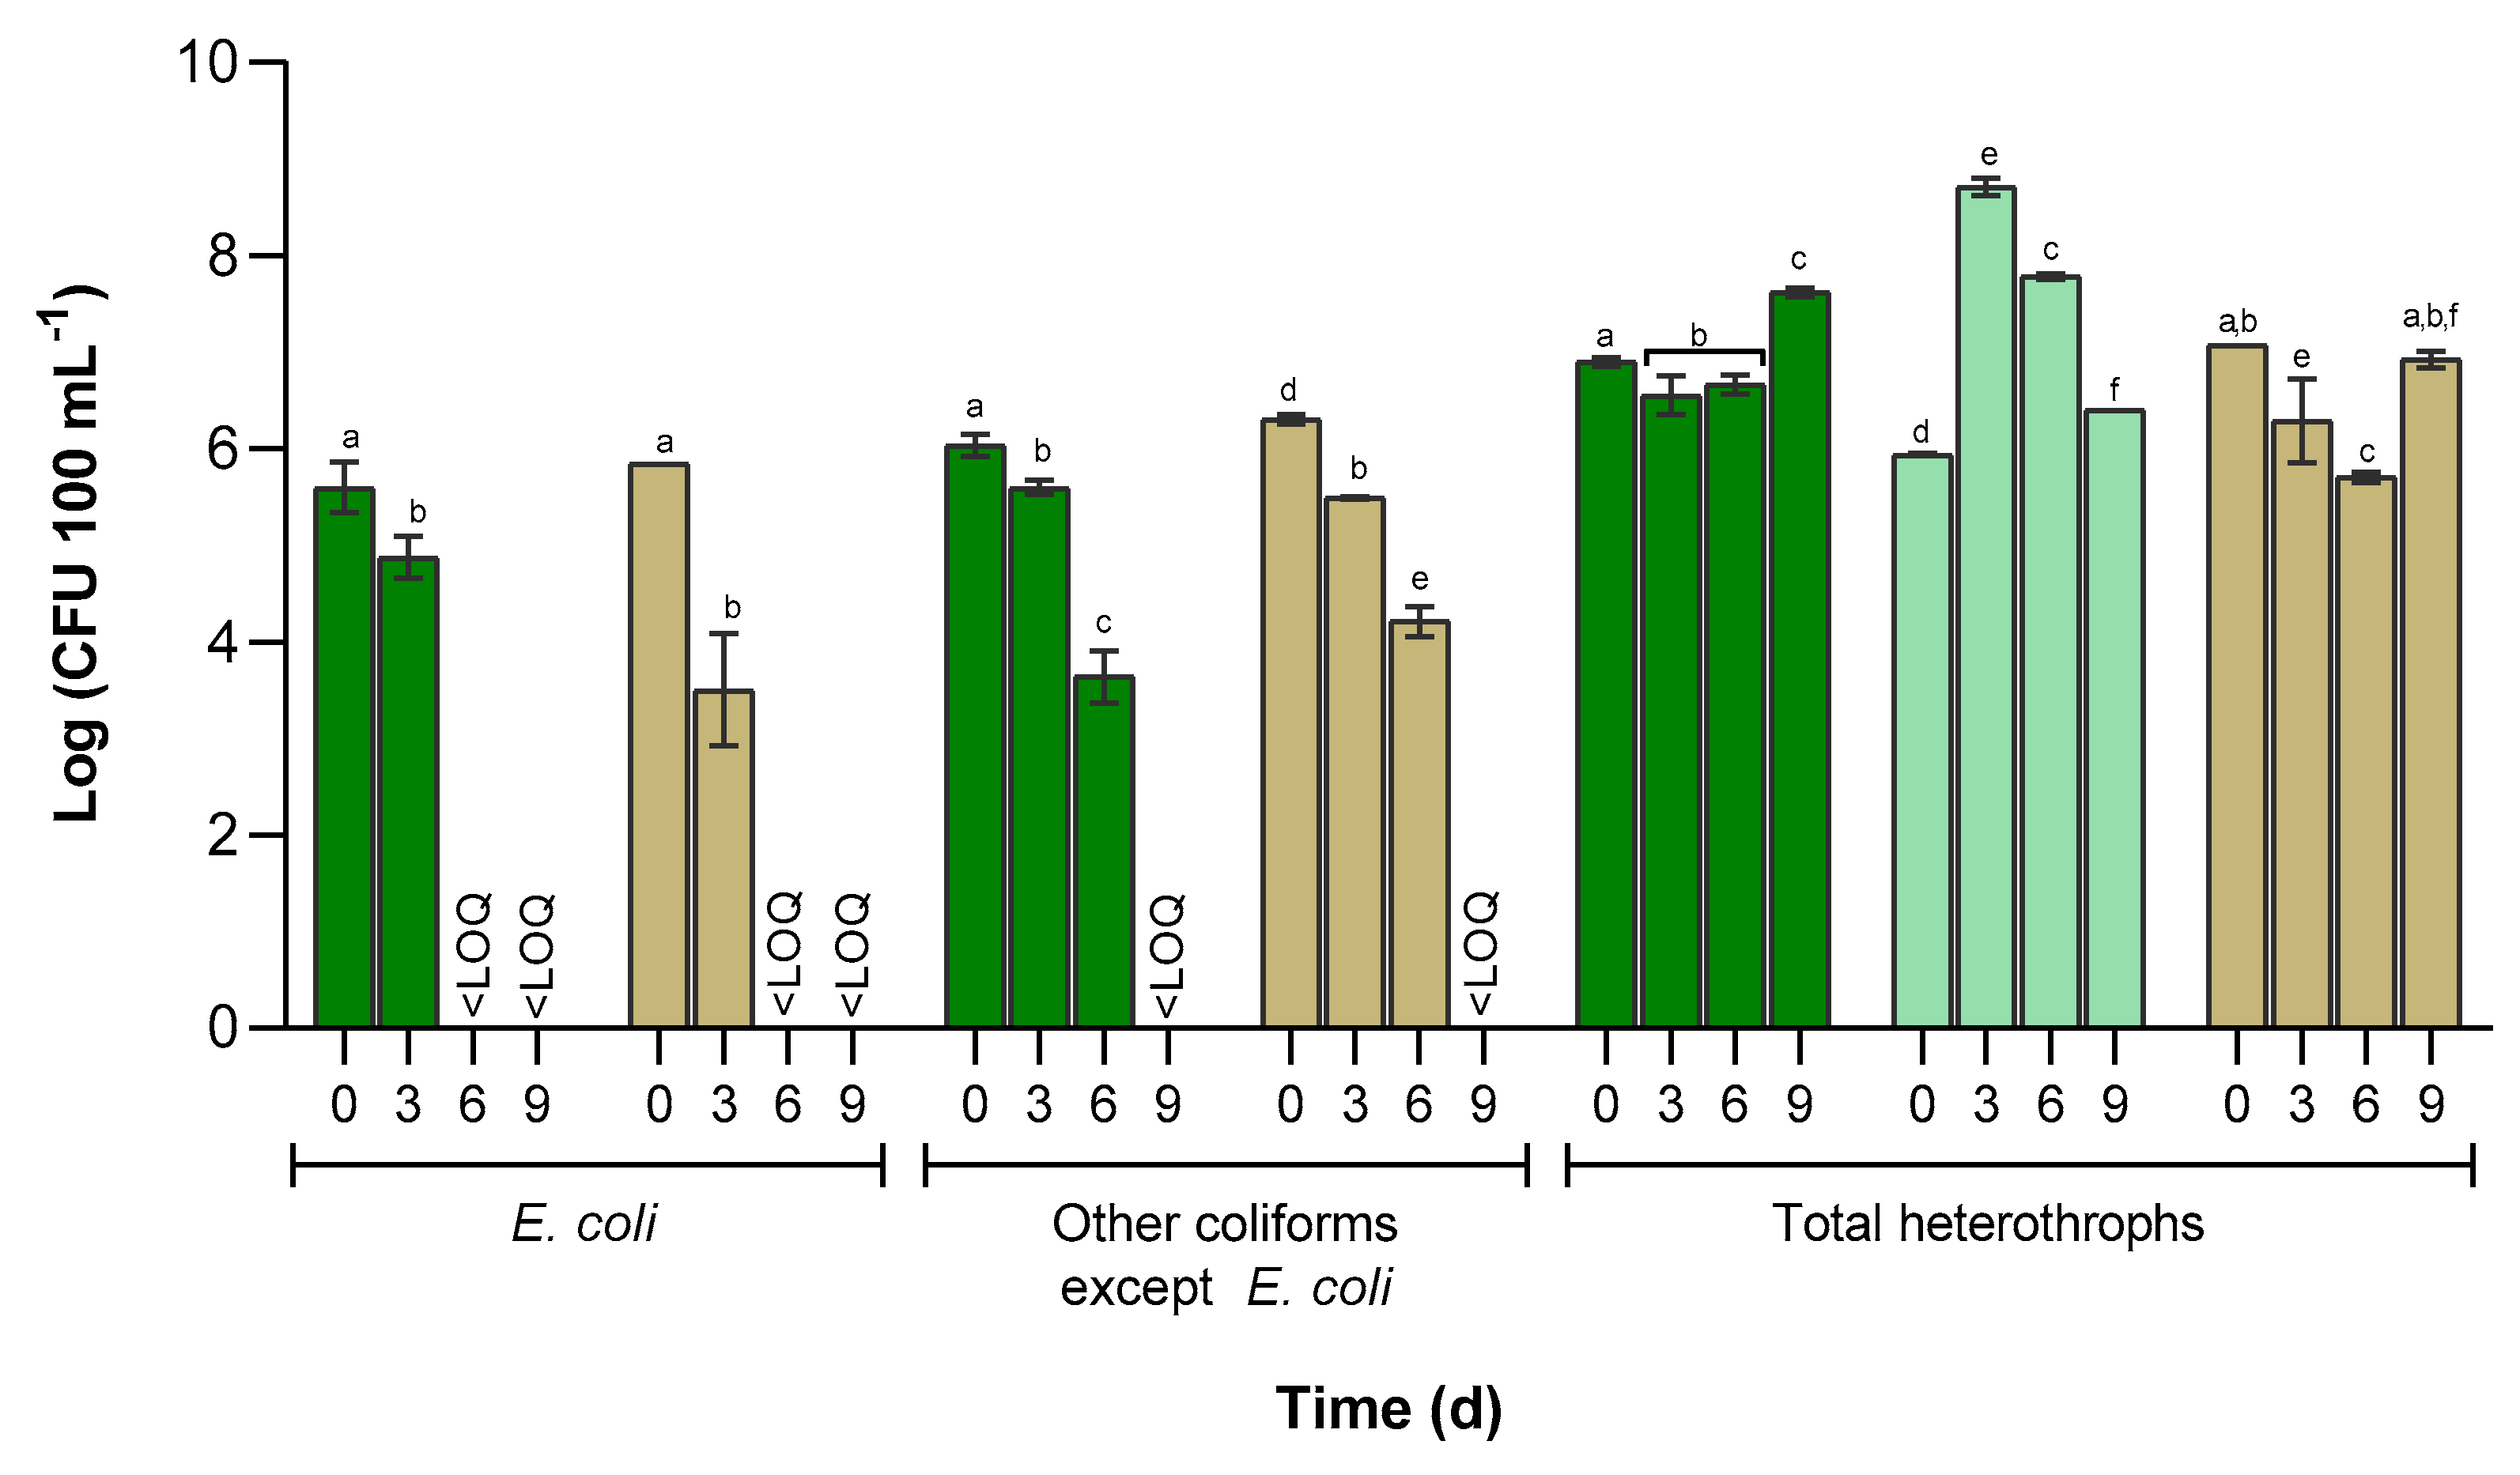
2.5. Enumeration of Culturable Microorganisms

Total heterotrophic and coliform bacteria (E. coli and other coliforms except for E. coli) were enumerated over time in each PBR. Samples of 1 mL were taken in duplicate at days 0, 3, 6, and 9, and were used to perform 10-fold dilution series. The enumeration of these culturable microorganisms was performed according to the membrane filtration method. For that, 1 mL of each serially 10-fold diluted sample was filtered through cellulose nitrate membrane filters (0.22 μm porosity; Whatman, Maidstone, UK) in duplicate. Membranes were incubated on Plate Count Agar (PCA, Merck, New York, NY, USA) at 30 °C for 48 h to enumerate total heterotrophs, and in Chromogenic Coliform Agar (CCA) at 36 °C for 24 h for E. coli (blue colony forming units) and other coliforms (pink colony forming units) enumeration.

2.6. DNA Extraction

A volume of 50 mL from each PBR was sampled on days 0 and 9. Samples were filtered through polycarbonate membranes (0.22 µm porosity; Whatman, UK), and total deoxyribonucleic acid (DNA) was extracted using the commercial kit Power Soil® DNA Isolation (MO BIO Laboratories, Inc., Carlsbad, CA, USA), according to the protocol provided by the manufacturer. Total DNA was quantified using the Qubit 3.0 Fluorometer (Invitrogen, Waltham, MA, USA) with Qubit® dsDNA HS assay kit (Invitrogen, USA), and DNA samples were stored at −20 °C before further analysis.

2.7. Quantification of 16S rRNA, intl1 and Antibiotic Resistance Genes

To determine the abundance of 16S rRNA, intI1, and the ARGs sul1 and blaTEM, a quantitative polymerase chain reaction (qPCR, StepOneTM Real-Time PCR System, Life Technologies, Carlsbad, CA, USA) was performed in duplicate for each DNA extract [32]. Quantification was attained in duplicate through a standard curve method as described in a StepOne™ Real-Time PCR System (Life Technologies, Carlsbad, CA, USA) [33], and to avoid any probable qPCR inhibition, target genes were evaluated in a serially diluted sample [34]. The abundance values of each gene (GA) were expressed as the average of log gene copy number per 100 mL, and the intI1 and ARGs prevalence was determined according to normalization with the respective 16S rRNA abundance values (GA copy number per 100 mL/16S rRNA gene copy number per 100 mL). Moreover, the percentage of reduction of resistance genes (RRG) was calculated as presented in Equation (1): where GAT0 corresponds to the GA at the beginning of the experiment (T0), and GAT9 to the GA on the last day (T9).
RRG = G A T 0 G A T 9 G A T 0 × 100

2.8. Treated Water Storage

The potential of reusing the treated water was explored for the microalgal system that revealed the best UWW treatment results. Hence, at the end of the experiment, microalgae cells were harvested by centrifugation at 1431× g (Eppendorf 5804 R centrifuge, Hamburg, Germany) for 10 min, and water (supernatant) was stored for 5 d, in the dark, and at room temperature. Water stability in terms of 16S rRNA, intl1, and ARGs abundance and prevalence was performed as described in the previous section.

2.9. Statistical Analysis

Experimental data were analyzed using GraphPad Prism 8.0. A Shapiro-Wilk test of normality was performed before the analysis of variance (ANOVA) to confirm the normal distribution of the residuals. A two-way ANOVA with Tukey’s multi-comparison test was used to find differences between growth parameters, P–PO4 removal parameters, E. coli, other coliforms and total heterotrophs, and multiple t-student tests were used to compare ARG abundance, over time and between the PBRs. A Pearson correlation was also established among all physicochemical and microbiological parameters. All statistical analyses were performed at a significance level of 0.05.

3. Results and Discussion

3.1. Microalgal Growth

The microalgal growth profile along the UWW treatment is depicted in Figure 2, and the calculated growth parameters are presented in Table 2. In this experiment, light was provided by an artificial source, LED, with continuous illumination (24:0 LDC). Although it may not represent a real-life scenario, considering that sun is the main cost-effective light source, it has been proven that microalgal N and P uptake efficiencies are higher when a continuous light supply is applied, and the absence of a dark period reduces the proliferation of bacteria [35]. The possibility of using artificial light even in open-space photobioreactors (open raceways) was shown recently [36]. Hence, to improve microalgal efficiency, this experiment was designed considering microalgal systems operated in closed photobioreactors with light provided by a low-cost artificial light supply (LEDs).
PBRs inoculated with C. vulgaris (CV and C+) showed similar growth behavior until day 6, with no significant differences (p > 0.05) in the μmax values, 0.087 ± 0.002 d−1 and 0.115 ± 0.045 d−1, respectively. No lag phase was observed in any of these PBRs; however, in the CV PBR, a deceleration and a possible stationary phase started after day 6. On the other hand, microalgal growth in the C+ reactor was in a plain exponential phase at the end of the experiment (day 9). In terms of productivity, microalgae grown in the C+ PBR attained a 3-fold higher PX,avg than in the CV PBR. Moreover, C. vulgaris on C+ PBR reached the highest Xmax, (8.1 ± 0.2) × 105 cells mL−1 (p < 0.05), probably due to the greater availability of organic carbon from the UWW sterilization process.
After a lag phase of 3 d, autochthonous microalgal species (AMS) belonging to microalgal classes Cyanophyceae, Chlorophyceae, and Bacillariophyceae (Figure 3), started to proliferate exponentially in the C− reactor until the end of the experiment, attaining the highest μmax (0.687 ± 0.065 d−1) and Px,avg ((9.0 ± 0.3) × 104 cells mL−1 d−1) (p < 0.05). The best results in terms of microalgal growth in C− can be associated, to some extent, with the cooperation effects between bacteria and microalgae and greater adaptation of AMS to the UWW than C. vulgaris [37].

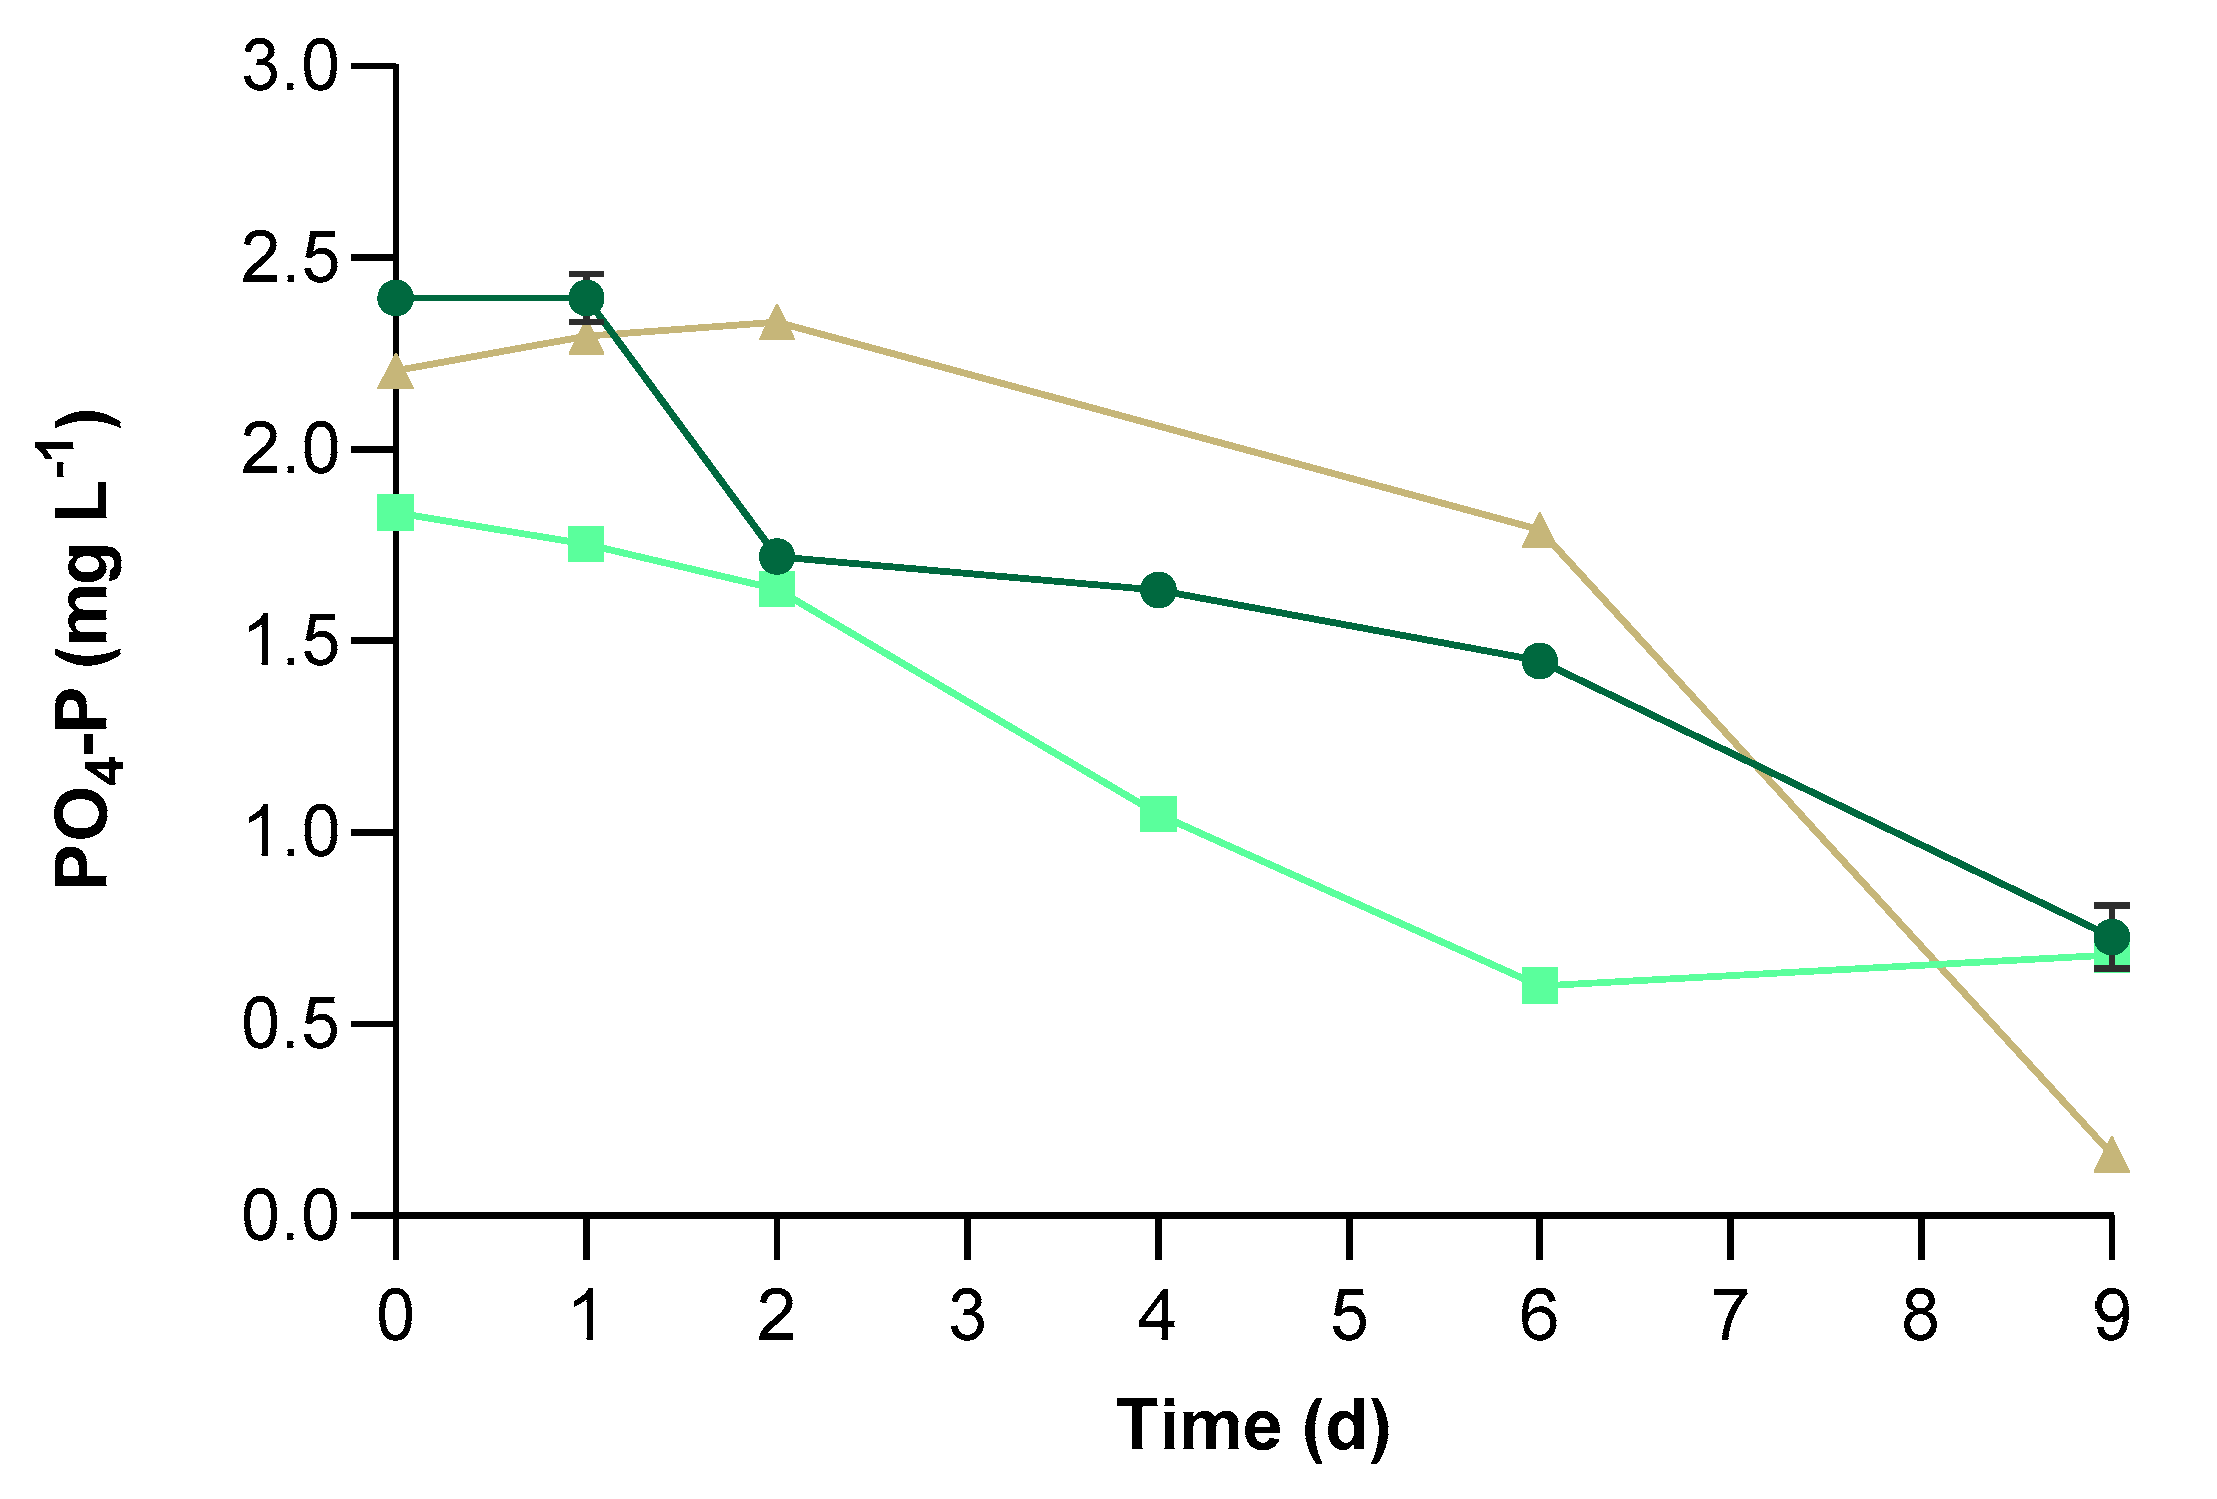
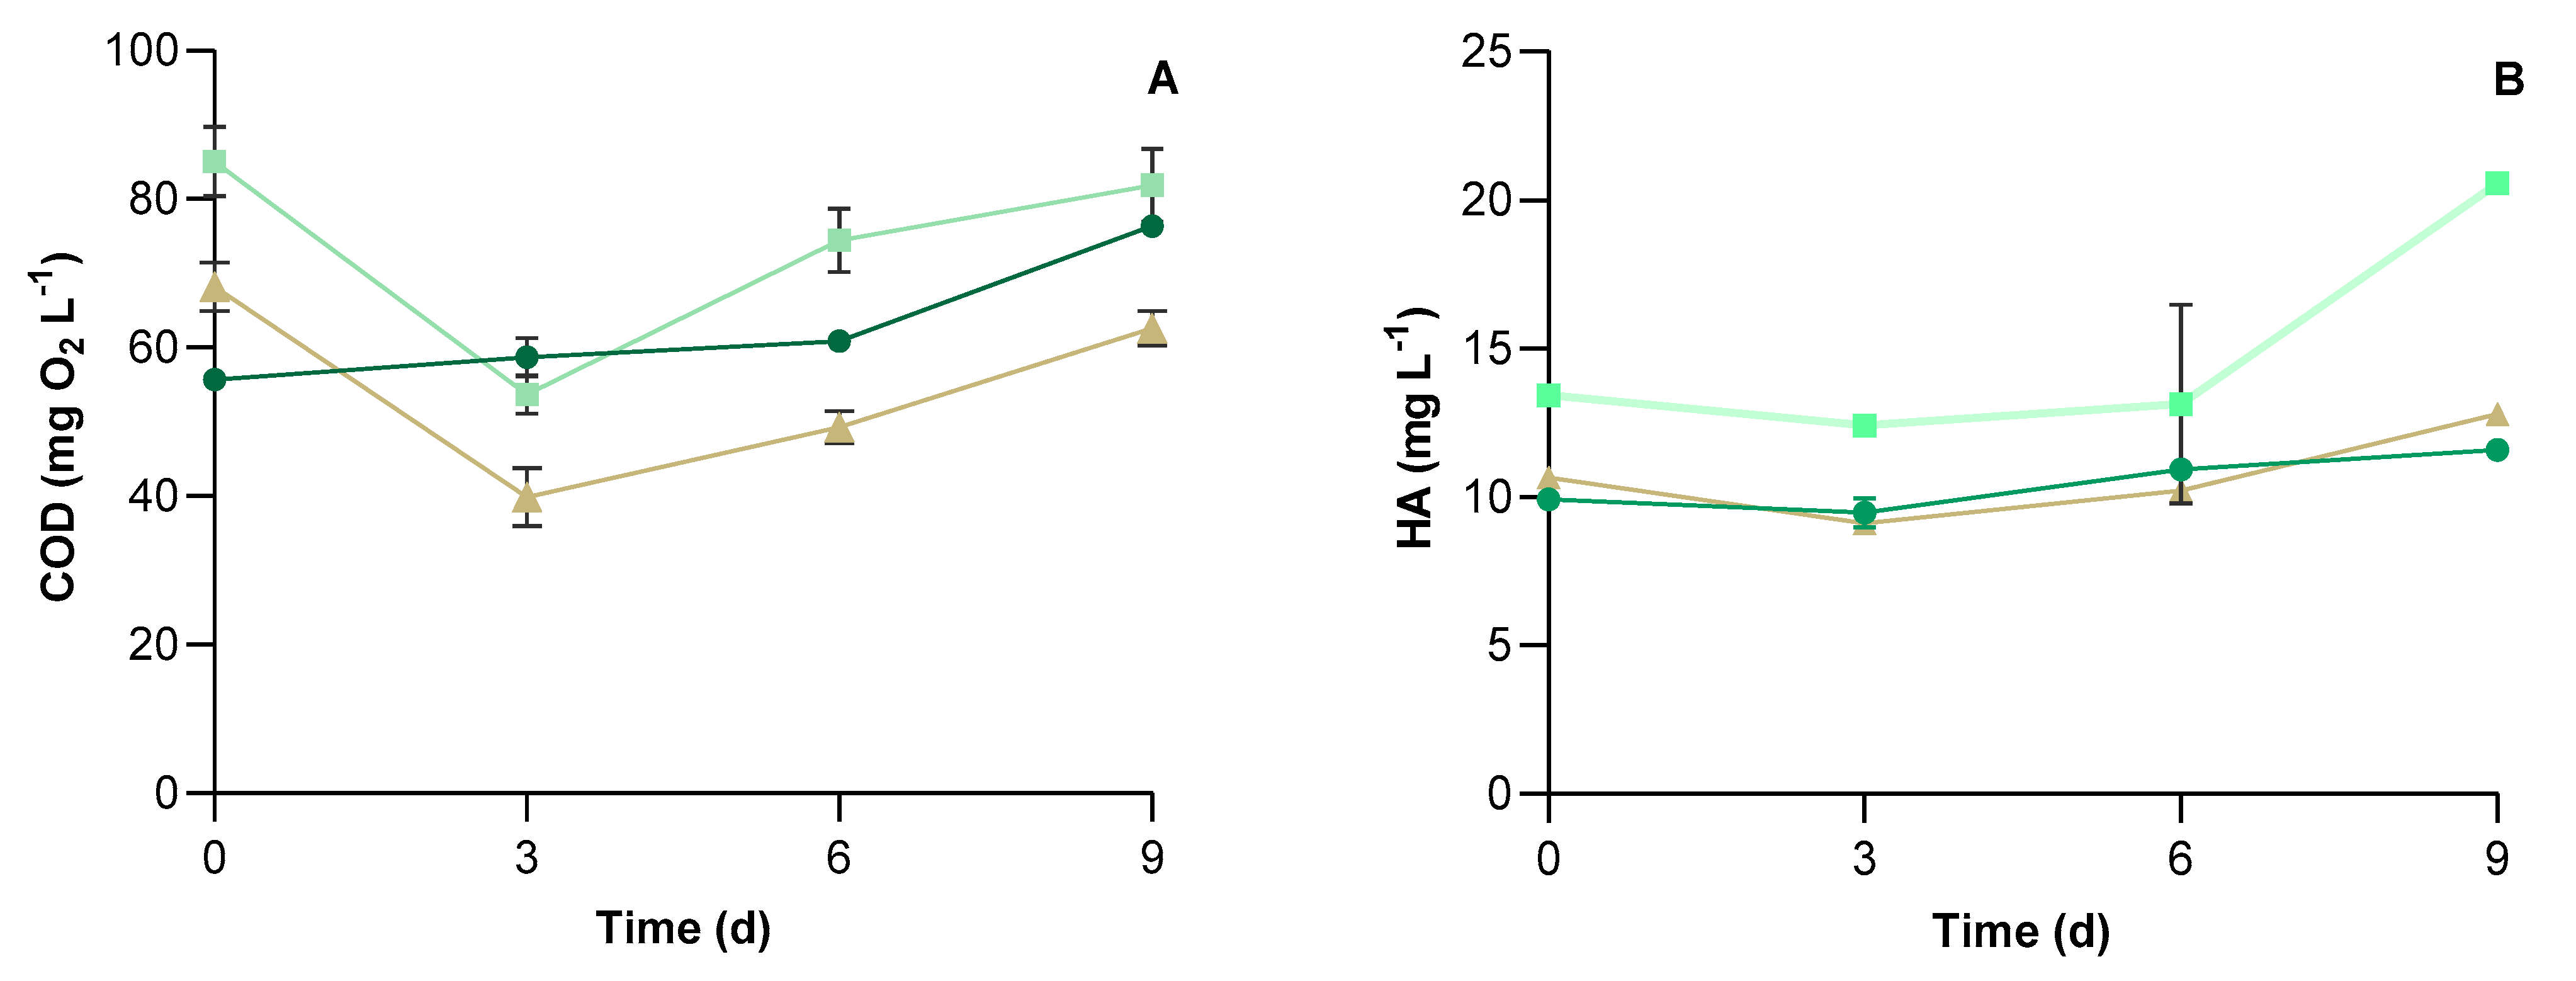
3.2. Physical-Chemical Characteristics of UWW and Conventional Pollutants Removal

The pH variations were plotted over time (Figure 4). In the CV and C+ PBRs, the pH values started to increase on day 2, while in the C− PBR, it only occurred on day 3, along with microalgal growth. In contrast with the present study, a pH decrease was reported in photobioreactors with other microalgal species described as hyperproducers of humic acids, such as Euglena sp. [38]. The co-production of other acid compounds such as itaconic acid by these microalgae was responsible for the pH decrease in such photobioreactors [39]. In the present study, the observed pH increase was probably due to the photosynthetic process. As microalgae consume CO2, a cell internal conversion of HCO3 occurs to be further used as a carbon source for photosynthesis. This process leads to the accumulation of OH in the cells; to neutralize these ions, an increase in H+ uptake from the culture medium occurs, leading to a cell-external increase in pH [39]. The correlation between the microalgal growth and pH is supported by the exponential growth of microalgal cells and pH increase in both the C+ and C− PBRs, and the stationary phase of C. vulgaris between days 6 and 9.
As with any other living organism, microalgae are mainly composed of C, N, and P, typically with molar ratios C106H181O45N16P [35]. Consequently, the assimilation mechanisms of these elements are linked [35]. Hence, the advantages of using microalgae-based treatments is the capacity of these organisms to remove conventional pollutants, such as phosphates, nitrates, and COD, frequently detected in the final effluents of conventional UWWTPs, at concentrations up to 40 mg L−1 of total phosphorus, 30 mg L−1 of NO3–N and 160 mg O2 L−1 of COD, respectively [7,26,40]. To confirm this ability, variations of PO4–P concentration over time were registered (Figure 5), and the phosphorus MR and RE were calculated (Table 3) after 9 d of the microalgal treatment. Variations in the N–NO3- concentration were not determined because their content in the initial wastewater was already below the detection limit (0.2 mg L−1).
The initial PO4–P concentration of UWW was close to the EU legislation limit for UWWTPs with less than 100,000 population equivalent (2 mg L−1) [41], and a slightly lower concentration was detected in the C+ PBR. Microalgae removed PO4–P in all PBRs, revealing REs above 62% (Table 3). The profile of phosphorus removal over time followed the microalgal growth, with the highest RE and MR attained by AMS in the C− PBR, 92.6 ± 0.1% and 2.04 ± 0.03 mg L−1, respectively. These results are similar to the ones obtained using Chlorella sorokiniana and C. vulgaris by Fan et al. [42], Mujtaba & Lee [43], and Ferro et al. [44], and 5% higher than those described for C. vulgaris by Salgado et al. [25]. Although it was not possible to calculate NO3–N removal efficiencies, due to the linkage between the macronutrients, it is expected that both C. vulgaris and AMS could remove this conventional pollutant as well as other species of nitrogen such as NH4+ [25,31,45].
Figure 6 depicts the variation of COD and HA concentrations over time in all PBRs. Initial UWW COD concentration values in all PBRs were below the maximum (125 mg O2 L−1) established by the Council Directive 1991/271/EEC [46]. In the C+ PBR, the sterilization process of UWW led to a 34% increase in the initial COD concentration (Figure 6A), since the organic matter degradation may have originated from polyphenolic, humin, and humic and fulvic acids [47]. On the other hand, the CV PBR had a significantly lower (p < 0.05) concentration of COD values due to a dilution effect of the C. vulgaris pre-inoculum.
Nevertheless, the COD values lowered in the C+ in the first 3 d, as represented in Figure 6A, suggesting that C. vulgaris underwent mixotrophic metabolism. This type of metabolism allows cells to use organic carbon for respiration, besides inorganic carbon for photoautotrophy [48]. In the C− PBR, the COD decreased in the same period, most likely due to its consumption by the bacteria from the UWW. However, COD decrease by AMS should not be neglected, even though they were at lower concentrations at this first 3 d. After that, COD concentration increased over time, reaching slightly lower values in the C− PBR (62.5 ± 2.3 mg O2 L−1) than in the CV PBR (75.7 ± 2.7 mg O2 L−1), but still lower than legislation limits. In wastewater, COD can have many origins. However, in this present scenario, the increase in COD concentration over time probably occurred due to the excretion of metabolic products, such as EPS, of which HA, a stable organic matter form, is a component [47]. Some microalgal species naturally secrete humic acids, while others secret humic acid-like substances along with EPS release in the presence of certain stressors [39,49]. Indeed, several studies related to wastewater treatment report the excretion of EPS by Chlorella sp., including HA, although to a lesser extent when compared to other HA hyperproducers such as Euglena sp. [38,50,51,52].
Hence, HA may have contributed to the COD increase. This occurrence is supported since the COD (Figure 6A) and HA content (Figure 6B) increased after day 3, to which a Pearson correlation was found to some extent (r 0.7–0.8). In addition, a high correlation between HA and MCC values (Pearson correlation, r > 0.9, p < 0.050) in the C− PBR was observed (Figure S1).
In summary, these results led to the conclusion that both C. vulgaris and AMS are efficient microalgal systems for PO4–P removal and organic matter stabilization from UWW.

3.3. Cultivable Bacterial Abundance

Microbial abundance was determined for all PBRs in terms of E. coli, other coliforms except E. coli, and total heterotrophic bacteria (Figure 7). As expected, total coliforms were not detected in the C+ PBR. Both C. vulgaris and AMS had high similarity in their effects on these cultivable bacterial groups after 9 d, reducing coliforms to values lower than the limit of quantification (5 CFU mL−1). E. coli reduction was faster (after 3 d) than other coliforms (after 6 d), and no statistical differences were observed in these parameters between the CV and C− PBRs (p > 0.05). According to the Pearson correlation for the CV PBR (Figure S1), aside from a strong negative correlation and significance between C. vulgaris MCC and E. coli concentration (r > 0.9 and p < 0.05), it was not possible to establish other clear and significant correlations (Figure S1). However, the pH increase seems to have a role, as observed in the study of Davies-Colley [53], in which a pH above 8.5 induced the inactivation of E. coli. While optimal pH conditions for faecal coliform growth are between 6.5 and 7.5, pH levels above 8.5 are very effective in their removal [22]. The pH has also been reported as playing an important role in reducing the proliferation of pathogens in wastewater stabilization ponds, in which microalgae had a crucial role in water alkalization as a result of photosynthesis [54]. Moreover, other studies report a reduction of four orders of magnitude in the concentration of total coliforms and E. coli after a pH increase from 8.4 to 10.5, and a total coliform reduction rate of 92% in high retention ponds for UWWT at a pH of 9.4 [55,56].
Indeed, the decrease of coliforms (except E. coli) abundance over time was highly negatively correlated with pH increase in the CV and C− PBRs (r > 0.9 and p < 0.05), as well as with microalgal growth and HA production in the CV (r > 0.9 and p < 0.05) (Figure S1). Moreover, HAs have adverse effects on pathogenic bacteria in the presence of light due to photo-oxidation, since HAs act as exogenous photosensitizers [18]. In photo-oxidation, the photosensitizers absorb light and transfer i energy to other molecules, leading to the development of reactive oxygen species that damage the cell membranes of microorganisms [18]. Therefore, the results from the present study suggest that the decrease in the abundance of coliforms is related to C. vulgaris growth, indicating that this is an efficient biological system to promote UWW disinfection.
Regarding total heterotrophic bacteria, the initial abundance in C+ PBR was lower than in CV and C− PBRs, due to the sterilization process of UWW, which also reduced total coliforms to non-detectable levels. Furthermore, the total heterotrophs content (6.9 logs CFU 100 mL−1) in the C+ PBR confirmed that the C. vulgaris pre-inoculum was a microalgae-bacteria consortium. Additionally, the increase of the total heterotrophs in the C+ PBR over time, when compared to the CV PBR suggests that bacteria from the C. vulgaris consortium competed with bacteria from UWW in the CV PBR. In the C+ PBR, a decrease in the total heterotrophs content was observed from days 3 to 9, probably due to nutrient starvation caused by the rapid microalgae growth or the production of any antibacterial compound. More constant values of total heterotrophs were detected in the CV PBR, suggesting that a microalgae-bacteria consortium was well established [57]. Microalgae can transform solar energy into chemical energy, producing O2 and organic matter. In turn, bacteria may use the O2 for respiration, decompose the organic compounds, and supply CO2 and growth-promoting factors and vitamins (B12, B1 and B7) that boost microalgal growth [58,59,60].
It should not be neglected that other operational characteristics related to microalgal growth may have had a role in the bacterial abundance during the experiments. Light exposure, particularly from photosynthetic active radiation (PAR), has been described as having disinfection effects on water due to its ability to penetrate in water depth. For example, over 99% of visible light at 556 nm can penetrate 8 cm, while shorter wavelengths (UV-B or UV-A) are retained in the first 2.5 cm [18]. Still, the responses of different bacteria to light damage vary significantly; while inactivation of E. coli occurs through endogenous mechanisms promoted by UV-B and UV-A, for other bacteria like E. faecalis, it occurs by PAR [18]. Additionally, a light–dark photoperiod of 24:0 showed a low reduction in E. coli abundance, while for E. faecalis it had the opposite effect [4]. Moreover, the presence of oxygen produced by microalgae may have a role in the reduction of E. coli abundance [4,56].

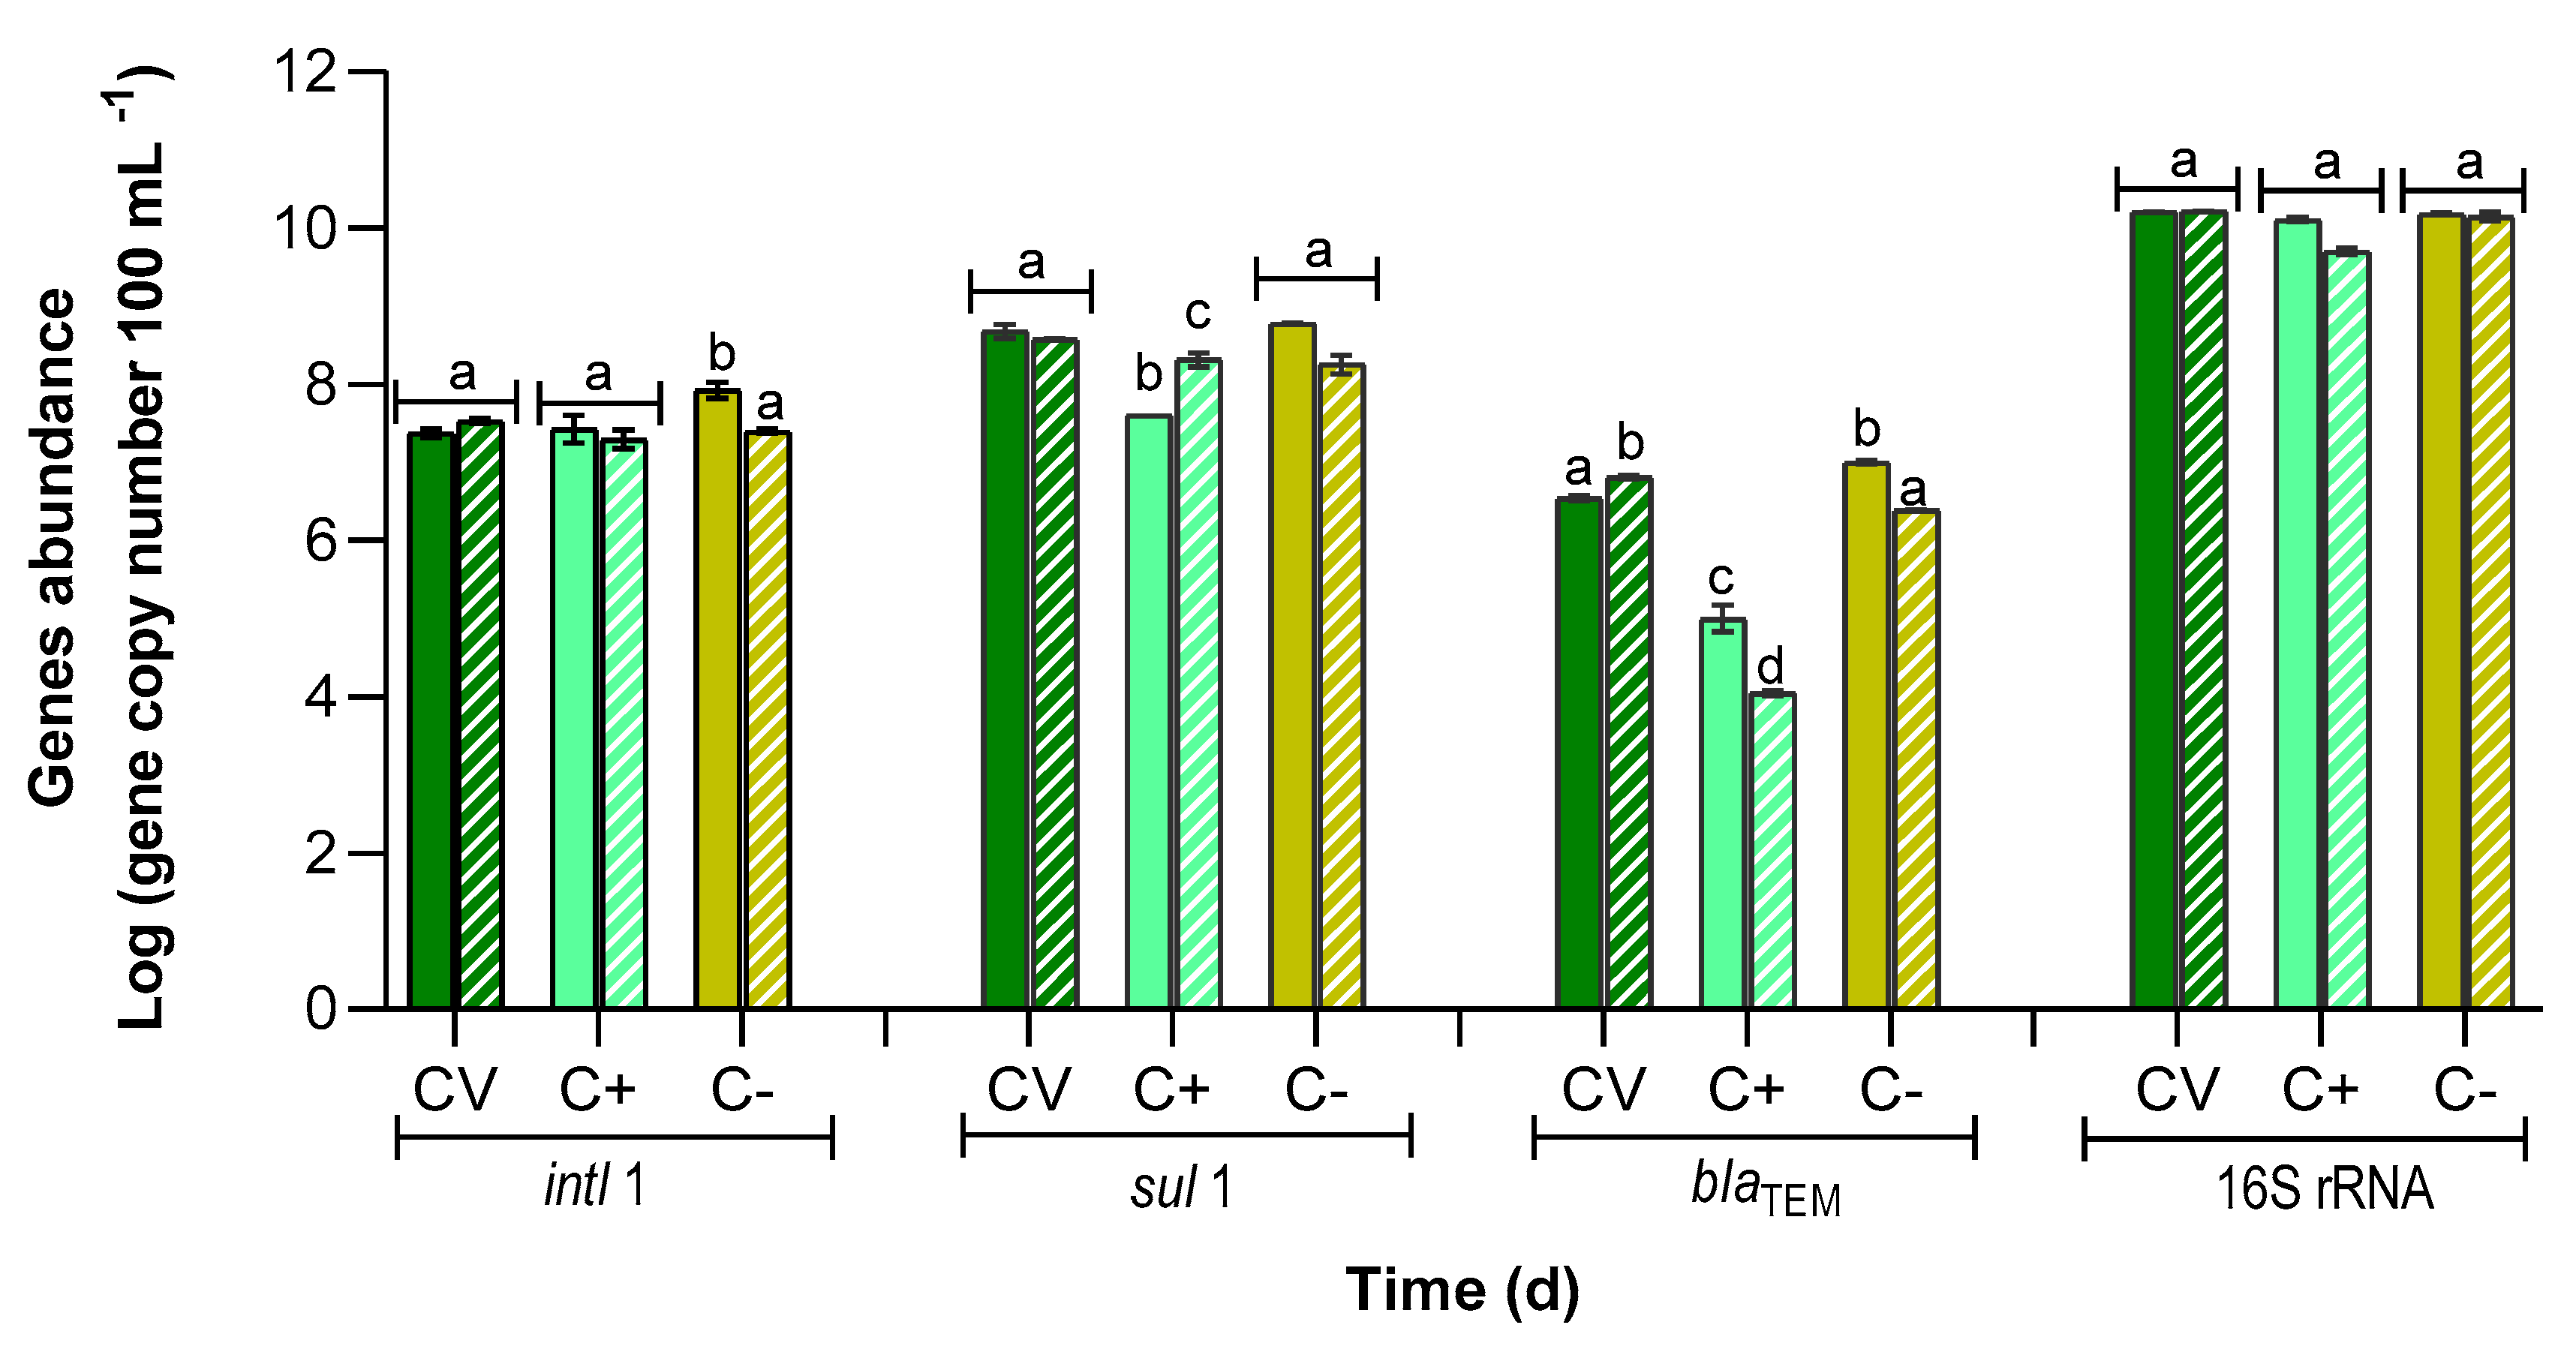
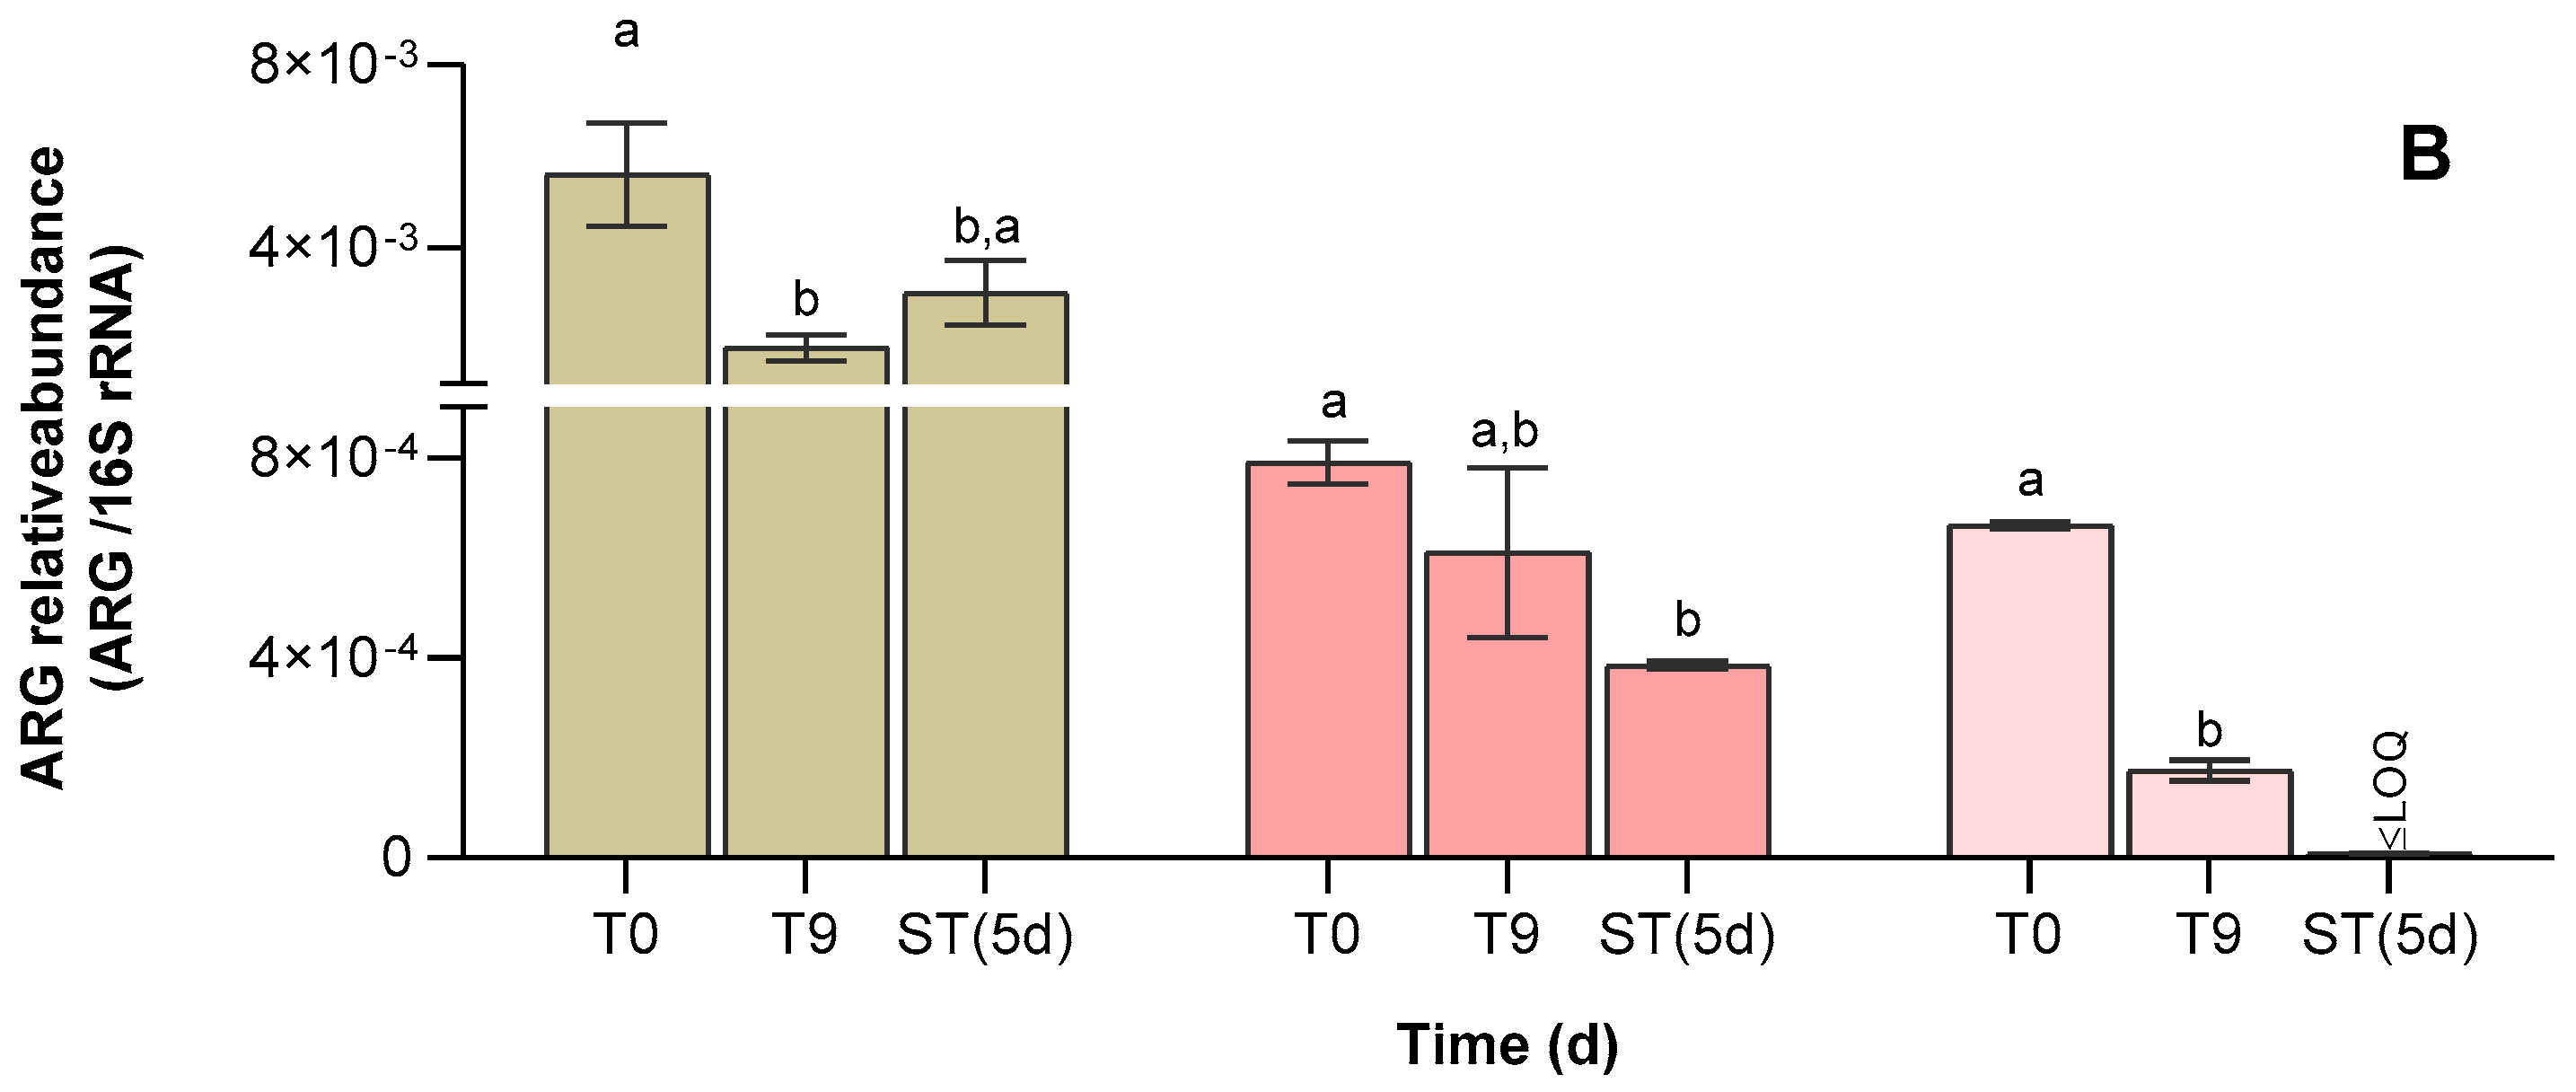
3.4. Abundance of Antibiotic Resistance Genes

Due to the non-cultivability nature of most water’s bacterial organisms, total bacterial abundance was evaluated by quantifying the housekeeping gene 16S rRNA. Additionally, the abundance of intl1 and ARGs (sul1 and blaTEM) was quantified in all PBRs (Figure 8). Results show that at the beginning of the experiment, in both the CV and C− PBRs, the abundance of total bacteria was at least 3 log higher than the ones quantified by cultivable methods (Figure 8 and Figure 7, respectively). However, this difference was much higher in the C+ PBR, 4.1 logs, indicating a high abundance of non-cultivable bacteria in consortia with C. vulgaris, which was kept stable during the 9 d of the experiment. At the end of the experiment, the ratio of abundance of the 16S rRNA gene and total heterotrophs was reduced in the CV, and slightly in the C− PBR, possibly due to the release of algae metabolites that favored the cultivability of some UWW bacterial groups.
The intI1 gene encoding the class 1 integrons integrase, found in pathogenic gram-negative and commensal bacteria of humans and domestic animals, is commonly used as a marker for anthropogenic pollution [61]. Moreover, this gene is usually related to ARGs, namely sul1 since intI1 encodes for an integrase responsible for the insertion and excision of exogenous gene cassettes [62]. The ARGs blaTEM and sul1 are related to beta-lactams and sulfonamides resistance, respectively [32,63]. The reduction of intI1 and ARGs can occur via the removal of living cells containing these genes and the loss of ARG-containing plasmids [24,62].
Although the C. vulgaris inoculum used in this study did not have an environmental origin, it was revealed to be non-axenic and possibly in a consortium with bacteria carrying intl1, sul1, and blaTEM genes, with an abundance of 7.4 ± 0.2, 7.6 ± 0.1 and 5.0 ± 0.2 log (gene copy number 100 mL−1), respectively (C+, Figure 8).
In terms of microalgae’s ability to reduce intl1 and ARGs from UWW, C. vulgaris appears to not have any significant (p < 0.05) effect in terms of log reduction, RRG and prevalence of these genes (CV and C+, Figure 8, Table 4). In contrast, AMS from the C− PBR may have contributed to the reduction of the intl1 (0.5 log reduction, p < 0.05) and blaTEM (0.6 log reduction, p < 0.05) genes abundance after 9 d, corresponding to percentages of RRG of 70.4 ± 9.2%, 69.2 ± 7.5%, and 75.7 ± 1.6%, for intl1, sul1, and blaTEM respectively (Figure 8, Table 4). Additionally, a significant decrease in the prevalence of the blaTEM gene after 9 d was registered in the C-PBR (Table 4).
The obtained results are in line with similar studies. As observed by Cheng et al. [37] with Galdieria sulphuraria, AMS treatment also reduced intl1 abundance, indicating that the microalgal treatment could reduce the spread of resistance. Additionally, AMS’s ability to reduce blaTEM abundance was 0.1 log higher when compared to the Chlorella sorokiniana- Brevundimonas basaltis consortium, as studied by Silva Rodrigues et al. [40]. Recently, Tang et al. [24] observed that a C. vulgaris -B. licheniformis consortium was able to promote sul1 reduction of abundance due to the efficient removal of exogenous plasmids carrying ARGs such as sul1. They observed that microalgal cells (i) absorbed and endocytosed the exogenous plasmids carrying sul1, with no affection of the microalgae cell nucleus, (ii) EPS promoted and increased the adsorption of exogenous ARG-containing plasmids, and (iii) endocytosis increased with a larger time (more than 6 d) of contact between microalgae and plasmids [24]. This study [24] was performed in synthetic media instead of WW, with a controlled microbial population, and with the different operating conditions of temperature (30 °C), light exposure (120 µmol m−2 s−1), and cultivation time (10 d). However, in a real scenario using real WW, there are no guarantees that the same mechanisms may occur straightforwardly due to the complexity of WW composition, and the unlikeliness of the occurrence of intact plasmids in the environment. Nevertheless, the capacity of microalgae to adsorb extracellular DNA fragments containing ARGs should be studied in the future.
Due to the promising results of AMS in the C− PBR, the treated water was tested for its stability in terms of 16S rRNA, intl1, and ARG content (Figure 9), envisioning a possible treated water reutilization scenario. Storage revealed a decrease of 16S rRNA abundance (Figure 9A), as well as a reduction of intl1, sul1, and blaTEM abundance, with log reductions of 1.0, 0.7, and 2.5, respectively, when compared to values obtained at the end of the experiment (T9), corresponding to an RRG of 97.1, 94.2 and 99.9% from the beginning of the assay (T0) up to the end of the storage period (ST5d). Microalgae surface adsorbed bacteria co-precipitation might have had a role in this reduction, probably by a reconfiguration of the bulk water microbial composition [14].

4. Conclusions

In conclusion, the use of microalgal systems as a polishing treatment for UWW seems to be successful. This study demonstrated that the growth of both C. vulgaris and AMS in UWW promotes the removal of conventional pollutants such as PO4–P and the reduction of E. coli and other coliforms’ abundance. However, when comparing specific parameters of both microalgal systems, the use of AMS seems to be more promising due to the high (i) growth rate (μmax of 0.687 ± 0.065 d−1), and biomass productivity (9.0 ± 0.3) × 104, (ii) removal rate of PO4–P (c.a. 92%), (iii) reduction of intI1 (0.5 log) and blaTEM (0.6 log) genes’ abundance after 9 d, and (iv) reduction of intl1 (1 log), sul1 (0.5 log), and blaTEM (2.5 log) genes’ abundance and their prevalence in treated water stored for 5 d. For future work, it should be interesting to identify the microalgal and bacterial species in the AMS system. Moreover, monitoring the AMS species and wastewater composition, namely in terms of nitrogen and phosphorus, would be helpful in understanding the dynamics of this system. As discussed throughout the present work, abiotic factors such as light intensity have a main role in both microalgal growth and the reduction of pathogens’ proliferation, namely in conjugation with pH. Hence, studies considering the light intensity and pH ranges would be helpful in optimizing the potential of AMS. Moreover, due to the scarcity of information related to the microalgal mechanisms involved in ARGs reduction of abundance and prevalence in real wastewater, future studies should focus on these events.

Supplementary Materials

The following supporting information can be downloaded at: https://www.mdpi.com/article/10.3390/app13074266/s1, Figure S1. Pearson correlation of all analyzed variables obtained for each PBRs: (A) CV (Chlorella vulgaris + UWW); (B) positive control, C+ positive control (C. vulgaris + autoclaved UWW); and (C) negative control, C− (raw UWW). Variables: pH; HA: humic acid concentration; COD: chemical oxygen demand concentration; MCC: microalgal cell concentration; PO4–P: Phosphate-phosphorus concentration; OFC: other faecal coliforms except Escherichia. coli concentration; Ec: E. coli concentration; TH: Total heterotrophs concentration. White squares correspond to non-determined values.

Author Contributions

Conceptualization, H.M.A., J.C.M.P. and O.C.N.; methodology, H.M.A. and O.C.N.; investigation: H.M.A., J.F.S. and E.M.S.; resources, J.C.M.P. and O.C.N.; data curation, H.M.A., J.F.S. and E.M.S.; writing—original draft preparation, H.M.A. and J.F.S.; writing—review and editing, J.C.M.P., O.C.N. and E.M.S.; supervision, J.C.M.P. and O.C.N.; project administration, J.C.M.P. and O.C.N.; funding acquisition, J.C.M.P. and O.C.N. All authors have read and agreed to the published version of the manuscript.

Funding

This work was financially supported by: (i) LA/P/0045/2020 (ALiCE) and UIDB/00511/2020- UIDP/00511/2020 (LEPABE) funded by national funds through FCT/MCTES (PIDDAC); (ii) Project PhotoBioValue (ref. PTDC/BTABTA/2902/2021), funded by FEDER funds through COMPETE2020-Programa Operacional Competitividade e Internacionalização (POCI) and by national funds (PIDDAC) through FCT/MCTE; and (iii) Project 2SMART—engineered Smart materials for Smart citizens (ref. NORTE-01-0145-FEDER-000054) and (iv) Project Healthy Waters (ref. NORTE-01-0145-FEDER-000069), former both supported by Norte Portugal Regional Operational Programme (NORTE 2020) under the PORTUGAL2020 Partnership Agreement through the European Regional Development Fund (ERDF). Also E.M. Salgado thanks FCT for the financial support of her work through the FCT PhD Research Scholarship 2021.07412.BD.

Data Availability Statement

No data available.

Conflicts of Interest

The authors declare no conflict of interest.

References

  1. Jones, E.R.; van Vliet, M.T.H.; Qadir, M.; Bierkens, M.F.P. Country-level and gridded estimates of wastewater production, collection, treatment and reuse. Earth Syst. Sci. Data 2021, 13, 237–254. [Google Scholar] [CrossRef]
  2. Guo, J.; Li, J.; Chen, H.; Bond, P.L.; Yuan, Z. Metagenomic analysis reveals wastewater treatment plants as hotspots of antibiotic resistance genes and mobile genetic elements. Water Res. 2017, 123, 468–478. [Google Scholar] [CrossRef]
  3. Leng, L.; Wei, L.; Xiong, Q.; Xu, S.; Li, W.; Lv, S.; Lu, Q.; Wan, L.; Wen, Z.; Zhou, W. Use of microalgae based technology for the removal of antibiotics from wastewater: A review. Chemosphere 2020, 238, 124680. [Google Scholar] [CrossRef]
  4. Ruas, G.; Serejo, M.L.; Farias, S.L.; Scarcelli, P.; Boncz, M.Á. Removal of pathogens from domestic wastewater by microalgal-bacterial systems under different cultivation conditions. Int. J. Environ. Sci. Technol. 2022, 19, 10177–10188. [Google Scholar] [CrossRef]
  5. Ji, B. Towards environment-sustainable wastewater treatment and reclamation by the non-aerated microalgal-bacterial granular sludge process: Recent advances and future directions. Sci. Total Environ. 2022, 806, 150707. [Google Scholar] [CrossRef]
  6. Muhammad Saqib, I.; Zobia, A.; Amjad, K.; Amjad, K. Disinfection methods. In Photocatalysts; Sher Bahadar, K., Kalsoom, A., Eds.; IntechOpen: Rijeka, Croatia, 2018; Chapter 1. [Google Scholar]
  7. EPA. Wastewater Technology Fact Sheet: Chlorine Desinfection; EPA: Washington, DC, USA, 1999. [Google Scholar]
  8. Lim, S.; Shi, J.L.; von Gunten, U.; McCurry, D.L. Ozonation of organic compounds in water and wastewater: A critical review. Water Res. 2022, 213, 118053. [Google Scholar] [CrossRef]
  9. Amin, M.; Hashemi, H.; Mohammadi, A.; Hung, Y. A review on wastewater disinfection. Int. J. Env. Health Eng. 2013, 2, 22. [Google Scholar] [CrossRef]
  10. Eerkes-Medrano, D.; Leslie, H.A.; Quinn, B. Microplastics in drinking water: A review and assessment. Curr. Opin. Environ. Sci. Health 2019, 7, 69–75. [Google Scholar] [CrossRef] [Green Version]
  11. Gonçalves, A.L.; Pires, J.C.M.; Simões, M. A review on the use of microalgal consortia for wastewater treatment. Algal Res. 2017, 24, 403–415. [Google Scholar] [CrossRef]
  12. Sousa, J.C.G.; Ribeiro, A.R.; Barbosa, M.O.; Pereira, M.F.R.; Silva, A.M.T. A review on environmental monitoring of water organic pollutants identified by eu guidelines. J. Hazard. Mater. 2018, 344, 146–162. [Google Scholar] [CrossRef]
  13. Wollmann, F.; Dietze, S.; Ackermann, J.-U.; Bley, T.; Walther, T.; Steingroewer, J.; Krujatz, F. Microalgae wastewater treatment: Biological and technological approaches. Eng. Life Sci. 2019, 19, 860–871. [Google Scholar] [CrossRef] [Green Version]
  14. Ribeirinho-Soares, S.; Moreira, N.F.F.; Graça, C.; Pereira, M.F.R.; Silva, A.M.T.; Nunes, O.C. Overgrowth control of potentially hazardous bacteria during storage of ozone treated wastewater through natural competition. Water Res. 2022, 209, 117932. [Google Scholar] [CrossRef]
  15. Li, G.; Hao, Y.; Yang, T.; Xiao, W.; Pan, M.; Huo, S.; Lyu, T. Enhancing bioenergy production from the raw and defatted microalgal biomass using wastewater as the cultivation medium. Bioengineering 2022, 9, 637. [Google Scholar] [CrossRef]
  16. Álvarez-González, A.; Uggetti, E.; Serrano, L.; Gorchs, G.; Ferrer, I.; Díez-Montero, R. Can microalgae grown in wastewater reduce the use of inorganic fertilizers? J. Environ. Manag. 2022, 323, 116224. [Google Scholar] [CrossRef]
  17. Bouki, C.; Venieri, D.; Diamadopoulos, E. Detection and fate of antibiotic resistant bacteria in wastewater treatment plants: A review. Ecotoxicol. Environ. Saf. 2013, 91, 1–9. [Google Scholar] [CrossRef]
  18. Liu, L.; Hall, G.; Champagne, P. Disinfection processes and mechanisms in wastewater stabilization ponds: A review. Environ. Rev. 2018, 26, 417–429. [Google Scholar] [CrossRef] [Green Version]
  19. Muñoz, I.; Gómez-Ramos, M.J.; Agüera, A.; Fernández-Alba, A.R.; García-Reyes, J.F.; Molina-Díaz, A. Chemical evaluation of contaminants in wastewater effluents and the environmental risk of reusing effluents in agriculture. TrAC Trends Anal. Chem. 2009, 28, 676–694. [Google Scholar] [CrossRef]
  20. Ruas, G.; Serejo, M.L.; Paulo, P.L.; Boncz, M.Á. Evaluation of domestic wastewater treatment using microalgal-bacterial processes: Effect of co2 addition on pathogen removal. J. Appl. Phycol. 2018, 30, 921–929. [Google Scholar] [CrossRef]
  21. Posadas, E.; Morales, M.d.M.; Gomez, C.; Acién, F.G.; Muñoz, R. Influence of ph and co2 source on the performance of microalgae-based secondary domestic wastewater treatment in outdoors pilot raceways. Chem. Eng. J. 2015, 265, 239–248. [Google Scholar] [CrossRef] [Green Version]
  22. Awuah, E.; Lubberding, H.J.; Asante, K.; Gijzen, H.J. The effect of ph on enterococci removal in pistia-, duckweed- and algae-based stabilization ponds for domestic wastewater treatment. Water Sci. Technol. 2002, 45, 67–74. [Google Scholar] [CrossRef]
  23. Muñoz, R.; Guieysse, B. Algal–bacterial processes for the treatment of hazardous contaminants: A review. Water Res. 2006, 40, 2799–2815. [Google Scholar] [CrossRef]
  24. Tang, Y.; Song, L.; Ji, X.; Huang, S.; Yu, Y.; Ye, J.; Xu, W.; Hou, M. Algal-bacterial consortium mediated system offers effective removal of nitrogen nutrients and antibiotic resistance genes. Bioresour. Technol. 2022, 362, 127874. [Google Scholar] [CrossRef]
  25. Salgado, E.M.; Gonçalves, A.L.; Sánchez-Soberón, F.; Ratola, N.; Pires, J.C.M. Microalgal cultures for the bioremediation of urban wastewaters in the presence of siloxanes. Int. J. Environ. Res. Public Health 2022, 19, 2634. [Google Scholar] [CrossRef]
  26. Vargas-Estrada, L.; Longoria, A.; Okoye, P.U.; Sebastian, P.J. Energy and nutrients recovery from wastewater cultivated microalgae: Assessment of the impact of wastewater dilution on biogas yield. Bioresour. Technol. 2021, 341, 125755. [Google Scholar] [CrossRef]
  27. APHA. Standard Methods for the Examination of Water and Wastewater, 23rd ed.; APHA: Washington, DC, USA, 2017. [Google Scholar]
  28. Lee, Y.-J.; Lei, Z. Microalgal-bacterial aggregates for wastewater treatment: A mini-review. Bioresour. Technol. Rep. 2019, 8, 100199. [Google Scholar] [CrossRef]
  29. EPA. Method 352.1: Nitrogen, Nitrate (Colorimetric, Brucine) by Spectrophotometer; EPA: Washington, DC, USA, 1971. [Google Scholar]
  30. Rodrigues, A.; Brito, A.; Janknecht, P.; Proença, M.F.; Nogueira, R. Quantification of humic acids in surface water: Effects of divalent cations, ph, and filtration. J. Environ. Monit. 2009, 11, 377–382. [Google Scholar] [CrossRef] [Green Version]
  31. Whitton, R.; Le Mével, A.; Pidou, M.; Ometto, F.; Villa, R.; Jefferson, B. Influence of microalgal n and p composition on wastewater nutrient remediation. Water Res. 2016, 91, 371–378. [Google Scholar] [CrossRef]
  32. Narciso-da-Rocha, C.; Varela, A.R.; Schwartz, T.; Nunes, O.C.; Manaia, C.M. Blatem and vana as indicator genes of antibiotic resistance contamination in a hospital–urban wastewater treatment plant system. J. Glob. Antimicrob. Resist. 2014, 2, 309–315. [Google Scholar] [CrossRef] [Green Version]
  33. Brankatschk, R.; Bodenhausen, N.; Zeyer, J.; Bürgmann, H. Simple absolute quantification method correcting for quantitative pcr efficiency variations for microbial community samples. Appl. Environ. Microbiol. 2012, 78, 4481–4489. [Google Scholar] [CrossRef] [Green Version]
  34. Bustin, S.A.; Benes, V.; Garson, J.A.; Hellemans, J.; Huggett, J.; Kubista, M.; Mueller, R.; Nolan, T.; Pfaffl, M.W.; Shipley, G.L.; et al. The miqe guidelines: Minimum information for publication of quantitative real-time pcr experiments. Clin. Chem. 2009, 55, 611–622. [Google Scholar] [CrossRef] [Green Version]
  35. Su, Y. Revisiting carbon, nitrogen, and phosphorus metabolisms in microalgae for wastewater treatment. Sci. Total Environ. 2021, 762, 144590. [Google Scholar] [CrossRef] [PubMed]
  36. Carneiro, M.; Maia, I.B.; Cunha, P.; Guerra, I.; Magina, T.; Santos, T.; Schulze, P.S.C.; Pereira, H.; Malcata, F.X.; Navalho, J.; et al. Effects of led lighting on nannochloropsis oceanica grown in outdoor raceway ponds. Algal Res. 2022, 64, 102685. [Google Scholar] [CrossRef]
  37. Singh, D.V.; Singh, R.P. Algal consortia based metal detoxification of municipal wastewater: Implication on photosynthetic performance, lipid production, and defense responses. Sci. Total Environ. 2022, 814, 151928. [Google Scholar] [CrossRef] [PubMed]
  38. Wu, M.; Wu, G.; Lu, F.; Wang, H.; Lei, A.; Wang, J. Microalgal photoautotrophic growth induces ph decrease in the aquatic environment by acidic metabolites secretion. Biotechnol. Biofuels Bioprod. 2022, 15, 115. [Google Scholar] [CrossRef]
  39. Chi, Z.; O’Fallon, J.V.; Chen, S. Bicarbonate produced from carbon capture for algae culture. Trends Biotechnol. 2011, 29, 537–541. [Google Scholar] [CrossRef]
  40. APHA. Standard Methods for the Examination of Water and Wastewater, 18th ed.; APHA: Washington, DC, USA, 1992. [Google Scholar]
  41. EUR-Lex. Commission directive 98/15/ec of 27 february 1998 amending council directive 91/271/eec with respect to certain requirements established in annex i thereof. Off. J. Eur. Communities 1998, 67, 29–30. [Google Scholar]
  42. Fan, J.; Chen, Y.; Zhang, T.C.; Ji, B.; Cao, L. Performance of chlorella sorokiniana-activated sludge consortium treating wastewater under light-limited heterotrophic condition. Chem. Eng. J. 2020, 382, 122799. [Google Scholar] [CrossRef]
  43. Mujtaba, G.; Lee, K. Treatment of real wastewater using co-culture of immobilized chlorella vulgaris and suspended activated sludge. Water Res. 2017, 120, 174–184. [Google Scholar] [CrossRef]
  44. Ferro, L.; Gojkovic, Z.; Munoz, R.; Funk, C. Growth performance and nutrient removal of a chlorella vulgaris-rhizobium sp. Co-culture during mixotrophic feed-batch cultivation in synthetic wastewater. Algal Res. 2019, 44, 101690. [Google Scholar] [CrossRef]
  45. Yu, H.; Kim, J.; Lee, C. Nutrient removal and microalgal biomass production from different anaerobic digestion effluents with chlorella species. Sci. Rep. 2019, 9, 6123. [Google Scholar] [CrossRef] [Green Version]
  46. EUW Directive. Council Directive of 21 May 1991 concerning urban waste water treatment (91/271/EEC). J. Eur. Commun. 1991, 135, 40–52. [Google Scholar]
  47. Rosenblum, J.; Lee, J.; Martin, J.; Bisesi, M.S. Correlation between levels of humic acid and fecal indicator bacteria: A potential predictor of biosolids stabilization. Environ. Eng. Sci. 2018, 35, 663–672. [Google Scholar] [CrossRef]
  48. Siqueira, S.F.; Queiroz, M.I.; Zepka, L.Q.; Jacob-Lopes, E. Microalgae biotechnology—A brief introduction. In Microalgal Biotechnology; Jacob-Lopes, E., Zepka, L.Q., Queiroz, M.I., Eds.; InTech: London, UK, 2018; pp. 1–11. [Google Scholar]
  49. Jiao, Y.; Zhu, Y.; Chen, M.; Wan, L.; Zhao, Y.; Gao, J.; Liao, M.; Tian, X. The humic acid-like substances released from microcystis aeruginosa contribute to defending against smaller-sized microplastics. Chemosphere 2022, 303, 135034. [Google Scholar] [CrossRef]
  50. Chen, B.; Li, F.; Liu, N.; Ge, F.; Xiao, H.; Yang, Y. Role of extracellular polymeric substances from chlorella vulgaris in the removal of ammonium and orthophosphate under the stress of cadmium. Bioresour. Technol. 2015, 190, 299–306. [Google Scholar] [CrossRef]
  51. Zhang, Y.; Li, X.; Du, J.; Pu, L.; Chen, S. Effects of chlorella extracellular polymeric substances on the aggregation and stability of tio2 nanoparticles as electrolytes. Desalination Water Treat. 2021, 209, 334–341. [Google Scholar] [CrossRef]
  52. Barboríková, J.; Šutovská, M.; Kazimierová, I.; Jošková, M.; Fraňová, S.; Kopecký, J.; Capek, P. Extracellular polysaccharide produced by chlorella vulgaris—Chemical characterization and anti-asthmatic profile. Int. J. Biol. Macromol. 2019, 135, 1–11. [Google Scholar] [CrossRef]
  53. Davies-Colley, R.J.; Donnison, A.M.; Speed, D.J.; Ross, C.; Nagels, J.W. Inactivation of faecal indicator micro-organisms in waste stabilisation ponds: Interactions of environmental factors with sunlight. Water Res. 1999, 33, 1220–1230. [Google Scholar] [CrossRef]
  54. Wallace, J.; Champagne, P.; Hall, G. Multivariate statistical analysis of water chemistry conditions in three wastewater stabilization ponds with algae blooms and ph fluctuations. Water Res. 2016, 96, 155–165. [Google Scholar] [CrossRef] [PubMed]
  55. Schumacher, G.; Blume, T.; Sekoulov, I. Bacteria reduction and nutrient removal in small wastewater treatment plants by an algal biofilm. Water Sci. Technol. 2003, 47, 195–202. [Google Scholar] [CrossRef]
  56. El Hamouri, B.; Khallayoune, K.; Bouzoubaa, K.; Rhallabi, N.; Chalabi, M. High-rate algal pond performances in faecal coliforms and helminth egg removals. Water Res. 1994, 28, 171–174. [Google Scholar] [CrossRef]
  57. Aditya, L.; Mahlia, T.M.I.; Nguyen, L.N.; Vu, H.P.; Nghiem, L.D. Microalgae-bacteria consortium for wastewater treatment and biomass production. Sci. Total Environ. 2022, 838, 155871. [Google Scholar] [CrossRef]
  58. Higgins, B.T.; Gennity, I.; Fitzgerald, P.S.; Ceballos, S.J.; Fiehn, O.; VanderGheynst, J.S. Algal–bacterial synergy in treatment of winery wastewater. NPJ Clean Water 2018, 1, 6. [Google Scholar] [CrossRef] [Green Version]
  59. Wang, H.; Deng, L.; Qi, Z.; Wang, W. Constructed microalgal-bacterial symbiotic (mbs) system: Classification, performance, partnerships and perspectives. Sci. Total Environ. 2022, 803, 150082. [Google Scholar] [CrossRef]
  60. Yong, J.J.J.Y.; Chew, K.W.; Khoo, K.S.; Show, P.L.; Chang, J.-S. Prospects and development of algal-bacterial biotechnology in environmental management and protection. Biotechnol. Adv. 2021, 47, 107684. [Google Scholar] [CrossRef]
  61. Gillings, M.R.; Gaze, W.H.; Pruden, A.; Smalla, K.; Tiedje, J.M.; Zhu, Y.-G. Using the class 1 integron-integrase gene as a proxy for anthropogenic pollution. ISME J. 2015, 9, 1269–1279. [Google Scholar] [CrossRef]
  62. Cheng, X.; Delanka-Pedige, H.M.K.; Munasinghe-Arachchige, S.P.; Abeysiriwardana-Arachchige, I.S.A.; Smith, G.B.; Nirmalakhandan, N.; Zhang, Y. Removal of antibiotic resistance genes in an algal-based wastewater treatment system employing galdieria sulphuraria: A comparative study. Sci. Total Environ. 2020, 711, 134435. [Google Scholar] [CrossRef]
  63. Du, J.; Ren, H.; Geng, J.; Zhang, Y.; Xu, K.; Ding, L. Occurrence and abundance of tetracycline, sulfonamide resistance genes, and class 1 integron in five wastewater treatment plants. Environ. Sci. Pollut. Res. 2014, 21, 7276–7284. [Google Scholar] [CrossRef]
Figure 1. Experimental setup of the microalgal treatment, including the CV (C. vulgaris + UWW) PBR, positive (C+, C. vulgaris + autoclaved UWW), and negative (C−, UWW) PBRs controls.
Applsci 13 04266 g001
Figure 2. Microalgal cell concentration (MCC, average ± standard deviation) over time (d) for each PBR: CV (C. vulgaris + UWW); C+ (C. vulgaris + autoclaved UWW); and C− (raw UWW).
Applsci 13 04266 g002
Figure 3. Microscopic observations (40×) of UWW autochthonous microalgal species detected in the C− PBR.
Applsci 13 04266 g003
Figure 4. pH variation (average ± standard deviation) over time (d) for each PBR: CV (C. vulgaris + UWW); C+ (C. vulgaris + autoclaved UWW); and C− (raw UWW).
Applsci 13 04266 g004
Figure 5. Variation of phosphate–phosphorus (PO4–P) concentration (average ± standard deviation) over time (d), expressed in mg L−1, for each PBR: CV (C. vulgaris + UWW); C+ (C. vulgaris + autoclaved UWW); and C− (raw UWW).
Applsci 13 04266 g005
Figure 6. Variation of chemical oxygen demand (COD) (A) and humic acid (HA) (B) concentration (average ± standard deviation) over time (d), expressed in mg O2 L−1 and mg L−1, respectively, for each PBR: CV (C. vulgaris + UWW); C+ (C. vulgaris + autoclaved UWW); and C− (raw UWW).
Applsci 13 04266 g006
Figure 7. Quantification of E. coli, other faecal coliforms except E. coli, and total heterotrophs over time (d) for each PBR: CV (C. vulgaris + UWW); C+ (C. vulgaris + autoclaved UWW); and C− (raw UWW). Results are expressed in log (CFU 100 mL−1) (average ± standard deviation). Bars from the same group of bacteria with a common superscript letter are not statistically different (two-way ANOVA followed by Tukey post hoc test p > 0.05).
Applsci 13 04266 g007
Figure 8. The abundance of the 16S rRNA, intl1, and antibiotic resistance genes (sul1 and blaTEM) detected in each PBR: CV (C. vulgaris + UWW); C+ (C. vulgaris + autoclaved UWW); and C− (raw UWW), at the beginning of the experiment (full colored bars) and after 9 d of treatment (striped bars). Results (average ± standard deviation) are expressed in a log (gene copy number 100 mL−1). Bars of the same gene with the same letters are not statistically different (two-way ANOVA followed by Tukey post hoc test p < 0.05).
Applsci 13 04266 g008
Figure 9. Abundance of the 16S rRNA,  intl1and the antibiotic resistance genes  sul1 and  blaTEM (A) and their relative abundance (prevalence) (B) in the C− (raw UWW) PBR over time and after 5 d of water storage (ST5d). Results (average ± standard deviation) of abundance are expressed in gene log (gene copy number 100 mL−1) and genes’ relative abundance is normalized according to 16S rRNA. Bars of the same gene with the same letter are not statistically different (two-way ANOVA followed by Tukey post hoc test p < 0.05).
Applsci 13 04266 g009aApplsci 13 04266 g009b
Table 1. Physicochemical characterization of the urban effluent collected after the secondary clarifier and used in this study.
ParametersValuesUnits
pH8.6-
Chemical oxygen demand (COD)85.4 ± 4.7mg O2 L−1
Humic Acids (HA)10.7 ± 0.3mg L−1
Nitrate–nitrogen (NO3–N)<LOD 1mg L−1
Phosphate–phosphorus (PO4–P)2.2 ± 0.1mg L−1
1 LOD = 0.2 mg L−1.
Table 2. Growth parameters determined for each PBR: CV (C. vulgaris + UWW), C+ (C. vulgaris + autoclaved UWW), and C− (raw UWW). Values with a common superscript letter and within the same column are not statistically different (p > 0.05).
PBRMCCmax (Cells mL−1)μmax (d−1)PX,avg (Cells mL−1 d−1)
CV(6.3 ± 0.4) × 105 a0.087 ± 0.002 a(1.7 ± 0.6) × 104 a
C+(8.1 ± 0.2) × 105 b0.115 ± 0.045 a(5.1 ± 0.2) × 104 b
C−(5.5 ± 0.1) × 105 a0.687 ± 0.065 b(9.0 ± 0.3) × 104 c
µmax: maximum specific growth rate; MCCmax: maximum microalgal cell concentration; PX,avg: average biomass productivity.
Table 3. Initial PO4–P concentration and removal parameters determined for each PBR: CV (C. vulgaris + UWW), C+ (C. vulgaris + autoclaved UWW), and C− (raw UWW). Values with a different letter within the same column are statistically different (p < 0.05).
PBRP0 (mg L−1)MR (mg L−1)RE (%)
CV2.40 ± 0.02 a1.67 ± 0.09 a69.60 ± 3.44 a
C+1.83 ± 0.02 c1.15 ± 0.03 b62.91 ± 0.61 b
C−2.20 ± 0.01 b2.04 ± 0.03 c92.62 ± 0.10 c
MR: mass removal; P0: initial phosphorus concentration; RE: removal efficiency.
Table 4. Relative abundance (prevalence) of intl1 and resistance genes (sul1 and blaTEM) at the beginning (T0) and at the end (T9) of the experiment, and percentage of the reduction of resistance genes after the treatment (RRG), determined for each PBR. For each gene, values (average ± standard deviation) with the same superscript letters are not statistically different (p < 0.05).
PBRintl1 sul1 blaTEM
Prevalence RRG (%)PrevalenceRRG (%)PrevalenceRRG (%)
T0T9 T0T9 T0T9
CV(1.5 ± 0.1) × 10−3 a(2.0 ± 0.1) × 10−3 a −40.0 ± 6.1 a(3.0 ± 0.1) × 10−2 a(2.3 ± 0.1) × 10−2 a22.3 ± 13.9 a(2.2 ± 0.1) × 10−4 a (4.0 ± 0.3) × 10−4 b−85.6 ± 4.9 a
C+(2.2 ± 1.0) × 10−3 a,b (4.0 ± 1.5) × 10−3 a,b27.2 ± 54.1 b(3.1 ± 0.1) × 10−3 a (4.2 ± 0.1) × 10−2 a−422.6 ± 113.5 b(8.1 ± 2.4) × 10−6 c(2.2 ± 0.1) × 10−6 d89.2 ± 5.1 b
C−(5.6 ± 1.2) × 10−3 b(1.8 ± 0.3) × 10−3 a,c 70.4 ± 9.2 c(3.9 ± 0.1) × 10−2 a(1.3 ± 0.1) × 10−2 a69.2 ± 7.5 c(6.6 ± 0.1) × 10−4 e(1.7 ± 0.2) × 10−4 a75.7 ± 1.6 c
Disclaimer/Publisher’s Note: The statements, opinions and data contained in all publications are solely those of the individual author(s) and contributor(s) and not of MDPI and/or the editor(s). MDPI and/or the editor(s) disclaim responsibility for any injury to people or property resulting from any ideas, methods, instructions or products referred to in the content.

