Article

Adaptive Dimensional Gaussian Mutation of PSO-Optimized Convolutional Neural Network Hyperparameters

School of Information and Control Engineering, Xi’an University of Architecture and Technology, Xi’an 710055, China
*
Author to whom correspondence should be addressed.
Appl. Sci. 2023, 13(7), 4254; https://doi.org/10.3390/app13074254
Submission received: 21 February 2023 / Revised: 22 March 2023 / Accepted: 26 March 2023 / Published: 27 March 2023

Abstract

:
The configuration of the hyperparameters in convolutional neural networks (CNN) is crucial for determining their performance. However, traditional methods for hyperparameter configuration, such as grid searches and random searches, are time consuming and labor intensive. The optimization of CNN hyperparameters is a complex problem involving multiple local optima that poses a challenge for traditional particle swarm optimization (PSO) algorithms, which are prone to getting stuck in the local optima and achieving suboptimal results. To address the above issues, we proposed an adaptive dimensional Gaussian mutation PSO (ADGMPSO) to efficiently select the optimal hyperparameter configurations. The ADGMPSO algorithm utilized a cat chaos initialization strategy to generate an initial population with a more uniform distribution. It combined the sine-based inertia weights and an asynchronous change learning factor strategy to balance the global exploration and local exploitation capabilities. Finally, an elite particle adaptive dimensional Gaussian mutation strategy was proposed to improve the population diversity and convergence accuracy at the different stages of evolution. The performance of the proposed algorithm was compared to five other evolutionary algorithms, including PSO, BOA, WOA, SSA, and GWO, on ten benchmark test functions, and the results demonstrated the superiority of the proposed algorithm in terms of the optimal value, mean value, and standard deviation. The ADGMPSO algorithm was then applied to the hyperparameter optimization for the LeNet-5 and ResNet-18 network models. The results on the MNIST and CIFAR10 datasets showed that the proposed algorithm achieved a higher accuracy and generalization ability than the other optimization algorithms, such as PSO-CNN, LDWPSO-CNN, and GA-CNN.

1. Introduction

Convolutional neural networks (CNNs) are essential types of deep learning models that have found wide applications in artificial intelligence. CNNs have achieved remarkable success in various fields, including image recognition [1,2,3], speech recognition [4,5,6], and natural language processing [7,8,9]. However, the performance of a CNN is heavily reliant on the selection of its hyperparameters. During the CNN training process, a range of hyperparameters needs to be predetermined, such as the size of the convolution kernel, the type of pooling layer, and the activation function. Different choices of hyperparameters can significantly impact the model’s performance. The size of the convolution kernel determines the size of the features extracted by the model, the type of pooling layer determines the way the model reduces the size of the feature map, and the kind of activation function affects the expressiveness of the network. Since the CNN hyperparameter settings are specific to the problem, the optimal hyperparameters for the different situations will likely differ. Therefore, efficiently selecting the optimal CNN hyperparameters is currently a hot research topic.
Early in the research, Bergstra et al. [10] proposed the grid and random search methods for hyperparameter optimization. The grid search method is an exhaustive trial-and-error approach that requires the appropriate expertise. This method can be effective when the number of hyperparameters is small. However, as the hyperparameter search space increases, the time consumed by the grid search method increases exponentially. The random search method uses sampled parameters for randomly selecting the optimal hyperparameters. The search results have some level of uncertainty, and each sampling point does not consider the previous effects, which may result in the problem of repeated searches.
In order to overcome the time-consuming and laborious task of the manual selection of the hyperparameters, researchers have recently achieved promising results using metaheuristic algorithms for hyperparameter optimization. Metaheuristic algorithms have become a research trend in CNN hyperparameter optimization due to their evolutionary features. These algorithms are usually classified into nine different categories, including swarm-based algorithms, chemical-based algorithms, biology-based algorithms, physics-based algorithms, sport-based algorithms, music-based algorithms, social-based algorithms, mathematics-based algorithms, and hybrid methods [11]. Among these categories, swarm-based algorithms are the most widely used in the field of CNN hyperparameter optimization.
Yamasaki et al. [12] were the first to apply PSO to the field of CNN hyperparameter tuning and proposed the PSO-CNN algorithm. Their experiments on five different image datasets showed that the proposed algorithm significantly improved the model’s accuracy compared to the original AlexNet model. To improve the algorithm’s global and local search capabilities, Serizawa et al. [13] introduced a linear decreasing inertia weighting strategy. They proposed the LDWPSO-CNN algorithm, which obtained a better LeNet-5 image classification accuracy on the MNIST and CIFAR-10 datasets. Guo et al. [14] proposed the DPSO-CNN model, which combines distributed techniques with PSO-CNN to reduce the time required for algorithm operation. Singh et al. [15] addressed the problem of the algorithm runtime by proposing a multi-level particle swarm optimization (MPSO-CNN) algorithm, which combined the hierarchical ideas with the hyperparameter optimization problems by simultaneously searching for the structure and hyperparameters of the CNN using multiple levels of particle swarms. Lee et al. [16] applied a genetic algorithm to the hyperparameter optimization problem of convolutional neural networks and achieved superior results in their experiments on an amyloid brain dataset for Alzheimer’s diagnosis by searching for an excellent CNN network structure and hyperparameters. Rasmiranjan et al. [17] used the gray wolf optimization algorithm to select the suitable CNN hyperparameters by searching for them in a skin lesion multiclass dataset. They conducted experiments with GA-CNN model, which showed an excellent competitiveness for the proposed algorithm.
The cited studies in the references [12,13,14,15,16,17] demonstrated the effective outcomes in hyperparameter optimization of convolutional neural networks by applying evolutionary algorithms. Nonetheless, CNN hyperparameter optimization is a complex optimization problem with multiple locally optimal solutions, and these studies have disregarded the limitations of evolutionary algorithms in solving intricate optimization problems. Specifically, evolutionary algorithms converge on locally optimal solutions and have a limited solution accuracy when confronted with complex issues. The advantages and disadvantages of the mentioned hyperparametric optimization methods are shown in Table 1.
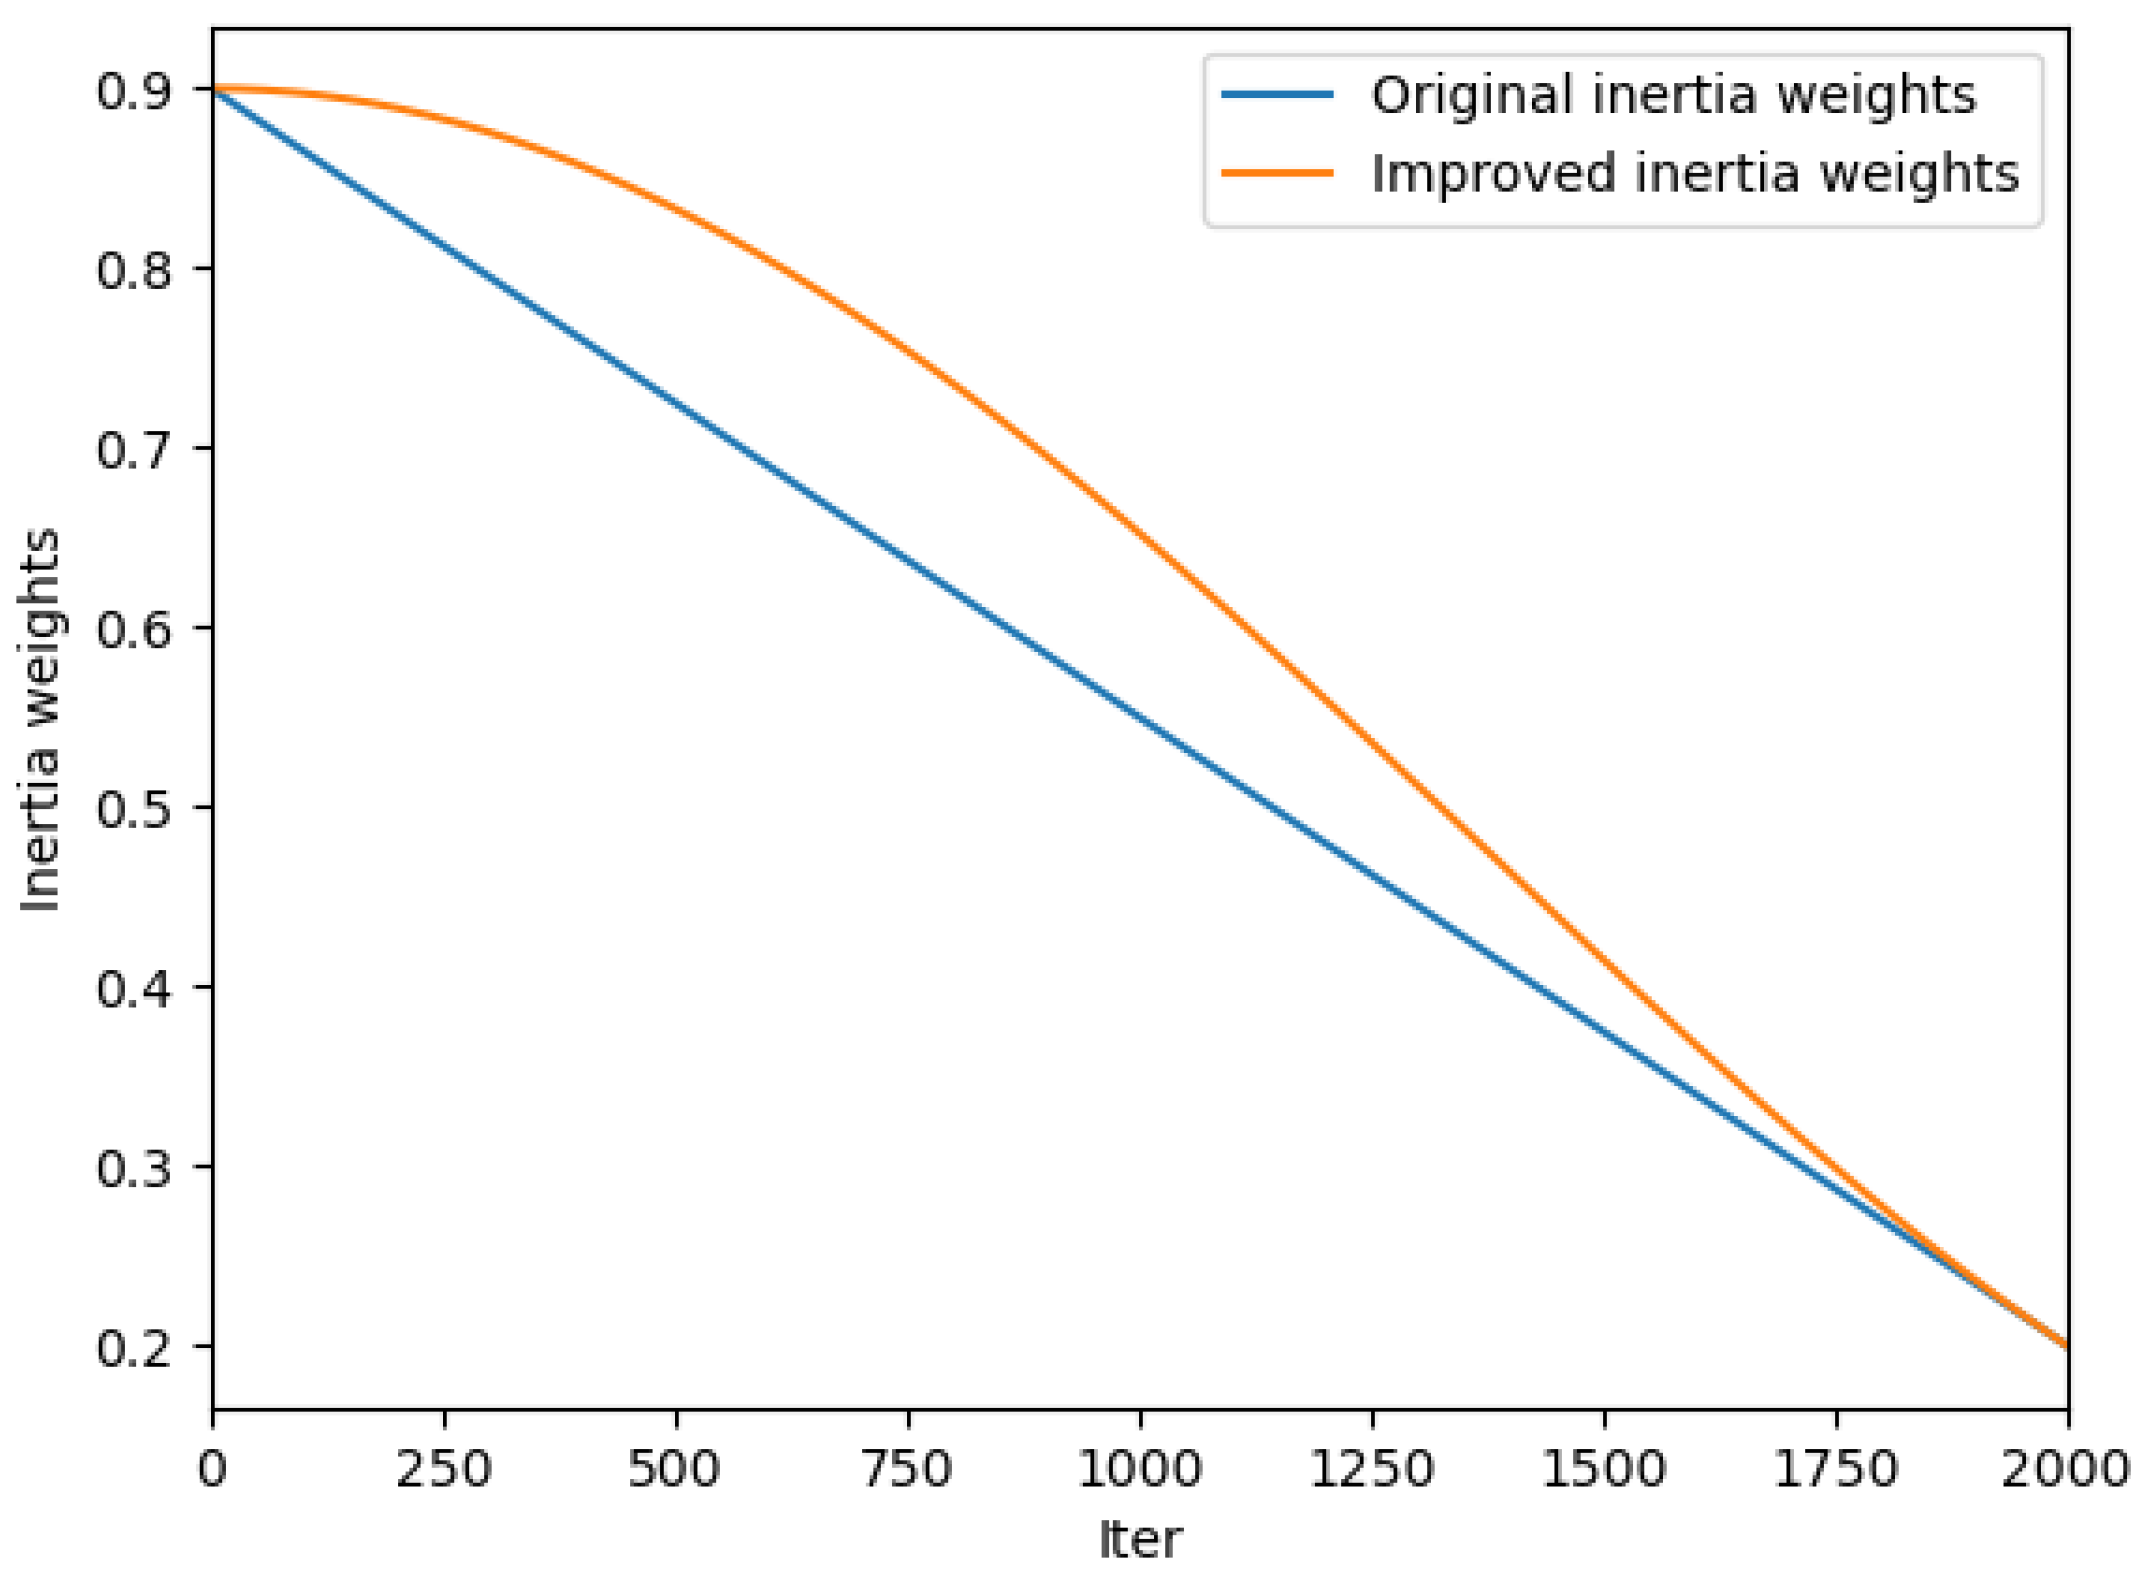
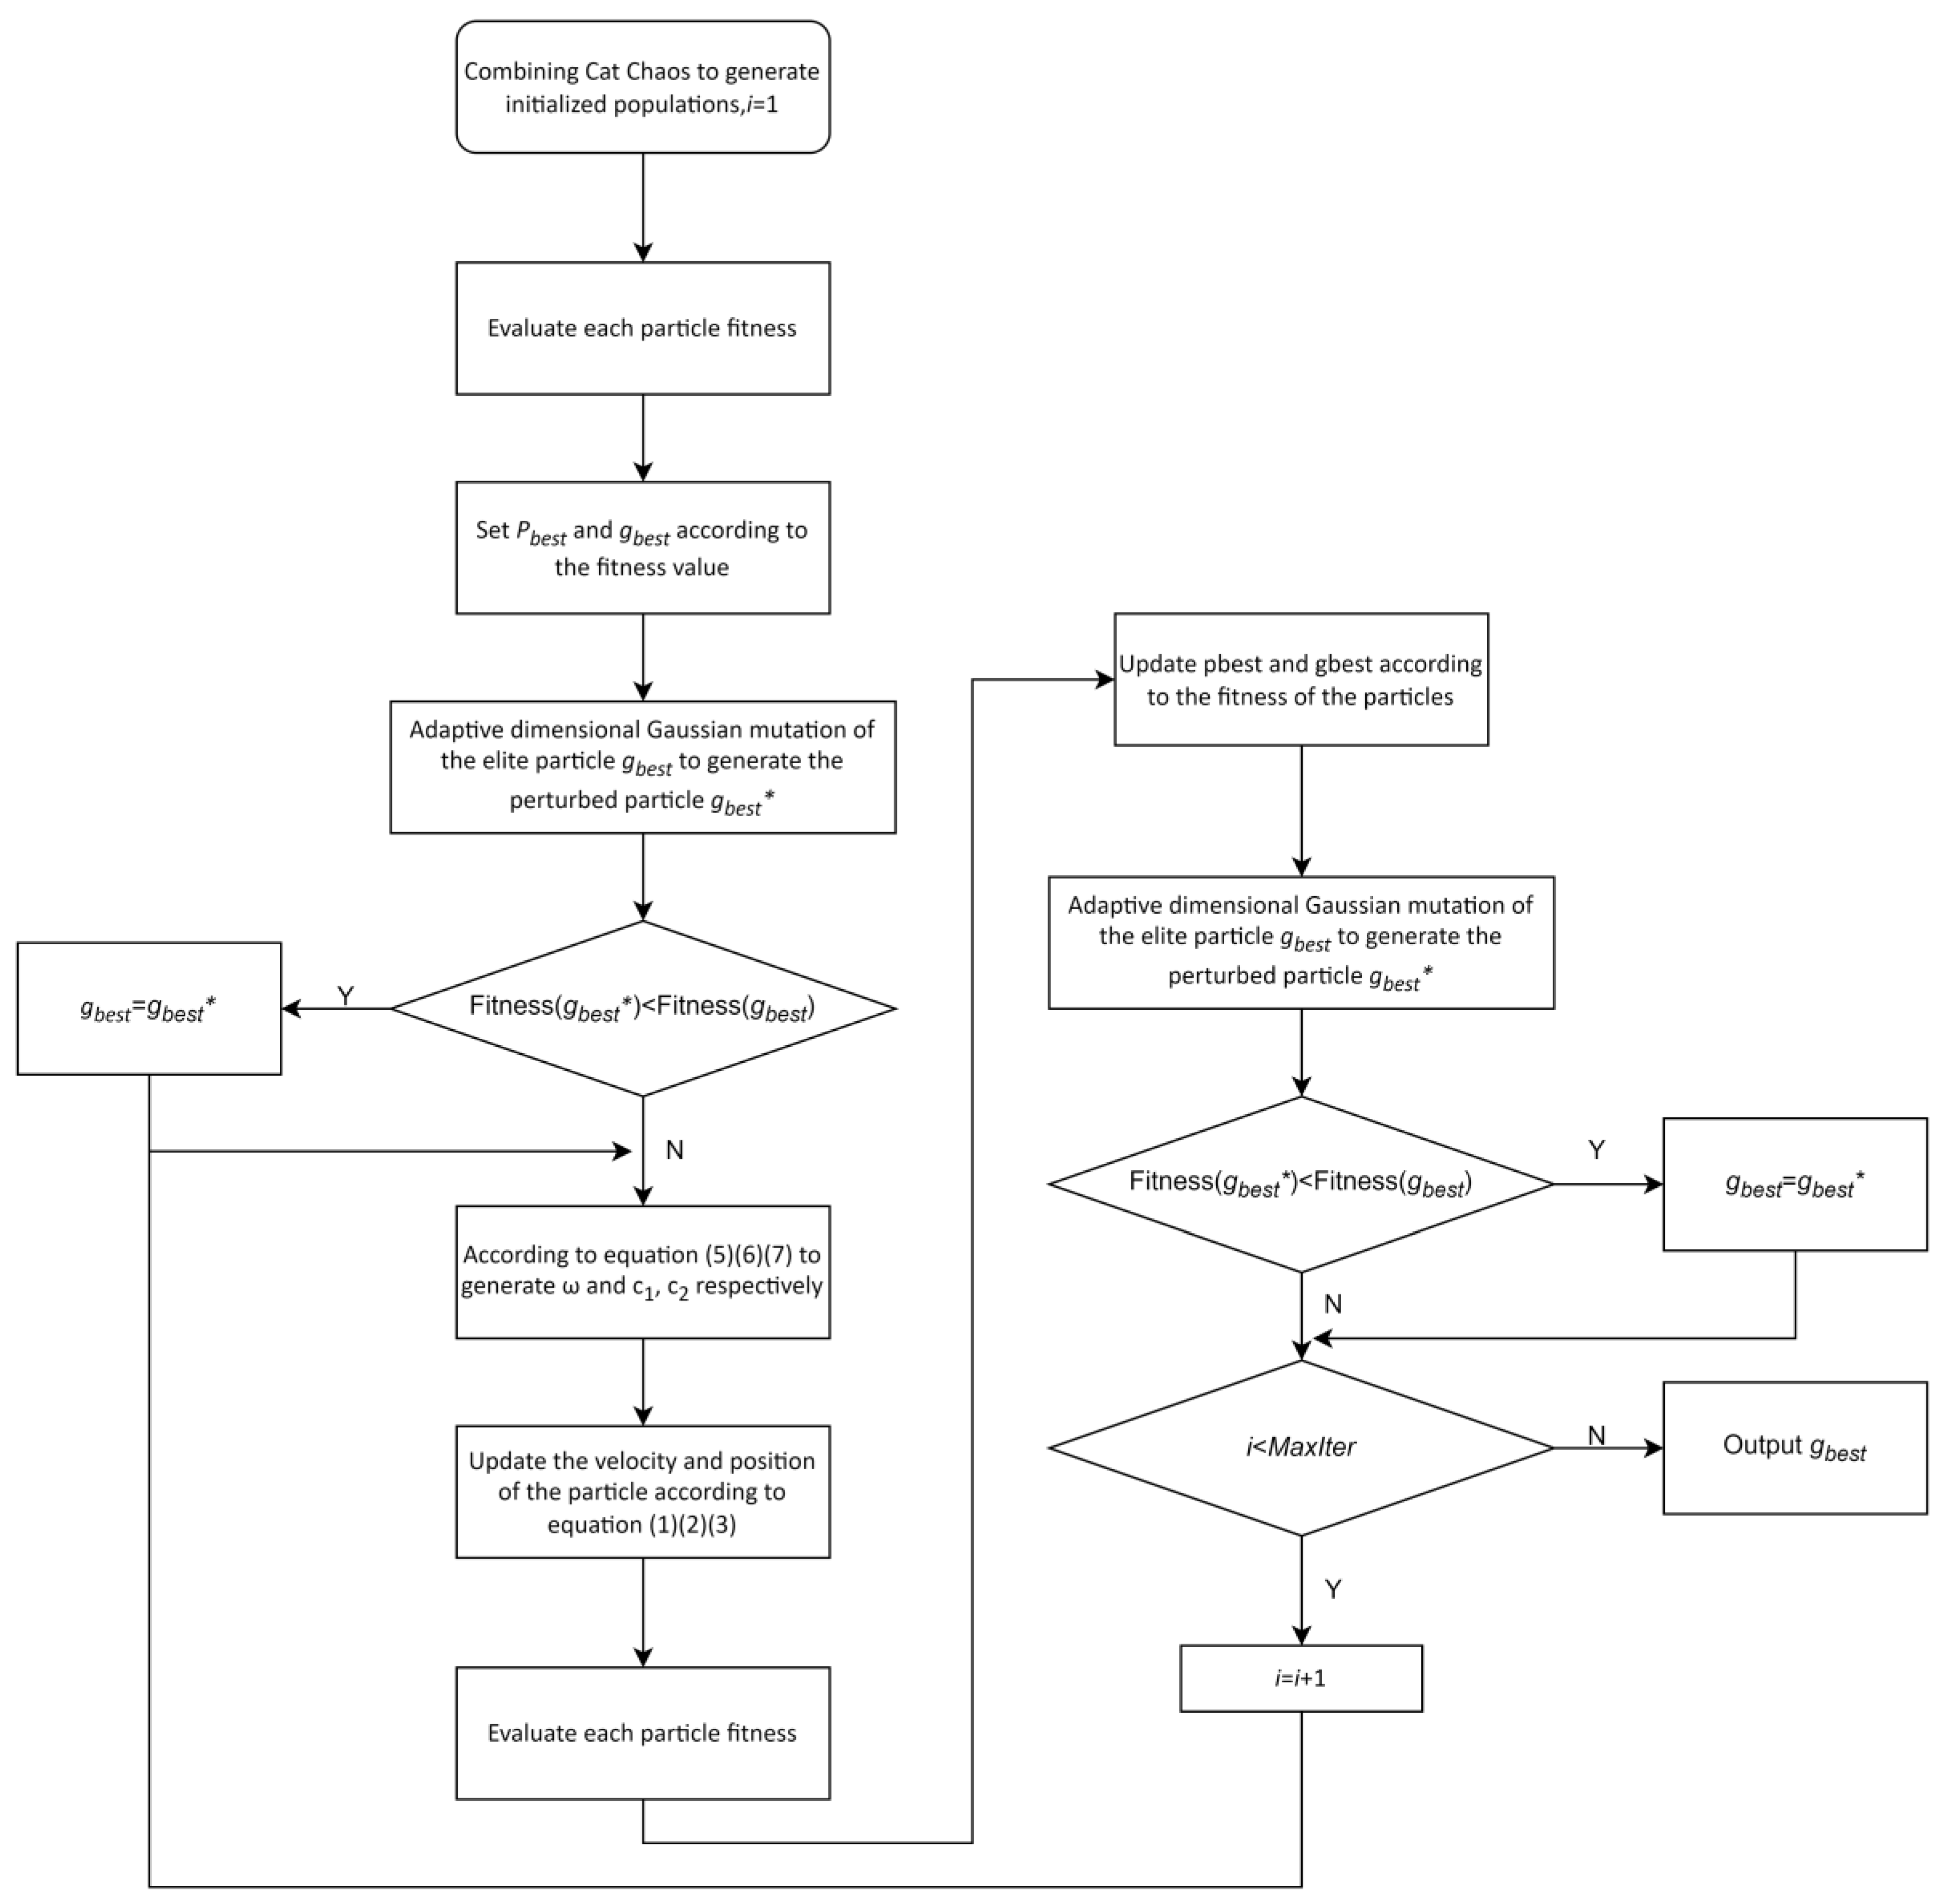
To address the challenges mentioned above and improve the automatic discovery of the optimal hyperparameter configurations, this paper presents a particle swarm algorithm with an adaptive dimensional Gaussian mutation. Compared to the original PSO, this method offers three key advantages: (1) the initialization of the population using cat chaos mapping, which enhances the uniformity of the initial population; (2) the introduction of a sine-based nonlinear decreasing inertia weight and a heterogeneous learning factor strategy that balances the pre-exploration and post-exploitation capabilities; and (3) the proposal of a strategy for an adaptive dimensional Gaussian mutation for the elite particles to increase the optimal global particle, which enhances the search range and facilitates the escape from local optimal solutions. The elite particles’ dimensionality is adaptively reduced later to preserve most of their information and improve the algorithmic convergence accuracy. The experimental results demonstrate the superiority of the proposed algorithm over the standard CNN models and the PSO-CNN, LDWPSO-CNN, and GA-CNN methods.
The main contributions of this paper are as follows:
  • This paper proposes an adaptive dimensional Gaussian mutation particle swarm algorithm to enhance the algorithm’s performance by addressing the limitations of the standard PSO method. The proposed approach leverages a cat chaotic initial population, a sine-based nonlinear decreasing inertia weight, an asynchronous learning factor strategy, and an elite particle adaptive dimensional Gaussian mutation strategy.
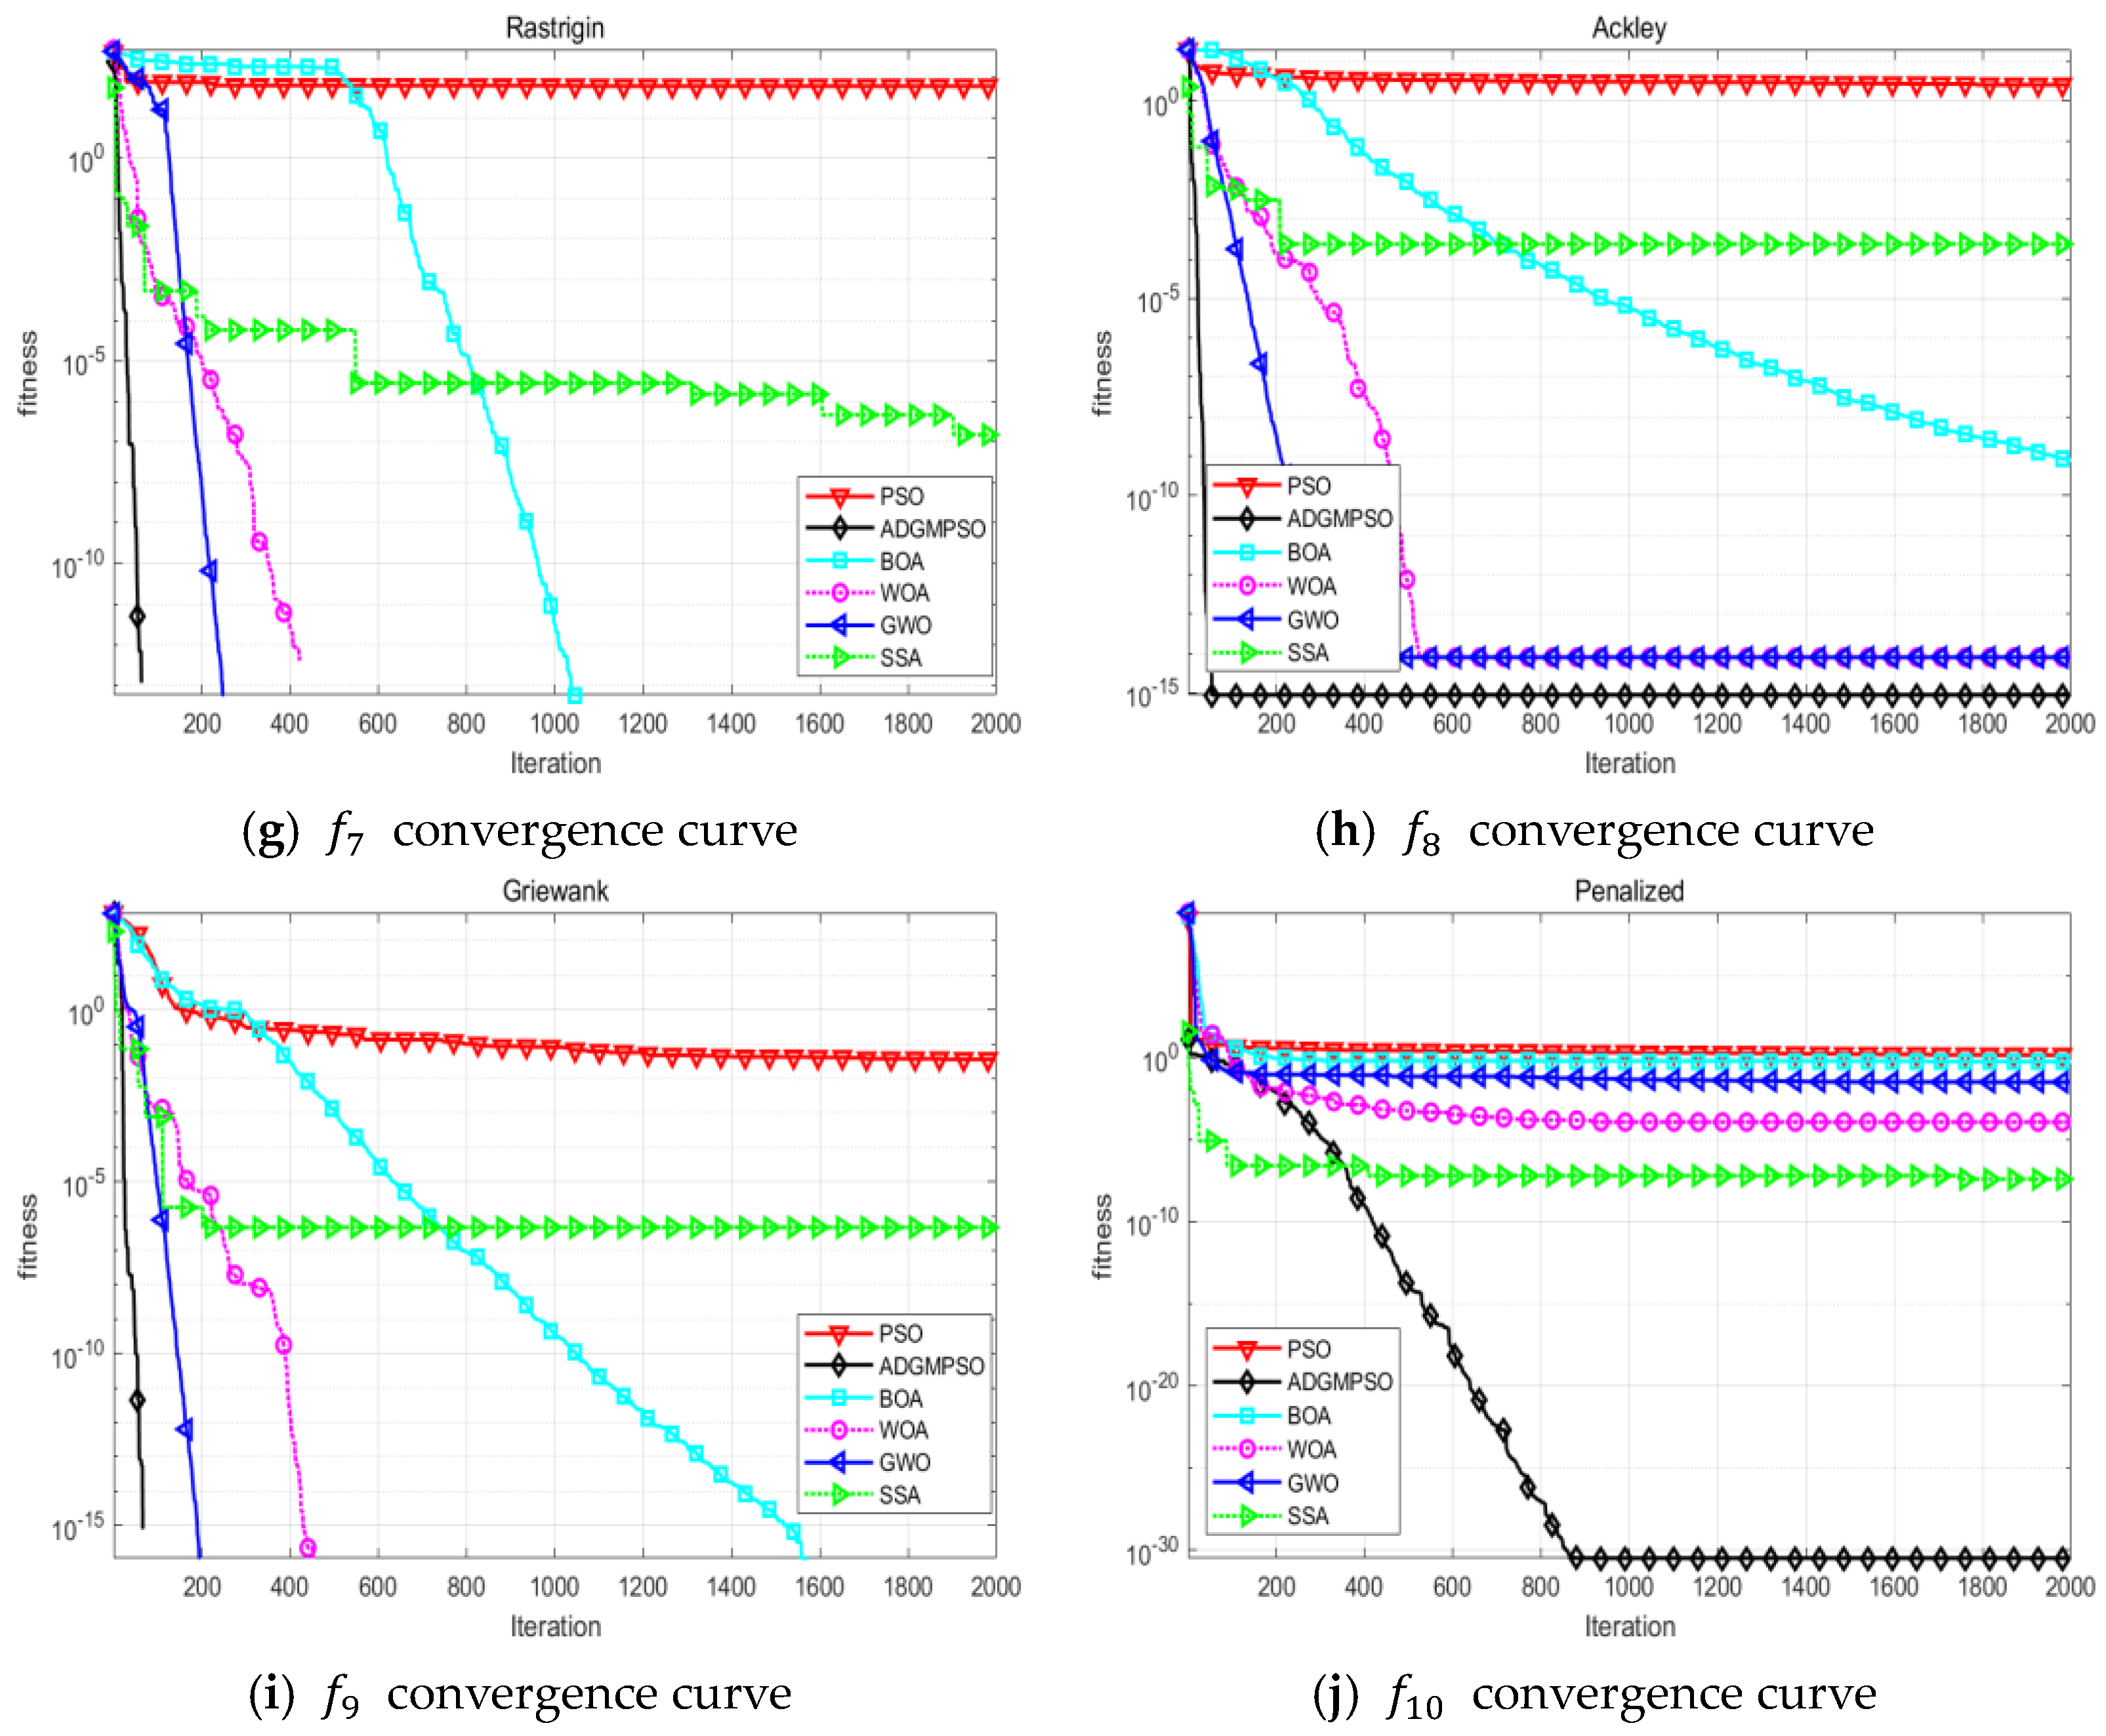
  • The performance of the proposed algorithm is evaluated through benchmark function comparisons with the mainstream evolutionary algorithms. Additionally, a single policy ablation experiment is conducted to demonstrate the effectiveness of the proposed improvements.
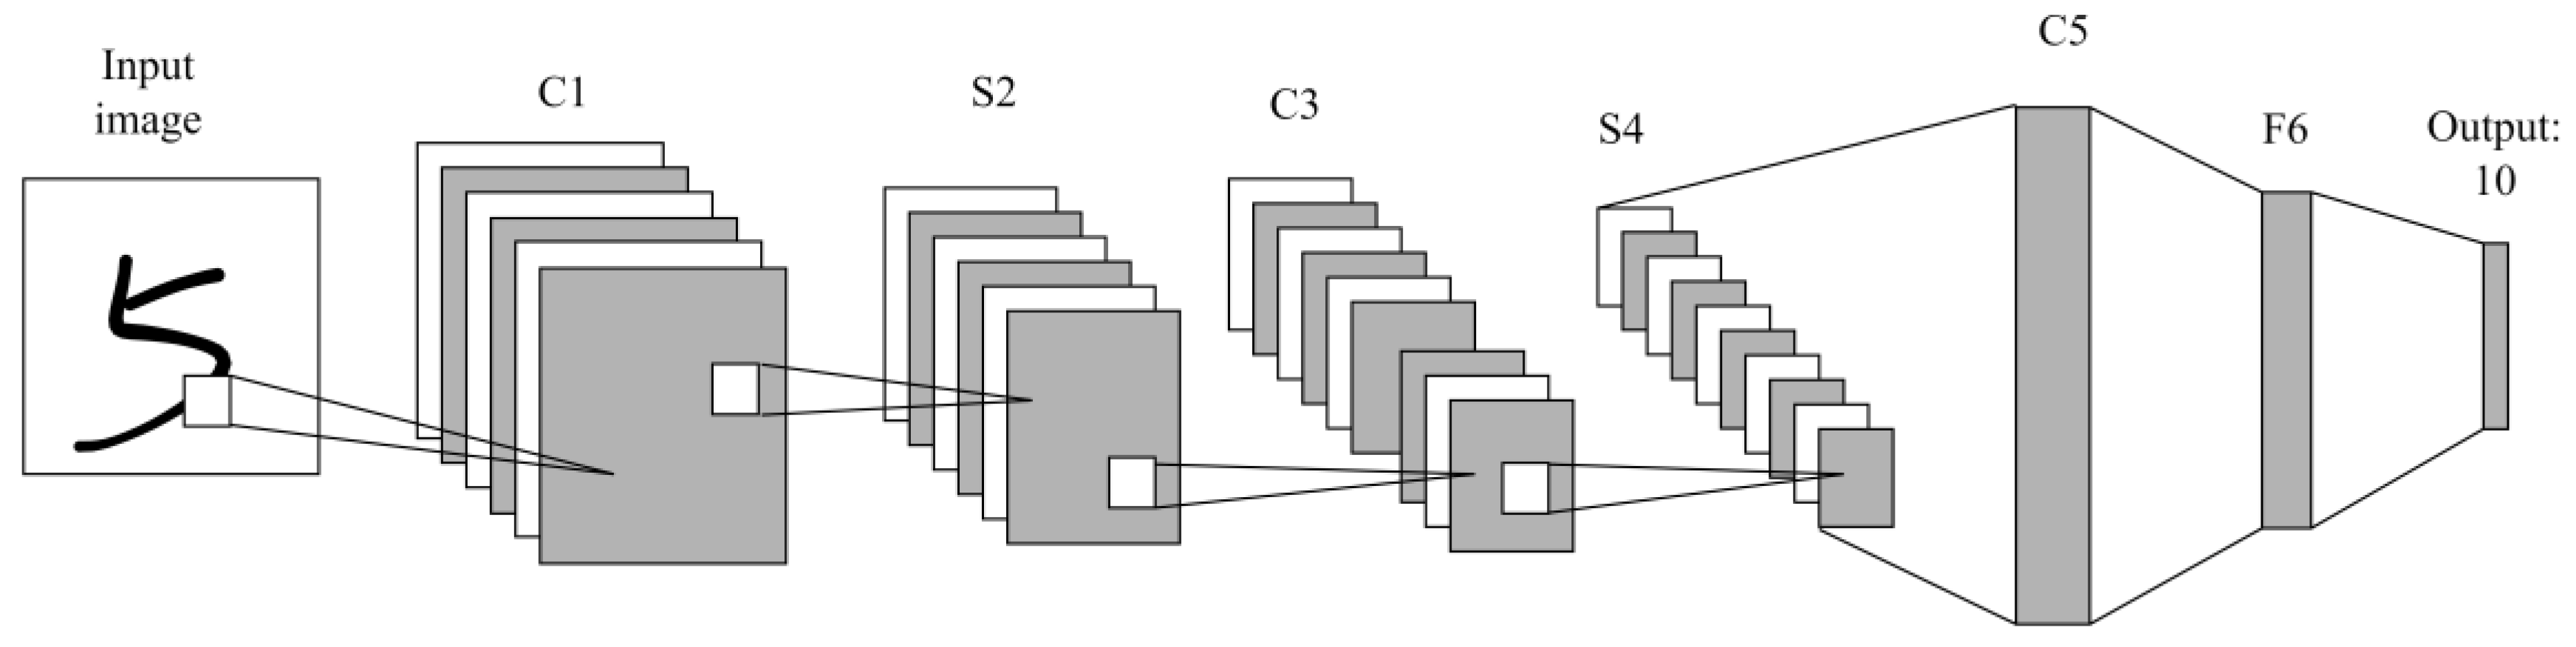
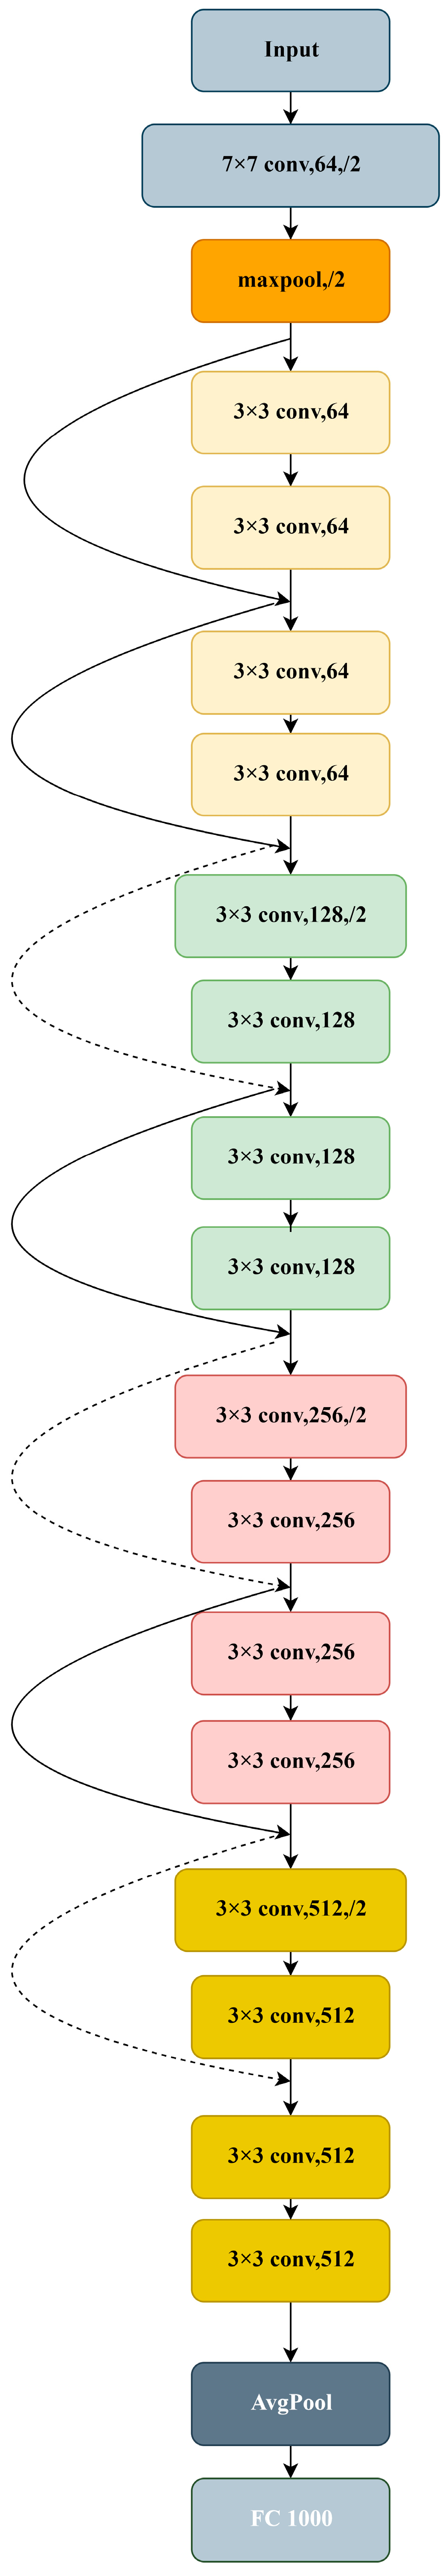
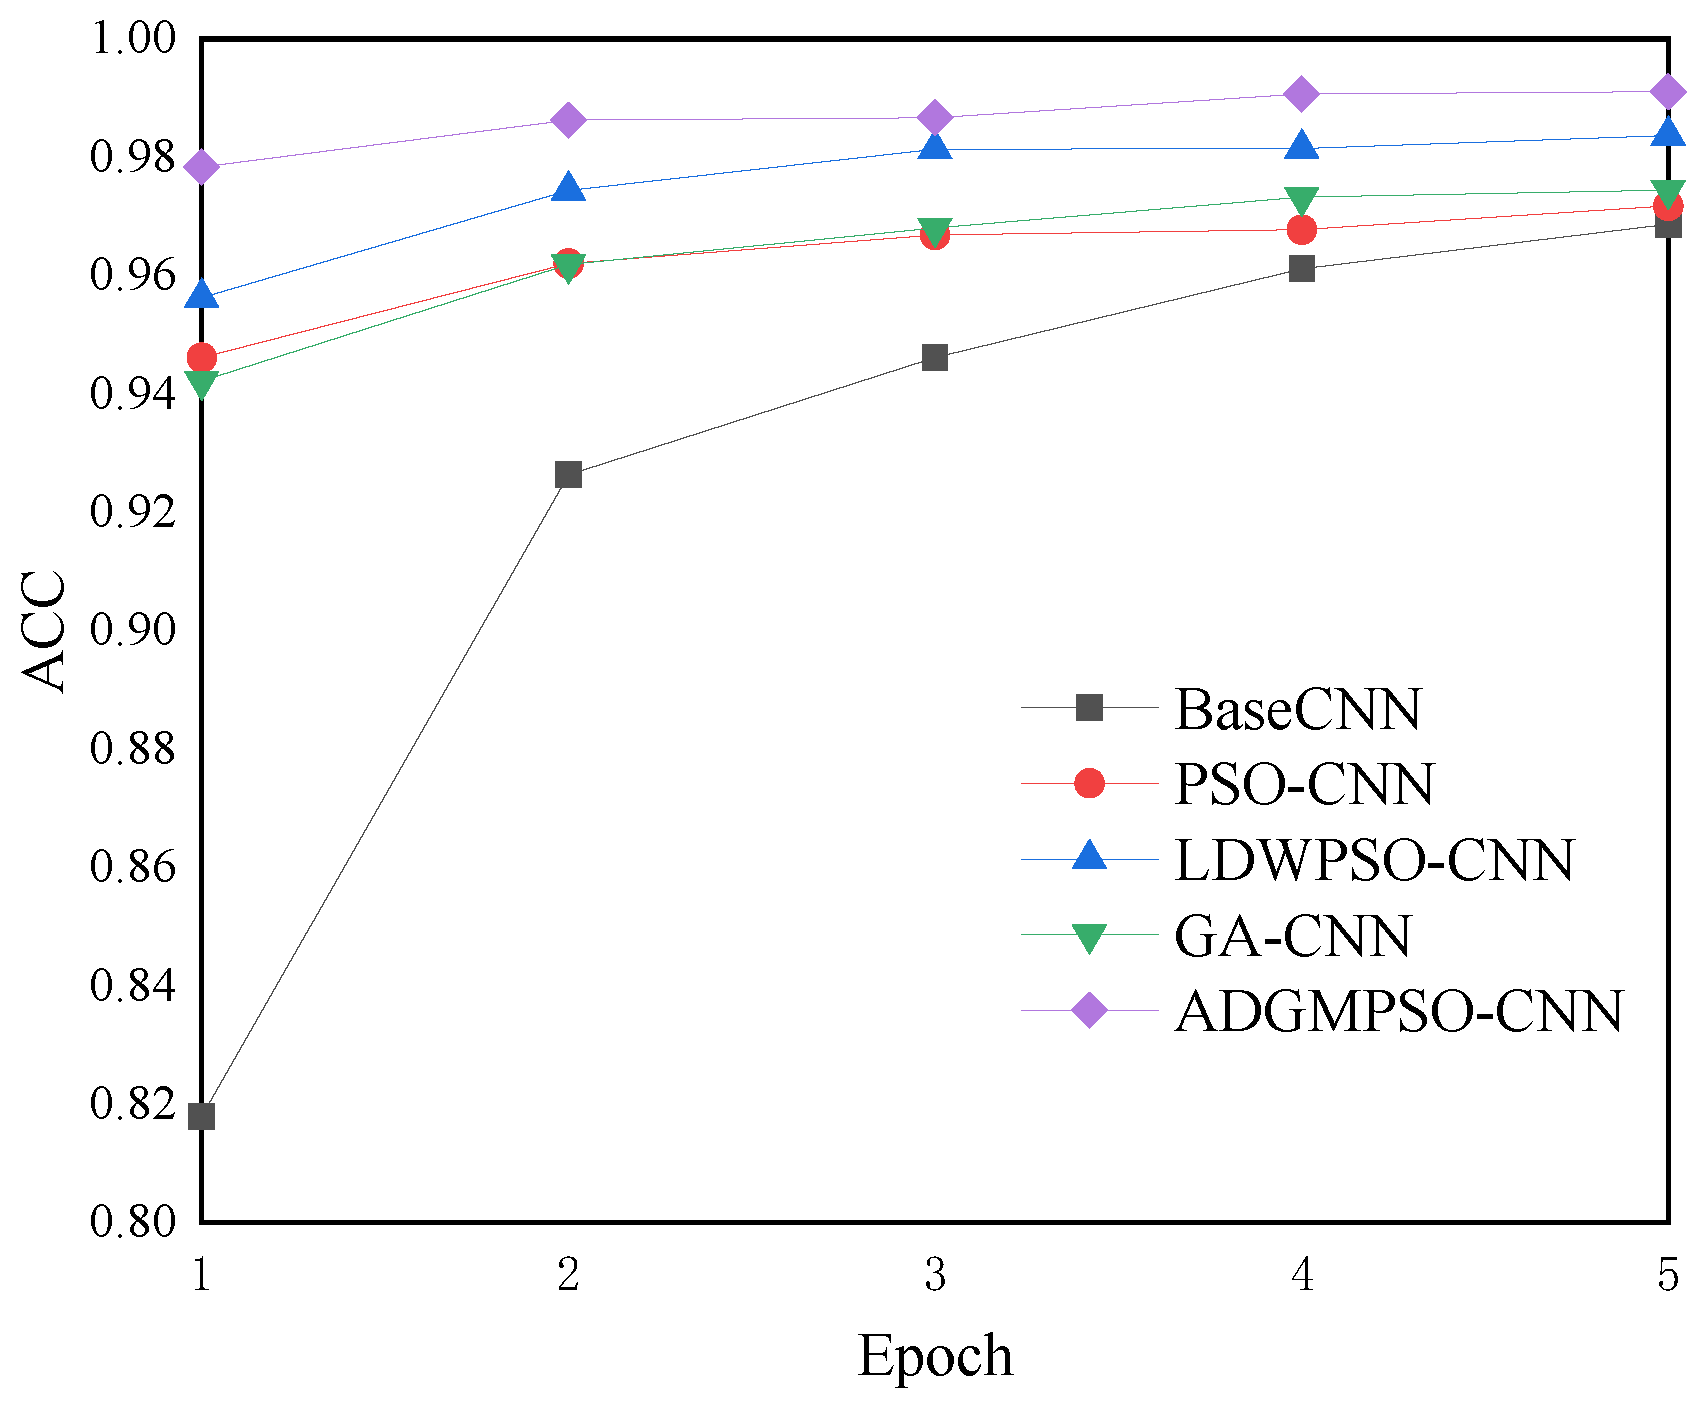
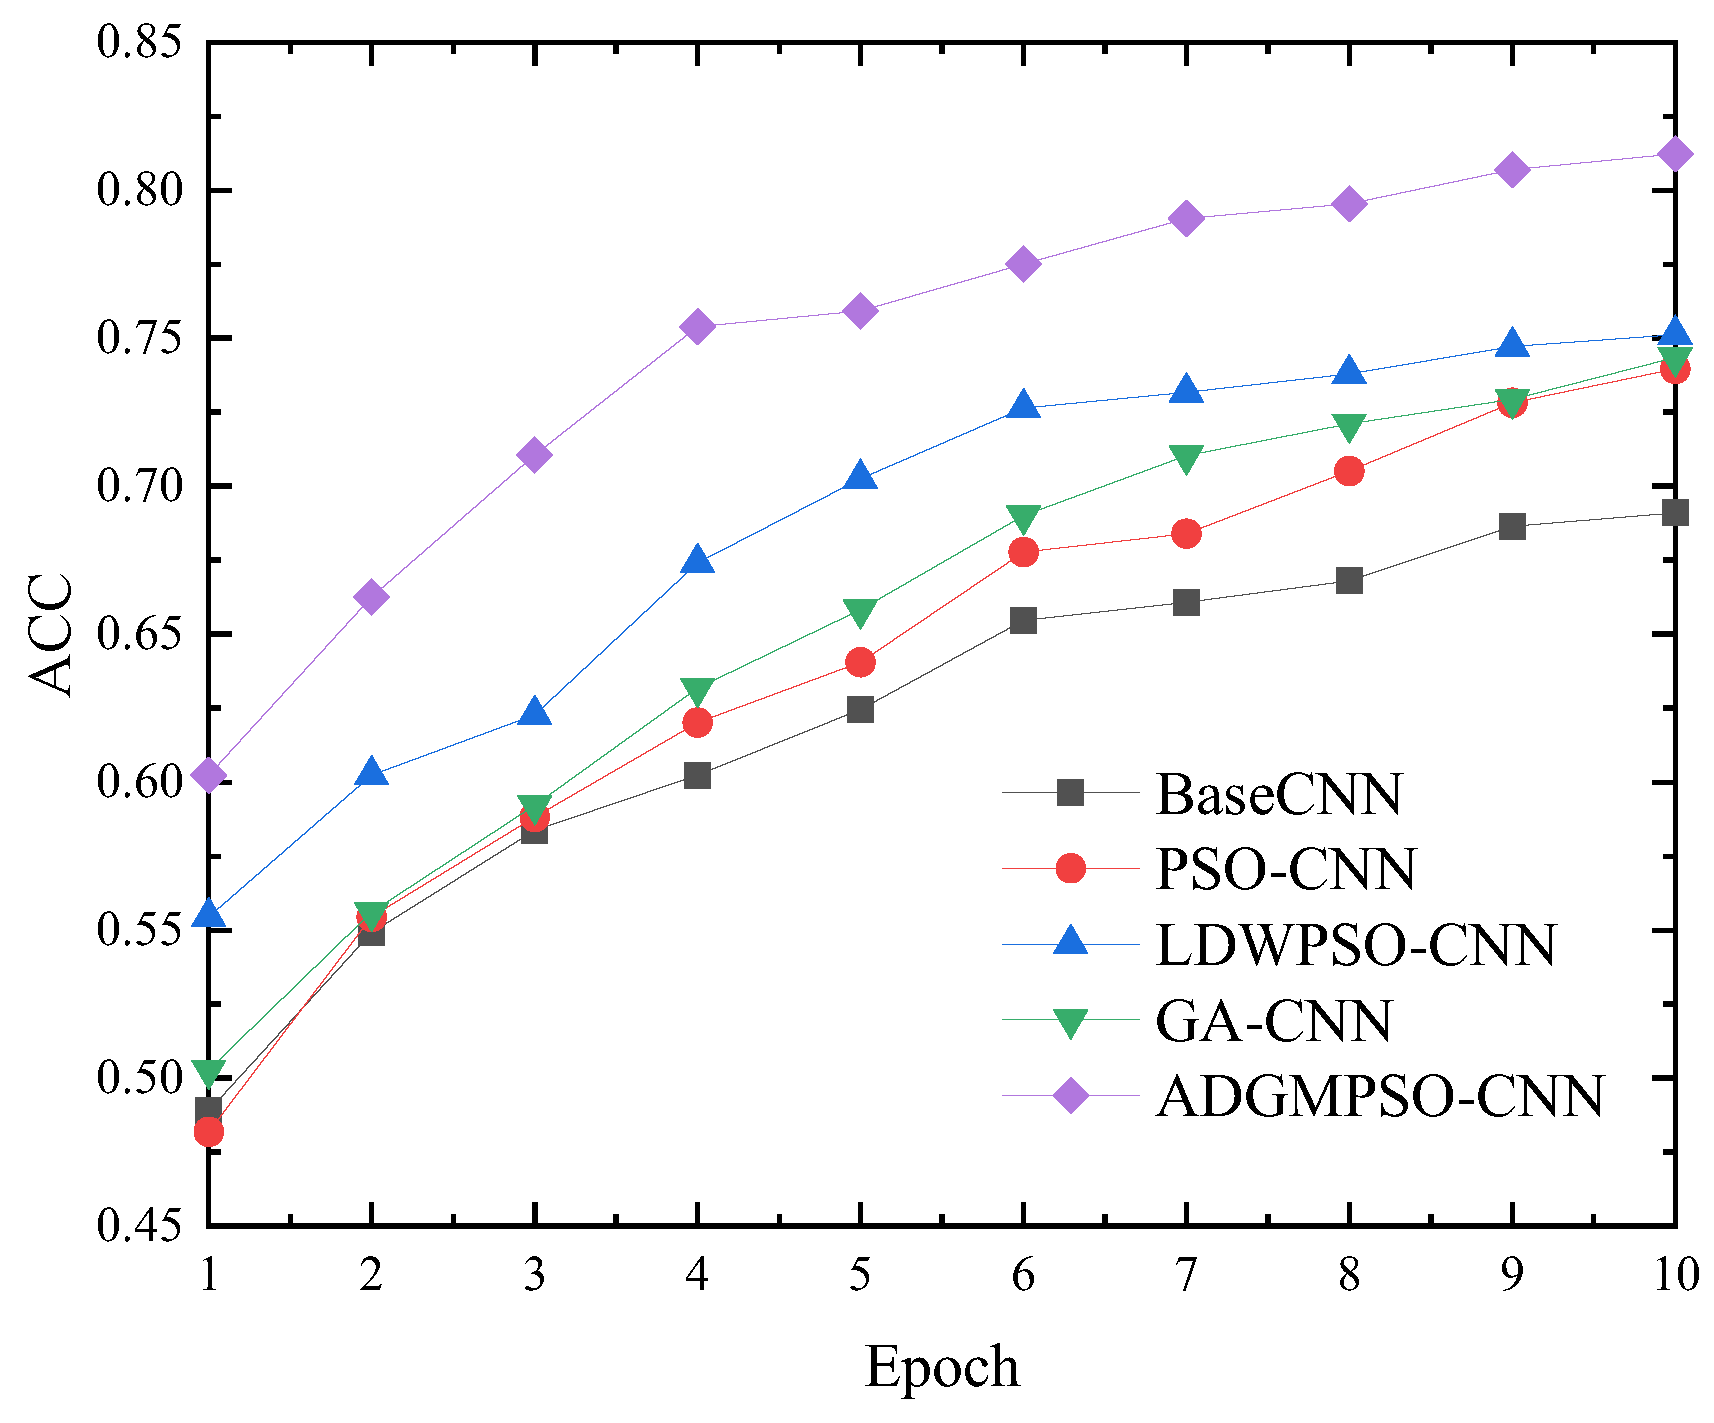
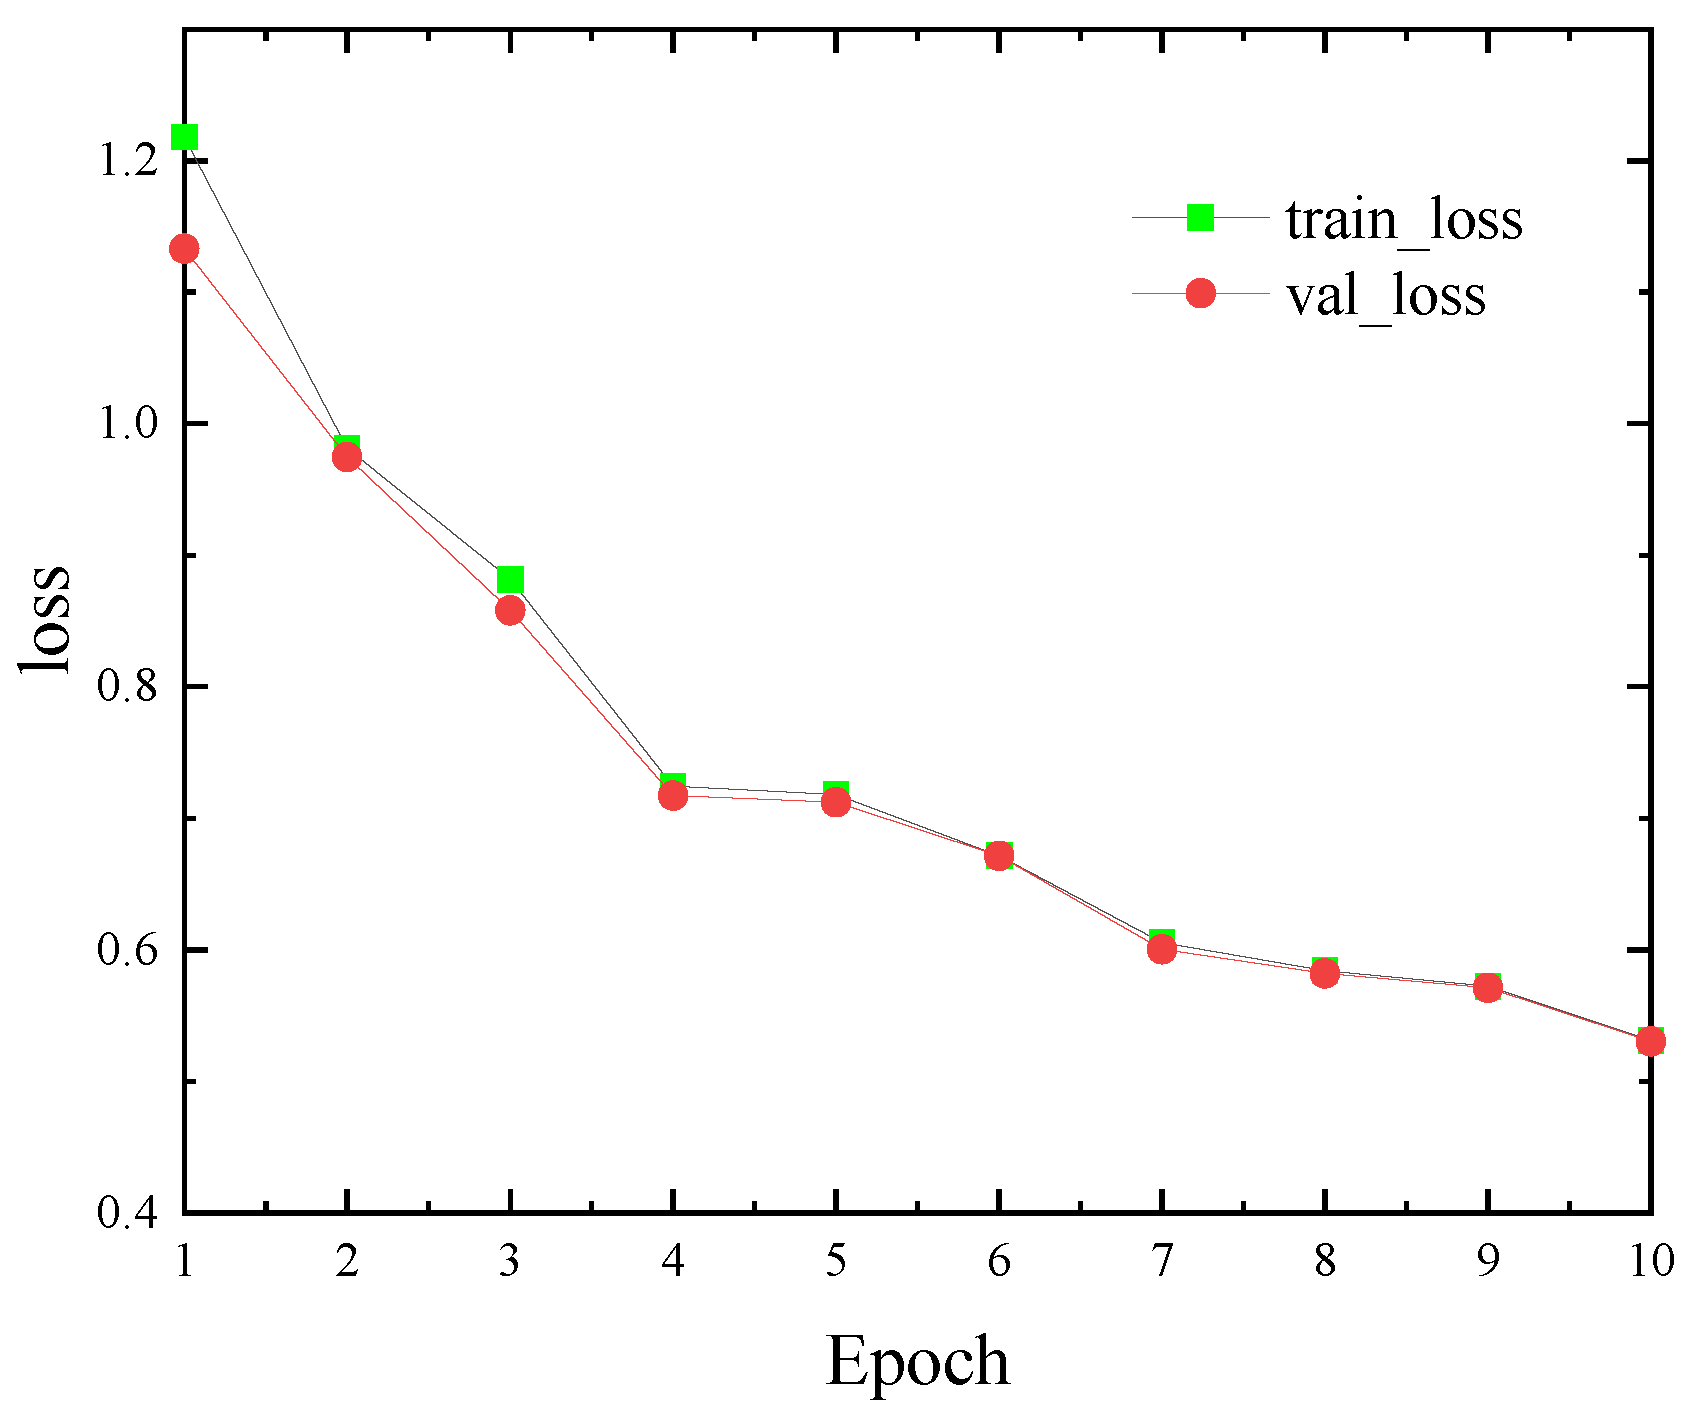
  • The proposed algorithm is applied to the hyperparameter optimization for the classical CNN models LeNet-5 and ResNet-18 on the MNIST and CIFAR10 datasets, respectively. The experimental results demonstrate that the optimized network model achieved a 99.11% accuracy after only five epochs on the MNIST dataset and 81.23% after ten epochs on the CIFAR10 dataset. The accuracy achieved on the CIFAR10 dataset after ten epochs, 81.23%, was significantly higher than that of the standard CNN model and the related hyperparameter optimization algorithms, such as the PSO-CNN, LDWPSO-CNN, and GA-CNN.
The essay is organized as follows. The convolutional neural network-related theories and demonstrative CNN models are introduced in Section 2 of this paper as well as the underlying theory and equations of the PSO algorithm. Section 3 details the improvement strategies related to the proposed improved algorithm ADGMPSO. Section 4 tests the proposed algorithm against five mainstream evolutionary algorithms using benchmark test functions and examines the effectiveness of the improved strategy. Section 5 combines the ADGMPSO with two typical CNN models, LeNet-5 and ResNet-18, to perform hyperparameter tuning experiments on the MNIST and CIFAR-10 datasets. Finally, Section 6 provides a summary of the main findings and the conclusions of the study while also identifying the potential avenues for future research.

2. Related Theory

2.1. Convolutional Neural Networks

CNNs consist of three main components: a convolutional layer, a pooling layer, and a fully connected layer. The convolutional layer plays a crucial role in the feature extraction of the input features. By utilizing convolutional kernels, it captures valuable feature information from the input data, and the size and number of the convolutional kernels significantly influence the network’s overall performance. The pooling layer is utilized to decrease the computational complexity by reducing the size of feature maps [18] while preserving the vital features. The two common forms of pooling layers are average pooling and maximal pooling. After the convolutional and pooling layers, towards the end of the CNN, one or more fully connected layers are often added to create global semantic information. The number of neurons and the selection of the activation function in the fully connected layers are some of the most critical hyperparameters influencing the network performance. Some of the more representative CNN models are LeNet-5 [19] and ResNet [20]. LeNet-5 is a classic CNN model with a straightforward architecture, as illustrated in Figure 1. It is widely used for recognizing handwritten digits in MNIST datasets.
ResNet is a prominent CNN model that addresses the degradation problem of the network at deeper layers by introducing the residual structure and utilizing the jump connection feature. Owing to its high performance, ResNet is widely used in various research fields. ResNet-18, the simplest ResNet model, is depicted in Figure 2. ResNet-18 exhibits a remarkable performance in the tasks involving relatively simple data scenarios.

2.2. Particle Swarm Optimization Algorithm

PSO is a widespread metaheuristic algorithm that aims to find an optimal or near-optimal solution within a given solution space by simulating the foraging behavior of a bird flock [21]. Each individual is continuously updated based on their position and velocity information about the optimal position. In each evolutionary process, each particle updates the velocity and position information at the next moment using Equations (1) and (2) to approximate the optimal or suboptimal solution in the solution space.
v i d t + 1 = ω v i d t + c 1 r 1 p b e s t i d x i d t + c 2 r 2 g b e s t d x i d t
x i d t + 1 = x i d t + v i d t + 1
In PSO, v i d t and x i d t represent the d-dimensional velocity and the position components of the particle at moment t , respectively. The particle’s d-dimensional individual optimal component of the ith particle is denoted by p b e s t i d , while gbest d represents the d-th dimensional component of the population optimum. The learning factors c 1 and c 2 usually take a fixed value of 2, while the inertia weight ω controls the particle’s momentum. To increase the algorithm’s randomness, r 1 and r 2 are set to random numbers between 0 and 1.
In addition, when the velocity evolved by the particle swarm optimization algorithm exceeds V m a x or falls below V m i n , it is often necessary to limit the velocity by clamping it to the maximum or minimum velocity. It is commonly used in PSO algorithms, as shown in Equation (3).
v i d t + 1 = V m a x ,   i f   v i d t + 1 > V m a x V m i n ,   i f   v i d t + 1 < V m i n .

3. ADGMPSO Algorithm

ADGMPSO improves the traditional PSO algorithm in three key aspects: (1) initializing populations based on the cat chaos strategy. (2) Combining the sine-based nonlinear decreasing inertia weights and asynchronous change learning factor strategy. (3) the elite particle adaptive dimensional Gaussian mutation strategy.

3.1. Cat Chaos Initialization Population

In evolutionary algorithms, whether the initial population distribution is uniform significantly affects the algorithm’s solution accuracy and convergence speed [22]. Standard PSO initializes the population by generating random variables, which have a poor ergodicity and an uneven distribution of the initial individuals [23].
Chaotic mappings are often incorporated into the metaheuristic algorithms due to their advantages, such as a high ergodicity and randomness. Bingol and Alatas [24] were the first to apply chaotic systems to optics inspired optimization (OIO) algorithms to improve OIO’s global convergence speed and accuracy. They proposed three methods for improving chaotic OIO by incorporating five chaotic mappings into the two components of OIO. Similarly, the bird swarm algorithm (BSA) is prone to premature convergence and can fall into local optimal solutions. Therefore, the literature [25] integrates chaotic mappings into the BSA to address these limitations. However, logistic chaotic mappings, widely used in metaheuristic algorithms, have certain drawbacks, such as a sensitivity to the initial values and a high probability of mapping point edges, resulting in a relatively uneven traversal. To overcome these limitations, Yu et al. [26] proved that cat chaotic mappings have better chaotic properties and ergodicity than logistic mappings, making them a promising option for enhancing the optimization algorithms’ exploration and exploitation capabilities. This study introduces the sat chaotic mapping in this context to enhance the diversity and uniformity of the initial population in the evolutionary algorithms. By leveraging the superior properties of the cat chaotic mapping, we can generate initial populations with a greater diversity and a more uniform distribution of individuals, thus enhancing the algorithm’s global search capabilities and improving its performance. Its chaotic sequence generation function is defined in Equation (4).
x n + 1 y n + 1 = 1 1 1 2 x n y n   m o d   1
To initialize the particle swarm population, a chaotic sequence matrix of the dimensions N × D is generated using Equation (4), where N denotes the size of the population and D denotes the dimensionality of an individual. Following this, the chaotic sequences are mapped to the initial population of individuals using Equation (5).
X i j = l b j + u b j l b j × y i j  
In this context, l b j denotes the minimum value of the jth dimensional search range, while the symbol u b j indicates the j-dimensional search space’s maximum value.

3.2. Sine-Based Nonlinear Decreasing Inertia Weights and the Asynchronous Change Learning Factor Strategy

The inertia weight, denoted by the symbol ‘ ω ’, is a crucial PSO parameter that improves the algorithm’s accuracy and speed of convergence. Standard PSO utilizes a linear decreasing inertia weighting strategy. However, the solution search process for real-world problems is typically nonlinear [27]. Therefore, this paper uses a sine-based nonlinear decreasing inertia weights strategy to improve the inertia weights, as shown in Equation (6).
ω = ω m a x t × ω m a x ω m i n T × s i n t × π 2 T
The variable T represents the maximum number of iterations for the evolutionary process, while t indicates the current iteration number. Figure 3 shows the improved inertia weight map, where ω is large at the beginning of the iterative evolution, which facilitates a global search in the solution space. Then, it decays rapidly. In the late iteration, the exact search is performed with a small ω .
In addition to the inertia weights, the learning factors c 1 and c 2 are vital parameters that affect the performance of PSO. c 1 and c 2 represent the weights of an individual and the social cognition of the particles, respectively, and play a vital factor in changing the convergence speed and search direction. Usually, c 1 and c 2 are set to a constant value of 2. However, given that the search process is stochastic, it takes work to perform an accurate quantitative analysis of the learning factors [28]. Exploitation and exploration are two crucial stages in the evolutionary process of PSO. It is essential to enrich the diversity of the population in the early stage of evolution and enhance the exploration ability of the particles in the late stage. Hence, in this paper, we propose an improved learning factor strategy. As shown in Equations (7) and (8), During evolutionary iterations, the individual learning factor is decreased, and the social learning factor is increased to achieve a balance between the ability to develop and qualitatively explore these iterations. Additionally, the sum of the two factors is kept constant as the PSO algorithm progresses. This paper implemented this strategy to enhance the particles’ exploration ability in the later stages of evolution while enriching the population diversity in the early stages.
c 1 = c max c max c min t T
c 2 = c min + c max c min t T
where c max and c min mean the maximum and minimum learning factors, respectively.

3.3. Elite Particle Adaptive Dimensional Gaussian Mutation Strategy

Sarangi et al. [29] verified that Gaussian mutations improve the convergence of PSO, and thus approach a better solution. To address the limitations of PSO in solving complex problems, such as low accuracy, a susceptibility to local optima, and slow convergence, this paper proposes an adaptive dimensional Gaussian mutation strategy for the current elite particle, i.e., the optimal global position, to improve the algorithm’s performance. Add a perturbation of the standard Gaussian distribution variation term to the optimal global position to produce a mutated position. The Gaussian function is shown in Equation (9).
G u s s i α = 1 2 π σ 2 e α 2 2 σ 2
where α is a random number from 0 to 1 and σ is 1.
To enhance the performance of the PSO algorithm, the global search range is improved early to increase the convergence speed, and the convergence accuracy is later enhanced. This work suggests an adaptive dimensional Gaussian mutation approach. Early in the evolution, a more significant number of dimensions of the elite particles, i.e., the optimal global particles, are selected for Gaussian mutation to improve the search range and avoid being trapped in the local optima. This is achieved by adaptively determining the dimension ratio γ , where γ m a x and γ m i n represent the maximum and minimum mutation dimension ratios for each round of iterations using Equation (10). In the later stage, the dimension ratio of the Gaussian mutation is adaptively decayed to enhance the search of the local regions near the elite particles and boost the convergence of the algorithm’s performance.
γ = γ m a x γ m a x γ m i n × t T
As presented in Equation (11), the global optimal particle g b e s t is subjected to Gaussian mutation to generate a new position g b e s t * . However, the new position produced by perturbation may not necessarily be superior to the original position of the elite particle. In order to prevent a degradation of the evolutionary effect, a greedy selection strategy is employed for the mutated elite particle. Specifically, the fitness of the individual generated after each mutation iteration is compared with that of the global optimal particle. If the fitness of the mutated particle is superior, it is updated as the new global optimal particle. On the other hand, if the fitness is inferior, the elite particle remains unchanged.
g b e s t * = g b e s t + g b e s t × G u s s i α

3.4. Procedure of ADGMPSO

Based on the improvement of the PSO algorithm in Section 4.1, Section 4.2 and Section 4.3, Figure 4 illustrates the detailed implementation process of the ADGMPSO algorithm.

4. Benchmark Function Testing and Analysis

4.1. Introduction to Benchmark Functions and the Experimental Environment

To evaluate the optimization performance of ADGMPSO, we conducted experiments using ten standard benchmark test functions listed in Table 2. The functions f 1 to f 6 were single-peak test functions, used to measure the algorithm’s convergence speed. Functions f 7 to f 10 were multi-peak test functions that evaluated the algorithm’s convergence accuracy. All of the test functions used in this study had a dimension of 30, with an optimal value of 0.
The runtime environment of the benchmark test function is shown in Table 3.

4.2. Comparison of ADGMPSO to Other Mainstream Evolutionary Algorithms

For the comparison experiments with the proposed ADGMPSO, we selected five existing algorithms: the particle swarm optimization algorithm (PSO), butterfly optimization algorithm (BOA) [30], whale optimization algorithm (WOA) [31], squirrel search algorithm (SSA) [32], and gray wolf optimization algorithm (GWO) [33]. We analyzed the performance of the algorithms based on the obtained optimal values, mean values, and standard deviations. The population size of each algorithm was set to 40, and the maximum number of iterations was set to 2000. All the algorithms were randomly initialized, with the exception of ADGMPSO, which utilized the cat chaos initialization population. The termination condition for all the algorithms was that the current iteration count reached the maximum number of iterations. The essential parameters for each algorithm were set, as shown in Table 4.
To minimize the experimental error caused by the randomness, 20 comparative experiments were conducted on 10 benchmark functions for each of the six algorithms, including the proposed ADGMPSO, using the same simulation equipment and operating environment specified in Table 4. Table 5 displays the best results, average results, and standard deviations of the various methods on the ten benchmark functions.
It can be inferred from the experimental findings of the benchmark test functions reported in Table 5 that ADGMPSO identified the theoretical optimal solution in terms of the optimal values for solving the single-peak functions f 1 , f 2 , f 3 , as well as the multi-peak functions f 7 and f 9 . Even though ADGMPSO failed to reach the theoretically ideal value for the test functions f 4 , f 5 , f 6 , and f 10 when determining the ideal value, it significantly outperformed the other five algorithms by orders of magnitude.
The optimal value alone did not reflect the overall algorithm performance. However, upon analyzing the average results presented in Table 5, it became apparent that ADGMPSO consistently achieved the lowest mean value across all ten benchmark test functions compared to the other five algorithms. Therefore, ADGMPSO exhibited the highest convergence capability and overall optimization performance.
The standard deviation reflects the robustness of an algorithm, with a minor standard deviation indicating more excellent stability and robustness. In contrast, a more significant standard deviation indicates greater volatility and less robustness. The experimental results indicated that ADGMPSO achieved the theoretical optimum for the standard deviation in test functions f 1 , f 2 , f 3 , f 5 , f 7 , f 8 , and f 9 , demonstrating the best robustness among the six algorithms. While it did not reach the theoretical optimum in the test functions f 4 and f 10 , it still outperformed the other algorithms by several orders of magnitude.
To make it easier to compare how fast the algorithms converged and how accurate they were, the convergence curves were generated for the ten benchmark test functions. The convergence accuracy was represented by the vertical axis, while the number of iterations was represented by the horizontal axis. Figure 5 shows that the ADGMPSO algorithm achieved convergence to the desired accuracy in fewer iterations than the other algorithms for all the test functions. Although BOA, WOA, and GWO also reached the theoretical optimum on the multi-peaked functions f 7 and f 9 , they required significantly more iterations than ADGMPSO.

4.3. Wilcoxon Rank Sum Test

To further compare whether the ADGMPSO algorithm was significantly different from other algorithms, a Wilcoxon rank sum test was performed between the 20 iterations of ADGMPSO and the other algorithms at a significance level of p = 5 % . The null hypothesis (H0) was rejected if the value was less than p = 5 % since there was a substantial difference between the two algorithms. If NaN was obtained, it indicated that the overall performance of the two algorithms was the same, and the significance could not be determined [34]. The findings of the R denoted by the symbols “ + ”, “ ” and “ = ” denoted that the performance of ADGMPSO was, respectively, superior to, inferior to, and equal to the compared algorithms. The results, shown in Table 6, indicate that ADGMPSO outperformed PSO and SSA significantly in all the tested functions. Eight test functions showed significantly better results than BOA and GWO, and two test functions showed approximately equal performance. Performance-wise, ADGMPSO generally outperformed the other algorithms by a wide margin.

4.4. Improvement Strategy Validity Test

The previous experiments mainly compared the improved PSO with the other mainstream evolutionary algorithms and showed the excellence of the proposed ADGMPSO algorithm. To further confirm the extent of the influence and effectiveness of the improved strategy on ADGMPSO, it was compared experimentally to the standard PSO. PSO1 improved based on the cat initialization strategy, PSO2 improved based on the sine-based nonlinear decreasing inertia weights and asynchronous change learning factors, and PSO3 improved based on the adaptive dimensional Gaussian mutation. The experimental parameters were set consistently for 20 experiments and the results are presented in Table 7.
As can be seen from Table 7, PSO1 improved using the cat chaos initialization and had a performance that was several times better compared to the PSO algorithm for all three metrics due to its more uniformly distributed initial population. PSO2 had performances that were several or even tens of orders of magnitude better than the PSO for each function. This was due to the sine-based nonlinear decreasing inertia weights and the asynchronous change learning factor strategy, which enabled the algorithm to conduct a more extensive search of the solution space range in the initial phase and a detailed local exploration in the later stage. PSO3 used the adaptive dimensional Gaussian mutation strategy of the elite particles to perturb the optimal global solution with mutation, which enabled the algorithm to perform a more significant perturbation to explore a more comprehensive search space in the early stage, and smaller perturbations to facilitate local exploitation and to improve the algorithm’s ability to overcome local optima. Since the multi-peaked function had multiple locally optimal solutions, the PSO3 algorithm showed a significant performance improvement compared to the PSO, as it converged to more accurate values by evading of the local optimum via mutation.
The three proposed improvement strategies based on the original PSO algorithm demonstrated performance improvements in the benchmark function’s optimal value, mean, and standard deviation. ADGMPSO combined the advantages of all three strategies and exhibited an optimal performance in finding the optimal value in the benchmark function test.

5. Hyperparameter Optimization of the CNN

5.1. Experimental Settings

To show the effectiveness of ADGMPSO in optimizing the hyperparameters of the convolutional neural networks, this study applied the improved algorithm to the classic LeNet-5 CNN model and the more popular ResNet-18 CNN network model. The MNIST handwritten digit dataset [18] and the CIFAR-10 dataset [35] were the benchmark datasets. The MNIST dataset contained 10,000 test images and 60,000 training images, all of which were 28 × 28 single-channel grayscale images of the numbers zero to nine. This study used MNIST as the benchmark dataset for optimizing the hyperparameters of LeNet-5. Each hyperparameter of LeNet-5 that needed optimization was used as a dimension of the individual ADGMPSO particle, and the hyperparameter information encoded by the different particle dimensions is shown in Table 8.
The CIFAR-10 dataset is a multi-channel RGB image dataset of ten different types of images. It has 10,000 test images and 50,000 training images, all of which are 32 × 32 pixels in size. It was used as the benchmark dataset for the hyperparameter optimization experiments of ResNet-18. This paper used hyperparameter tuning for the first convolutional layer and pooling layer of the ResNet-18 network since they were responsible for the feature extraction and the dimensionality reduction from the original data, respectively [36]. Considering the computational cost, the tuning was limited to these two layers. The information on the hyperparameters that were to be optimized is shown in Table 9.
To compare the performance of the base CNN model, PSO-CNN, LDWPSO-CNN, GA-CNN, and the model optimized by the proposed algorithm with the hyperparameters, five experiments were conducted on the same device to reduce the experimental error, and the results were averaged. Given that the hyperparameters to be optimized were entirely integers, all the algorithms in this paper were encoded using integers. To represent the discrete hyperparameters, such as the pooling layer types, integer one corresponded to the max. pooling, and integer two corresponded to the avg. pooling. Additionally, the rounding operation was applied to each dimension of the evolving individual to ensure the correctness of the network structure. Furthermore, every optimization algorithm in this study employed the classification accuracy of the dataset images as the fitness function. The population size for all the selected optimization algorithms was 10, and the maximum number of evolutions was 30. Details of the relevant parameters for all the algorithms are listed in Table 10.
All the algorithms used random initialization except ADGMPSO-CNN, which used cat-based chaos to initialize the population. All the algorithms were terminated by reaching the maximum number of iterations. The operating environment of the hyperparameter optimization experiment is shown in Table 11.

5.2. LeNet-5 Hyperparameter Optimization Experiments

The MNIST handwritten digit dataset was used as the benchmark dataset for this experiment. The hyperparameters were optimized every five epochs, and the network was trained based on the optimized hyperparameters. The LeNet-5 hyperparameters obtained after optimization using ADGMPSO-CNN are shown in Figure 6.
Compared to the standard LeNet-5, the optimized hyperparameters had a larger number of convolution kernels for extracting more feature information. The ReLU activation function was more effective in addressing the vanishing gradients problem than the original Sigmoid activation function used in the neural networks. The mixture of the max. pooling and avg. pooling enhanced the model’s generalization performance by preserving the image texture and background information while also reducing the dimensionality. The optimized number of neurons in the fully connected layer was selected to prevent overfitting issues.
As can be seen from Figure 7, The hyperparameter optimization algorithms based on evolutionary algorithms showed promising results compared to the base CNN. Among them, PSO-CNN and GA-CNN achieved similar results in optimizing the hyperparameters. However, the performance of LDWPSO-CNN was slightly better due to its linear decreasing inertia weighting strategy. The algorithm ADGMPSO-CNN proposed in this paper achieved a significantly better performance in the search for optimization than PSO-CNN, LDWPSO-CNN, and GA-CNN through three improvement strategies. The optimized standard LeNet-5 model achieved a high accuracy from the first iteration and finally reached 99.11% accuracy after the five training iterations, showing a significant improvement.
Figure 8 illustrates the average loss curve of the LeNet-5 model optimized by ADGMPSO-CNN on the MNIST dataset, indicating a well-fitted model.

5.3. ResNet-18 Hyperparameter Optimization Experiments

The ResNet-18 model was trained on the CIFAR-10 image dataset and was evaluated based on its accuracy after ten epochs. The model’s hyperparameters were optimized using ADGMPSO-CNN, and the results are presented in Figure 9.
Given the small size of the images in the CIFAR-10 dataset compared to the original ResNet-18 model, the hyperparameters optimized by ADGMPSO-CNN for ResNet-18 included a smaller convolutional kernel size and stride size. This was to preserve the original image information as much as possible while still extracting helpful features. Additionally, using avg. pooling helped reduce the dimensionality and passed information to the next module for the feature selection.
Based on the findings presented in Figure 10, it was evident that the PSO-CNN, GA-CNN, and LDWPSO-CNN models were well-optimized, surpassing the performance of the base CNN model. At each epoch, the accuracy of the ResNet-18 model optimized by the ADGMPSO-CNN method was much higher than that of the standard ResNet-18 model and the other hyperparameter optimization algorithms. After ten epochs of learning, the accuracy rate of the ADGMPSO-CNN algorithm reached 81.23%, further indicating the effectiveness of ADGMPSO-CNN.
The average loss curve of the ResNet-18 model, which was optimized by ADGMPSO-CNN on the CIFAR-10 dataset, is depicted in Figure 11. The curve demonstrates that the model was well-fitted to the dataset.
Comparing the two experiments demonstrated that the ADGMPSO-CNN algorithm significantly improved the hyperparameter optimization of convolutional neural networks. The tuning performance of the ADGMPSO-CNN algorithm outperformed the compared optimization algorithms on various neural network models and datasets. These results show that the proposed ADGMPSO-CNN algorithm exhibited a significant superiority in the generalization capability.

6. Conclusions and Future Work

In this paper, we proposed an adaptive dimensional Gaussian mutation PSO (ADGMPSO) algorithm that incorporated three improvement strategies to enhance the performance of PSO in identifying optimal solutions. The experimental results comparing the proposed algorithm with mainstream evolutionary algorithms using ten benchmark functions demonstrated its advantages in the convergence speed, evading locally optimal solutions, and the convergence accuracy. The hyperparameter tuning experiments on the LeNet-5 and ResNet-18 models for the MNIST and CIFAR10 datasets further showed the superiority and generalization ability of the proposed algorithm.
Despite the positive impact of our study, its limitations must be acknowledged. Firstly, since ADGMPSO aimed to improve the PSO algorithm’s ability to avoid locally optimal solutions and convergence accuracy, it did not optimize the algorithm’s running time and, therefore, did not reduce the algorithm’s running time compared to the original algorithm. Secondly, when conducting the hyperparameters optimization experiments for more complex convolutional neural networks, this paper optimized the hyperparameters of only the first few layers, given the computational resources and time constraints, without optimizing the whole network structure.
To overcome these limitations, our future research will first focus on considering both the algorithm’s performance improvement and time complexity, propose a new multi-objective hyperparameter optimization improvement algorithm, conduct a more comprehensive hyperparameter optimization for more complex network structures to demonstrate the algorithm’s superiority, and finally, carry out more extensive hyperparameter tuning of CNNs for other fields, such as speech recognition and natural language processing to demonstrate the algorithm’s generalization capability.

Author Contributions

Conceptualization, C.W.; methodology, T.S.; data curation, T.S.; supervision, C.W.; writing—original draft preparation, T.S. and D.H. All authors have read and agreed to the published version of the manuscript.

Funding

This work was supported by the National Natural Science Foundation of China (62072363) and the Natural Science Foundation of Shaanxi Province (S2019-JC-YB-1191).

Institutional Review Board Statement

Not applicable.

Informed Consent Statement

Not applicable.

Data Availability Statement

Not applicable.

Acknowledgments

The authors would like to thank Genqing Bian and Bilin Shao for all their support.

Conflicts of Interest

The authors declare no conflict of interest.

References

  1. Sarwinda, D.; Paradisa, R.H.; Bustamam, A.; Anggia, P. Deep learning in image classification using residual network (ResNet) variants for detection of colorectal cancer. Procedia Comput. Sci. 2021, 179, 423–431. [Google Scholar] [CrossRef]
  2. Sitaula, C.; Hossain, M.B. Attention-based VGG-16 model for COVID-19 chest X-ray image classification. Appl. Intell. 2021, 51, 2850–2863. [Google Scholar] [CrossRef]
  3. Kumar, P.; Bajpai, B.; Gupta, D.O.; Jain, D.C.; Vimal, S. Image recognition of COVID-19 using DarkCovidNet architecture based on convolutional neural network. World J. Eng. 2022, 19, 90–97. [Google Scholar] [CrossRef]
  4. Yang, C.H.; Qi, J.; Chen, S.Y.; Chen, P.Y.; Siniscalchi, S.M.; Ma, X.; Lee, C.H. Decentralizing feature extraction with quantum convolutional neural network for automatic speech recognition. In Proceedings of the ICASSP 2021-2021 IEEE International Conference on Acoustics, Speech and Signal Processing (ICASSP), Virtual, 6–11 June 2021; pp. 6523–6527. [Google Scholar]
  5. Alsabhan, W. Human–Computer Interaction with a Real-Time Speech Emotion Recognition with Ensembling Techniques 1D Convolution Neural Network and Attention. Sensors 2023, 23, 1386. [Google Scholar] [CrossRef]
  6. Azis, N.; Herwanto, H.; Ramadhani, F. Implementasi Speech Recognition Pada Aplikasi E-Prescribing Menggunakan Algoritme Convolutional Neural Network. J. Media Inform. Budidarma 2021, 5, 460–467. [Google Scholar] [CrossRef]
  7. Mao, K.; Xu, J.; Yao, X.; Qiu, J.; Chi, K.; Dai, G. A Text Classification Model via Multi-Level Semantic Features. Symmetry 2022, 14, 1938. [Google Scholar] [CrossRef]
  8. Mutinda, J.; Mwangi, W.; Okeyo, G. Sentiment Analysis of Text Reviews Using Lexicon-Enhanced Bert Embedding (LeBERT) Model with Convolutional Neural Network. Appl. Sci. 2023, 13, 1445. [Google Scholar] [CrossRef]
  9. Chotirat, S.; Meesad, P. Part-of-Speech tagging enhancement to natural language processing for Thai wh-question classification with deep learning. Heliyon 2021, 7, e08216. [Google Scholar] [CrossRef]
  10. Bergstra, J.; Bengio, Y. Random search for hyper-parameter optimization. J. Mach. Learn. Res. 2012, 13, 281–305. [Google Scholar]
  11. Akyol, S.; Alatas, B. Plant intelligence based metaheuristic optimization algorithms. Artif. Intell. Rev. 2017, 47, 417–462. [Google Scholar] [CrossRef]
  12. Yamasaki, T.; Honma, T.; Aizawa, K. Efficient optimization of convolutional neural networks using particle swarm optimization. In Proceedings of the 2017 IEEE Third International Conference on Multimedia Big Data (BigMM), Laguna Hills, CA, USA, 19–21 April 2017; pp. 70–73. [Google Scholar]
  13. Serizawa, T.; Fujita, H. Optimization of convolutional neural network using the linearly decreasing weight particle swarm optimization. arXiv 2020, arXiv:2001.05670. [Google Scholar]
  14. Guo, Y.; Li, J.Y.; Zhan, Z.H. Efficient hyperparameter optimization for convolution neural networks in deep learning: A distributed particle swarm optimization approach. Cybern. Syst. 2020, 52, 36–57. [Google Scholar] [CrossRef]
  15. Singh, P.; Chaudhury, S.; Panigrahi, B.K. Hybrid MPSO-CNN: Multi-level particle swarm optimized hyperparameters of convolutional neural network. Swarm Evol. Comput. 2021, 63, 100863. [Google Scholar] [CrossRef]
  16. Lee, S.; Kim, J.; Kang, H.; Kang, D.-Y.; Park, J. Genetic algorithm based deep learning neural network structure and hyperparameter optimization. Appl. Sci. 2021, 11, 744. [Google Scholar] [CrossRef]
  17. Mohakud, R.; Dash, R. Designing a grey wolf optimization based hyper-parameter optimized convolutional neural network classifier for skin cancer detection. J. King Saud Univ.-Comput. Inf. Sci. 2022, 34, 6280–6291. [Google Scholar] [CrossRef]
  18. Alzubaidi, L.; Zhang, J.; Humaidi, A.J.; Al-Dujaili, A.; Duan, Y.; Al-Shamma, O.; Santamaría, J.; Fadhel, M.A.; Al-Amidie, M.; Farhan, L. Review of deep learning: Concepts, CNN architectures, challenges, applications, future directions. J. Big Data 2021, 8, 1–74. [Google Scholar] [CrossRef]
  19. Lecun, Y.; Bottou, L.; Bengio, Y.; Haffner, P. Gradient-based learning applied to document recognition. Proc. IEEE 1998, 86, 2278–2324. [Google Scholar] [CrossRef] [Green Version]
  20. He, K.; Zhang, X.; Ren, S.; Sun, J. Deep residual learning for image recognition. In Proceedings of the IEEE Conference on Computer Vision and Pattern Recognition, Las Vegas, NV, USA, 26 June–1 July 2016; pp. 770–778. [Google Scholar]
  21. Eberhart, R.; Kennedy, J. A new optimizer using particle swarm theory. In Proceedings of the Sixth International Symposium on Micro Machine and Human Science, MHS’95, Nagoya, Japan, 4–6 October 1995; pp. 39–43. [Google Scholar]
  22. Dokeroglu, T.; Sevinc, E.; Kucukyilmaz, T.; Cosar, A. A survey on new generation metaheuristic algorithms. Comput. Ind. Eng. 2019, 137, 106040. [Google Scholar] [CrossRef]
  23. Ajibade, S.S.; Ogunbolu, M.O.; Chweya, R.; Fadipe, S. Improvement of Population Diversity of Meta-heuristics Algorithm Using Chaotic Map. In Proceedings of the International Conference of Reliable Information and Communication Technology, Casablanca, Morocco, 14–15 September 2022; Springer: Cham, Switzerland, 2022; pp. 95–104. [Google Scholar]
  24. Bingol, H.; Alatas, B. Chaos based optics inspired optimization algorithms as global solution search approach. Chaos Solitons Fractals 2020, 141, 110434. [Google Scholar] [CrossRef]
  25. Varol Altay, E.; Alatas, B. Bird swarm algorithms with chaotic mapping. Artif. Intell. Rev. 2020, 53, 1373–1414. [Google Scholar] [CrossRef]
  26. Yu, F.; Xu, X. A short-term load forecasting model of natural gas based on optimized genetic algorithm and improved BP neural network. Appl. Energy 2014, 134, 102–113. [Google Scholar] [CrossRef]
  27. Shao, S.; Peng, Y.; He, C.; Du, Y. Efficient path planning for UAV formation via comprehensively improved particle swarm optimization. ISA Trans. 2020, 97, 415–430. [Google Scholar] [CrossRef]
  28. Feng, H.; Ma, W.; Yin, C.; Cao, D. Trajectory control of electro-hydraulic position servo system using improved PSO-PID controller. Autom. Constr. 2021, 127, 103722. [Google Scholar] [CrossRef]
  29. Sarangi, A.; Samal, S.; Sarangi, S.K. Analysis of gaussian & cauchy mutations in modified particle swarm optimization algorithm. In Proceedings of the 2019 5th International Conference on Advanced Computing & Communication Systems (ICACCS), Coimbatore, India, 15–16 March 2019; pp. 463–467. [Google Scholar]
  30. Arora, S.; Singh, S. Butterfly optimization algorithm: A novel approach for global optimization. Soft Comput. 2019, 23, 715–734. [Google Scholar] [CrossRef]
  31. Mirjalili, S.; Lewis, A. The whale optimization algorithm. Adv. Eng. Softw. 2016, 95, 51–67. [Google Scholar] [CrossRef]
  32. Jain, M.; Singh, V.; Rani, A. A novel nature-inspired algorithm for optimization: Squirrel search algorithm. Swarm Evol. Comput. 2019, 44, 148–175. [Google Scholar] [CrossRef]
  33. Mirjalili, S.; Mirjalili, S.M.; Lewis, A. Grey wolf optimizer. Adv. Eng. Softw. 2014, 69, 46–61. [Google Scholar] [CrossRef] [Green Version]
  34. Derrac, J.; García, S.; Molina, D.; Herrera, F. A practical tutorial on the use of nonparametric statistical tests as a methodology for comparing evolutionary and swarm intelligence algorithms. Swarm Evol. Comput. 2011, 1, 3–18. [Google Scholar] [CrossRef]
  35. Krizhevsky, A.; Hinton, G. Learning Multiple Layers of Features from Tiny Images. 2009. Available online: http://citeseerx.ist.psu.edu/viewdoc/download?doi=10.1.1.222.9220&rep=rep1&type=pdf (accessed on 10 September 2020).
  36. Wang, Y.; Zhang, H.; Zhang, G. cPSO-CNN: An efficient PSO-based algorithm for fine-tuning hyper-parameters of convolutional neural networks. Swarm Evol. Comput. 2019, 49, 114–123. [Google Scholar] [CrossRef]
Figure 1. LeNet-5 structure diagram.
Applsci 13 04254 g001
Figure 2. ResNet-18 structure diagram.
Applsci 13 04254 g002
Figure 3. The improved inertia weight curve.
Applsci 13 04254 g003
Figure 4. Flowchart of ADGMPSO.
Applsci 13 04254 g004
Figure 5. The convergence curves of the 10 test functions.
Applsci 13 04254 g005aApplsci 13 04254 g005b
Figure 6. The optimized hyperparameters of LeNet-5.
Applsci 13 04254 g006
Figure 7. Accuracy comparison of the MNIST datasets.
Applsci 13 04254 g007
Figure 8. LeNet-5 average loss curve.
Applsci 13 04254 g008
Figure 9. The optimized hyperparameters of ResNet-18.
Applsci 13 04254 g009
Figure 10. Accuracy comparison of the CIFAR-10 datasets.
Applsci 13 04254 g010
Figure 11. ResNet-18 average loss curve.
Applsci 13 04254 g011
Table 1. Advantages and disadvantages of the hyperparametric optimization algorithms.
AlgorithmAdvantagesDisadvantages
Grid search methodSimple and easy to implement, suitable for the case of a small number of hyperparameters.Non-automatic tuning, requires knowledge, not suitable for a large hyperparameter search.
Random search methodSimple and easy to implement, can avoid getting trapped in a local optimal solution.Non-automatic tuning, requires relevant knowledge, effect depends on the distribution of samples, there is a duplicate search problem.
PSO-CNNAutomatic tuning, the first introduction of PSO for a hyperparameter search.Hyperparameter optimization is a complex problem in optimization with multiple local optima. It is essential to note the challenges that metaheuristic algorithms face in dealing with complex optimization problems. Metaheuristic algorithms are prone to falling into local optima, which can lead to a low solution accuracy.
LDWPSO-CNNAutomatic tuning, introducing a linear decreasing inertia weighting strategy, balancing the global and local search ability of the algorithm.
DPSO-CNNAuto-tuning, incorporating distributed technology, reduces the algorithm runtime.
MPSO-CNNAuto-tuning, combined with the idea of hierarchy.
GA-CNNAutomatic optimization, incorporating GA for hyperparameter tuning.
GWO-CNNAutomatic optimization search, incorporating GWO for CNN hyperparameter tuning, better than GA.
Table 2. Benchmark test functions.
Func.NameSearch RangeOptimal ValueDim.
f 1 Sphere[−100, 100]030
f 2 Schwefel 2.22[−10, 10]030
f 3 Schwefel 1.2[−100, 100]030
f 4 Step[−100, 100]030
f 5 Schwefel 2.21[−100, 100]030
f 6 Quartic[−1.28, 1.28]030
f 7 Rastrigin[−5.12, 5.12]030
f 8 Ackley[−32, 32]030
f 9 Griewank[−600, 600]030
f 10 Penalized[−50, 50]030
Table 3. Benchmark function running environment table.
Running EnvironmentDetails
Operating SystemWindows 10
CPUI5 9300H CPU@2.40 GHz
RAM16 GB DDR4 RAM
SoftwareMATLAB2016a
Table 4. Parameter settings for the different algorithms.
AlgorithmParameter
PSO ω = 0.9, c 1 = c 2 = 2
BOA C = 0.01, P = 0.8, α increases linearly from 0.1 to 0.3
WOA r 1 , r 2 [0, 1], α decreases linearly from 2 to 0
SSA P dp = 0.1 , G c   = 1.9, sf = 18
GWO r 1 , r 2 [0, 1], α decreases linearly from 2 to 0
ADGMPSO ω m a x = 0.9, ω m i n = 0.2, c m a x = 2, c m i n = 1, γ m i n = 0.2, γ m a x = 1 , γ decreases linearly from 1 to 0.2
Table 5. Test function experiment results.
Func.MeasurePSOBOAWOASSAGWOADGMPSO
f 1 Best2.42 × 10−14.12 × 10−1302.67 × 10−103.60 × 10−1400
Average4.34 × 10−17.02 × 10−1301.78 × 10−61.95 × 10−1370
STD1.41 × 10−11.73 × 10−1303.41 × 10−64.31 × 10−1370
f 2 Best2.94 × 10−14.49 × 10−398.31 × 10−2328.69 × 10−68.76 × 10−800
Average4.71 × 10−12.24 × 10−134.50 × 10−2207.12 × 10−41.41 × 10−780
STD1.47 × 10−19.96 × 10−1306.59 × 10−41.57 × 10−780
f 3 Best2.25 × 1014.97 × 10−131.08 × 1021.03 × 10−62.01 × 10−460
Average4.93 × 1017.61 × 10−132.11 × 1039.00 × 10−43.30 × 10−380
STD1.70 × 1011.53 × 10−131.72 × 1032.07 × 10−31.51 × 10−370
f 4 Best2.02 × 10−13.593.63 × 10−43.93 × 10−91.01 × 10−99.24 × 10⁻³²
Average5.92 × 10−14.676.96 × 10−44.34 × 10−63.22 × 10−14.01 × 10⁻²⁷
STD1.89 × 10−16.28 × 10−12.96 × 10−46.39 × 10−62.77 × 10−11.31 × 10⁻²⁶
f 5 Best7.57 × 10−11.19 × 10−91.63 × 10−72.04 × 10−51.49 × 10−379.97 × 10−290
Average1.671.40 × 10−91.48 × 1011.75 × 10−41.90 × 10−351.35 × 10−247
STD6.85 × 10−11.56 × 10−101.89 × 1011.12 × 10−43.07 × 10−350
f 6 Best7.10 × 10−31.44 × 10−42.09 × 10−57.98 × 10−55.42 × 10−53.19 × 10⁻⁶
Average1.54 × 10−14.44 × 10−48.19 × 10−43.49 × 10−43.04 × 10−41.76 × 10⁻⁴
STD5.96 × 10−32.50 × 10−41.04 × 10−32.75 × 10−41.81 × 10−42.35 × 10⁻⁴
f 7 Best1.61 × 101001.53 × 10−1200
Average2.57 × 101006.09 × 10−700
STD8.33001.26 × 10−600
f 8 Best1.36 × 10−14.37 × 10−158.88 × 10−161.75 × 10−64.44 × 10−158.88 × 10⁻¹⁶
Average1.675.07 × 10−103.93 × 10−153.43 × 10−47.99 × 10−158.88 × 10⁻¹⁶
STD7.36 × 10−11.58 × 10−102.72 × 10−153.21 × 10−41.76 × 10−150
f 9 Best4.13 × 10−1001.41 × 10−1300
Average5.58 × 10−1003.23 × 10−600
STD1.05 × 10−1005.21 × 10−600
f 10 Best2.16 × 10−11.37 × 10−14.92 × 10−57.29 × 10−121.98 × 10−31.29 × 10−32
Average2.244.30 × 10−14.44 × 10−48.54 × 10−92.49 × 10−28.48 × 10−32
STD1.511.30 × 10−11.36 × 10−31.04 × 10−81.00 × 10−22.67 × 10−29
Table 6. Wilcoxon rank sum test results.
Func.ADGMPSO-PSOADGMPSO-BOAADGMPSO-WOAADGMPSO-GWOADGMPSO-SSA
PRPRPRPRPR
f 1 8.01 × 10⁻⁹+8.01 × 10⁻⁹+NaN=1.37 × 10⁻⁸+8.01 × 10⁻⁹+
f 2 8.01 × 10⁻⁹+1.04 × 10⁻⁸+8.01 × 10⁻⁹+8.01 × 10⁻⁹+8.01 × 10⁻⁹+
f 3 8.01 × 10⁻⁹+8.01 × 10⁻⁹+8.01 × 10⁻⁹+8.01 × 10⁻⁹+7.99 × 10⁻⁹+
f 4 6.79 × 10⁻⁸+6.79 × 10⁻⁸+6.75 × 10⁻⁸+6.77 × 10⁻⁸+6.78 × 10⁻⁸+
f 5 6.80 × 10⁻⁸+6.80 × 10⁻⁸+6.80 × 10⁻⁸+6.80 × 10⁻⁸+6.79 × 10⁻⁸+
f 6 6.79 × 10⁻⁸+1.61 × 10⁻⁴+7.58 × 10⁻⁴+2.6 × 10⁻³+3.6 × 10⁻³+
f 7 8.01 × 10⁻⁹+NaN=NaN=NaN=8.01 × 10⁻⁹+
f 8 8.01 × 10⁻⁹+7.95 × 10⁻⁹+2.32 × 10⁻⁵+1.56 × 10⁻⁹+7.99 × 10⁻⁹+
f 9 8.01 × 10⁻⁹+NaN=3.42 × 10⁻¹-NaN=7.83 × 10⁻⁹+
f 10 6.80 × 10⁻⁸+6.80 × 10⁻⁸+6.80 × 10⁻⁸+6.79 × 10⁻⁸+6.76 × 10⁻⁸+
+/=/−10/0/08/2/07/2/18/2/010/0/0
Table 7. Experimental comparison of the different improvement strategies.
Func.MeasurePSOPSO1PSO2PSO3ADGMPSO
f 1 Best2.72 × 10−11.83 × 10−18.76 × 10−5700
Average3.51 × 10−12.12 × 10−13.80 × 10−3900
STD2.71 × 10−11.33 × 10−11.66 × 10−3800
f 2 Best3.11 × 10−12.98 × 10−11.08 × 10−71.89 × 10−2300
Average4.36 × 10−13.44 × 10−15.81 × 10−43.42 × 10−2210
STD5.51 × 10−17.12 × 10−11.93 × 10−34.21 × 10−2500
f 3 Best1.92 × 1012.01 × 1013.53 × 10−32.33 × 10−3150
Average5.01 × 1013.22 × 1012.66 × 10−14.02 × 10−2710
STD2.11 × 1017.446.43 × 10−13.06 × 10−2810
f 4 Best1.92 × 10−18.59 × 10−21.65 × 10−303.237.72 × 10−33
Average2.89 × 10−11.03 × 10−18.94 × 10−255.243.42 × 10−27
STD1.68 × 10−15.21 × 10−22.78 × 10−264.311.41 × 10−28
f 5 Best6.29 × 10−11.33 × 10−11.46 × 10−41.74 × 10−1593.51 × 10−293
Average1.513.71 × 10−13.66 × 10−31.71 × 10−1368.92 × 10−246
STD2.81 × 10−11.39 × 10−16.24 × 10−31.99 × 10−1460
f 6 Best6.21 × 10−32.24 × 10−31.99 × 10−31.63 × 10−34.22 × 10−6
Average5.21 × 10−12.41 × 10−24.89 × 10−31.49 × 10−21.63 × 10−4
STD5.36 × 10−39.51 × 10−41.51 × 10−32.65 × 10−22.44 × 10−4
f 7 Best2.31 × 1018.331.30 × 10100
Average3.01 × 1011.21 × 1012.19 × 10100
STD8.666.21 × 10−14.7700
f 8 Best1.44 × 10−12.82 × 10−18.61 × 10−148.88 × 10−168.88 × 10⁻¹⁶
Average1.316.36 × 10−11.14 × 10−128.88 × 10−168.88 × 10⁻¹⁶
STD6.12 × 10−13.28 × 10−12.93 × 10−1200
f 9 Best3.86 × 10−18.10 × 10−11.11 × 10−1600
Average6.12 × 10−11.596.76 × 10−300
STD1.45 × 10−15.30 × 10−11.01 × 10−200
f 10 Best2.71 × 10−11.25 × 10−19.56 × 10−52.79 × 10−301.56 × 10⁻³²
Average1.924.29 × 10−17.22 × 10−48.33 × 10−276.09 × 10⁻³²
STD1.356.24 × 10−16.32 × 10−48.14 × 10−291.22 × 10⁻³⁰
Table 8. LeNet-5 to be optimized for the hyperparameters.
DimensionHyperparametersSearch Range
x 1 Number of first layer convolution kernels[1–128]
x 2 Size of first layer convolution kernels[3 × 3, 5 × 5, 7 × 7]
x 3 Type of first layer activation function[Sigmod, ReLu, Tanh]
x 4 Type of second pooling layer[max. pooling, avg. pooling]
x 5 Number of third layer convolution kernels[1–128]
x 6 Size of third layer convolution kernels [3 × 3, 5 × 5, 7 × 7]
x 7 Type of third layer activation function[Sigmod, ReLu, Tanh]
x 8 Type of fourth pooling layer[max. pooling, avg. pooling]
x 9 Number of neurons in the fifth layer[1–128]
x 10 Type of fifth layer activation function[Sigmod, ReLu, Tanh]
x 11 Number of neurons in the sixth layer[1–128]
x 12 Type of sixth layer activation function[Sigmod, ReLu, Tanh]
Table 9. ResNet-18 to be optimized for the hyperparameters.
DimensionHyperparametersSearch Range
x 1 Number of first layer convolution kernels[1–128]
x 2 Size of first layer convolution kernels [3 × 3, 5 × 5, 7 × 7]
x 3 First layer convolution kernel step[1–2]
x 4 First layer convolutional layer filling type[valid, same]
x 5 Type of second pooling layer[max. pooling, avg. pooling]
x 6 Size of third layer convolution kernels [3 × 3, 5 × 5, 7 × 7]
x 7 Second pooling layer step[1–2]
x 8 Second layer filling type[valid, same]
Table 10. Algorithm parameter settings.
AlgorithmParameter
PSO-CNNω = 0.9, c1 = c2 = 2
LDWPSO-CNNω decreases linearly from 0.9 to 0.4, c1 = c2 = 2
GA-CNNMutation possibility rate = 0.1, crossover probability = 0.9
ADGMPSO-CNNωmax = 0.9, ωmin = 0.2, cmax = 2, cmin = 1, γmin = 0.2, γmax = 1, γ Decreases linearly from 1 to 0.2
Table 11. Hyperparameter optimization experiment running environment.
Running EnvironmentDetails
Operating SystemUbuntu 18.04.5
CPUIntel(R) Xeon(R) Gold 5218 CPU@2.30 GHz
RAM32 GB DDR4 RAM
SoftwarePython 3.8.5, Pytorch 1.12
GPUNVIDIA Tesla T4
Disclaimer/Publisher’s Note: The statements, opinions and data contained in all publications are solely those of the individual author(s) and contributor(s) and not of MDPI and/or the editor(s). MDPI and/or the editor(s) disclaim responsibility for any injury to people or property resulting from any ideas, methods, instructions or products referred to in the content.

