
Trait Energy and Fatigue Influence Inter-Individual Mood and Neurocognitive Responses during Work Done While Sitting, Standing, and Intermittent Walking: A Randomized-Controlled Crossover Design
 , , and
Abstract
:1. Introduction
2. Methods
2.1. Study Design
2.2. Screening
2.3. Participants
2.4. Baseline Measures
2.5. Testing Day Measures
- (1)
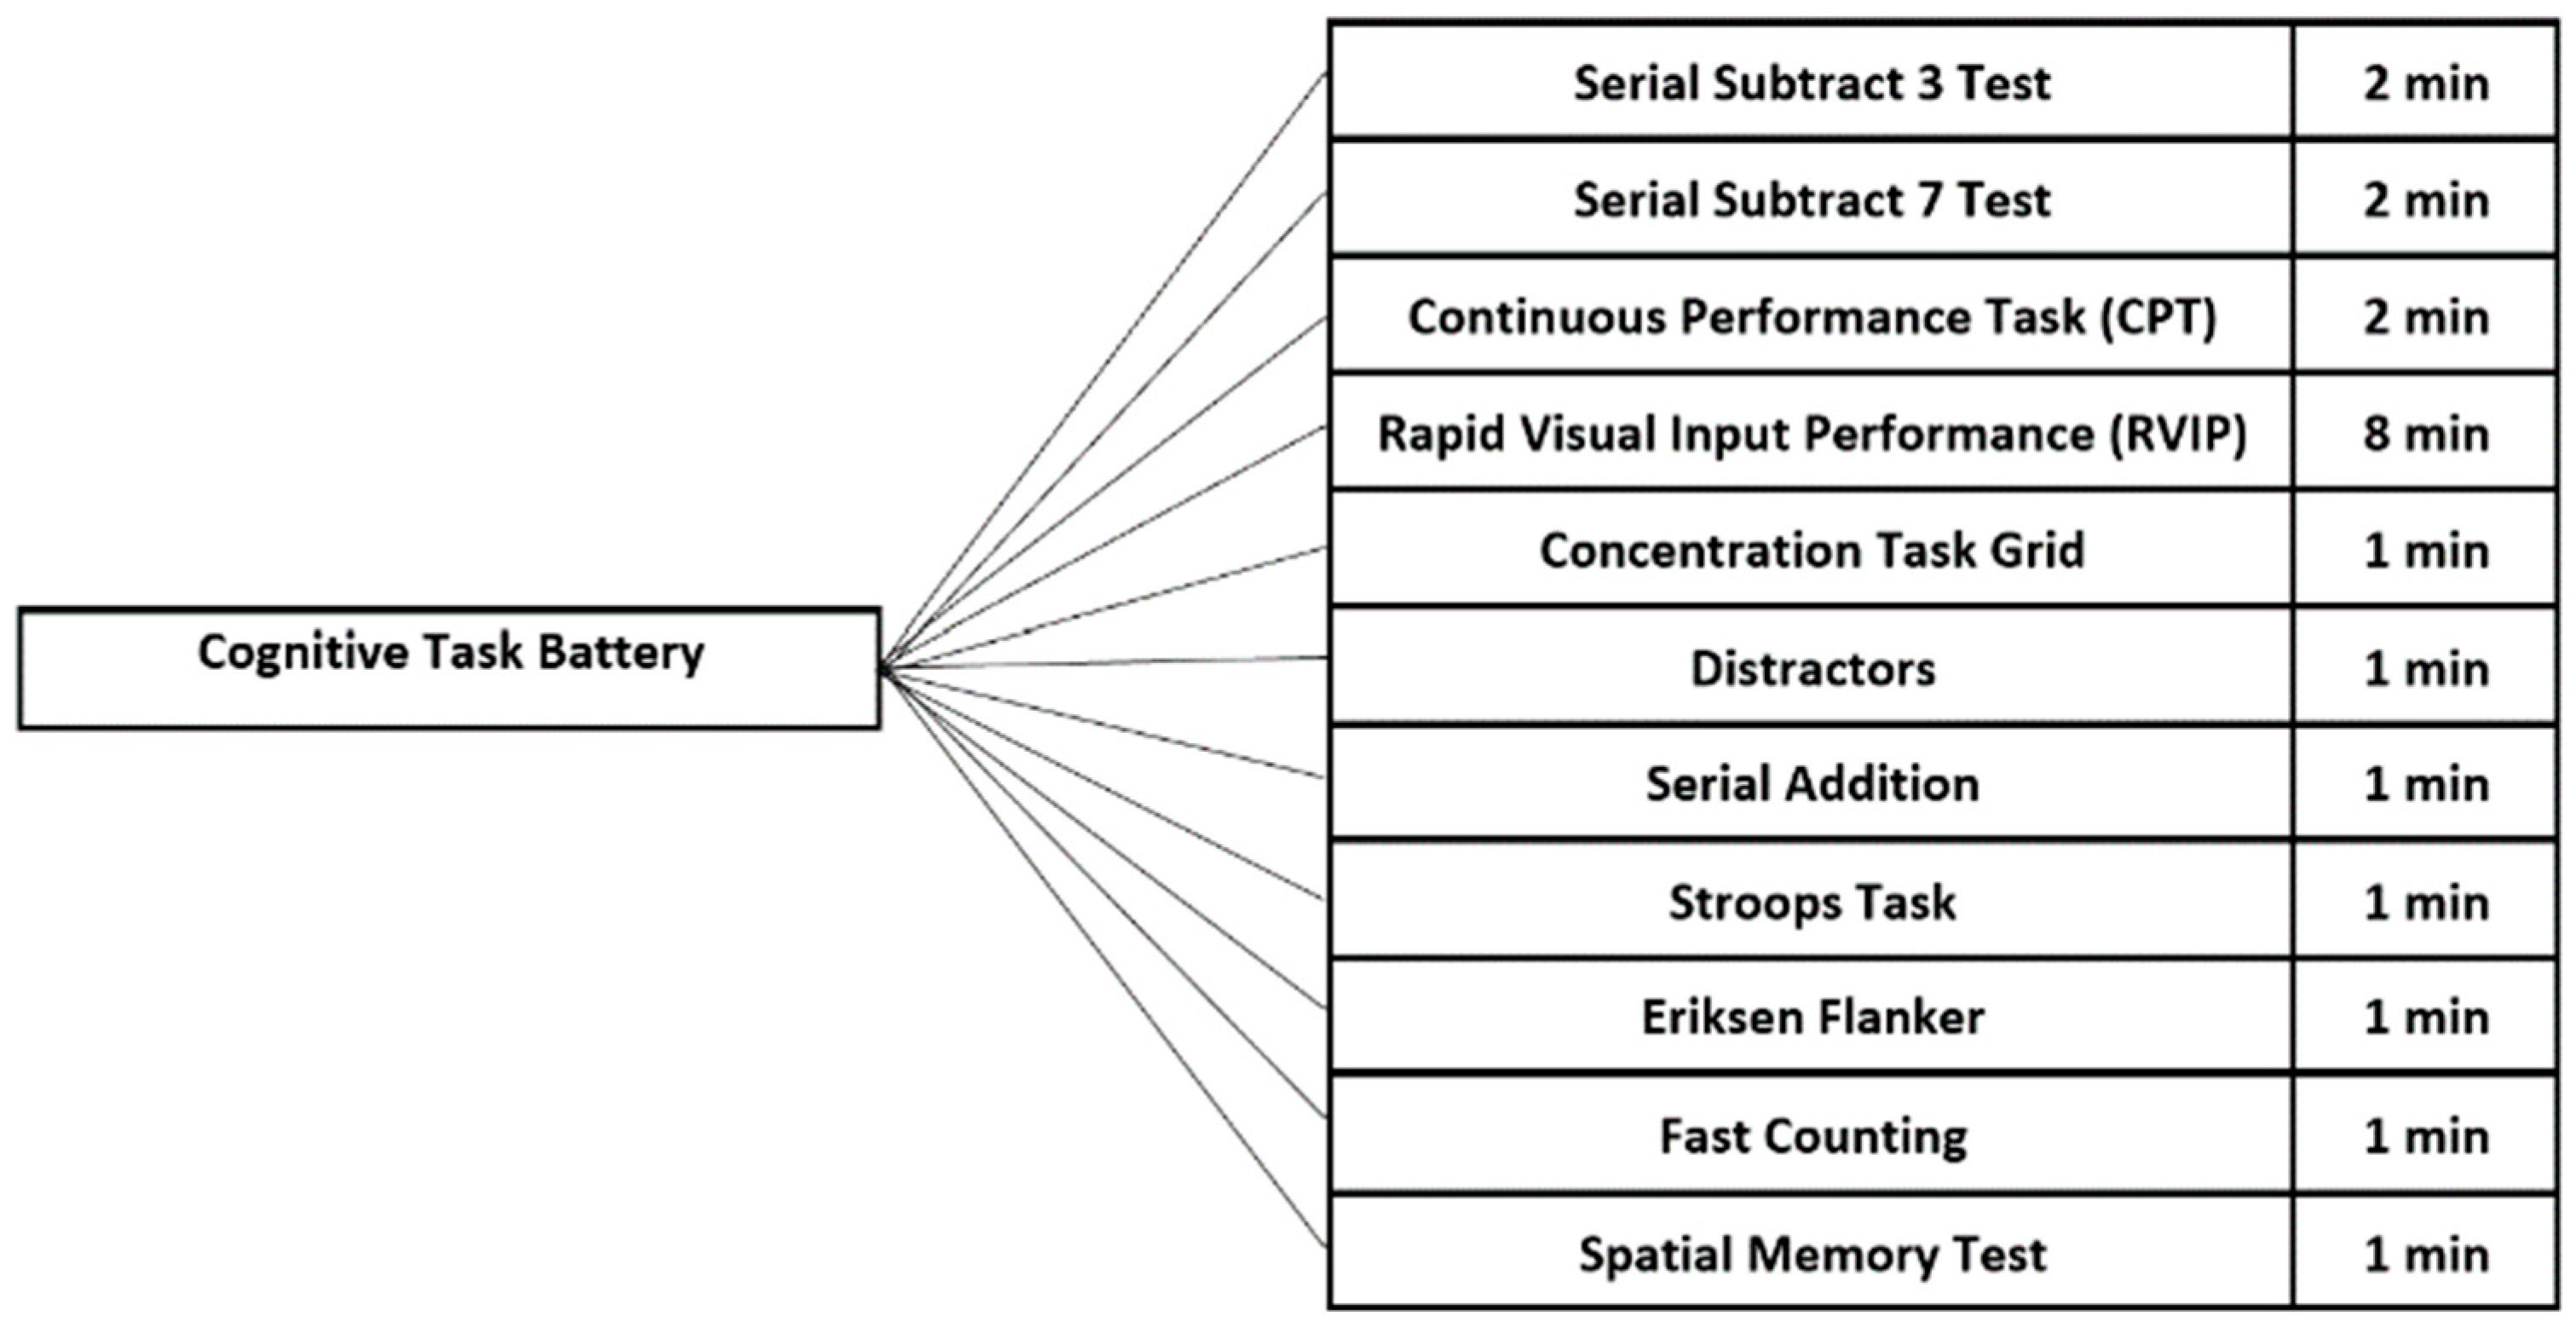
- Serial Subtraction 3 and 7 task—Participants were asked to silently subtract backwards in threes or sevens from a random number starting between 800 and 999 that was presented on the iPad screen (Tahoma Regular fond; size 20). Participants were instructed to type their answers as quickly and as accurately as possible. After each answer was submitted by the participant, the answer was cleared from the screen and participants continued to subtract three or seven from their previous answer. Participants were allowed to complete as many attempts as possible in two minutes. In the case of incorrect responses, subsequent responses were scored as correct if they were correct in relation to the new number. The tasks were scored for the number of correct responses, the number of total attempts, and the percentage of correct responses (correct responses/total responses X 100) [11,45,46].
- (2)
- Continuous Performance Task (CPT)—Participants monitored a continuous series of letters (A–Z; Tahoma Regular font, size 20 point) presented on the screen for 1000 ms and were asked to respond to the detection of the letter “X” only when preceded by the letter “A” by tapping on the screen or pressing the “Space” key. The participants used the same modality for all tests over the course of the study. A total of 48 correct targets were randomly presented over the course of two minutes, and the task was scored for the percentage of target strings correctly detected, errors of omission (missed targets), false alarms (key pressed/screen tapped when no target presented), and the average reaction time for correct decisions [10,11,45,46].
- (3)
- Rapid-Visual Input Processing Task (RVIP)—Participants were required to monitor a continuous series of digits (1–9; Tahoma Regular font, size 20 point) presented on the screen every 1000 ms. The participants were given a primary, secondary, and tertiary task. The participant’s primary task was to detect the presentation of three consecutive odd digits that were in ascending order (e.g., 3–7–9), the secondary task was to detect three consecutive even digits that were in ascending order (e.g., 2–4–8), and the tertiary task was to identify the number 6 when it was presented on the screen. The participants were given the option of using the keyboard or the touch screen on the iPad and participants used the same modality over the course of the study. If participants chose to use the touch screen, they were asked to press the green button for the primary task, the red button for the secondary task, and the yellow button for the tertiary task. If participants chose to use the keyboard, they were asked to press the left arrow for the primary, the right arrow for the secondary, and the up arrow for the tertiary task. Of the 480 stimuli presented, there were 8 primary targets, 8 secondary targets, and 48 tertiary targets over the course of the 8 min protocol. The task was scored for the number of correct detections of each target, average reaction time for correct detection of each target, the number of false alarms for each task, and errors of omission (missed targets) [10,11,45,46].
- (4)
- Concentration Task Grid (CGT)—A 100 square grid was used as a measure of concentration. The grid is arranged in a 10 × 10 square with each square containing a two-digit number (from 00 to 99) which is randomly placed in the center of each of the squares. Participants were asked to mark off as many consecutive numbers as possible starting from 00 within a one-minute period, by tapping on the desired square [47].
- (5)
- Distractors—Participants were presented target arrows, in either red or green, every 1000 ms. Prior to the start of each test, participants were informed whether the color of the target for the test was red or green. Participants were asked to press the direction of the arrow presented on the screen only if it was a target. For example, If the target was red and the arrow presented on the screen was red, then participants pressed the arrow on the keyboard that corresponded with the direction of the arrow presented on the screen [48]. A total of 12 distractors were presented during each one-minute test and participants were scored for correct responses, incorrect responses, and average response time for each correct response.
- (6)
- Paced Visual Serial Addition Task (PVSAT)—Participants were asked to start at the number 0 and add the digit shown on the screen (0–9). Participants were then asked to remember the previous number and add the next digit presented on the screen and type their responses on the keypad [49]. After each entry, a new digit was presented. Participants were given one minute to add as many digits as possible. In the case of incorrect responses, subsequent responses were scored as correct if they were correct in relation to the new number. Participants were scored for the number of correct responses and the average time it took to complete each correct response.
- (7)
- Stroop Task—Participants were presented words (Tahoma font, 20 point), every 1000 ms, on a screen spelling the names of colors (i.e., blue, yellow, red, green), which were either congruent (words presented in the same color as the color they were spelling out, such as the RED presented in red font) or incongruent (words presented in a color different from the color that they spelled out, such as the word RED spelled in green font). Participants were presented with all five options of colors used in this test (red, green, yellow, black, and blue) and asked to press the color of the text (font color) and not the word presented on the screen. There were 30 congruent and 30 incongruent tasks presented in random order and participants were scored on the number of correct responses, number of incorrect responses, and the average reaction time for correct responses. Each test was scored separately for both congruent and incongruent tasks [50,51].
- (8)
- Eriksen Flanker Task—During this task, participants were first presented with a white fixation cross for 200 ms, followed immediately by five equally sized arrows arranged in a 10.5 cm horizontal array for 800 ms. Participants were instructed to attend to the central arrow and ignore the four flankers. Participants were asked to press the left key if the central arrow was facing left and the right arrow if the central arrow was pointed to the right. If all arrows were pointing the same direction (e.g., “< < < < <”), then the trial was considered congruent. However, if the central arrow was pointing in the opposite direction (e.g., “> > < > >”) then the trial was considered incongruent. Subjects were presented with 30 congruent and 30 incongruent trials in random order. The tests were scored on the number of correct responses, number of incorrect responses, and the average reaction time for correct responses. Each test was scored separately for both congruent and incongruent tasks [52].
- (9)
- Perceptual (Fast Count) Task—Participants were asked to press the number key that qualified with the number of dots presented on the screen. Each dot was approximately 0.5 cm in diameter and the number of dots on the screen ranged from 4 to 7. The number of dots was randomized across each trial and trials lasted 1 min. Participants were scored based on number of correct responses, average reaction time for each correct response and the total number of trials conducted in one minute [53].
- (10)
- Modified Corsi-Block and Visuo-Spatial Memory Task—A pilot test using a combination of the Corsi-Block test and a Visuo-Spatial Memory task was designed to test participants’ visuo-spatial memory. Participants were presented a 3 × 3 square grid on the screen, where a dot was flashed in each of the grids in a randomized order and in a randomized location (i.e., middle of the top right square in the grid, bottom left corner of the top right square in the grid). The dot remained on the screen for 500 ms before the next dot appeared. After the entire grid had dots present and the last dot had remained on the screen for 500 ms, the dots were removed, and the participants were asked to identify the order in which the dots appeared on the screen and the location where they appeared. Each participant completed 10 trials. Due to poor test–retest reliability, this test was not included in the results of this study.
2.6. Mood and Motivation Surveys
- (1)
- (2)
- Profile of Mood Survey Short Form (POMS-SF): The 30-item Profile of Mood Survey Short Form was used to assess current mood states on a five-point scale ranging from “Not at all” (scored as 0) to “Extremely (scored as 4). Depression, tension/anxiety, anger, fatigue, and vigor (energy) were scored as a sum of five variables (i.e., vigor (energy) = energetic + lively + full of pep + vigorous + active) with scores ranging from 0 to 20. Confusion was the sum of four variables and then, the variable efficient was subtracted from it (i.e., confusion = confused + muddled + bewildered + forgetful – efficient), with scores ranging from −4 to 16. A total mood disturbance score was also calculated by adding depression, tension, anger, fatigue, and confusion and subtracting vigor (energy) from the total score. Among healthy adults, the Cronbach’s alpha is reported to be 0.90 [54]. For the current study, the Cronbach’s alpha ranged from 0.69 to 0.81 (Tension/Anxiety = 0.781, Depression = 0.766, Anger = 0.777, Fatigued = 0.808, Vigor = 0.767, Confused = 0.690).
- (3)
- State Mental and Physical Energy and Fatigue: Using the third section of the State and Trait Mental and Physical Energy and Fatigue survey [41], current state moods of mental and physical energy and fatigue were assessed using a 12-item VAS, with each state outcome containing three items. Each item was anchored by “No feeling at all” to “The highest imaginable feeling”. The Cronbach’s alpha for these moods range from 0.88 to 0.90 [24,25,26,30,42]. For the current study, the Cronbach’s alpha ranged from 0.91 to 0.96 (state physical energy = 0.940, state physical fatigue = 0.909, state mental energy = 0.959, state mental fatigue = 0.943).
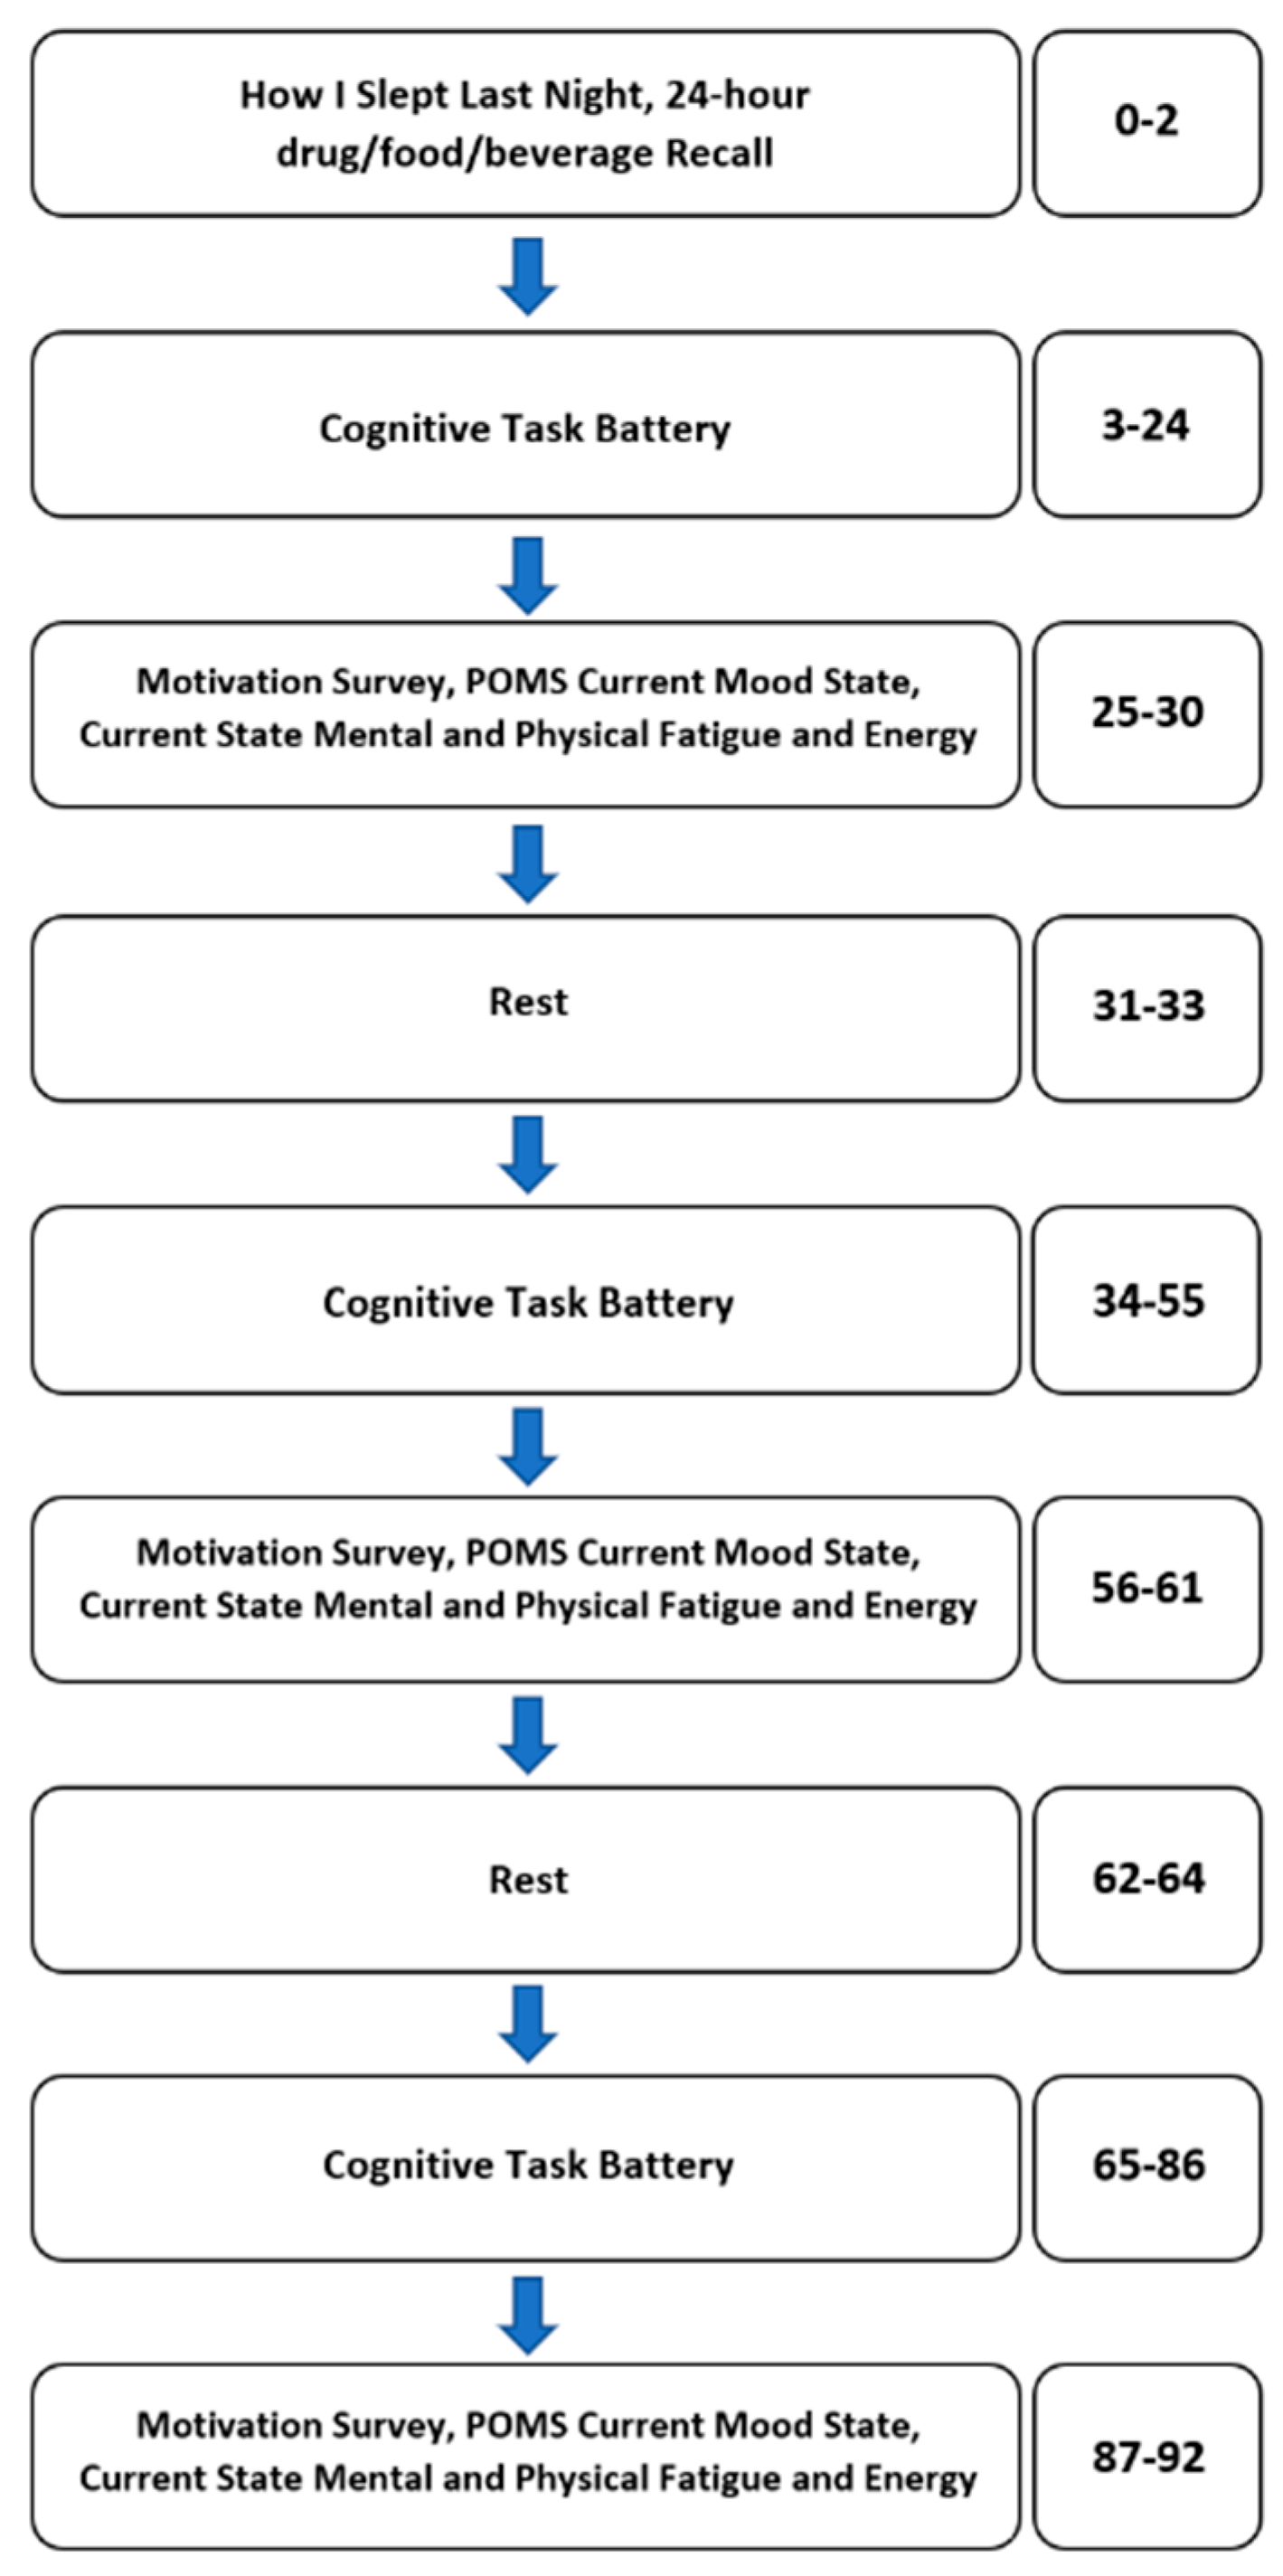
2.7. Procedure
2.8. Statistical Analyses
3. Results
4. Discussion
Practical Implications
5. Conclusions
Supplementary Materials
Author Contributions
Funding
Institutional Review Board Statement
Informed Consent Statement
Data Availability Statement
Conflicts of Interest
References
- Milojevich, H.M.; Lukowski, A.F. Sleep and mental health in undergraduate students with generally healthy sleep habits. PLoS ONE 2016, 11, e0156372. [Google Scholar] [CrossRef] [PubMed]
- Blanco, C.; Okuda, M.; Wright, C.; Hasin, D.S.; Grant, B.F.; Liu, S.M.; Olfson, M. Mental health of college students and their non–college-attending peers: Results from the national epidemiologic study on alcohol and related conditions. Arch. Gen. Psychiatry 2008, 65, 1429–1437. [Google Scholar] [CrossRef] [PubMed] [Green Version]
- Sheldon, E.; Simmonds-Buckley, M.; Bone, C.; Mascarenhas, T.; Chan, N.; Wincott, M.; Gleeson, H.; Sow, K.; Hind, D.; Barkham, M. Prevalence and risk factors for mental health problems in university undergraduate students: A systematic review with meta-analysis. J. Affect. Disord. 2021, 287, 282–292. [Google Scholar] [CrossRef] [PubMed]
- de Oliveira, J.M.D.; Butini, L.; Pauletto, P.; Lehmkuhl, K.M.; Stefani, C.M.; Bolan, M.; Guerra, E.; Dick, B.; Canto, G.D.L.; Massignan, C. Mental health effects prevalence in children and adolescents during the COVID-19 pandemic: A systematic review. Worldviews Evidence-Based Nurs. 2022, 19, 130–137. [Google Scholar] [CrossRef]
- Ma, L.; Mazidi, M.; Li, K.; Li, Y.; Chen, S.; Kirwan, R.; Zhou, H.; Yan, N.; Rahman, A.; Wang, W.; et al. Prevalence of mental health problems among children and adolescents during the COVID-19 pandemic: A systematic review and meta-analysis. J. Affect. Disord. 2021, 293, 78–89. [Google Scholar] [CrossRef]
- Roberts, R.; Golding, J.; Towell, T.; Weinreb, I. The effects of economic circumstances on British students’ mental and physical health. J. Am. Coll. Health 1999, 48, 103–109. [Google Scholar] [CrossRef]
- Chrikov, I.; Soria, K.M.; Horgos, B.; Jones-White, D. Undergraduate and Graduate Students’ Mental Health during the COVID-19 Pandemic; SERU Consortium, University of California Berkley and University of Minnesota, 2020. [Google Scholar]
- Castillo-Montoya, M. Professors’ pedagogical strategies for teaching through diversity. Rev. High Educ. 2019, 42, 199–226. [Google Scholar] [CrossRef]
- Kumar, N.; Wheaton, L.A.; Snow, T.K.; Millard-Stafford, M. Exercise and caffeine improve sustained attention following fatigue independent of fitness status. Fatigue Biomed. Health Behav. 2015, 3, 104–121. [Google Scholar] [CrossRef]
- Boolani, A.; Lindheimer, J.B.; Loy, B.D.; Crozier, S.; O’Connor, P.J. Acute effects of brewed cocoa consumption on attention, motivation to perform cognitive work and feelings of anxiety, energy and fatigue: A randomized, placebo-controlled crossover experiment. BMC Nutr. 2017, 3, 8. [Google Scholar] [CrossRef] [Green Version]
- Boolani, A.; Fuller, D.T.; Mondal, S.; Wilkinson, T.; Darie, C.C.; Gumpricht, E. Caffeine-Containing, Adaptogenic-Rich Drink Modulates the Effects of Caffeine on Mental Performance and Cognitive Parameters: A Double-Blinded, Placebo-Controlled, Randomized Trial. Nutrients 2020, 12, 1922. [Google Scholar] [CrossRef]
- Hutak, J.L.; Boolani, A.; Byerley, L.O. Energy drink usage by students attending an online university. J. Am. Coll. Health 2022, 1–9. [Google Scholar] [CrossRef]
- Mahoney, C.R.; Giles, G.E.; Marriott, B.P.; Judelson, D.A.; Glickman, E.L.; Geiselman, P.J.; Lieberman, H.R. Intake of caffeine from all sources and reasons for use by college students. Clin. Nutr. 2019, 38, 668–675. [Google Scholar] [CrossRef] [Green Version]
- MacEwen, B.T.; MacDonald, D.J.; Burr, J.F. A systematic review of standing and treadmill desks in the workplace. Prev. Med. 2015, 70, 50–58. [Google Scholar] [CrossRef]
- Merriman, W.; González-Toro, C.M.; Cherubini, J. Physical activity in the classroom. Kappa Delta Pi. Rec. 2020, 56, 164–169. [Google Scholar] [CrossRef]
- Loy, B.D.; O’Connor, P.J.; Dishman, R.K. The effect of a single bout of exercise on energy and fatigue states: A systematic review and meta-analysis. Fatigue Biomed. Health Behav. 2013, 1, 223–242. [Google Scholar] [CrossRef]
- Ensari, I.; Greenlee, T.A.; Motl, R.W.; Petruzzello, S.J. Meta-analysis of acute exercise effects on state anxiety: An update of randomized controlled trials over the past 25 years. Depress Anxiety 2015, 32, 624–634. [Google Scholar] [CrossRef]
- Bourke, M.; Patten, R.K.; Klamert, L.; Klepac, B.; Dash, S.; Pascoe, M.C. The acute affective response to physical activity in people with depression: A meta-analysis. J. Affect. Disord. 2022, 311, 353–363. [Google Scholar] [CrossRef]
- Chang, Y.K.; Labban, J.D.; Gapin, J.I.; Etnier, J.L. The effects of acute exercise on cognitive performance: A meta-analysis. Brain Res. 2012, 1453, 87–101. [Google Scholar] [CrossRef] [Green Version]
- Carmichael, K.E.; O’Connor, P.J.; Gay, J.L. Stair walking effects on feelings of energy and fatigue: Is 4-min enough for benefits? Front. Psychol. 2022, 13, 895446. [Google Scholar] [CrossRef]
- Boolani, A.; Sur, S.; Yang, D.; Avolio, A.; Goodwin, A.; Mondal, S.; Fulk, G.; Towler, C.; Smith, M.L. Six Minutes of Physical Activity Improves Mood in Older Adults: A Pilot Study. J. Geriatr. Phys. Ther. 2021, 44, 18–24. [Google Scholar] [CrossRef]
- Barrios, N.; Sames, C.; Allen, A.; Vieira, E.R.; Boolani, A. Intensity of Aquatic Physical Activity Is Best When Tailored to the Participants’ Mental and Physical Capabilities: An Exploratory Study. J. Aquat. Phys. Ther. 2022, 30, 30–36. [Google Scholar] [CrossRef]
- Ward-Ritacco, C.L.; Adrian, A.L.; O’Connor, P.J.; Binkowski, J.A.; Rogers, L.Q.; Johnson, M.A.; Evans, E.M. Feelings of energy are associated with physical activity and sleep quality, but not adiposity, in middle-aged postmenopausal women. Menopause 2015, 22, 304–311. [Google Scholar] [CrossRef] [PubMed]
- Fuller, D.T.; Smith, M.L.; Boolani, A. Trait Energy and Fatigue Modify the Effects of Caffeine on Mood, Cognitive and Fine-Motor Task Performance: A Post-Hoc Study. Nutrients 2021, 13, 412. [Google Scholar] [CrossRef] [PubMed]
- Boolani, A.; Fuller, D.; Mondal, S.; Gumpricht, E. Trait Energy and Fatigue Modify Acute Ingestion of an Adaptogenic-Rich Beverage on Neurocognitive Performance. Appl. Sci. 2022, 12, 4466. [Google Scholar] [CrossRef]
- Manierre, M.; Jansen, E.; Boolani, A. Sleep quality and sex modify the relationships between trait energy and fatigue on state energy and fatigue. PLoS ONE 2020, 15, e0227511. [Google Scholar] [CrossRef]
- Devereaux, C.; Yager, C.; Pickett, A.C.; Smith, M.L.; Martin, J.; Boolani, A. Predictors of Feelings of Anxiety in Graduate Allied Health Students: An Exploratory Study. J. Allied. Health 2021, 50, e73–e77. [Google Scholar]
- Boolani, A.; Yager, C.; Reid, J.; Lackman, J.; Smith, M.L. Correlates of depressive mood among graduate-level allied health students: An exploratory study examining trait energy and fatigue. J. Am. Coll. Health 2021, 1–12. [Google Scholar] [CrossRef]
- Eshragh, J.; Dhruva, A.; Paul, S.M.; Cooper, B.A.; Mastick, J.; Hamolsky, D.; Levine, J.D.; Miaskowski, C.; Kober, K.M. Associations between neurotransmitter genes and fatigue and energy levels in women after breast cancer surgery. J. Pain Symptom. Manag. 2017, 53, 67–84.e7. [Google Scholar] [CrossRef]
- Boolani, A.; Gallivan, K.M.; Ondrak, K.S.; Christopher, C.J.; Castro, H.F.; Campagna, S.R.; Taylor, C.M.; Luo, M.; Dowd, S.E.; Smith, M.L.; et al. Trait Energy and Fatigue May Be Connected to Gut Bacteria among Young Physically Active Adults: An Exploratory Study. Nutrients 2022, 14, 466. [Google Scholar] [CrossRef]
- Loy, B.D.; Cameron, M.H.; O’Connor, P.J. Perceived fatigue and energy are independent unipolar states: Supporting evidence. Med. Hypotheses 2018, 113, 46–51. [Google Scholar] [CrossRef]
- Dupree, E.J.; Goodwin, A.; Darie, C.C.; Boolani, A. A Pilot exploratory Proteomics Investigation of mental fatigue and mental energy. In Advancements of Mass Spectrometry in Biomedical Research; Springer: Berlin/Heidelberg, Germany, 2019; pp. 601–611. [Google Scholar]
- Boolani, A.; O’Connor, P.J.; Reid, J.; Ma, S.; Mondal, S. Predictors of feelings of energy differ from predictors of fatigue. Fatigue Biomed. Health Behav. 2019, 7, 12–28. [Google Scholar] [CrossRef]
- Loy, B.D.; O’Connor, P.J. The effect of histamine on changes in mental energy and fatigue after a single bout of exercise. Physiol. Behav. 2016, 153, 7–18. [Google Scholar] [CrossRef]
- Boolani, A.; Ryan, J.; Vo, T.; Wong, B.; Banerjee, N.; Banerjee, S.; Appoah-Kubi, K.O.; Boolani, A. Do changes in mental energy and fatigue impact functional assessments associated with fall risks? An exploratory study using machine learning. Phys. Occup. Ther. Geriatr. 2020, 38, 283–301. [Google Scholar] [CrossRef]
- Kadry, A.M.; Torad, A.; Elwan, M.A.; Kakar, R.S.; Bradley, D.; Chaudhry, S.; Boolani, A. Using Machine Learning to Identify Feelings of Energy and Fatigue in Single-Task Walking Gait: An Exploratory Study. Appl. Sci. 2022, 12, 3083. [Google Scholar] [CrossRef]
- Mahoney, G.; Martin, J.; Martin, R.; Yager, C.; Smith, M.L.; Grin, Z.; Vogel-Rosbrook, C.; Bradley, D.; Appiah-Kubi, K.O.; Boolani, A. Evidence that feelings of energy and fatigue are associated differently with gait characteristics and balance: An exploratory study. Fatigue Biomed. Health Behav. 2021, 9, 125–138. [Google Scholar] [CrossRef]
- Kowalski, K.L.; Boolani, A.; Christie, A.D. State and Trait Fatigue and Energy Predictors of Postural Control and Gait. Motor Control. 2021, 25, 519–536. [Google Scholar] [CrossRef]
- Boolani, A.; Allen, A.; Barrios, N.; Sames, C. Association between trait energy and fatigue and aquatic functional tests: An exploratory study. J. Aquat. Phys. Ther. 2022, 30, 8–11. [Google Scholar] [CrossRef]
- Filippi, M.; Krähenmann, R.; Fissler, P. The Link Between Energy-Related Sensations and Metabolism: Implications for Treating Fatigue. 2022. Available online: https://www.frontiersin.org/articles/10.3389/fpsyg.2022.920556 (accessed on 28 February 2023).
- O’Connor, P. Mental and Physical State and Trait Energy and Fatigue Scales; University of Georgia: Athens, GA, USA, 2006. [Google Scholar]
- Boolani, A.; Manierre, M. An exploratory multivariate study examining correlates of trait mental and physical fatigue and energy. Fatigue Biomed. Health Behav. 2019, 7, 29–40. [Google Scholar] [CrossRef]
- Dietch, J.R.; Taylor, D.J.; Sethi, K.; Kelly, K.; Bramoweth, A.D.; Roane, B.M. Psychometric evaluation of the PSQI in US college students. J. Clin. Sleep Med. 2016, 12, 1121–1129. [Google Scholar] [CrossRef] [Green Version]
- Lee, P.H.; Macfarlane, D.J.; Lam, T.H.; Stewart, S.M. Validity of the international physical activity questionnaire short form (IPAQ-SF): A systematic review. Int. J. Behav. Nutr. Phys. Act. 2011, 8, 115. [Google Scholar] [CrossRef] [Green Version]
- Scholey, A.B.; French, S.J.; Morris, P.J.; Kennedy, D.O.; Milne, A.L.; Haskell, C.F. Consumption of cocoa flavanols results in acute improvements in mood and cognitive performance during sustained mental effort. J. Psychopharmacol. 2010, 24, 1505–1514. [Google Scholar] [CrossRef] [PubMed]
- Haskell, C.F.; Kennedy, D.O.; Milne, A.L.; Wesnes, K.A.; Scholey, A.B. The effects of L-theanine, caffeine and their combination on cognition and mood. Biol. Psychol. 2008, 77, 113–122. [Google Scholar] [CrossRef] [PubMed]
- Harris, D.V.; Harris, B.L. The Athlete’s Guide to Sports Psychology: Mental Skills for Physical People; Human Kinetics: Champaign, IL, USA, 1984; Volume 1. [Google Scholar]
- Bravo, M.J.; Nakayama, K. The role of attention in different visual-search tasks. Percept Psychophys 1992, 51, 465–472. [Google Scholar] [CrossRef] [PubMed]
- Fos, L.A.; Greve, K.W.; South, M.B.; Mathias, C.; Benefield, H. Paced Visual Serial Addition Test: An alternative measure of information processing speed. Appl. Neuropsychol. 2000, 7, 140–146. [Google Scholar] [CrossRef] [PubMed]
- Adleman, N.E.; Menon, V.; Blasey, C.M.; White, C.D.; Warsofsky, I.S.; Glover, G.H.; Reiss, A.L. A developmental fMRI study of the Stroop color-word task. Neuroimage 2002, 16, 61–75. [Google Scholar] [CrossRef]
- Bugg, J.M.; Jacoby, L.L.; Toth, J.P. Multiple levels of control in the Stroop task. Mem. Cognit. 2008, 36, 1484–1494. [Google Scholar] [CrossRef] [Green Version]
- Stins, J.F.; Polderman, J.T.; Boomsma, D.I.; de Geus, E.J. Conditional accuracy in response interference tasks: Evidence from the Eriksen flanker task and the spatial conflict task. Adv. Cogn. Psychol. 2007, 3, 409. [Google Scholar] [CrossRef]
- Upadhayay, N.; Guragain, S. Comparison of cognitive functions between male and female medical students: A pilot study. J. Clin. Diagn Res. JCDR 2014, 8, BC12-5. [Google Scholar] [CrossRef]
- Heuchert, J.P.; McNair, D.M. Profile of Mood States, 2nd ed.; POMS 2; Multi-Health System Inc.: North Tonawanda, NY, USA, 2012. [Google Scholar]
- Pilcher, J.J.; Huffcutt, A.I. Effects of sleep deprivation on performance: A meta-analysis. Sleep 1996, 19, 318–326. [Google Scholar] [CrossRef]
- Vallat, R. Pingouin: Statistics in Python. J. Open Source Softw. 2018, 3, 1026. [Google Scholar] [CrossRef]
- Jolly, E. Pymer4: Connecting R and Python for linear mixed modeling. J. Open Source Softw. 2018, 3, 862. [Google Scholar] [CrossRef]
- Singmann, H.; Bolker, B.; Westfall, J.; Aust, F. Package ‘afex.’ Vienna. 2015. Available online: https://www.scirp.org/reference/ReferencesPapers.aspx?ReferenceID=2062246 (accessed on 15 March 2023).
- Abdi, H. The greenhouse-geisser correction. Encycl. Res. Des. 2010, 1, 544–548. [Google Scholar]
- Thissen, D.; Steinberg, L.; Kuang, D. Quick and easy implementation of the Benjamini-Hochberg procedure for controlling the false positive rate in multiple comparisons. J. Educ. Behav. Stat. 2002, 27, 77–83. [Google Scholar] [CrossRef]
- Trigo Sánchez, M.E.; Martínez Cervantes, R.J. Generalized eta squared for multiple comparisons on between-groups designs. Psicothema 2016, 28, 340–345. [Google Scholar]
- Bakeman, R. Recommended effect size statistics for repeated measures designs. Behav. Res. Methods 2005, 37, 379–384. [Google Scholar] [CrossRef]
- Jolliffe, I.T.; Cadima, J. Principal component analysis: A review and recent developments. Philos. Trans. R Soc. Math Phys. Eng. Sci. 2016, 374, 20150202. [Google Scholar] [CrossRef] [Green Version]
- White, I.R.; Royston, P.; Wood, A.M. Multiple imputation using chained equations: Issues and guidance for practice. Stat. Med. 2011, 30, 377–399. [Google Scholar] [CrossRef]
- Wong, T.T. Performance evaluation of classification algorithms by k-fold and leave-one-out cross validation. Pattern Recognit. 2015, 48, 2839–2846. [Google Scholar] [CrossRef]
- Brassington, G. Mean absolute error and root mean square error: Which is the better metric for assessing model performance? In EGU General Assembly Conference Abstracts; EGU: Munich, Germany, 2017; p. 3574. [Google Scholar]
- Willmott, C.J.; Matsuura, K. Advantages of the mean absolute error (MAE) over the root mean square error (RMSE) in assessing average model performance. Clim. Res. 2005, 30, 79–82. [Google Scholar] [CrossRef]
- Vabalas, A.; Gowen, E.; Poliakoff, E.; Casson, A.J. Machine learning algorithm validation with a limited sample size. PLoS ONE 2019, 14, e0224365. [Google Scholar] [CrossRef]
- Massee, L.A.; Ried, K.; Pase, M.; Travica, N.; Yoganathan, J.; Scholey, A.; Macpherson, H.; Kennedy, G.; Sali, A.; Pipingas, A. The acute and sub-chronic effects of cocoa flavanols on mood, cognitive and cardiovascular health in young healthy adults: A randomized, controlled trial. Front. Pharmacol. 2015, 6, 93. [Google Scholar] [CrossRef] [PubMed] [Green Version]
- Husemann, B.; Von Mach, C.Y.; Borsotto, D.; Zepf, K.I.; Scharnbacher, J. Comparisons of Musculoskeletal Complaints and Data Entry Between a Sitting and a Sit-Stand Workstation Paradigm. Hum. Factors 2009, 51, 310–320. [Google Scholar] [CrossRef] [PubMed]
- Pronk, N.P.; Katz, A.S.; Lowry, M.; Payfer, J.R. Peer reviewed: Reducing occupational sitting time and improving worker health: The take-a-stand project, 2011. Prev. Chronic Dis. 2012, 9, E154. [Google Scholar] [CrossRef] [PubMed] [Green Version]
- Steyer, R.; Majcen, A.M.; Schwenkmezger, P.; Buchner, A. A latent state-trait anxiety model and its application to determine consistency and specificity coefficients. Anxiety Res. 1989, 1, 281–299. [Google Scholar] [CrossRef]
- Cole, D.A.; Nolen-Hoeksema, S.; Girgus, J.; Paul, G. Stress exposure and stress generation in child and adolescent depression: A latent trait-state-error approach to longitudinal analyses. J. Abnorm. Psychol. 2006, 115, 40. [Google Scholar] [CrossRef]
- van Gelder, J.L.; De Vries, R.E.; Van Sintemaartensdijk, I.; Donker, T. Personality pathways to aggression: Testing a trait-state model using immersive technology. Criminology 2022, 60, 406–428. [Google Scholar] [CrossRef]
- O’Connor, P.J. Mental energy: Developing a model for examining nutrition-related claims. Nutr. Rev. 2006, 64, S2–S6. [Google Scholar] [CrossRef] [Green Version]
- Baghurst, T.; Bounds, E.; Boolani, A.; Betts, N. Comparison Between Perceived and Actual Physical Activity of Physical Education Teacher Education Students. Rev. PhénEPSPHEnex J. 2018, 9, 1–11. [Google Scholar]
- Weintraub, S.; Dikmen, S.S.; Heaton, R.K.; Tulsky, D.S.; Zelazo, P.D.; Bauer, P.J.; Carlozzi, N.E.; Slotkin, J.; Blitz, D.; Wallner-Allen, K.; et al. Cognition assessment using the NIH Toolbox. Neurology 2013, 80 (Suppl. 3), S54–S64. [Google Scholar] [CrossRef] [Green Version]


| Measure | Mean (SD) |
|---|---|
| Sex (male:female) | 7:24 |
| Height (cm) | 172.44 (9.08) |
| Weight (kg) | 74.87 (14.5) |
| Age (years) | 25.8 (3.6) |
| Trait Physical Energy | 6.06 (1.82) |
| Trait Physical Fatigue | 5.06 (2.0) |
| Trait Mental Energy | 5.26 (1.76) |
| Trait Mental Fatigue | 5.81 (2.14) |
| Vigorous Physical Activity (h/week) | 2.40 (5.27) |
| Moderate Physical Activity (h/week) | 4.17 (10.02) |
| Sitting Time (h/day) | 9.47 (4.00) |
| Pittsburgh Sleep Quality Inventory Score | 6.94 (2.1) |
| Caffeine Consumption (servings per day) | 1.8 (2.2) |
| Factor | Measure | F-Stat | p-Value | η2G |
|---|---|---|---|---|
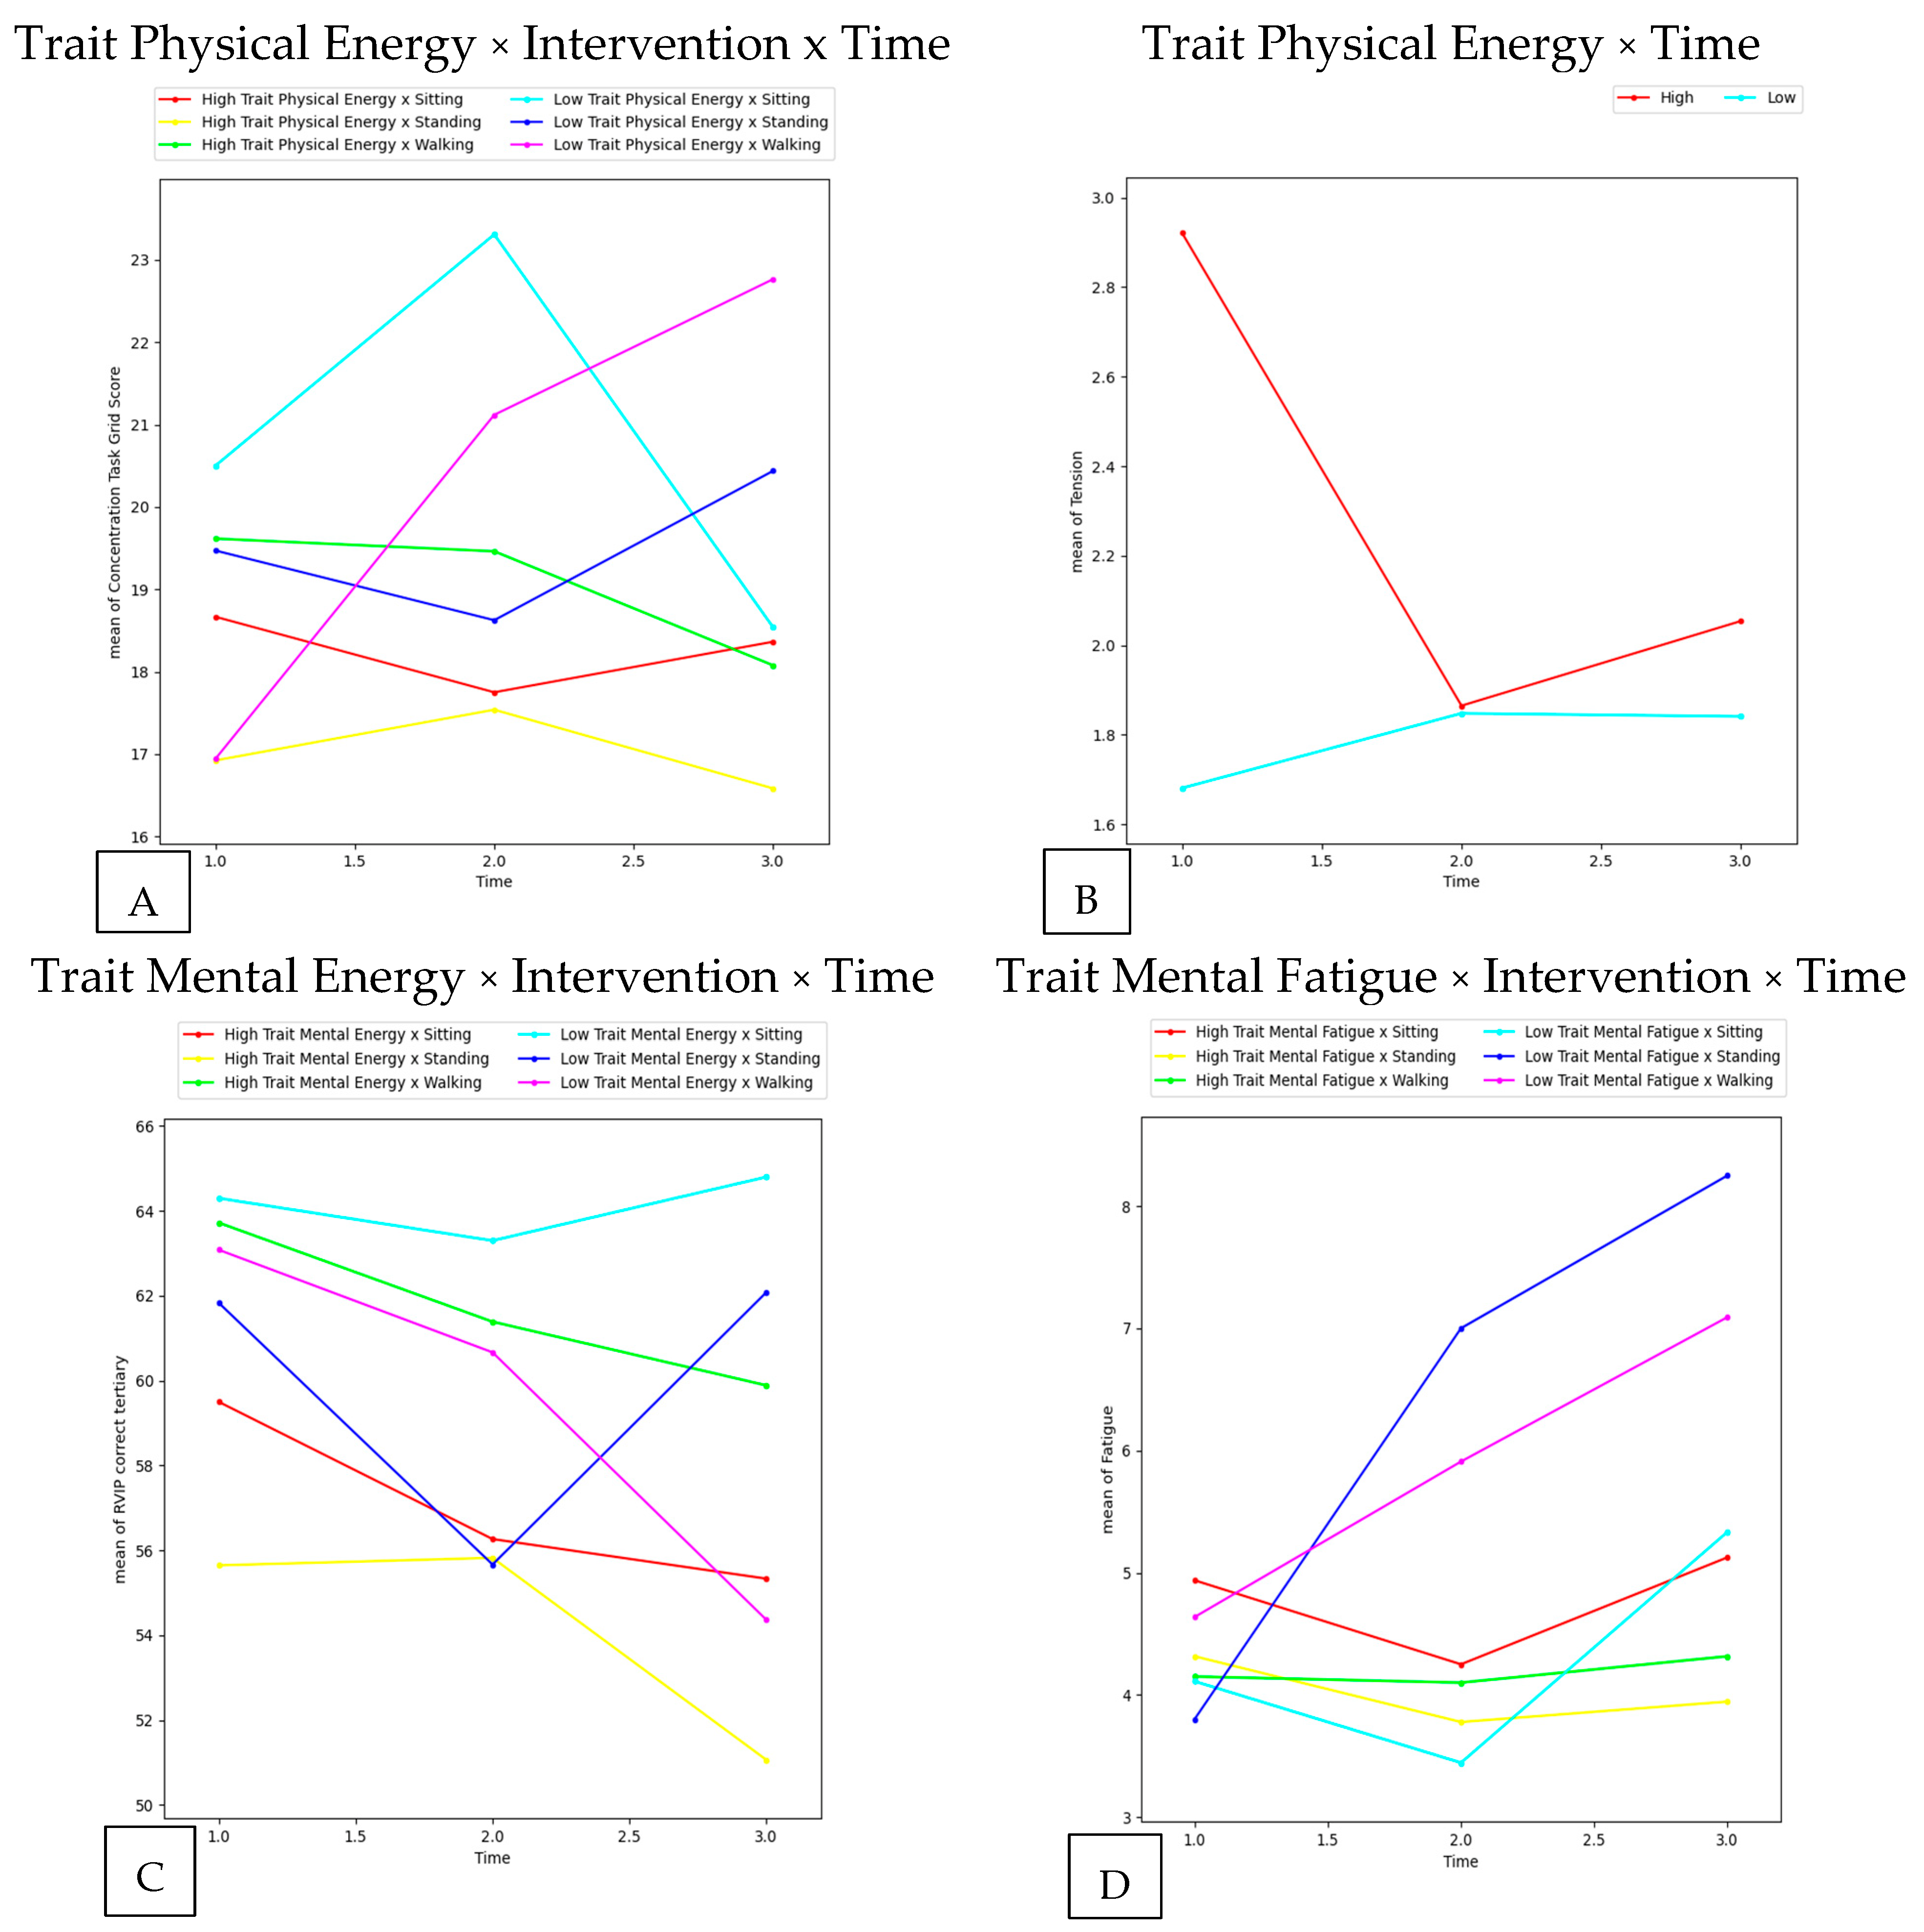
| Trait Physical Energy × Intervention × Time | Concentration Task Grid Score | 2.779 | 0.041 | 0.030 |
| Time | Distractors correct | 3.354 | 0.050 | 0.016 |
| Time | Distractors average reaction time | 5.215 | 0.014 | 0.010 |
| Trait Physical Energy × Intervention | Forward Counting Correct | 6.730 | 0.005 | 0.064 |
| Time | Forward Counting Correct | 3.559 | 0.040 | 0.037 |
| Trait Physical Energy × Intervention | RVIP primary reaction time | 4.234 | 0.029 | 0.036 |
| Time | RVIP primary reaction time | 5.523 | 0.013 | 0.029 |
| Trait Physical Energy × Intervention × Time | Serial addition average reaction time | 3.562 | 0.029 | 0.017 |
| Time | Stroop congruent average reaction time | 25.336 | <0.001 | 0.076 |
| Time | Stroop incongruent average reaction time | 9.895 | 0.002 | 0.057 |
| Trait Physical Energy × Time | Tension | 5.737 | 0.021 | 0.021 |
| Trait Physical Energy × Intervention | Fatigue | 3.860 | 0.031 | 0.088 |
| Intervention × Time | Confusion | 3.770 | 0.020 | 0.043 |
| Time | Vigor | 5.990 | 0.006 | 0.017 |
| Time | State Physical Energy | 13.961 | <0.001 | 0.082 |
| Trait Physical Energy × Time | State Physical Energy | 3.902 | 0.048 | 0.024 |
| Trait Physical Energy × Intervention | State Physical Fatigue | 4.050 | 0.026 | 0.104 |
| Time | State Physical Fatigue | 16.368 | <0.001 | 0.042 |
| Trait Physical Energy × Intervention | State Mental Energy | 4.293 | 0.025 | 0.088 |
| Time | State Mental Energy | 4.85 | 0.018 | 0.011 |
| Time | State Mental Fatigue | 15.119 | <0.001 | 0.056 |
| Trait Physical Energy × Intervention | Motivation | 5.700 | 0.011 | 0.129 |
| Time | Motivation | 10.901 | 0.001 | 0.026 |
| Trait Physical Fatigue × Intervention | Forward Counting Correct | 6.123 | 0.007 | 0.062 |
| Trait Physical Fatigue | RVIP incorrect secondary | 5.370 | 0.031 | 0.084 |
| Trait Physical Fatigue | Stroop percentage correct congruent | 6.746 | 0.016 | 0.036 |
| Trait Physical Fatigue | Stroop correct incongruent | 5.156 | 0.033 | 0.023 |
| Trait Physical Fatigue | Stroop percentage correct incongruent | 5.156 | 0.033 | 0.023 |
| Trait Physical Fatigue × Intervention | Depression | 3.618 | 0.045 | 0.102 |
| Intervention × Time | Vigor | 2.658 | 0.048 | 0.011 |
| Trait Mental Energy × Intervention | Forward counting average reaction time | 3.79 | 0.040 | 0.043 |
| Trait Mental Energy | RVIP correct secondary | 4.423 | 0.048 | 0.128 |
| Trait Mental Energy | RVIP incorrect secondary | 4.809 | 0.040 | 0.074 |
| Trait Mental Energy × Intervention × Time | RVIP tertiary percent correct | 3.436 | 0.023 | 0.023 |
| Trait Mental Energy × Intervention | Serial subtract three correct | 3.911 | 0.029 | 0.040 |
| Trait Mental Energy × Time | Serial subtract three attempts | 4.382 | 0.030 | 0.019 |
| Trait Mental Energy | Vigor | 7.095 | 0.015 | 0.101 |
| Trait Mental Energy | State Physical Fatigue | 6.313 | 0.021 | 0.061 |
| Trait Mental Fatigue × Intervention | Distractors correct | 4.160 | 0.025 | 0.036 |
| Trait Mental Fatigue × Intervention | RVIP correct primary | 4.357 | 0.027 | 0.028 |
| Time | RVIP correct tertiary | 3.757 | 0.034 | 0.013 |
| Trait Mental Fatigue × Intervention | RVIP primary omitted | 4.373 | 0.027 | 0.028 |
| Trait Mental Fatigue × Intervention | RVIP primary percent correct | 4.377 | 0.027 | 0.028 |
| Time | RVIP tertiary percent correct | 3.782 | 0.033 | 0.013 |
| Trait Mental Fatigue × Intervention × Time | Serial subtract seven correct | 2.825 | 0.045 | 0.02 |
| Trait Mental Fatigue | Stroop percentage correct incongruent | 4.664 | 0.041 | 0.022 |
| Trait Mental Fatigue × Time | Stroop percentage correct incongruent | 5.917 | 0.019 | 0.046 |
| Time | Fatigue | 6.548 | 0.014 | 0.023 |
| Trait Mental Fatigue × Time | Fatigue | 6.924 | 0.012 | 0.024 |
| Trait Mental Fatigue × Intervention × Time | Fatigue | 3.510 | 0.027 | 0.017 |
Disclaimer/Publisher’s Note: The statements, opinions and data contained in all publications are solely those of the individual author(s) and contributor(s) and not of MDPI and/or the editor(s). MDPI and/or the editor(s) disclaim responsibility for any injury to people or property resulting from any ideas, methods, instructions or products referred to in the content. |
© 2023 by the authors. Licensee MDPI, Basel, Switzerland. This article is an open access article distributed under the terms and conditions of the Creative Commons Attribution (CC BY) license (https://creativecommons.org/licenses/by/4.0/).
Share and Cite
Gigliotti, H.M.; Hodgson, C.; Riley, M.; Marshall, B.; Ward-Ritacco, C.L.; Martin, J.; Boolani, A. Trait Energy and Fatigue Influence Inter-Individual Mood and Neurocognitive Responses during Work Done While Sitting, Standing, and Intermittent Walking: A Randomized-Controlled Crossover Design. Appl. Sci. 2023, 13, 4241. https://doi.org/10.3390/app13074241
Gigliotti HM, Hodgson C, Riley M, Marshall B, Ward-Ritacco CL, Martin J, Boolani A. Trait Energy and Fatigue Influence Inter-Individual Mood and Neurocognitive Responses during Work Done While Sitting, Standing, and Intermittent Walking: A Randomized-Controlled Crossover Design. Applied Sciences. 2023; 13(7):4241. https://doi.org/10.3390/app13074241
Chicago/Turabian StyleGigliotti, Hannah M., Cody Hodgson, Mary Riley, Brittany Marshall, Christie L. Ward-Ritacco, Joel Martin, and Ali Boolani. 2023. "Trait Energy and Fatigue Influence Inter-Individual Mood and Neurocognitive Responses during Work Done While Sitting, Standing, and Intermittent Walking: A Randomized-Controlled Crossover Design" Applied Sciences 13, no. 7: 4241. https://doi.org/10.3390/app13074241