
Development of an Artificial Intelligence-Based System for Predicting Weld Bead Geometry

Abstract
:1. Introduction
2. Materials and Methods
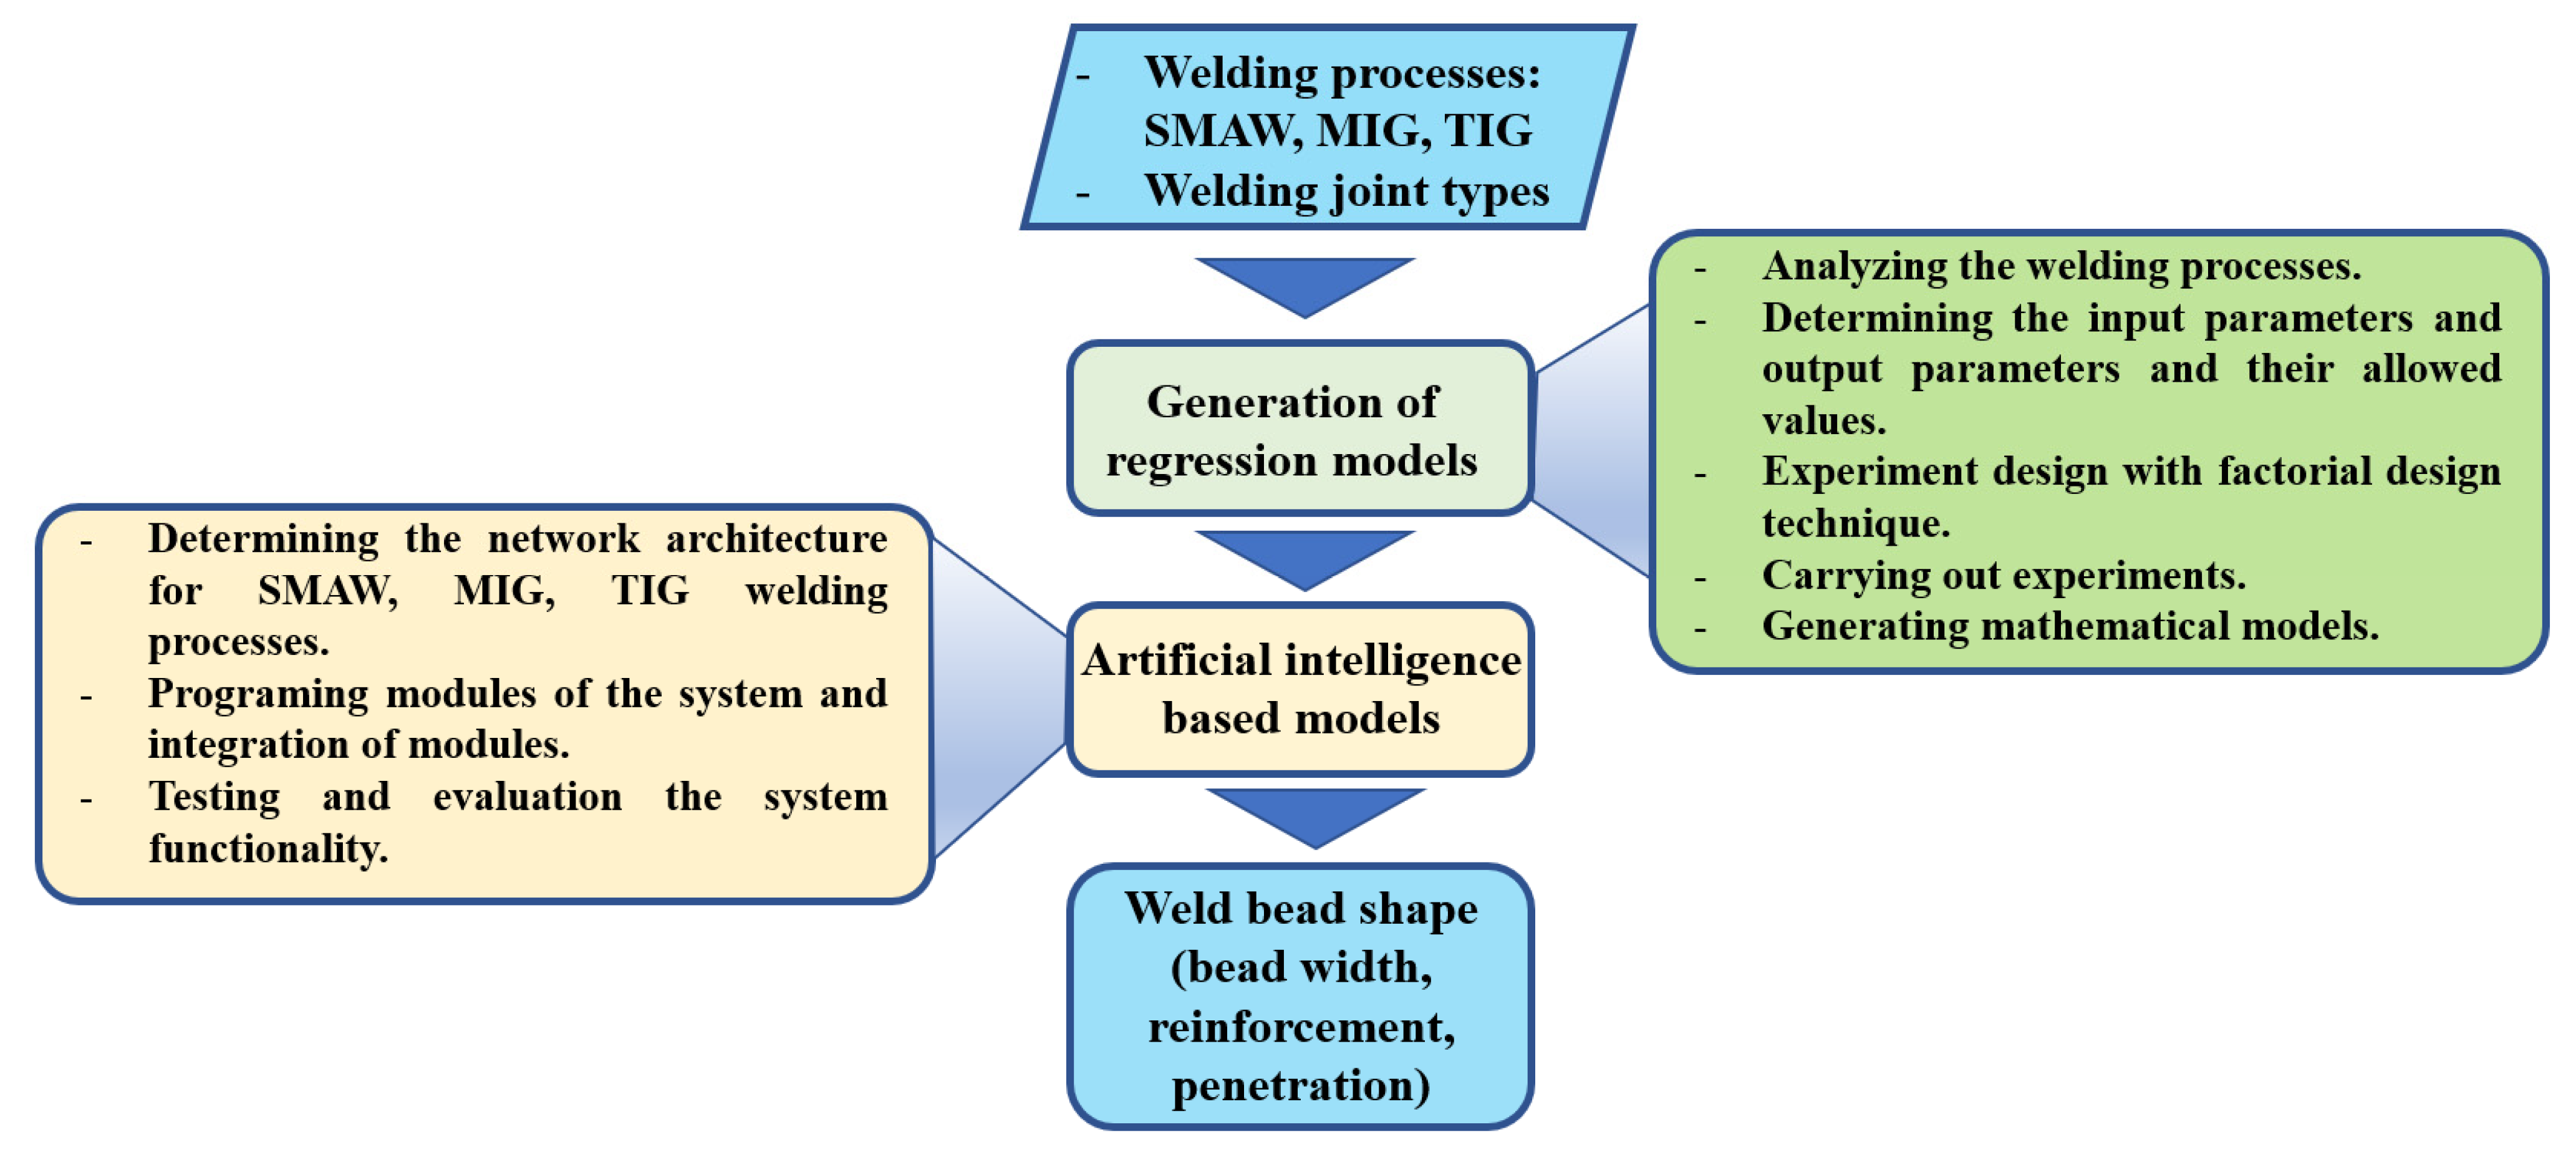
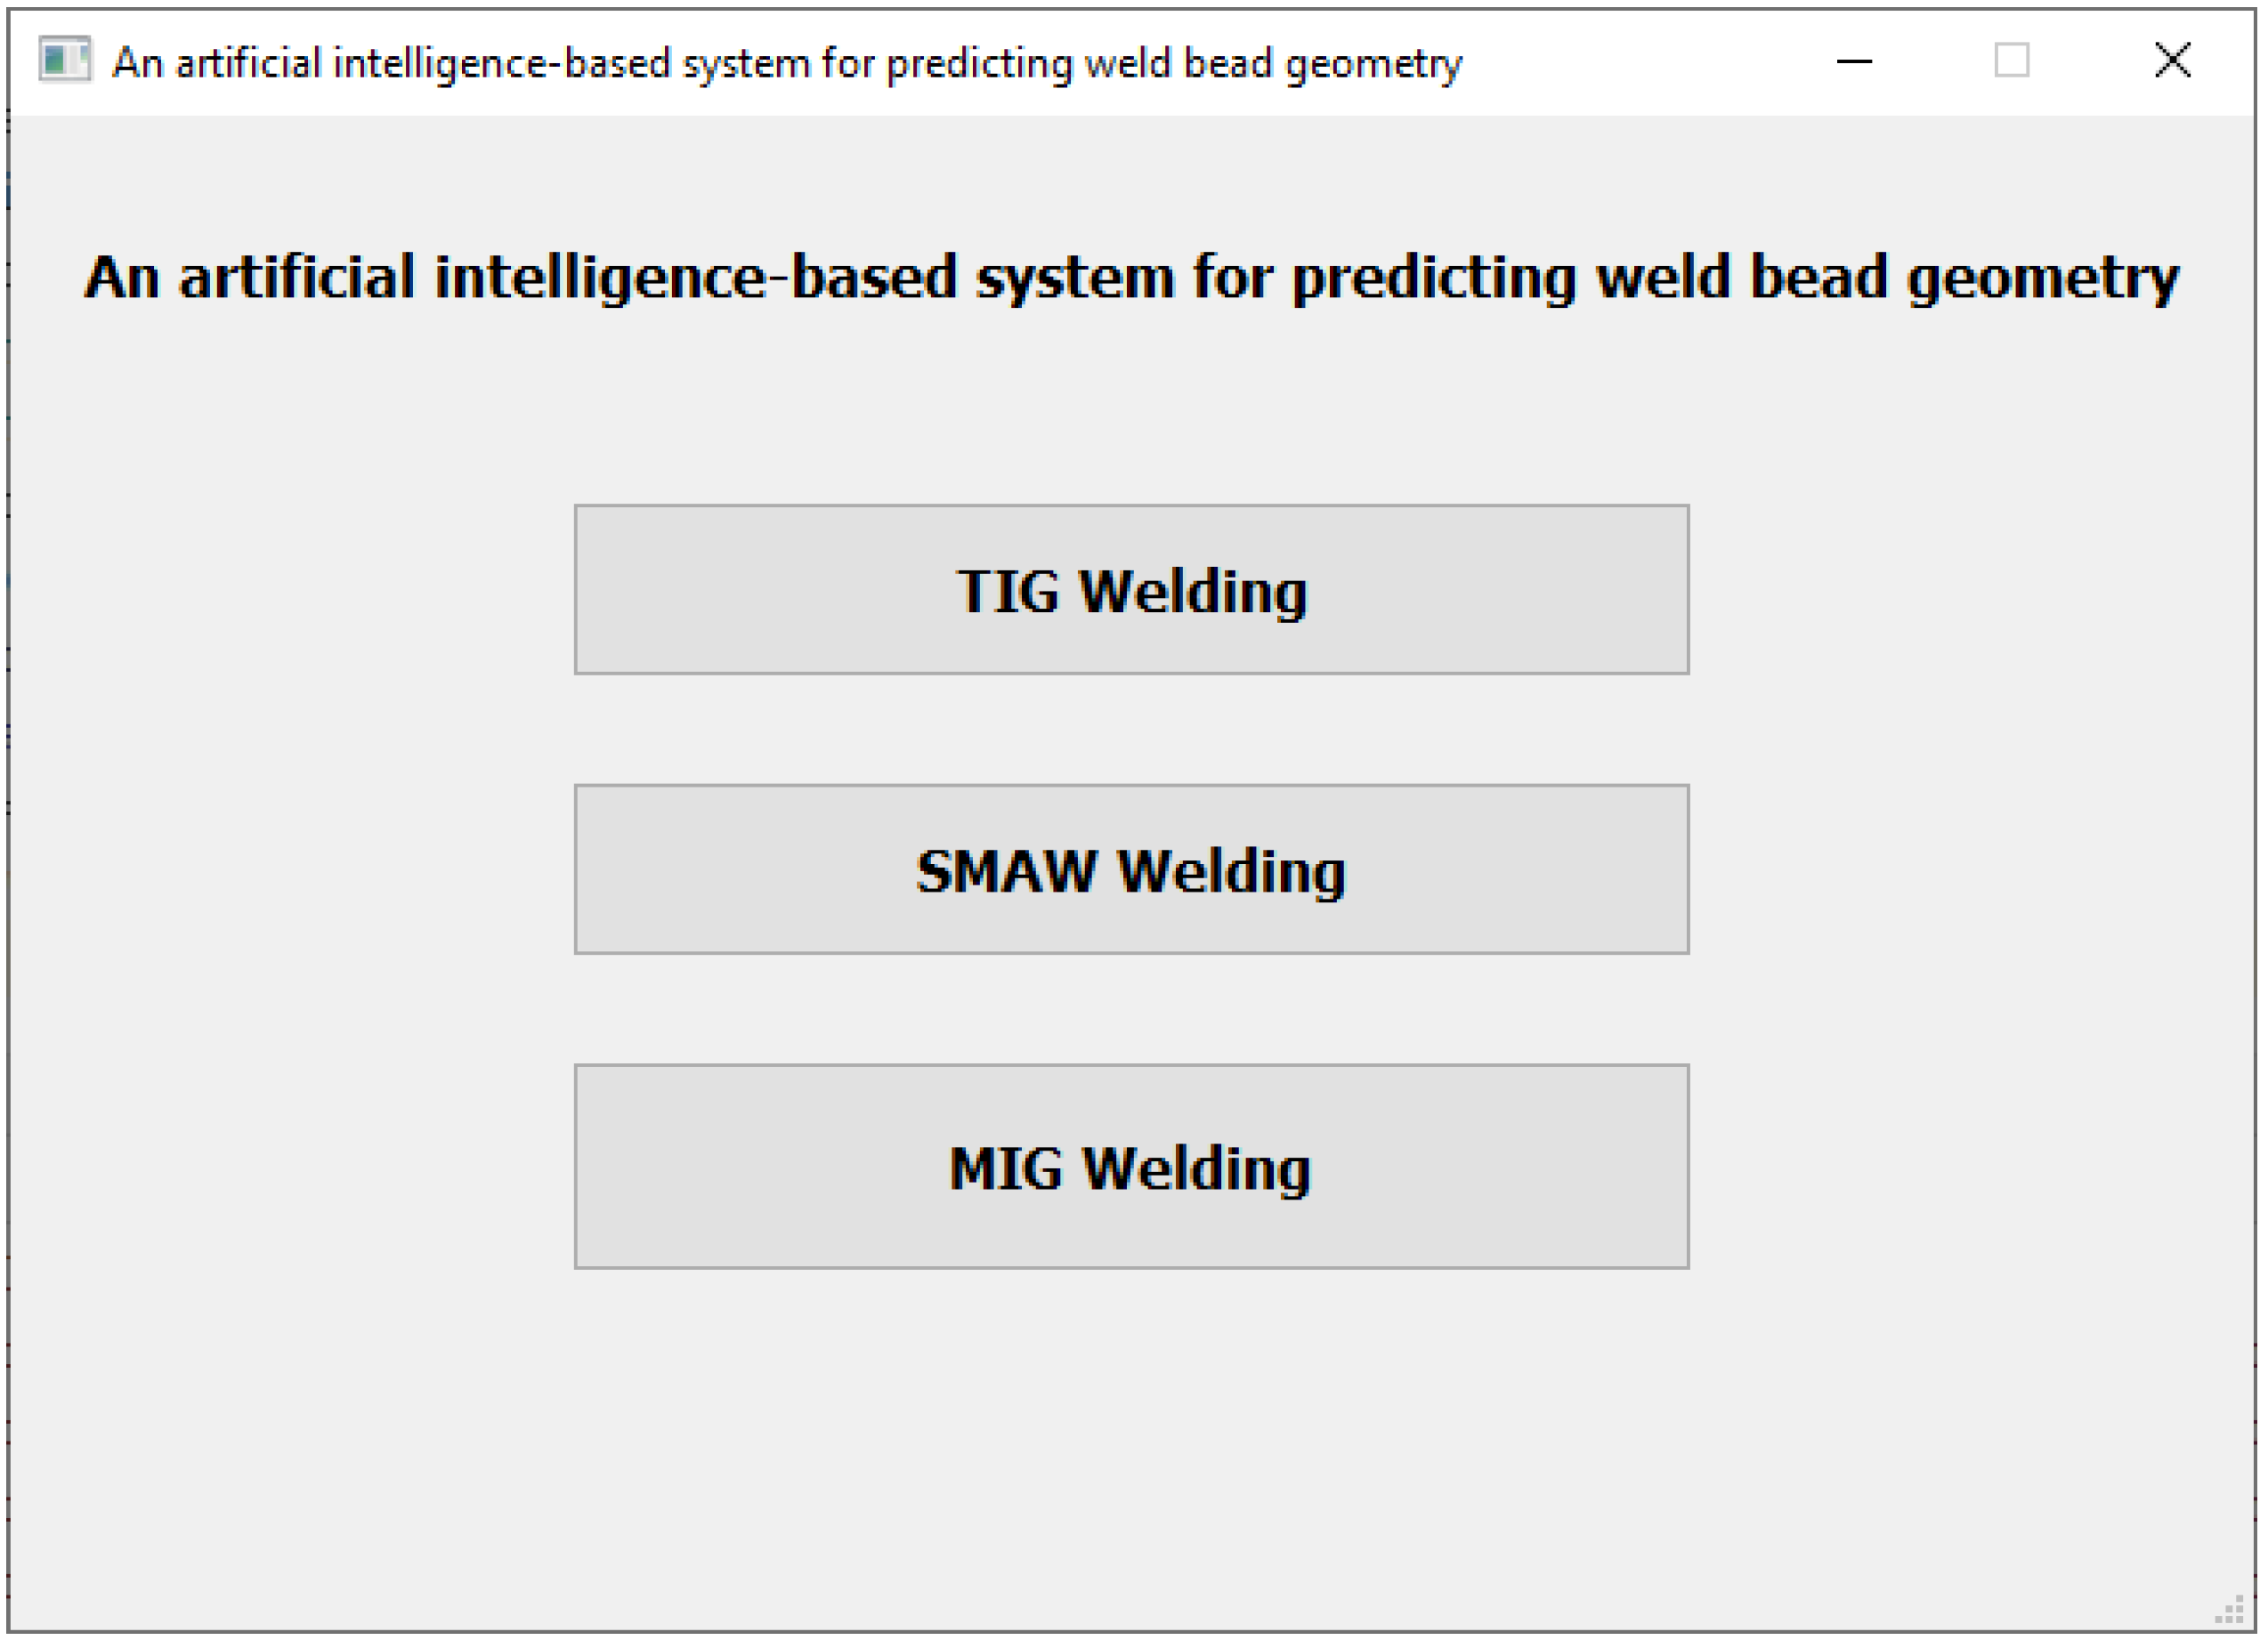
2.1. Systematic Procedure for Developing the Predictive System
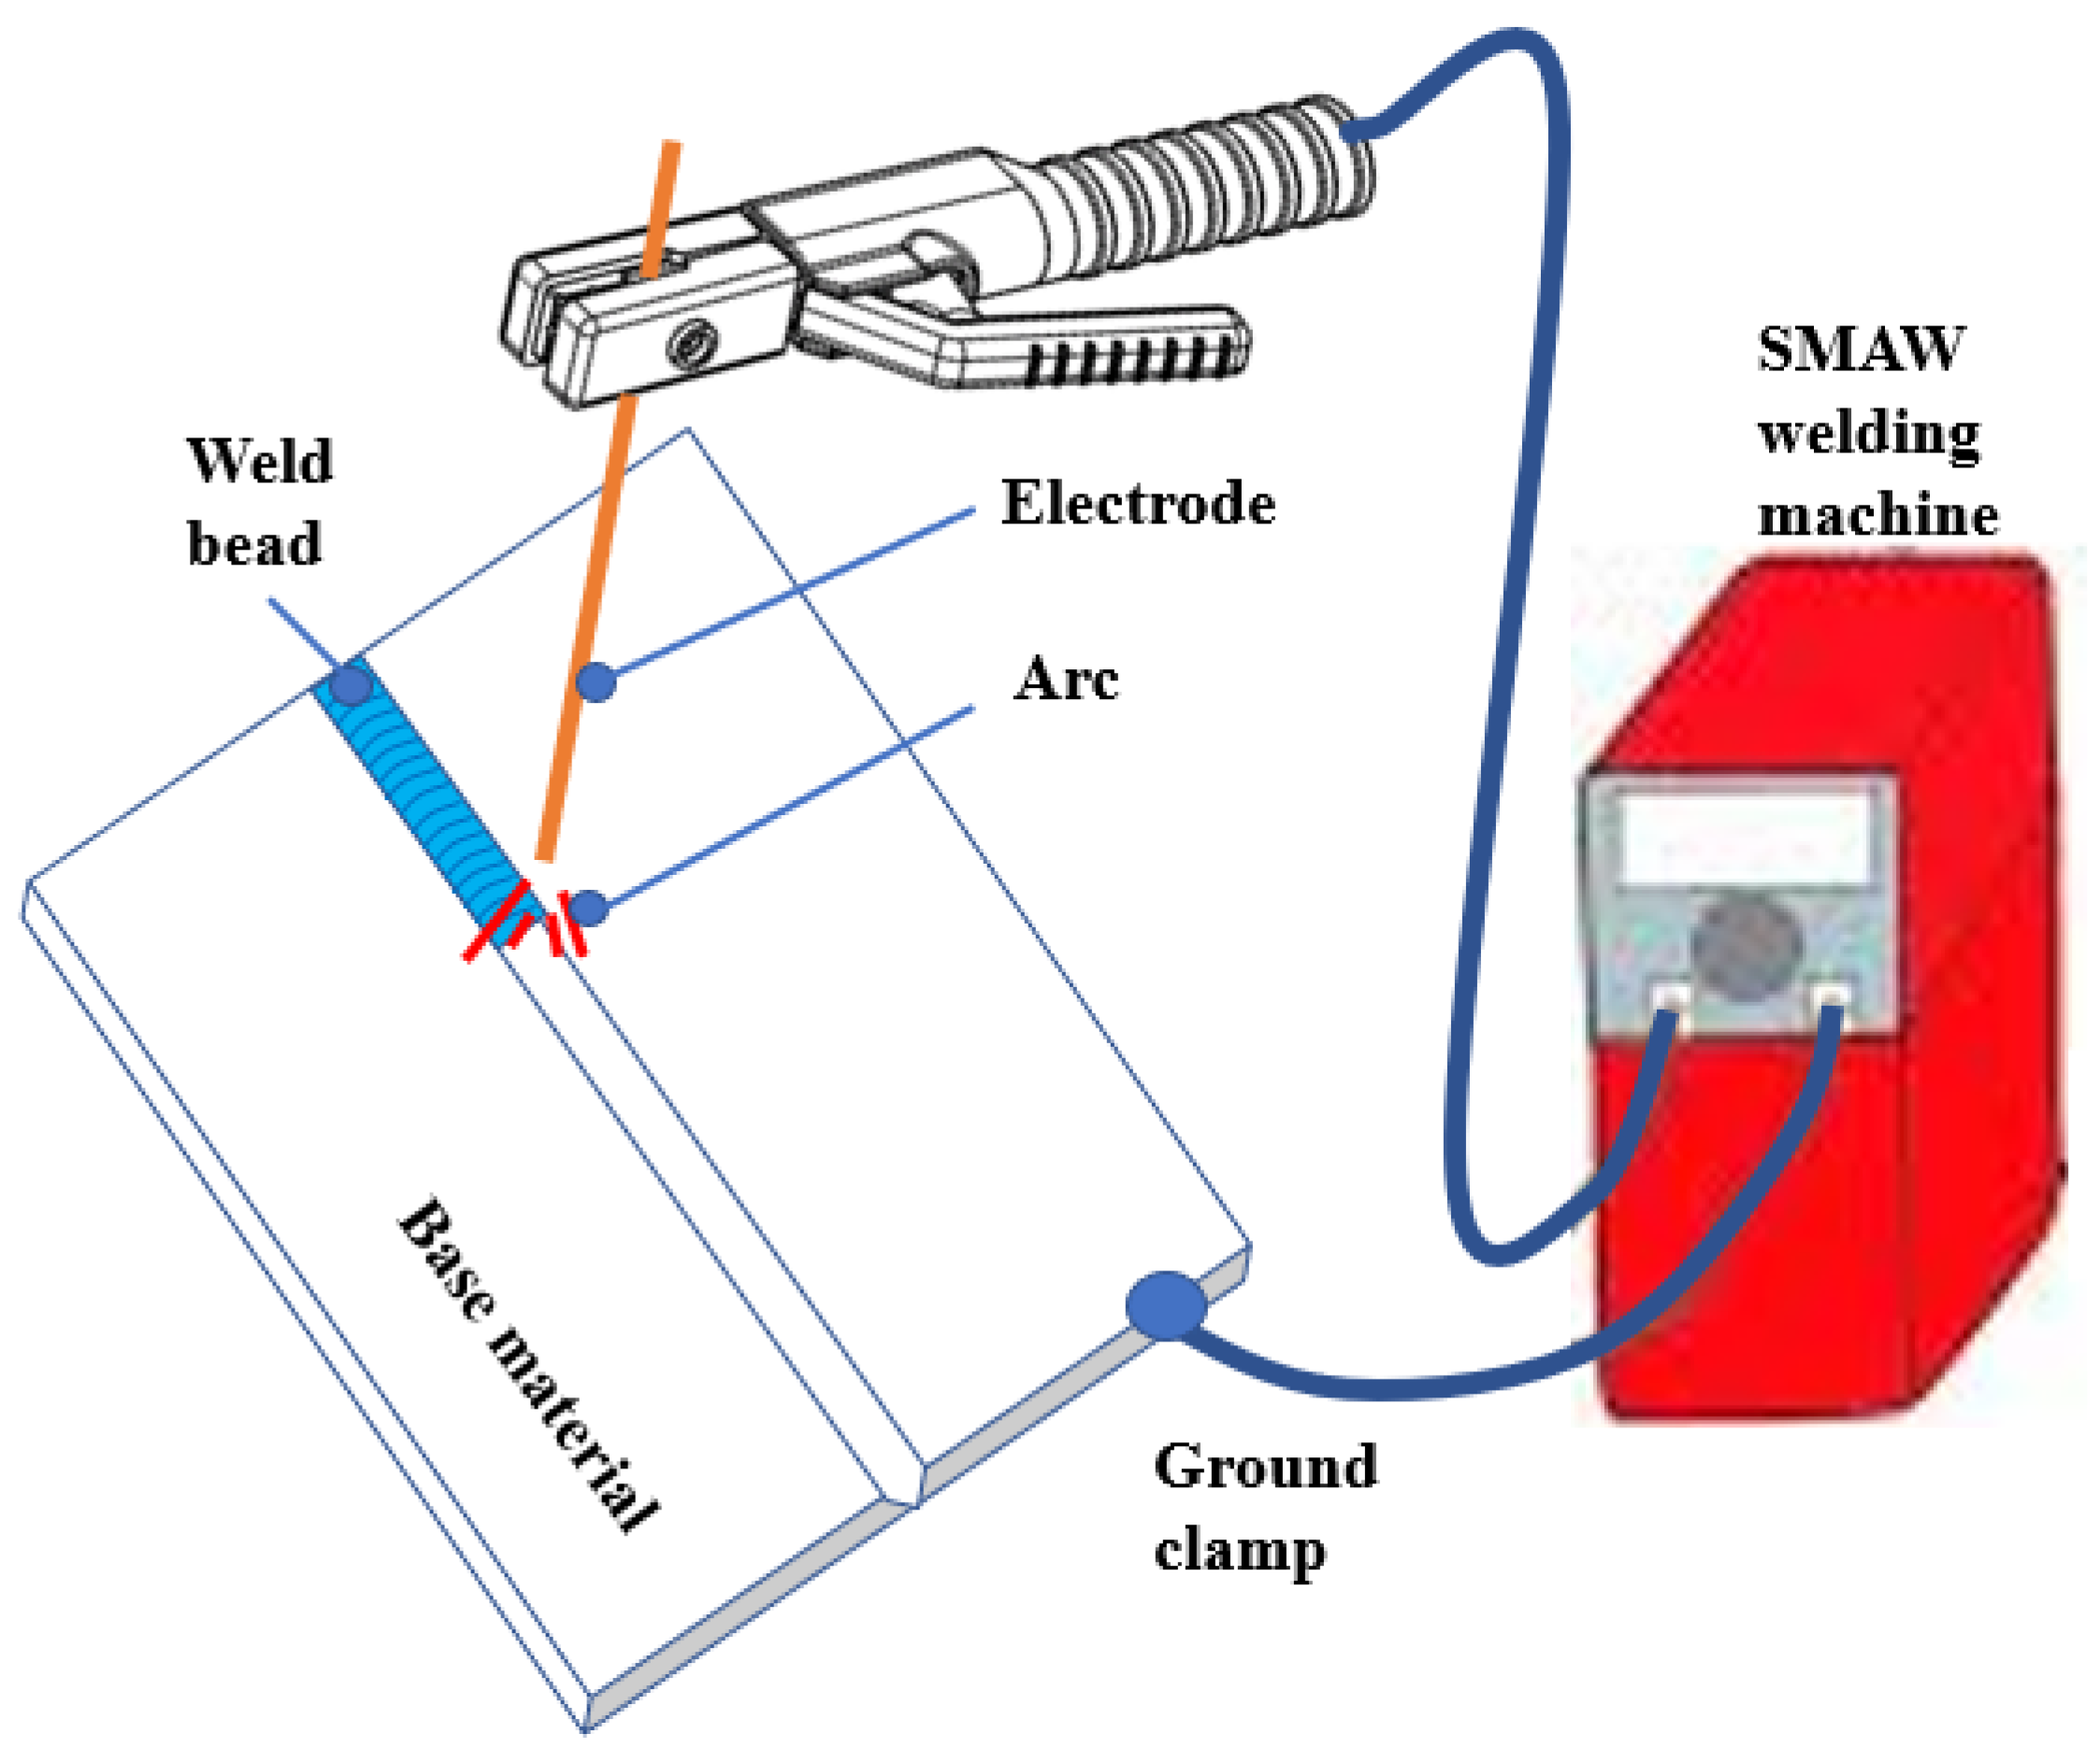
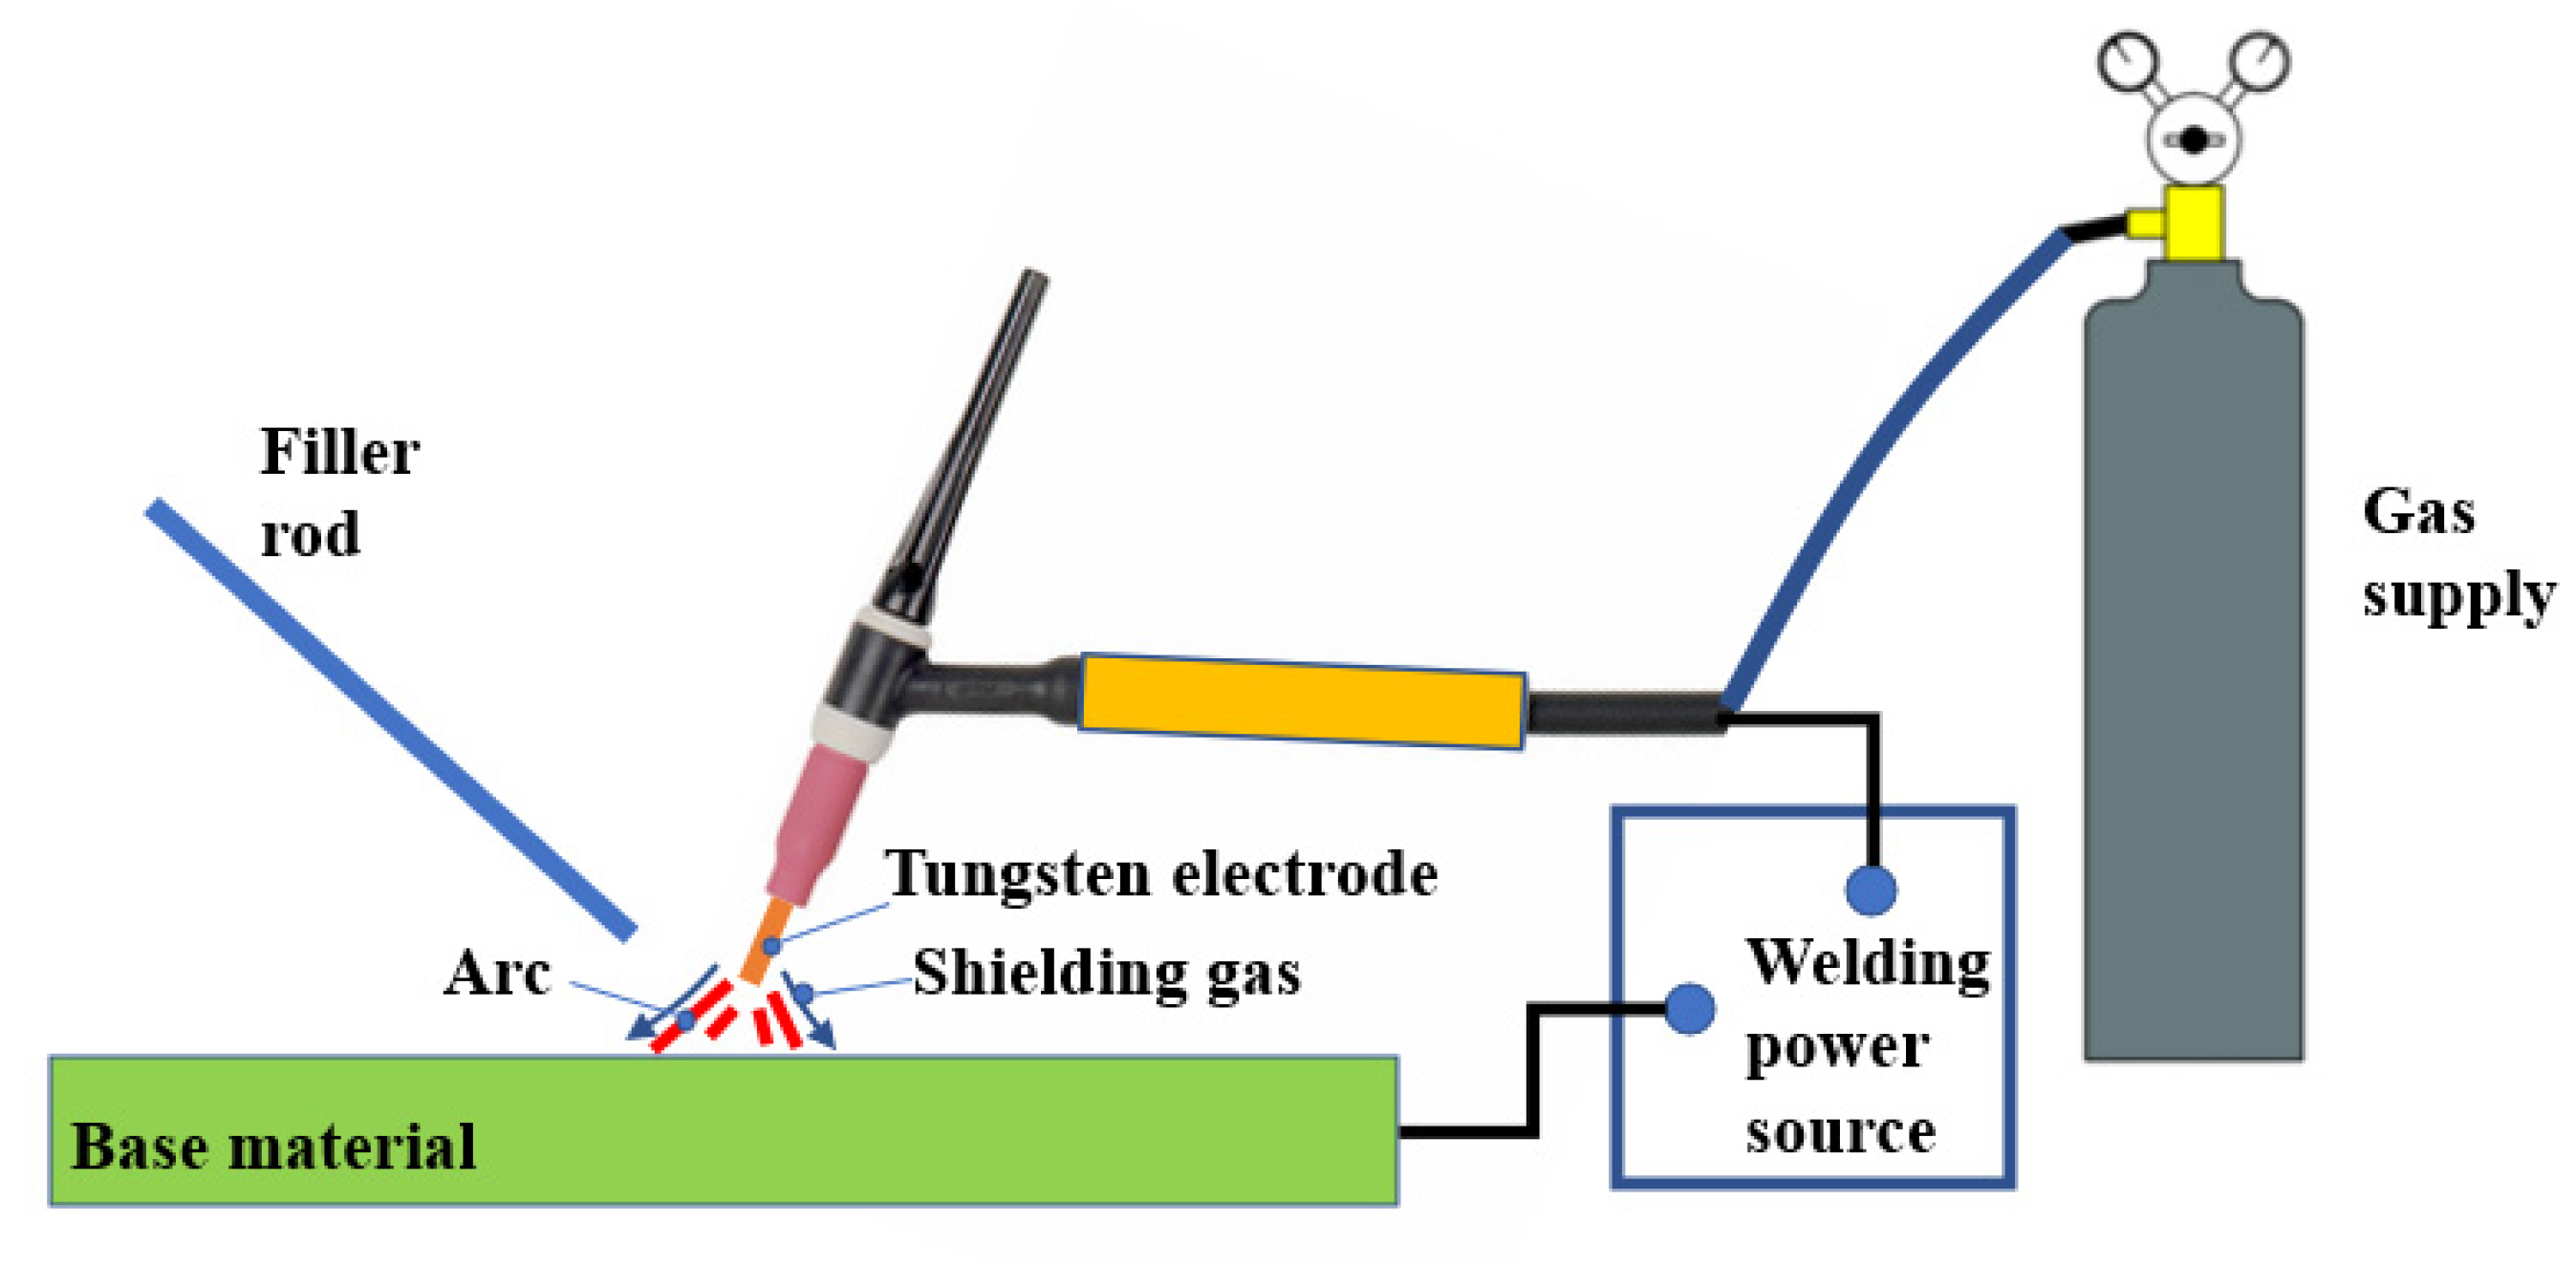
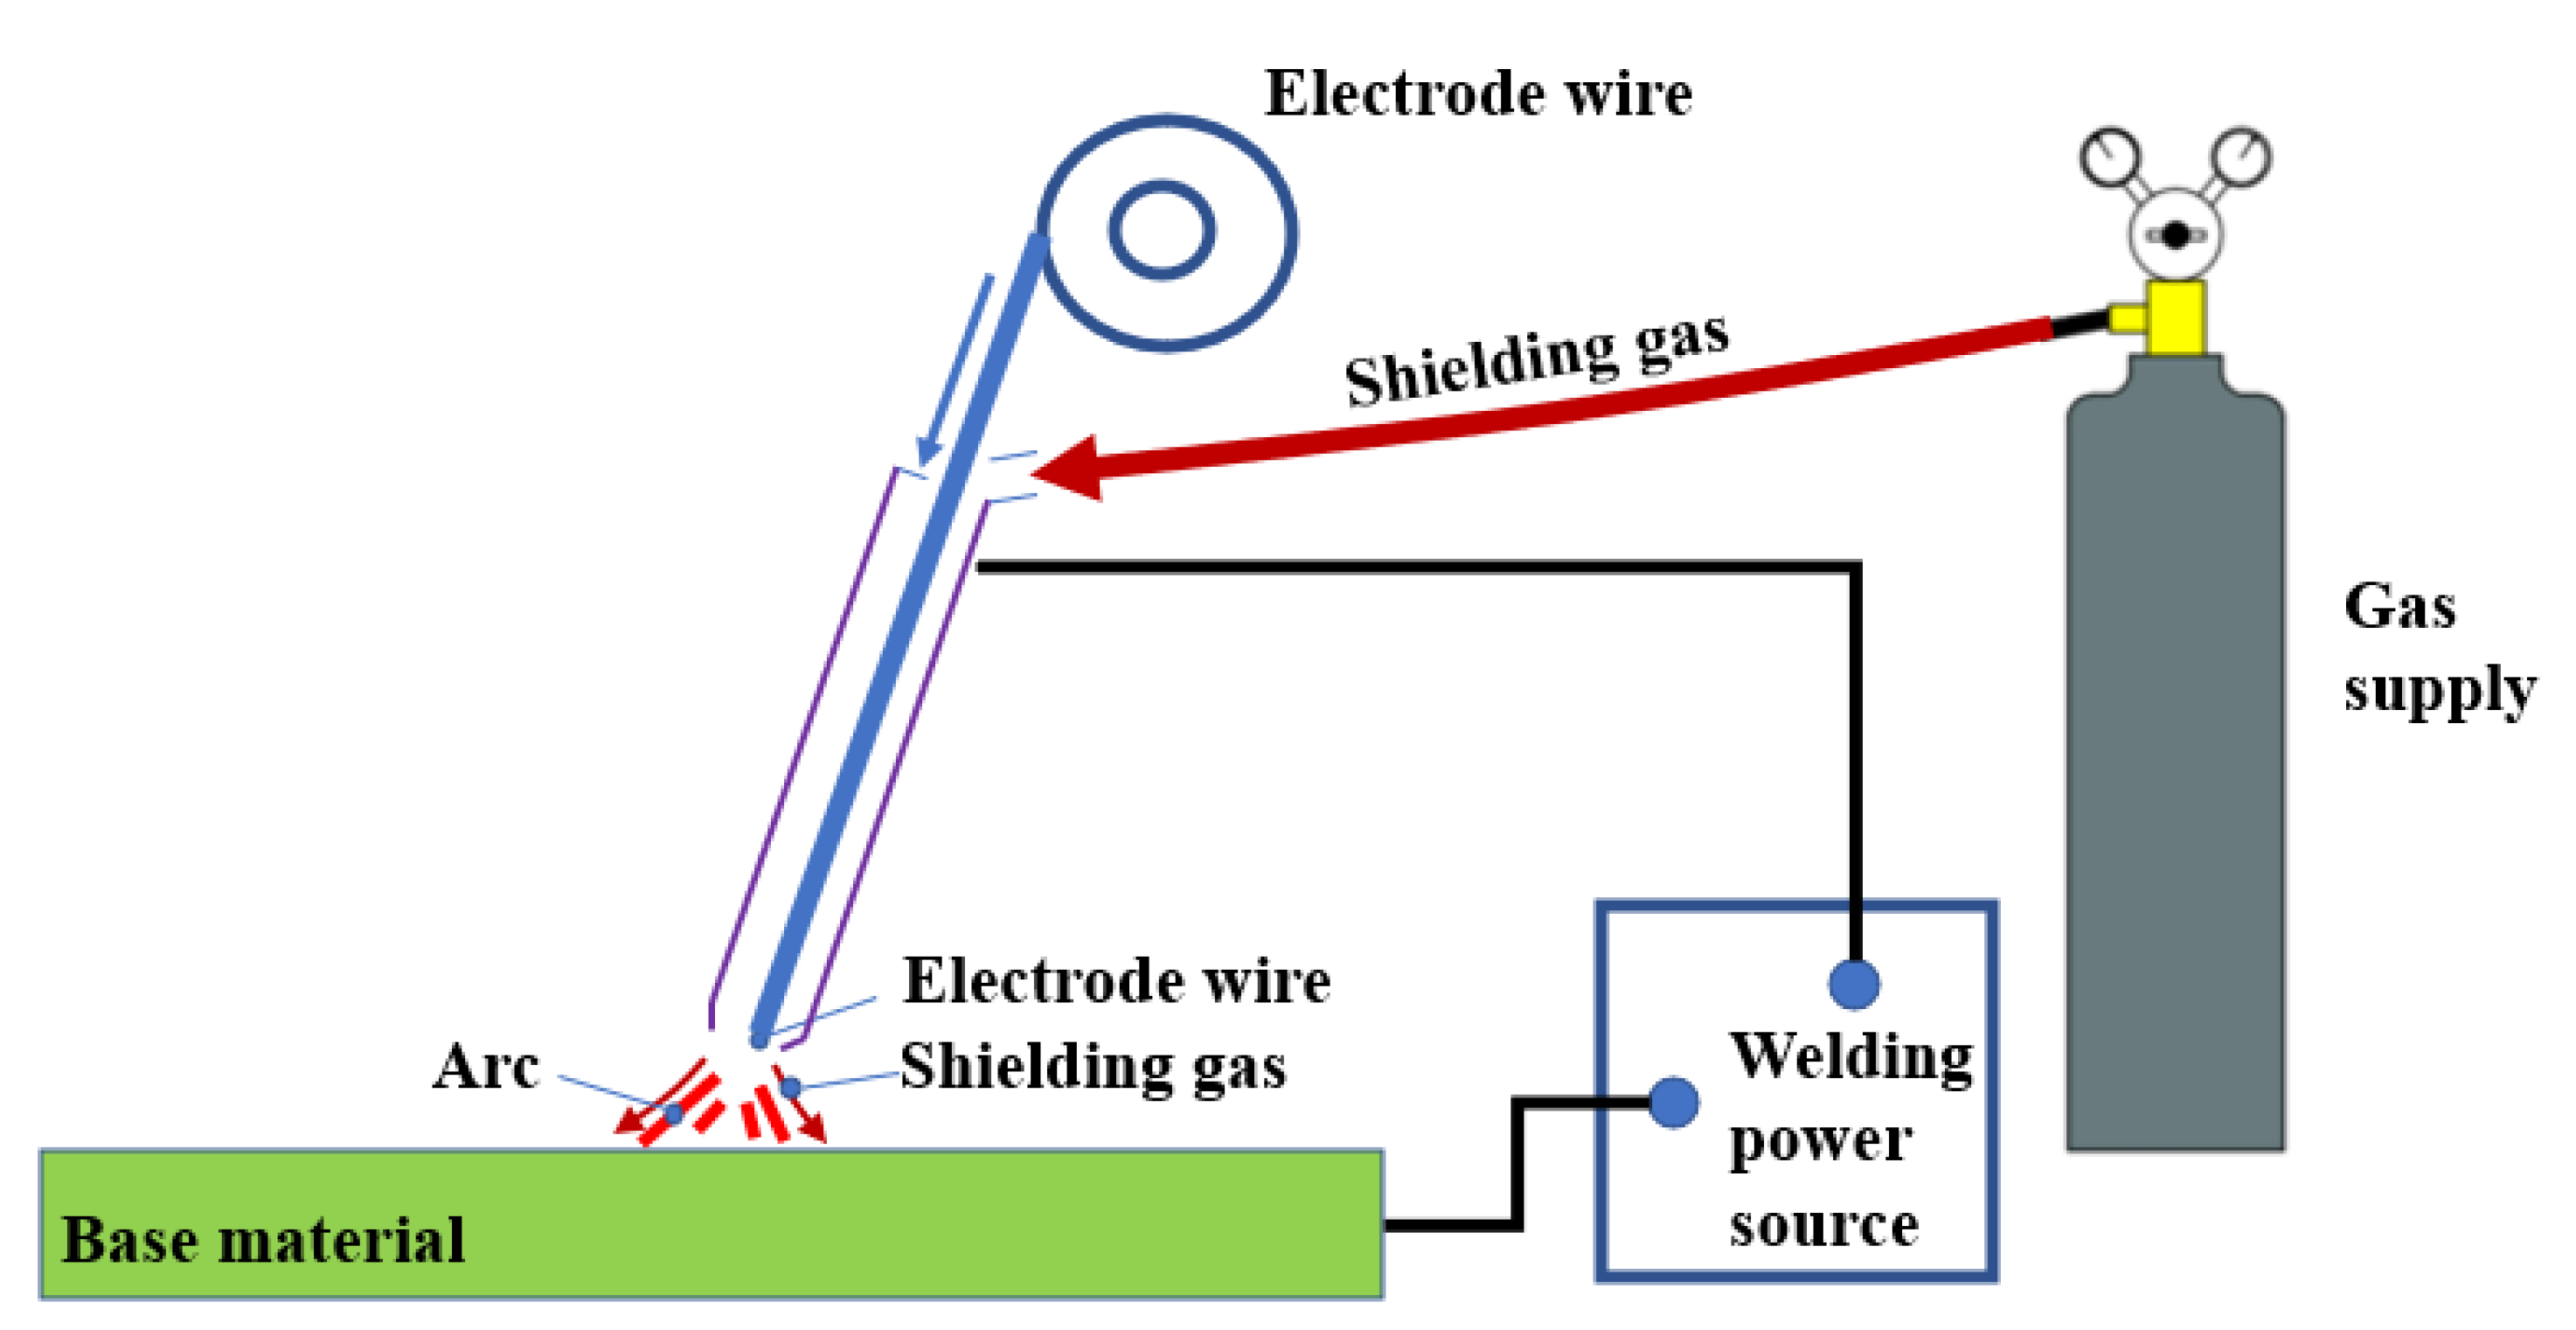
2.2. SMAW, MIG, and TIG Welding Processes
2.3. Experiments for Generating Data and Development of Regression Models

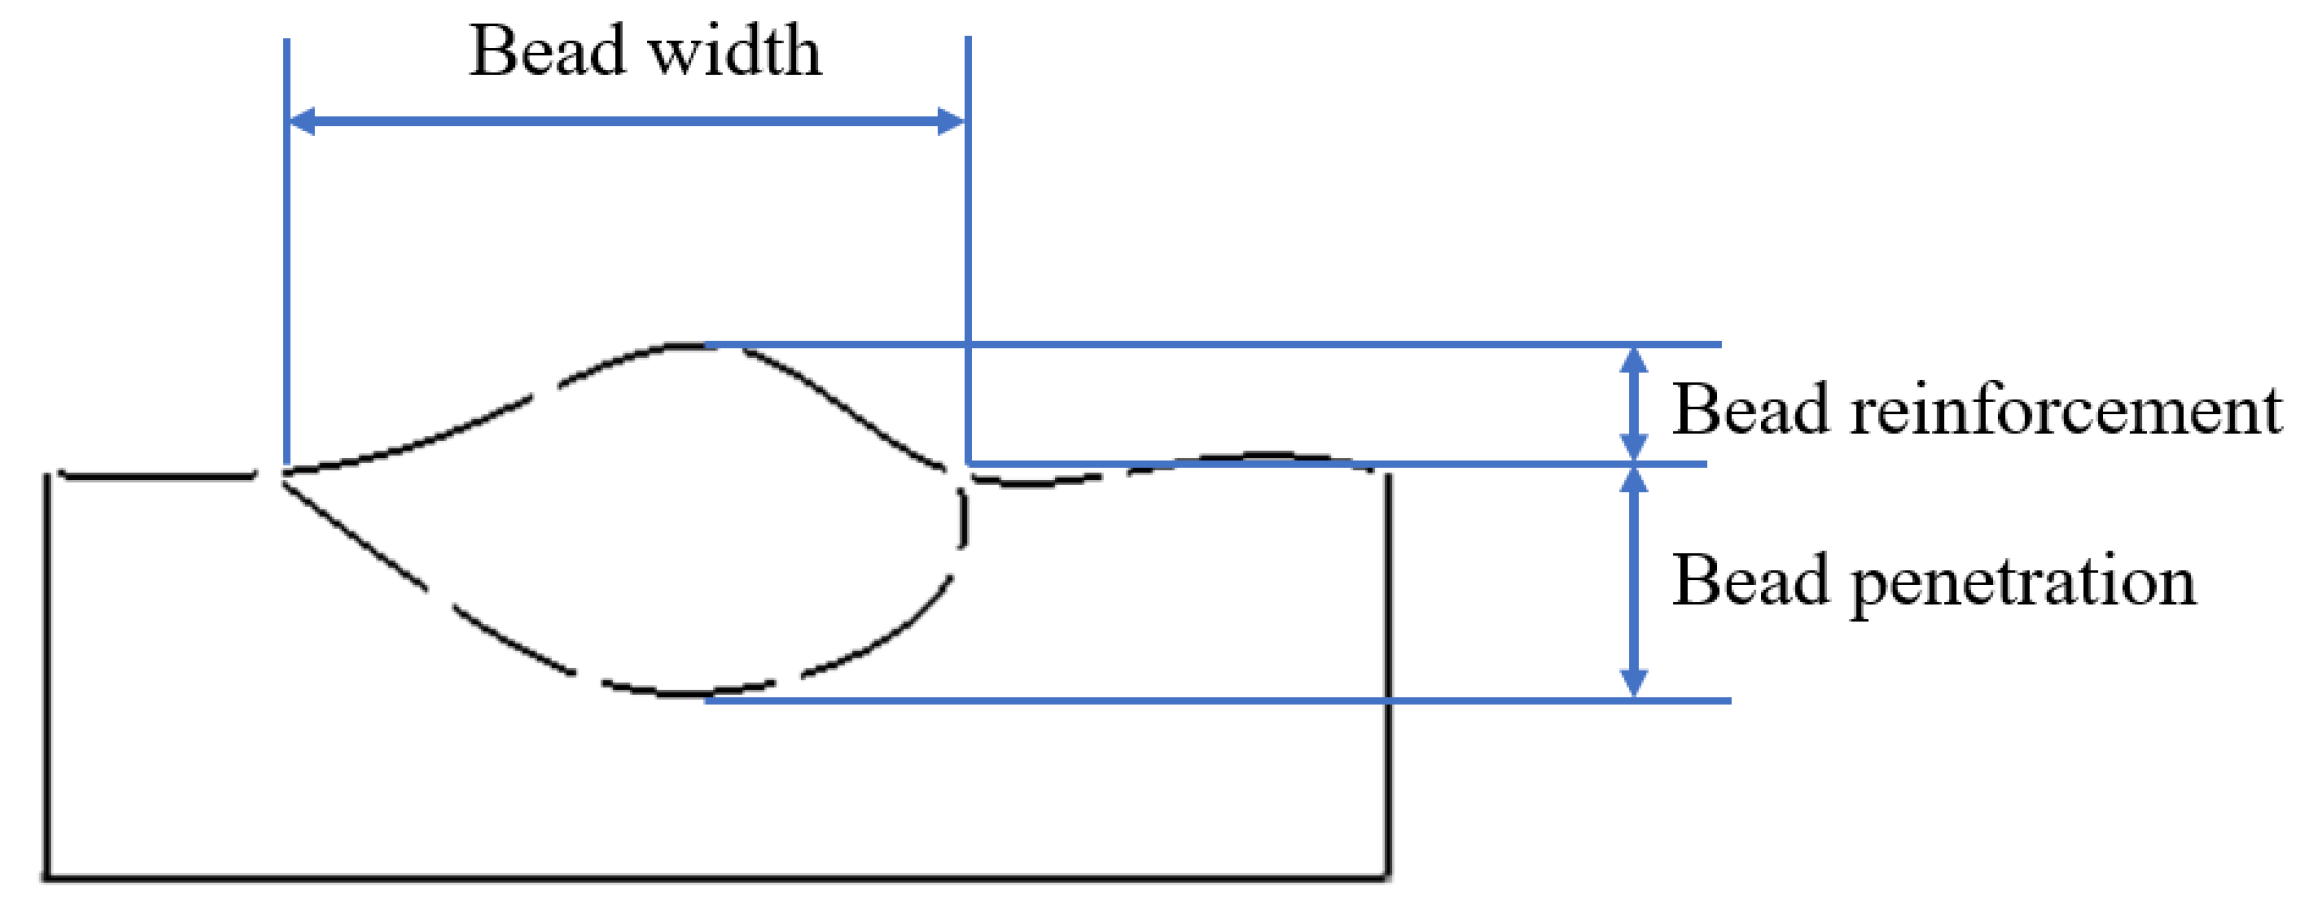
| Number | A | B | C | D | E | KS (mm) | RS (mm) | PS (mm) |
|---|---|---|---|---|---|---|---|---|
| 1 | 60 | 3.0 | 70 | 4.0 | 3.0 | 9.6 | 1.0 | 1.4 |
| 2 | 90 | 1.2 | 70 | 2.6 | 3.0 | 10.9 | 1.5 | 1.3 |
| 3 | 60 | 1.2 | 120 | 2.6 | 3.0 | 9.3 | 2.0 | 1.3 |
| 4 | 60 | 3.0 | 120 | 4.0 | 1.0 | 9.0 | 0.8 | 1.5 |
| 5 | 90 | 3.0 | 120 | 4.0 | 3.0 | 8.1 | 1.1 | 1.6 |
| 6 | 90 | 1.2 | 70 | 4.0 | 1.0 | 8.0 | 1.8 | 1.5 |
| 7 | 90 | 3.0 | 70 | 2.6 | 3.0 | 9.3 | 1.0 | 1.4 |
| 8 | 60 | 1.2 | 120 | 2.6 | 1.0 | 11.3 | 1.5 | 1.3 |
| 9 | 60 | 3.0 | 70 | 4.0 | 1.0 | 9.0 | 2.0 | 1.4 |
| 10 | 90 | 1.2 | 120 | 2.6 | 3.0 | 7.8 | 1.0 | 1.7 |
| 11 | 60 | 1.2 | 120 | 4.0 | 3.0 | 10.2 | 1.3 | 2.5 |
| 12 | 90 | 3.0 | 120 | 4.0 | 1.0 | 7.7 | 1.4 | 1.9 |
| 13 | 60 | 3.0 | 120 | 2.6 | 1.0 | 7.4 | 1.2 | 2.2 |
| 14 | 90 | 3.0 | 120 | 2.6 | 1.0 | 8.9 | 1.7 | 2.2 |
| 15 | 60 | 3.0 | 70 | 2.6 | 3.0 | 11.3 | 1.6 | 1.7 |
| 16 | 90 | 1.2 | 120 | 4.0 | 3.0 | 8.5 | 1.0 | 2.2 |
| 17 | 60 | 3.0 | 70 | 2.6 | 1.0 | 8.5 | 1.3 | 2.3 |
| 18 | 90 | 3.0 | 70 | 2.6 | 1.0 | 9.7 | 1.6 | 1.8 |
| 19 | 60 | 1.2 | 70 | 4.0 | 3.0 | 9.4 | 1.4 | 2.2 |
| 20 | 90 | 1.2 | 70 | 4.0 | 3.0 | 10.9 | 1.3 | 1.6 |
| 21 | 60 | 1.2 | 70 | 2.6 | 3.0 | 7.4 | 1.8 | 2.0 |
| 22 | 90 | 1.2 | 120 | 4.0 | 1.0 | 9.4 | 1.2 | 2.6 |
| 23 | 60 | 1.2 | 70 | 2.6 | 1.0 | 8.5 | 0.9 | 2.2 |
| 24 | 60 | 3.0 | 120 | 4.0 | 3.0 | 10.1 | 1.6 | 2.1 |
| 25 | 60 | 1.2 | 70 | 4.0 | 1.0 | 10.0 | 1.4 | 2.4 |
| 26 | 90 | 3.0 | 70 | 4.0 | 3.0 | 11.0 | 1.5 | 2.3 |
| 27 | 60 | 3.0 | 120 | 2.6 | 3.0 | 10.6 | 2.0 | 2.3 |
| 28 | 90 | 3.0 | 70 | 4.0 | 1.0 | 10.2 | 0.8 | 2.4 |
| 29 | 90 | 1.2 | 70 | 2.6 | 1.0 | 8.5 | 1.1 | 2.6 |
| 30 | 60 | 1.2 | 120 | 4.0 | 1.0 | 9.7 | 1.8 | 2.4 |
| 31 | 90 | 3.0 | 120 | 2.6 | 3.0 | 9.9 | 1.0 | 2.9 |
| 32 | 90 | 1.2 | 120 | 2.6 | 1.0 | 8.9 | 0.6 | 2.6 |
| Parameter | Unit | Notation | Minimum Value (−) | Maximum Value (+) |
|---|---|---|---|---|
| Welding speed | cm/min | a | 25 | 45 |
| Arc voltage | V | b | 26 | 30 |
| Wire feed rate | m/min | c | 6 | 7 |
| Gas flow rate | L/min | d | 14 | 18 |
| Nozzle-to-plate distance | mm | e | 15 | 20 |
| Torch angle | degree | f | 70 | 100 |
| Number | a | b | c | d | e | f | KM (mm) | RM (mm) | PM (mm) |
|---|---|---|---|---|---|---|---|---|---|
| 1 | 45 | 30 | 6 | 18 | 20 | 100 | 9.2 | 2.4 | 1.8 |
| 2 | 25 | 30 | 6 | 18 | 15 | 70 | 11.6 | 3.4 | 2.5 |
| 3 | 45 | 26 | 7 | 18 | 20 | 70 | 7.6 | 3.4 | 2.0 |
| 4 | 25 | 26 | 7 | 14 | 20 | 100 | 9.4 | 3.9 | 1.9 |
| 5 | 45 | 30 | 6 | 14 | 20 | 100 | 9.2 | 2.4 | 1.7 |
| 6 | 45 | 30 | 7 | 18 | 20 | 100 | 9.8 | 2.6 | 2.0 |
| 7 | 25 | 26 | 7 | 18 | 15 | 100 | 9.8 | 3.8 | 2.0 |
| 8 | 45 | 30 | 7 | 18 | 15 | 100 | 10.1 | 2.5 | 2.1 |
| 9 | 25 | 26 | 6 | 14 | 20 | 70 | 8.8 | 4.0 | 2.0 |
| 10 | 45 | 30 | 6 | 14 | 15 | 70 | 9.4 | 2.6 | 2.1 |
| 11 | 25 | 30 | 6 | 14 | 20 | 70 | 11.2 | 3.5 | 2.4 |
| 12 | 45 | 30 | 7 | 18 | 20 | 70 | 9.7 | 2.9 | 2.4 |
| 13 | 45 | 30 | 6 | 14 | 20 | 70 | 9.1 | 2.7 | 2.1 |
| 14 | 25 | 26 | 7 | 18 | 15 | 70 | 9.7 | 4.1 | 2.4 |
| 15 | 25 | 26 | 6 | 18 | 20 | 70 | 8.9 | 4.0 | 2.1 |
| 16 | 45 | 26 | 7 | 14 | 20 | 100 | 7.6 | 3.2 | 1.6 |
| 17 | 25 | 30 | 7 | 14 | 20 | 70 | 11.9 | 3.6 | 2.7 |
| 18 | 25 | 26 | 6 | 14 | 15 | 100 | 9.1 | 3.7 | 1.7 |
| 19 | 25 | 30 | 7 | 14 | 15 | 100 | 12.4 | 3.2 | 2.3 |
| 20 | 45 | 30 | 7 | 18 | 15 | 70 | 10.0 | 2.8 | 2.5 |
| 21 | 45 | 26 | 6 | 18 | 20 | 70 | 7.2 | 3.3 | 1.8 |
| 22 | 45 | 26 | 7 | 14 | 15 | 100 | 7.9 | 3.1 | 1.6 |
| 23 | 25 | 26 | 7 | 14 | 20 | 70 | 9.3 | 4.2 | 2.3 |
| 24 | 45 | 26 | 7 | 18 | 15 | 100 | 7.9 | 3.0 | 1.7 |
| 25 | 25 | 30 | 7 | 14 | 15 | 70 | 12.3 | 3.5 | 2.7 |
| 26 | 25 | 30 | 7 | 18 | 20 | 100 | 12.1 | 3.3 | 2.3 |
| 27 | 25 | 30 | 7 | 18 | 20 | 70 | 12.0 | 3.6 | 2.7 |
| 28 | 45 | 26 | 7 | 18 | 20 | 100 | 7.7 | 3.1 | 1.7 |
| 29 | 45 | 26 | 6 | 14 | 15 | 100 | 7.4 | 2.9 | 1.4 |
| 30 | 25 | 26 | 7 | 14 | 15 | 70 | 9.6 | 4.1 | 2.3 |
| 31 | 45 | 26 | 6 | 14 | 15 | 70 | 7.3 | 3.2 | 1.7 |
| 32 | 45 | 30 | 7 | 14 | 15 | 100 | 10.0 | 2.5 | 2.0 |
| 33 | 25 | 30 | 7 | 18 | 15 | 70 | 12.3 | 3.5 | 2.8 |
| 34 | 45 | 26 | 7 | 18 | 15 | 70 | 7.8 | 3.3 | 2.1 |
| 35 | 25 | 26 | 7 | 14 | 15 | 100 | 9.7 | 3.8 | 1.9 |
| 36 | 45 | 30 | 7 | 14 | 15 | 70 | 9.9 | 2.8 | 2.4 |
| 37 | 45 | 26 | 6 | 18 | 15 | 100 | 7.4 | 2.9 | 1.4 |
| 38 | 45 | 30 | 6 | 18 | 15 | 100 | 9.5 | 2.3 | 1.8 |
| 39 | 25 | 30 | 7 | 14 | 20 | 100 | 12.0 | 3.3 | 2.3 |
| 40 | 45 | 26 | 6 | 18 | 20 | 100 | 7.2 | 3.0 | 1.4 |
| 41 | 25 | 26 | 7 | 18 | 20 | 70 | 9.4 | 4.2 | 2.4 |
| 42 | 45 | 26 | 7 | 14 | 20 | 70 | 7.6 | 3.5 | 2.0 |
| 43 | 25 | 26 | 6 | 14 | 15 | 70 | 9.0 | 4.0 | 2.1 |
| 44 | 25 | 30 | 6 | 18 | 15 | 100 | 11.7 | 3.1 | 2.1 |
| 45 | 45 | 30 | 6 | 18 | 20 | 70 | 9.2 | 2.7 | 2.2 |
| 46 | 25 | 30 | 6 | 18 | 20 | 100 | 11.4 | 3.2 | 2.1 |
| 47 | 25 | 26 | 7 | 18 | 20 | 100 | 9.5 | 3.9 | 2.0 |
| 48 | 45 | 26 | 6 | 14 | 20 | 100 | 7.2 | 3.0 | 1.3 |
| 49 | 25 | 26 | 6 | 18 | 15 | 100 | 9.2 | 3.6 | 1.7 |
| 50 | 45 | 26 | 6 | 14 | 20 | 70 | 7.1 | 3.3 | 1.7 |
| 51 | 25 | 26 | 6 | 18 | 20 | 100 | 8.9 | 3.7 | 1.7 |
| 52 | 25 | 30 | 6 | 18 | 20 | 70 | 11.3 | 3.5 | 2.5 |
| 53 | 25 | 26 | 6 | 18 | 15 | 70 | 9.1 | 3.9 | 2.1 |
| 54 | 45 | 26 | 7 | 14 | 15 | 70 | 7.8 | 3.4 | 2.0 |
| 55 | 25 | 30 | 6 | 14 | 15 | 100 | 11.6 | 3.1 | 2.0 |
| 56 | 45 | 30 | 6 | 14 | 15 | 100 | 9.4 | 2.3 | 1.7 |
| 57 | 25 | 30 | 7 | 18 | 15 | 100 | 12.5 | 3.2 | 2.4 |
| 58 | 45 | 30 | 7 | 14 | 20 | 100 | 9.8 | 2.6 | 2.0 |
| 59 | 45 | 30 | 6 | 18 | 15 | 70 | 9.4 | 2.6 | 2.2 |
| 60 | 45 | 26 | 6 | 18 | 15 | 70 | 7.4 | 3.2 | 1.8 |
| 61 | 25 | 30 | 6 | 14 | 15 | 70 | 11.6 | 3.4 | 2.4 |
| 62 | 45 | 30 | 7 | 14 | 20 | 70 | 9.7 | 2.9 | 2.4 |
| 63 | 25 | 26 | 6 | 14 | 20 | 100 | 8.9 | 3.7 | 1.6 |
| 64 | 25 | 30 | 6 | 14 | 20 | 100 | 11.3 | 3.2 | 2.0 |
| Parameter | Unit | Notation | Minimum Value (−) | Maximum Value (+) |
|---|---|---|---|---|
| Welding speed | cm/min | M | 24 | 46 |
| Wire feed rate | cm/min | N | 1.5 | 2.5 |
| % cleaning | O | 30 | 70 | |
| Joint gap | mm | P | 2.4 | 3.2 |
| Welding current | A | Q | 80 | 110 |
| Number | M | N | O | P | Q | KT (mm) | RT (mm) | PT (mm) |
|---|---|---|---|---|---|---|---|---|
| 1 | 46 | 1.5 | 30 | 2.4 | 110 | 6.1 | 0.8 | 2.6 |
| 2 | 46 | 2.5 | 70 | 3.2 | 80 | 5.3 | 1.4 | 1.4 |
| 3 | 24 | 2.5 | 30 | 3.2 | 110 | 12.3 | 0.4 | 2.1 |
| 4 | 46 | 1.5 | 30 | 3.2 | 110 | 7.3 | 0.7 | 1.6 |
| 5 | 24 | 1.5 | 70 | 3.2 | 110 | 12.9 | 0.3 | 1.9 |
| 6 | 24 | 2.5 | 30 | 2.4 | 80 | 6.7 | 1.2 | 1.7 |
| 7 | 46 | 2.5 | 70 | 2.4 | 110 | 7.0 | 0.8 | 1.7 |
| 8 | 46 | 1.5 | 70 | 2.4 | 110 | 7.7 | 0.8 | 1.5 |
| 9 | 46 | 2.5 | 70 | 3.2 | 110 | 7.8 | 0.6 | 1.8 |
| 10 | 24 | 1.5 | 30 | 2.4 | 110 | 11.3 | 0.4 | 1.8 |
| 11 | 46 | 1.5 | 30 | 2.4 | 80 | 5.0 | 1.4 | 1.0 |
| 12 | 46 | 1.5 | 70 | 3.2 | 110 | 7.6 | 0.6 | 1.5 |
| 13 | 24 | 1.5 | 70 | 2.4 | 80 | 7.4 | 0.8 | 1.6 |
| 14 | 46 | 2.5 | 30 | 2.4 | 110 | 6.4 | 1.0 | 1.5 |
| 15 | 24 | 1.5 | 30 | 2.4 | 80 | 6.1 | 0.9 | 1.7 |
| 16 | 24 | 2.5 | 70 | 2.4 | 110 | 11.8 | 0.4 | 2.1 |
| 17 | 24 | 1.5 | 70 | 3.2 | 80 | 7.3 | 0.7 | 1.6 |
| 18 | 46 | 2.5 | 30 | 3.2 | 80 | 5.0 | 1.5 | 1.1 |
| 19 | 24 | 2.5 | 30 | 3.2 | 80 | 6.8 | 1.1 | 1.8 |
| 20 | 46 | 1.5 | 70 | 2.4 | 80 | 5.0 | 1.1 | 1.3 |
| 21 | 24 | 2.5 | 70 | 2.4 | 80 | 7.0 | 0.9 | 1.9 |
| 22 | 24 | 1.5 | 30 | 3.2 | 110 | 11.5 | 0.3 | 2.1 |
| 23 | 24 | 2.5 | 70 | 3.2 | 80 | 7.5 | 0.9 | 1.8 |
| 24 | 46 | 2.5 | 70 | 2.4 | 80 | 5.2 | 1.4 | 1.4 |
| 25 | 46 | 1.5 | 70 | 3.2 | 80 | 4.4 | 1.1 | 1.4 |
| 26 | 24 | 2.5 | 30 | 2.4 | 110 | 9.3 | 0.8 | 1.9 |
| 27 | 46 | 1.5 | 30 | 3.2 | 80 | 4.9 | 1.2 | 1.3 |
| 28 | 24 | 2.5 | 70 | 3.2 | 110 | 12.5 | 0.4 | 2.1 |
| 29 | 24 | 1.5 | 30 | 3.2 | 80 | 6.4 | 1.0 | 1.4 |
| 30 | 46 | 2.5 | 30 | 3.2 | 110 | 6.9 | 1.1 | 1.5 |
| 31 | 24 | 1.5 | 70 | 2.4 | 110 | 11.2 | 0.7 | 1.5 |
| 32 | 46 | 2.5 | 30 | 2.4 | 80 | 4.8 | 1.4 | 1.1 |
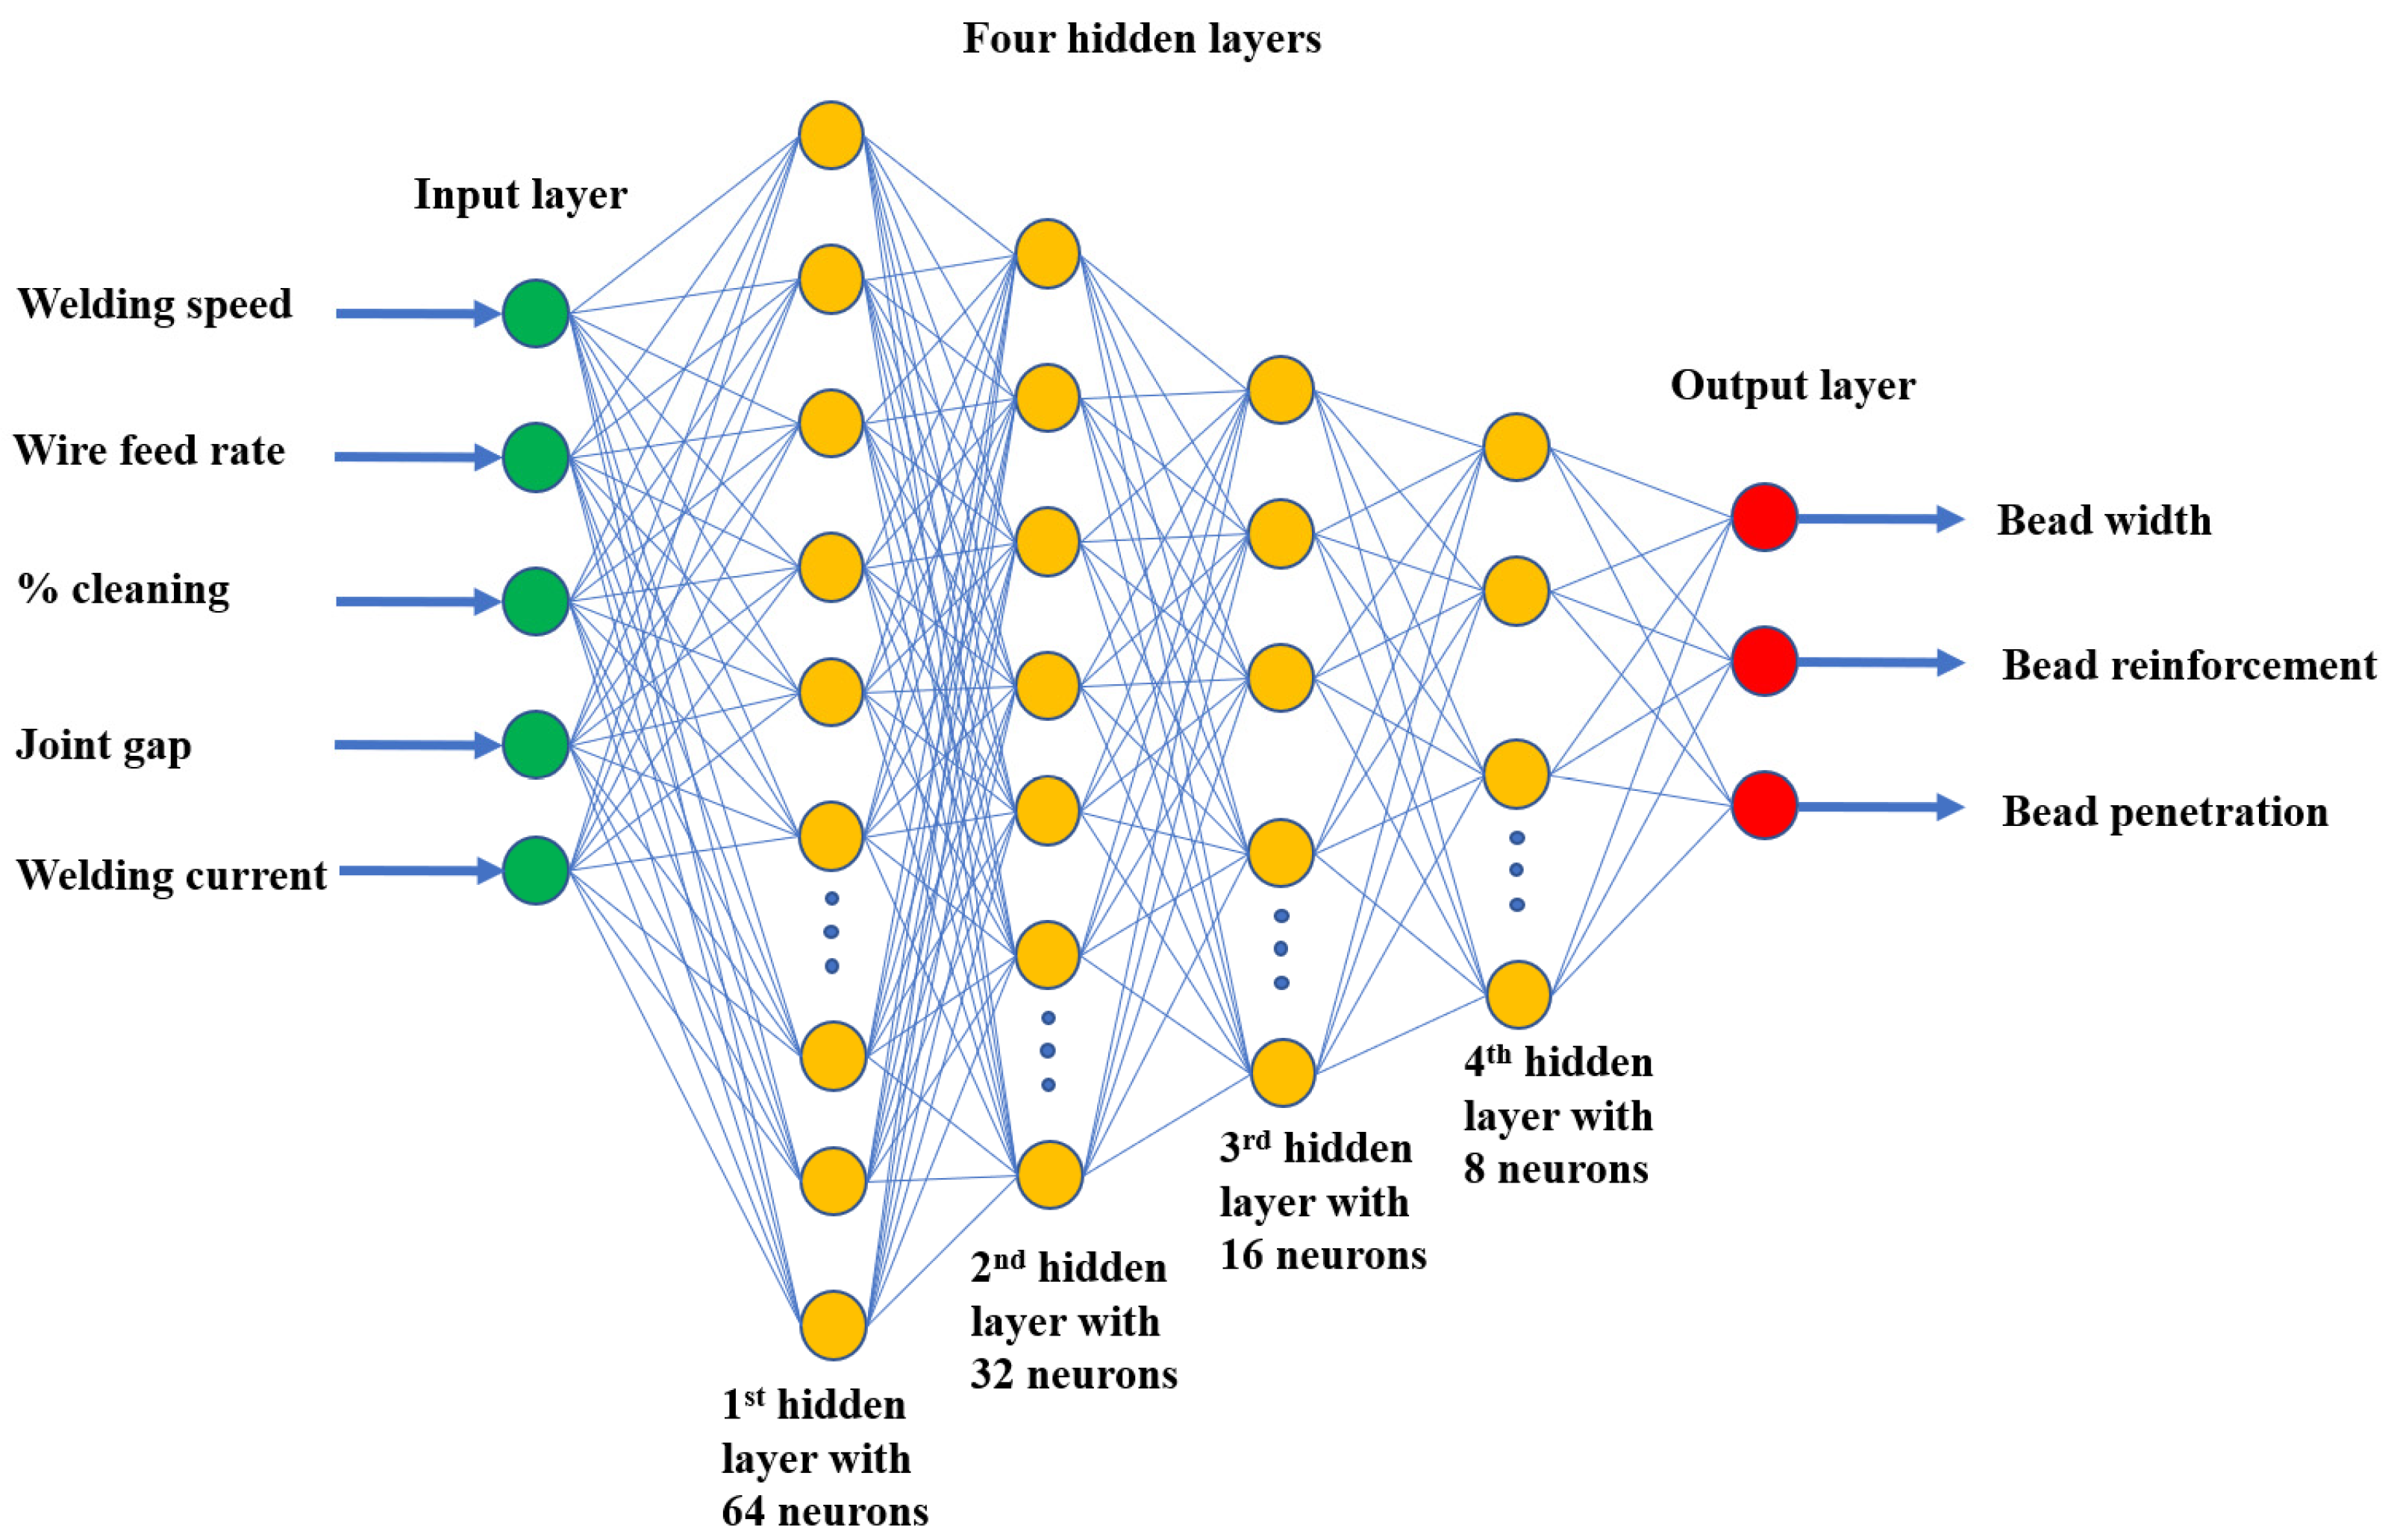
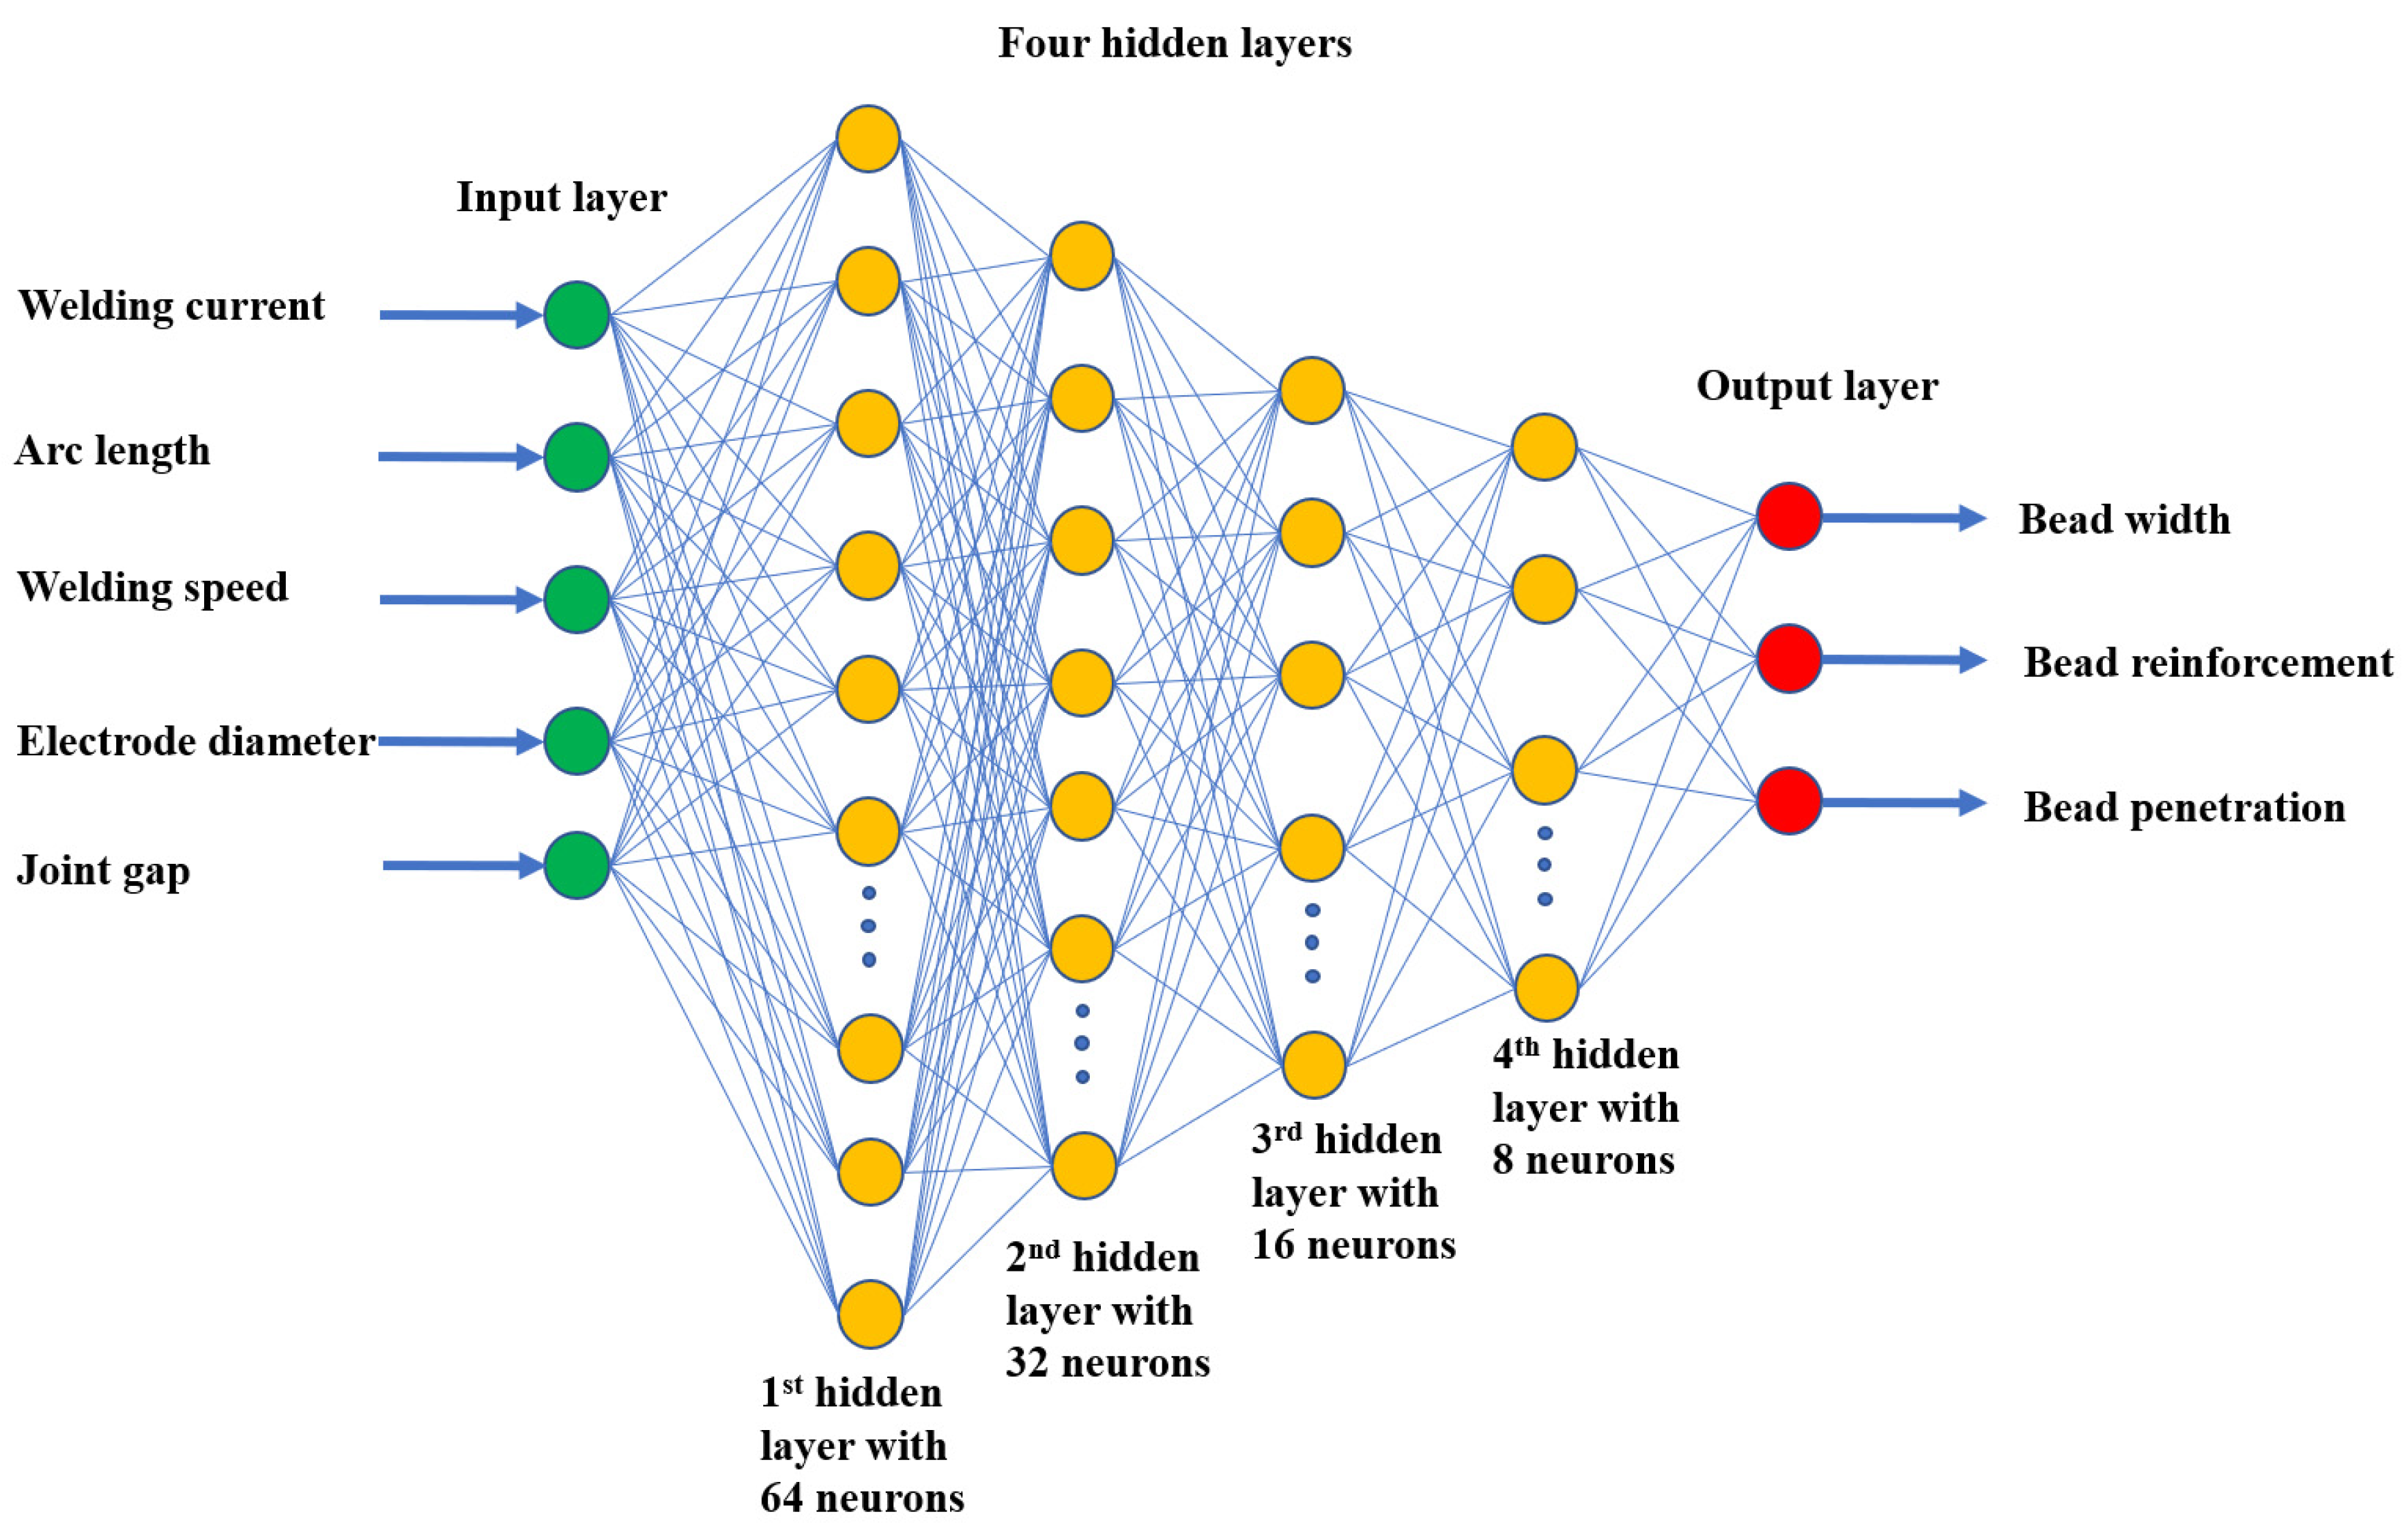
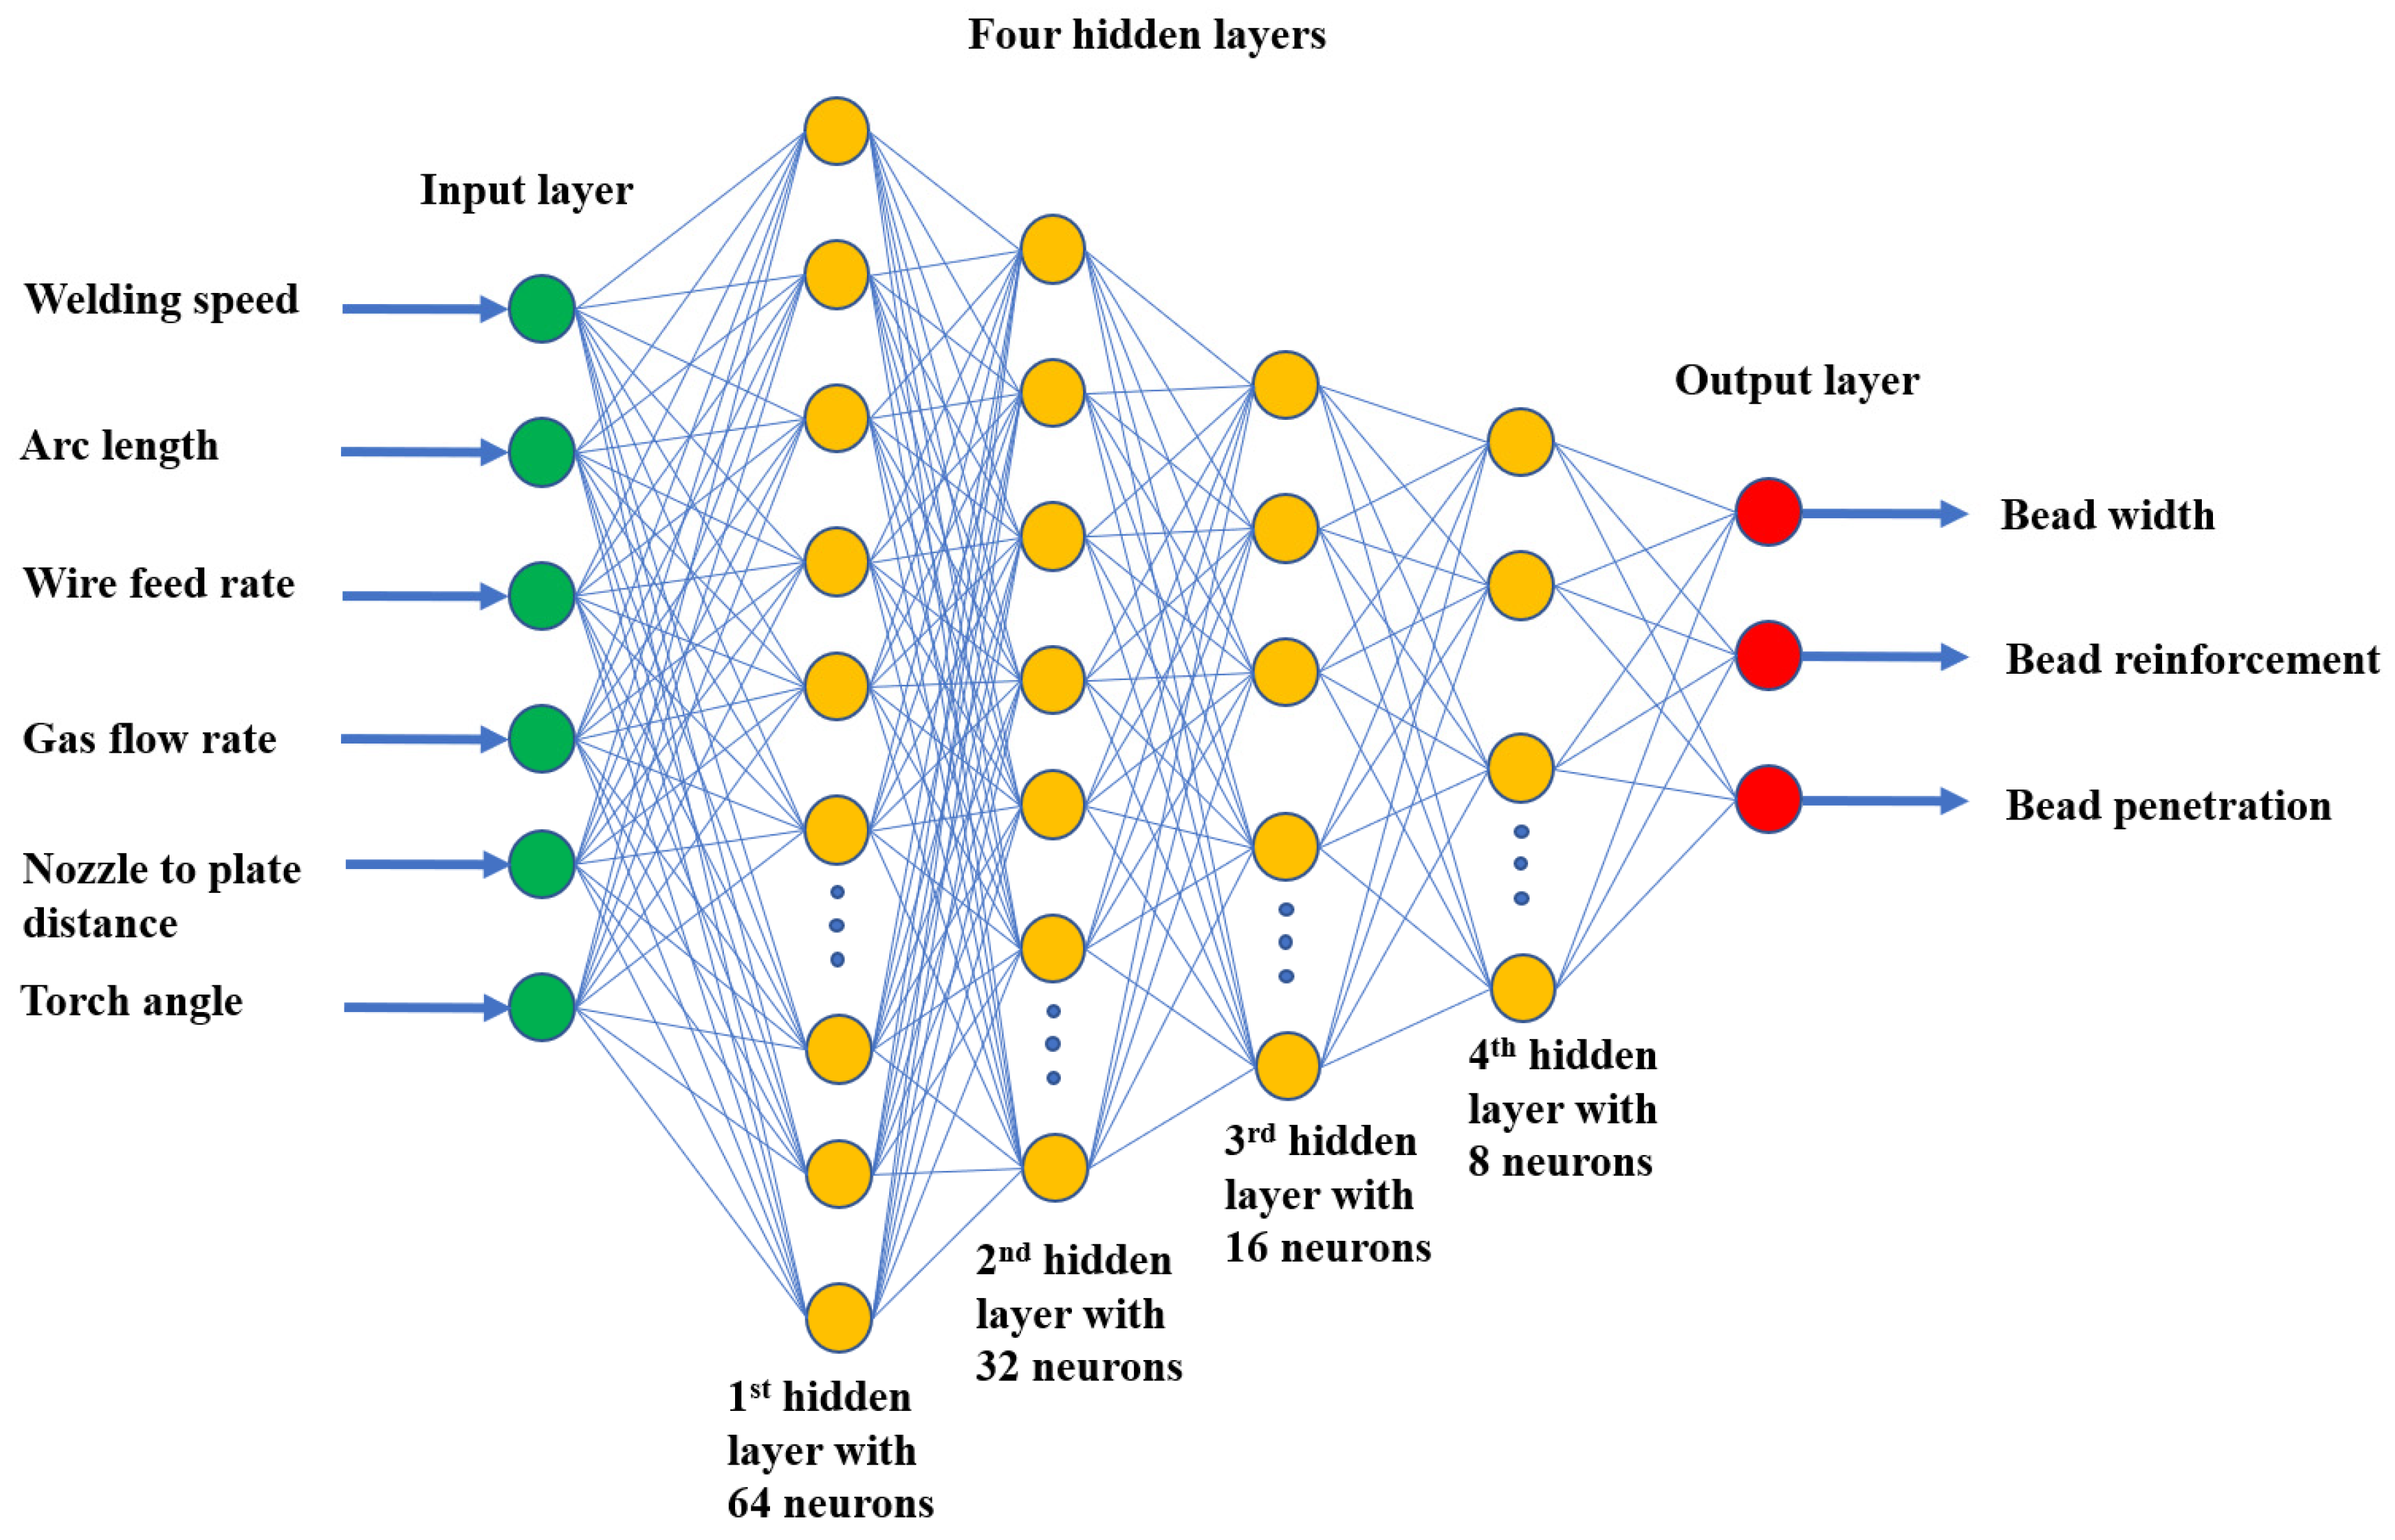
2.4. Modeling of Artificial Intelligence-Based Predictive System
| Layer | Layer (Type) | Output Shape | Activation | Param # |
|---|---|---|---|---|
| Input | Dense | 5 | ||
| Hidden | dense (Dense) | (None, 64) | ReLU | 448 |
| dense_1 (Dense) | (None, 32) | ReLU | 2080 | |
| dense_2 (Dense) | (None, 16) | ReLU | 528 | |
| dense_3 (Dense) | (None, 8) | ReLU | 136 | |
| Output | dense_4 (Dense) | (None, 3) | Linear | 27 |
3. Results and Discussions
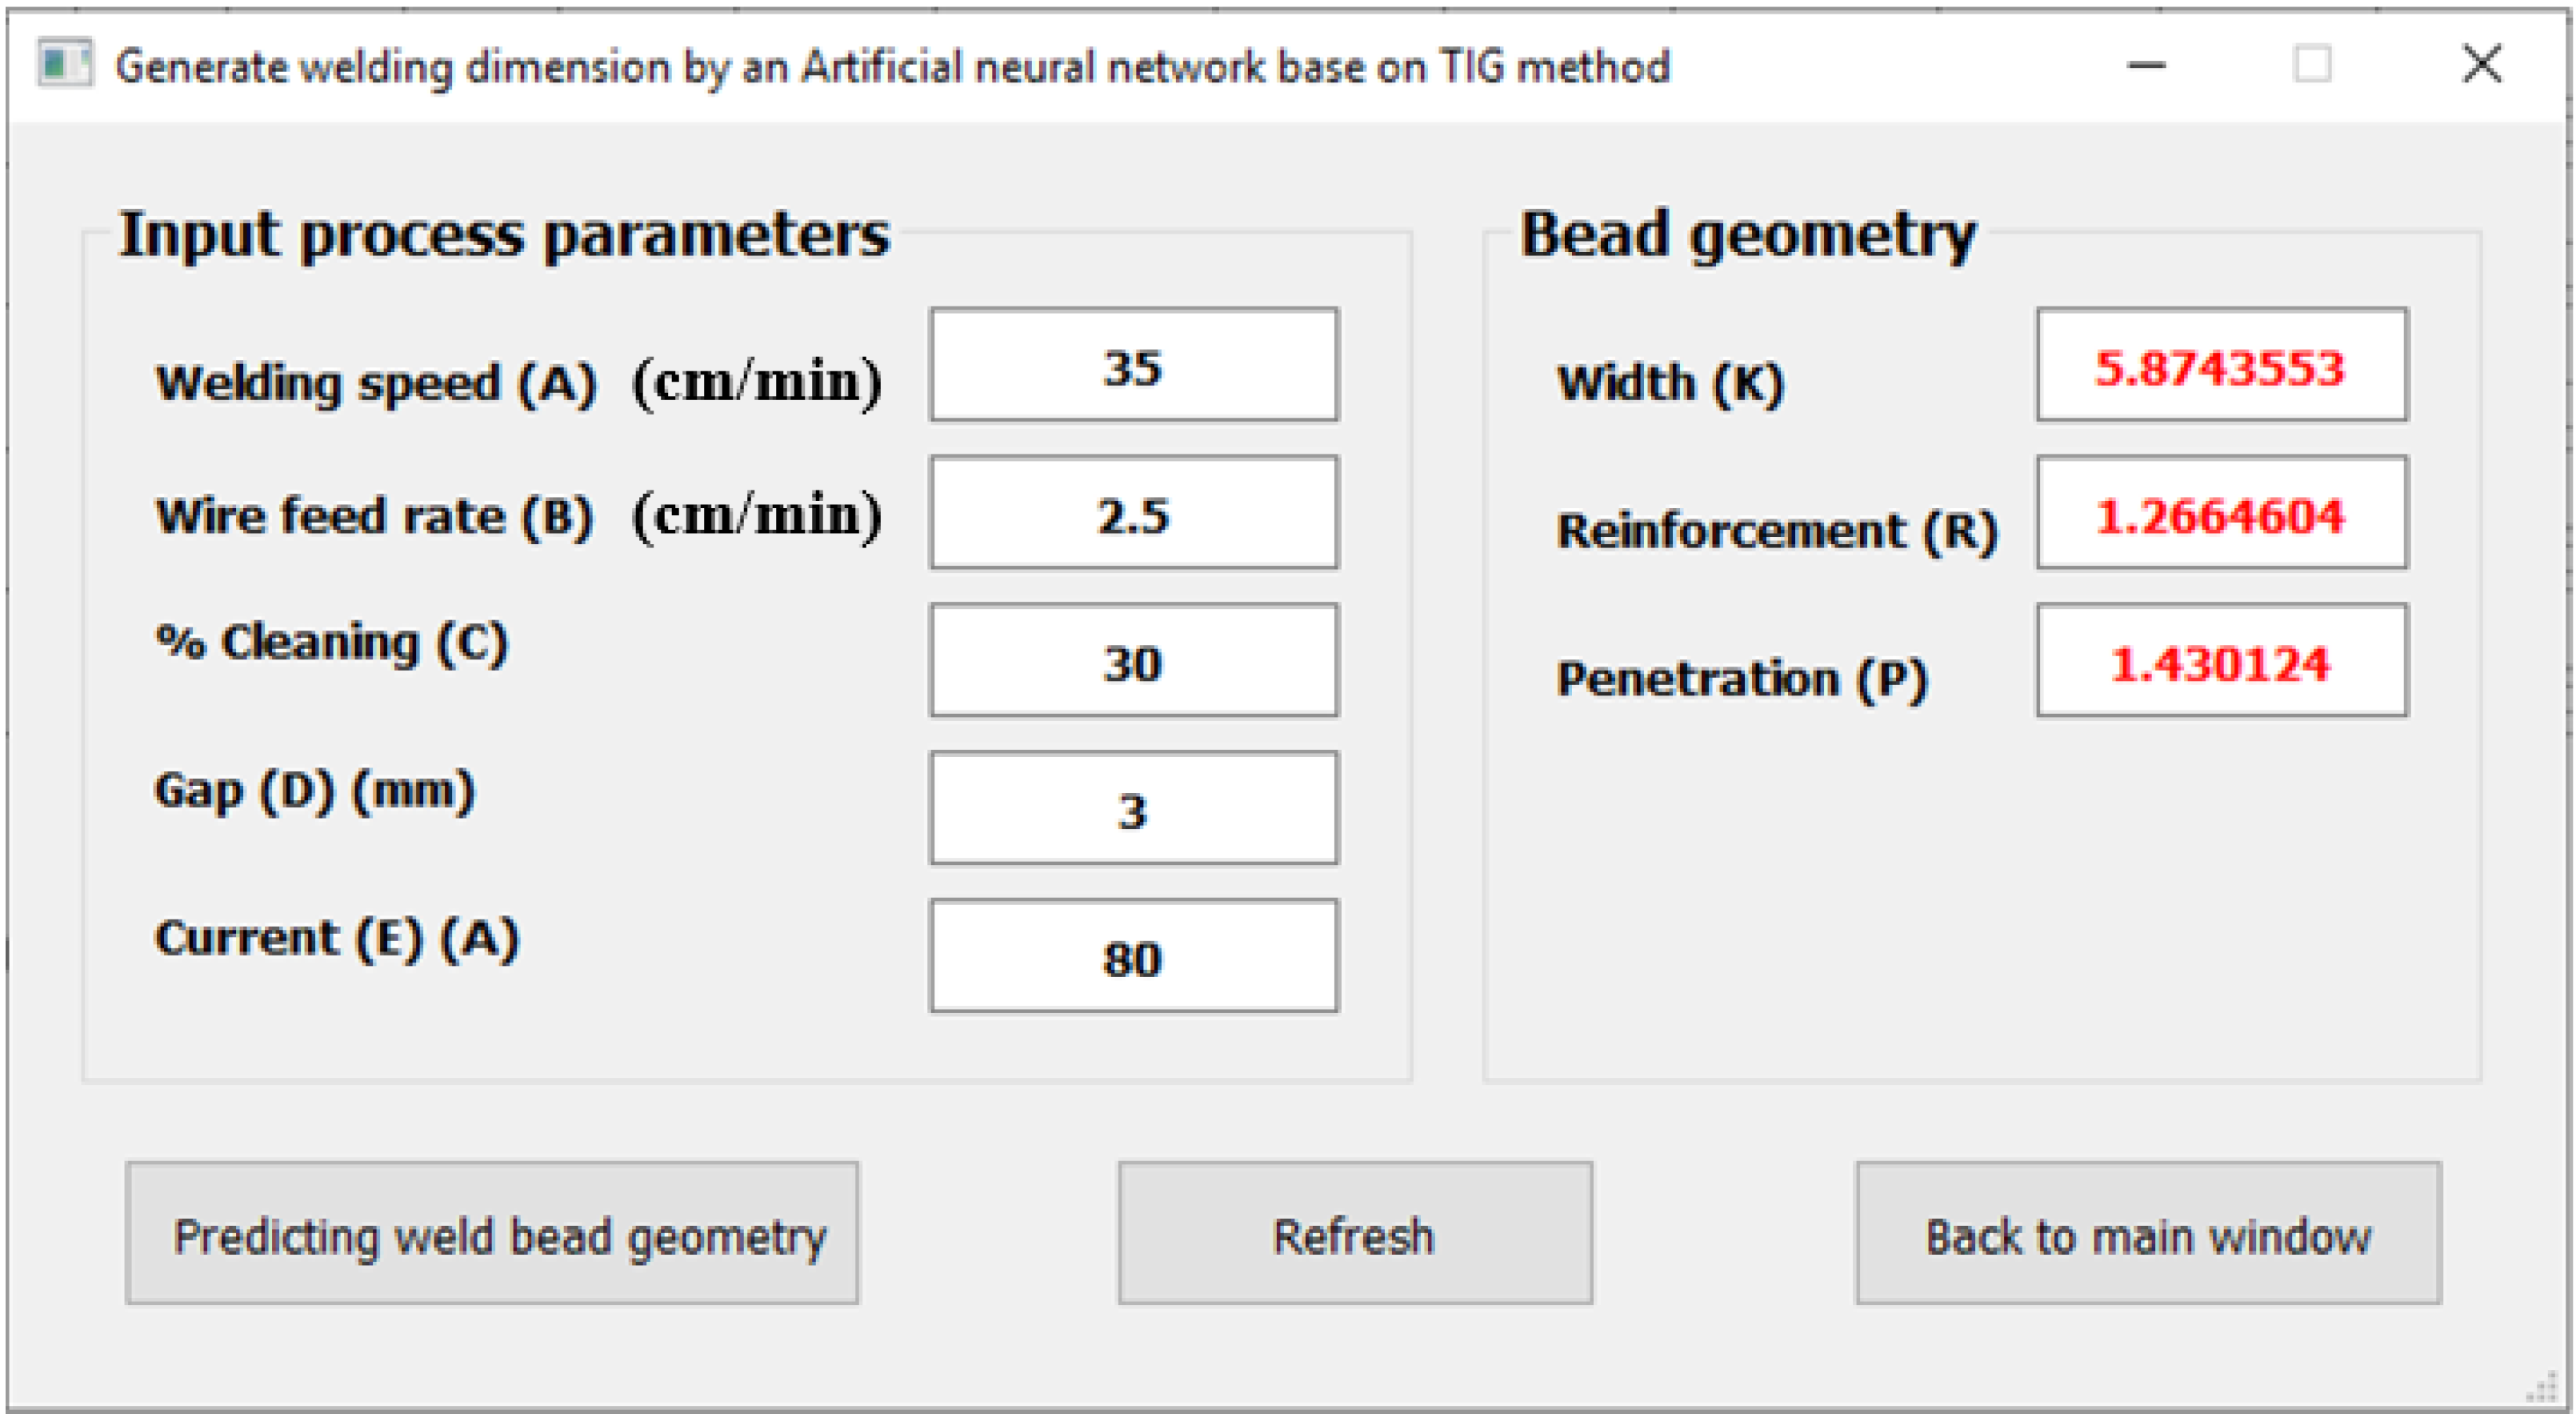
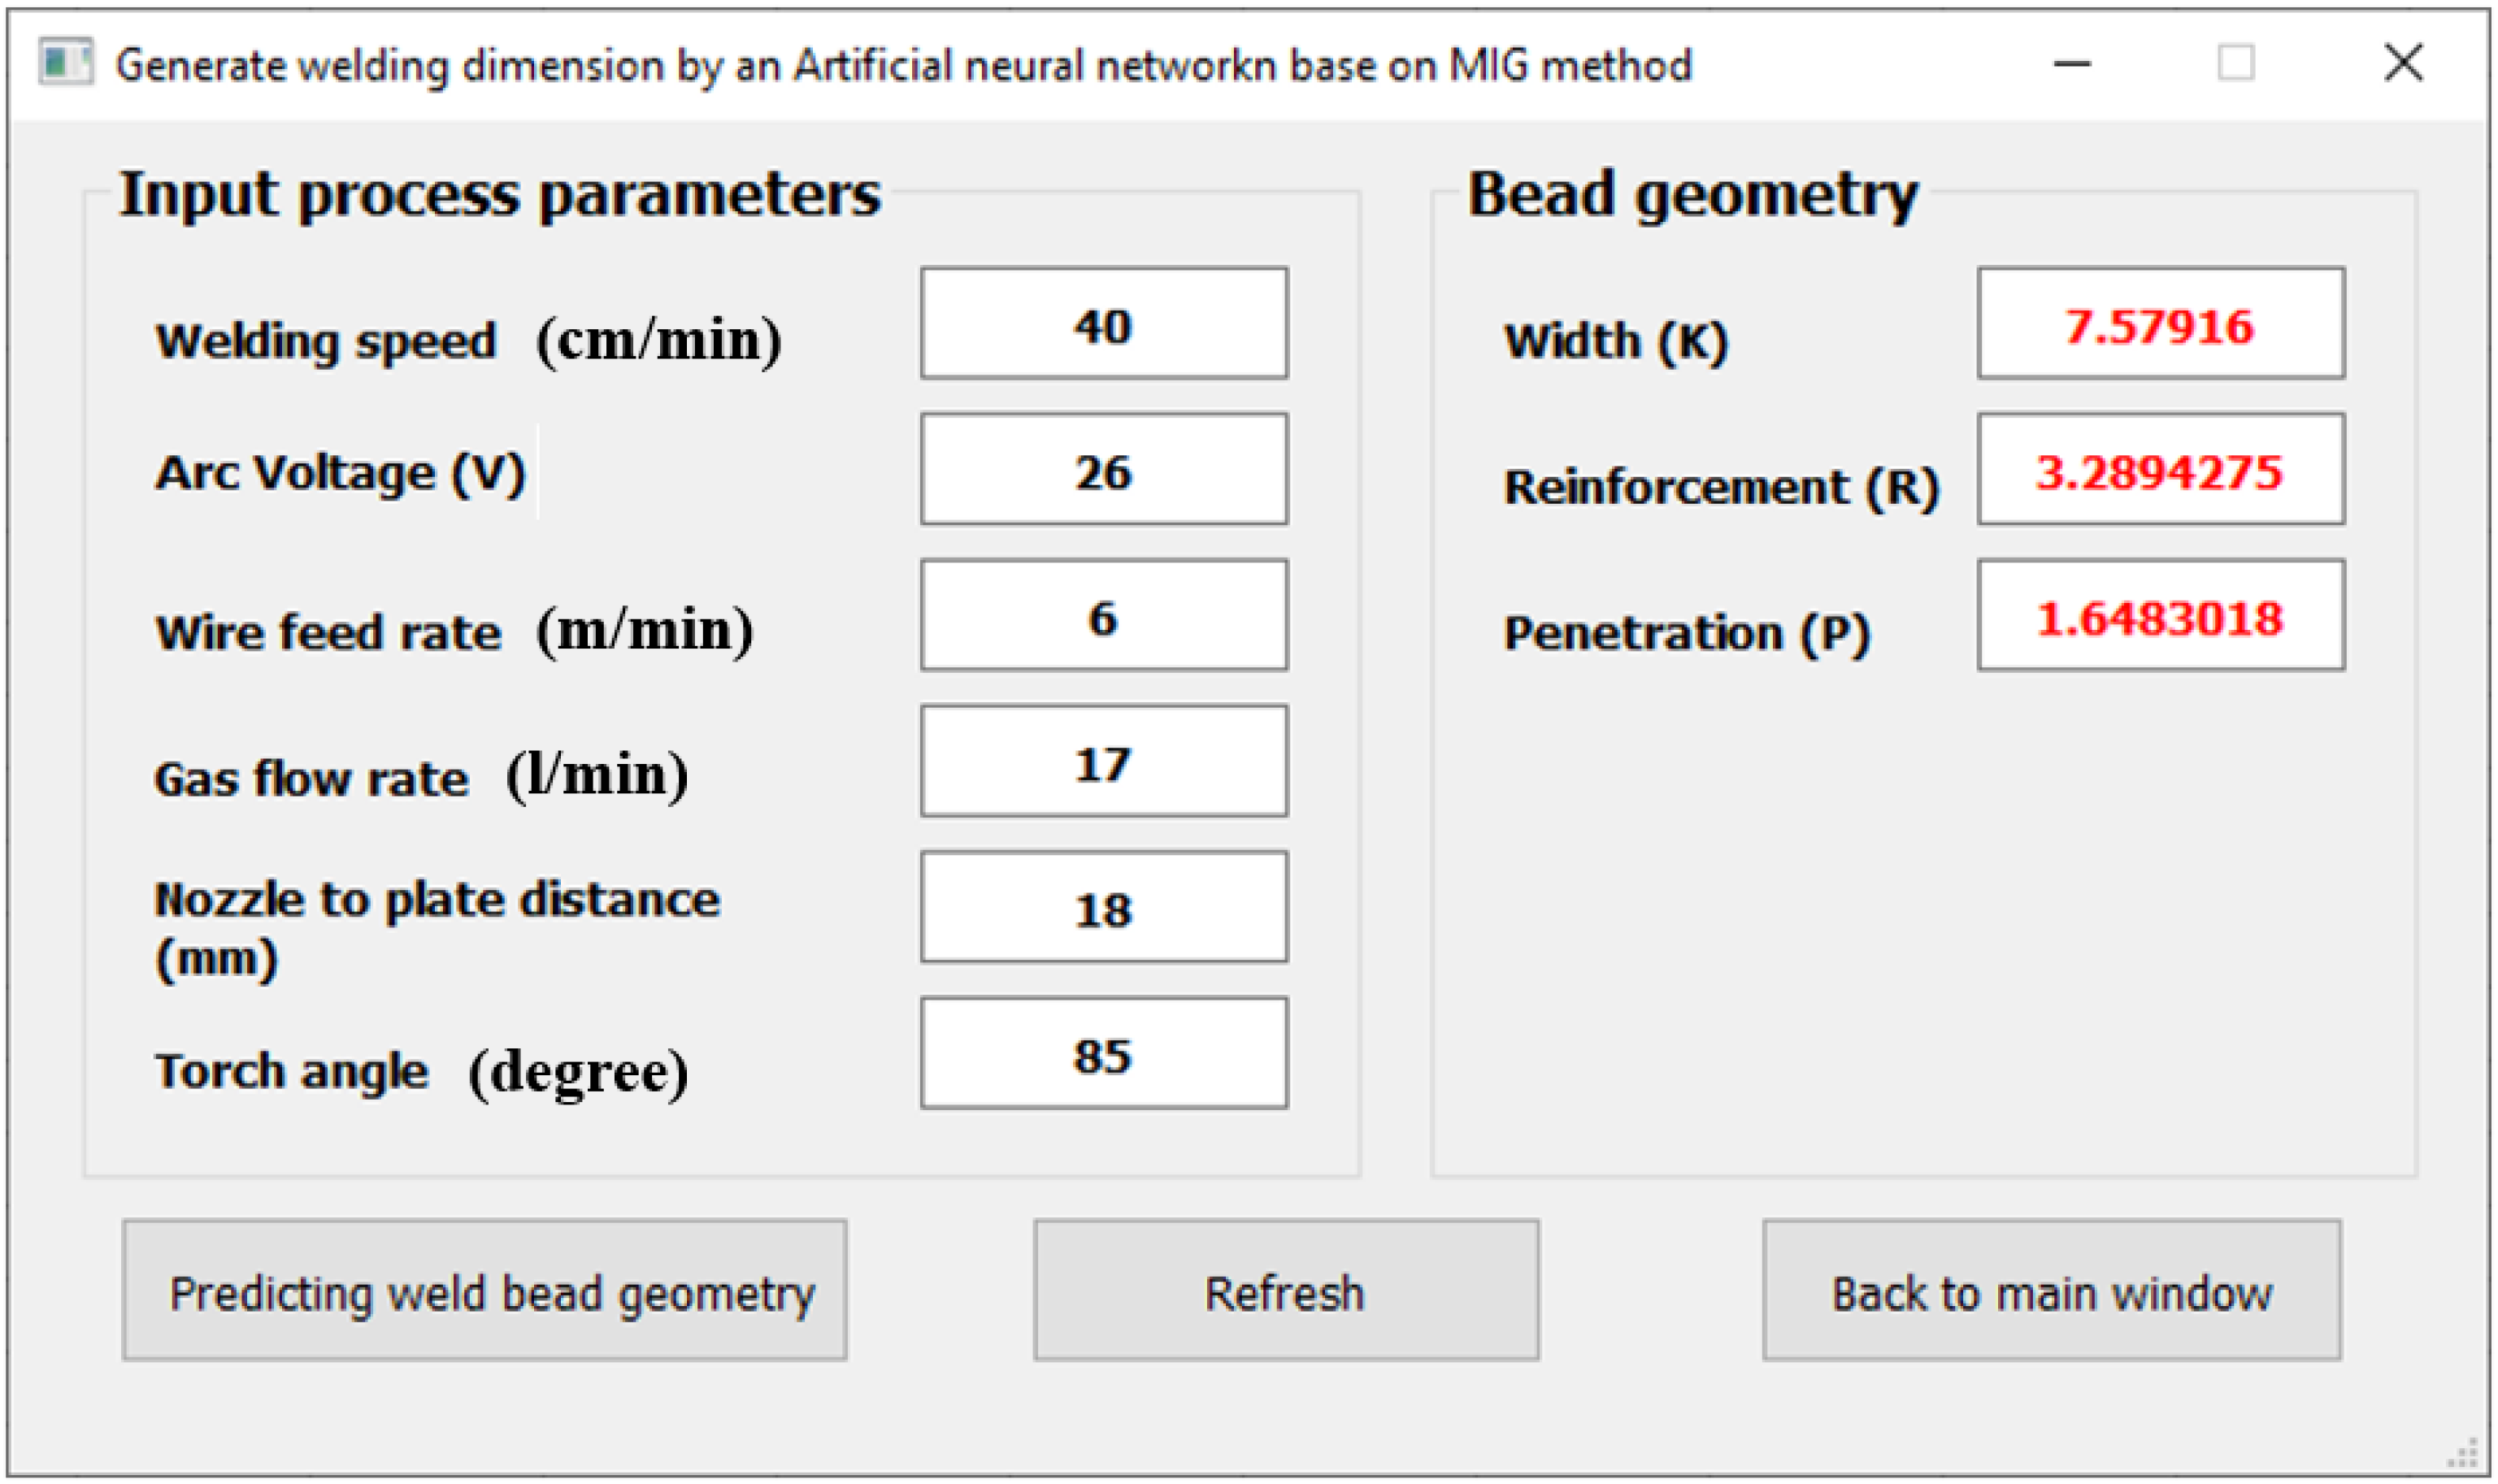
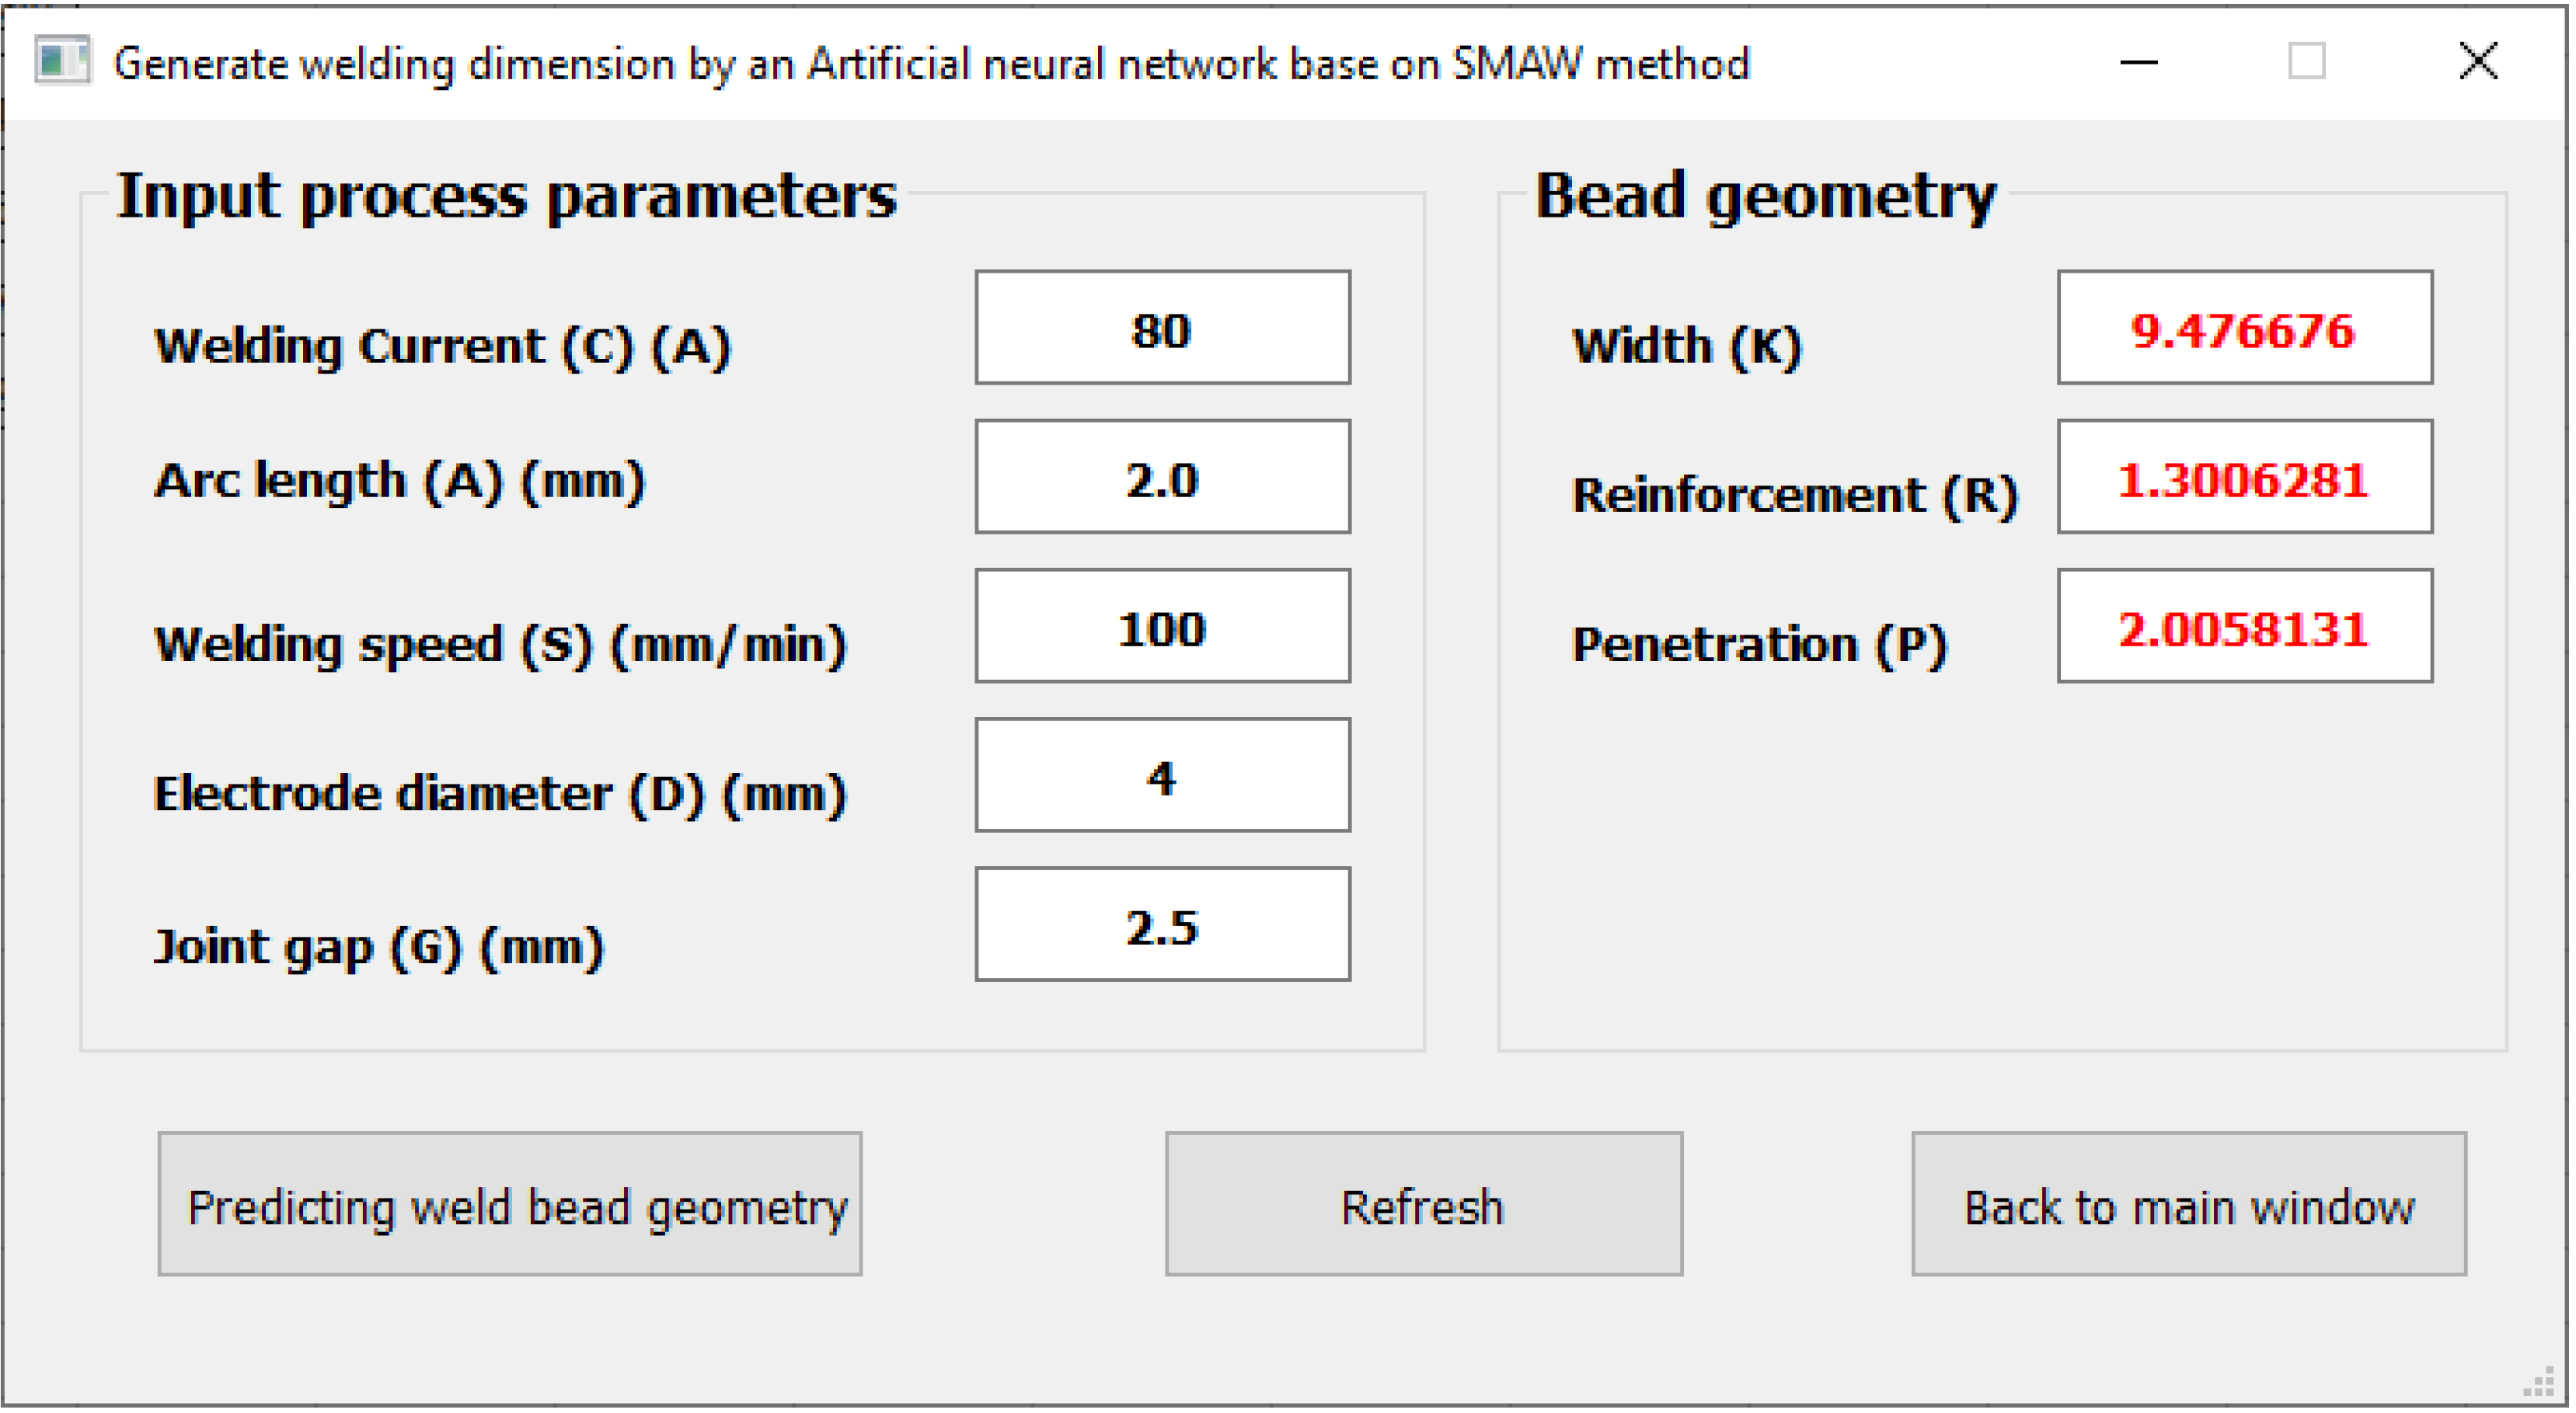
3.1. Implementation of the Artificial Intelligence-Based System
3.2. Testing and Evaluating the Functionality of the Developed Predictive System
3.3. Discussion of the Predicted and Calculated Results
| Welding Process | Weld Bead Geometry | Experimental Results | Predicted Results |
|---|---|---|---|
| TIG welding process | Weld bead width (KT) | 4.4 ÷ 12.9 | 5.87 ÷ 10.6 |
| Reinforcement (RT) | 0.3 ÷ 1.4 | 0.5 ÷ 1.27 | |
| Penetration (PT) | 1.0 ÷ 2.6 | 1.38 ÷ 1.9 | |
| MIG welding process | Weld bead width (KM) | 7.1 ÷ 12.4 | 7.31 ÷ 12.03 |
| Reinforcement (RM) | 2.3 ÷ 4.2 | 2.72 ÷ 3.79 | |
| Penetration (PM) | 1.3 ÷ 2.8 | 1.53 ÷ 2.43 | |
| SMAW welding process | Weld bead width (KS) | 7.4 ÷ 11.3 | 8.81 ÷ 9.63 |
| Reinforcement (RS) | 0.6 ÷ 2.0 | 1.2 ÷ 1.44 | |
| Penetration (PS) | 1.3 ÷ 2.9 | 1.91 ÷ 2.12 |
4. Conclusions
Author Contributions
Funding
Institutional Review Board Statement
Informed Consent Statement
Data Availability Statement
Conflicts of Interest
References
- Mohd, N.C.W.; Ferry, M.; Nik, W.B.W. A study of software approach for predicting weld bead geometry in shielded metal arc welding (SMAW) process. Appl. Mech. Mater. 2014, 554, 386–390. [Google Scholar]
- Ganjigatti, J.P.; Pratihar, D.K.; Choudhury, A.R. Modeling of the MIG welding process using statistical approaches. Int. J. Adv. Manuf. Technol. 2008, 35, 1166–1190. [Google Scholar] [CrossRef]
- Kumar, R.; Saurav, S.K. Modeling of TIG welding process by regression analysis and neural network technique. Int. J. Mech. Eng. Technol. 2015, 6, 10–27. [Google Scholar]
- Shukla, A.A.; Joshi, V.S.; Chel, A.; Shukla, B.A. Analysis of shielded metal arc welding parameter on depth of penetration on AISI 1020 plates using response surface methodology. Procedia Manuf. 2018, 20, 239–246. [Google Scholar] [CrossRef]
- Ghanty, P.; Vasudevan, M.; Mukherjee, D.P.; Pal, N.R.; Chandrasekhar, N.; Maduraimuthu, V.; Bhaduri, A.K.; Barat, P.; Raj, B. Artificial neural network approach for estimating weld bead width and depth of penetration from infrared thermal image of weld pool. Sci. Tech. Weld. Join. 2008, 13, 395–401. [Google Scholar] [CrossRef]
- Nagesh, D.S.; Datta, G.L. Prediction of weld bead geometry and penetration in shielded metal-arc welding using artificial neural networks. J. Mater. Process. Technol. 2002, 123, 303–312. [Google Scholar] [CrossRef]
- Benyounis, K.Y.; Olabi, A.G. Optimization of different welding processes using statistical and numerical approaches—A reference guide. Adv. Eng. Softw. 2008, 39, 483–496. [Google Scholar] [CrossRef] [Green Version]
- Sen, M.; Mukherjee, M.; Pal, T.K. Prediction of weld bead geometry for double pulse gas metal arc welding process by regression analysis. In Proceedings of the 5th International and 26th All India Manufacturing Technology, Design and Research Conference (AIMTDR 2014), Guwahati, India, 12–14 December 2014. [Google Scholar]
- Singh, J.; Singh, G. Effects of variation in welding current during SMAW process on A36 mild steel. Int. J. Res. Appl. Sci. Eng. Technol. 2022, 10, 259–264. [Google Scholar] [CrossRef]
- Ranjan, R. Parametric optimization of shielded metal arc welding processes by using factorial design approach. Int. J. Sci. Res. Publ. 2014, 4. Available online: https://citeseerx.ist.psu.edu/document?repid=rep1&type=pdf&doi=3bff5b16728003f23044819fa6a1ad4f6c275422#page=637 (accessed on 16 February 2022).
- Ahmed, A.N.; Noor, C.W.M.; Allawi, M.F.; El-Shafie, A. RBF-NN-based model for prediction of weld bead geometry in Shielded Metal Arc Welding (SMAW). Neural Comput. Appl. 2018, 29, 889–899. [Google Scholar] [CrossRef]
- Ali, M.S.; Rao, C.S.; Rao, D.N. Study the effect of shielded metal arc welding process parameters, cryo-treatment and preheating on welding characteristics and modelling by an artificial neural network. Aust. J. Mech. Eng. 2014, 12, 195–207. [Google Scholar] [CrossRef]
- Singh, R.P.; Gupta, R.C.; Sarkar, S.C. Prediction of weld width of shielded metal arc weld under magnetic field using artificial neural networks. Int. J. Comput. Eng. Res. 2013, 3, 58–64. [Google Scholar]
- Pradhan, R.; Joshi, A.P.; Sunny, M.R.; Sarkar, A. Machine learning models for determination of weld bead shape parameters for gas metal arc welded T-joints-A comparative study. arXiv 2022, arXiv:2206.02794. [Google Scholar]
- Campbell, S.; Alexander, G.; Norman, M. Artificial neural network prediction of weld geometry performed using GMAW with alternating shielding gases. Weld. J. 2012, 91, 174–181. [Google Scholar]
- Nagesh, D.S.; Datta, G.L. Genetic algorithm for optimization of welding variables for height to width ratio and application of ANN for prediction of bead geometry for TIG welding process. Appl. Soft Comput. 2010, 10, 897–907. [Google Scholar] [CrossRef]
- Ismail, M.I.S.; Okamoto, Y.; Okada, A. Neural network modeling for prediction of weld bead geometry in laser micro-welding. Adv. Opt. Technol. 2013, 2013, 415837. [Google Scholar] [CrossRef] [Green Version]
- Mohd, N.C.W.; Ferry, M.; Gholamhassan, N.; Ahmad, F.; Mohd, A.; Nur, A.R. Prediction of weld bead geometry in SMAW welded plates by using artificial neural network approach. In Proceedings of the 9th International Conference on Marine Technology, Sarawak, Malaysia, 3–4 December 2014. [Google Scholar]
- Xiong, J.; Zhang, G.; Hu, J.; Wu, L. Bead geometry prediction for robotic GMAW-based rapid manufacturing through a neural network and a second-order regression analysis. J. Intell. Manuf. 2014, 25, 157–163. [Google Scholar] [CrossRef]
- Kim, I.S.; Lee, S.H.; Yarlagadda, P.K.D.V. Comparison of multiple regression and back propagation neural network approaches in modelling top bead height of multi-pass gas metal arc welds. Sci. Technol. Weld. Join. 2003, 8, 347–352. [Google Scholar] [CrossRef]
- Keshmiri, S.; Zheng, X.; Feng, L.W.; Pang, C.K.; Chew, C.M. Application of deep neural network in estimation of the weld bead parameters. In Proceedings of the IEEE/RSJ International Conference on Intelligent Robots and Systems (IROS), Hamburg, Germany, 28 September–3 October 2015. [Google Scholar]
- Majumdar, J.D. Underwater welding—Present status and future scope. J. Nav. Archit. Mar. Eng. 2006, 3, 39–47. [Google Scholar] [CrossRef]
- Kesse, M.A.; Buah, E.; Handroos, H.; Ayetor, G.K. Development of an Artificial Intelligence Powered TIG Welding Algorithm for the Prediction of Bead Geometry for TIG Welding Processes using Hybrid Deep Learning. Metals 2020, 10, 451. [Google Scholar] [CrossRef] [Green Version]
- A First Course in Design and Analysis of Experiments. Available online: http://users.stat.umn.edu/ (accessed on 19 August 2022).
- Sinha, A.; Kim, D.; Ceglarek, D. Correlation analysis of the variation of weld seam and tensile strength in laser welding of galvanized steel. Opt. Lasers Eng. 2013, 51, 1143–1152. [Google Scholar] [CrossRef]
- Verma, Y. A Complete Understanding of Dense Layers in Neural Networks. Available online: https://analyticsindiamag (accessed on 6 February 2023).
- ReLU Activation Function. Available online: https://vidyasheela.com (accessed on 6 February 2023).
- A Gentle Introduction to the Rectified Linear Unit (ReLU). Available online: https://machinelearningmastery.com/rectified-linear-activation-function-for-deep-learning-neural-networks/ (accessed on 6 February 2023).
- How to Choose Loss Functions When Training Deep Learning Neural Networks. Available online: https://machinelearningmastery.com/how-to-choose-loss-functions-when-training-deep-learning-neural-networks/ (accessed on 6 February 2023).
- Diederik, P.K.; Jimmy, B. Adam: A method for stochastic optimization. In Proceedings of the 3rd International Conference for Learning Representations, San Diego, CA, USA, 7–9 May 2015. [Google Scholar]


| Parameter | Unit | Notation | Minimum Value (−) | Maximum Value (+) |
|---|---|---|---|---|
| Welding current | A | A | 60 | 90 |
| Arc length | mm | B | 1.2 | 3.0 |
| Welding speed | mm/min | C | 70 | 120 |
| Electrode diameter | mm | D | 2.6 | 4.0 |
| Joint gap | mm | E | 1.0 | 3.0 |
| Layer | Layer (Type) | Output Shape | Activation | Param # |
|---|---|---|---|---|
| Input | Dense | 6 | ||
| Hidden | dense (Dense) | (None, 64) | ReLU | 448 |
| dense_1 (Dense) | (None, 32) | ReLU | 2080 | |
| dense_2 (Dense) | (None, 16) | ReLU | 528 | |
| dense_3 (Dense) | (None, 8) | ReLU | 136 | |
| Output | dense_4 (Dense) | (None, 3) | Linear | 27 |
| Dataset | Number Patterns | Number Patterns of Test Set | Number Patterns of Training Set | RMSE Training Set | RMSE Test Set | ||||
|---|---|---|---|---|---|---|---|---|---|
| K | R | P | K | R | P | ||||
| TIG | 128 | 115 | 13 | 0.02625 | 0.00073 | 0.00999 | 0.04818 | 0.00067 | 0.00115 |
| MIG | 19 | 98 | 11 | 0.00046 | 0.00009 | 0.00006 | 0.00013 | 0.00020 | 0.00005 |
| SMAW | 62 | 55 | 7 | 0.01049 | 0.00091 | 0.00161 | 0.00220 | 0.00026 | 0.00050 |
| M | N | O | P | Q | C-KT | C-RT | C-PT | P-KT | P-RT | P-PT | Dev. of KT | % of KT | Dev. of RT | % of RT | Dev. of PT | % of PT |
|---|---|---|---|---|---|---|---|---|---|---|---|---|---|---|---|---|
| 24 | 2.5 | 30 | 3.2 | 80 | 7.46 | 1.04 | 1.68 | 7.80 | 1.09 | 1.69 | 0.33 | 4.49 | 0.05 | 4.58 | 0.01 | 0.44 |
| 24 | 2.5 | 30 | 2.4 | 110 | 10.38 | 0.63 | 2.01 | 10.60 | 0.62 | 1.90 | 0.23 | 2.19 | −0.01 | 2.22 | −0.11 | 5.55 |
| 24 | 2.5 | 70 | 3.2 | 95 | 9.87 | 0.67 | 1.87 | 9.94 | 0.65 | 1.93 | 0.08 | 0.79 | −0.03 | 3.73 | 0.06 | 3.08 |
| 46 | 2.5 | 30 | 3.2 | 95 | 5.95 | 1.14 | 1.52 | 5.91 | 1.17 | 1.45 | −0.04 | 0.61 | 0.03 | 2.42 | −0.06 | 4.09 |
| 24 | 2 | 40 | 2.6 | 90 | 8.39 | 0.83 | 1.75 | 8.35 | 0.83 | 1.74 | −0.04 | 0.42 | 0.00 | 0.04 | −0.01 | 0.79 |
| 35 | 2.5 | 70 | 2.4 | 95 | 7.73 | 0.92 | 1.68 | 7.73 | 0.95 | 1.72 | 0.01 | 0.09 | 0.03 | 3.24 | 0.05 | 2.71 |
| 35 | 2 | 60 | 3 | 105 | 9.09 | 0.65 | 1.77 | 9.04 | 0.64 | 1.76 | −0.05 | 0.56 | −0.01 | 1.76 | −0.02 | 1.01 |
| 35 | 2 | 50 | 2.8 | 85 | 6.50 | 1.03 | 1.53 | 6.52 | 1.03 | 1.50 | 0.02 | 0.27 | −0.01 | 0.50 | −0.03 | 2.13 |
| 35 | 1.5 | 70 | 2.4 | 110 | 9.45 | 0.52 | 1.78 | 9.44 | 0.50 | 1.82 | −0.01 | 0.07 | −0.02 | 3.97 | 0.04 | 2.45 |
| 46 | 1.5 | 70 | 2.4 | 110 | 7.83 | 0.69 | 1.61 | 7.70 | 0.69 | 1.58 | −0.13 | 1.62 | 0.00 | 0.41 | −0.02 | 1.51 |
| 30 | 2.5 | 50 | 2.8 | 95 | 8.38 | 0.87 | 1.76 | 8.32 | 0.87 | 1.74 | −0.06 | 0.73 | 0.00 | 0.50 | −0.03 | 1.48 |
| 46 | 1.5 | 30 | 2.4 | 95 | 5.43 | 1.06 | 1.42 | 5.53 | 1.08 | 1.38 | 0.10 | 1.90 | 0.01 | 1.08 | −0.04 | 2.90 |
| 24 | 1.5 | 70 | 3.2 | 95 | 9.87 | 0.51 | 1.80 | 9.97 | 0.51 | 1.77 | 0.10 | 1.06 | 0.00 | 0.73 | −0.03 | 1.51 |
| a | b | c | d | e | f | C-KM | C-RM | C-PM | P-KM | P-RM | P-PM | Dev. of KM | % of KM | Dev. of RM | % of RM | Dev. of PM | % of PM |
|---|---|---|---|---|---|---|---|---|---|---|---|---|---|---|---|---|---|
| 25 | 30 | 7 | 18 | 17 | 70 | 12.01 | 3.56 | 2.76 | 9.91 | 2.82 | 2.43 | −0.10 | 0.84 | −0.14 | 3.85 | −0.13 | 4.75 |
| 40 | 28 | 7 | 17 | 16 | 75 | 9.12 | 3.14 | 2.13 | 8.97 | 3.14 | 2.11 | −0.15 | 1.59 | 0.00 | 0.11 | −0.01 | 0.62 |
| 35 | 26 | 6 | 16 | 15 | 70 | 8.19 | 3.57 | 1.93 | 8.06 | 3.56 | 1.93 | −0.13 | 1.58 | −0.01 | 0.20 | 0.00 | 0.03 |
| 30 | 27 | 7 | 15 | 16 | 90 | 9.84 | 3.59 | 2.09 | 9.85 | 3.58 | 2.08 | 0.02 | 0.16 | −0.01 | 0.20 | −0.01 | 0.33 |
| 30 | 30 | 7 | 15 | 17 | 95 | 11.54 | 3.13 | 2.30 | 11.46 | 3.12 | 2.29 | −0.07 | 0.61 | −0.01 | 0.46 | −0.01 | 0.59 |
| 25 | 30 | 7 | 14 | 20 | 95 | 11.86 | 3.38 | 2.35 | 12.03 | 3.36 | 2.33 | 0.17 | 1.42 | −0.02 | 0.64 | −0.01 | 0.63 |
| 45 | 30 | 7 | 18 | 17 | 80 | 10.04 | 2.71 | 2.33 | 9.94 | 2.72 | 2.30 | −0.11 | 1.06 | 0.01 | 0.29 | −0.03 | 1.10 |
| 25 | 26 | 6 | 14 | 15 | 100 | 9.24 | 3.65 | 1.65 | 9.22 | 3.62 | 1.64 | −0.02 | 0.18 | −0.03 | 0.72 | −0.01 | 0.48 |
| 45 | 26 | 6 | 18 | 18 | 90 | 7.12 | 3.04 | 1.53 | 7.31 | 3.04 | 1.53 | 0.20 | 2.74 | −0.01 | 0.19 | −0.01 | 0.58 |
| 30 | 26 | 6 | 15 | 15 | 75 | 8.69 | 3.71 | 1.92 | 8.51 | 3.70 | 1.92 | −0.18 | 2.06 | −0.01 | 0.35 | 0.00 | 0.02 |
| 25 | 26 | 7 | 14 | 15 | 100 | 9.82 | 3.81 | 1.92 | 9.83 | 3.79 | 1.92 | 0.01 | 0.06 | −0.01 | 0.37 | 0.00 | 0.13 |
| A | B | C | D | E | C-KS | C-RS | C-PS | P-KS | P-RS | P-PS | Dev. of KS | % of KS | Dev. of RS | % of RS | Dev. of PS | % of PS |
|---|---|---|---|---|---|---|---|---|---|---|---|---|---|---|---|---|
| 65 | 2 | 80 | 3.5 | 1 | 9.24 | 1.42 | 2.01 | 9.26 | 1.41 | 2.04 | 0.02 | 0.23 | −0.01 | 0.41 | 0.03 | 1.31 |
| 90 | 1.5 | 95 | 4 | 2 | 9.27 | 1.22 | 2.06 | 9.63 | 1.20 | 1.98 | 0.36 | 3.87 | −0.02 | 1.39 | −0.08 | 3.98 |
| 75 | 1.5 | 115 | 4 | 2 | 9.24 | 1.32 | 2.09 | 9.21 | 1.30 | 2.10 | −0.03 | 0.35 | −0.02 | 1.70 | 0.01 | 0.53 |
| 80 | 2.5 | 90 | 3 | 2.5 | 9.47 | 1.34 | 1.92 | 9.44 | 1.33 | 1.91 | −0.02 | 0.26 | −0.01 | 0.57 | −0.01 | 0.54 |
| 60 | 1.2 | 95 | 2.6 | 1 | 9.01 | 1.47 | 2.08 | 8.81 | 1.44 | 1.99 | −0.19 | 2.15 | −0.02 | 1.69 | −0.09 | 4.16 |
| 80 | 1.2 | 120 | 4 | 2 | 9.15 | 1.27 | 2.14 | 9.21 | 1.32 | 2.10 | 0.06 | 0.63 | 0.05 | 3.60 | −0.03 | 1.57 |
| 70 | 1.5 | 115 | 4 | 1.5 | 9.13 | 1.35 | 2.13 | 9.02 | 1.37 | 2.12 | −0.11 | 1.23 | 0.03 | 1.87 | 0.00 | 0.13 |
Disclaimer/Publisher’s Note: The statements, opinions and data contained in all publications are solely those of the individual author(s) and contributor(s) and not of MDPI and/or the editor(s). MDPI and/or the editor(s) disclaim responsibility for any injury to people or property resulting from any ideas, methods, instructions or products referred to in the content. |
© 2023 by the authors. Licensee MDPI, Basel, Switzerland. This article is an open access article distributed under the terms and conditions of the Creative Commons Attribution (CC BY) license (https://creativecommons.org/licenses/by/4.0/).
Share and Cite
Tran, N.-H.; Bui, V.-H.; Hoang, V.-T. Development of an Artificial Intelligence-Based System for Predicting Weld Bead Geometry. Appl. Sci. 2023, 13, 4232. https://doi.org/10.3390/app13074232
Tran N-H, Bui V-H, Hoang V-T. Development of an Artificial Intelligence-Based System for Predicting Weld Bead Geometry. Applied Sciences. 2023; 13(7):4232. https://doi.org/10.3390/app13074232
Chicago/Turabian StyleTran, Ngoc-Hien, Van-Hung Bui, and Van-Thong Hoang. 2023. "Development of an Artificial Intelligence-Based System for Predicting Weld Bead Geometry" Applied Sciences 13, no. 7: 4232. https://doi.org/10.3390/app13074232