Article

Vectorized Representation of Commodities by Fusing Multisource Heterogeneous User-Generated Content with Multiple Models

School of Information and Control Engineering, China University of Mining and Technology, Xuzhou 221116, China
*
Author to whom correspondence should be addressed.
Appl. Sci. 2023, 13(7), 4217; https://doi.org/10.3390/app13074217
Submission received: 20 February 2023 / Revised: 15 March 2023 / Accepted: 22 March 2023 / Published: 27 March 2023
(This article belongs to the Special Issue Advanced Artificial Intelligence Theories and Applications)

Abstract

:
In the field of personalized recommendation, user-generated content (UGC) such as videos, images, and product comments are becoming increasingly important, since they implicitly represent the preferences of users. The vectorized representation of a commodity with multisource and heterogeneous UGC is the key for sufficiently mining the preference information to make a recommendation. Existing studies have mostly focused on using one type of UGC, e.g., images, to enrich the representation of a commodity, ignoring other contents. When more UGC are fused, complicated models with heavy computation cost are often designed. Motivated by this, we proposed a low-computational-power model for vectorizing multisource and recommendation UGC to achieve accurate commodity representations. In our method, video description keyframes, commodities’ attribute text, and user comments were selected as the model’s input. A multi-model fusion framework including feature extraction, vectorization, fusion, and classification based on MobileNet and multilayer perceptrons was developed. In this UGC fusion framework, feature correlations between images and product comments were extracted to design the loss function to improve the precision of vectorized representation. The proposed algorithm was applied to an actual representation of a commodity described by UGC, and the effectiveness of the proposed algorithm was demonstrated by the classification accuracy of the commodity represented.

1. Introduction

With the rapid development of the internet, e-commerce has entered a period of rapid growth. In the past few years, e-commerce platforms such as Amazon, Taobao, Jingdong, and eBay have increased drastically. How to identify the exact products that users are interested in among the numerous commodities has become an urgent problem to be solved in e-commerce. Therefore, personalized product recommendation algorithms have developed rapidly. Personalized recommendations are based on the accurate construction of models of user interest, and the accurate representation of commodities is the basis of these. However, most current studies have focused on improving the recommendation models and ignored the accurate vectorized representation of products with possible variety in the information, which makes it difficult to break through the bottleneck of the recommendation algorithms. Therefore, it is crucial to fully utilize all types of information describing a commodity and accurately represent the commodities.
In the early development of e-commerce, the information used to express a product was mainly described by the attributes and images provided by merchants. Attributes are the basic information of the commodity, such as the category, color, style, and so on. With the popularity of many mobile apps, users have become increasingly involved in e-commerce, thereby providing more valuable information for representing products, such as user comments, videos, and images. In addition, short videos are becoming increasingly popular for providing users with more comprehensive information. Videos, text, and images, provided by merchants or buyers, are all part of the user-generated content. These data are of great value for descriptions of a commodity and personalized recommendations. Fusing this information to represent a product is one of the hot topics in personalized recommendation over recent years. For the same product, UGC comes from multiple users (merchants and buyers) and are expressed as videos, images, attributes, comments, ratings, and other forms, which are multisource and heterogeneous. Such a characteristic makes the vectorized expression of UGC more comprehensive, whereas the heterogeneity increases the difficulty of extraction and fusion of the data features. How to effectively and accurately express a product in a vector with the multisource and heterogeneous UGC has become a key step in personalized recommendations.
Feature extraction and fusion of the multisource heterogeneous UGC are first required to achieve vectorized representation of commodities in a unified vector space [1,2,3]. In the field of personalized recommendations, there are few studies on the fusion of representations of UGC, especially concerning the video information of the products. In addition, the consistency of heterogeneous information from multiple sources has been considered in many studies, and this consistency is used in the design of the fusion strategy. Considering the consistency of heterogeneous information, it is necessary to integrate the differences and complementarity of UGC to realize the representation of a product from multiple perspectives. Accordingly, we proposed a fusion strategy based on the diversity and consistency of UGC to achieve accurate representations of products. Images containing global and local information were extracted as representative key video frames based on a user-personalized keyframe extraction algorithm [4]. Taking positive, neutral, and negative comments into account, we also used the comments from multiple users and attribute text of the product. Based on this UGC, an algorithm for feature extraction for fusing images and text was designed. In addition, based on the consistency of fusion, an improved loss function strategy was proposed to improve the accuracy of the representation of the fusion features.
The following contributions were our main focus: (1) a fusion framework integrating video images, attributes, and comments as the UGC of a product was designed; (2) the fusion network’s loss function was developed to improve the accuracy of feature representation considering the consistency of the fusion; (3) the proposed algorithm was applied to a self-built commodity dataset, and the classification results indicated the effectiveness of the proposed algorithm.
The rest of this article is organized as follows. The feature representation of personalized recommendations, the fusion of multisource and heterogeneous features, and other related work is discussed in Section 2. Section 3 introduces the proposed algorithm, including the framework, the improved loss function, and an analysis of its performance. The application of the algorithm to practical problems and an analysis of the results are presented in Section 4. Finally, a conclusion is presented.

2. Related Work

Recommendation algorithms have developed rapidly, and their key lies in the extraction, representation, and application of user and commodity features. Yu et al. [5] extracted the features of users, products, and other entities (such as film directors and actors) and considered the relationships among them as a representation to realize personalized recommendations. Li et al. [6] took features such as users, places, authors, terms, and articles to carry out feature coding to realize personalized paper recommendations. Ishanka and Yukawa [7] proposed a context-aware recommendation system, which used user comments to acquire users’ emotional information and combined users, items, and scores to provide recommendations. Tang and Wang [8] combined the operational behavior features of users to improve the effect of top-N recommendations. Zhang et al. [9] designed a deep knowledge perception network to predict the probability of a user clicking on current news through the historical records of that user’s clicks. Hwang and Park [10] designed a recommendation system based on actor content for recommending Korean films. Cui et al. [11] proposed a recommendation model based on the time correlation coefficient by considering that users’ interests change over time. Through the time correlation coefficient, similar users were gathered to achieve fast and accurate recommendations. Wang et al. [12] used an analysis of commodity attributes and users’ emotions to realize commodity recommendation, but they only used the commodity score to represent the commodities’ attributes, which had certain limitations. Islek and Oguducu [13] proposed a hierarchical recommendation model by using items’ titles, descriptions, a few reviews, and information on historical users’ interactions. There are existing studies on the feature extraction, representation, and application of user-generated content. Here, we considered the representation of a product by using UGC. The subsequent discussion focuses on an analysis of related research work, including the fusion of multisource heterogeneous UGC and vectorized representation of video images and text.

2.1. Fusion of Multisource Heterogeneous Information

For personalized recommendations in e-commerce, the major concern of users is the introduction of the commodity itself, e.g., the properties, videos, images, and user comments of the commodity. This information has the characteristics of multiple sources and heterogeneity. Hence, how to integrate the multisource heterogeneous data and improve the representation of a commodity has become a key issue, but few related studies have been carried out. In other fields, the fusion of multisource and heterogeneous information has gained wide attention.
For the fusion of heterogeneous data such as images, videos, and text, existing studies have commonly used a convolutional neural network (CNN). In the field of semantic image annotation, to model the distribution of semantic mapping between images and sentences, Ma et al. [14] proposed a convolutional neural network of multisource heterogeneous data. Through a three-layered fusion strategy of the text layer, the sentence layer, and the paragraph layer, the similarity in the semantics was fully captured. The multilayer perceptron (MLP) method can be used to acquire the joint representation of images and text. In the fusion of audio and visual signals, Hou et al. [15] proposed a voice enhancement framework, i.e., CNN was used to capture the features of audio and visual signals, and then a joint distribution model of a fully connected network was established by rebuilding the original input. Nguyen et al. [16] introduced the strategy of integrating fuzzy logic and CNN to realize the emotional classification of movie clips. Gan and Zhang Hang [17] proposed a personalized recommendation method based on deep learning and multiview deep fusion, which was used to evaluate prediction tasks. In this algorithm, each data source was regarded as a view, where different views described different aspects of the user’s preferences and the item’s features. The multilayer perceptron method and a convolutional neural network were used to achieve data fusion. Zhang et al. [18] proposed a modular emotion recognition model based on a deep canonical correlation analysis to improve the performance of emotion recognition with multisource data.
Wang et al. [19] adopted a naive Bayes multilabel classification algorithm to overcome the problem of inconsistency in multisource data structures and adopted a time-differenced correlation analysis to solve the time inconsistency problem of two time series. Zhang et al. [20] used CNN and long short-term memory (LSTM) to fully integrate adjacent brain wave signals and extract features to accurately identify human intentions. Jiang et al. [21] proposed adaptive importance sampling based on the fusion of information by encoding a graph structure and triples through the generalized graph attention network. In addition, bidirectional encoder representations from transformers were used to extract the features from multiple heterogeneous sources for the corresponding text descriptions. Huang and Sun [22], starting from the integration of personal data on the internet, acquired data from different sources and constructed a personal data space through a trusted model to establish unified and effective methods. Li et al. [23] introduced a reliability weight to reduce the overall deviation in weighting between the real situation and multisource observations to resolve conflicts. Nti et al. [24] integrated multisource information by stacking a CNN and LSTM to improve the accuracy of stock price predictions. Gao and Ran [25] introduced a feature vector and a time-weighted function to propose a collaborative filtering recommendation algorithm based on fusion of multiple types of information, which improved the accuracy of recommendation while further integrating, managing, and storing massive amounts of data from different industries. Ji et al. [26] found that most of the existing fusion recommendation models simply combined the recommendation results of different data without integrating multisource heterogeneous information, and then they proposed a combination of social data, scores, and comments to produce top-N recommendations. Although the models achieved better results, they lacked descriptions of the commodities’ attributes, especially in the case of video information. Zhu et al. [27] proposed a low-rank, multipeak fusion model based on an attention mechanism which combined low-rank weights and an attention mechanism to make the results of fusion more efficient. Du et al. [28] designed a bi-attention modal separation network using heterogeneous data pairs as the inputs to improve the accuracy of sentiment analysis. Zhang et al. [29] embedded an attention mechanism into a lane detection model to balance multimodal feature fusion and improve lane detection ability. Zhang et al. [30] designed a deep fusion network to better integrate the hidden spatial and semantic relations in multisource and heterogeneous data to improve the accuracy of answering image-related questions. Sun et al. [31] proposed a new deep network, which included a multimodel fusion mechanism, a pyramid extension module, and a multilevel feature fusion module to achieve the adaptive fusion of features. Zhang et al. [32] mapped low-level and high-level features into a public space to effectively learn their joint feature representations. Shen et al. [33] believed that because of the existence of redundant information, the use of traditional fusion algorithms such as weighted averages would lead to distortions or extra noise. Accordingly, a new feature selection method was proposed, and pointwise mutual information (PMI) was used to measure the similarity between features to preserve the significant structures and spatial consistency of the fusion data. However, these studies rarely involved the fusion of videos, images, and text in user-generated content.

2.2. Vectorized Representation of Images and Text

The vectorized representation of images is based on accurately obtaining the features from the image. Chhabra et al. [34] extracted the oriented fast and rotated brief (ORB) features and scale-invariant feature transform (SIFT) features of images and achieved better results in the field of image retrieval. Garg et al. [35] extracted the contrast features of the image and used percentile methods to strengthen underwater images. Luo et al. [36] proposed a new semi-supervised feature selection method by integrating the local structure of videos into the feature selection process, which improved the accuracy of semantic recognition in videos. Gupta et al. [37] analyzed a large number of works on image feature extraction and object detection, and found that color filter arrays decreased after image compression, indicating that different feature extraction algorithms have their own scenarios for application. Kashif Shaheed et al. [38] proposed a depth-separable residual Xception network for feature extraction and classification of images that had excellent performance.
The basis of fusing multisource heterogeneous information such as images and text is obtaining a vectorized representation of related data. Video data are often converted into images, and then a 3D convolutional neural network is used for feature extraction [39] to fully utilize the time sequence information in videos, which is frequently used in video classification, action recognition, and other fields. For commodity videos, users tend to focus on the overall effect or detailed features of commodities, so the timing of videos has a relatively small effect on the extraction of key features. Meanwhile, to avoid the high computational cost of 3D convolution, we extracted the keyframes from commodity videos and used a 2D convolutional neural network to extract features. For the CNN [40], many mature networks, such as VGG (Visual Geometry Group) [41] and GoogLeNet [42], have achieved attractive results. However, with the deepening of the layers in the network, the problem of gradient disappearance has also emerged. Therefore, in addition to the residual module, He et al. [43] proposed a deep residual network (ResNet). Furthermore, Andrew designed the MobileNet [44] model by using depthwise separable convolution, which greatly reduced the required training parameters. On this basis, the residual module was incorporated to the proposed MobileNetV2 [45], which had higher feature representation accuracy.
Natural language processing is a widely used technology that analyzes human language, including text classification [46], text sentiment analysis [47], and machine translation [48]. The key problem is to convert the text into computable vectors. Latent Dirichlet allocation (LDA) and Word2Vec are widely adopted as important models for the extraction of text features. Aakansha Gupta and Rahul Katarya [49] proposed a subject model based on LDA, combining COVID-19 case data and news articles into the LDA model to acquire new and more comprehensive features. Doganer and Zhang [50] used the LDA model to identify topics in videos about COVID-19 on YouTube to better provide people with information about the virus. Mimu et al. [51] applied LDA and content filtering to design a mixed recommendation model to improve the interpretability of users and item-related topics. Guo et al. [52] designed an LDA model by combining brand information to analyze the strengths and weaknesses of competitive brands on the same e-commerce platform and to provide suggestions for brand managers and marketers. Zhao et al. [53] found that the LDA model and its training process may expose information, thus causing serious privacy problems. Therefore, the differential private LDA algorithm and a local private LDA training algorithm based on crowdsourced data were proposed to protect the privacy of individual users. To analyze malware, Sun et al. [54] proposed a classification scheme using the Word2Vec pretraining model, which acquired fewer feature dimensions and resulted in a stronger representation of malware features, reduced memory usage, shortened the training time, and improved the classification performance. To improve the accuracy of the recommendation system based on the Word2Vec algorithm, Se Joon Park et al. [55] took the sequence of clicked items and user purchases as the input and output of the model, respectively, and used the XGBoost regression model to recommend products for users. Xu et al. [56] aimed to study emotion classification in microblog text and introduced a Word2Vec model into the convolutional neural network classification model to acquire the word vectors of each word to obtain higher accuracy. Wang and Zhu [57] aimed to solve the problems of feature dimensions and their lack in traditional text classification models. An inverse document frequency term and an inverse file word frequency model combined with the Word2Vec algorithm was proposed to realize the weighted classification of text information. The feature extraction and vectorized representation of images and text laid the foundation for the fused representation of user-generated content.

3. Multimodel Fusion-Based Feature Representation of Commodities with Multisource and Heterogeneous User-Generated Content

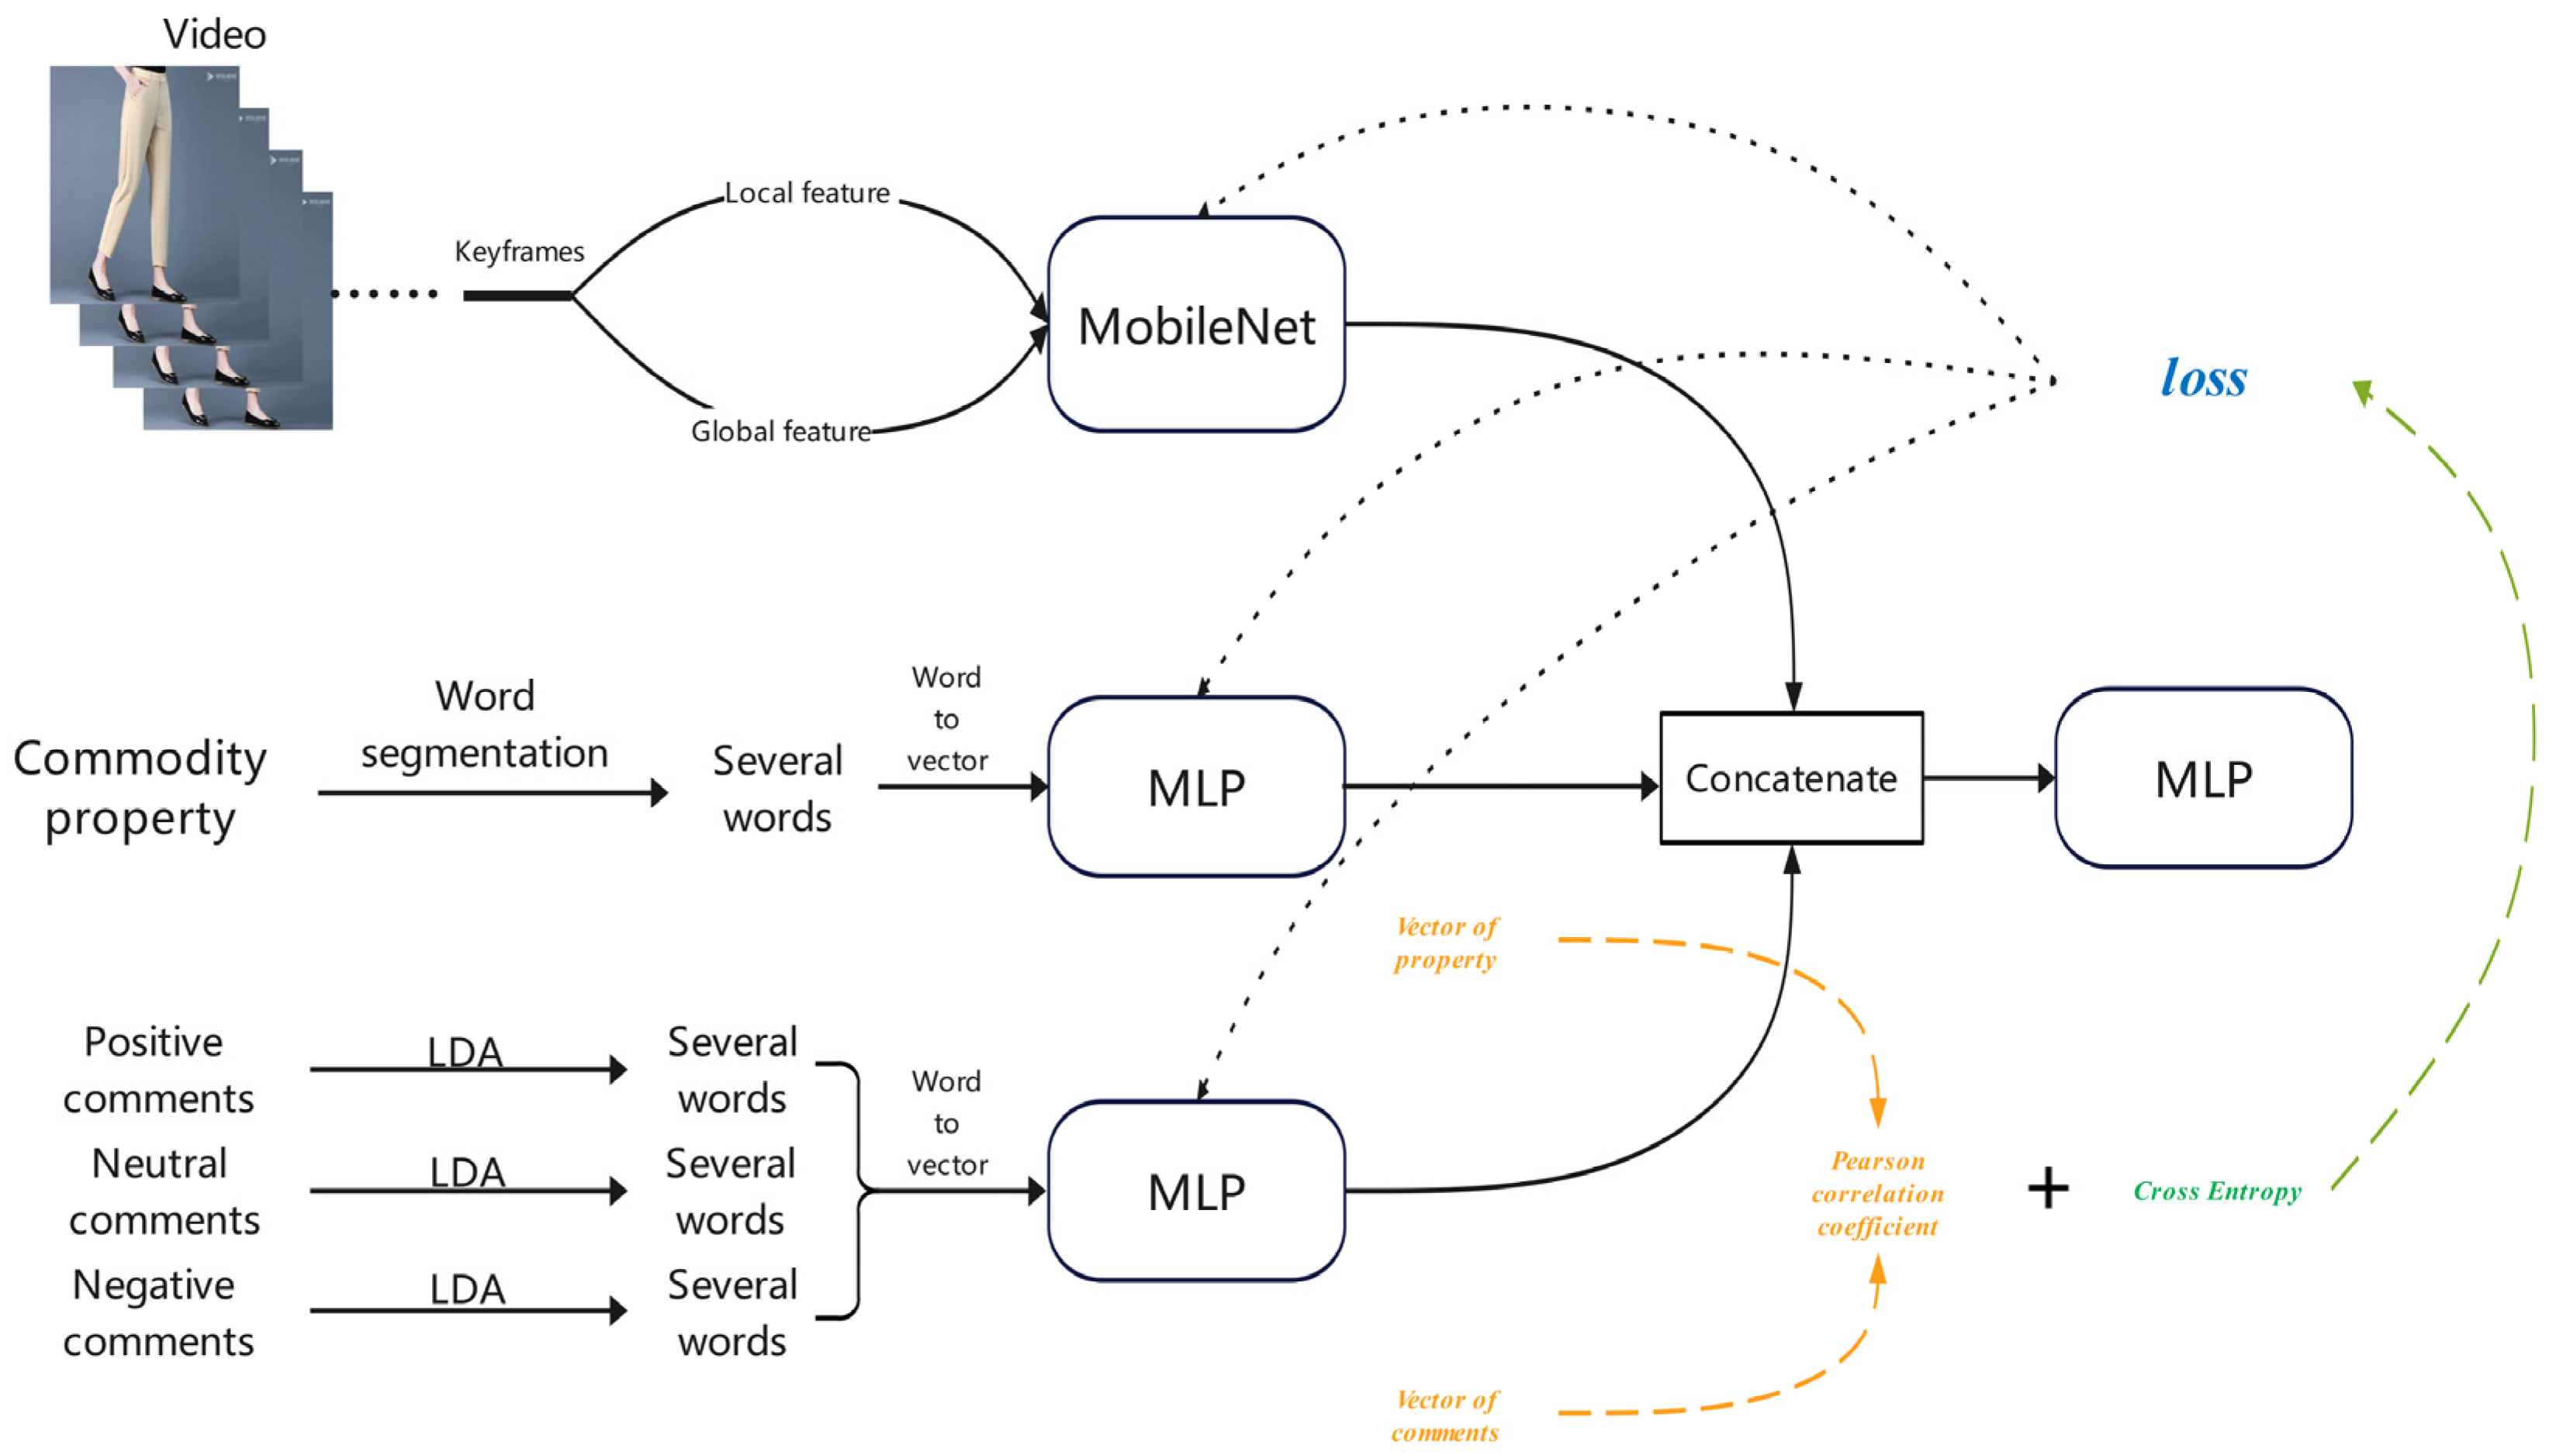
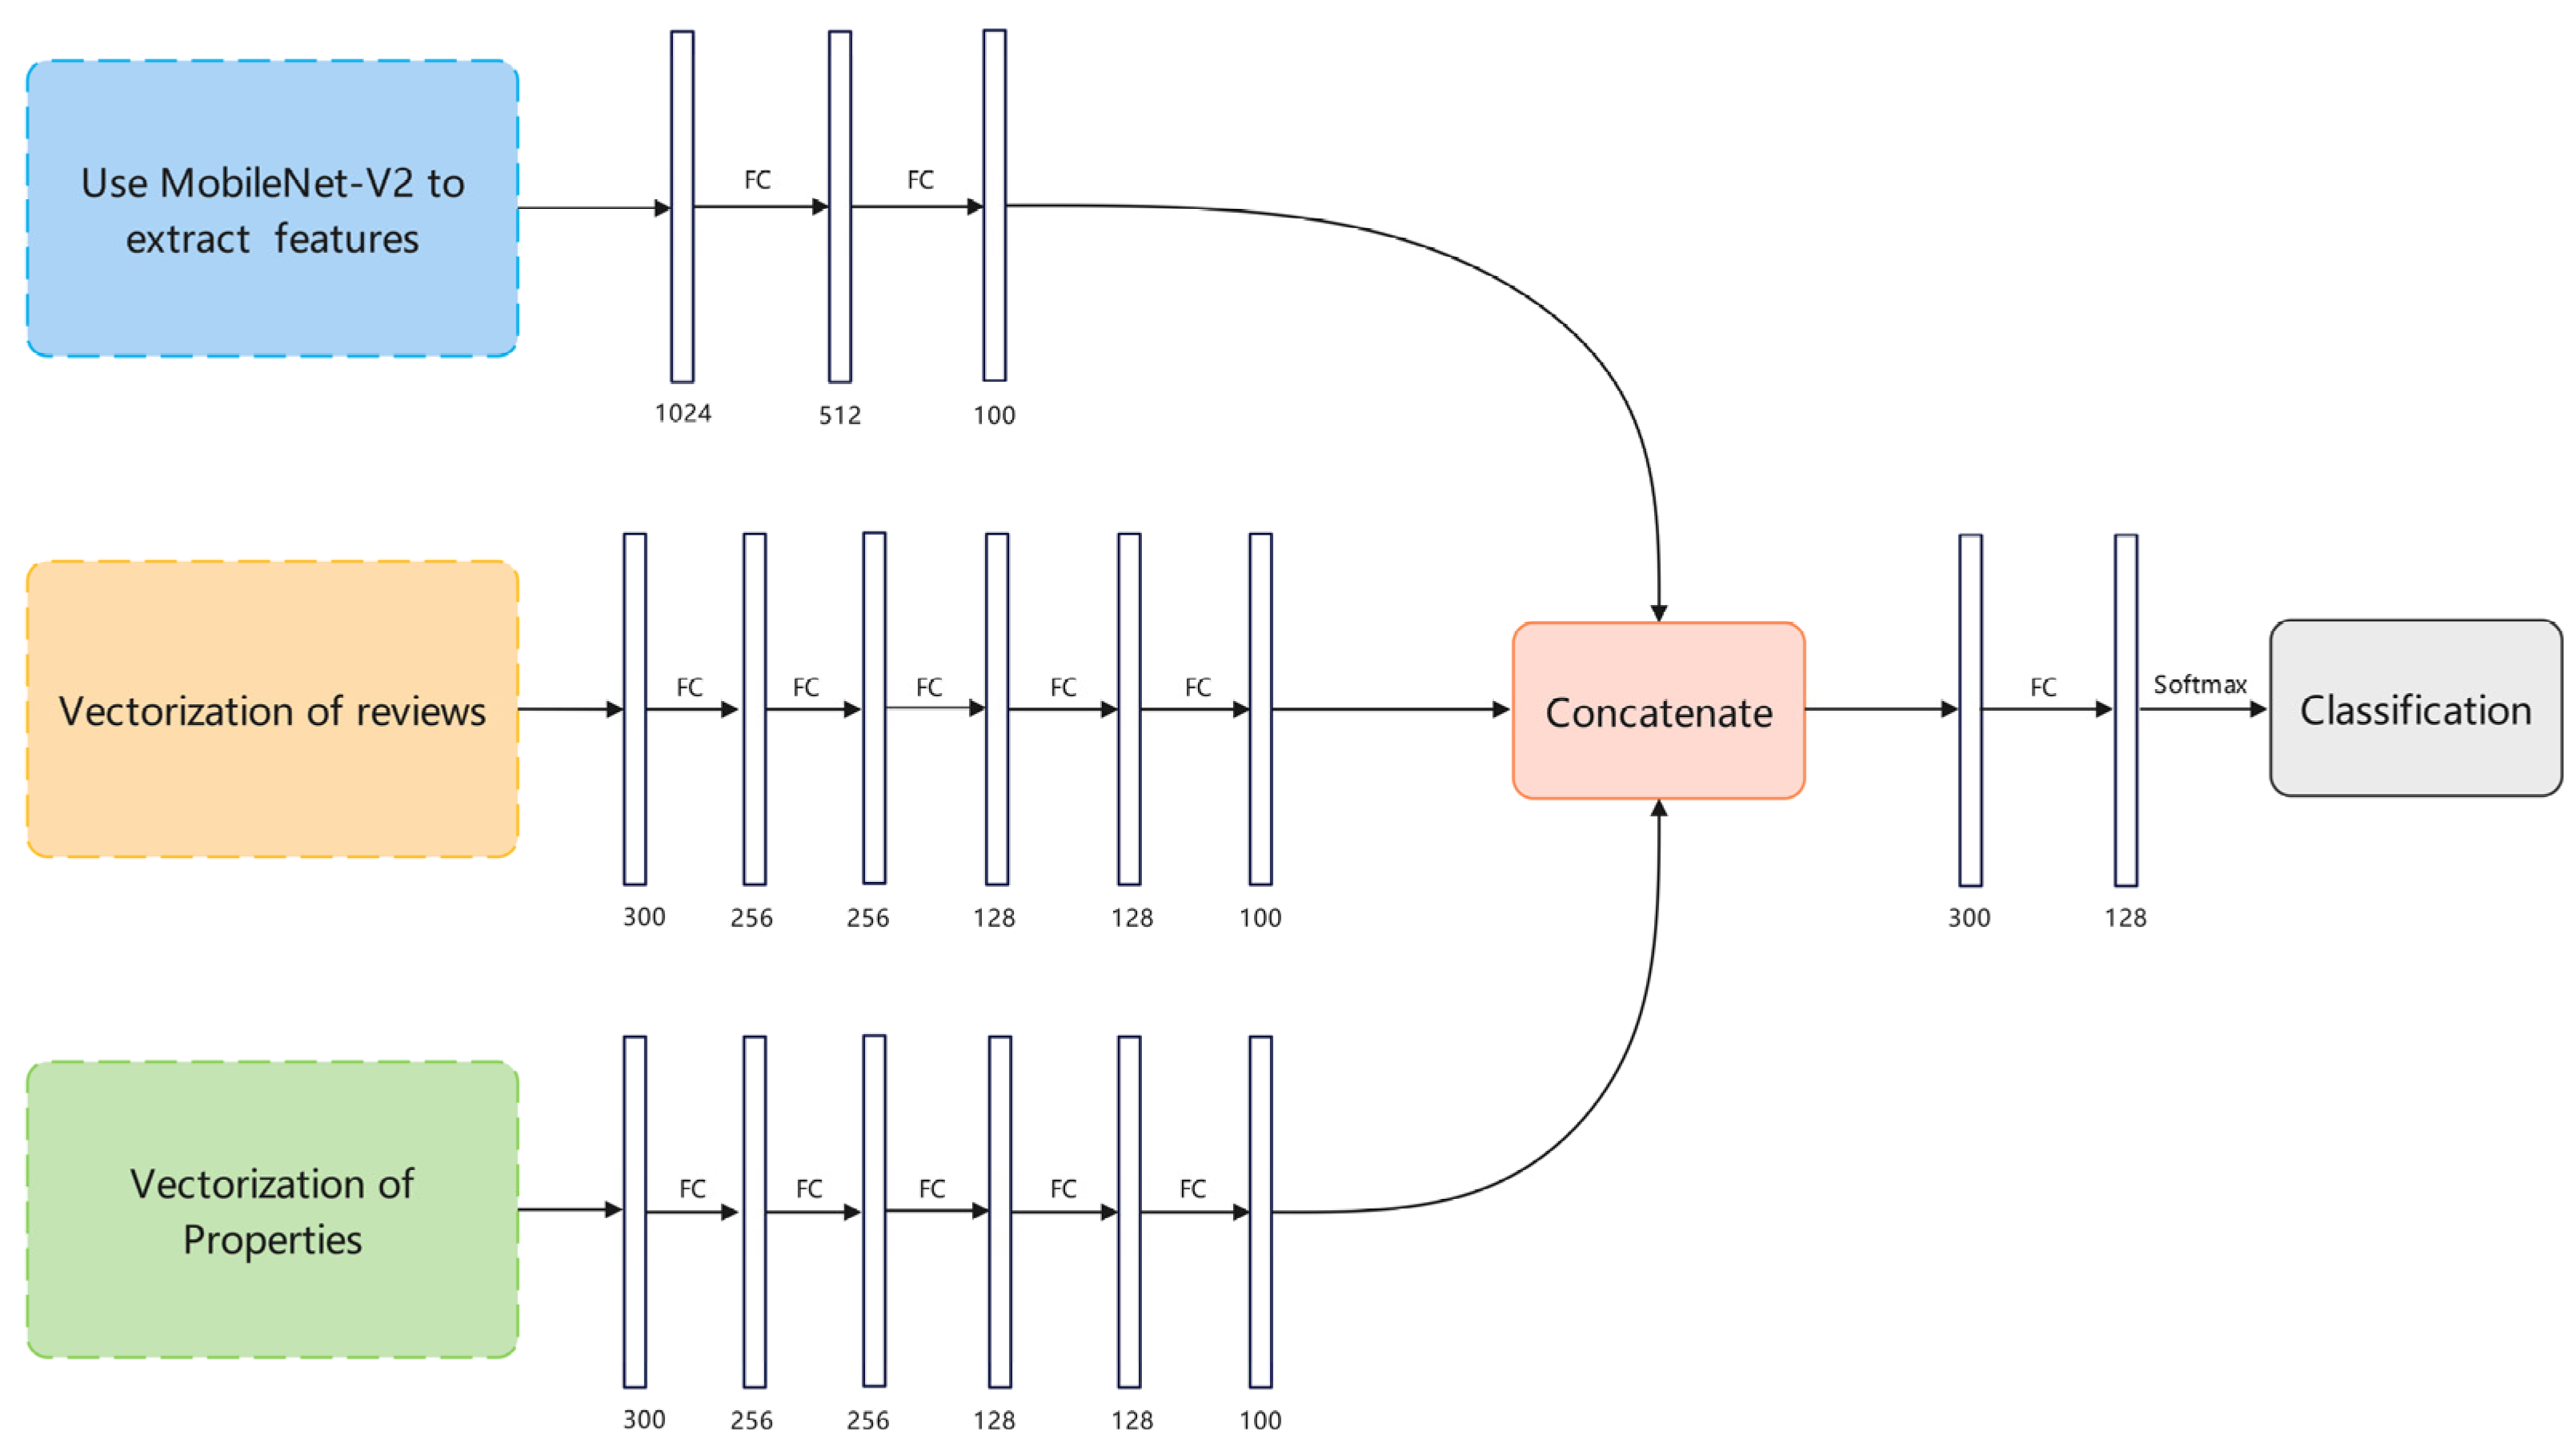
3.1. Framework of the Algorithm

Fully integrating UGC such as videos, images, attributes, and comments related to goods can be favorable to the comprehensive representation of products to present personalized searches and recommendations. In view of this, a commodity’s videos, images, and text comments were fused in a lightweight fusion model to perform an accurate vectorized representation of the product. First, based on our existing work [14], two types of keyframe images reflecting the overall and local detail of commodities were extracted and combined with other descriptive images of commodities to form a video and image subset. MobileNetV2 was used to extract the features of this image subset. The commodity’s attribute and the user comments formed a text description subset. The feature vector representation of this subset was performed by LDA and the Word2Vec algorithm. Furthermore, considering the consistency between attributes and comments, an improved network loss function integrating attribute–comment correlations was designed. Finally, the image and text features were fused to acquire a vectorized representation of the products based on user-generated content.
The framework of the proposed algorithm is displayed in Figure 1. The keyframes, including the local and global features, were provided to MobileNetV2, and the corresponding vectorized features could be obtained. The text of the attributes and comments of a product were inputted to Word2Vec to obtain the vectorized features. Two MLPs were then followed to perform a subsequent feature extraction after running Word2Vec. Then the output of MobileNetV2 and the two MLPs were concatenated as the fused vector and put into the final MLP to perform the classification. The function of the last MLP was to guarantee the accuracy of the vectorized representation of a product using UGC. The fusion of the detailed contents of image and text features, together with the design of the loss function will be addressed in the following subsections.

3.2. Vectorized Representation of the Image Subset Using MobileNetV2

Keyframes from the video were first extracted through the MobileNetV2 network trained in our previous work [14]. The MobileNetV2 network divided the video into four types of image sets, namely local, global, redundant, and distorted images. Images that reflect the local details and the overall effects of commodities have real value for representations of a commodity. Therefore, only these types of keyframe images were selected here to form an image subset. When the number of these types of keyframes was large, to reduce the computation cost, K-means clustering was used with the categories m and n for the local and global image sets. In total, m + n keyframes in the center of each class were selected to form an image subset. The processes of keyframe stacking and network input are shown in Figure 2, where the MobileNetV2 network outputs an l video dimension vector, namely, a vector of video features.

3.3. Vectorized Representation of Text Based on LDA and Word2Vec

For text information, Jieba segmentation was first used to analyze the attributes and comments of the commodity and retained the positive, neutral, and negative word sets, which were recorded as follows: W s = 1 , 2 , , w s r , W p h , W p z , and W p c . Then the review word sets W p h , W p z , and W p c were fed into the LDA model to obtain k theme words. These keywords were set as the input of the trained Word2Vec model to obtain k l-dimensional features of positive, neutral, and negative comments, respectively, denoted as V p h = V p h 1 , V p h 2 , , V p h k , V p z = V p z 1 , V p z 2 , , V p z k , and V p c = V p c 1 , V p c 2 , , V p c 3 . In addition, the keyword features of the comments were fused by Formula (1) to obtain the l-dimensional feature vectors of the user comments:
Φ p = i = 1 k V p h i + V p z i + V p c i 3 × k
For the attribute word sets, Word2Vec was directly used to achieve a vectorized representation of the text, and then r l-dimensional features could be obtained, expressed as V s = V s 1 , V s 2 , , V s r . Their weighted average was calculated by Formula (2), and the feature vectors of the attribute word sets were obtained:
Φ s = i = 1 r V s i k

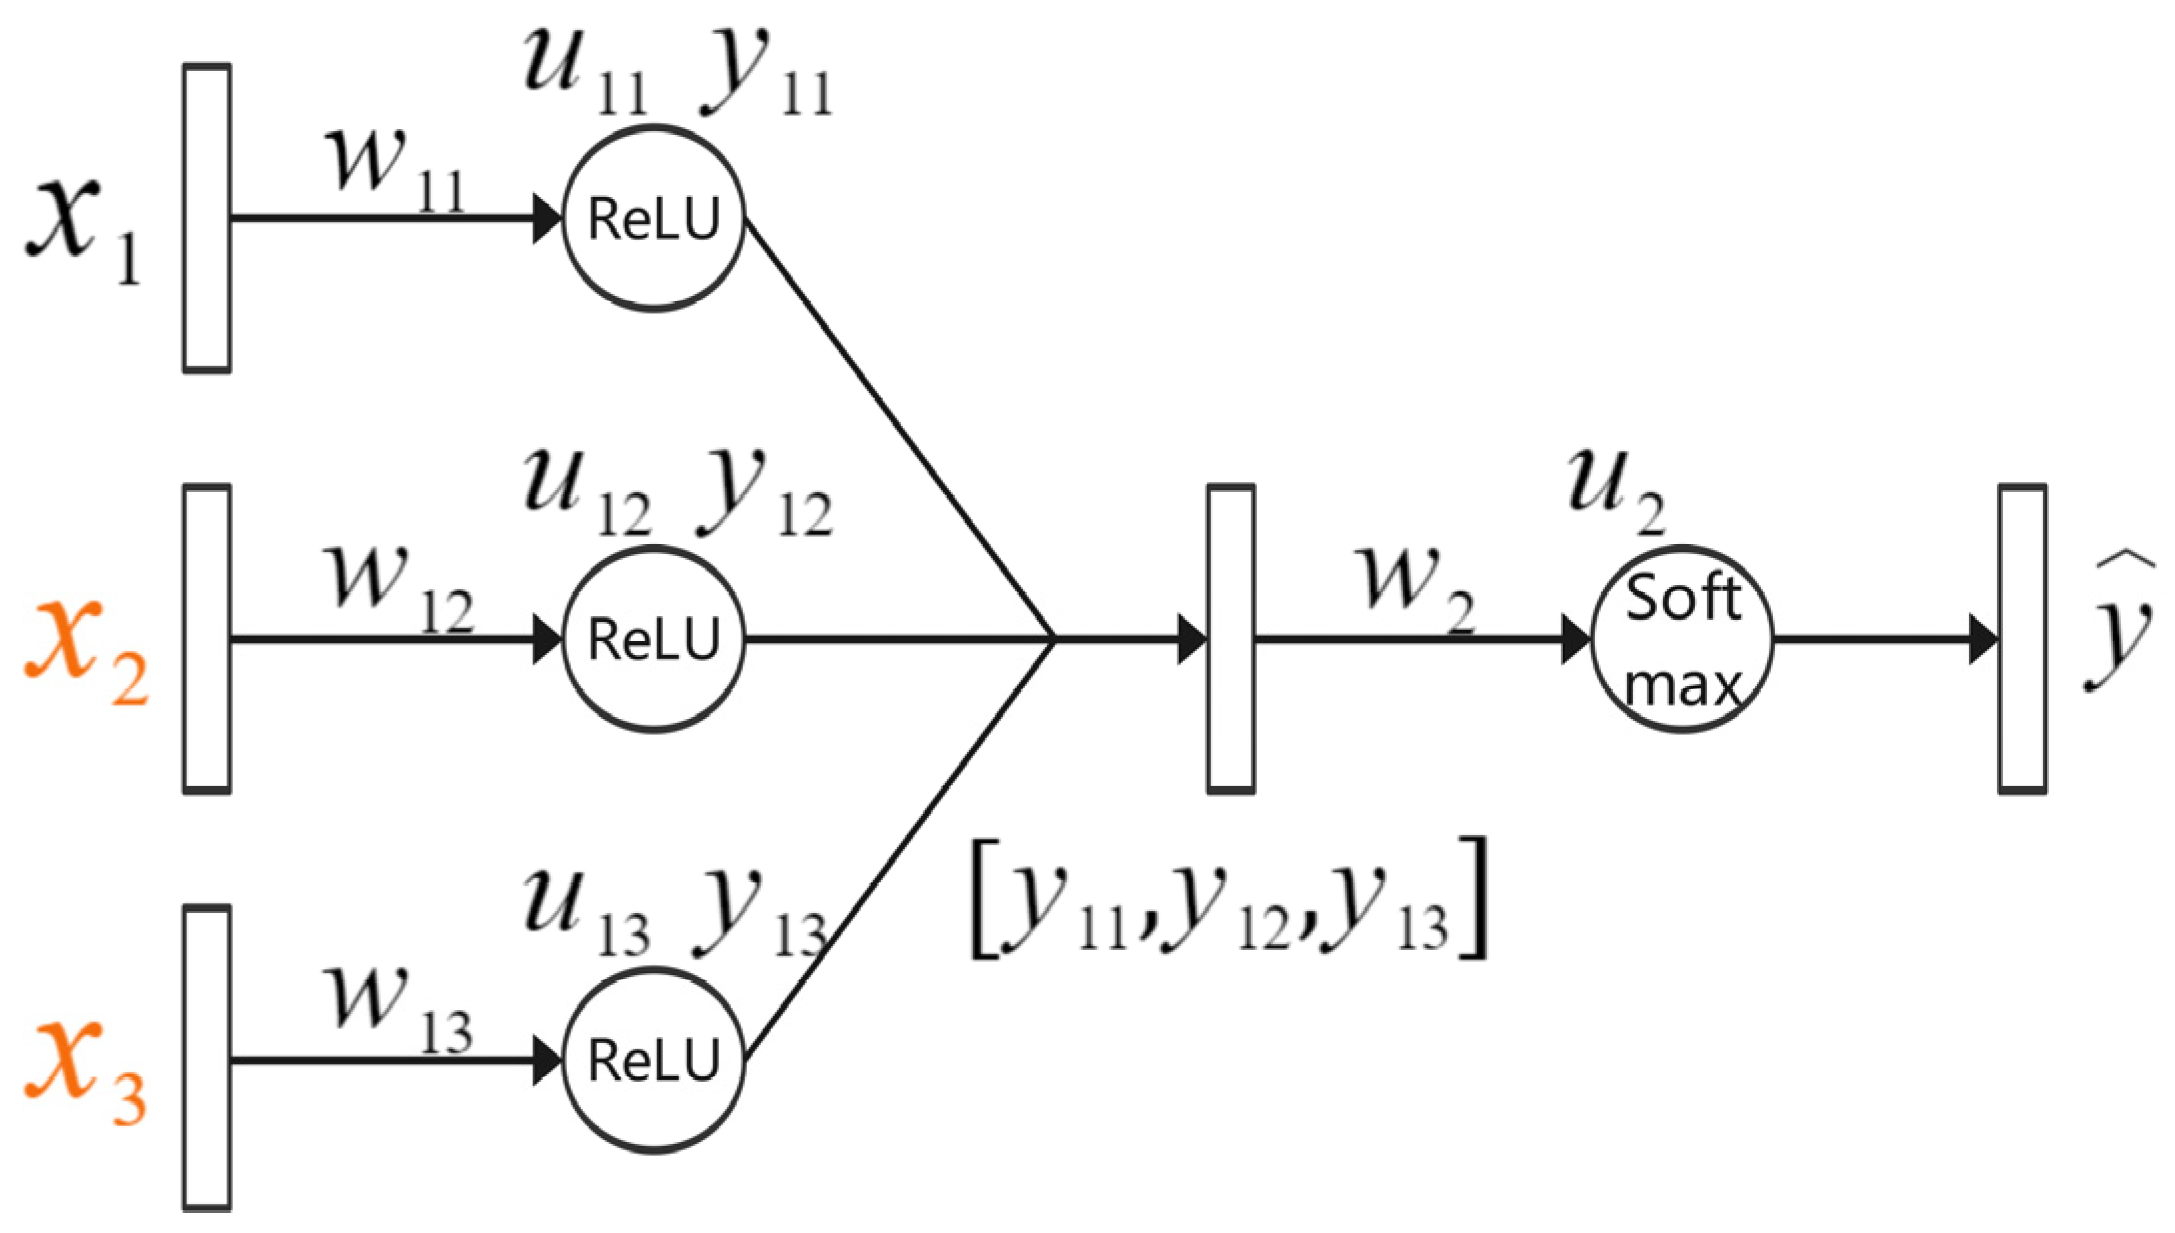
3.4. Improved Loss Function-Assisted Fusion of Commodity Features

To acquire uniform commodity features, we designed a three-channel parallel neural network to extract the features of keyframe images, features, and comments and integrate them. MobileNetV2 was used to extract the images’ features, and MLP was used to extract the attributes’ features and the comment’s features; that is, the text vector obtained in Section 3.2 was inputted into the MLP. The l text -dimensional feature vector of text information was obtained by feature extraction. Because the comments and attributes of the commodity are both word-based descriptions, we hoped to retain the different types of information contained in them to a greater extent. Therefore, the algorithm introduced Pearson’s correlation coefficient into the network loss function to measure the correlations between comments and attributes. The features of comments were calculated as X r e v = x r e v 1 , x r e v 2 , , x r e v z and the features of the attribute were calculated as X p r o = x p r o 1 , x p r o 2 , , x p r o z . Then Pearson’s correlation coefficient for the comment features and attribute features could be obtained via Formula (3)
ρ X r e v X p r o = C o v X r e v , X p r o σ X r e v σ X p r o
where C o v X r e v , X p r o represents the covariance of X r e v and X p r o , and σ X r e v = i = 1 z X r e v E X r e v 2 z and σ X p r o = i = 1 z X p r o E X p r o 2 z are the variances of X r e v and X p r o , respectively.
C o v X r e v , X p r o = i = 1 z X r e v i E X r e v X p r o i E X p r o z
where E X r e v = i = 1 z x r e v i z is the expectation of X r e v and E X p r o = i = 1 z x p r o i z is the expectation of X p r o . The loss function combining the cross-entropy and Pearson’s correlation coefficient is defined by Formula (5)
L = 1 N i c = 1 M y i c log p i c + ρ X r e v X p r o 2
= 1 N i c = 1 M y i c log p i c + i = 1 z X r e v i E X r e v X p r o i E X p r o i = 1 z X r e v E X r e v 2 i = 1 z X p r o E X p r o 2 2
where N is the total number of samples, M is the number of categories, and y i c is the symbolic item, which has a value of 0 or 1. When the true category of sample i is c, this took 1; otherwise, 0 was taken. p i c represents the probability that sample i belongs to category c. When L decreases gradually, ρ X r e v X p r o also decreases, which means that the attributes and comments become increasingly irrelevant. The purpose of this approach is to preserve more diversified features within them and enrich the features after fusion. In this study, the influence of L on the weight was derived in detail by taking the one-layer MLP network as an example, as shown in Figure 3.
L = 1 N i c = 1 M y i c log y ^ i c + h = 1 d y 12 h y ¯ 12 y 13 h y ¯ 13 h = 1 d y 12 h y ¯ 12 2 h = 1 d y 13 h y ¯ 13 2 2
where d represents the output dimension of the hidden layer for the jth element w 13 j in w 13 :
L w 13 j = L c e w 13 j + L c o w 13 j
L c o w 13 j = L c o y 13 j y 13 j u 13 j u 13 j w 13 j
L c o y 13 j = 1 1 d y 12 j y ¯ 12 σ 12 σ 13 ρ y 13 j y ¯ 13 σ 13 2
L c o w 13 j = 1 1 d y 12 j y ¯ 12 σ 12 σ 13 ρ y 13 j y ¯ 13 σ 13 2 x 3
where L c e w 13 j represents the gradient of cross-entropy. The derivative of Pearson’s correlation coefficient of the loss function proposed in this study was derived as L c o w 13 j . Moreover, y ¯ 12 and y ¯ 13 represent the mean values of y 12 and y 13 , respectively; σ 12 and σ 13 represent the variances of y 12 and y 13 , respectively; and ρ represents the Pearson’s correlation coefficients of y 12 and y 13 . It can be observed from the results that the updating of w 13 is related not only to y 13 and x 3 but also to y 12 . Therefore, the information between the two branches can be fully utilized when the weight is updated to achieve a better fusion effect. The fusion network training process is shown in Algorithm 1.
Algorithm 1 The fusion network training process
Input: Training data
Output: Category
  Step 1: Select some training data
  Step 2: The predicted value is obtained by forward propagation
  Step 3: Loss backpropagates and updates the parameters of MobileNet-V2 and the three MLPS simultaneously
  Step 4: if not reaching the training times then
      Redo Step (1)
    else
      Finish training

4. Experiments

The performance and rationality of the proposed algorithm were verified by experiments. First, the overall effect of a multisource heterogeneous information fusion network was validated. Second, the proposed algorithm was compared with the existing fusion algorithm, and then the necessity of each item in the fusion algorithm was verified.

4.1. Dataset and Experimental Setup

The current boom in e-commerce has produced a huge amount of commodity data, including commodity attributes, videos, and user comments. However, no public dataset contains the aforementioned three elements, so we downloaded and constructed a clothes dataset from Jingdong (www.jingdong.com, accessed on 4 October 2021). It contains 759 samples in four categories: clothes, pants, shoes, and hats. The basic parameters are shown in Table 1. For a comparison, we used the Amazon dataset, which includes commodity attributes, images, and user comments. The basic parameters are shown in Table 2.
The experimental hardware used an Intel Core i7-8700k CPU, 64 GB of RAM, and an Nvidia GeForce GTX 1080 Ti graphics card. The software environment used Python version 3.7 and GPU-accelerated network training when training the MobileNetV2 network.
After trial and error, a MLP network with five layers was applied to deal with commodities’ comments and attribute text, and a MLP network with two layers was used to process the image information. The specific network architecture is displayed in Figure 4.

4.2. Comparison Algorithms and Evaluation Metrics

Three contrast fusion algorithms were used: (1) Concatenate: the acquired image, comments, and attribute features were concatenated into a vector as the fusion feature of the product; (2) MCB [58]: this fusion algorithm is used for multimodal compact bilinear pooling to combine the features of two modes; (3) ViLT [59]: this was used to integrate image and text information.
To evaluate the effectiveness of the proposed algorithm, three commonly used metrics were adopted here, i.e., accuracy, recall, and F1 score. First, the confusion matrix was constructed, as shown in Table 3, where T a , T b , T c , and T d represent the four types of samples correctly classified; T t represents the total number of all samples; and F g h , g = a , b , c , d , h = a , b , c , d represents the g-type samples incorrectly classified as type h. In this way, Formulas (6)–(8) were obtained. The range of the accuracy, recall, and F1 score was [0, 1]. The closer the value is to 1, the better the effect.
A c c u r a c y = T a + T b + T c + T d T t
R e c a l l = 1 4 × T a S a + T b S b + T c S c + T d S d
F 1 = 1 2 × T a S a + S a + T b S b + S b + T c S c + S c + T d S d + S d

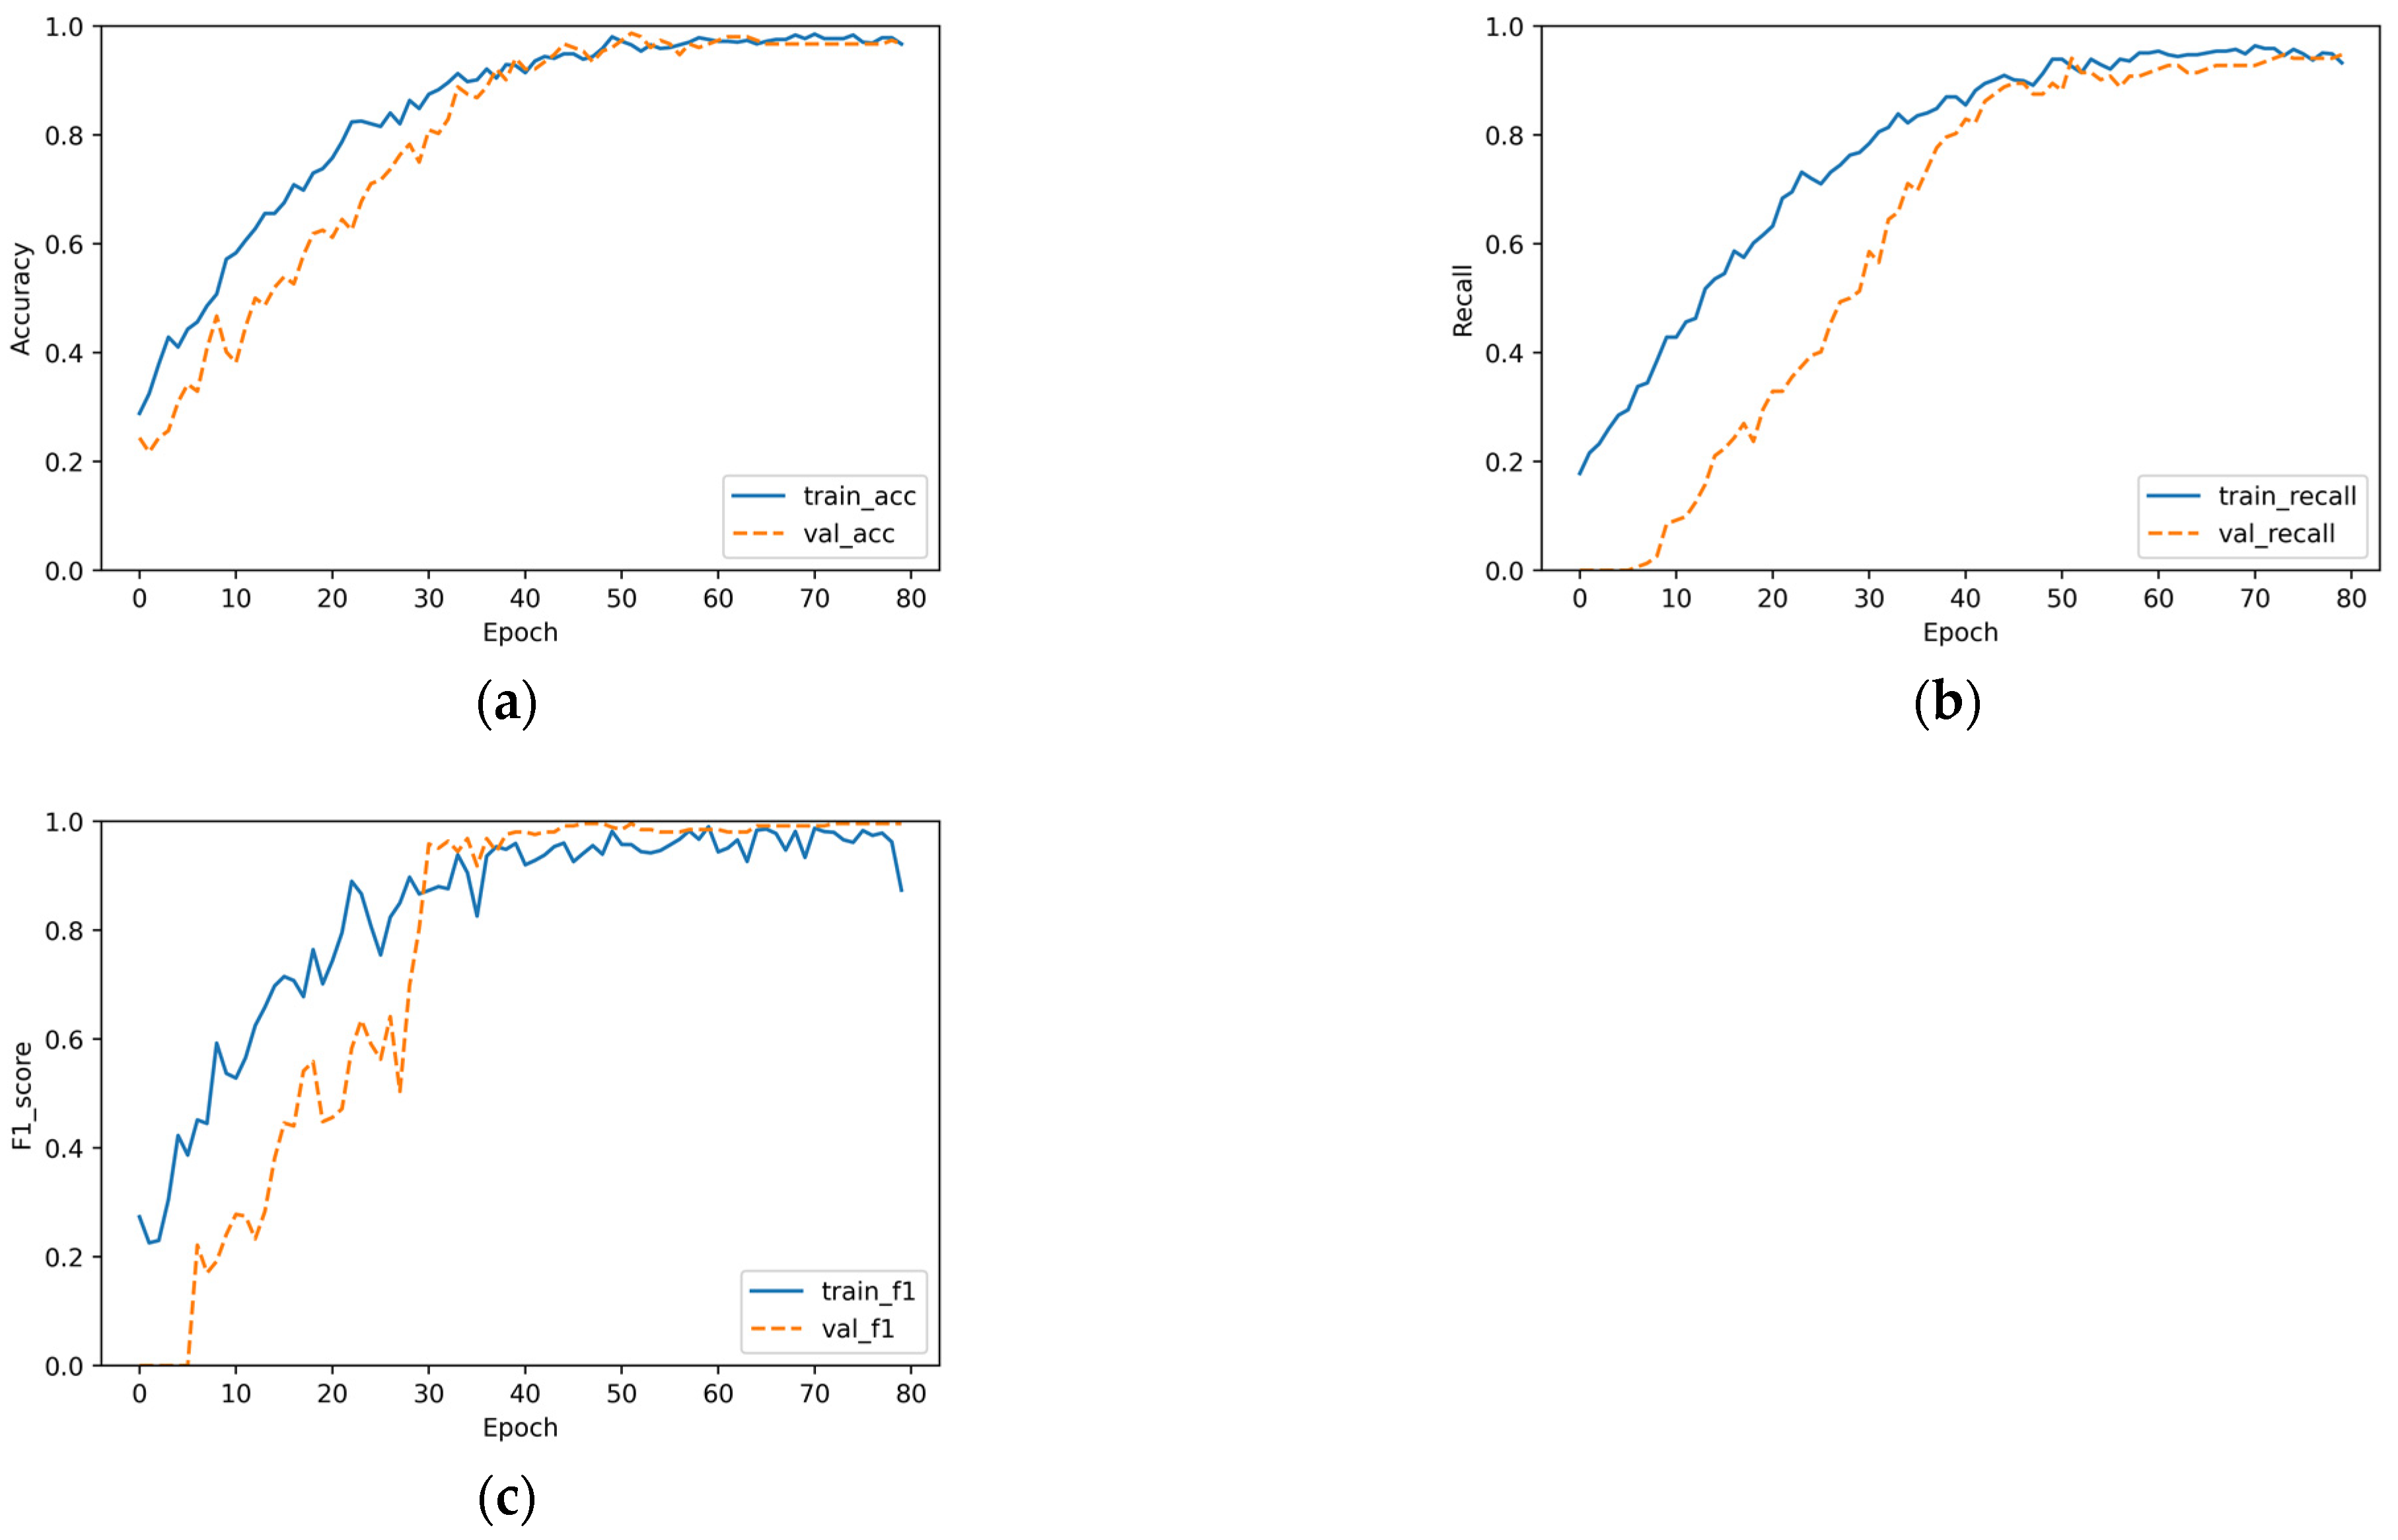
4.3. Performance of Our Algorithm on the Clothes Dataset

The algorithm was applied to the Clothes dataset, and the Word2Vec model trained by Shen Li et al. [47] was used to vectorize the text information. Its vector length was l e n = 300 ; the other hyperparameters were defined as m = 3 , n = 2 , k = 5 , and e p o c h = 80 ; and the learning rate was l = 0.0001 after many experiments. The ratio of the training set to the validation set was 8:2.
As can be observed in Figure 5, the overall classification accuracy of the proposed algorithm was relatively high, and the convergence of the recall and F1 score was >0.95, which indicates that for commodity data, the proposed algorithm could extract and the fuse features well, proving the effectiveness of the algorithm.

4.4. Comparative Experiments

Because MCB and ViLT are both modal fusion algorithms, images and attributes were used for fusion, and the fused features were sent to the softmax classifier for learning and classification. The experiment was carried out on the Clothes dataset and the Amazon dataset. The Amazon dataset contained 8600 items in five categories.
As can be observed in Table 4, although the fusion effect of MCB was the best for the training set and each index was close to 1, its effect was poor for the validation set, with a serious overfitting phenomenon. Compared with Concatenate and ViLT, the accuracy, recall, and F1 value of the verification set of the proposed algorithm improved, but the accuracy was similar. In a specific comparison with Concatenate, the accuracy, recall, and F1 score of the proposed algorithm increased by 10.5%, 11.6%, and 20.9%, respectively; compared with ViLT, the accuracy, recall, and F1 score increased by 16.7%, 54.9%, and 84.8%, respectively.
As can be seen in Table 5, MCB still had serious overfitting on the Amazon dataset. The effect of ViLT and Concatenate decreased compared with that for the small dataset, while the algorithm proposed here had a more comparable performance. Compared with Concatenate, the accuracy, recall, and F1 score of the proposed algorithm increased by 10.5%, 11.6% and 20.9%, respectively; compared with ViLT, the accuracy, recall, and F1 score increased by 16.7%, 54.9% and 84.8%, respectively. It can be seen that the performance of the proposed algorithm for accurately representing a product was greatly improved.
In order to verify the computational complexity of the algorithm, we compared the running time of MCB, ViLT, and the proposed algorithm. We calculated the average value of 100 experiments, and the results are shown in Table 6. The results show that MCB had the shortest running time but the worst effect. Compared with ViLT, the running time of the proposed algorithm improved by 74.1%. In conclusion, the algorithm in this study had low computational complexity under the conditions of high fusion accuracy.

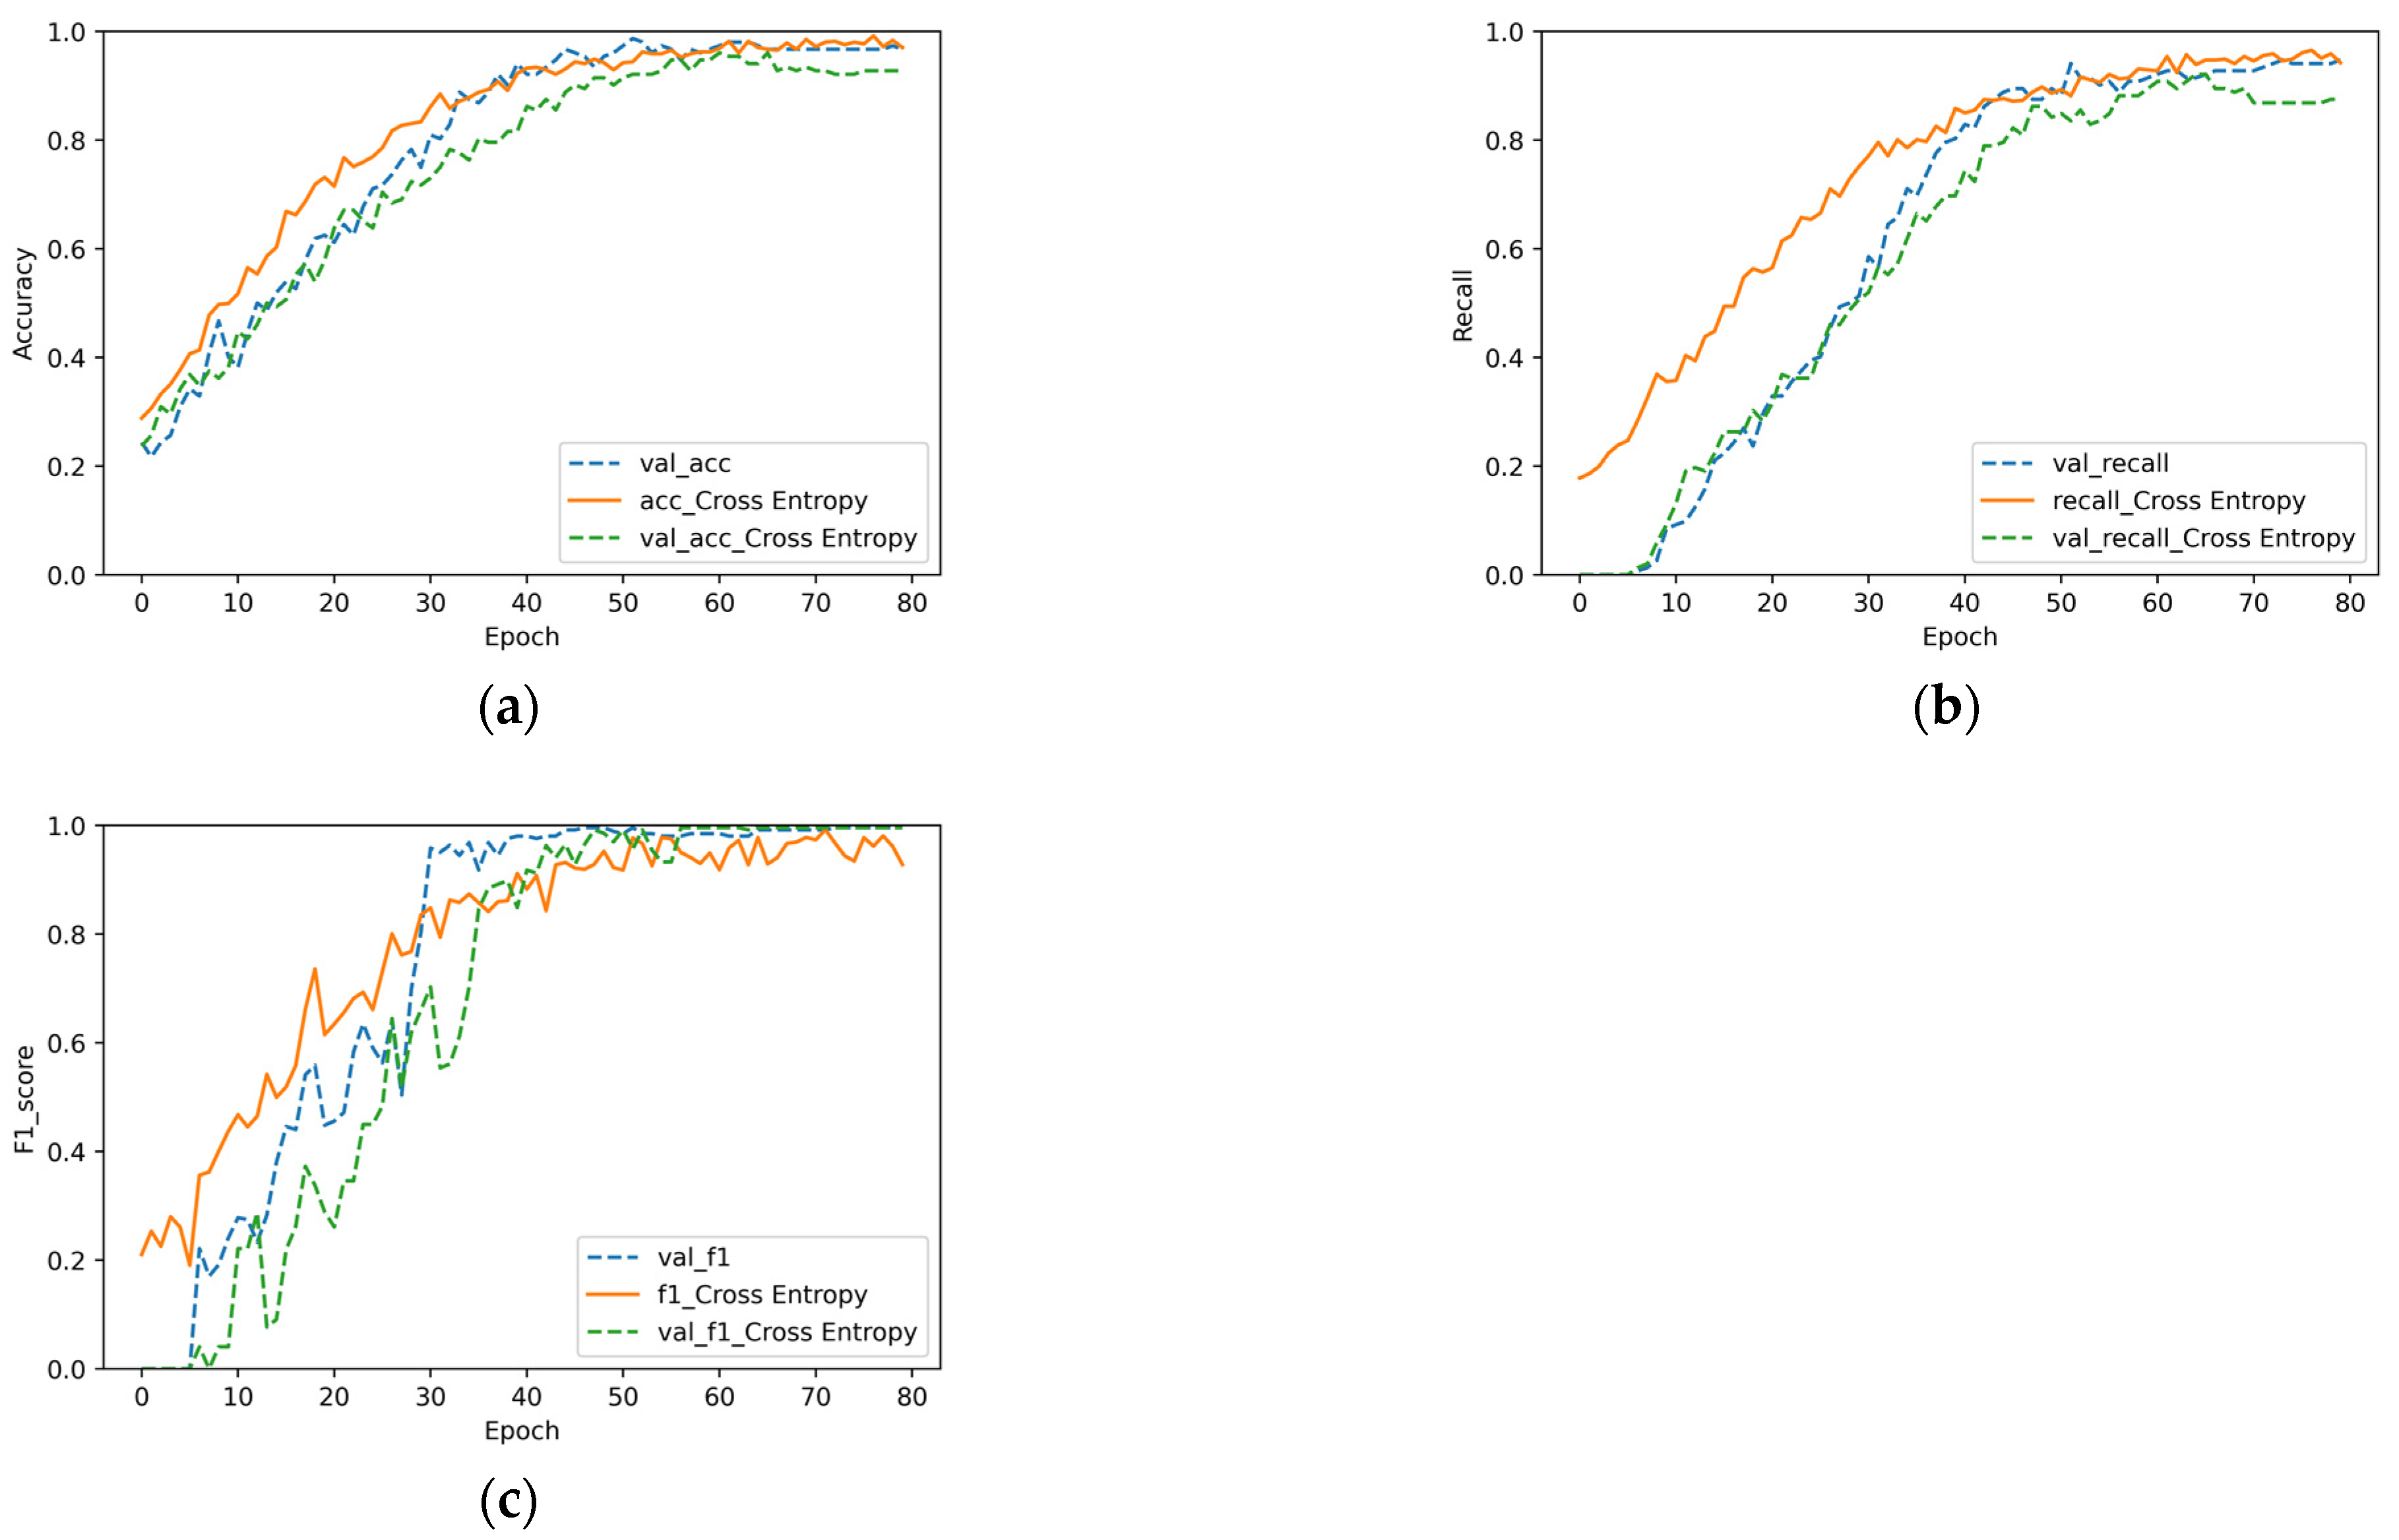
4.5. Validity of the Improved Loss Function

To verify the effectiveness of our loss function, the model used only cross-entropy as the loss for the experiment, and the values of the other hyperparameters remain unchanged. The results of the two experiments were compared with each other.
The results are displayed in Figure 6, where “val_acc” in Figure 6a represents the accuracy on the validation set in the experiment conducted with improved loss. “acc_Cross Entropy” and “val_acc_Cross Entropy”, respectively, represent the accuracy on the training and validation set of the experiment conducted with cross-entropy. The annotations in Figure 6b,c have similar definitions. As can be observed in Figure 6, the F1 scores of the two methods were very similar, and the experimental results of loss of the verification set for improvements in the accuracy and recall were slightly better than those of cross-entropy. After 75 rounds of training, the results of model convergence indicated that the accuracy of the verification set was 0.967 and 0.921. The effect was improved by approximately 5%, and the recall rate was 0.941 and 0.868, with an increase of approximately 8.4%. It can be observed that the use of an improved loss function had a positive effect on the feature fusion.

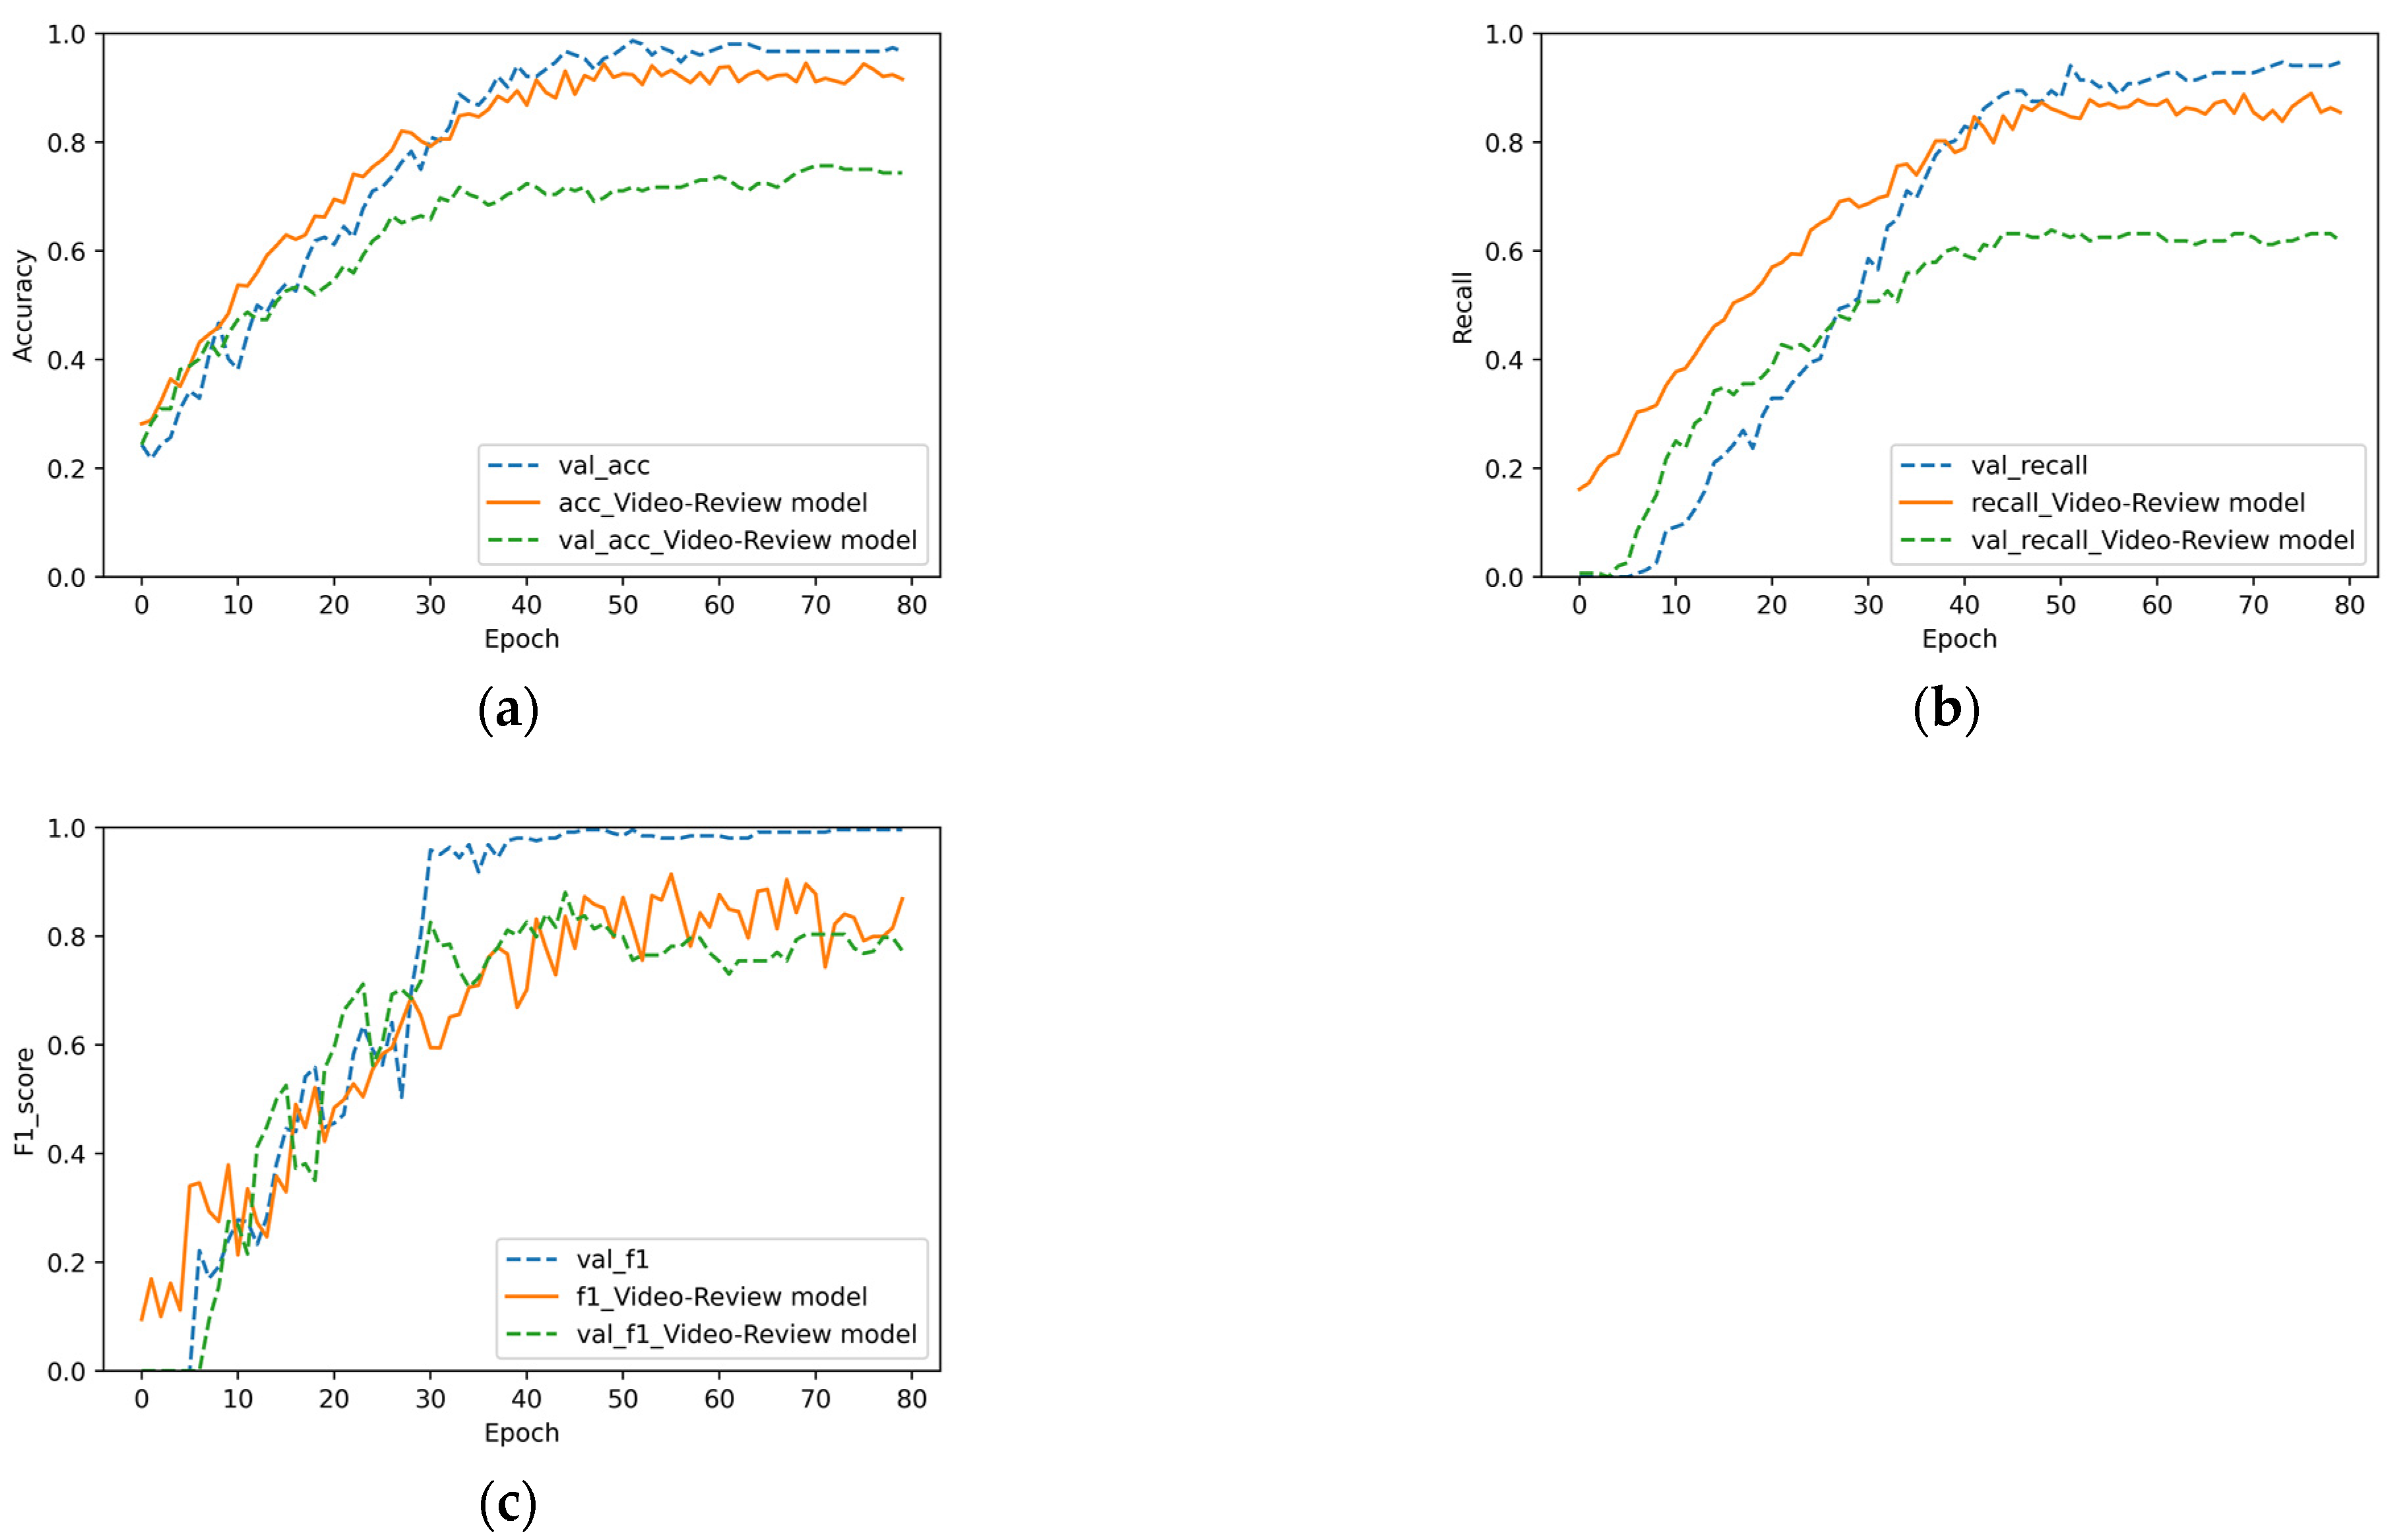
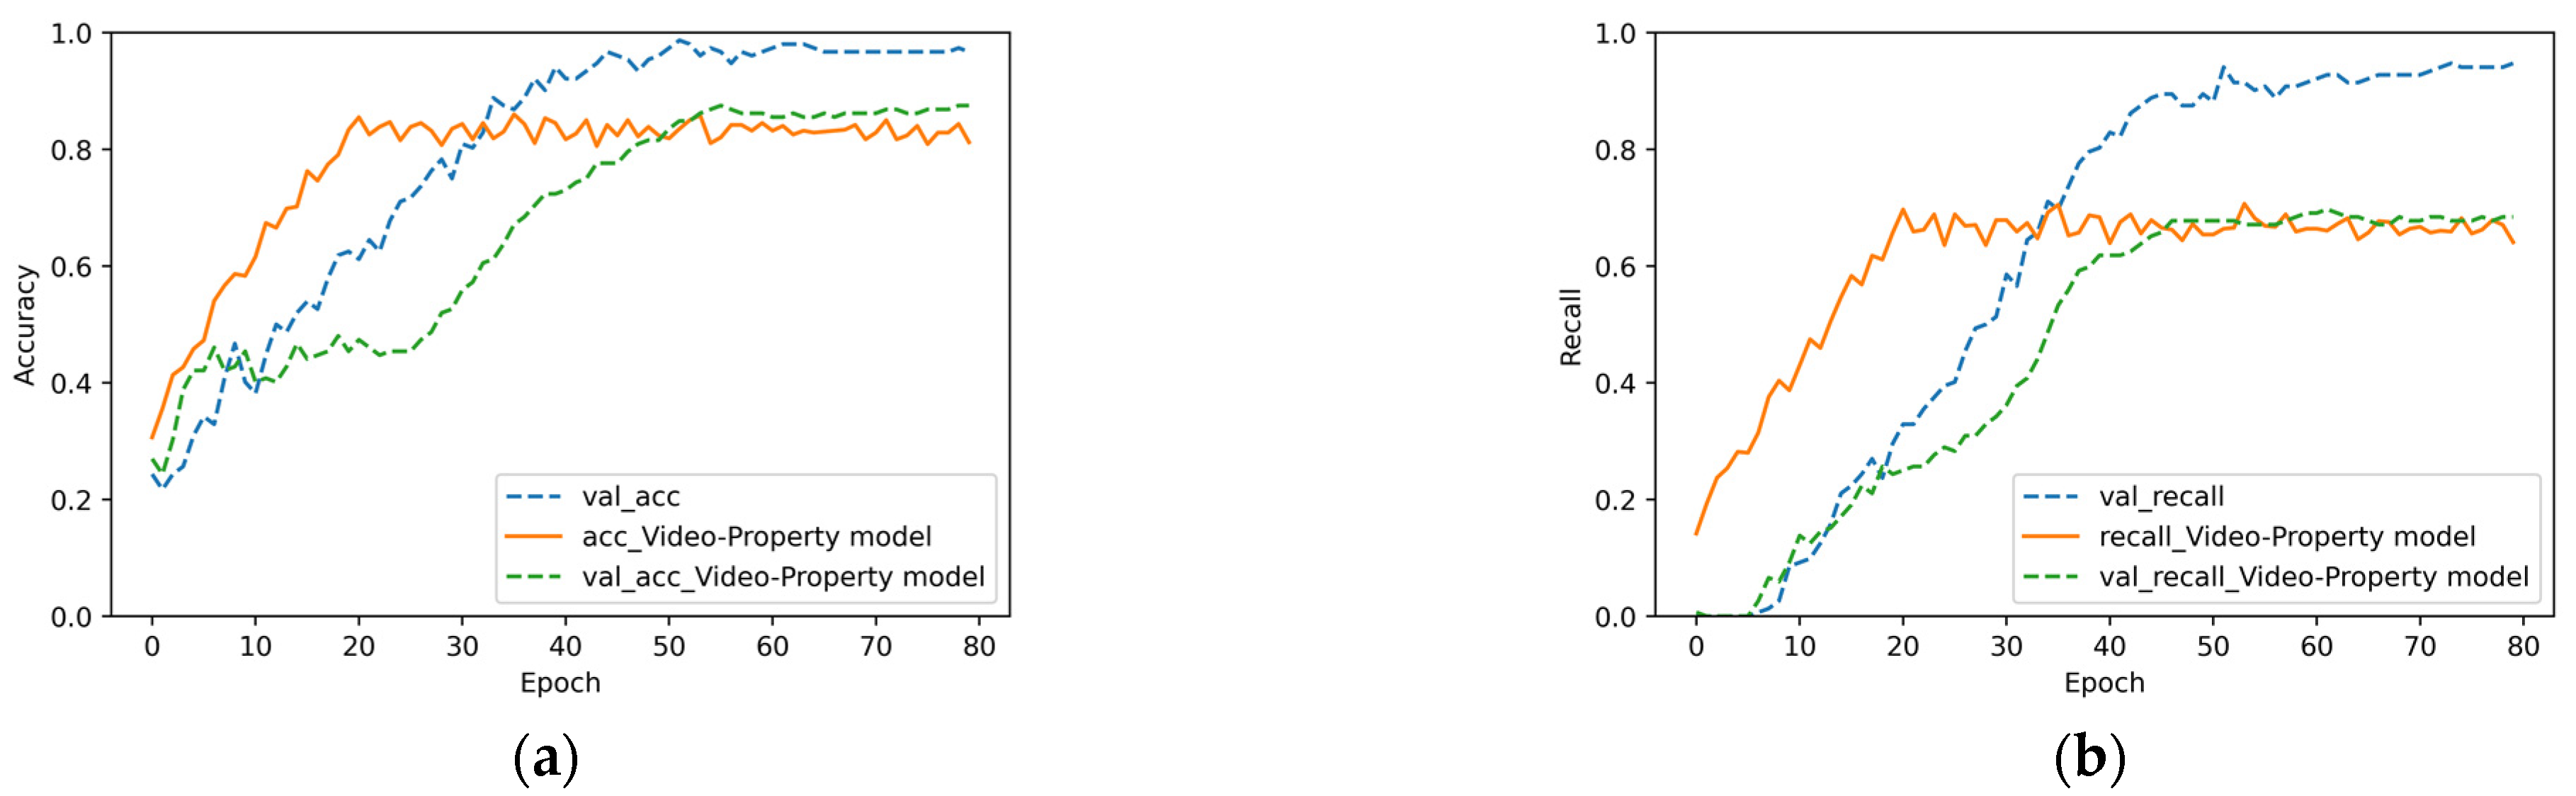
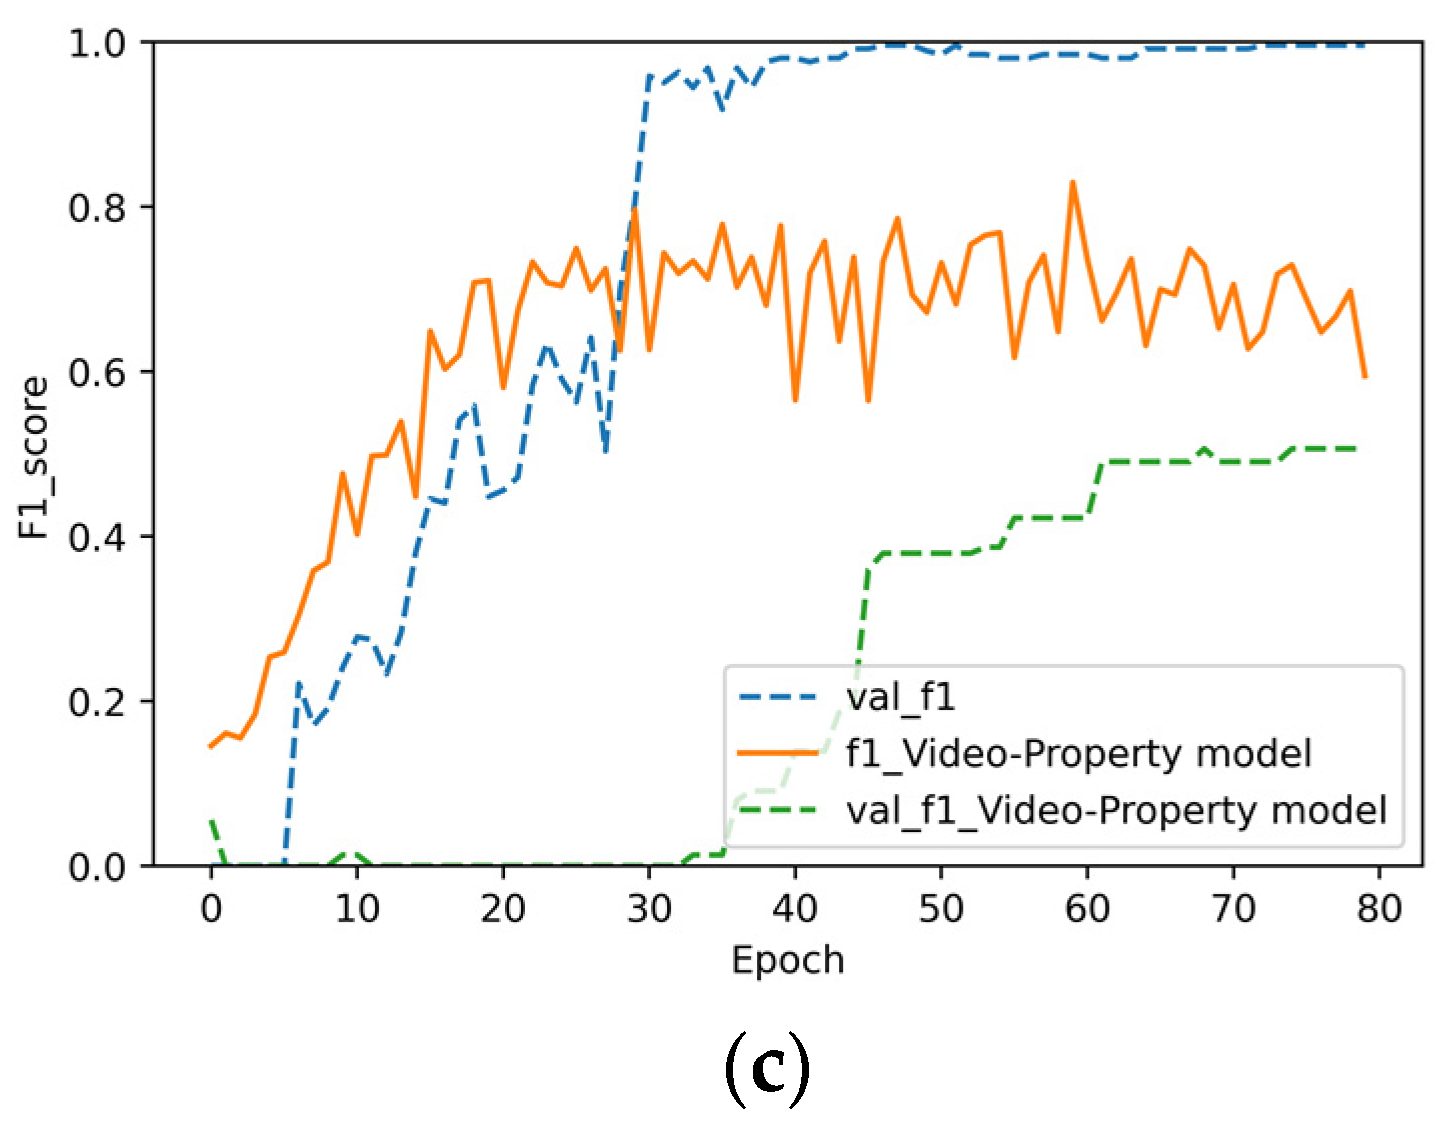
4.6. Value of Multisource Heterogeneous Information

To verify the value of fusing different sources of UGC, three pair-to-pair fusion models were designed in this experiment, namely, fusion of videos and comments (denoted as the video–review model), fusion of videos and properties (denoted as the video–property model), and fusion of comments and properties (denoted as the review–property model). Compared with the original fusion model, in these three models, only the data input changed, whereas the other parameters remained unchanged.
In Figure 7, Figure 8 and Figure 9, “val_acc”, “val_recall”, and “val_f1” represent the accuracy rate, recall rate, and F1 value of the original model for the verification set, respectively. It can be observed in Figure 7, Figure 8 and Figure 9 that the fusion of three features is better than that of two. For the fusion of videos and comments reflected in Figure 7, the accuracy of the original model was 21% higher. Meanwhile, Figure 7a,b also reflects the overfitting phenomenon of the video–review model (Figure 8). The accuracy of the original model was approximately 10% higher. It can be observed that for commodity data, comments and commodity attribute text are equally important. In Figure 9a, the accuracy of the verification set was 16.7% higher than that of the training set. This phenomenon was caused by the addition of the dropout layer to the full connection layer, which made the accuracy of the training set lower than that of the verification set. To summarize, each heterogeneous feature of a commodity plays an important role in the commodity itself. The algorithm in this study is suitable for the fusion of video and text features, but it cannot deal with plain text features.

5. Conclusions

To integrate the UGC of a commodity for accurate representation, we proposed a fusion model for multisource and heterogeneous information based on neural networks, LDA, Word2Vec, and MobileNetV2 with an improved loss function. For video information, the keyframes were extracted, and then MobileNetV2 was used for feature extraction. Comments were converted into a vector by LDA and Word2Vec, and attributes were also converted into vectors by Word2Vec after word segmentation. After extracting the features from the vectors of comments and attributes through MLP, the vectors were fused with the video features, and the final feature representation of the product was acquired through several layers of a fully connected network. The experimental results indicated that the proposed algorithm is effective and can accurately achieve vectorized representation of commodities.

Author Contributions

Conceptualization, X.S. and G.M.; methodology, G.M.; software, G.M.; validation, G.M., X.S. and W.W.; data curation, G.M.; writing—original draft preparation, G.M.; writing—review and editing, X.S.; visualization, G.M.; supervision, X.S.; project administration, X.S. All authors have read and agreed to the published version of the manuscript.

Funding

This work is partially supported by the National Natural Science Foundation of China (Grant No. 61876184).

Institutional Review Board Statement

Not applicable.

Informed Consent Statement

Informed consent was obtained from all subjects involved in the study.

Data Availability Statement

The Amazon data set can be found here: http://jmcauley.ucsd.edu/data/amazon/index_2014.html. The clothing data set are not publicly available due to copyright issues.

Conflicts of Interest

The authors declare no conflict of interest.

References

  1. Bramon, R.; Boada, I.; Bardera, A.; Rodriguez, J.; Feixas, M.; Puig, J.; Sbert, M. Multimodal Data Fusion Based on Mutual Information. IEEE Trans. Vis. Comput. Graph. 2012, 18, 1574–1587. [Google Scholar] [CrossRef] [PubMed]
  2. Bronstein, M.M.; Bronstein, A.M.; Michel, F.; Paragios, N. Data fusion through crossmodality metric learning using similarity-sensitive hashing. In Proceedings of the 2010 IEEE Computer Society Con-ference on Computer Vision and Pattern Recognition, San Francisco, CA, USA, 13–18 June 2010; pp. 3594–3601. [Google Scholar] [CrossRef]
  3. Poria, S.; Cambria, E.; Bajpai, R.; Hussain, A. A review of affective computing: From unimodal analysis to multimodal fusion. Inf. Fusion 2017, 37, 98–125. [Google Scholar] [CrossRef] [Green Version]
  4. Man, G.; Sun, X. Interested Keyframe Extraction of Commodity Video Based on Adaptive Clustering Annotation. Appl. Sci. 2022, 12, 1502. [Google Scholar] [CrossRef]
  5. Yu, X.; Ren, X.; Sun, Y.; Gu, Q.; Sturt, B.; Khandelwal, U.; Norick, B.; Han, J. Personalized entity recommendation: A Heterogeneous Information Network Approach. In Proceedings of the 7th ACM International Conference on Web Search and Data Mining, New York, NY, USA, 24–28 February 2014; pp. 283–292. [Google Scholar] [CrossRef]
  6. Li, Y.; Wang, R.; Nan, G.; Li, D.; Li, M. A personalized paper recommendation method considering diverse user preferences. Decis. Support Syst. 2021, 146, 113546. [Google Scholar] [CrossRef]
  7. Ishanka, U.A.P.; Yukawa, T. The Prefiltering Techniques in Emotion Based Place Recommendation Derived by User Reviews. Appl. Comput. Intell. Soft Comput. 2017, 2017, 1–10. [Google Scholar] [CrossRef] [Green Version]
  8. Tang, J.; Wang, K. Personalized Top-N Sequential Recommendation via Convolutional Sequence Embedding. In Proceedings of the Eleventh ACM International Conference on Web Search and Data Mining, New York, NY, USA, 5–9 February 2018; pp. 565–573. [Google Scholar] [CrossRef] [Green Version]
  9. Zhang, F.; Wang, H.; Xie, X.; Guo, M.; Xie, X. DKN: Deep Knowledge-Aware Network for News Recommendation. In Proceedings of the 2018 World Wide Web Conference, Lyon, France, 23–27 April 2018; pp. 1835–1844. [Google Scholar] [CrossRef] [Green Version]
  10. Hwang, S.; Park, E. Movie Recommendation Systems Using Actor-Based Matrix Computations in South Korea. IEEE Trans. Comput. Soc. Syst. 2021, 9, 1387–1393. [Google Scholar] [CrossRef]
  11. Cui, Z.; Xu, X.; Xue, F.; Cai, X.; Cao, Y.; Zhang, W.; Chen, J. Personalized Recommendation System Based on Collaborative Filtering for IoT Scenarios. IEEE Trans. Serv. Comput. 2020, 13, 685–695. [Google Scholar] [CrossRef]
  12. Wang, Z.; Wan, M.; Cui, X.; Liu, L.; Liu, Z.; Xu, W.; He, L. Personalized Recommendation Algorithm Based on Product Reviews. J. Electron. Commer. Organ. 2018, 16, 22–38. [Google Scholar] [CrossRef]
  13. Islek, I.; Oguducu, S.G. A hierarchical recommendation system for E-commerce using online user reviews. Electron. Commer. Res. Appl. 2022, 52, 101131. [Google Scholar] [CrossRef]
  14. Ma, L.; Lu, Z.; Shang, L.; Li, H. Multimodal Convolutional Neural Networks for Matching Image and Sentence. In Proceedings of the 2015 IEEE In-ternational Conference on Computer Vision (ICCV), Santiago, Chile, 7–13 December 2015; pp. 2623–2631. [Google Scholar] [CrossRef] [Green Version]
  15. Hou, J.-C.; Wang, S.-S.; Lai, Y.-H.; Tsao, Y.; Chang, H.-W.; Wang, H.-M. Audio-Visual Speech Enhancement Using Multimodal Deep Convolutional Neural Networks. IEEE Trans. Emerg. Top. Comput. Intell. 2018, 2, 117–128. [Google Scholar] [CrossRef] [Green Version]
  16. Nguyen, T.-L.; Kavuri, S.; Lee, M. A multimodal convolutional neuro-fuzzy network for emotion understanding of movie clips. Neural Netw. 2019, 18, 208–219. [Google Scholar] [CrossRef]
  17. Gan, M.X.; Zhang, H. DeepFusion: Fusing User-Generated Content and Item Raw Content towards Personalized Product Recommendation. Complexity 2020, 2020, 4780191. [Google Scholar] [CrossRef]
  18. Zhang, K.; Li, Y.; Wang, J.; Wang, Z.; Li, X. Feature Fusion for Multimodal Emotion Recognition Based on Deep Canonical Correlation Analysis. IEEE Signal Process. Lett. 2021, 28, 1898–1902. [Google Scholar] [CrossRef]
  19. Wang, H.J.; Zhang, Z.H.; Wang, P.W. A Situation Analysis Method for Specific Domain Based on Multi-source Data Fusion. Intell. Comput. Theor. Appl. 2018, 10954, 160–171. [Google Scholar] [CrossRef]
  20. Zhang, D.; Yao, L.; Chen, K.; Wang, S.; Chang, X.; Liu, Y. Making Sense of Spatio-Temporal Preserving Representations for EEG-Based Human Intention Recognition. IEEE Trans. Cybern. 2020, 50, 3033–3044. [Google Scholar] [CrossRef]
  21. Jiang, T.; Wang, H.; Luo, X.; Xie, S.; Wang, J. MIFAS:Multi-sourceheterogeneous information fusion with adaptive importance sampling for link prediction. Expert Syst. 2021, 39, e12888. [Google Scholar] [CrossRef]
  22. Jiming, H.; Wei, S. An Object-Centric Multi-source Heterogeneous Data Fusion Scheme. In Proceedings of the IEEE International Conference on Information Communication and Software Engineering (ICICSE), Chengdu, China, 19–21 March 2021; pp. 24–29. [Google Scholar] [CrossRef]
  23. Li, Y.; Li, Q.; Gao, J.; Su, L.; Zhao, B.; Fan, W.; Han, J. Conflicts to Harmony: A Framework for Resolving Conflicts in Heterogeneous Data by Truth Discovery. IEEE Trans. Knowl. Data Eng. 2016, 28, 1986–1999. [Google Scholar] [CrossRef]
  24. Nti, I.K.; Adekoya, A.F.; Weyori, B.A. A novel multi-source information-fusion predictive framework based on deep neural networks for accuracy enhancement in stock market prediction. J. Big Data 2021, 8, 17. [Google Scholar] [CrossRef]
  25. Gao, Y.; Ran, L.X. Collaborative Filtering Recommendation Algorithm for Heterogeneous Data Mining in the Internet of Things. IEEE Access 2019, 7, 123583–123591. [Google Scholar] [CrossRef]
  26. Ji, Z.; Yang, C.; Wang, H.; Armendáriz-Iñigo, J.E.; Arce-Urriza, M. BRS cS: A hybrid recommendation model fusing multi-source heterogeneous data. EURASIP J. Wirel. Commun. Netw. 2020, 2020, 124. [Google Scholar] [CrossRef]
  27. Zhu, H.; Wang, Z.; Shi, Y.; Hua, Y.; Xu, G.; Deng, L. Multimodal Fusion Method Based on Self-Attention Mechanism. Wirel. Commun. Mob. Comput. 2020, 2020, 1–8. [Google Scholar] [CrossRef]
  28. Du, P.F.; Gao, Y.L.; Li, X.Y. Bi-attention Modal Separation Network for Multimodal Video Fusion. In Proceedings of the International Conference on Multimedia Modeling, Phu Quoc, Vietnam, 6–10 June 2022; pp. 585–598. [Google Scholar] [CrossRef]
  29. Zhang, X.; Gong, Y.; Li, Z.; Liu, X.; Pan, S.; Li, J. Multi-Modal Attention Guided Real-Time Lane Detection. In Proceedings of the 6th IEEE International Conference on Advanced Robotics and Mechatronics (ICARM), Chongqing, China, 3–5 July 2021; pp. 146–153. [Google Scholar] [CrossRef]
  30. Zhang, W.; Yu, J.; Wang, Y.; Wang, W. Multimodal deep fusion for image question answering. Knowl. Based Syst. 2021, 212, 106639. [Google Scholar] [CrossRef]
  31. Sun, Y.; Fu, Z.; Sun, C.; Hu, Y.; Zhang, S. Deep Multimodal Fusion Network for Semantic Segmentation Using Remote Sensing Image and LiDAR Data. IEEE Trans. Geosci. Remote Sens. 2022, 60, 1–18. [Google Scholar] [CrossRef]
  32. Zhang, Y.F.; Morel, O.; Seulin, R.; Mériaudeau, F.; Sidibé, D. A central multimodal fusion framework for outdoor scene image segmentation. Multimed. Tools Appl. 2022, 81, 12047–12060. [Google Scholar] [CrossRef]
  33. Shen, D.; Zareapoor, M.; Yang, J. Multimodal image fusion based on point-wise mutual information. Image Vis. Comput. 2020, 105, 104047. [Google Scholar] [CrossRef]
  34. Chhabra, P.; Garg, N.K.; Kumar, M. Content-based image retrieval system using ORB and SIFT features. Neural Comput. Appl. 2020, 32, 2725–2733. [Google Scholar] [CrossRef]
  35. Garg, D.; Garg, N.K.; Kumar, M. Underwater image enhancement using blending of CLAHE and percentile methodologies. Multimed. Tools Appl. 2018, 77, 26545–26561. [Google Scholar] [CrossRef]
  36. Luo, M.N.; Chang, X.J.; Nie, L.Q.; Yang, Y.; Hauptmann, A.G.; Zheng, Q. An Adaptive Semisupervised Feature Analysis for Video Semantic Recognition. IEEE Trans. Cybern. 2018, 48, 648–660. [Google Scholar] [CrossRef]
  37. Gupta, S.; Mohan, N.; Kumar, M. A Study on Source Device Attribution Using Still Images. Arch. Comput. Methods Eng. 2021, 28, 2209–2223. [Google Scholar] [CrossRef]
  38. Shaheed, K.; Mao, A.; Qureshi, I.; Kumar, M.; Hussain, S.; Ullah, I.; Zhang, X. DS-CNN: A pre-trained Xception model based on depth-wise separable convolutional neural network for finger vein recognition. Expert Syst. Appl. 2022, 191, 116288. [Google Scholar] [CrossRef]
  39. Tran, D.; Bourdev, L.; Fergus, R.; Torresani, L.; Paluri, M. Learning Spatiotemporal Features with 3D Convolutional Networks. In Proceedings of the 2015 IEEE International Conference on Computer Vision (ICCV), Santiago, Chile, 7–13 December 2015; IEEE: Piscataway, NJ, USA, 2015. [Google Scholar] [CrossRef] [Green Version]
  40. Krizhevsky, A.; Sutskever, I.; Hinton, G.E. Imagenet classification with deep convolutional neural networks. Commun. ACM 2017, 60, 84–90. [Google Scholar] [CrossRef] [Green Version]
  41. Simonyan, K.; Zisserman, A. Very Deep Convolutional Networks for Large-Scale Image Recognition. arXiv 2014, arXiv:1409.1556. [Google Scholar] [CrossRef]
  42. Szegedy, C.; Liu, W.; Jia, Y.; Sermanet, P.; Reed, S.; Anguelov, D.; Erhan, D.; Vanhoucke, V.; Rabinovich, A.; Liu, W.; et al. Going deeper with convolutions. In Proceedings of the 2015 IEEE Conference on Computer Vision and Pattern Recognition (CVPR), Boston, MA, USA, 7–12 June 2015; pp. 1–9. [Google Scholar] [CrossRef] [Green Version]
  43. He, K.; Zhang, X.; Ren, S.; Sun, J. Deep residual learning for image recognition. In Proceedings of the IEEE Conference on Computer Vision and Pattern Recognition, Las Vegas, NV, USA, 27–30 June 2016; pp. 770–778. [Google Scholar] [CrossRef] [Green Version]
  44. Howard, A.G.; Zhu, M.; Chen, B.; Kalenichenko, D.; Wang, W.; Weyand, T.; Andreetto, M.; Adam, H. MobileNets: Efficient Convolutional Neural Networks for Mobile Vision Applications. arXiv 2017, arXiv:1704.04861. [Google Scholar] [CrossRef]
  45. Sandler, M.; Howard, A.; Zhu, M.; Zhmoginov, A.; Chen, L. MobileNetV2: Inverted residuals and linear bottlenecks. In Proceedings of the IEEE/CVF Conference on Computer Vision and Pattern Recognition (CVPR), Salt Lake City, UT, USA, 18–23 June 2018; pp. 4510–4520. [Google Scholar] [CrossRef] [Green Version]
  46. Kim, Y. Convolutional Neural Networks for Sentence Classification. arXiv 2014, arXiv:1408.5882. [Google Scholar] [CrossRef]
  47. Li, S.; Zhao, Z.; Hu, R.; Li, W.; Liu, T.; Du, X. Analogical Reasoning on Chinese Morphological and Semantic Relations; The Association for Computational Linguistics (ACL): Melbourne, Australia, 2018; Volume 2, pp. 138–143. [Google Scholar]
  48. Chiang, D. Hierarchical Phrase-Based Translation. Comput. Linguist. 2007, 33, 201–228. [Google Scholar] [CrossRef]
  49. Gupta, A.; Katarya, R. PAN-LDA: A latent Dirichlet allocation based novel feature extraction model for COVID-19 data using machine learning. Comput. Biol. Med. 2021, 138, 104920. [Google Scholar] [CrossRef] [PubMed]
  50. Doganer, A.; Zhang, Z.J. Evaluating YouTube as a source of information on COVID-19: Analysis with latent Dirichlet allocation method. Bratisl. Med. J. 2021, 122, 325–330. [Google Scholar] [CrossRef]
  51. Kawai, M.; Sato, H.; Shiohama, T. Topic model-based recommender systems and their applications to cold-start problems. Expert Syst. Appl. 2022, 202, 117129. [Google Scholar] [CrossRef]
  52. Guo, Y.X.; Wang, F.; Xing, C.; Lu, X.L. Mining multi-brand characteristics from online reviews for competitive analysis: A brand joint model using latent Dirichlet allocation. Electron. Commer. Res. Appl. 2022, 53, 101141. [Google Scholar] [CrossRef]
  53. Zhao, F.; Ren, X.; Yang, S.; Han, Q.; Zhao, P.; Yang, X. Latent Dirichlet Allocation Model Training With Differential Privacy. IEEE Trans. Inf. Forensics Secur. 2020, 16, 1290–1305. [Google Scholar] [CrossRef]
  54. Sun, J.; Luo, X.; Gao, H.; Wang, W.; Gao, Y.; Yang, X. Categorizing Malware via A Word2Vec-based Temporal Convolutional Network Scheme. J. Cloud Comput. 2020, 9, 53. [Google Scholar] [CrossRef]
  55. Byun, Y.C. Extreme Gradient Boosting for Recommendation System by Transforming Product Classification into Regression Based on Multi-Dimensional Word2Vec. Symmetry 2021, 13, 758. [Google Scholar] [CrossRef]
  56. Xu, D.; Tian, Z.; Lai, R.; Kong, X.; Tan, Z.; Shi, W. Deep learning based emotion analysis of microblog texts. Inf. Fusion 2020, 64, 1–11. [Google Scholar] [CrossRef]
  57. Wang, Y.C.; Zhu, L.G. Research on improved text classification method based on combined weighted model. Concurr. Comput. Pr. Exp. 2020, 32, e5140. [Google Scholar] [CrossRef]
  58. Fukui, A.; Park, D.H.; Yang, D.; Rohrbach, A.; Darrell, T.; Rohrbach, M. Multimodal Compact Bilinear Pooling for Visual Question Answering and Visual Grounding. In Proceedings of the Empirical Methods in Natural Language Processing, Austin, TX, USA, 1–5 November 2016; pp. 457–468. [Google Scholar] [CrossRef] [Green Version]
  59. Kim, W.; Son, B.; Kim, I. Vilt: Vision-And-Language Transformer without Convolution or Region Supervision. In Proceedings of the International Conference on Machine Learning (ICML), Online, 18–24 July 2021; pp. 5583–5594. [Google Scholar]
Figure 1. Proposed framework.
Applsci 13 04217 g001
Figure 2. Keyframe stacking and input. The input dimension of MobileNetV2 is 3 × m + n .
Applsci 13 04217 g002
Figure 3. Single-layer fusion network, where x 1 represents the image features, x 2 represents the X r e v commodity comments, and x 3 represents the X p r o commodity attributes.
Applsci 13 04217 g003
Figure 4. Detailed network architecture of the experiments. FC indicates the fully connected layer.
Applsci 13 04217 g004
Figure 5. The algorithm’s classification results: (a) accuracy, (b) recall, and (c) F1 score.
Applsci 13 04217 g005
Figure 6. Comparison of the effects of the loss function. The results for (a) accuracy, (b) recall, and (c) F1 score.
Applsci 13 04217 g006
Figure 7. Experimental results of the video–review model: (a) accuracy, (b) recall, and (c) F1 score.
Applsci 13 04217 g007
Figure 8. Experimental results of the video–property model: (a) accuracy, (b) recall, and (c) F1 score.
Applsci 13 04217 g008aApplsci 13 04217 g008b
Figure 9. Experimental results of the review–property model: (a) accuracy, (b) recall, and (c) F1 score.
Applsci 13 04217 g009
Table 1. Basic parameters of the clothes dataset.
Number of SamplesAverage Number of Reviews per Item
Clothes200150
Pants225150
Hats121150
Shoes213150
Table 2. Basic parameters of the Amazon dataset.
Number of SamplesAverage Number of Reviews per Item
Gift cards86395
Luxury beauty258647
Magazine subscriptions86026
Prime pantry205844
Software223317
Table 3. Confusion matrix.
True ValueTotal
ClothesPantsHatsShoes
Predicted valueClothes T a F b a F c a F d a S a
Pants F a b T b F c b F d b S b
Hats F a c F b c T c F d c S c
Shoes F a d F b d F c d T d S d
Total S a S b S b S d T t
Table 4. Comparative experimental results on the Clothes dataset. Note: Val_Accuracy, Val_Precision, Val_Recall, and Val_F1 are the accuracy, accuracy, recall, and F1 score, respectively, for the validation set.
ConcatenateMCBViLTOurs
Accuracy0.99511.00000.87310.9786
Val_Accuracy0.87500.28940.82890.9671
Precision1.00001.00001.00001.0000
Val_Precision1.00000.03671.00001.0000
Recall0.98351.00000.66060.9638
Val_Recall0.84870.11180.61180.9474
F10.99970.99990.75840.9901
Val_F10.82360.02060.53880.9959
Table 5. Comparative experimental results on the Amazon dataset. Note: Val_Accuracy, Val_Precision, Val_Recall, and Val_F1 are the accuracy, accuracy, recall, and F1 score, respectively, for the validation set.
ConcatenateMCBViLTOurs
Accuracy0.88890.99310.81230.9998
Val_Accuracy0.82860.21150.81490.9982
Precision0.96581.00000.95610.9971
Val_Precision0.89420.06980.96061.0000
Recall0.85960.97240.74110.9946
Val_Recall0.79820.15680.73811.0000
F10.89380.97720.69090.9997
Val_F10.82210.07930.70220.9963
Table 6. Comparison of the running time of MCB, ViLT, and the proposed algorithm.
MCBViLTOurs
Time0.05180.28420.0737
Disclaimer/Publisher’s Note: The statements, opinions and data contained in all publications are solely those of the individual author(s) and contributor(s) and not of MDPI and/or the editor(s). MDPI and/or the editor(s) disclaim responsibility for any injury to people or property resulting from any ideas, methods, instructions or products referred to in the content.

