Article

Mechanical Stress Prediction of an Aircraft Torque Tube Based on the Neural Network Application

Department of Aviation Engineering, Faculty of Aeronautics, Technical University of Košice, Rampová 7, 041 21 Košice, Slovakia
*
Author to whom correspondence should be addressed.
Appl. Sci. 2023, 13(7), 4215; https://doi.org/10.3390/app13074215
Submission received: 24 February 2023 / Revised: 21 March 2023 / Accepted: 24 March 2023 / Published: 26 March 2023

Abstract

:
The use of a predictive approach in the aviation industry is an important factor in aircraft maintenance. The main goal of this study was to create a new method for stress prediction during the operation of parts and to apply it on an aircraft torque tube (ATT). The method operates in real time during taxiing, takeoff, and landing using a neural network (NN). The stress calculated by the proposed method can be used in the future to calculate fatigue life and to save maintenance costs related to ATTs. This can play an important role in the evaluation of tests, such as unobserved crack failure. The main contribution of the presented methodology is in the fourth part of this study, where a new method of mechanical-stress prediction using a NN is described. The method essentially replaces finite element methods (FEMs), which require large amounts of time. The new method is much faster than commonly available methods, as the NN predicts the mechanical ATT stress in 0.00046 s, whereas the solution time using FEM is 1716 s for the same load step. In total, 36 regimes were calculated by FEMs in 17 h, 9 min and 36 s, whereas the novel method calculated the ATT stress for 36 regimes in 0.0166 s. The accuracy was also high, with R above 0.99. The main innovation presented in this study is the development of a method that can predict ATT stress in a very short time with a high percentage of accuracy and that can be used for stress and life prediction during the operation of parts. The partial results from the experimental tensile tests are also presented, and they are used for FEM calculations. The FEM results are used as inputs for the stress prediction by the NN.

1. Introduction

The trend in the aerospace industry is to produce lightweight mechanical parts from light metals, composites, etc.; however, some aerospace mechanical parts are still made of metal. Metallic materials are extensively used in engineering structures. At the same time, fatigue failure is one of the most common failure modes of metal structures. The fatigue phenomenon occurs when a material is subjected to fluctuating stresses and strains, which lead to failure due to damage accumulation [1]. Aviation maintenance faces the problem of early reveal fatigue damage. As written in [2], unscheduled maintenance can contribute significantly to an airline’s cost outlay. Currently, there is no system of prediction based on numerical calculation during aircraft operation according to the real state of a given part. One of the most crucial parameters for estimating fatigue life is stress during the operation regimes of particular parts. At present, manuals that prescribe the procedures indicated by manufacturers are used for maintenance [3]. Specialized personnel, usually based on their skills, decide whether a component needs repair or replacement. All maintenance activities are based on operating cycles, or the hours during which the component is active (preventive planned maintenance) [4]. The intervals of inspection are prescribed for cycles, or flight hours. The cycles are calculated by the maintenance system, into which line mechanics enter information according to the aircraft computer. Other possibilities are predictive maintenance actions (predictive maintenance) based on the states of components [5].
Some studies estimate fatigue life and cracks using finite element methods; the essential parameter, as already mentioned, is the stress during particular regimes. Stresses are used for various methods (such as the rain-flow method), in addition to other inputs, to estimate life cycles. One of these methods is presented in [6], where the fatigue-crack initiation was calculated using the 3D finite element method (FEM). The authors compared the numerical method with their experimentally obtained results, which proved the good agreement between the two methods. Another mechanical problem of fatigue loading is presented in [7], where, similarly to [6], a riveted and bolted steel construction is investigated. The same combination of the FEM and the experimental approach was used for the study. The study also presented crack propagation as a result of fatigue [7,8,9]. In [10], low cycle fatigue (LCF) was performed on a cantilever beam with a tip mass, and numerical and experimental approaches were used. In [11], the authors emphasized the mean stress effect on high cycle fatigue. A large number of scientific articles on material fatigue and crack failure can be found across the scientific community, but stresses during loading cycles are not fundamental elements in any fatigue studies. Nevertheless, they are essential parts of every fatigue-life calculation.
As described above, a combination of numerical and experimental approaches is one way to estimate the mechanical stresses of fatigue life. There is another approach that can combine two numerical methods. The main goal of the proposed article is to use numerical methods in order to develop a method that can estimate the mechanical loads of a particular part during its operation. One of the methods is already briefly mentioned (FEM), and the second is described below.
The second numerical tool chosen for the research is an artificial neural network (ANN). The ANN is a numerical method used in various fields to predict or simulate very complex systems and difficult problems. These ANNs can also be used as tools for predicting mechanical stress, crack propagation, fatigue life, and other mechanical problems. For instance, an ANN was used to predict the fatigue life of carbon and low-alloy steel [12]. Crack growth and its prediction based on neural networks are presented in [13], demonstrating the solution to another mechanical problem by ANN. The aeronautical problem of turbine-blade temperature-field prediction is described in [14], in which the authors describe research that uses the FEM method and an ANN to predict the temperature fields on the turbine blade of a jet engine. The mechanical stress of a TC21 titanium alloy is presented [15], where mechanical stresses from the experimental analysis and the predicted stresses were compared by an ANN. In that article, the ANN proved to be a highly accurate model for mechanical stress prediction. Other studies of the prediction of mechanical and material properties using ANNs have been conducted [16,17,18], as have studies on the mechanical stresses of various mechanical parts [19,20]. Finally, there are also studies showing that ANNs are highly accurate and useful tools for fatigue-life prediction [21,22]. Additionally ANNs are useful tools during the design process; for example, in [23], the ANN structure was used for the optimization in a Pareto approach for stress prediction in the disk-drum structure of an axial compressor. The authors of the article reported a reduction in the time taken to perform the numerical calculation due to the application of the ANN.
Furthermore, mechanical stress was calculated in [24,25], where the calculations were performed using FEM, and in [26], a the low and high cycle fatigue of a turbine blade were estimated using FEM. However, compared to our method, that is, the application of an ANN for stress prediction, the FEM is time-consuming. Other articles focus on stress prediction using FEM [27], and [28] describes a thermal analysis and creep-lifetime prediction based on the effectiveness of a thermal barrier coating on a gas-turbine-combustor liner using coupled CFD and FEM simulation. In such complex studies, the solution times can be significant. In [29], the authors describe the stress and deformation of a rocket gas-turbine disc using FEM, in which multiple regimes are taken into consideration. Therefore, there are many studies on stress prediction using FEM. However, the FEM solution time for complex assemblies can take several minutes or hours, whereas elapsed time recorded in this article for several operational conditions is 0.03 s. During the operation of parts (in this case, an aircraft torque tube—ATT), the method can predict stress in real time according to the operating conditions and monitor the condition of the ATT. The elapsed time for the finite element analysis (FEA) solution is several minutes, so it is not possible to predict the stress of an ATT during an aircraft’s landing or takeoff using this approach. Another advantage of our methodology is its application to various components beyond those used in the aviation industry.
As previously described, finite element analysis is currently a common tool for the prediction of stress, deformation, etc. [30]. There are also analytical approaches to stress estimation that are too complicated for complex problems [31]. Experimental stress prediction is another form of stress estimation, but is not applicable to operating conditions in rea -time; it is more often used during experimental laboratory tests [32]. In terms of time consumption, these experiments resemble the FEM. Strain-gauge-stress measurement is a typical experimental method for estimating stress, but due to its nature, it is mainly used in the development of mechanical parts [33,34].
In addition to numerical methods, there are also experimental methods for stress, deformation, and fatigue-life estimation [35]. A common method for modal-stress parameters is experimental modal analysis. Modal analysis is frequently used to estimate natural frequencies in jet engines, as in [36], where a jet-engine rotor was investigated. These examples also combine numerical and experimental approaches [37,38]. One of the many ways of evaluating mechanical stress is the use of photoelasticity [39]. This method is also used for the experimental estimation of mechanical stress. Photoelasticity requires more time and a special setup [40]; it is therefore more expensive and more time-consuming than using ANNs for stress prediction. Finally, it should be emphasized that there are other experimental methods, such as moiré [41], holographic interferometry for stress prediction [42], the digital recording and analysis of images, etc. However, these are experimental methods that are not applicable in real time for stress prediction during ATT (aircraft takeoff or landing) [43,44].
In this work, ANNs were used for stress prediction along with FEA modeling, which is used for gaining inputs. Many studies suggest the replacement of FEM by neural networks (NNs) due to the advantages of ANNs [45]. The novel method presented in this paper provides the possibility of predicting stress during ATT operations and monitoring its life based on this stress [46]. The main target of this paper is to develop a method for the mechanical-stress prediction of the torque tube of an aircraft brake that is able to determine stress in real time during its operation [47]. The method is unique because it is applied to ATT, and the predicted stress can be used for life monitoring in ATT. The methodology is described in the second section, where all the materials and methods are described. The third part of this manuscript is devoted to the application of the method. In the fourth section, the material properties obtained from the experimental tensile testing of the ATT material are described; these properties are essential for FEM simulation. In the fifth section, the 3D model of ATT is described, and in the sixth part of the paper, FEM analyses according to the 3D model and material properties are reported. The ANN was scripted and trained using MATLAB software and it is described in the penultimate part of the article, at the end of which the methodology for the life cycle counting is described, in which the ATT stress obtained from the NN can be used. All the results are summarized in the last section of the paper.

2. Materials and Methods

The subject of this study is the development of a new method for immediate stress prediction using multiple inputs during the taxiing, takeoff, and landing of an aircraft. The main goal of this study is to create a reliable methodology for predicting mechanical stress with application to ATT, on the basis of which it is possible to create a new method for calculating fatigue life. To achieve the stated goal, a methodology is developed, which is summarized in the following steps:
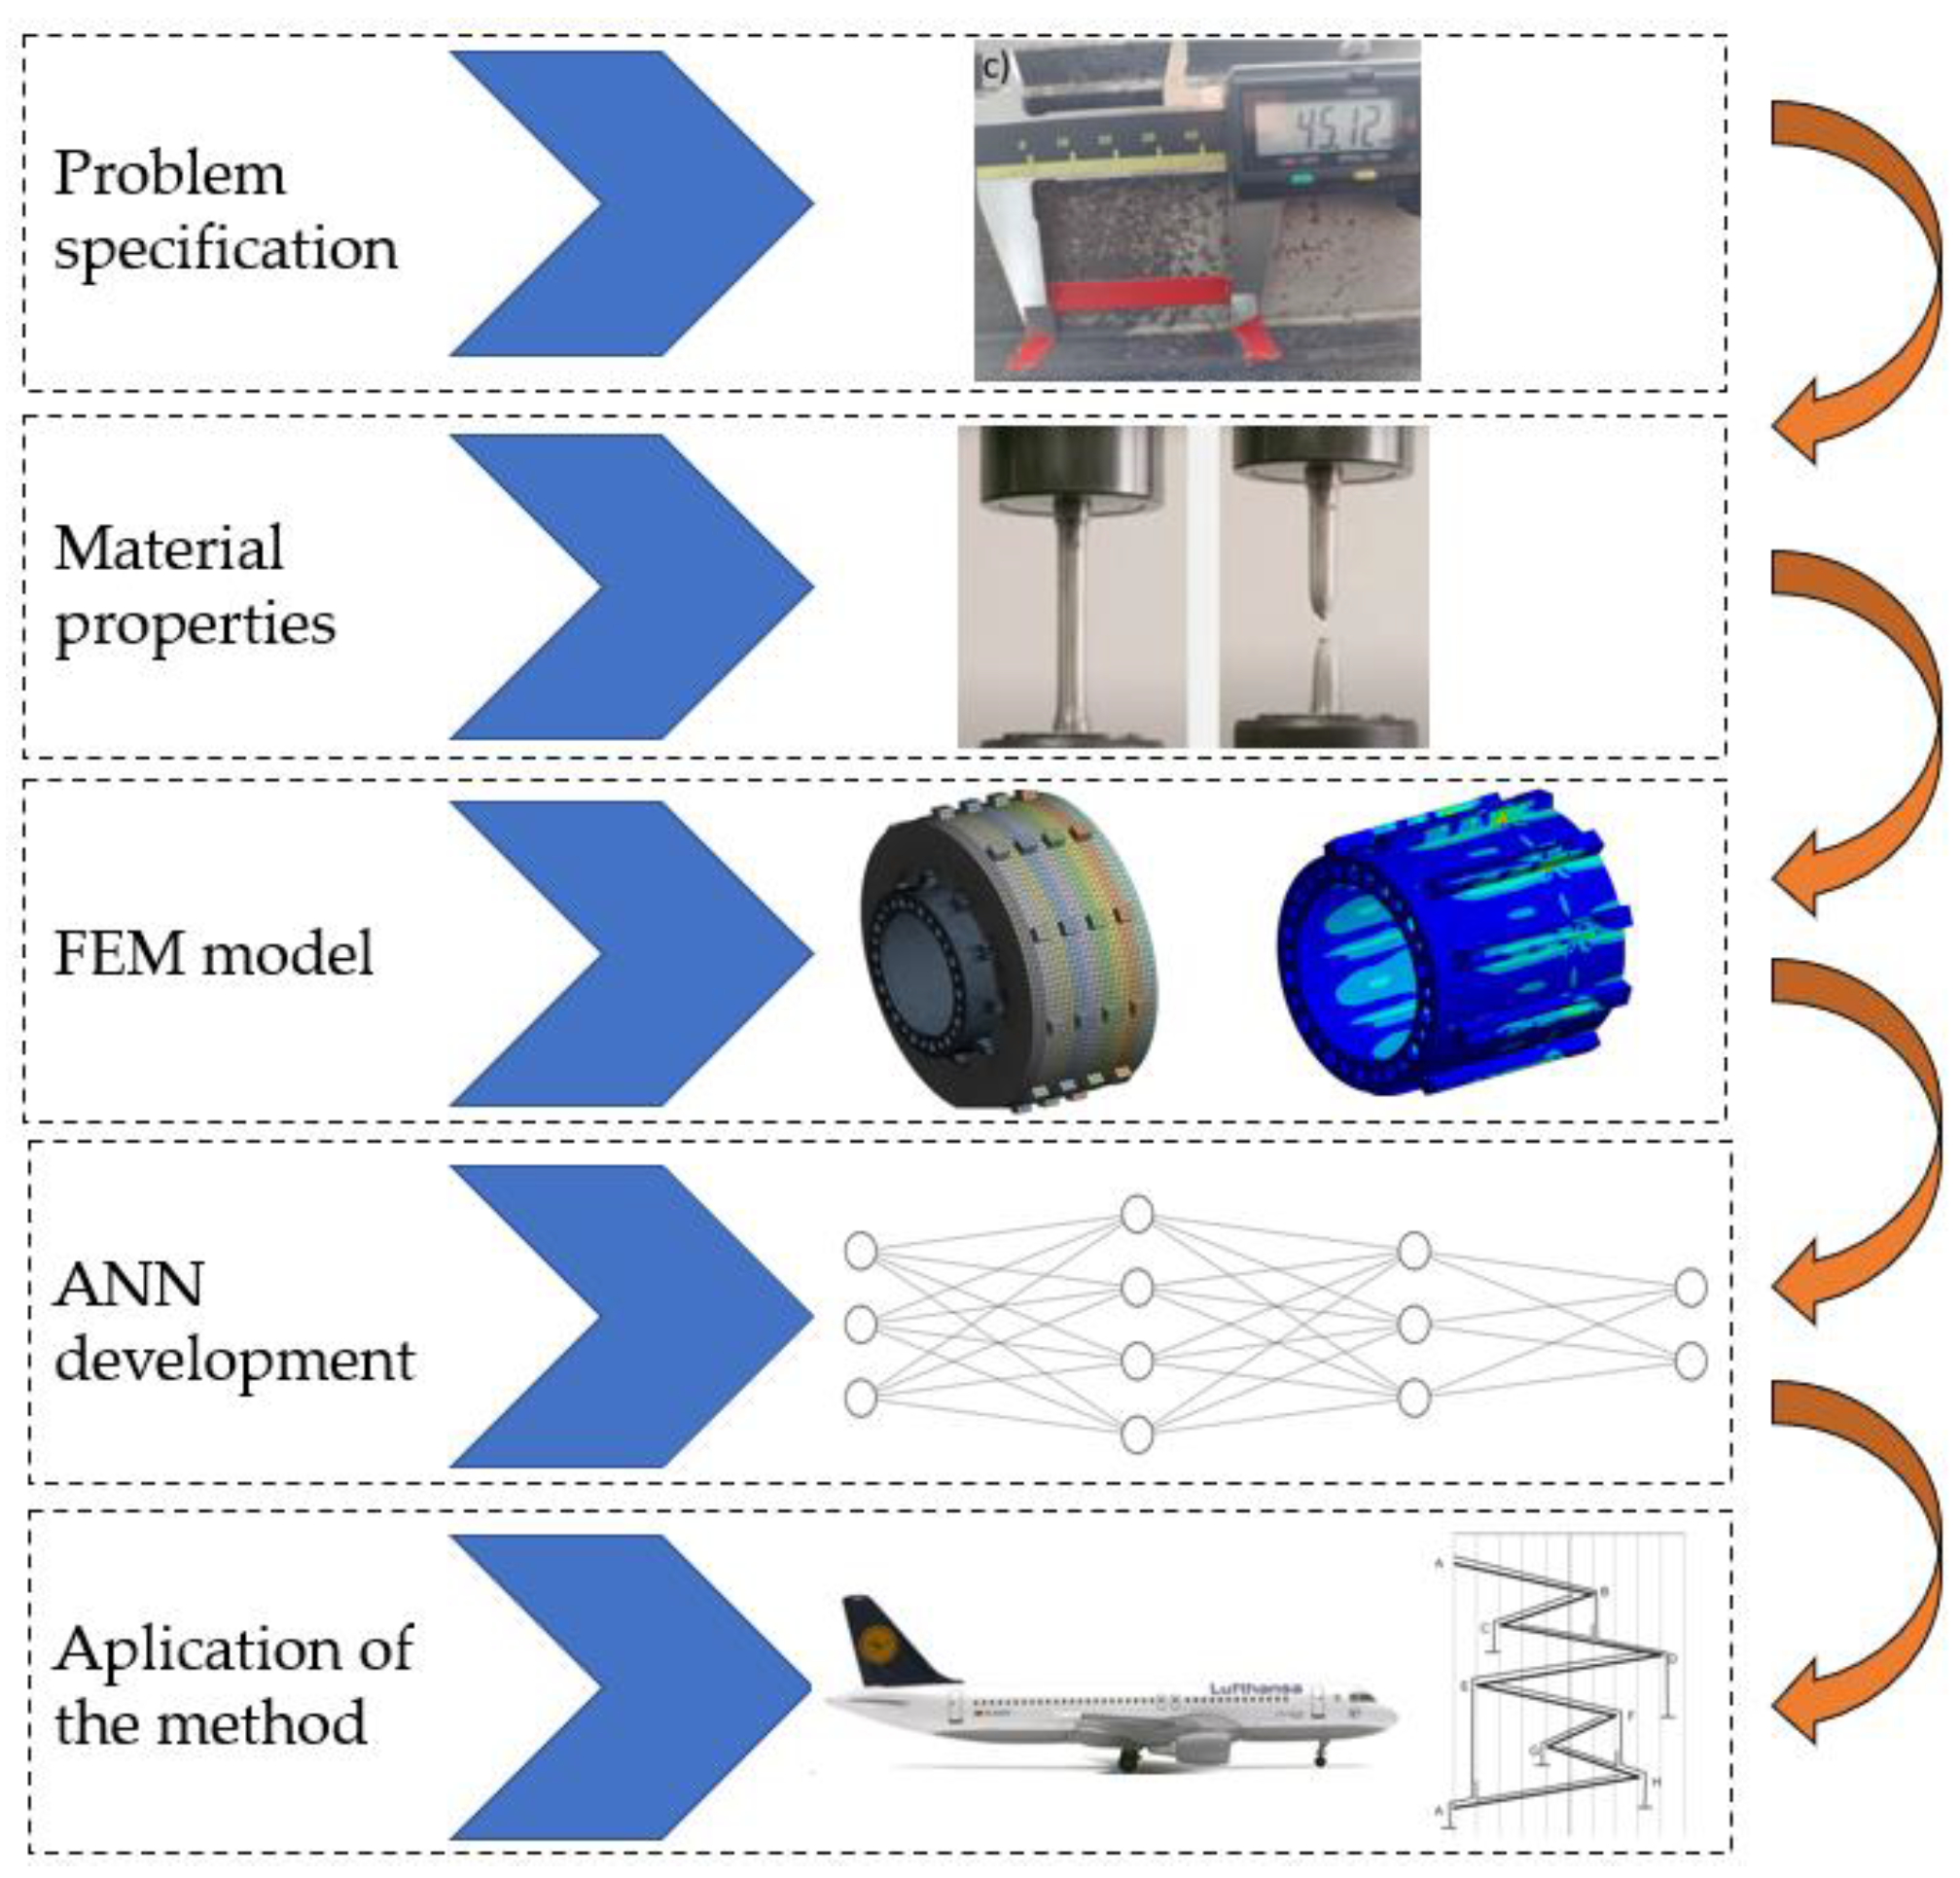
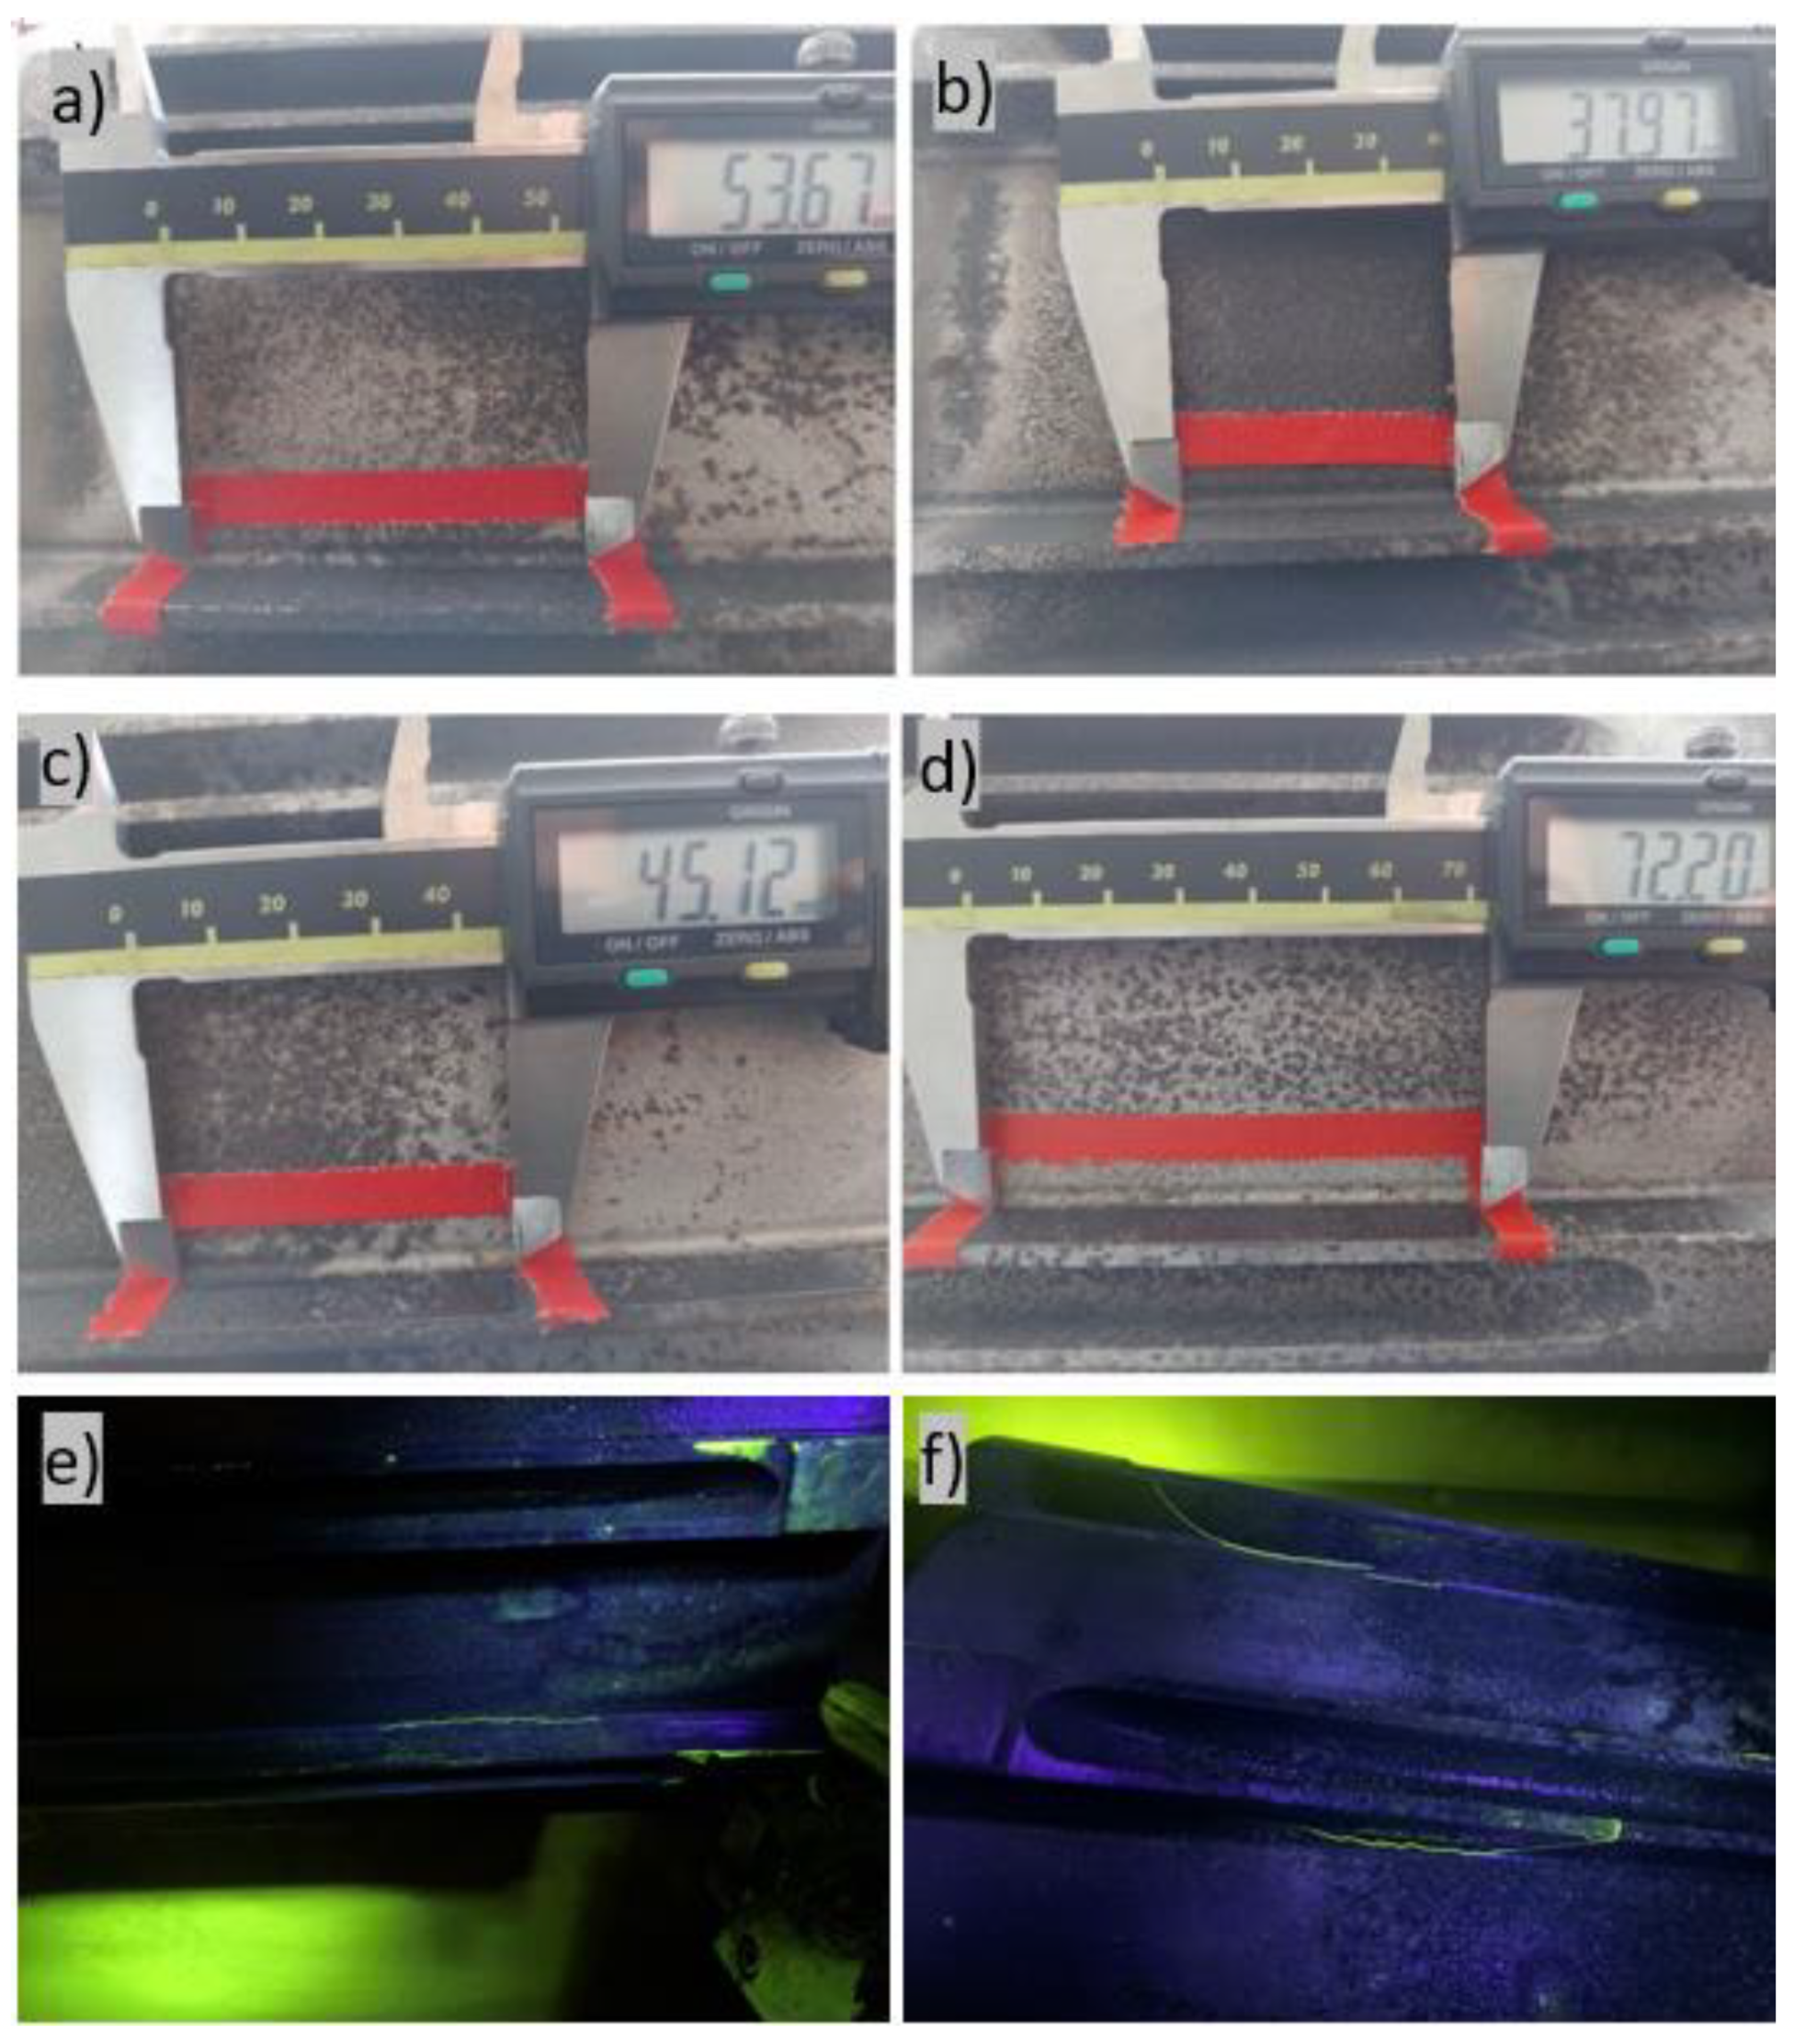
  • The specification and identification of torque-tube mechanical problems. The cracks in the torque tube were identified on the splines (see Figure 1). There are four ATTs with different cracks, which belong to a particular number of cycles. In Figure 2a–d, the cracks from 37 to 73 mm are shown and, for better visualization, a nondestructive method is used to reveal them (Figure 2e,f). Aircraft land under various conditions (outside temperature, braking temperature, landing speed, etc.), and these different conditions produce different loads on ATT and affect a number of ATT life cycles and crack growth. According to the cracks, it is possible to determine critical areas, and the results from FEM can be validated in terms of area of interest.
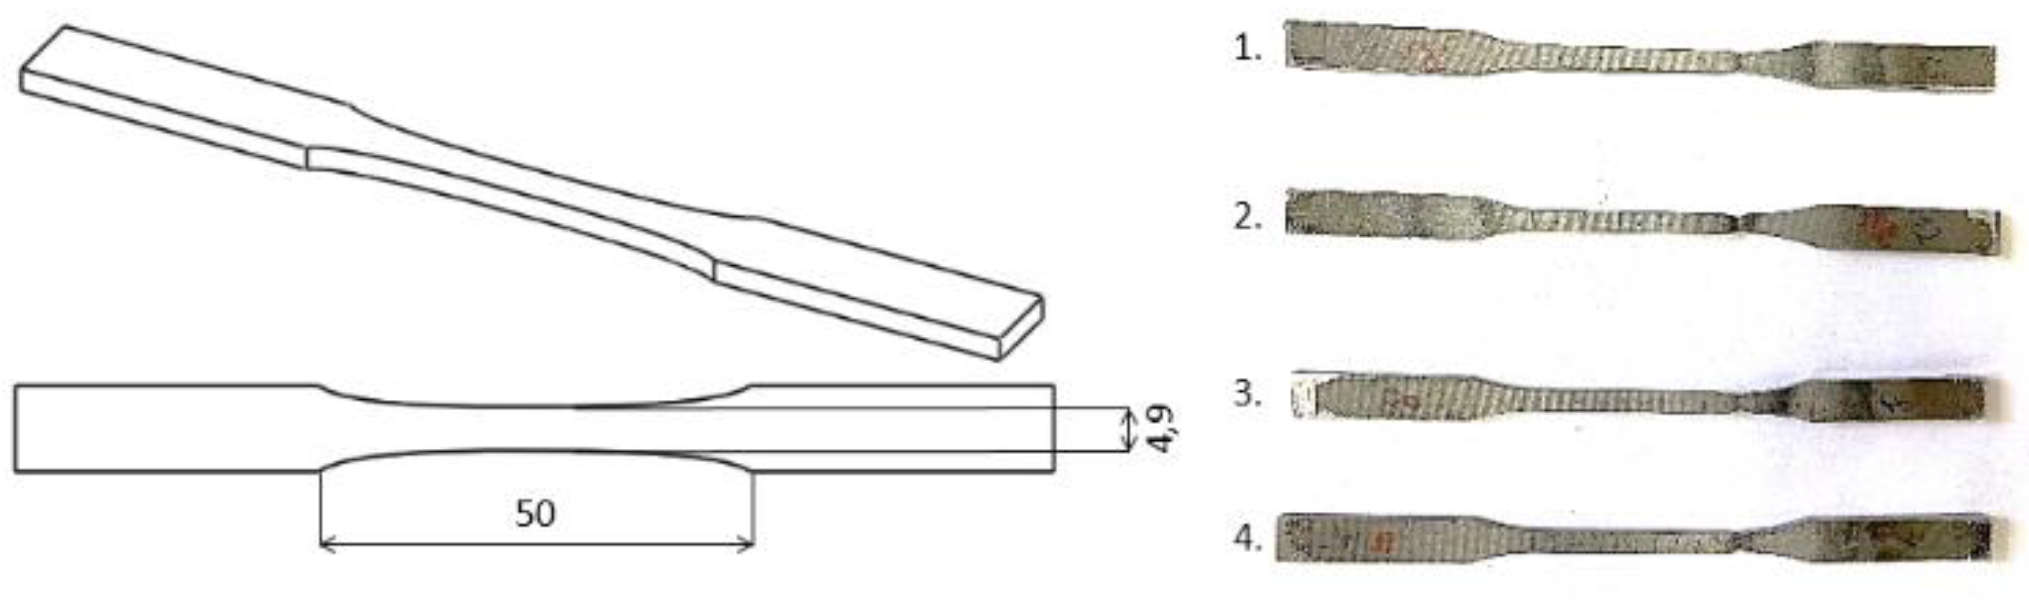
  • Material properties are essential for stress and fatigue analyses; therefore, the second step involves material identification and determination of its properties. Materials are used in aircraft engineering structures and fatigue failure is one of the most common failure cases. Materials are extremely lightweight and durable components and structures. They are characterized by excellent mechanical properties, elasticity, and plasticity [1]. Mechanical properties are dependent on materials that are used for manufacturing brake-torque tubes, since they reduce material failure. This alloy does not need post-welding surface treatment, due to its properties. Material properties are assessed experimentally using the tensile test.
  • The third step belongs to the creation of a 3D geometry model of the ATT. The 3D model is used to create a FEM model, which means 3D geometry serves as an input for the meshing process. The 3D geometry is modeled in ANSYS software.
  • In order to gain inputs for the neural network, mechanical stresses for different operational regimes of ATT have to be estimated. For this purpose, FEM analysis was chosen, and mechanical stress was calculated by FEA for multiple operational regimes. The ANSYS software was used for all FEAs.
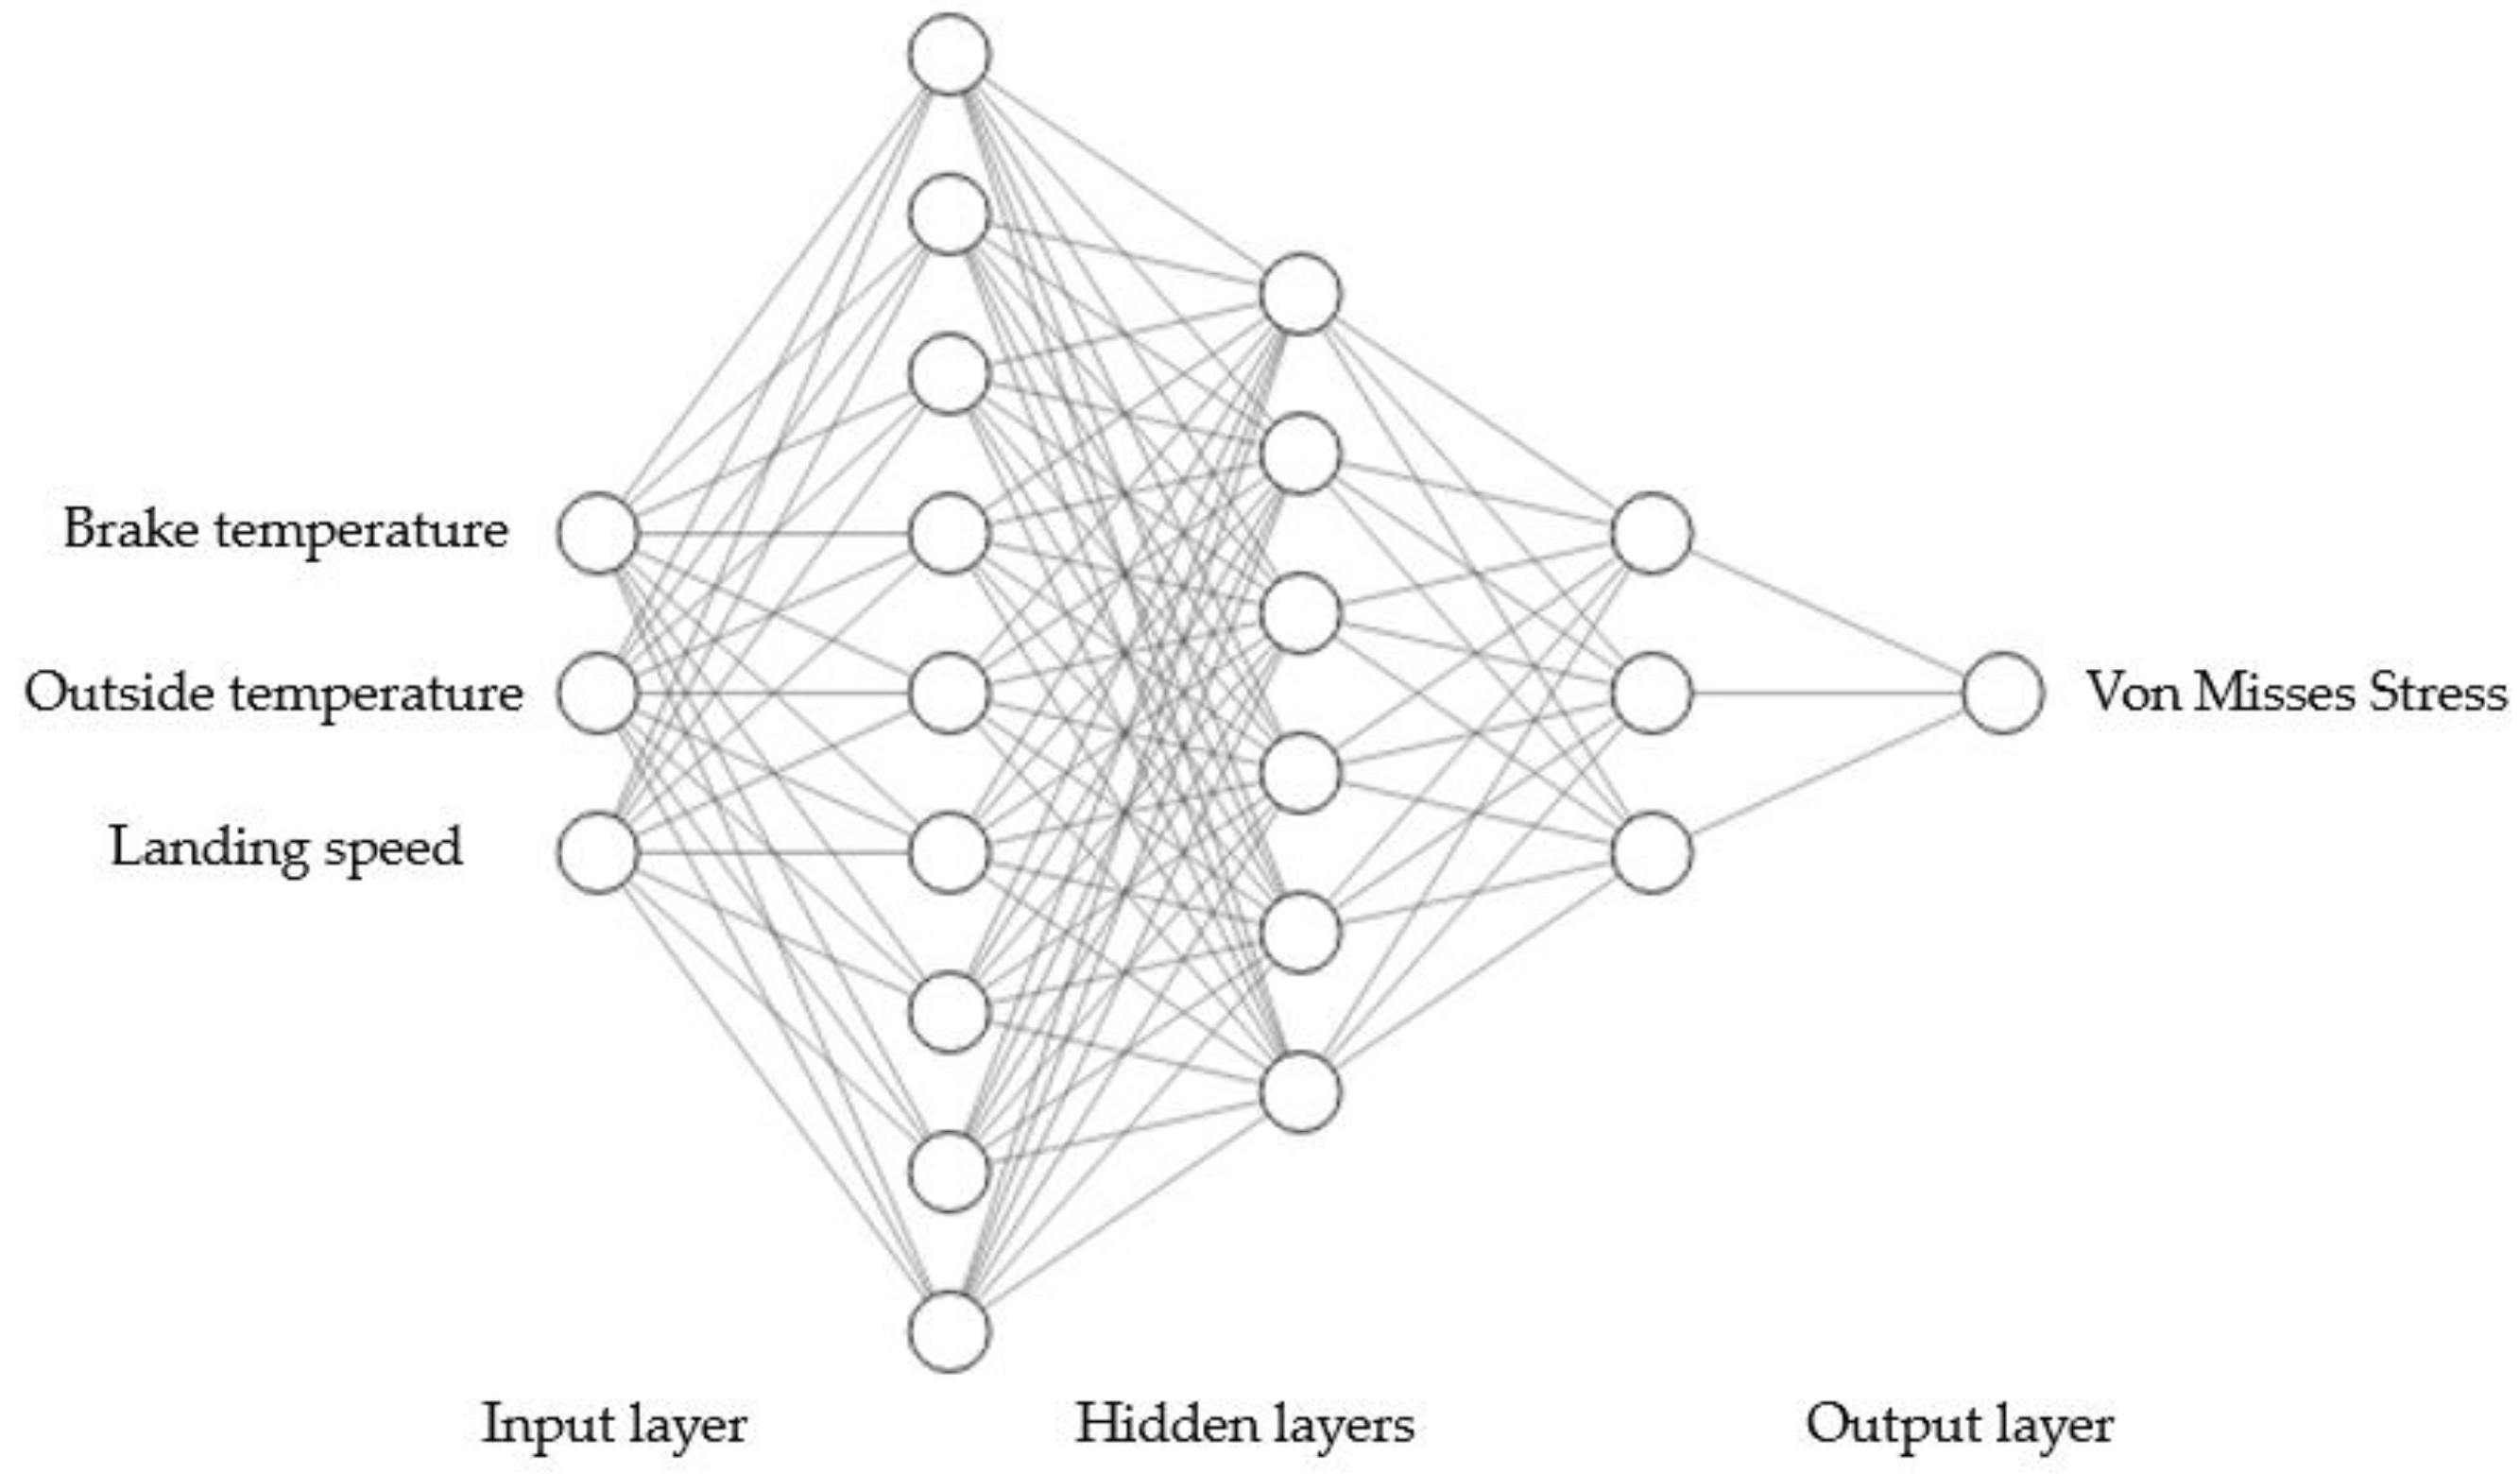
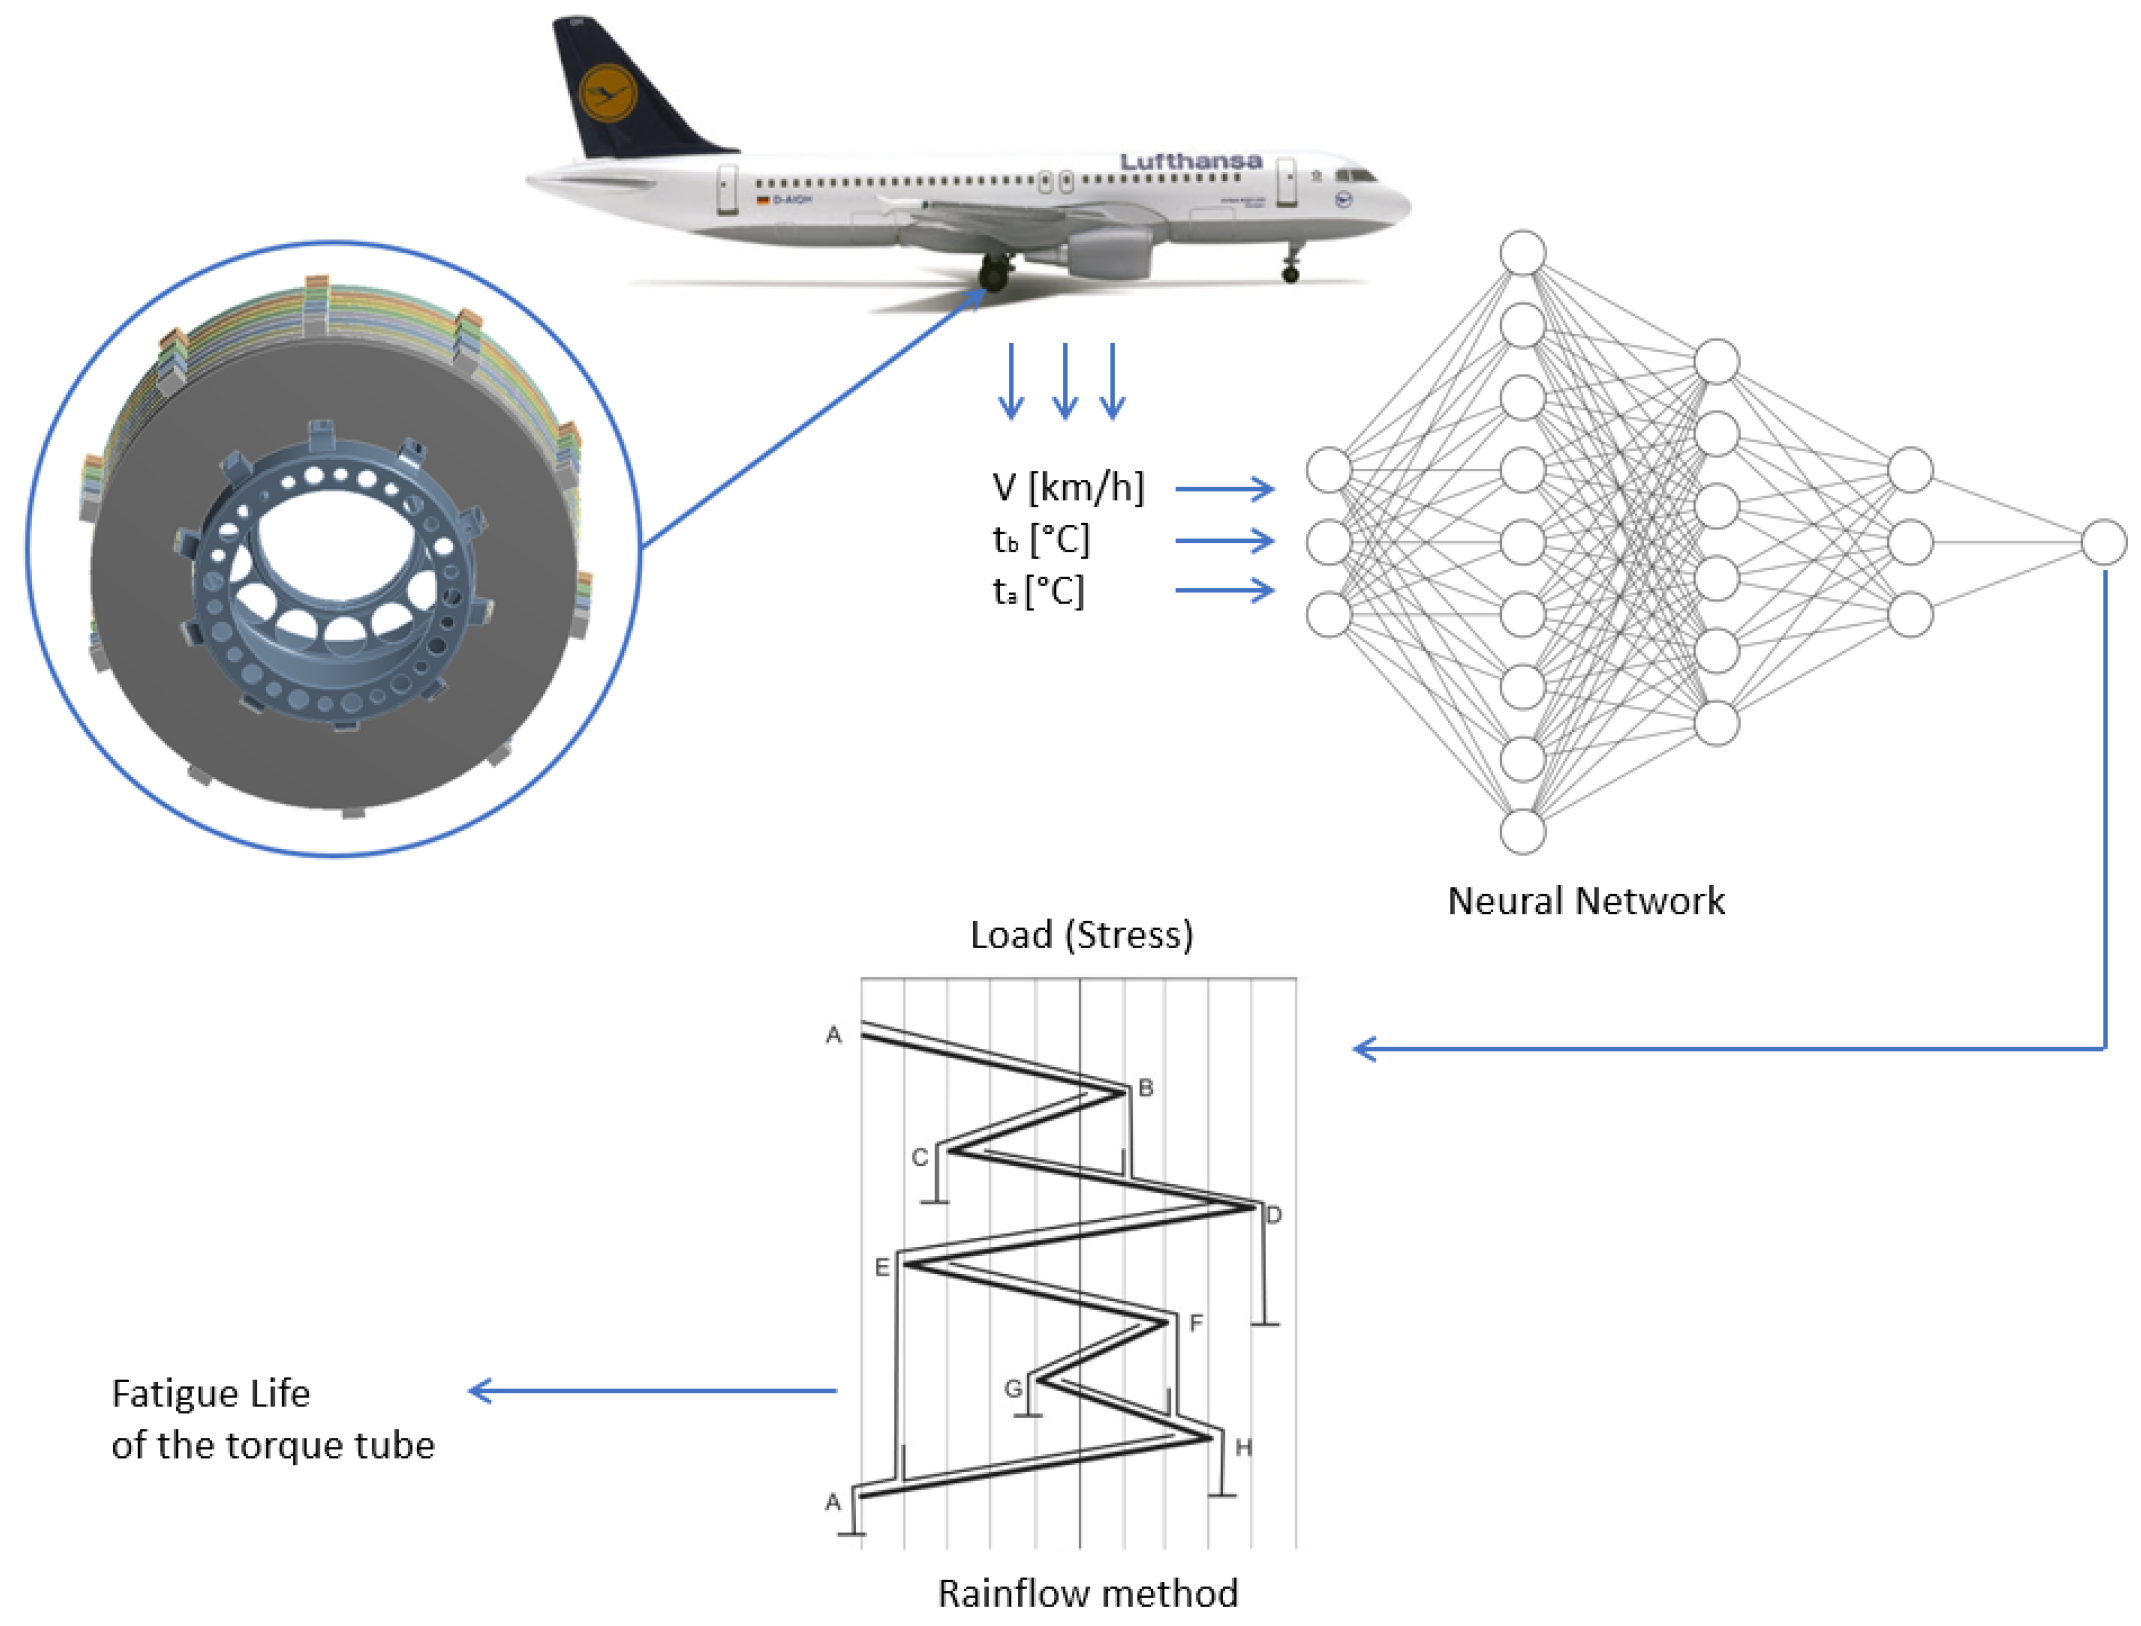
  • Last step is building an artificial neural network (ANN) for predicting the mechanical stress oN ATT based on the landing parameters of an aircraft. Parameters are described in the last chapter of the paper. The ANN describes the interdependence of the landing parameters and the mechanical stress of ATT, and it is programmed in MATLAB software. This step is the main part of the study. In order to fulfill the aim of the article, a new method had to be created. This method is able to calculate the mechanical stress on ATT at its critical area using ANN during aircraft operation. By using this method, it is possible to create a life-cycle-counting algorithm.
All the above steps are summarized in Figure 1, where the methodology can be seen. The first part of Figure 1 consists in the specification f the problem, a mechanical crack in ATT occurring during aircraft operation. This shows the area of interest, in which the FEM analysis has to be performed. The material properties (Figure 1) are essential for FEM modeling, so material samples were created from ATT material and the material properties were experimentally estimated using a tensile test. The FEM modeling was performed using constants calculated and experimentally obtained from the tensile test (third part of Figure 1). As shown in the fourth part of Figure 1, the ANN was trained according to the results from the FEM modeling and ATT operating conditions specified by temperatures and speed. The hypothesis is that the FEM can be replaced by ANN for this particular application. In the last part, the methodology for the rain-flow method is applied; this was the method used to calculate the life cycle using stress from ANN. The aim of the last part of Figure 1 is only to suggest a way to use the stress calculated by ANN during ATT operation.

3. ATT-Mechanical-Problem Identification—Method-Application Object

Study presented in Figure 1 is applied on an Airbus A320 aircraft-brake part, which is aircraft torque tube (ATT). The brake and, thus, the ATT are parts of the retractable landing gear. The ATT is part of the brake, which is heavily stressed by fatigue load. Although it is made of solid material, it is exposed to a wide range of temperatures during its operation and, at the same time, it is subjected to pressure and shock during braking. The average number of life cycles for this component is around 30,000 from the operating data; however, the life of ATT varies depending on its operating conditions. Therefore, it would be more efficient to change ATT operation time to its limit. It is essential to estimate the correct time to change the ATT, as some ATTs can withstand 17,000 cycles, while others can withstand up to 36,000 cycles (Figure 2). As mentioned above, the number of cycles is affected by the loads during the operation of the ATT,; therefore, the main goal of this article is to create an algorithm that is able to calculate the maximum stress on the critical part of ATT during each landing of an aircraft under different conditions (outside temperature, brake temperature, landing speed). The stress calculated by the novel method can be used for the life-cycle-counting algorithm for the ATT part, which can be used maximally but within safe limits.
In Figure 2, the area of interest for the ATT can be seen, which is the area of the ATT ribs where the loads due to the brake plates’ impact are concentrated. Various cracks were observed during the ATT maintenance and the non-destructive method was used for better representation (Figure 2e,f). Using the maintenance results in Figure 2, it is possible to compare the correlation between the real conditions and the FEM analysis, whether the stress have the same location in calculation and, thus, whether the results are relevant.

4. Experimental Estimation of the ATT Material’s Properties

To achieve the proposed goal, material properties are essential for input data for FEM analyses. The mechanical properties were evaluated experimentally in the laboratory using a tensile test. In a tensile test, a test specimen is stretched, usually to rupture, with progressively increased uniaxial tensile loads to determine its resistance to force. The samples were made of the same material as ATT (15CrMoV6).
A 3D model of the sample with its basic dimensions is shown in Figure 3. For the experiment, flat samples with diameters of 12.5 mm, a measurement length of 50 mm, and a measurement width of 4.9 mm were prepared, as shown in Figure 3. Four samples are shown on the right side of the figure specimens for testing.
The Young’s Modulus (E) and Poisson’s ratio (μ) are crucial parameters in FEM analysis; therefore, these material constants were calculated from the data obtained from the experiment, and the results are represented in Table 1. The constants were estimated based on well-known formulas [48]. These formulas define the relationship between tensile stress and axial strain (ε) in the linear elastic region of the material. From the changes in the dimensions of the specimen, the length (l0) in mm, and the length after the test (Δl) in mm, the strain was calculated [49] and the stress (σ) was calculated using the force (F) in N measured during the experiment [48]. According to these calculations, the Young’s Modulus (E) and Poisson ratio (μ) were calculated. All the calculated and experimentally estimated data are summarized in Table 1.
The Young’s Modulus estimated in Table 1 had a mean value of 212.086 GPa and the average value for the Poisson’s ratio was 0.323.
During the braking process, the brake assembly, especially the braking discs, can generate heat up to 350 °C due to friction. An aircraft makes 5–6 landings per day. The landing-gear compartment has no thermal isolation, which means that the braking system in flight is cooled down to minus 50 °C; the temperature during the landing reaches 250 °C, so the range covers 300 °C and is overcome in a few seconds. This steel alloy can be heated in a short time and mechanically loaded at the same time. This means that the braking assembly is mainly affected by the temperature during the landing, so it is necessary to consider the properties of the material with respect to the temperature for the specific braking phase. The Young’s modulus vs. the temperature was plotted in MATLAB software for the particular alloy from which the ATT was made, and it is shown in Figure 4.
The experimentally estimated material properties are used in the next part of the manuscript for the FEM calculations of the ATT stress in the ANSYS software.

5. Three-Dimensional Model

In order to create a new methodology for predicting fatigue life, it is necessary to obtain information about the stress distribution of the component, and the geometry of the assembly is also essential. The assembly was created with ANSYS software and consisted of several parts: a stator hub, also called an aircraft torque tube (ATT), the stator, and the rotor plates. In the assembly shown in Figure 5, regardless of the torque tube, there are five stator plates and four rotor plates. The presented brake is a cyclical symmetrical part; thus, the creation of the segment would have been a logical solution. However, there were some holes and features that did not allow the cyclic symmetry approach, so it was necessary to simulate the entire part. The assembly in Figure 5 was meshed in ANSYS software and its use in the FEM analysis is reported in the following chapter.

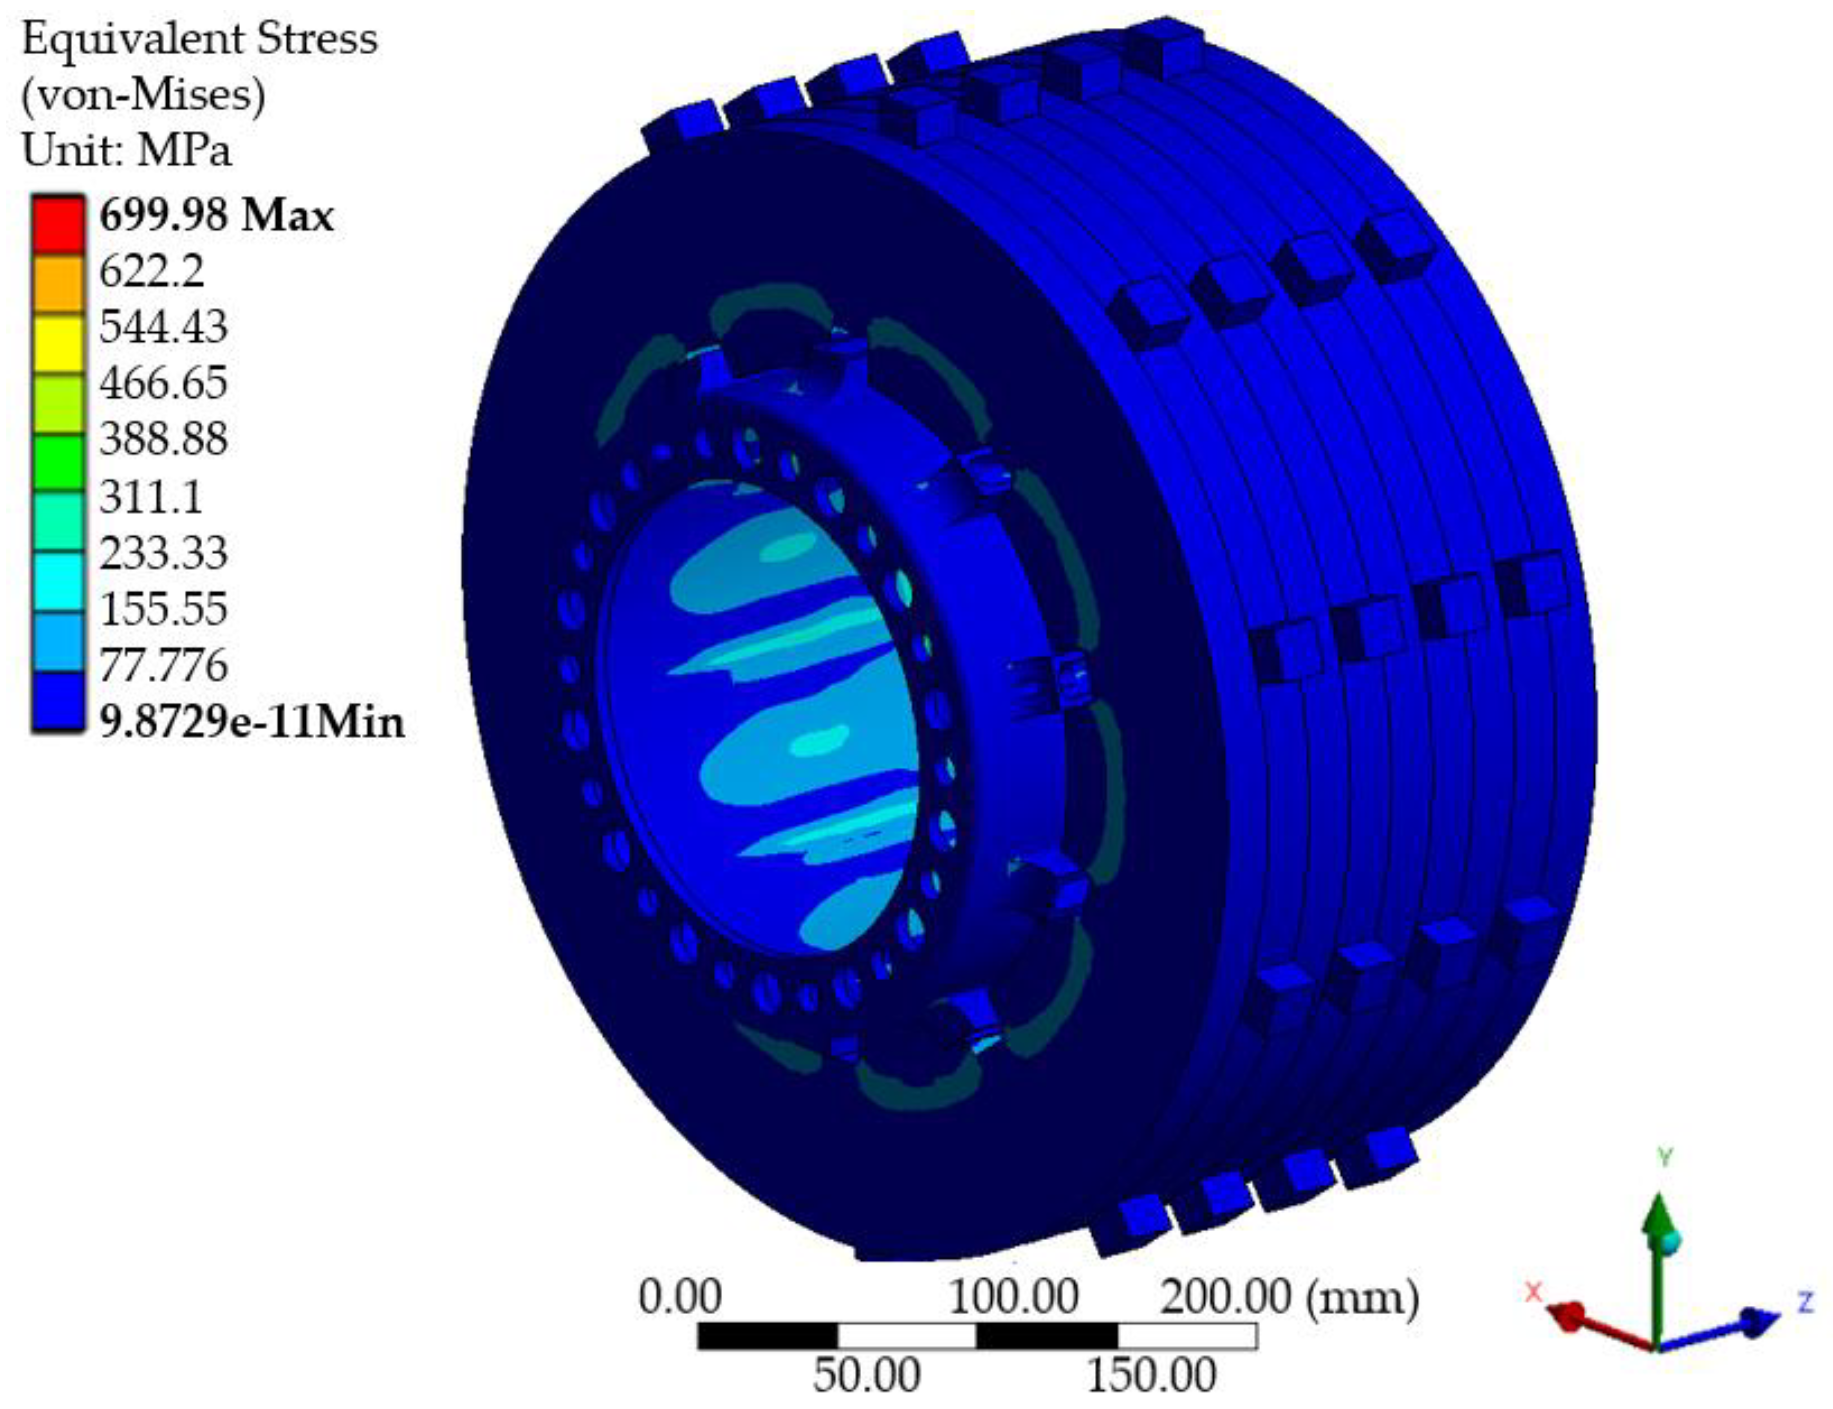
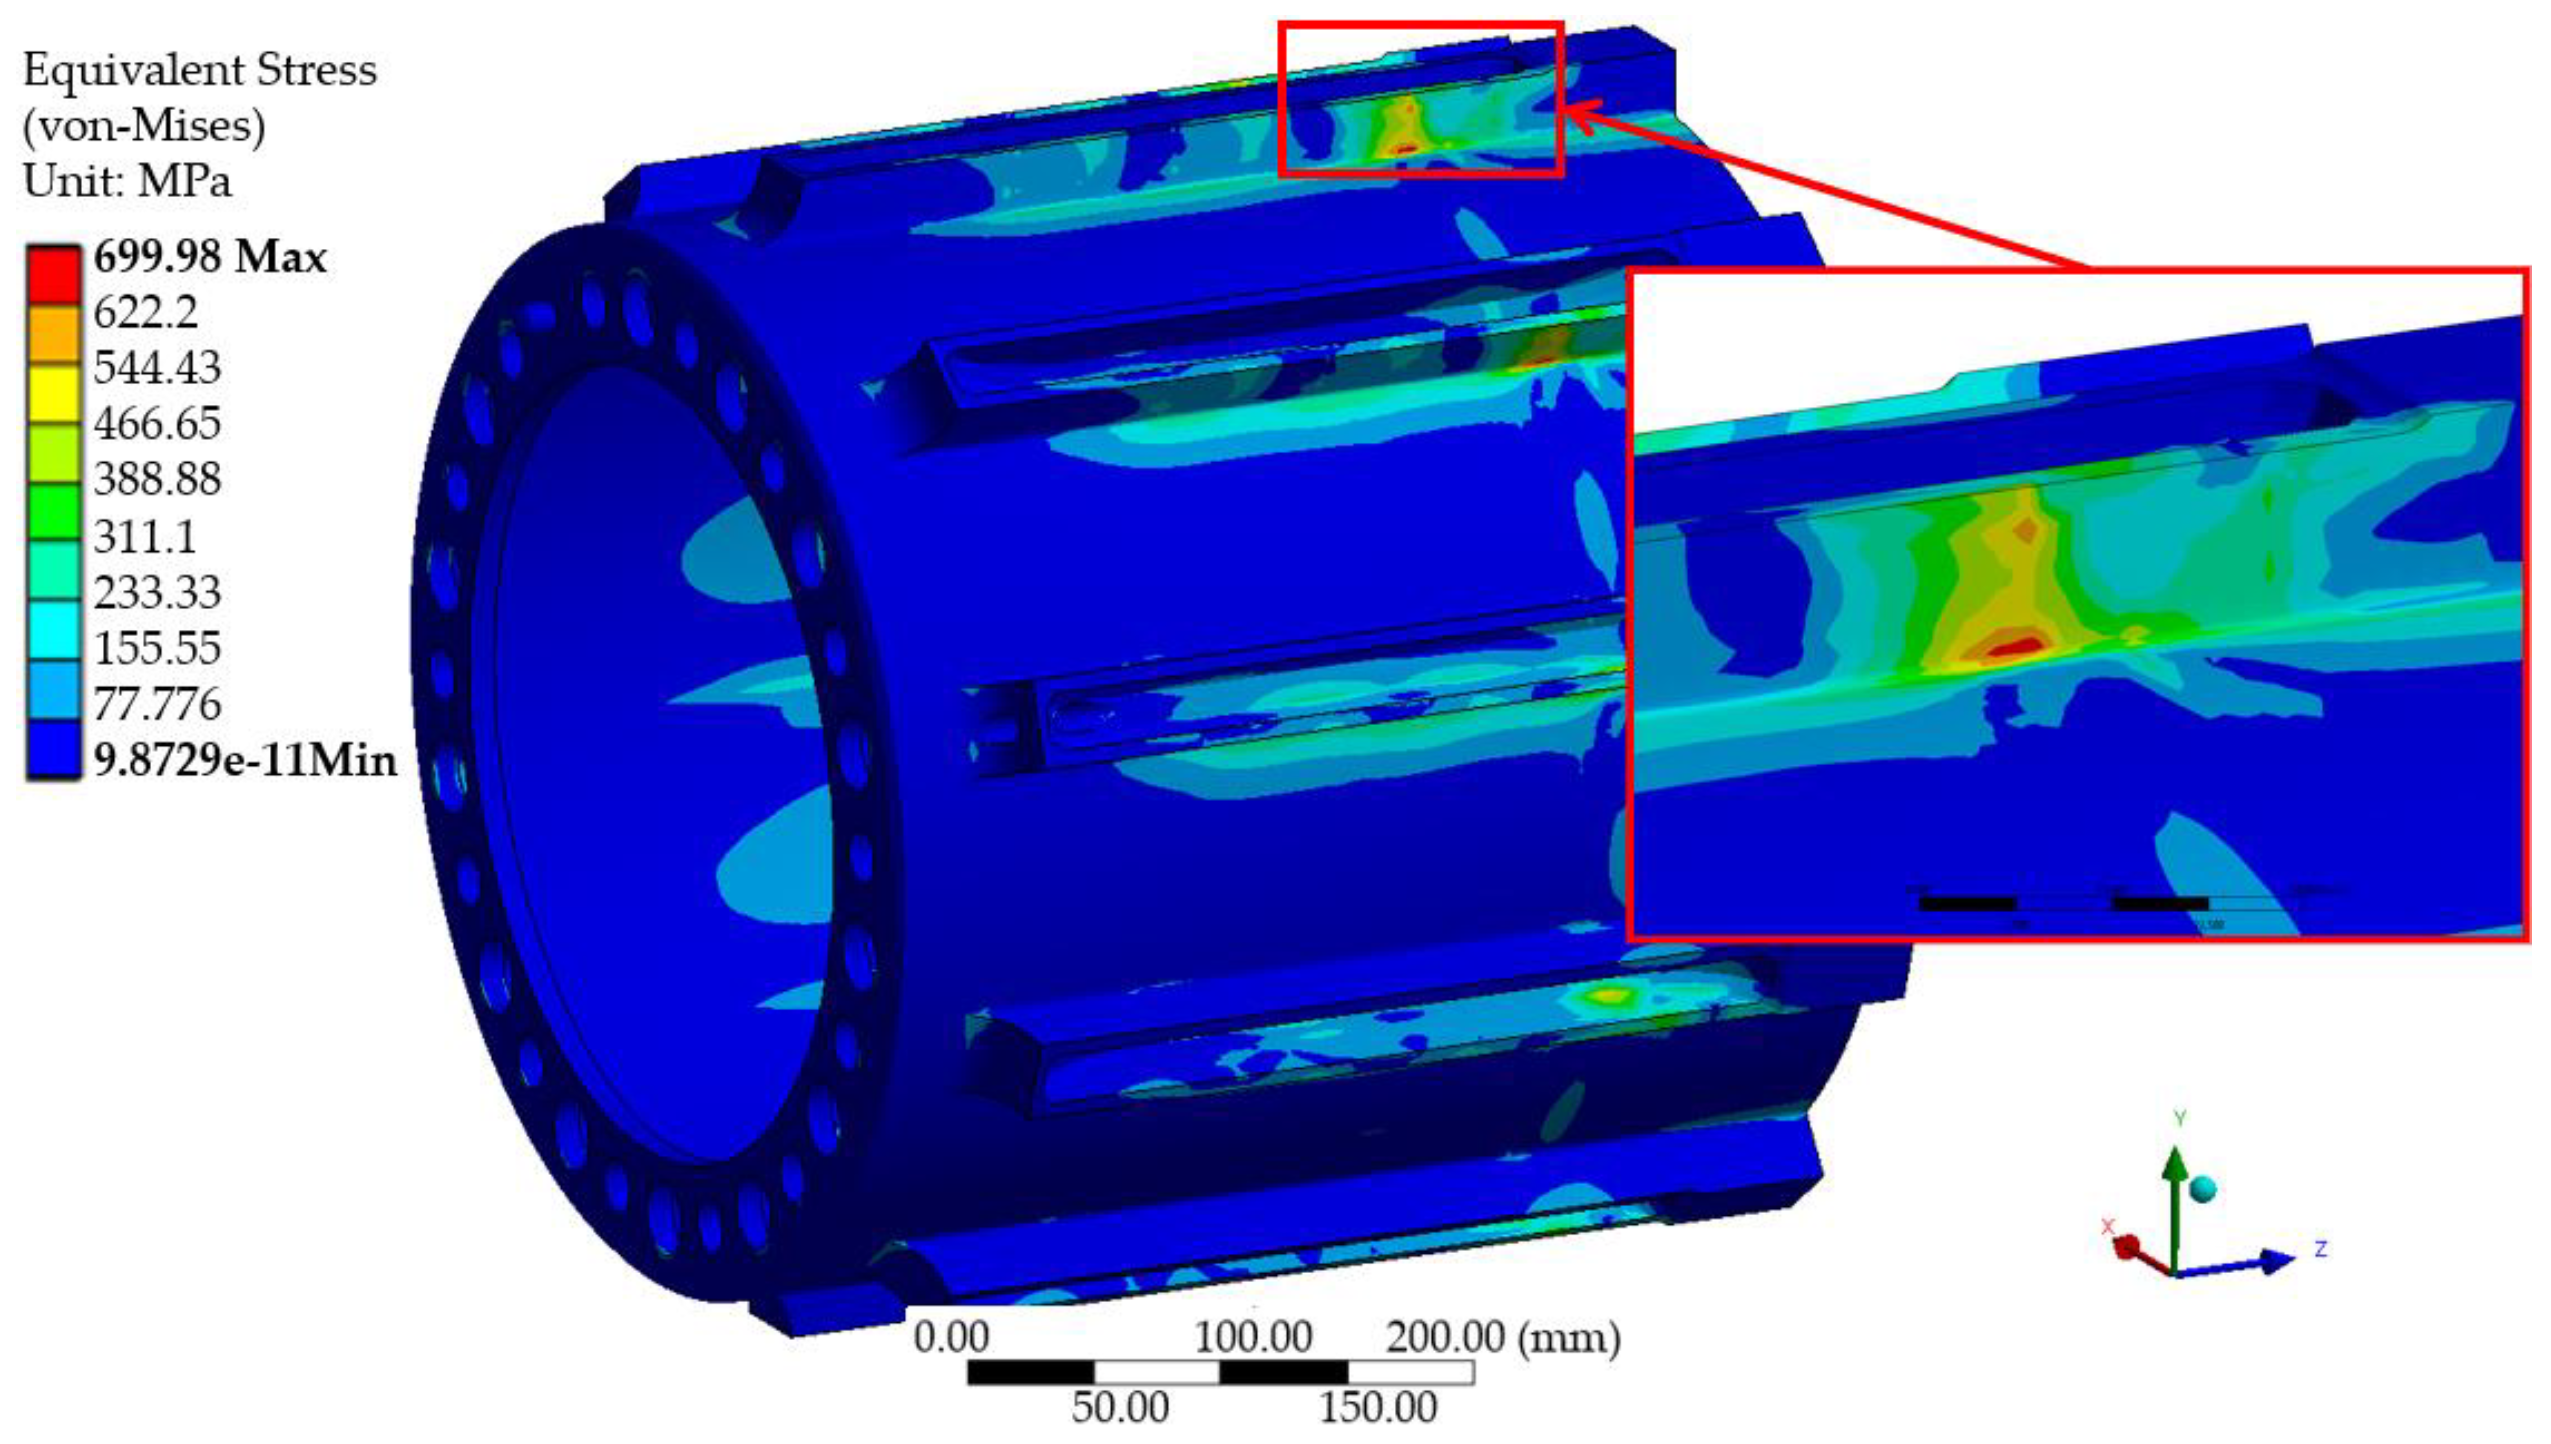
6. Brake-Assembly Finite Element Analysis

The brake assembly was meshed in the ANSYS software using HEXA elements, which were of high quality; the HEXA elements were also used to reduce the number of elements in the finite element model (FEM) [51]. The FEM model is shown on the left side of Figure 6. It can be clearly seen that the mesh is finer in the area of interest, which is the torque tube. The right side of Figure 6 represents the application of the boundary condition; the temperature is shown in red, and the centrifugal force applied and is represented by the yellow arrow. The assembly was fixed in the holes shown in purple in Figure 6. The boundary conditions are represented by the speed of the aircraft, from which the centrifugal force was calculated, followed by the temperature of the brake during landing. The third parameter that affected the stress was the ambient temperature. The contacts with the corresponding friction coefficient are defined between the individual parts [52]. The material properties of the parts were applied as described in the previous sections. A static structural analysis was performed for 36 regimes, which were defined by the aforementioned parameters. For example, three of the thirty-six regimes are mentioned in Table 2. The regimes represented some of the states of the brake during the aircraft operation and simulated real conditions [51,52].
A pressure of 14.47 MPa was applied on the surface of the first plate in order to simulate the action of the braking valves and squeezing plates. The FEM model consists of 204,469 elements and the elapsed time of the static structural analysis was 1716 s. The results of the study are represented by the stress calculated for the 36 regimes of the brake operation; one of these regimes is shown in Figure 7. The boundary conditions stand for the temperature of the brake during the operation, which was at 260 °C, the outside temperature of 40 °C, and the aircraft’s landing speed of 300 km/h.
The temperature had the most significant impact on the torque tube, which was caused by the friction between the stator and rotor plates during the landing of the aircraft until the aircraft stopped. The maximal Von Misses stress of the brake was 699.98 MPa, and it was concentrated in the torque tube in the area of the ribs. A detailed view is shown in Figure 8.
Analogically, the FEM analysis was performed for 36 operational regimes and 36 mechanical stresses were calculated. The estimated Von Misses stresses were used as target inputs for the NN-training process.

7. Application of the Neural Network for Stress Prediction

In order to create a new method for life prediction, the stress of the torque tube during landing is an essential part. Instead of calculating the stress for every landing, the neural network was developed. It can be used to predict the maximal stress during each landing of an aircraft. Once the stress is calculated according to the speed and temperatures, it is possible to use for example rain-flow method and count the cycles to failure of the torque tube [53].
As mentioned above, the NN was used for stress prediction during the training phase of the NN while the results from the FEM analyses were used. The inputs for the NN are in Table 2; in addition to the parameters defining the regime, the stress from the FEM analysis was also used for the NN training [54,55]. An example of the training dataset is in Table 2; a total of 36 training regimes were used for the training of the NN. The training data obtained in the FEM analyses were normalized for the NN. Three of the thirty-six training inputs are shown as examples in Table 2. The input layer consists of three neurons. The first input is the brake temperature, the second input is the outside temperature, and the third is the landing speed. The structure of the output layer is one neuron represented by the stress in MPa.
The NN for the stress prediction of the torque tube was developed in MATLAB software, in the form of feedforward network back propagation. The SCG algorithm—scaled conjugate gradient was used as a training function. An activation function is a hyperbolic tangent sigmoid-transfer function [56,57]. The network designed for the stress prediction of the torque tube in Figure 9 consists of one input and output layer and three hidden layers [58,59,60]. In the input layer, the brake temperature, outside temperature, and landing speed (Figure 9) are present during the training and during the life of the NN [60,61]. On the other hand, during training in the output layer, the stress is from the FEM analysis for the specific braking regime and during life, the network predicts the stress based on the trained weights and biases. It should be emphasized that Figure 9 presents a principal ANN architecture used for ATT-stress prediction. In accordance with the architecture, the ANN mathematical model was designed in MATLAB software for stress prediction.
The architecture of the NN for the study presented in Figure 9 was programmed and trained in MATLAB. The ANN’s elapsed training time was 0.03 s and, once it was trained, the NN predicted the stress for 36 operational regimes in 0.016648 s; thus, for one regime, in the prediction only took 0.00046 s. The statistical parameters of the training NN are shown in Figure 10 [58,61]. Figure 10 consists of four plots, the first of which approximates the training data, and it is visualized by the blue line. In total, 70% of the data were devoted to the ANN training process, while 15% of the data were used for the validation (second plot with green line), and the remaining 15% of the data were test data for the ANN (plot with red line). All the values are summarized in the fourth plot, with a black line.
As can be seen in Figure 10, all four lines reached a highly accurate fit. Figure 10 is also called a regression plot, which shows the relationship between the outputs of the network and the targets. If the training were perfect, the network outputs and the targets would be exactly equal, but this relationship is rarely perfect in practice. The dashed line in each plot represents the perfect result of outputs = targets. The solid line represents the best-fitting linear-regression line between the outputs and the targets. The R-value is an indication of the relationship between the outputs and targets; it is the coefficient of correlation. If R = 1, this indicates that there is an exact linear relationship between the outputs and the targets. If the R is close to zero, then there is no linear relationship between the outputs and the targets. The training data reached 0.99999, as did the validation, the test data had a value of 0.99931, and the total data stood at 0.99973. These values represent the highly accurate results of the ANN.
The results of the stress prediction from the NN are shown in Figure 11, which includes the stresses of the 36 regimes predicted by the neural network and the 36 regimes estimated using the conventional FEM method. When the results from the NN and FEM are compared, it is obvious that the values were matched with high accuracy. In Figure 11, the mechanical stress of the ATT calculated using the ANN is shown by the blue line with circles, and the second red line with dots is the stress calculated using the FEM.
The main results of this article are presented in Figure 11, where the mechanical stress of the ATT calculated by the ANN and FEM is shown. Figure 11 shows mechanical stress from approximately 360 MPa to 700 MPa; a perfect match can be seen for almost every regime, apart from regime 34, where a small deviation is observable. These results prove the possibility of stress prediction using ANNs as replacements for the FEM.
The estimated errors are shown in Figure 12, where the maximal error is only 2%, which is approximately 15 MPA. The stress range for the 36 regimes was almost 350 MPa, so errors of 15 MPa are neglected.
The data in Figure 12 demonstrate the high level of accuracy of the neural network for the prediction of the stress on the ATT according to the landing parameters. Although the main task of this research was to develop a new algorithm for mechanical-stress assessment, the scope of further research is briefly outlined in the following paragraph.
A novel method using ANN for ATT stress prediction according to the aircraft parameters of temperature and speed can be used in future research as an input for the fatigue-life-counting algorithm (Figure 13). Figure 13 shows an integration of the proposed method into the aircraft-torque-tube-health-monitoring system. The stress calculated by the ANN can be used in the well-known rain-flow method, which is a method used for fatigue-life estimation according to mechanical stress. In Figure 13, the scheme for the cycle-to-failure-counting algorithm for the ATT is shown. As shown in the right part of Figure 13, the stress estimated using a neural network according to the landing parameters (speed, torque-tube temperature, and ambient temperature) was used as an input rain-flow method, as in the lower part of Figure 13. The output from the rain-flow method can be the remaining life of the ATT. The main point of Figure 13 is to present the methodology, which can be used for ATT-life-fatigue prediction for further research with the results from this paper. The methods also show how the respective technologies in ANNs, computer-aided design (CAD), product-lifecycle management (PLM) systems, and computer-aided engineering (CAX) systems could be combined into one method to predict the mechanical stress on specific parts [62,63].

8. Conclusions

The combination of an ANN and FEM for ATT-stress prediction was presented in the paper. The results confirm the hypothesis that it is possible to create a method for the prediction of the mechanical stress on an ATT based on accurate inputs obtained during flight (aircraft speed, ambient temperature, and brake temperature). A feedforward back propagation network in MATLAB and FEM modeling in ANSYS software were employed to create a new ATT-stress-prediction method. The following observations were made through our research:
  • The methodology for the mechanical stress on the ATT was developed based on the ANN, so the FEM method is replaced, and it was possible to estimate the mechanical stress on the ATT during the operation of the aircraft and, thus, the braking.
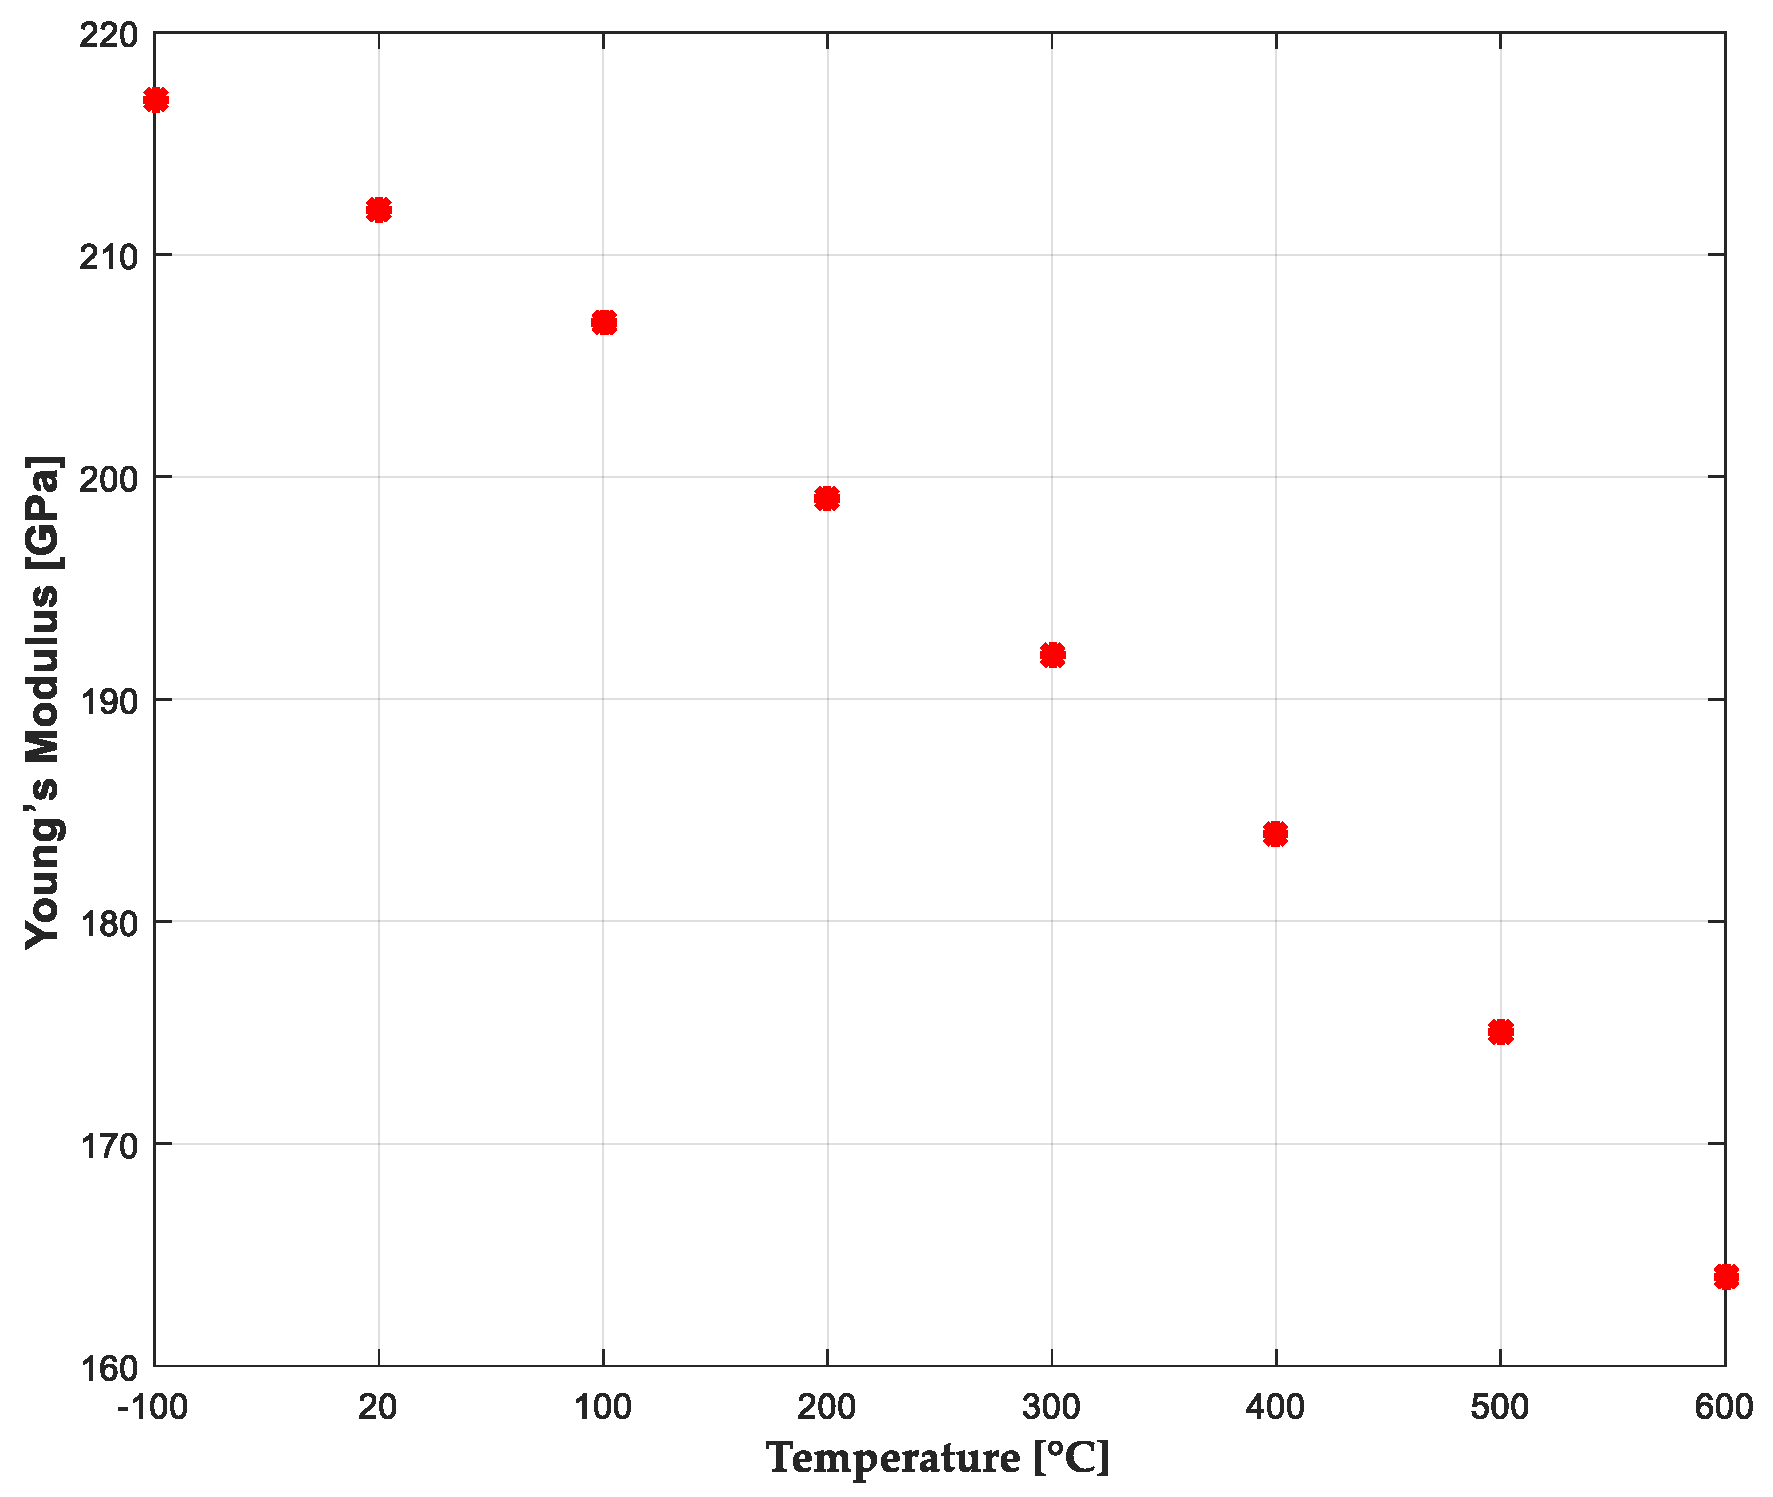
  • The mechanical properties of the ATT (15CrMoV6) material were experimentally estimated. The Young’s modulus had a mean value of 212.086 GPa and the average value for the Poisson’s ratio was 0.323.
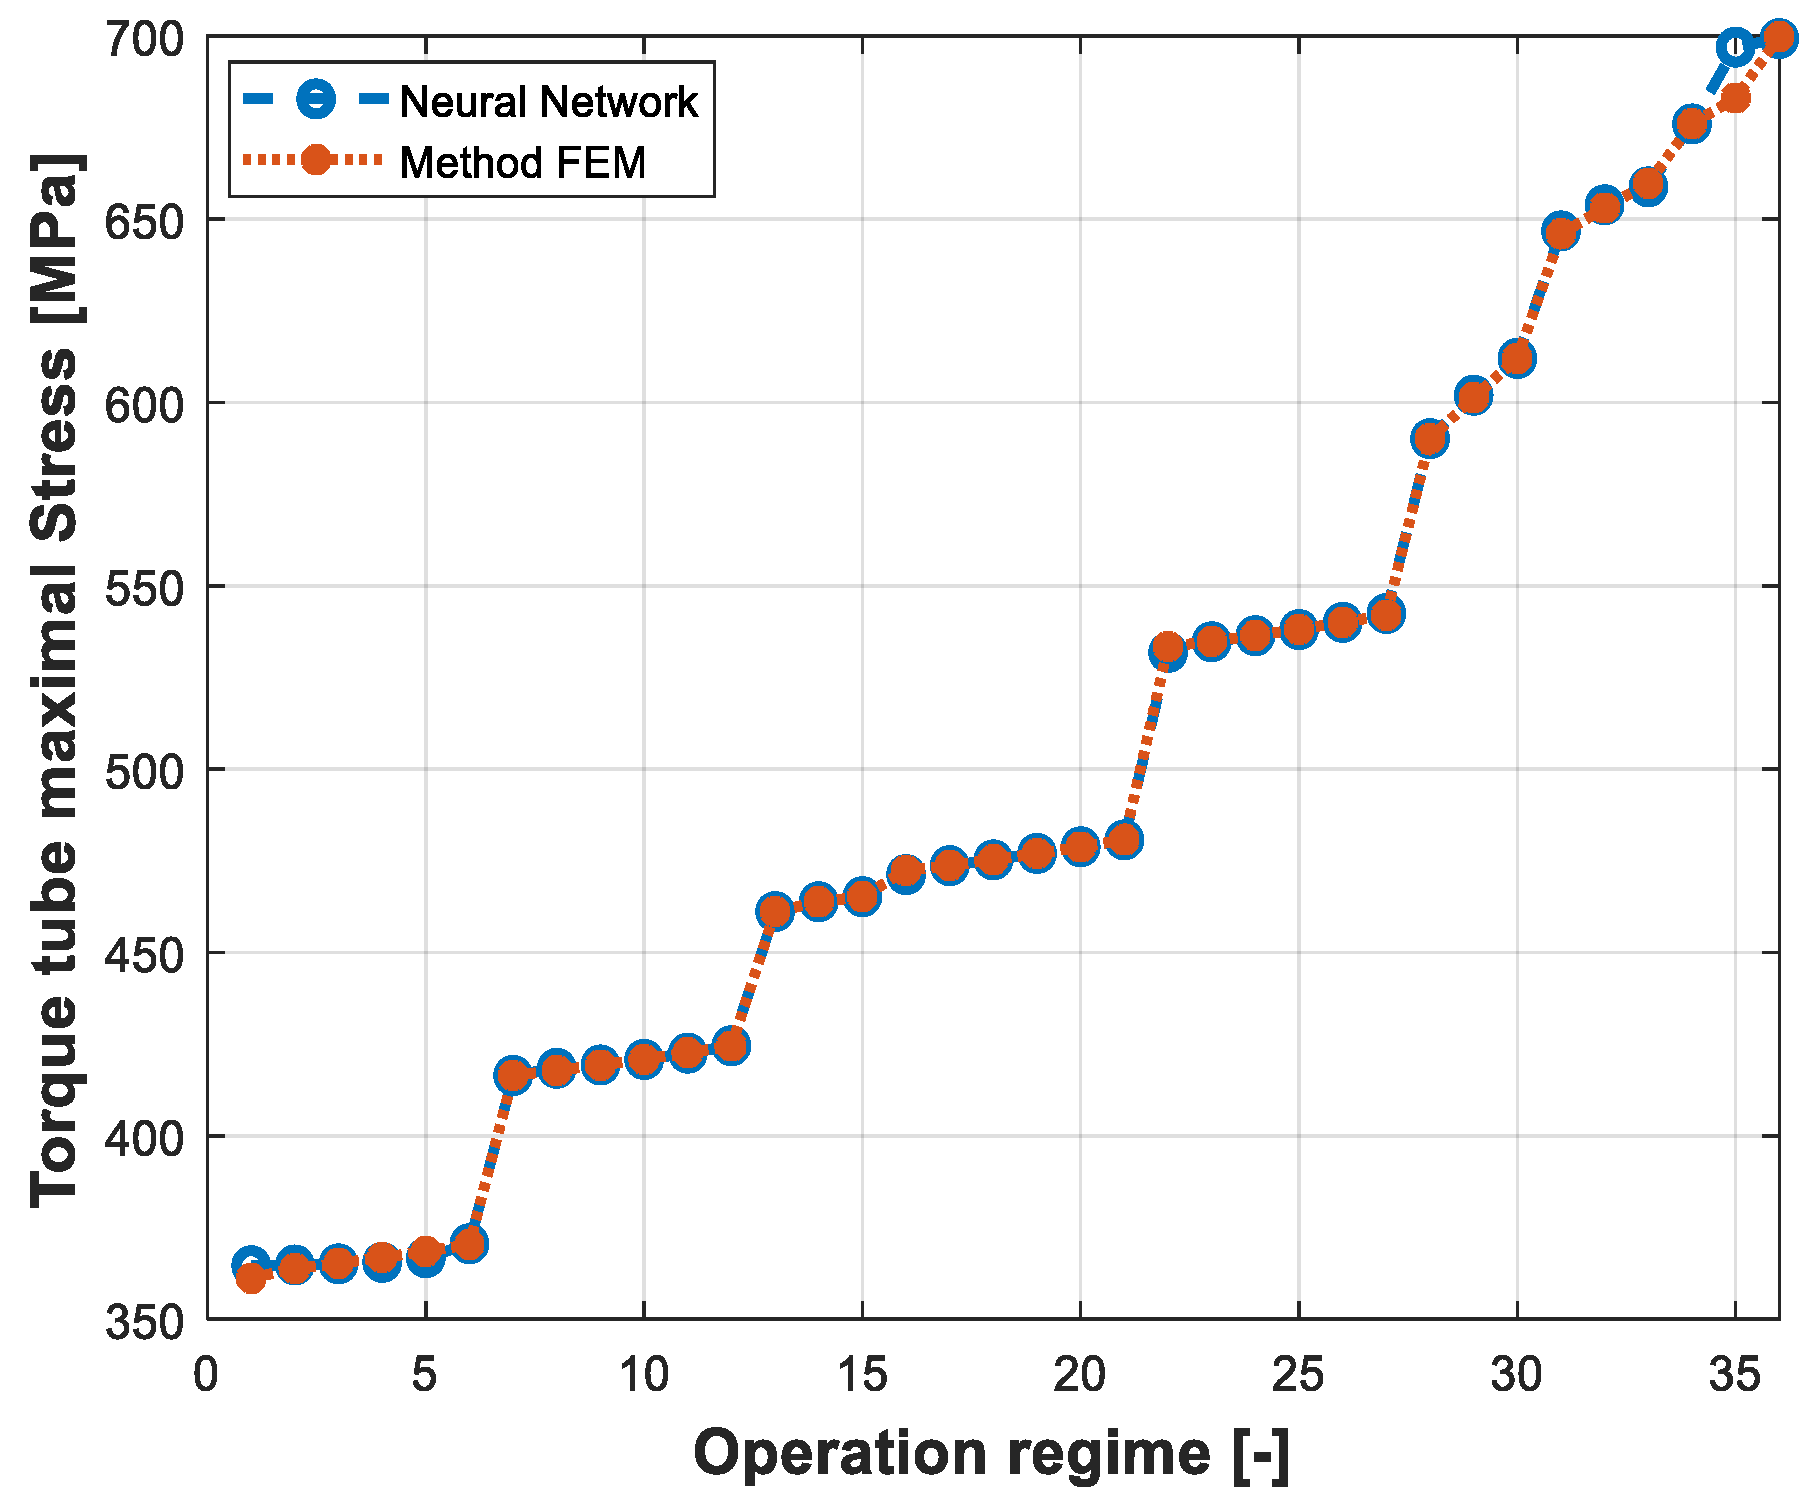
  • The 3D model of the ATT and a finite element model of an Airbus A320 brake were created in ANSYS software and static structural analyses were performed. The maximal stress estimated by the FEM in the ANSYS software was 699.98 MPa and the elapsed time of the solution for one operational regime was 1716 s.
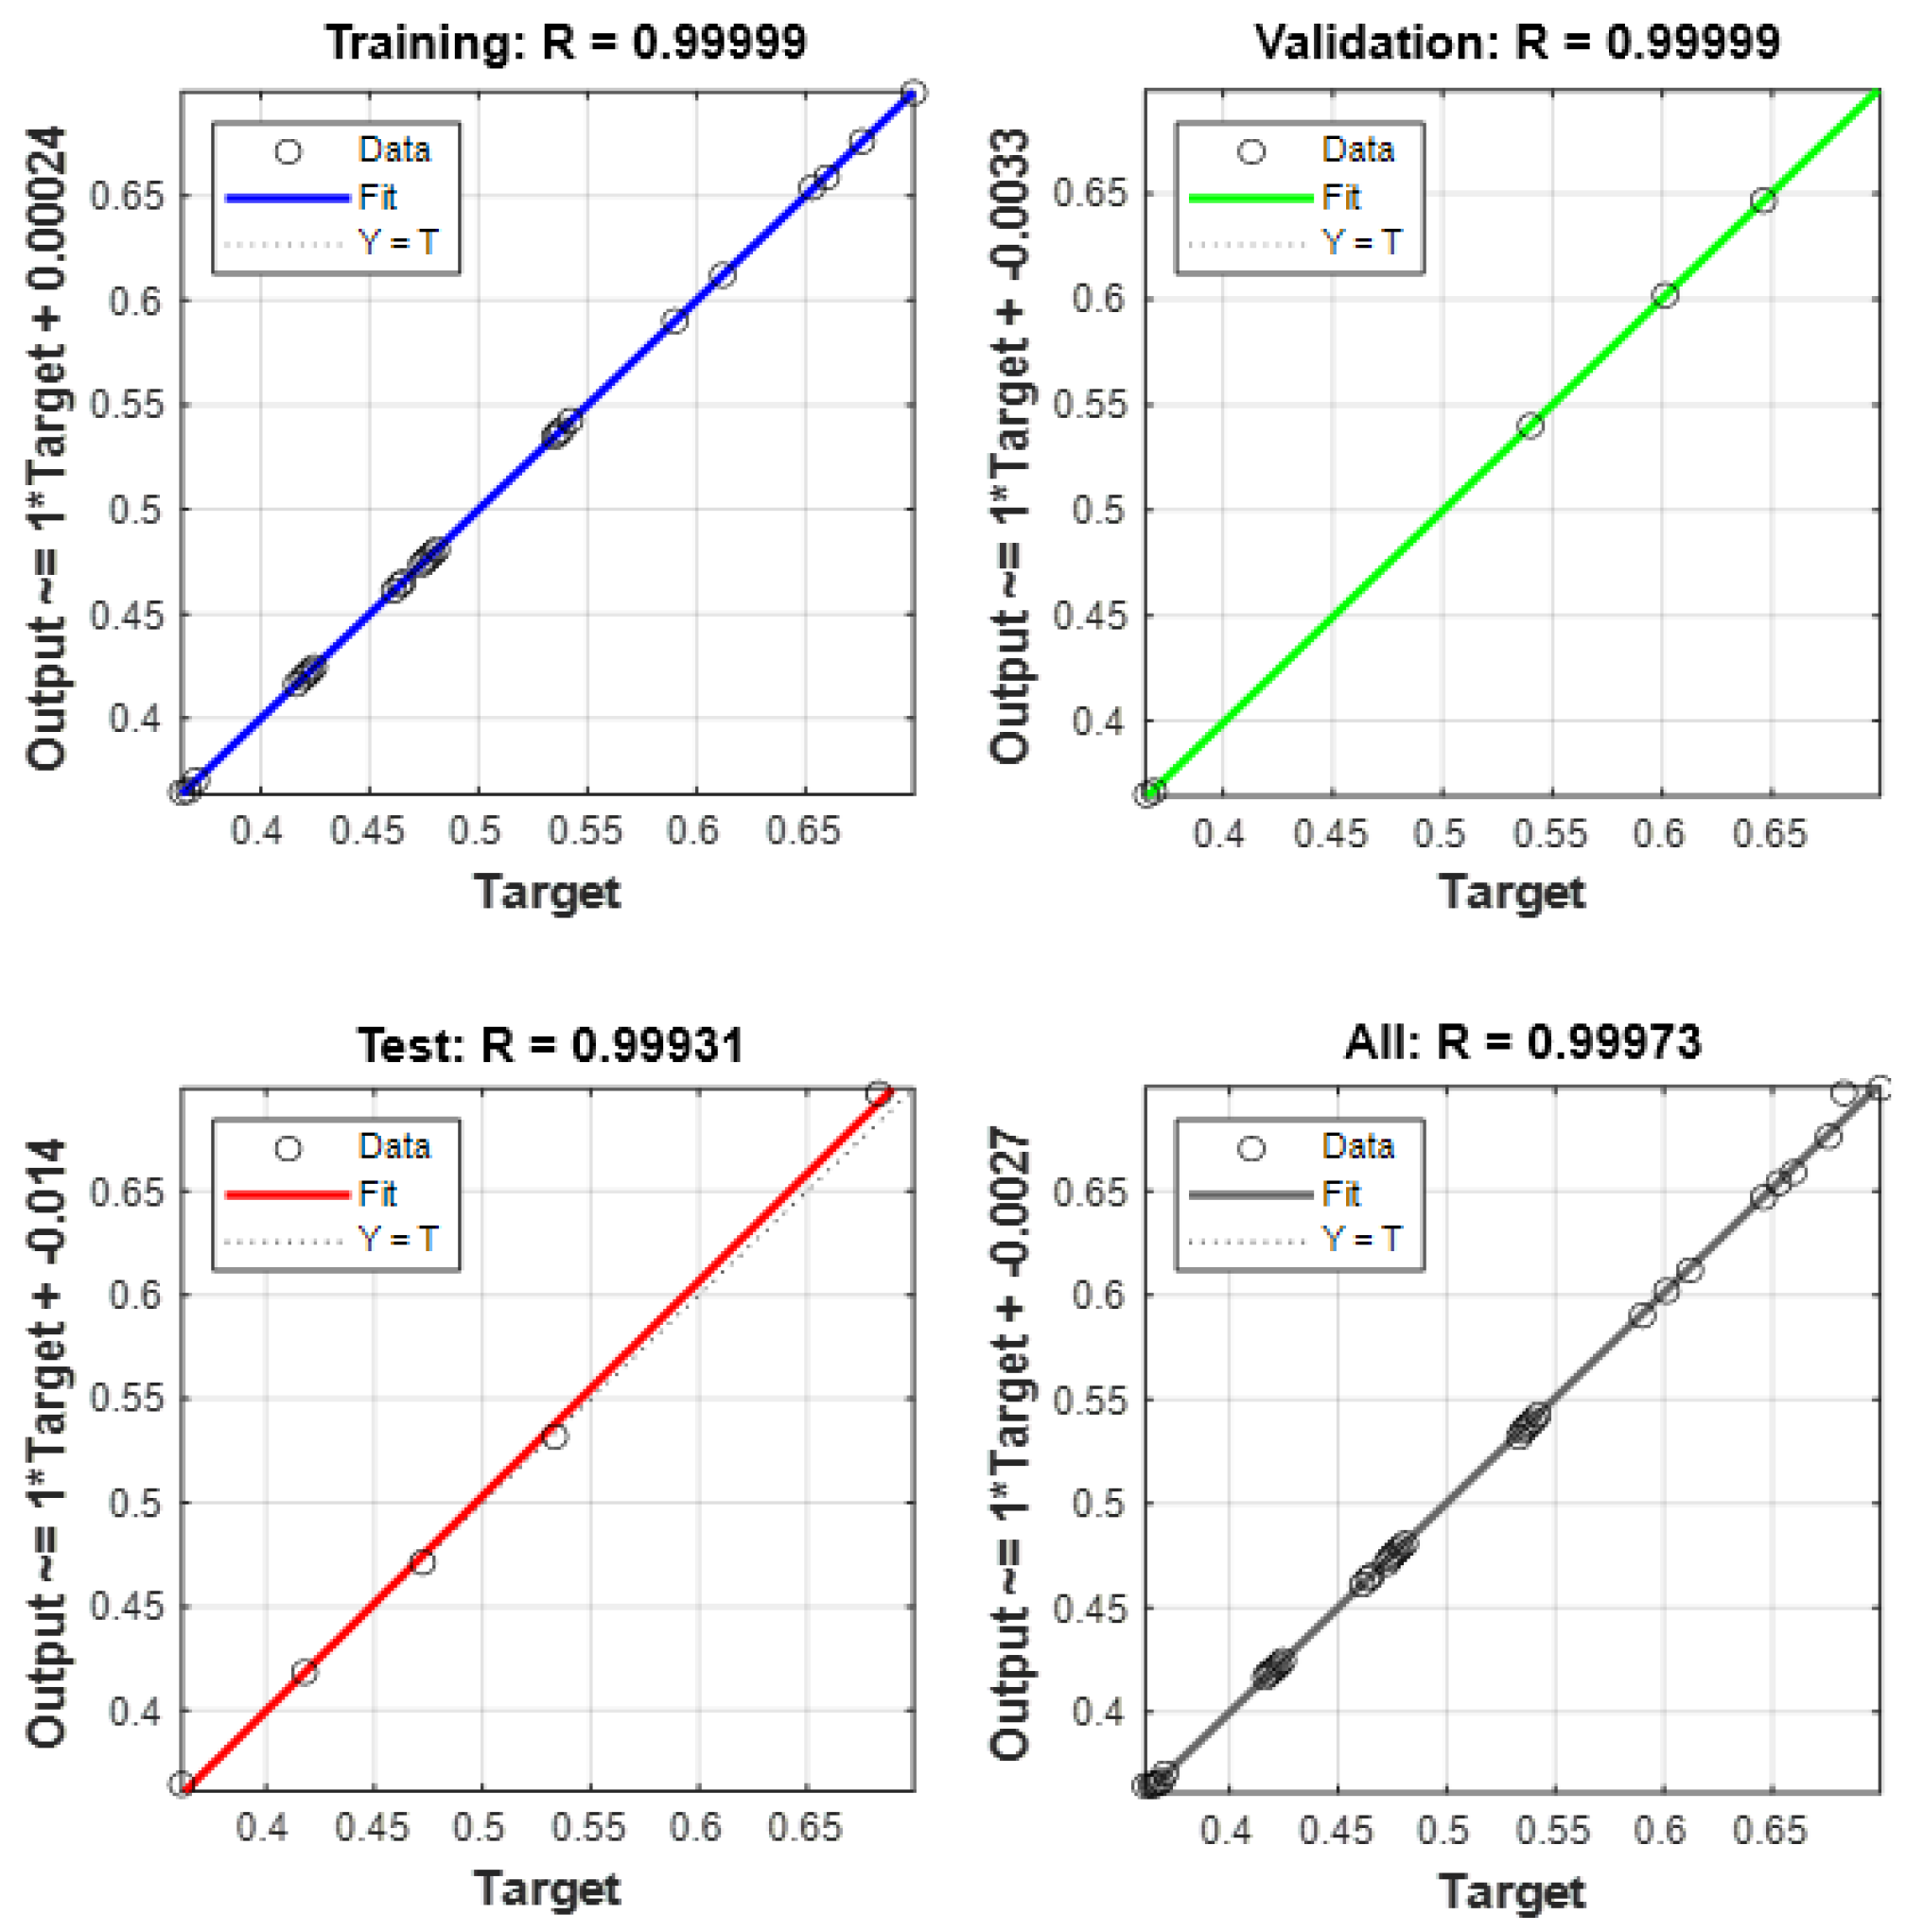
  • According to the input from the FEM analyses, the ANN for the ATT stress prediction was created. The ANN ATT stress prediction’s elapsed time for the 36 regimes was 0.0166 s. The NN predicted the mechanical ATT stress for one regime in 0.00046 s, which was 3,730,434.783 times faster than the FEM modeling. The new method is much faster than the most commonly used methods.
  • The accuracy level of the novel method presented in the article was also relatively high. The maximal error was only 15 MPa (2%), which is not a significant value.
In this article, a novel method for predicting the mechanical stress on ATTs was presented. The method is unique because ATTs are currently monitored only by mechanics and inspections (Figure 2). The proposed method ensures stress prediction during the operation of aircraft and, according to this predicted stress, it will be possible to predict fatigue life, as described in Figure 13. The main innovation in this study lies in the application of the ANN to a particular part of an aircraft and the creation of a new method that will make it possible to predict the stress on the ATT, as mentioned above, in a fraction of a second.

Author Contributions

Conceptualization, M.H., P.K. and M.S.; methodology, M.H. and M.S.; software, M.H., P.K., M.S. and S.A.-R.; validation, M.H., P.K., M.S. and S.A.-R.; formal analysis, M.H. and M.S.; investigation, P.K., M.S. and B.R.; writing—original draft preparation, M.H., M.S., S.A.-R. and B.R.; writing—review and editing, M.H. and P.K.; visualization, M.S., S.A.-R. and B.R.; supervision, M.H., P.K. and S.A.-R.; project administration, M.H. and P.K. All authors have read and agreed to the published version of the manuscript.

Funding

The research was funded by the Slovak Research and Development Agency under the number APVV-20-0546—Innovative measurement of airspeed of unconventional flying vehicles and under contract number OPII-VA/DP/2021/9.3-01 within the “Research of an intelligent management logistics system with a focus on monitoring the hygienic safety of the logistics chain” project implemented under contract number 313011BWP9.

Institutional Review Board Statement

Not applicable.

Informed Consent Statement

Not applicable.

Data Availability Statement

The data presented in this study are available on request from the corresponding author. The data are not publicly available, due to privacy restrictions.

Conflicts of Interest

The authors declare no conflict of interest.

References

  1. Santecchia, E.; Hamouda, A.M.S.; Musharavati, F.; Zalnezhad, E.; Cabibbo, M.; El Mehtedi, M.; Spigarelli, S. A Review on Fatigue Life Prediction Methods for Metals. Adv. Mater. Sci. Eng. 2016, 26, 9573524. [Google Scholar] [CrossRef] [Green Version]
  2. Verhagen, W.J.C.; De Boer, L.W.M. Predictive maintenance for aircraft components using proportional hazard models. J. Ind. Inf. Integr. 2018, 12, 23–30. [Google Scholar] [CrossRef]
  3. Maletič, D.; Maletič, M.; Al-Najjar, B.; Gomišček, B. An Analysis of Physical Asset Management Core Practices and Their Influence on Operational Performance. Sustainability 2020, 12, 9097. [Google Scholar] [CrossRef]
  4. Gallego-García, S.; Gejo-García, J.; García-García, M. Development of a Maintenance and Spare Parts Distribution Model for Increasing Aircraft Efficiency. Appl. Sci. 2021, 11, 1333. [Google Scholar] [CrossRef]
  5. Tateishi, K.; Hanji, T.; Minami, M. A prediction model for extremely low cycle fatigue strength of structural steel. Int. J. Fatigue 2007, 29, 887–896. [Google Scholar] [CrossRef]
  6. Chakherlou, T.N.; Mirzajanzadeh, M.; Abazadeh, B. Investigation of the fatigue life and crack growth in torque tightened bolted joints. Aerosp. Sci. Technol. 2011, 15, 304–313. [Google Scholar] [CrossRef]
  7. Valtinat, G.; Hadrych, I.; Huhn, H. Strengthening of riveted and bolted steel constructions under fatigue loading by preloaded fasteners experimental and theoretical investigations. Connect. Steel Struct. IV 2000, 4, 464–473. [Google Scholar]
  8. Beden, S.M.; Abdullah, S.; Arrifin, A.K. Review of Fatigue Crack Propagation Models for Metallic Components. Eur. J. Sci. Res. 2009, 28, 364–397. [Google Scholar]
  9. Younis, H.B.; Kamal, K.; Sheikh, M.F.; Hamza, A. Prediction of fatigue crack growth rate in aircraft aluminum alloys using optimized neural networks. Theor. Appl. Fract. Mech. 2022, 117, 103196. [Google Scholar] [CrossRef]
  10. Saranik, M.; Jézéquel, L.; Lenoir, D. Experimental and numerical study for fatigue life prediction of bolted connection. Procedia Eng. 2013, 66, 354–368. [Google Scholar] [CrossRef] [Green Version]
  11. Susmel, L.; Tovo, R.; Lazzarin, P. The mean stress effect on the high-cycle fatigue strength from a multiaxial fatigue point of view. Int. J. Fatigue 2005, 27, 928–943. [Google Scholar] [CrossRef]
  12. Pleune, T.T.; Chopra, O.K. Using artificial neural networks to predict the fatigue life of carbon and low-alloy steels. Nucl. Eng. Des. 2000, 197, 1–12. [Google Scholar] [CrossRef]
  13. Ma, X.; He, X.; Tu, Z.C. Prediction of fatigue-crack growth with neural network-based increment learning scheme. Eng. Fract. Mech. 2020, 241, 107402. [Google Scholar] [CrossRef]
  14. Spodniak, M.; Semrád, K.; Draganová, K. Turbine Blade Temperature Field Prediction Using the Numerical Methods. Appl. Sci. 2021, 11, 2870. [Google Scholar] [CrossRef]
  15. Kanthasamy, U.; Chinthaka, M. Predicting Residual Fatigue Life with Finite Element Analysis. In Proceedings of the 110th Annual Session of Institute of Engineers, Colombo, Sri Lanka, 14 October 2016. [Google Scholar]
  16. Yi, S.-X.; Yang, Z.-J.; Xie, H.-X. Hot Deformation and Constitutive Modeling of TC21 Titanium Alloy. Materials 2022, 15, 1923. [Google Scholar] [CrossRef]
  17. Filipoiu, N.; Nemnes, G.A. Prediction of Equilibrium Phase, Stability and Stress-Strain Properties in Co-Cr-Fe-Ni-Al High Entropy Alloys Using Artificial Neural Networks. Metals 2020, 10, 1569. [Google Scholar] [CrossRef]
  18. Ye, S.; Li, B.; Li, Q.; Zhao, H.P.; Feng, X.Q. Deep neural network method for predicting the mechanical properties of composites. Appl. Phys. Lett. 2019, 115, 161901. [Google Scholar] [CrossRef]
  19. Asteris, P.G.; Roussis, P.C.; Douvika, M.G. Feed-Forward Neural Network Prediction of the Mechanical Properties of Sandcrete Materials. Sensors 2017, 17, 1344. [Google Scholar] [CrossRef] [Green Version]
  20. Nie, Z.; Jiang, H.; Kara, L.B. Stress Field Prediction in Cantilevered Structures Using Convolutional Neural Networks. J. Comput. Inf. Sci. Eng. 2020, 20, 011002. [Google Scholar] [CrossRef] [Green Version]
  21. Bezerra, E.; Ancelotti, A.; Pardini, L.; Rocco, J.; Iha, K.; Ribeiro, C. Artificial neural networks applied to epoxy composites reinforced with carbon and E-glass fibers: Analysis of the shear mechanical properties. Mater. Sci. Eng. A 2007, 464, 177–185. [Google Scholar] [CrossRef]
  22. Maleki, E.; Reza Kashyzadeh, K. Effects of the hardened nickel coating on the fatigue behavior of ck45 steel: Experimental, finite element method, and artificial neural network modeling. Iran. J. Mater. Sci. Eng. 2017, 14, 81–99. [Google Scholar]
  23. Ajmal, P.C.H.; Mohammed, A. Finite element analysis based fatigue life evaluation approach for railway bridges: A study in Indian scenario. Struct. Monit. Maint. 2018, 5, 429–443. [Google Scholar] [CrossRef]
  24. Lu, C.; Li, H.; Han, L.; Keshtegar, B.; Fei, C.W. Bi-iterative moving enhanced model for probability-based transient LCF life prediction of turbine blisk. Aerosp. Sci. Technol. 2023, 132, 107998. [Google Scholar] [CrossRef]
  25. Wen, J.; Fei, C.; Ahn, S.Y.; Han, L.; Huang, B.; Liu, Y.; Kim, H.S. Accelerated damage mechanisms of aluminized superalloy turbine blades regarding combined high-and-low cycle fatigue. Surf. Coat. Technol. 2022, 451, 129048. [Google Scholar] [CrossRef]
  26. Fei, C.; Wen, J.; Han, L.; Huang, B.; Yan, C. Optimizable Image Segmentation Method with Superpixels and Feature Migration for Aerospace Structures. Aerospace 2022, 9, 465. [Google Scholar] [CrossRef]
  27. Zych, P.; Żywica, G. Fatigue Analysis of the Microturbine Rotor Disc Made of 7075 Aluminium Alloy Using a New Hybrid Calculation Method. Materials 2022, 15, 834. [Google Scholar] [CrossRef] [PubMed]
  28. Radhakrishnan, K.; Park, J.S. Thermal Analysis and Creep Lifetime Prediction Based on the Effectiveness of Thermal Barrier Coating on a Gas Turbine Combustor Liner Using Coupled CFD and FEM Simulation. Energies 2021, 14, 3817. [Google Scholar] [CrossRef]
  29. Elhefny, A.; Liang, G. Stress and deformation of rocket gas turbine disc under different loads using finite element modelling. Propuls. Power Res. 2013, 2, 38–49. [Google Scholar] [CrossRef] [Green Version]
  30. Adnan, M.; Shujiel, L. FEA Analysis and Fatigue Life Prediction of Aircraft Turbine Disk. North Am. Acad. Res. (NAAR) J. 2021, 4, 10–19. [Google Scholar] [CrossRef]
  31. Guo, Y.; Liu, Y.; Wu, Y.; Cao, H.; Mo, D. Design Optimization and Burst Speed Prediction of a Ti2AlNb Blisk. Int. J. Aerosp. Eng. 2021, 2021, 3290518. [Google Scholar] [CrossRef]
  32. Jiang, L.; Jiang, Y.; Yu, L.; Yang, H.; Li, Z.; Ding, Y. Thermo-Mechanical Coupling Analyses for Al Alloy Brake Discs with Al2O3-SiC(3D)/Al Alloy Composite Wear-Resisting Surface Layer for High-Speed Trains. Materials 2019, 12, 3155. [Google Scholar] [CrossRef] [PubMed] [Green Version]
  33. Giannella, V.; Baglivo, G.; Giordano, R.; Sepe, R.; Citarella, R. Structural FEM Analyses of a Landing Gear Testing Machine. Metals 2022, 12, 937. [Google Scholar] [CrossRef]
  34. Kinne, M.; Thöns, S. Fatigue Reliability Based on Predicted Posterior Stress Ranges Determined from Strain Measurements of Wind Turbine Support Structures. Energies 2023, 16, 2225. [Google Scholar] [CrossRef]
  35. Rincón-Casado, A.; Juliá-Lerma, J.M.; García-Vallejo, D.; Domínguez, J. Experimental estimation of the residual fatigue life of in-service wind turbine bolts. Eng. Fail. Anal. 2022, 141, 106658. [Google Scholar] [CrossRef]
  36. Lin, C.-S.; Chiang, H.-T.; Hsu, C.-H.; Lin, M.-H.; Liu, J.-K.; Bai, C.-J. Modal Verification and Strength Analysis of Bladed Rotors of Turbine in Rated Working Conditions. Appl. Sci. 2021, 11, 6306. [Google Scholar] [CrossRef]
  37. Teixeira Júnior, M.; Zilio, G.; Mortean, M.V.V.; de Paiva, K.V.; Oliveira, J.L.G. Experimental and numerical analysis of transient thermal stresses on thick-walled cylinder. Int. J. Press. Vessel. Pip. 2023, 202, 104884. [Google Scholar] [CrossRef]
  38. Huang, X.; Chen, C.; Xuan, H.; Guo, X.; Shan, X.; Hong, W. Fatigue crack propagation analysis in an aero-engine turbine disc using computational methods and spin test. Theor. Appl. Fract. Mech. 2023, 124, 103745. [Google Scholar] [CrossRef]
  39. Ramesh, K.; Sasikumar, S. Digital photoelasticity: Recent developments and diverse applications. Opt. Lasers Eng. 2020, 135, 106186. [Google Scholar] [CrossRef]
  40. Ren, Z.; Zhang, Q.; Ju, Y.; Xie, H. Determination of the full-field stress and displacement using photoelasticity and sampling moiré method in a 3D-printed model. Theor. Appl. Mech. Lett. 2022, 12, 100380. [Google Scholar] [CrossRef]
  41. Chen, R.; Zhang, Q.; He, W.; Xie, H.M. Orthogonal sampling moiré method and its application in microscale deformation field measurement. Opt. Lasers Eng. 2022, 149, 106811. [Google Scholar] [CrossRef]
  42. Xia, H.; Guo, R.; Yan, F.; Cheng, H.; Lin, Z.; Ma, Q.; Wang, F. Simultaneous measurement of stress-optic constant and stress field of transparent plate by digital holographic interferometry. Optik 2016, 127, 11974–11981. [Google Scholar] [CrossRef]
  43. Zhao, M.; Pei, X.; Luo, S.; Yan, M.; Xing, W.; Wang, W.; Liu, S.; Shao, R.; Xu, Z. Research on mechanical properties and failure mechanism of TRM composites via digital image correlation method and finite element simulation. Compos. Struct. 2023, 311, 116798. [Google Scholar] [CrossRef]
  44. Komichenko, S.O.; Benin, A.V.; Kanifadin, K.V. Applying the Digital Image Correlation Method to Assess the Stress-Strain State of Gondola Elements. Transp. Res. Procedia 2023, 68, 702–711. [Google Scholar] [CrossRef]
  45. Badarinath, P.V.; Chierichetti, M.; Kakhki, F.D. A Machine Learning Approach as a Surrogate for a Finite Element Analysis: Status of Research and Application to One Dimensional Systems. Sensors 2021, 21, 1654. [Google Scholar] [CrossRef] [PubMed]
  46. Kundu, S.; Jones, R.; Peng, D.; Matthews, N.; Alankar, A.; Raman, S.R.K.; Huang, P. Review of Requirements for the Durability and Damage Tolerance Certification of Additively Manufactured Aircraft Structural Parts and AM Repairs. Materials 2020, 13, 1341. [Google Scholar] [CrossRef] [Green Version]
  47. Spodniak, M.; Klimko, M.; Hocko, M.; Žitek, P. Low cycle fatigue numerical estimation of a high pressure turbine disc for the AL-31F jet engine. EPJ Web Conf. 2017, 143, 2114. [Google Scholar] [CrossRef] [Green Version]
  48. Peihao, S.; Trivedi, A.; Siviour, C.R. Tensile testing of polymers: Integration of digital image correlation, infrared thermography and finite element modelling. J. Mech. Phys. Solids 2023, 171, 105161. [Google Scholar] [CrossRef]
  49. Ye, X.; Zheng, H.; Zhang, G.; Chang, Z.; Zheng, Z.; Huang, Z.; Gao, X.; Su, G. In Situ Observation of Retained Austenite Transformation in Low-Carbon Micro-Alloyed Q&P Steels. Crystals 2023, 13, 351. [Google Scholar] [CrossRef]
  50. EN 10085; Nitriding Steels—Technical Delivery Conditions. Deutsches Institut für Normung: Berlin, Germany, 2011. Available online: https://standards.iteh.ai/catalog/standards/sist/e61dd10f-256e-4c73-be10-a638e8a93729/sist-en-10085-2002 (accessed on 18 March 2023).
  51. Ansys Inc. ANSYS Workbench Documentation 10.0. 2005. Available online: https://kashanu.ac.ir/Files/Content/ANSYS%20Workbench.pdf (accessed on 18 March 2023).
  52. Spodniak, M.; Semrád, K.; Fozo, L.; Pavlinský, J. FEM analysis of natural frequencies of jet engine iSTC-21v turbine blade. In Proceedings of the IEEE 17th World Symposium on Applied Machine Intelligence and Informatics (SAMI), Herlany, Slovakia, 24–26 January 2019. [Google Scholar] [CrossRef]
  53. Pham, Q.H.; Gagnon, M.; Antoni, J.; Tahan, A.; Monette, C. Rainflow-counting matrix interpolation over different operating conditions for hydroelectric turbine fatigue assessment. Renew. Energy 2021, 172, 465–476. [Google Scholar] [CrossRef]
  54. Zhao, W.; Guo, T.; Yu, X.; Han, C. A learnable sampling method for scalable graph neural networks. Neural Netw. 2023, 162, 412–424. [Google Scholar] [CrossRef]
  55. Konar, D.; Sarma, A.D.; Bhandary, S.; Bhattacharyya, S.; Cangi, A.; Aggarwal, V. A shallow hybrid classical–quantum spiking feedforward neural network for noise-robust image classification. Appl. Soft Comput. 2023, 136, 110099. [Google Scholar] [CrossRef]
  56. Nwankpa, C.; Ijomah, W.; Gachagan, A.; Marshall, S. Activation Functions: Comparison of Trends in Practice and Research for Deep Learning. arXiv 2018, arXiv:1811.03378. [Google Scholar] [CrossRef]
  57. Guo, Q.; Wu, X.; Kittler, J.; Feng, Z. Differentiable neural architecture learning for efficient neural networks. Pattern Recognit. 2022, 126, 108448. [Google Scholar] [CrossRef]
  58. Hegendörfer, A.; Steinmann, P.; Mergheim, J. Numerical Optimization of a Nonlinear Nonideal Piezoelectric Energy Harvester Using Deep Learning. J. Low Power Electron. Appl. 2023, 13, 8. [Google Scholar] [CrossRef]
  59. Wang, Y.; Cao, Y.; Cao, C.; Wang, H. Effect of Curing Temperature under Deep Mining Conditions on the Mechanical Properties of Cemented Paste Backfill. Minerals 2023, 13, 383. [Google Scholar] [CrossRef]
  60. Petkar, P.M.; Gaitonde, V.N.; Kulkarni, V.N.; Karnik, R.S.; Davim, J.P. A Comparative Study in Forming Behavior of Different Grades of Steel in Cold Forging Backward Extrusion by Integrating Artificial Neural Network (ANN) with Differential Evolution (DE) Algorithm. Appl. Sci. 2023, 13, 1276. [Google Scholar] [CrossRef]
  61. Long, B.; Wu, K.; Li, P.; Li, M. A Novel Remaining Useful Life Prediction Method for Hydrogen Fuel Cells Based on the Gated Recurrent Unit Neural Network. Appl. Sci. 2022, 12, 432. [Google Scholar] [CrossRef]
  62. Mesároš, P.; Mandičák, T.; Behúnová, A. Use of BIM technology and impact on productivity in construction project management. Wirel. Netw. 2022, 28, 855–862. [Google Scholar] [CrossRef]
  63. Busari, Y.O.; Manurung, Y.H.P.; Leitner, M.; Shuaib-Babata, Y.L.; Mat, M.F.; Ibrahim, H.K.; Simunek, D.; Sulaiman, M.S. Numerical Evaluation of Fatigue Crack Growth of Structural Steels Using Energy Release Rate with VCCT. Appl. Sci. 2022, 12, 2641. [Google Scholar] [CrossRef]
Figure 1. The method used ANN for stress prediction applied to ATT with future application to life-cycle counting.
Applsci 13 04215 g001
Figure 2. ATT cracks: (a) 25,000 cycles; (b) 17,000 cycles; (c) 36,000 cycles; (d) 17,000 cycles; (e,f) ATT cracks in the rib area visualized using a non-destructive technique.
Applsci 13 04215 g002
Figure 3. Tensile-test-specimen description.
Applsci 13 04215 g003
Figure 4. Dependence of elastic modulus on temperature [50].
Applsci 13 04215 g004
Figure 5. Three-dimensional model of a brake assembly of the Airbus A320 modeled in ANSYS software.
Applsci 13 04215 g005
Figure 6. Finite element model and application of the boundary condition.
Applsci 13 04215 g006
Figure 7. Von Misses stress of the brake assembly.
Applsci 13 04215 g007
Figure 8. Von Misses stress distribution in the torque tube of the brake.
Applsci 13 04215 g008
Figure 9. An architecture of the neural network for stress prediction.
Applsci 13 04215 g009
Figure 10. Training parameters of the neural network.
Applsci 13 04215 g010
Figure 11. Predicted results of the torque-tube stress calculated by the NN and FEM.
Applsci 13 04215 g011
Figure 12. Estimated errors of the predicted data by NN and FEM.
Applsci 13 04215 g012
Figure 13. Methodology for aircraft-torque-tube-life prediction based on the numerical methods.
Applsci 13 04215 g013
Table 1. Measured and calculated mechanical properties of the specimen.
l0ΔlFσεEμ
5054.35102,000,000,0231,292,517.011.087212,780,604.420.310594
5052.4950,000,000220,468,786.261.048210,370,979.260.314774
5053.2105,000,000,0225,927,918.241.064212,338,269.020.339324
5053.5107,000,000,0227,756,492.121.07212,856,534.700.328888
Table 2. Inputs for the neural network.
RegimeBrake Temperature °COutside Temperature °CLanding Speed km/hStress MPa
120025200472.36
224025220533.42
326040260645.98
Disclaimer/Publisher’s Note: The statements, opinions and data contained in all publications are solely those of the individual author(s) and contributor(s) and not of MDPI and/or the editor(s). MDPI and/or the editor(s) disclaim responsibility for any injury to people or property resulting from any ideas, methods, instructions or products referred to in the content.

