
Ecological Sensitivity Assessment and Spatial Pattern Analysis of Land Resources in Tumen River Basin, China

1
College of Geography and Ocean Sciences, Yanbian University, Yanji 133002, China
2
College of Resources and Environment, Qingdao Agricultural University, Qingdao 266109, China
3
Qingdao Agricultural Remote Sensing Application Engineering Research Center, Qingdao 266109, China
4
School of Geomatics and Prospecting Engineering, Jilin Jianzhu University, Changchun 130118, China
*
Author to whom correspondence should be addressed.
Appl. Sci. 2023, 13(7), 4197; https://doi.org/10.3390/app13074197
Submission received: 24 February 2023
/
Revised: 14 March 2023
/
Accepted: 23 March 2023
/
Published: 25 March 2023
(This article belongs to the Section Environmental Sciences)
Abstract
:Ecological sensitivity is one of the important indicators of regional ecological fragility, which can represent the sensitivity of ecosystems to natural environmental conditions and human activity disturbances in the region. In this study, the ecological sensitivity of land resources in the Tumen River Basin of China was quantitatively evaluated by taking 3 ecologically sensitive impact types, including the natural environment, human disturbance, and soil erosion, as evaluation criteria, and 11 ecologically sensitive factors were selected to build an evaluation system using the analytic hierarchy process (AHP) method, to determine the weights of the evaluation factors, combined with geographic information system (GIS) technology. The results show that: (1) Among the three types of ecological sensitivity factors, the influence of human disturbance is the most obvious, and the two factors of land use type and distance from construction land have the highest weights in the comprehensive ecological sensitivity evaluation. (2) There are no extremely sensitive areas or insensitive areas in the Tumen River Basin in China. Highly sensitive areas account for only 0.59% of the total area and are mainly concentrated in the lakes, rivers, and reservoirs in the study area. Moderately sensitive areas account for 54.12%, which are concentrated in the central part of the Tumen River Basin Slightly sensitive areas are mainly located in the mountainous areas in the north and south of the study area. (3) Among the various land resource types, the proportion of slightly sensitive areas and moderately sensitive areas of woodland is close (about 50%), while cultivated land, grassland, construction land, and bare land are mainly moderately sensitive areas (73.95%, 82.07%, 96.59%, and 78.78%), and water bodies are mostly distributed within highly sensitive areas (60.97%), and all wetlands with the smallest area are moderately sensitive. The results of the study can provide data support and a scientific basis for regional ecological protection and development planning.
1. Introduction
The ecological environment is the basic condition for human survival, life, and production. With the development of the social economy and the improvement of science and technology, the impact of human beings on the ecological environment is increasing in both breadth and depth, which has led to a series of ecological and environmental problems that seriously threaten the living environment of human beings and the sustainable development of the social economy. To represent the sensitivity of regional ecosystems to natural environmental conditions and human activities in the region, researchers usually use ecological sensitivity to reflect the difficulty and possibility of ecological environmental problems occurring in regional ecosystems when they are disturbed, as well as the severity of the possible consequences [1,2,3]. In-depth analysis and reasonable evaluation of the ecological sensitivity in a region can provide a scientific basis for environmental protection strategies and the development and use of land resources in the region [4,5,6].
In recent years, research on ecological sensitivity has been mainly reflected in two aspects: sensitivity mechanism analysis and ecological sensitivity evaluation [7]. There are many ecological sensitivity evaluation methods, mainly including the alternative method [8,9], the modeling method [10,11], and the factor superposition method [12,13]. Among them, the alternative method defines sensitivity as the degree of response of a land ecosystem to changes in influencing factors [14], which is generally represented by the ratio of the change rate of the study object to the change rate of the factors [8]. This method is mostly used for specific problems or single sensitivities, with poor universality. Model methods, such as Shuangcheng Li et al. [10], construct a multi-layer perceptron network model to evaluate the sensitivity of ecosystems in response to climate change. However, the parameter uncertainty and high precision requirements of the model method limit the accuracy of reflecting sensitivity conditions and its application in large or medium scale regional studies. The rapid development of geographic information system (GIS) technology in recent years has led to the gradual expansion of ecological sensitivity research from a single sensitivity to a comprehensive regional sensitivity [7], and the factor superposition method has become the mainstream method [12]. In China, based on Interim Regulations on Ecological Function Zoning [15] and Technical Guidelines for the Evaluation of Resource and Environmental Carrying Capacity and Land Space Development Suitability (Trial) [16], many researchers have focused on ecological environmental problems such as soil erosion [17], desertification [18], salinization [19], and rocky desertification [20], and carry out the single sensitivity or comprehensive sensitivity evaluation of the ecological environment on the scale of cities, regions, or watersheds [7,21,22,23,24,25,26,27]. The research trend gradually changes from static to temporal and spatial dynamic evolution [28,29]. In foreign countries, researchers mainly focus on mathematical modeling and other methods to study the effects of certain ecological factors on regional ecological environments under large-scale natural conditions or study a specific ecological environment problem. the MEDALUS method [30], based on the evaluation of land desertification along the Mediterranean coast, provides a reference for ecological sensitivity assessment in Europe. This method selects four indicators of climate quality index, soil quality index, vegetation quality index, and land management quality index for comprehensive evaluation. At present, the application scope of MEDALUS method has been gradually extended from land desertification to other land degradation sensitivity issues [31,32,33]. Roue-Legall et al. used mercury levels in fish as the data source to build a model to evaluate the regional ecological sensitivity [34]. Fieberg et al. simulated the wolf reintroduction effect on elk and studied global sensitivity analysis to assess ecosystem instability [35]. Rossi et al. took two regions in Italy as research areas to study the coupling relationship between ecological value and ecological sensitivity indicators of protected areas and demographic pressure indicators [36]. Adamczyk et al. took Poland, as an example, and analyzed the sensitivity of the ecological effects for the investment based on the thermal insulation of the building [37]. These studies have made positive contributions to ecological environmental protection and regional ecosystem analysis and evaluation.
Located in the core region of Northeast Asia, the Tumen River Basin is rich in natural resources and has important ecological value, playing an important role in the ecosystem services and ecological security of Northeast Asia. In 2009, the State Council of China officially approved Planning Outline of China Tumen River Regional Cooperation and Development, Taking Chang-Ji-Tu as Development and Opening Pilot Area, marking that the construction of the Changchun-Jilin-Tumen area has been elevated to a national strategy. In recent years, with the implementation of the opening-up strategy, China’s Tumen River Basin has entered a stage of multinational joint development, and the ecosystem of this area has inevitably been disturbed by various factors. Although the overall condition of the ecological environment in the region is relatively good at present, the threats to ecological security cannot be ignored. However, the study of the region is rarely focused on ecological sensitivity, and, in particular, there is a lack of work on a comprehensive ecological sensitivity assessment of the whole area.
In this context, our objective in this study is to evaluate and analyze the ecological sensitivity of the Tumen River basin in China by using GIS technology, selecting ecological sensitivity factors, and combining single-factor hierarchical and multi-factor spatial overlay models to obtain ecological sensitivity evaluation results for the study area. The research results can provide a scientific reference for future ecological protection and restoration, development management, and policy formulation in this region.
2. Research Methodology
2.1. Overview of the Study Area and Data Sources
2.1.1. Overview of the Study Area
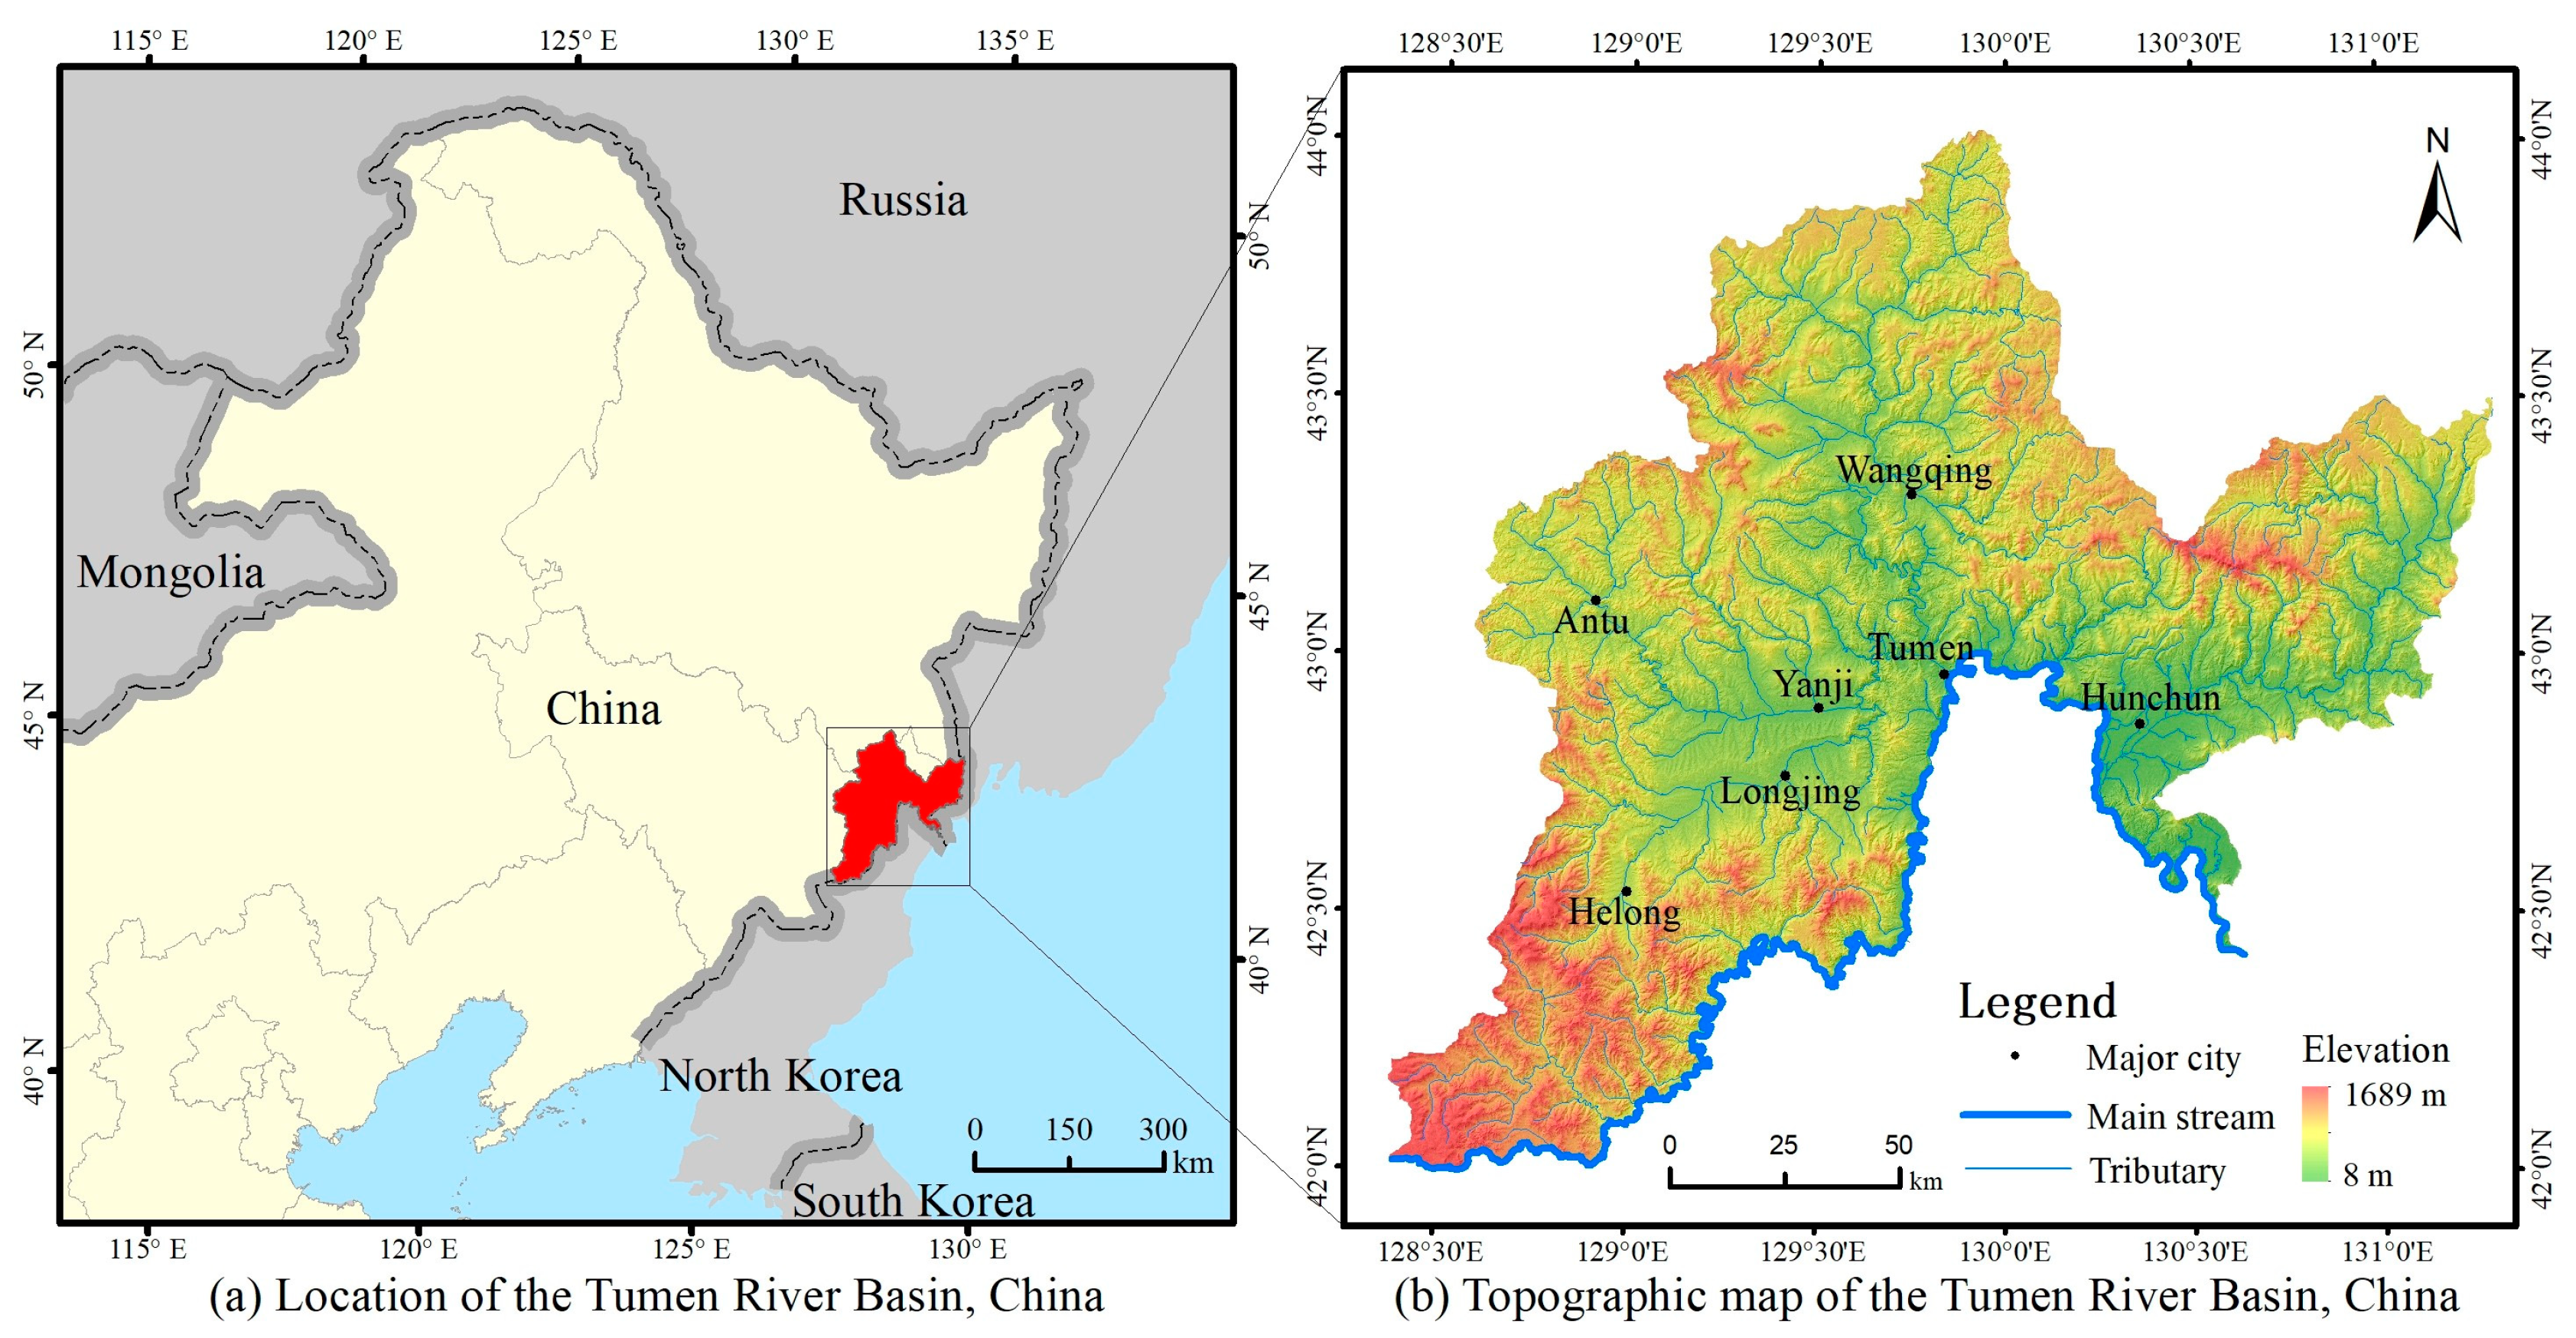
The Tumen River, originating from the eastern foot of the main peak of the Changbai Mountain Range and flowing northeastward into the Sea of Japan, is the boundary river between China and North Korea and Russia and North Korea. The Tumen River Basin (on the Chinese side), as shown in Figure 1, is located in the southeastern part of Jilin Province, China, within the Yanbian Korean Autonomous Prefecture, covering four counties, Yanji, Tumen, Longjing, and Hunchun, as well as parts of Hulong, Antu, and Wangqing counties. The geographical coordinates are 128°22′48″ E~131°18′33″ E, 41°59′49″ N~44°01′34″ N, with a total basin area of 22,690.70 km2. The landscape here is dominated by low mountains and hills, with several river valley basins, and elevations ranging from 8 to 1689 m, higher in the south and north, and lower in the center and east (Figure 1). This area belongs to the temperate continental monsoon climate, which is warm and rainy in summer and cold and dry in winter. The average annual temperature in the region is between −1 °C and 7 °C, with lower temperatures in the higher altitude areas and slightly higher temperatures in the river valleys and plains. The average annual precipitation is between 580 and 780 mm, with rainfall mostly concentrated in June, July, and August. The soils in the region are rich in types, including dark brown earth, albic soil, gray brown earth, and so on. Among the land resource types in the region, woodland dominates, followed by cultivated land, construction land, grassland, bare land, water bodies, and wetland. The forest cover in the region is about 85% and the overall ecological environment is good.
2.1.2. Data Sources and Preprocessing
The data involved in this study include elevation data, satellite remote sensing data, precipitation and temperature data, soil data, land use data, road, rainfall erosivity data, and water system data. The source and resolution/scale of the data are shown in Table 1.
The data were uniformly converted using the CGCS2000 coordinate system and the Gauss Kruger projection. For raster data, they were converted to a size of 30 × 30 m by resampling; for vector data, such as water systems and roads, buffer analysis and clipping were carried out, and then converted to raster data with a resolution of 30 m.
2.2. Construction of an Ecological Sensitivity Evaluation System
2.2.1. Selection of Evaluation Factors
Many factors influence ecosystem sensitivity, such as temperature, precipitation, vegetation, soil, land use type, etc. The influencing factors in different regions are different, and the ecological factors acting on different ecological processes are also different. In general, the most significant factors affecting ecological sensitivity are natural environmental conditions and human disturbances, so these two types were used as the criteria for ecological sensitivity evaluation in this study. In addition, the general evaluation content of ecosystem sensitivity stipulated in Interim Technical Regulations For Ecological Function Zoning (ITREFZ), issued by the Ministry of Ecology and Environmental of China [15], includes soil erosion sensitivity, salinization sensitivity, desertification sensitivity, and acid rain sensitivity. Considering the characteristics of this region, soil erosion was chosen as the third evaluation criterion.
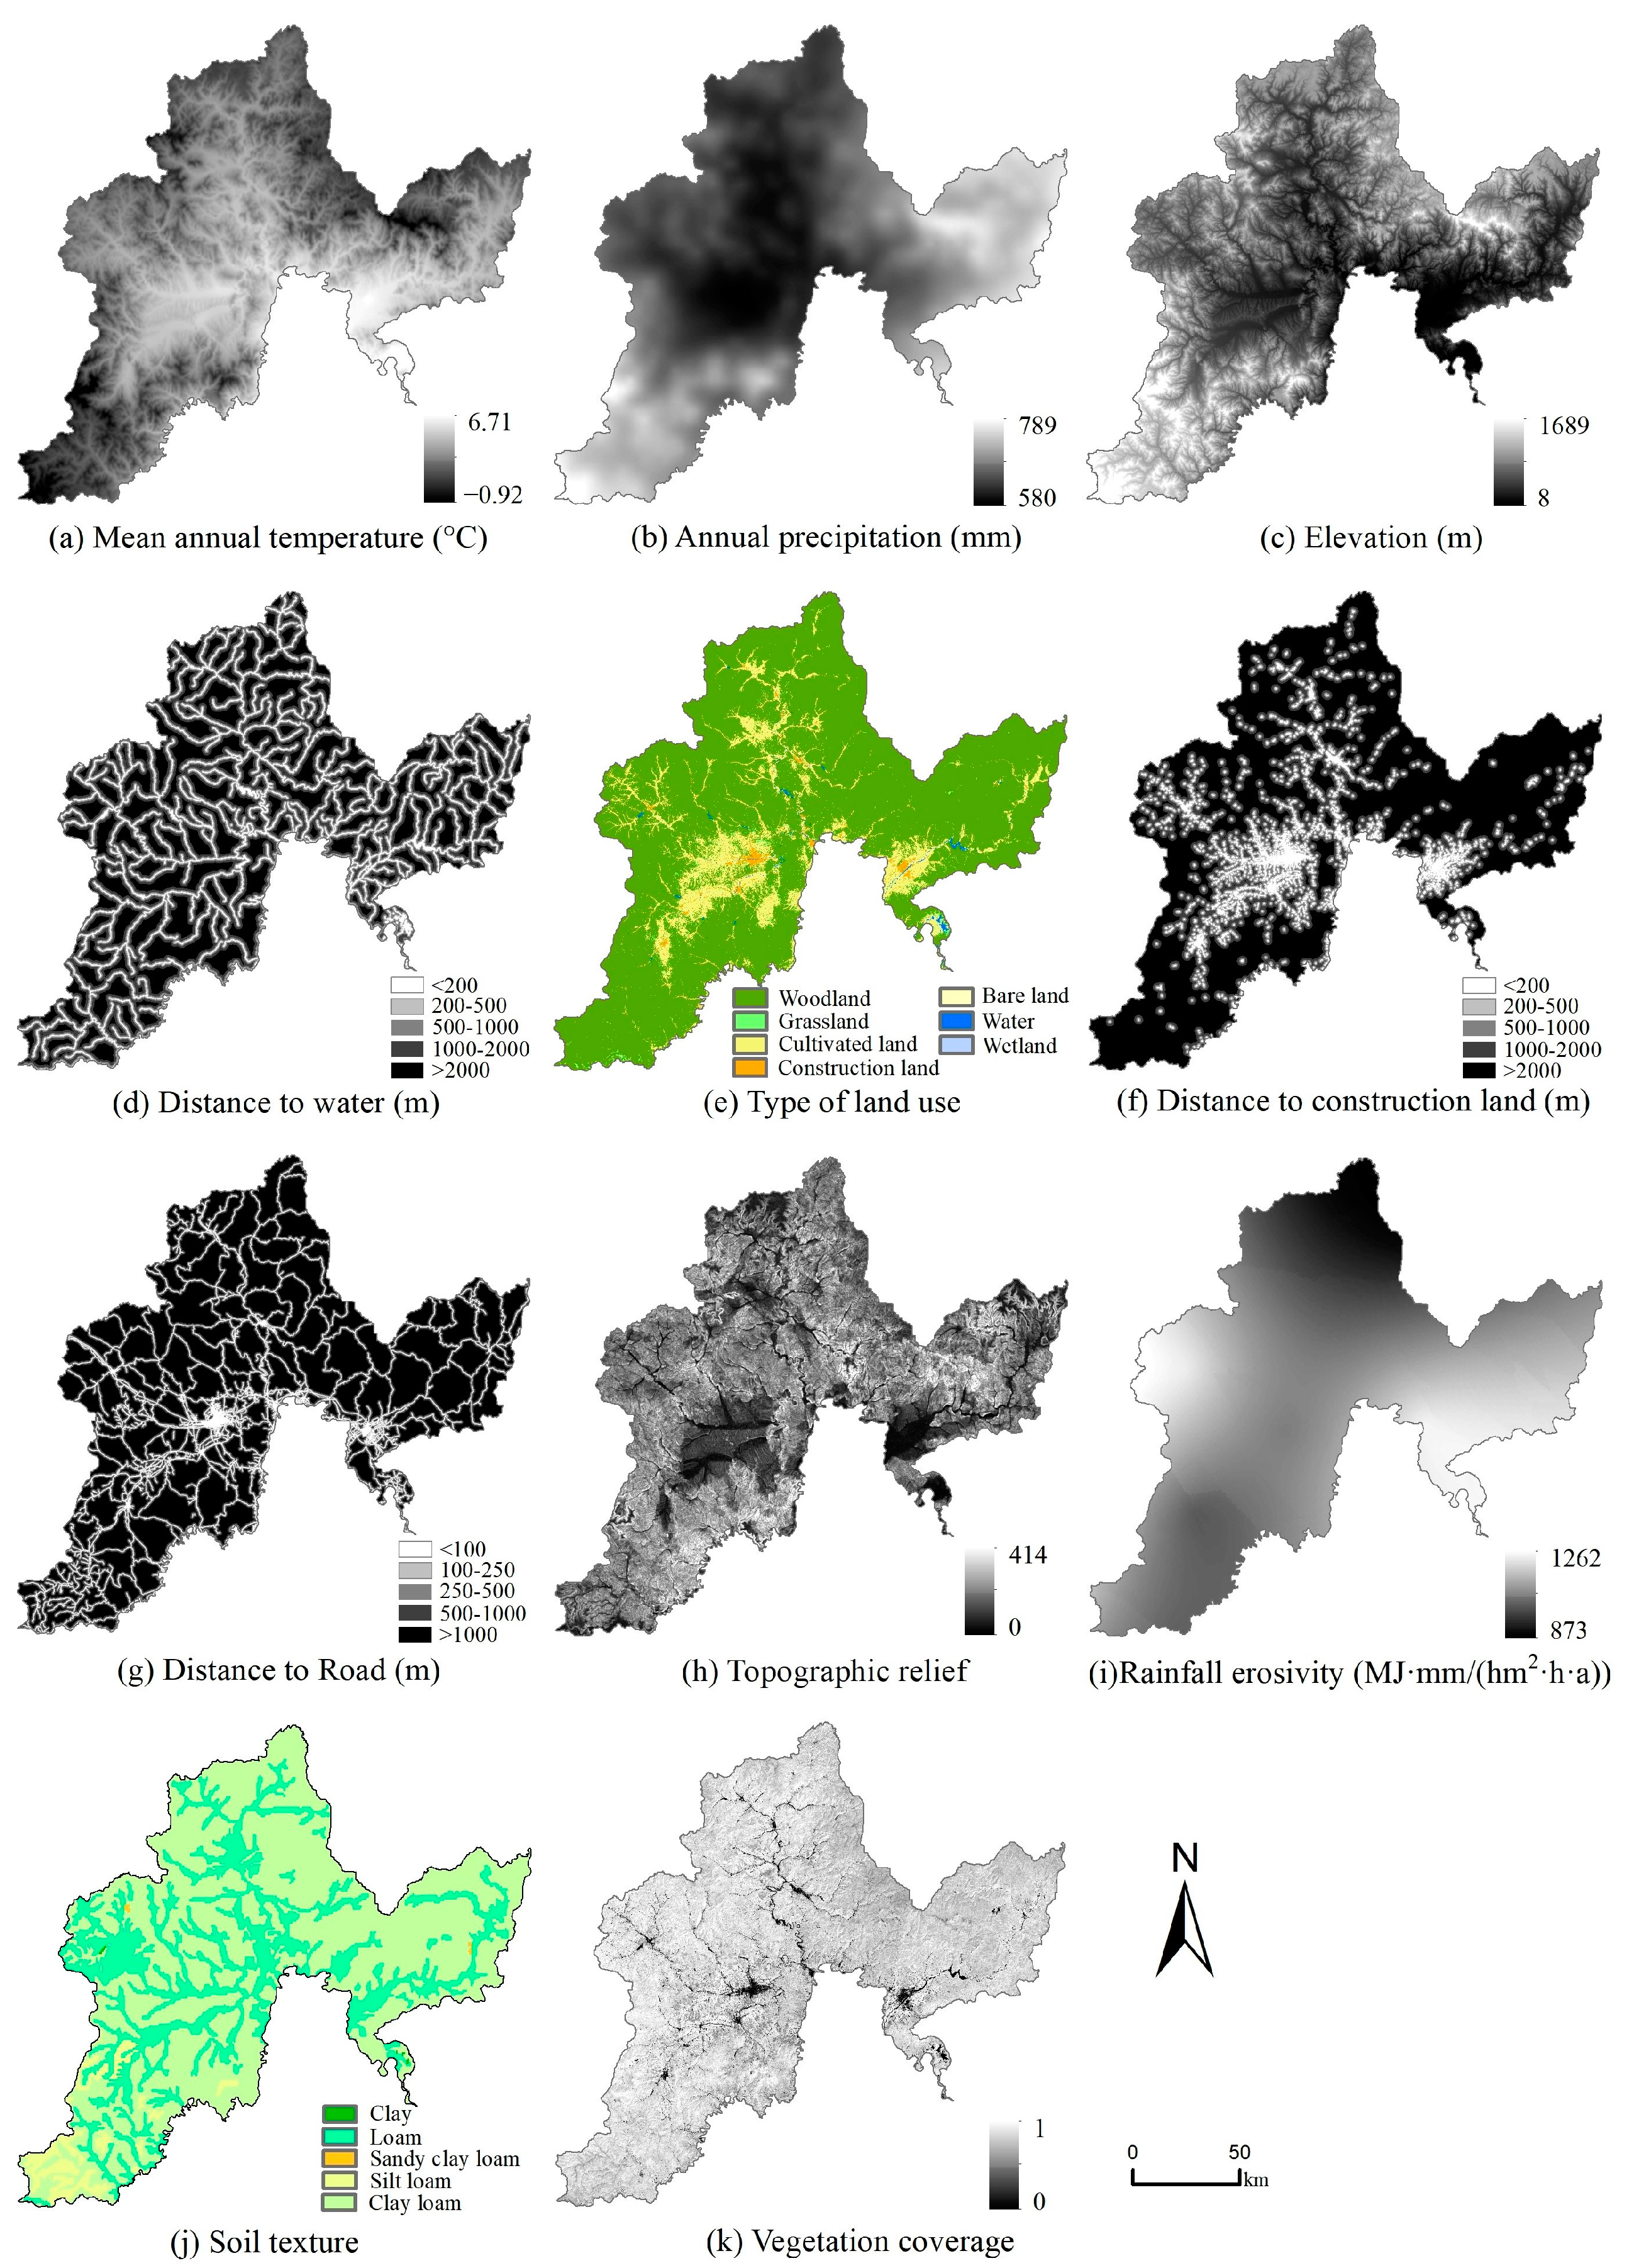
This study followed the basic principles of scientific, representative, relevant, comprehensive, and operable evaluation indicators, and, combined with the characteristics of the Tumen River Basin, we finally selected 11 ecological sensitivity factors. Temperature, precipitation, and elevation are the basic elements of natural environmental conditions. Water is the lifeblood of the ecosystem, and the distance to the water is also an important factor affecting ecological sensitivity [2]. Therefore, we selected the mean annual temperature, annual precipitation, elevation, and distance to water to form the evaluation criteria for the natural environment. The disturbance from human activity is mainly in the form of the use of land resources, and disturbance around construction land and road perimeters [13,24]. Here, we selected land use type, distance to construction land, and distance to roads to form the evaluation criteria for human disturbance. Topographic relief, rainfall erosivity, soil texture, and vegetation cover are the factors most used in soil erosion studies today, so they were chosen to form the evaluation criteria for soil erosion. All the evaluation factors are shown in Figure 2.
2.2.2. Classification of Sensitivity Levels for Each Factor
When conducting ecological sensitivity evaluation, the single factor of ecological sensitivity needs to be standardized. In accordance with the sensitivity classification standard in ITREFZ, combined with relevant domestic and international studies, in this study, we divided the sensitivity levels of each evaluation index into five grades: insensitive, slightly sensitive, moderately sensitive, highly sensitive, and extremely sensitive. For quantification, they were assigned scores of 1, 3, 5, 7, and 9. The grading standards of the ecological sensitivity of each factor are shown in Table 2.
2.3. Determination of Factor Weights
Analytic hierarchy process (AHP) is one of the most common methods used to determine the weight of each factor in the study of ecological sensitivity. It is a process of modeling and quantifying the decision-making thinking process of decision-makers on complex systems. Using this method, a complex problem can be decomposed into several levels and many factors, and a simple importance comparison among the factors can obtain the weight of the importance degree of different schemes/indicators, providing a basis for decision-making choices [39]. This method mainly includes the following steps:
- (1)
- Define the objectives of the analysis, identify the various factors related to the objectives of the analysis and the correlation between the various factors, then establish a hierarchical structure model.
- (2)
- Construct a judgment matrix and invite relevant experts to score each of the two factors according to their relative importance.
- (3)
- Calculate the weights and maximum eigenvalue of each indicator using the sum-product method.
- (4)
- Conduct a consistency test. If the consistency ratio CR < 0.10, it means that the judgment matrix passes the consistency test and the weights determined above are valid.
In this study, a hierarchy of indicators was constructed, and expert opinions were introduced into the hierarchical analysis method to compare the importance of eleven indicators from three aspects: natural environment, human disturbance, and soil erosion. With the help of YAAHP software [40], the calculation is realized and the consistency test is carried out. Finally, the weight results of each factor are obtained (Table 3).
Among them are the target layer CR0 = 0.05, the natural environment criterion layer CR1 = 0.03, the human disturbance criterion layer CR2 = 0.01, and the soil erosion criterion layer CR3 = 0.03. All consistency ratios are less than 0.10 and the judgment matrix is in good agreement.
2.4. Comprehensive Evaluation of Ecological Sensitivity
For ecological sensitivity evaluation based on multiple index factors, multi-factor weighted superposition is the most commonly used method [32]. With the support of ArcGIS 10.5 software, it can obtain a comprehensive evaluation value of the ecological sensitivity of the study area. The larger the value, the higher the degree of regional ecological sensitivity.
The composite index of ecological sensitivity is calculated by this formula:
In Formula (1), S refers to the comprehensive evaluation index of ecological sensitivity, n is the number of ecological sensitivity evaluation factors, Ci refers to the ecological environment sensitivity grade value of a single factor, and Wi is the weight of each ecological sensitivity factor. To better analyze the data, 2, 4, 6, and 8 were taken as thresholds, and the calculated comprehensive ecological sensitivity evaluation index was divided into five levels, namely: insensitive, slightly sensitive, moderately sensitive, highly sensitive, and extremely sensitive.
3. Results
3.1. Single Factor Analysis
3.1.1. Natural Environmental Factors
- (1)
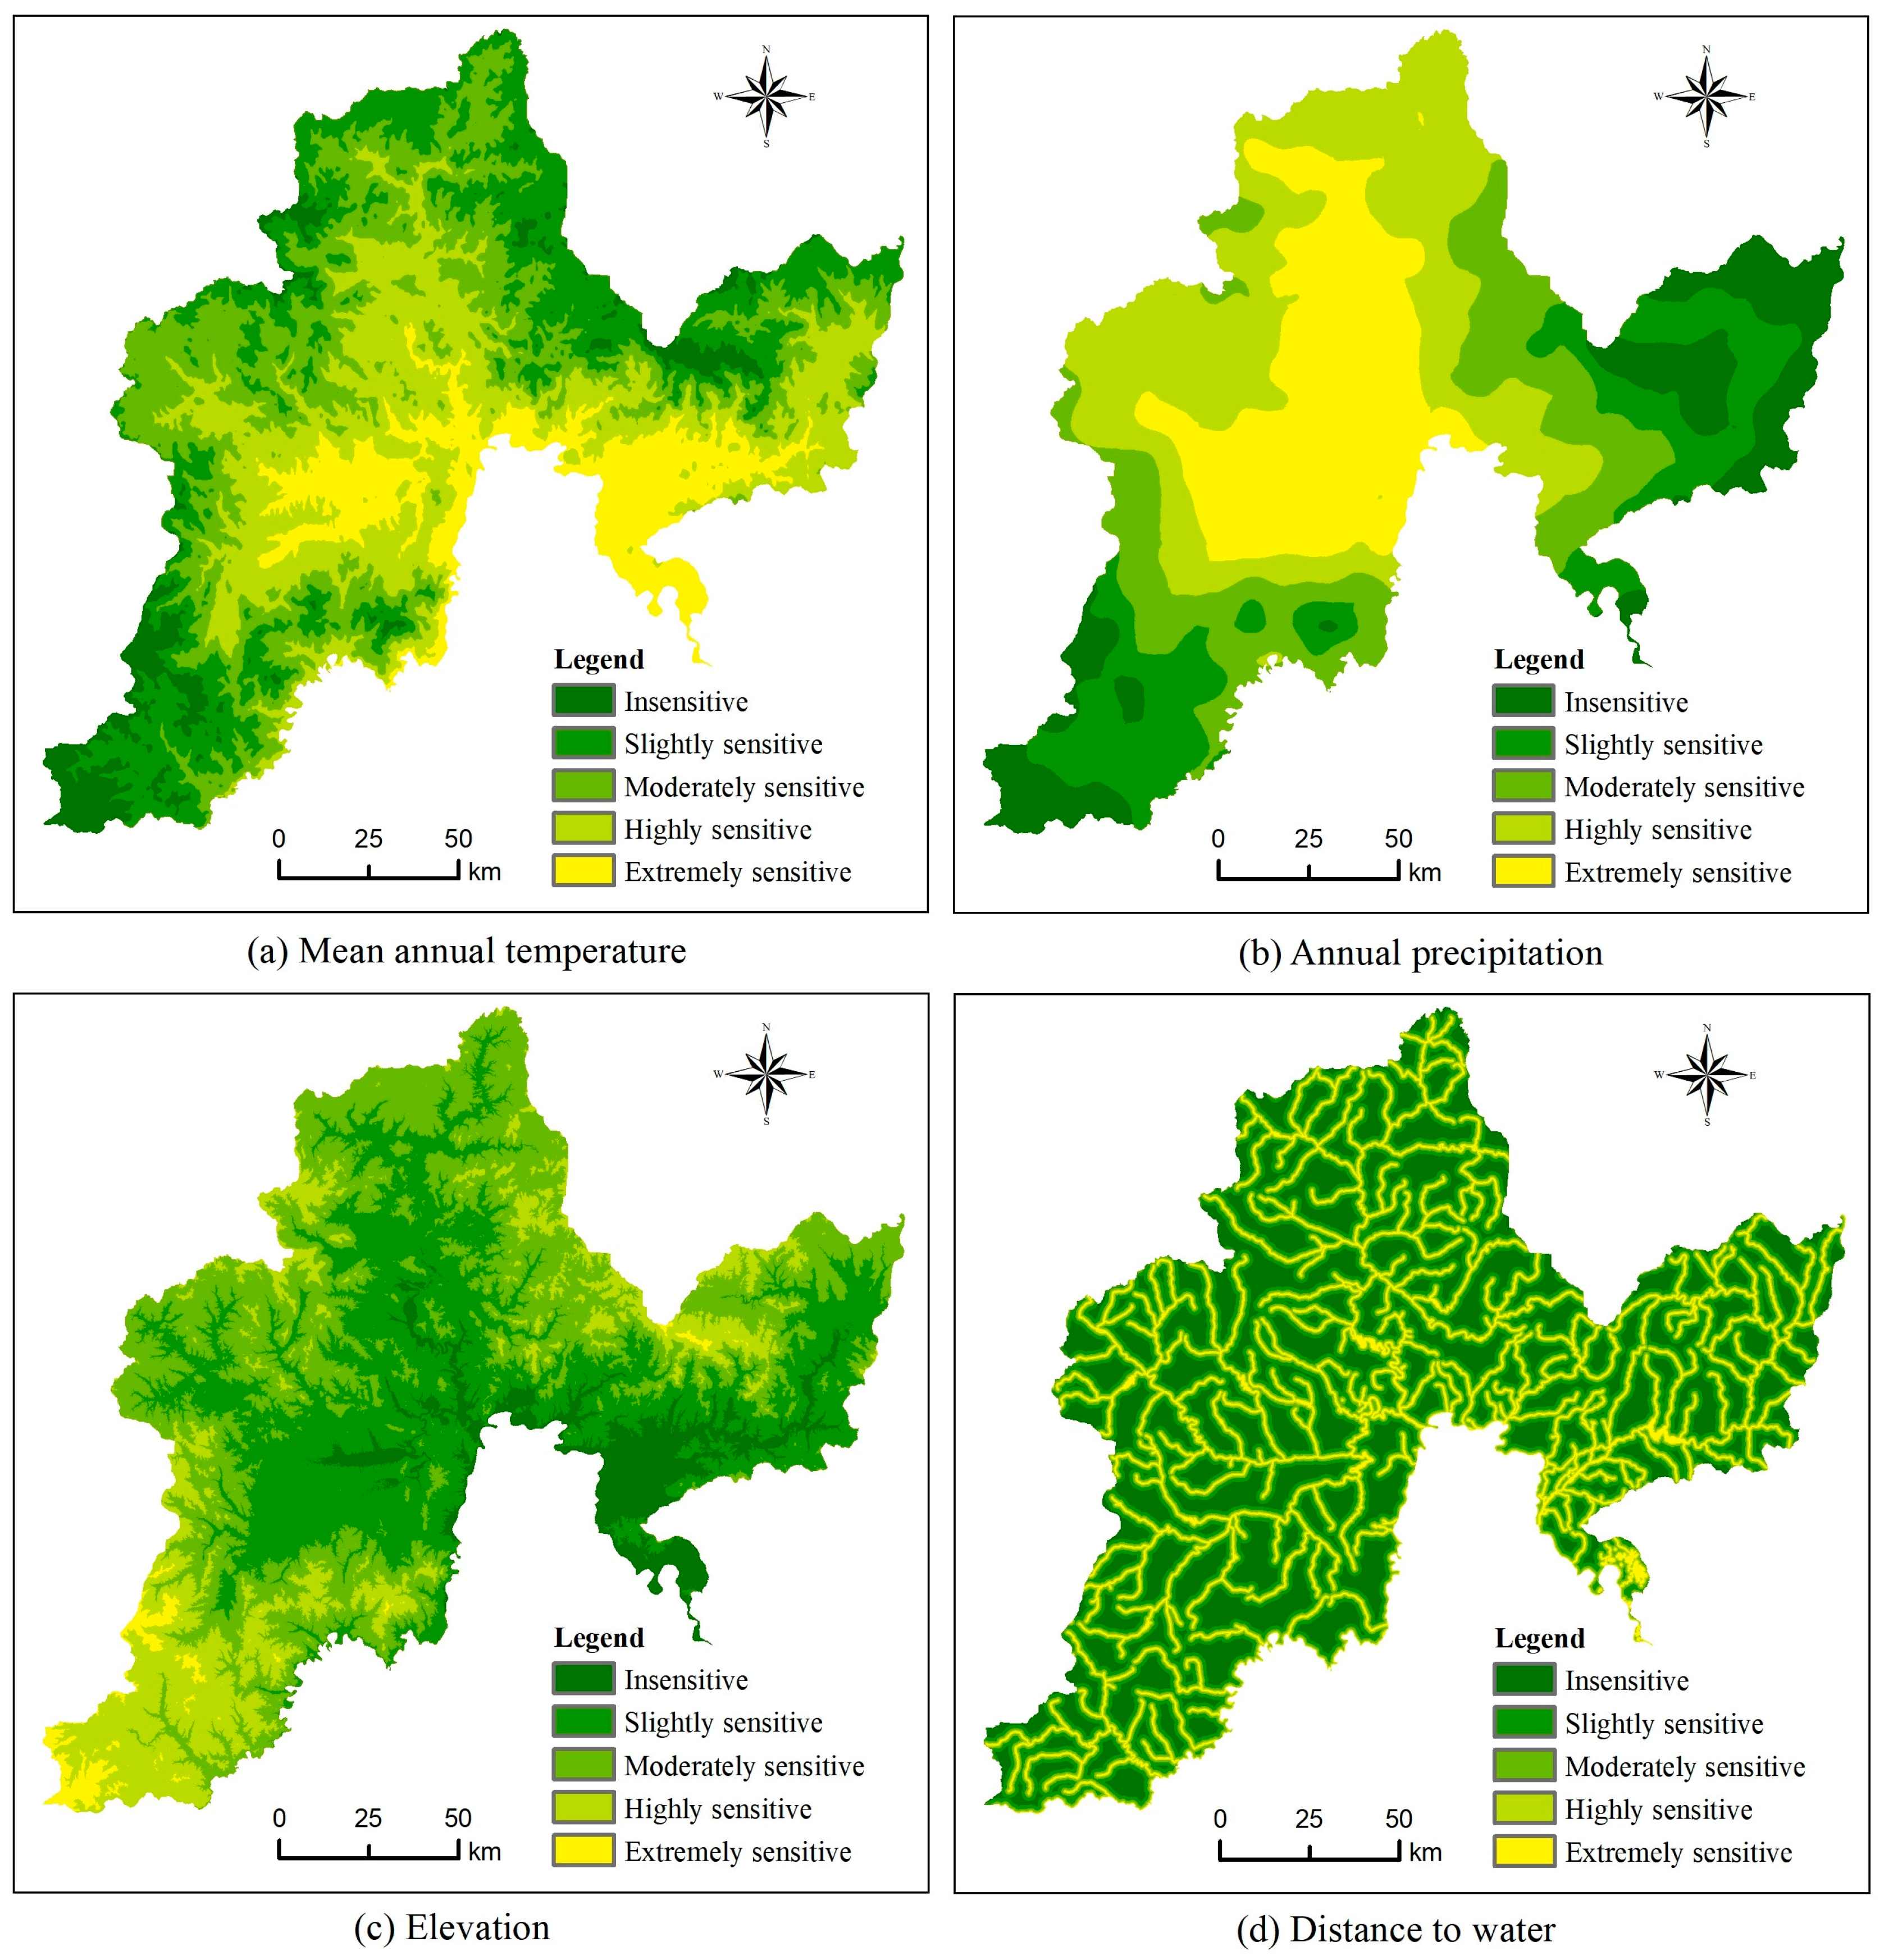
- Mean annual temperature. The mean annual temperature in the Tumen River Basin ranges from −0.9 °C to 6.7 °C, and the spatial difference is not very large. Based on the actual situation in the study area, the natural breakpoint method was used to classify the mean annual temperature sensitivity into five levels (Table 2), and the results and statistics are presented in Figure 3a and Table 4. It can be seen that the sensitivity is higher in the central and eastern parts of the Tumen River Basin, and it decreases in the west, north, and south. In general, the slightly sensitive, moderately sensitive, and highly sensitive areas are more or less evenly distributed, with a lower proportion of insensitive and extremely sensitive areas.
- (2)
- Annual precipitation. The result of the annual precipitation sensitivity classification of the Tumen River Basin is shown in Figure 3b. The central region of the basin is extremely sensitive, while the sensitivity of other regions gradually decreases from the center to the periphery. The area proportion of highly sensitive areas is the highest, followed by extremely sensitive areas, and the area proportion of moderately sensitive areas, slightly sensitive areas, and insensitive areas gradually decreases.
- (3)
- Elevation. The Tumen River Basin is located in the Changbai Mountain Range, with elevations ranging from 8 m to 1689 m. The elevation varies greatly and the topography is undulating. As shown in Figure 3c, the sensitivity is higher in the higher elevation areas in the south and north, and lower in the central and eastern river valley plains. The area of slightly sensitive areas and moderately sensitive areas account for a relatively large proportion of the study area, while insensitive areas and highly sensitive areas account for a relatively small proportion, and only 1.66% of region are extremely sensitive areas.
- (4)
- Distance to water. Water bodies, such as rivers, lakes, and reservoirs, play an important role in maintaining the regional ecological balance. In this study, the ecological sensitivity levels were classified according to the distance from water (Table 2), and the results are shown in Figure 3d. The ecological sensitivity in the study area is closely related to the distribution of the Tumen River main stream, tributaries at all levels, lakes, reservoirs, and other water bodies. The proportion of the area of insensitive and slightly sensitive areas is relatively large, totaling 60.67%. The proportion of moderately sensitive and highly sensitive areas is relatively low, and the area of extremely sensitive areas is 1942.47 km2, which is the smallest proportion of the area.
3.1.2. Human Disturbance Factors
- (1)
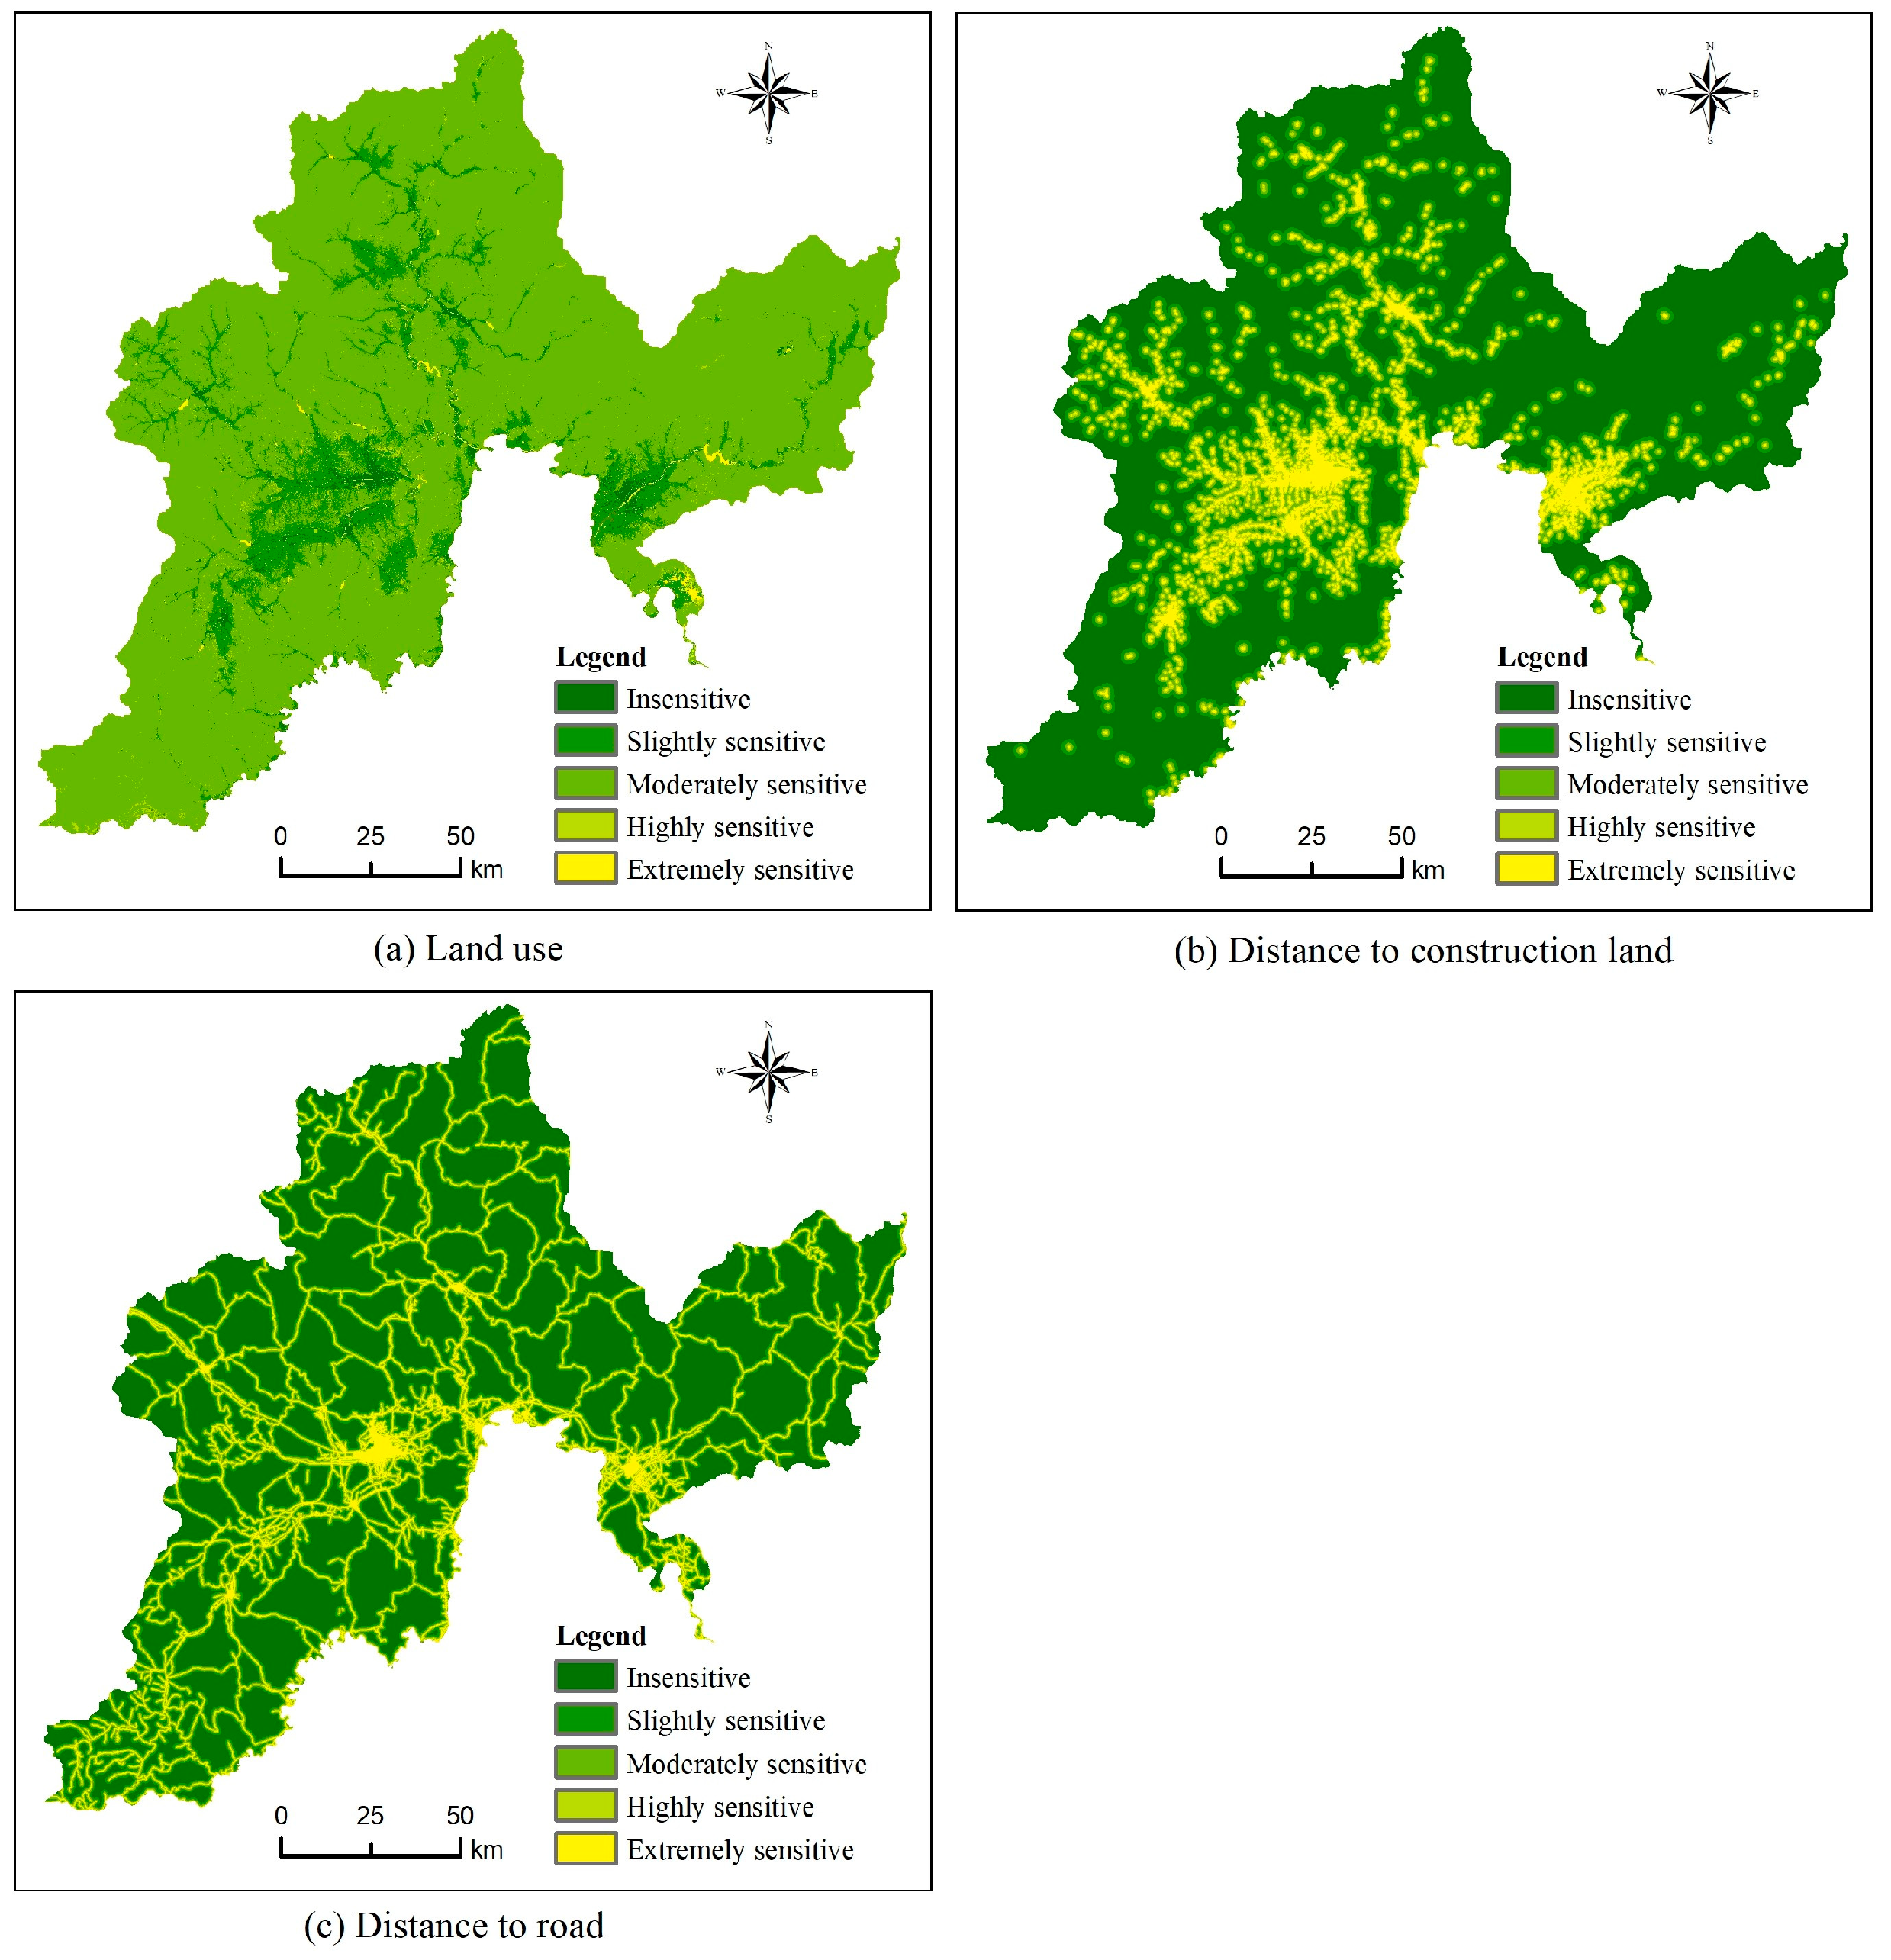
- Land use types. Different land use patterns make for different land cover, and differences exist in their regional ecological service functions and response to human activity disturbances. Among the various types of land use in the Tumen River Basin, the woodland is absolutely dominant, followed by cultivated land, with a relatively low proportion of construction land, grassland, and other land areas. According to the principles of classifying the sensitivity levels of land use type factors (Table 2), the result of the ecological sensitivity levels in the study area is shown in Figure 4a and Table 5. The moderately sensitive area corresponding to the woodland accounts for 84.39% of the total area, covering most of the study area, with a clear dominance. In second place is the slightly sensitive area corresponding to cultivated land distributed in the valley plains and nearby areas with low slopes, accounting for 11.38%. The least abundant area is the extremely sensitive area, with only 0.46%, where the main types of land are water or wetland.
- (2)
- Distance to construction land. In general, the smaller the distance to construction land, the more frequent the human activities and the stronger the disturbance to the ecosystem (Table 2). Construction land in the Tumen River Basin is concentrated in the urban and township areas of the major cities in the study area, such as Yanji, Longjing, Tumen, and Wangqing, as well as in scattered rural settlements and industrial and mining sites. Therefore, the level of ecological sensitivity gradually decreases in these areas (Figure 4b). More than half of them are insensitive areas (57.07%). With the increase in sensitivity, the proportion of each sensitive area decreases (Table 5).
- (3)
- Distance to road: Similar to the impact of construction land on ecological disturbance in the nearby area, the closer to the road, the higher the ecological sensitivity. The results are shown in Figure 4c and Table 5, based on the principle of classifying ecological sensitivity according to the distance to the road (Table 2). It is obvious that the ecological sensitivity gradually decreases with the increase in distance from the center of all kinds of roads in the study area to both sides. The areas with a clear dominance of area remain insensitive areas. The proportion of slightly sensitive, moderately sensitive, and highly sensitive areas gradually decreases, with the least extremely sensitive area accounting for only 6.88%.
3.1.3. Soil Erosion Factors
- (1)
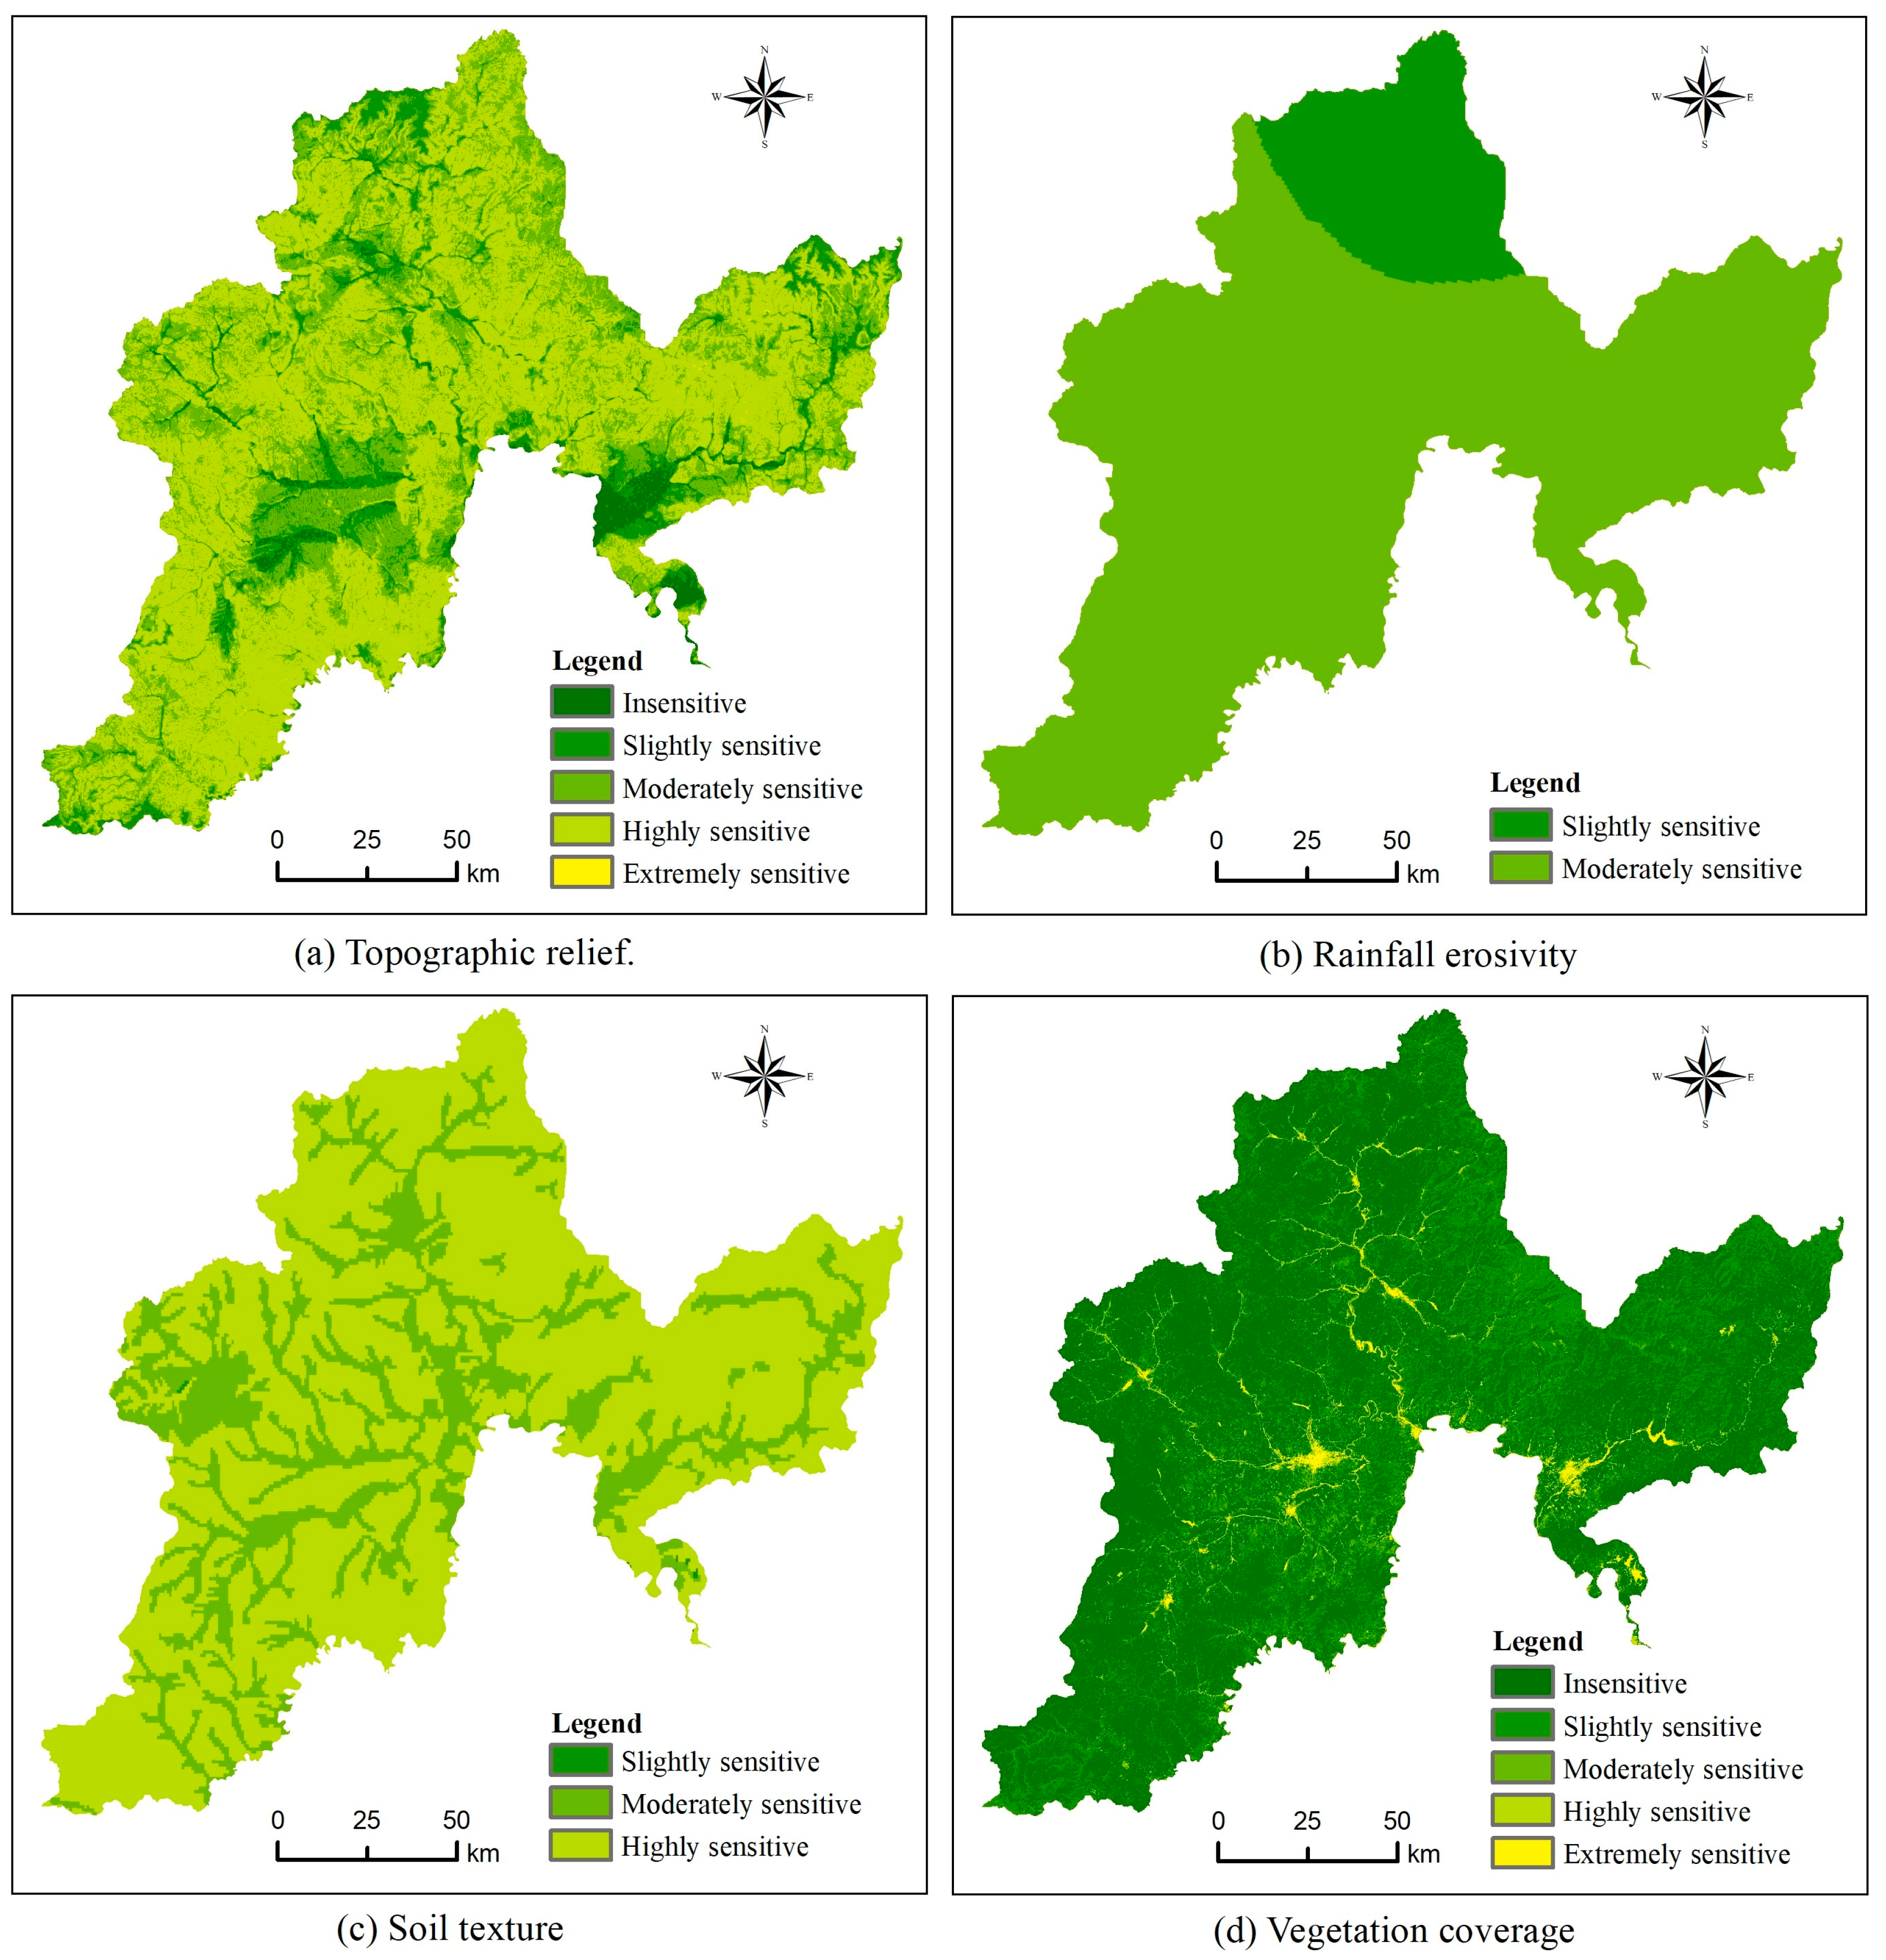
- Topographic relief. Topographic relief is an important topographic and geomorphic feature factor, which is closely related to soil erosion and ecological sensitivity. In general, the greater the relief, the higher the degree of ecological sensitivity. The Tumen River Basin is mostly mountainous and most of the areas have a large topographic relief and a high overall sensitivity. According to the results of the analysis (Figure 5a and Table 6), the study area has the largest area of highly sensitive areas, accounting for 54.87%. This is followed by moderately sensitive areas (32.01%). Slightly sensitive areas and insensitive areas account for a relatively small proportion and are mainly located in the river valley plain area. Extremely sensitive areas cover only 0.44% of the study area and are scattered throughout the areas where elevation changes are dramatic.
- (2)
- Rainfall erosivity. The differences in rainfall erosivity in the Tumen River Basin are not particularly significant. Based on the results of the analysis, there are only two areas in the study area that are slightly and moderately sensitive (Figure 5b). Most of these areas are moderately sensitive (86.29%). A small number of slightly sensitive areas (13.71%) are mainly located in the mountainous areas in the northern part of the study area.
- (3)
- Soil texture. The soil texture of the Tumen River Basin is dominated by clay loam and sandy loam, followed by loam and a very small amount of clay. The result of the ecological sensitivity classification of soil texture is shown in Figure 5c. Most of the study area is highly sensitive (73.94%); moderately sensitive areas are mainly located in river valleys, with an area of 26.01%; a very few slightly sensitive areas (0.06%) are mainly located near wetlands. There are no extremely sensitive areas or insensitive areas in the study area.
- (4)
- Vegetation coverage. Vegetation cover is an important factor influencing the ecological sensitivity of the region [41]. The Tumen River Basin has high forest coverage and an overall good level of ecological sensitivity (Figure 5d). Among the various levels of ecological sensitivity, the proportion of insensitive areas and mildly sensitive areas are relatively large, 70.83% and 23.95%, respectively, mainly woodland and grassland, cultivated land, and so on. The other three types of regions account for a relatively small proportion, with a total proportion of only 5.22%. The moderately sensitive and highly sensitive areas are located in scattered areas around the cities and towns. Extremely sensitive areas, with very low vegetation coverage, are located in urban construction land and areas such as rivers, lakes, and reservoirs.
3.2. Comprehensive Analysis
3.2.1. Spatial Pattern Analysis of Ecological Sensitivity
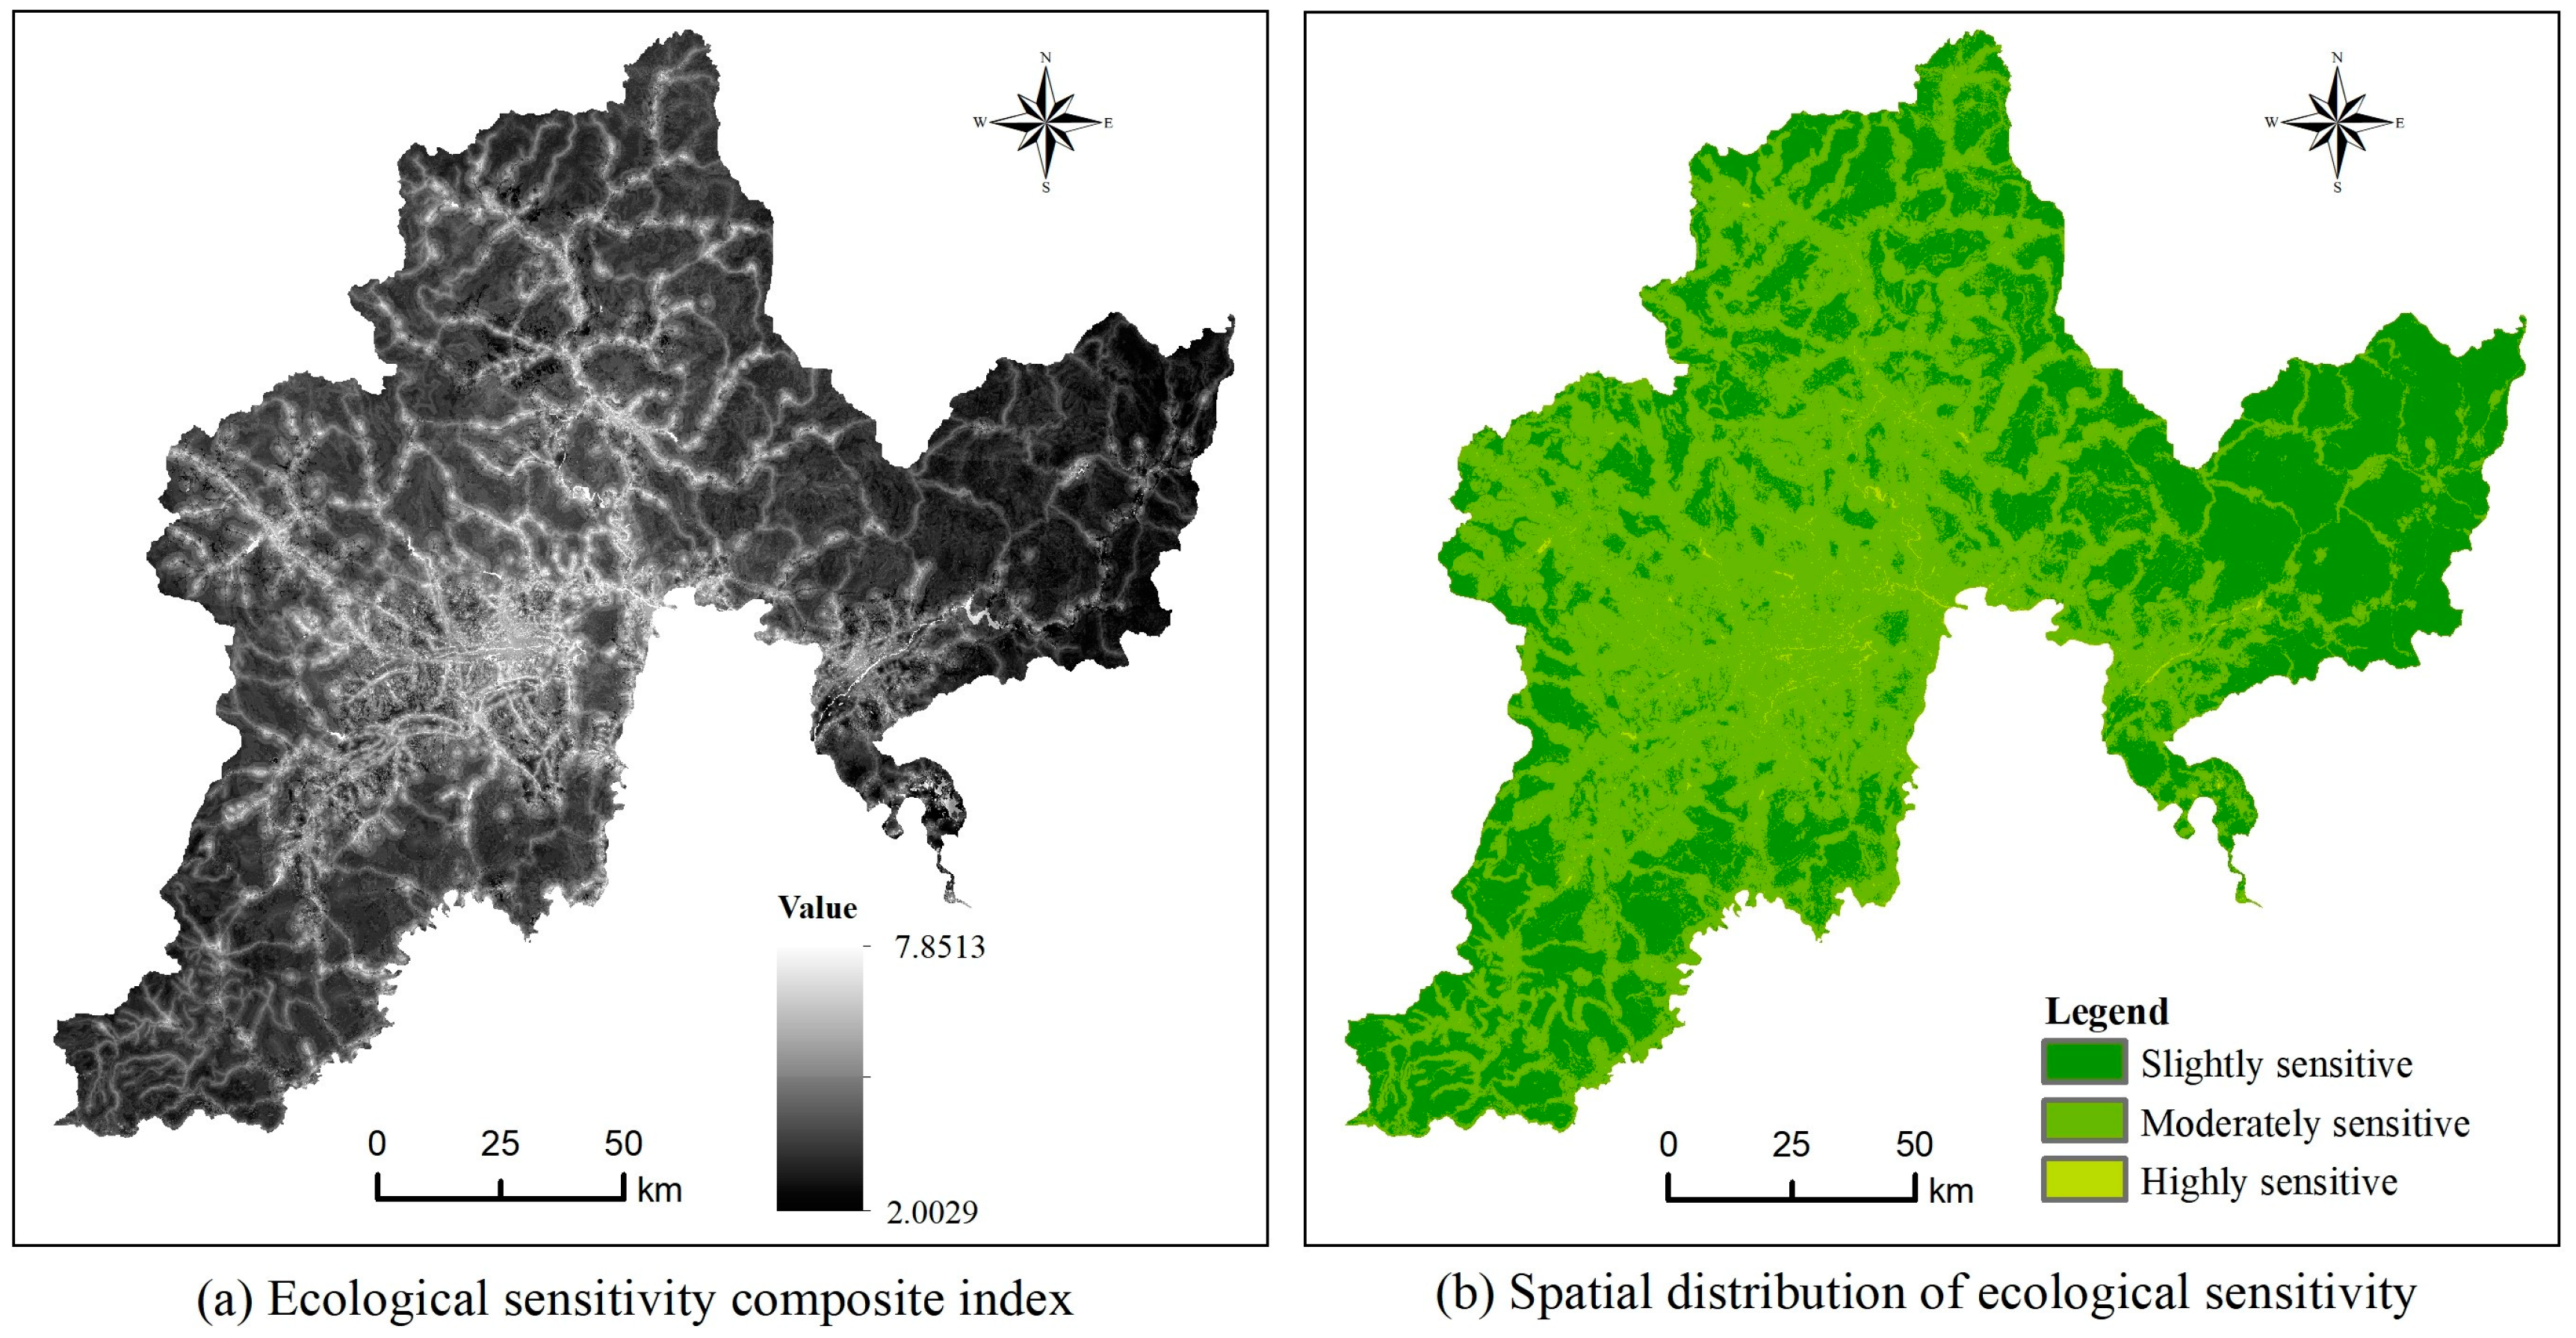
Based on the results of the above single-factor analysis and the weights of each factor, supported by ArcGIS 10.5 software, the above factors were calculated using the formula (1), and the comprehensive evaluation results map of ecological sensitivity in Tumen River Basin was obtained (as shown in Figure 6a). Then, with 2, 4, 6, and 8 as thresholds, the classification was carried out to obtain the final comprehensive classification results and statistical results of ecological sensitivity, as shown in Figure 6b and Table 7.
From the evaluation results, we can see that there are no extremely sensitive areas or insensitive areas in the study area. (1) The smallest of the various sensitive areas is the highly sensitive area, with a total area of 133.86 km2, accounting for 0.59% of the total area, which is mainly concentrated in the lakes, rivers, reservoirs, and other areas within the study area. These areas have a high sensitivity level in several important factor layers, such as land use type (factor weight ranked first), vegetation coverage (factor weight ranked third), and elevation (factor weight ranked fourth), and thus the sensitivity level is also high after the comprehensive evaluation. For this area, attention should be paid to protecting nearby vegetation to conserve water, controlling sewage discharge to reduce pollution, and taking various other measures to strengthen the protection of water resources and enhance the stability of the ecosystem. (2) The moderately sensitive area is the largest, with an area of 12,281.04 km2, accounting for 54.12% of the total area. The distribution is more concentrated in the middle of the Tumen River Basin. Other areas are also widely distributed around cultivated land and construction land on both sides of the road. These areas are easily disturbed by human activities, and the degree of ecological sensitivity easily increases with the intensification of human activities. Therefore, it is necessary to strengthen environmental protection management and education to reduce the disturbance of the ecosystem by human activities. (3) Slightly sensitive areas cover an area of 10,275.79 km2, accounting for 45.29% of the total area, mainly distributed in the northern and southern mountainous areas of the study area. This area has a relatively high vegetation cover and it is far away from areas with frequent human activities, so it has better ecological stability.
3.2.2. Ecological Sensitivity Analysis of Various Land Resources
By overlaying the results of the comprehensive ecological sensitivity evaluation with the land resource types, we can obtain the ecological sensitivity evaluation results for each land resource type, as shown in Table 8 and Figure 7.
By analyzing Table 8 and Figure 7, we can obtain the following results. (1) The cultivated land is mainly moderately sensitive (nearly 3/4), followed by slightly sensitive areas (about 1/4) which are mainly located in areas far from construction land and roads. In addition, the proportion of highly sensitive areas is very small (0.24%). (2) Woodland is the dominant land type in the Tumen River Basin, accounting for 84.40% of the total basin area. The proportion of slightly sensitive and moderately sensitive woodland areas is close, with the slightly sensitive areas being more remote; the proportion of woodland in highly sensitive areas is very small (0.13%). (3) The total area of grassland is not large, and its distribution is relatively scattered, mainly in the moderately sensitive area, followed by the highly sensitive area and the slightly sensitive area. (4) The majority of the construction land is moderately sensitive (96.59%), while the proportion of lightly sensitive areas and highly sensitive areas is small. (5) The bare land is mainly distributed in the moderately sensitive areas on both sides of the river, while the slightly sensitive areas (19.91%) and highly sensitive areas (1.31%) are scattered. (6) There are no slightly sensitive areas in the water bodies, and highly sensitive areas are larger, accounting for 45.6% of the total area of highly sensitive areas in the basin (60.97 km2). (7) Wetland area is very small, most located in the downstream of the Tumen River, and all of them are moderately sensitive areas. (8) In the areas of each sensitive level, the proportion of woodland in slightly sensitive areas and moderately sensitive areas is particularly significant, and the water body is more obvious in highly sensitive areas.
4. Discussion
4.1. Analysis of Results
The results show that the total area of slightly sensitive areas and moderately sensitive areas in the Tumen River Basin account for 99.41%. This indicates that the ecological sensitivity of the study area is below average, with relatively strong ecosystem stability and ecological carrying capacity. This situation is closely related to the good ecological environment in the study area. As a part of the Changbai Mountain Forest Ecological Function Area, this region has high forest cover, and ecological protection policies and ecological management measures in recent years have played an important role in maintaining the stability of the ecosystem. Nevertheless, moderately sensitive areas (54.12%) are also widely found in the central part of the study area in and around densely populated areas and on both sides of roads and rivers where human activities are frequent. Among the three types of ecological sensitivity factors, the influence of human disturbance is significantly stronger than that of the natural environment and soil erosion. The weight of land use type and distance to construction land is the highest among all the factors in the ecological sensitivity evaluation of the study area. The highly sensitive area is dominated by water bodies, because the water body has a high score in the land use factor layer. Therefore, this result confirms the importance of land use type factors in the comprehensive evaluation of sensitivity, which is similar to some previous studies [19,42,43].
According to the results of the study, there are 9 insensitive and extremely sensitive areas out of the 11 impact factors analyzed. After the comprehensive multi-factor analysis, there are no insensitive areas and extremely sensitive areas in the study area. In related studies, some researchers use the extreme value method for comprehensive ecological sensitivity evaluation, i.e., the maximum value of sensitivity evaluation results of each factor is used as a comprehensive evaluation result [3,38,44]. This will inevitably lead to an increase in areas of higher sensitivity. In contrast, this study avoids such extreme results as “buckets effect”, and can better reflect the comprehensive influence of various factors on regional ecological sensitivity.
4.2. Limitations of Work and Future Work
For ecological sensitivity evaluation, there is no unified evaluation rule system in academia. In this paper, 11 ecological factors closely related to the natural environment, human disturbance, and soil erosion in the study area are selected as evaluation indicators, which can effectively reflect the most significant ecological and environmental problems in the study area and quickly evaluate the ecological sensitivity of the study area. Due to the limitation of data acquisition, the influence of geological disasters, environmental pollution, and other factors on the ecological environment are not included, so the ecological sensitivity evaluation factor system of the study area can still be further improved.
In addition, the classification rules of the ecological sensitivity factors (Table 2) are determined according to the actual situation of the Tumen River Basin, relevant national standards, and previous research experience, so there is necessarily an artificial and subjective element [2,7,24,38]. If the classification rules for each indicator change, the evaluation results will also vary. Therefore, the rigid classification rules of ecological sensitivity evaluation factors also need to be studied in depth.
The AHP method relies heavily on the subjective decisions of experts when calculating the weights of each evaluation factor, and the number of experts or subjective experiences will affect the evaluation results. Therefore, in further research, we can combine the AHP method with objective assignment methods, such as the variation coefficient method and the entropy method, to weaken the influence of subjectivity and make the evaluation results more scientific.
5. Conclusions
Targeted at the lack of ecological sensitivity assessment work in the Tumen River Basin in China, we selected 3 types of 11 factors closely related to the ecological sensitivity of China’s Tumen River Basin, established an ecological sensitivity evaluation factor system, and used GIS technology combined with the AHP model to evaluate the ecological sensitivity of China’s Tumen River Basin. Finally, we obtained the ecological sensitivity evaluation results of the Tumen River Basin and analyzed its spatial pattern. Here, we present the main conclusions of the research.
The comprehensive ecological sensitivity levels of the Tumen River Basin include highly sensitive, moderately sensitive, and slightly sensitive areas, while there are no extremely sensitive or insensitive areas. The proportion of highly sensitive areas is very small, and their distribution scope is mainly concentrated in lakes, rivers, reservoirs, and other areas in the study area. The moderately sensitive area is the largest, accounting for 54.12% of the total area, and its distribution is concentrated in the middle of the Tumen River Basin. The slightly sensitive area is mainly distributed in the northern and southern mountainous areas of the study area.
Among the various land resource types, cultivated land is dominated by moderately sensitive areas, woodland has a close proportion of slightly and moderately sensitive areas, grassland has 82.07% of moderately sensitive areas, construction land is extremely concentrated in moderately sensitive areas, and bare land has 78.78% of moderately sensitive areas, while water bodies are mostly distributed in highly sensitive areas, and the wetlands are all moderately sensitive.
As the scope of human activities in the Tumen River Basin continues to expand and the intensity of development continues to increase, the threats to the ecological environment will intensify. For highly sensitive areas, we suggest that development should be strictly controlled, while ecological risk assessment should be performed and ecological risk monitoring and prevention efforts should be strengthened. The moderately sensitive areas and the slightly sensitive areas, with a certain resistance to disturbance and with ecological self-healing functions, can be developed appropriately, but attention should be paid to reasonable protection, and development should be carried out under the guidance of ecological protection.
Author Contributions
Formal analysis, visualization, and writing—original draft, H.F.; methodology, X.Z.; Investigation, writing—review and editing, Y.N.; software, D.Z.; supervision, Y.S. All authors have read and agreed to the published version of the manuscript.
Funding
This research was funded by the National Natural Science Foundation of China (Grant No. 42067065), the National Natural Science Foundation of China (Grant No. 42271314), and the Jilin Science and Technology Development Program (Grant No. 20210203138SF).
Institutional Review Board Statement
Not applicable.
Informed Consent Statement
Not applicable.
Data Availability Statement
Data are available from the corresponding author upon reasonable request.
Conflicts of Interest
The authors declare no conflict of interest.
References
- Wang, K.; Tian, G.X.; Cui, L. Ecological Sensitivity Analysis in Tongshan Scenic Spot Based on RS and GIS. J. Northwest For. Univ. 2009, 24, 200–203, 228. (In Chinese) [Google Scholar]
- Zhou, Y.L.; Yang, Y.F.; Yuan, W.Y. Analysis and Evaluation on Ecological Sensitivity of Xiaoqinghe River Basin in Jinan Based on GIS. J. Northwest For. Univ. 2016, 31, 50–56, 62. (In Chinese) [Google Scholar]
- Pan, F.; Tian, C.; Shao, F.; Zhou, W.; Chen, F. Evaluation of Ecological Sensitivity in Karamay, Xinjiang, Northwest China. Acta Geogr. Sin. 2011, 66, 1497–1507. (In Chinese) [Google Scholar]
- Duan, X.J.; Zou, H.; Wang, L.; Chen, W.X.; Min, M. Assessing ecological sensitivity and economic potentials and regulation zoning of the riverfront development along the Yangtze River. China J. Clean. Prod. 2021, 291, 125963. [Google Scholar] [CrossRef]
- Yu, J.; Li, F.T.; Wang, Y.; Lin, Y.; Peng, Z.W.; Cheng, K. Spatiotemporal evolution of tropical forest degradation and its impact on ecological sensitivity: A case study in Jinghong, Xishuangbanna. China Sci. Total Environ. 2020, 727, 138678. [Google Scholar] [CrossRef]
- Bai, Y.J.; Guo, R. The construction of green infrastructure network in the perspectives of ecosystem services and ecological sensitivity: The case of Harbin, China. Glob. Ecol. Conserv. 2021, 27, 01534. [Google Scholar] [CrossRef]
- You, N.S.; Meng, J.J. Ecological Functions Regionalization and Ecosystem Management Based on the Ecological Sensitivity and Ecosystem Service in the Middle Reaches of the Heihe River. J. Desert Res. 2017, 37, 186–197. (In Chinese) [Google Scholar]
- Ding, Z.M.; Yao, S.B. Theoretical analysis and model design of search for ecological conservation redlines based on the sensitivity assessment of ecosystem services. Land Use Policy 2020, 97, 104745. [Google Scholar] [CrossRef]
- Guo, N.D.; Chen, Z.Y.; Li, H.Z. Ecological Sensitivity Research and Their Grey Forecast Based on Land Use Change in Pingshan County, Hebei Province. Res. Soil Water Conserv. 2016, 23, 229–234. (In Chinese) [Google Scholar]
- LI, S.C.; Wu, S.H.; Dai, E.F. Assessing the fragility of ecosystem using artificial neural network model. Acta Geogr. Sin. 2005, 25, 621–626. (In Chinese) [Google Scholar]
- Qiu, H.J.; Cao, M.M.; Liu, W.; Wang, Y.; Hao, J.; Hu, S. The Susceptibility Assessment of Landslide and Its Calibration of the Models Based on Three Different Models. Sci. Geogr. Sin. 2014, 34, 110–115. (In Chinese) [Google Scholar]
- Leman, N.; Ramli, M.F.; Khirotdin, R.P.K. GIS-based integrated evaluation of environmentally sensitive areas (ESAs) for land use planning in Langkawi, Malaysia. Ecol. Indic. 2016, 61, 293–308. [Google Scholar] [CrossRef]
- Xu, Y.; Liu, R.; Xue, C.B.; Xia, Z.H. Ecological Sensitivity Evaluation and Explanatory Power Analysis of the Giant Panda National Park in China. Ecol. Indic. 2023, 146, 109792. [Google Scholar] [CrossRef]
- Ma, Y.J.; Huang, X.J.; Xu, M.M.; Zhong, T.Y.; Du, W.X. Sensitivity Analysis of Ecosystem Service Value to Coastal Tideland Development in Jiangsu Province. China Land Sci. 2006, 20, 28–34. (In Chinese) [Google Scholar]
- Chinese Research Academy of Environmental Sciences; University of Science and Technology Beijing; University of Chinese Academy of Sciences; Institute of Geographical Sciences and Natural Resources; CAS. Interim Technical Regulations For Ecological Function Zoning [EB/OL]. 2014. Available online: https://www.mee.gov.cn/gkml/hbb/bgth/201405/t20140521_275396.htm (accessed on 18 October 2022).
- Ministry of Natural Resources of the People’s Republic of China. Technical Guidelines for the Evaluation of Resource and Environmental Carrying Capacity & Land Space Development Suitability (Trial) [EB/OL]. 2020. Available online: http://gi.mnr.gov.cn/202001/t20200121_2498502.html (accessed on 18 October 2022).
- Zhang, R.; Liu, X.; Heathman, G.C.; Yao, X.; Hu, X.; Zhang, G. Assessment of soil erosion sensitivity and analysis of sensitivity factors in the Tongbai-Dabie mountainous area of China. Catena 2013, 101, 92–98. [Google Scholar] [CrossRef]
- Xu, D.Y.; You, X.G.; Xia, C.L. Assessing the spatial-temporal pattern and evolution of areas sensitive to land desertification in North China. Ecol. Indic. 2019, 97, 150–158. [Google Scholar] [CrossRef]
- Zhang, T.Y.; Wang, L.; Han, Y.; Zhang, M. Sensitivity Evaluation of Soil Salinization in Manasi River Basin Based on GIS and RS. Soils 2017, 49, 812–818. (In Chinese) [Google Scholar]
- Yan, L.H.; Zhou, Z.F.; Xie, Y.T.; Huang, D. Analysis on spatial correlation between sensitivity of rocky desertification and macroscopic geomorphology in Guizhou Plateau. Carsol. Sin. 2018, 37, 400–407. (In Chinese) [Google Scholar]
- Du, Y.Y.; Hu, Y.N.; Yang, Y.; Peng, J. Building ecological security patterns in southwestern mountainous areas based on ecological importance and ecological sensitivity:A case study of Dali Bai Autonomous Prefecture, Yunnan Province. Acta Ecol. Sin. 2017, 37, 8241–8253. (In Chinese) [Google Scholar]
- Huang, J.; Cui, S.G.; Li, F.Y.; Qiu, Q.Y.; Ma, K.M. Ecological sensitivity of Xiamen City to land use changes. Acta Ecol. Sin. 2011, 31, 7441–7449. (In Chinese) [Google Scholar]
- Chi, Y.; Zhang, Z.W.; Gao, J.H.; Xie, Z.L.; Zhao, M.W.; Wang, E.K. Evaluating landscape ecological sensitivity of an estuarine island based on landscape pattern across temporal and spatial scales. Ecol. Indic. 2019, 101, 221–237. [Google Scholar] [CrossRef]
- Duan, Y.Q.; Zhang, L.D.; Fan, X.Y.; Hou, Q.H.; Hou, X.M. Smart city oriented Ecological Sensitivity Assessment and Service Value Computing based on Intelligent sensing data processing. Comput. Commun. 2020, 160, 263–273. [Google Scholar] [CrossRef]
- Shi, Y.S.; Li, J.Q.; Xie, M.Q. Evaluation of the ecological sensitivity and security of tidal flats in Shanghai. Ecol. Indic. 2018, 85, 729–741. [Google Scholar] [CrossRef]
- Zhang, M.W.; Jin, H.J.; Cai, D.S.; Jiang, C.B. The comparative study on the ecological sensitivity analysis in Huixian karst wetland, China. Procedia Environ. Sci. 2010, 2, 386–398. [Google Scholar]
- Wang, X.M.; Bian, Z.F. The Implications of Ecological Sensitivity on Exploitation of Unutilized Land: A Case Study in Ji’Nan City, China. Procedia Environ. Sci. 2011, 10, 275–281. [Google Scholar] [CrossRef] [Green Version]
- Xu, L.L.; Yan, H.; Qian, S. Spatio-temporal change of land desertification sensitivity in Northern China from 2000 to 2018 based on MODIS-NDVI. J. Nat. Resour. 2020, 35, 925–936. (In Chinese) [Google Scholar]
- Wei, W.; Zhou, T.; Guo, Z.C.; Li, Z.Y.; Zhang, X.Y. Spatiotemporal evolution of land ecological sensitivity in arid inland river basin based on remote sensing index: A case of Wuwei City in Shiyang River Basin. Chin. J. Ecol. 2020, 39, 3068–3079. (In Chinese) [Google Scholar]
- Kosmas, C.; Kirkby, M.; Geeson, N. Manual on key indicators of desertification and mapping environmentally sensitive areas to desertification. European Commission. In European Commission, Energy, Environment and Sustainable Development, EUR 18882; European Commission: Bruxelles, Belgium, 1999; Volume 87. [Google Scholar]
- Prăvălie, R.; Patriche, C.; Tişcovschi, A.; Dumitraşcu, M.; Săvulescu, I.; Sîrodoev, I.; Bandoc, G. Recent spatio-temporal changes of land sensitivity to degradation in Romania due to climate change and human activities: An approach based on multiple environmental quality indicators. Ecol. Indic. 2020, 118, 106755. [Google Scholar] [CrossRef]
- Lee, E.J.; Piao, D.; Song, C.; Kim, J.; Lim, C.H.; Kim, E.; Moon, J.; Kafatos, M.; Lamchin, M.; Jeon, S.W.; et al. Assessing environmentally sensitive land to desertification using MEDALUS method in Mongolia. For. Sci. Technol. 2019, 15, 210–220. [Google Scholar] [CrossRef] [Green Version]
- Karamesouti, M.; Panagos, P.; Kosmas, C. Model-based spatio-temporal analysis of land desertification risk in Greece. Catena 2018, 167, 266–275. [Google Scholar] [CrossRef]
- Roué-Legall, A.; Lucotte, M.; Carreau, J.; Canuel, R.; Garcia, E. Development of an ecosystem sensitivity model regarding mercury levels in fish using a preference modeling methodology: Application to the Canadian boreal system. Environ. Sci. Technol. 2005, 39, 9412–9423. [Google Scholar] [CrossRef]
- John, F.; Kurt, J.J. Assessing uncertainty in ecological systems using global sensitivity analyses: A case example of simulated wolf reintroduction effects on elk. Ecol. Model. 2005, 187, 259–280. [Google Scholar]
- Rossi, P.; Pecci, A.; Amadio, V.; Rossi, O.; Soliani, L. Coupling indicators of ecological value and ecological sensitivity with indicators of demographic pressure in the demarcation of new areas to be protected: The case of the Oltrepò Pavese and the Ligurian-Emilian Apennine area (Italy). Landsc. Urban Plan. 2008, 85, 12–26. [Google Scholar] [CrossRef]
- Janusz, A.; Robert, D. Analysis of the sensitivity of the ecological effects for the investment based on the thermal insulation of the building: A Polish case study. J. Clean. Prod. 2017, 162, 856–864. [Google Scholar]
- Wei, C.J.; Meng, J.J. Ecological sensitivity assessment and spatial pattern analysis of land resources in China. Acta Sci. Nat. Univ. Pekin. 2022, 58, 157–168. [Google Scholar]
- Saaty, T.L. The Analytic Hierarchy Process; Mc Graw-Hill Company: Landon, UK, 1980. [Google Scholar]
- Chen, X.C.; Li, F.; Li, X.Q. Mapping ecological space quality changes for ecological management: A case study in the Pearl River Delta urban agglomeration, China. J. Environ. Manag. 2020, 267, 110658. [Google Scholar] [CrossRef]
- Li, J.Y. Responses of Vegetation NDVI to Climate Change and Land Use in Ordos City, North China. Appl. Sci 2022, 12, 7288. [Google Scholar] [CrossRef]
- Shi, N.N.; Quan, Z.J.; Han, Y.; Wang, Q.; Xiao, N.; Gao, X. Analysis of Land Resources Carrying Capacity in Wuhai City Based on Ecological Sensitivity. Res. Soil Water Conserv. 2017, 24, 239–243. (In Chinese) [Google Scholar]
- Yi, D.; Zhao, X.M.; Guo, X.; Zhao, L.H.; Zhang, H.; Han, Y.; Roshan, S.; Luo, Z.J. Delimitation of urban development boundary based on ecological sensitivity evaluation and CA-Markov simulation in plain city: A case of Nanchang, Jiangxi, China. Chin. J. Appl. Ecol. 2020, 31, 208–218. (In Chinese) [Google Scholar]
- Li, Y.J. Evaluation of Eco-environmental Sensitivity of National Ecological Function Area of Dushan County in Guizhou Province. J. Northwest For. Univ. 2017, 37, 66–73. (In Chinese) [Google Scholar]
Figure 1.
Maps of Tumen River Basin, China.

Figure 2.
Maps of the evaluation factors.

Figure 3.
Distribution of ecological sensitivity of the natural environment.

Figure 4.
Distribution of ecological sensitivity of human disturbance.

Figure 5.
Distribution of ecological sensitivity of soil erosion.

Figure 6.
Distribution of ecological sensitivity.

Figure 7.
Distribution of ecological sensitivity of various land resource types.


Table 1.
Data sources and description.
| Data Content | Type | Source | Resolution/Scale | Purpose |
|---|---|---|---|---|
| Temperatures | Raster image | WorldClim (www.worldclim.org, accessed on 12 September 2022) | 1 km | Produce a multi-year average temperature factor |
| Precipitation | Raster image | WorldClim (www.worldclim.org, accessed on 13 September 2022) | 1 km | Produce a multi-year average annual precipitation factor |
| Elevation | Raster image | Geospatial Data Cloud (China, gscloud.cn, accessed on 15 September 2022) | 30 m | Produce factors of elevation and topographic relief |
| Water | Vector data | National Catalogue Service For Geographic Information (China, www.webmap.cn, accessed on 8 October 2022), OSM (https://www.openstreetmap.org, accessed on 20 September 2022), | 1:1,000,000 | Produce factor of distance to water |
| Land use types | Raster image | GlobeLand30 (http://globallandcover.com/, accessed on 15 September 2022) | 30 m | Produce factor of land use, and extract construction land data to produce factor of distance to construction land |
| Roads | Vector data | National Catalogue Service For Geographic Information (China, www.webmap.cn, accessed on 8 October 2022), OSM (https://www.openstreetmap.org, accessed on 22 September 2022), | 1:1,000,000 | Produce factor of distance from roads |
| Rainfall erosivity | Raster image | Earth System Science Data (China, http://www.geodata.cn/, accessed on 14 September 2022) | 0.01° | Produce factor of rainfall erosivity |
| Soil texture | Raster image | Harmonized World Soil Database (www.fao.org/soils-portal/, accessed on 17 September 2022) | 1 km | Produce factor of soil texture |
| Lansat-OLI remote sensing data | Remote sensing image | Geospatial Data Cloud (China, gscloud.cn, accessed on 2 October 2022) | 30 m | Produce vegetation coverage factor |
Table 2.
Evaluation indicators and classification of ecological sensitivity.
| Type of Sensitivity | Sensitive Indicators | Sensitivity Classification | ||||
|---|---|---|---|---|---|---|
| Insensitive | Slightly Sensitivity | Moderately Sensitive | Highly Sensitive | Extremely Sensitive | ||
| Natural environment | Mean annual temperature (°C) | <1.68 | 1.68–2.79 | 2.79–3.84 | 3.84–4.94 | >4.94 |
| Annual precipitation (mm) | <621 | 621–652 | 652–688 | 688–721 | >721 | |
| Elevation (m) | <200 | 200–500 | 500–800 | 800–1200 | >1200 | |
| Distance to water (m) | >2000 | 1000–2000 | 500–1000 | 200–500 | <200 | |
| Human disturbance | Type of land use | Construction land, bare land | Cultivated land | Woodland | Grassland | Water, wetlands |
| Distance to construction land (m) | >2000 | 1000–2000 | 500–1000 | 200–500 | <200 | |
| Distance to road (m) | >1000 | 500–1000 | 250–500 | 100–250 | <100 | |
| Soil erosion | Topographic relief | <20 | 20–50 | 50–100 | 100–300 | >300 |
| Rainfall erosivity (MJ·mm/(hm2·h·a)) | <500 | 500–1000 | 1000–1500 | 1500–2000 | >2000 | |
| Soil texture | Sand | Clay (heavy), silty clay, clay | Loam, sandy clay | Clay loam, silt loam, sandy clay loam | Silt | |
| Vegetation coverage | >0.8 | 0.6–0.8 | 0.4–0.6 | 0.2–0.4 | <0.2 | |
| Assignment | 1 | 3 | 5 | 7 | 9 | |
According to the expert advice, we used the natural breakpoint method to classify the annual average temperature and annual average precipitation. Referring to the factor classification method in the previous research literature, and making appropriate revisions according to the data characteristics of this study area, we completed the classification of the other 9 factors [2,7,13,24,38].
Table 3.
Weigh of ecological sensitivity evaluation factors.
| Target Layer | Criterion Layer | Weights | Evaluation Indicator Layer | Weights | Weight Sort |
|---|---|---|---|---|---|
| Ecological sensitivity | Natural environment | 0.3119 | Mean annual temperature | 0.0601 | 7 |
| Annual precipitation | 0.0841 | 5 | |||
| Elevation | 0.1300 | 3 | |||
| Distance to water | 0.0377 | 9 | |||
| Human disturbance | 0.4905 | Type of land use | 0.2643 | 1 | |
| Distance to construction land | 0.1458 | 2 | |||
| Distance to road | 0.0803 | 6 | |||
| Soil erosion | 0.1976 | Topographic relief | 0.0513 | 8 | |
| Rainfall erosivity | 0.0238 | 11 | |||
| Soil texture | 0.0337 | 10 | |||
| Vegetation coverage | 0.0888 | 4 |
Table 4.
Area and proportion of ecological sensitivity classification of the natural environment.
| Sensitivity Level | Mean Annual Temperature | Annual Precipitation | Elevation | Distance to Water | ||||
|---|---|---|---|---|---|---|---|---|
| Area (km2) | Proportion (%) | Area (km2) | Proportion (%) | Area (km2) | Proportion (%) | Area (km2) | Proportion (%) | |
| Insensitive | 1389.19 | 6.12 | 2827.18 | 12.46 | 1801.31 | 7.94 | 6838.58 | 30.14 |
| Slightly sensitive | 5638.47 | 24.85 | 3804.25 | 16.77 | 8116.27 | 35.77 | 6926.50 | 30.53 |
| Moderately sensitive | 6626.97 | 29.21 | 4266.68 | 18.80 | 8624.22 | 38.01 | 4241.51 | 18.69 |
| Highly sensitive | 5974.18 | 26.33 | 6646.86 | 29.29 | 3771.33 | 16.62 | 2741.64 | 12.08 |
| Extremely sensitive | 3061.89 | 13.49 | 5145.72 | 22.68 | 377.57 | 1.66 | 1942.47 | 8.56 |
Table 5.
Area and proportion of ecological sensitivity classification of human disturbance.
| Sensitivity Level | Land Use Types | Distance to Construction Land | Distance to Road | |||
|---|---|---|---|---|---|---|
| Area (km2) | Proportion (%) | Area (km2) | Proportion (%) | Area (km2) | Proportion (%) | |
| Insensitive | 543.72 | 2.40 | 12,950.13 | 57.07 | 12,931.68 | 56.99 |
| Slightly sensitive | 2581.43 | 11.38 | 4158.72 | 18.33 | 3957.44 | 17.44 |
| Moderately sensitive | 19,148.58 | 84.39 | 2524.39 | 11.13 | 2464.58 | 10.86 |
| Highly sensitive | 313.51 | 1.38 | 1650.49 | 7.27 | 1776.04 | 7.83 |
| Extremely sensitive | 103.46 | 0.46 | 1406.97 | 6.20 | 1560.96 | 6.88 |
Table 6.
Area and proportion of ecological sensitivity classification of soil erosion.
| Sensitivity Level | Topographic Relief | Rainfall Erosivity | Soil Texture | Vegetation Coverage | ||||
|---|---|---|---|---|---|---|---|---|
| Area (km2) | Proportion (%) | Area (km2) | Proportion (%) | Area (km2) | Proportion (%) | Area (km2) | Proportion (%) | |
| Insensitive | 560.26 | 2.47 | 16,071.56 | 70.83 | ||||
| Slightly sensitive | 2408.16 | 10.61 | 3111.23 | 13.71 | 12.91 | 0.06 | 5433.58 | 23.95 |
| Moderately sensitive | 7264.04 | 32.01 | 19,579.47 | 86.29 | 5900.87 | 26.01 | 586.29 | 2.58 |
| Highly sensitive | 12,449.58 | 54.87 | 16,776.92 | 73.94 | 259.41 | 1.14 | ||
| Extremely sensitive | 8.66 | 0.04 | 339.86 | 1.50 | ||||
Table 7.
Comprehensive ecological sensitivity analysis results.
| Sensitivity Level | Area (km2) | Proportion (%) |
|---|---|---|
| Insensitive | - | - |
| Slightly sensitive | 10,275.79 | 45.29 |
| Moderately sensitive | 12,281.04 | 54.12 |
| Highly sensitive | 133.86 | 0.59 |
| Extremely sensitive | - | - |
Table 8.
Area and proportion of ecological sensitivity classification of various land resource types.
Table 8.
Area and proportion of ecological sensitivity classification of various land resource types.
| Type of Land Resource | Slightly Sensitivity | Moderately Sensitive | Highly Sensitive | Total | ||||
|---|---|---|---|---|---|---|---|---|
| Area (km2) | Proportion (%) | Area (km2) | Proportion (%) | Area (km2) | Proportion (%) | Total Area (km2) | Total Proportion (%) | |
| Cultivated land | 666.27 | 25.82 | 1908.39 | 73.95 | 6.07 | 0.24 | 2580.73 | 11.37 |
| Woodland | 9531.11 | 49.77 | 9594.22 | 50.10 | 24.59 | 0.13 | 19,149.92 | 84.40 |
| Grassland | 20.27 | 6.46 | 257.72 | 82.07 | 36.04 | 11.48 | 314.04 | 1.38 |
| Construction land | 7.06 | 2.45 | 278.32 | 96.59 | 2.76 | 0.96 | 288.15 | 1.27 |
| Bare ground | 50.91 | 19.91 | 201.42 | 78.78 | 3.35 | 1.31 | 255.69 | 1.13 |
| Water body | - | - | 38.61 | 38.77 | 60.97 | 61.23 | 99.58 | 0.44 |
| Wetland | - | - | 2.60 | 100.00 | - | - | 2.60 | 0.01 |
Disclaimer/Publisher’s Note: The statements, opinions and data contained in all publications are solely those of the individual author(s) and contributor(s) and not of MDPI and/or the editor(s). MDPI and/or the editor(s) disclaim responsibility for any injury to people or property resulting from any ideas, methods, instructions or products referred to in the content. |
© 2023 by the authors. Licensee MDPI, Basel, Switzerland. This article is an open access article distributed under the terms and conditions of the Creative Commons Attribution (CC BY) license (https://creativecommons.org/licenses/by/4.0/).
Share and Cite
MDPI and ACS Style
Feng, H.; Zhang, X.; Nan, Y.; Zhang, D.; Sun, Y. Ecological Sensitivity Assessment and Spatial Pattern Analysis of Land Resources in Tumen River Basin, China. Appl. Sci. 2023, 13, 4197. https://doi.org/10.3390/app13074197
AMA Style
Feng H, Zhang X, Nan Y, Zhang D, Sun Y. Ecological Sensitivity Assessment and Spatial Pattern Analysis of Land Resources in Tumen River Basin, China. Applied Sciences. 2023; 13(7):4197. https://doi.org/10.3390/app13074197
Chicago/Turabian StyleFeng, Hengdong, Xiaoguang Zhang, Ying Nan, Da Zhang, and Yan Sun. 2023. "Ecological Sensitivity Assessment and Spatial Pattern Analysis of Land Resources in Tumen River Basin, China" Applied Sciences 13, no. 7: 4197. https://doi.org/10.3390/app13074197
Note that from the first issue of 2016, this journal uses article numbers instead of page numbers. See further details here.