Article

Learning Methods and Predictive Modeling to Identify Failure by Human Factors in the Aviation Industry

by
Rui P. R. Nogueira
1,
Rui Melicio
1,*,
Duarte Valério
1 and
Luís F. F. M. Santos
2,3
1
Institute of Mechanical Engineering (IDMEC), Instituto Superior Técnico, Universidade de Lisboa, Av. Rovisco Pais 1, 1049-001 Lisboa, Portugal
2
Aeronautics and Astronautics Research Center (AEROG), Universidade da Beira Interior, Calçada Fonte do Lameiro, 6200-358 Covilhã, Portugal
3
ISEC Lisboa, Alameda das Linhas de Torres, 179, 1750-142 Lisboa, Portugal
*
Author to whom correspondence should be addressed.
Appl. Sci. 2023, 13(6), 4069; https://doi.org/10.3390/app13064069
Submission received: 15 February 2023 / Revised: 20 March 2023 / Accepted: 21 March 2023 / Published: 22 March 2023
(This article belongs to the Special Issue Research on Aviation Safety)

Abstract

:
This paper proposes a model capable of predicting fatal occurrences in aviation events such as accidents and incidents, using as inputs the human factors that contributed to each incident, together with information about the flight. This is important because aviation demands have increased over the years; while safety standards are very rigorous, managing risk and preventing failures due to human factors, thereby further increasing safety, requires models capable of predicting potential failures or risky situations. The database for this paper’s model was provided by the Aviation Safety Network (ASN). Correlations between leading causes of incident and the human element are proposed, using the Human Factors Analysis Classification System (HFACS). A classification model system is proposed, with the database preprocessed for the use of machine learning techniques. For modeling, two supervised learning algorithms, Random Forest (RF) and Artificial Neural Networks (ANN), and the semi-supervised Active Learning (AL) are considered. Their respective structures are optimized applying hyperparameter analysis to improve the model. The best predictive model, obtained with RF, was able to achieve an accuracy of 90%, macro F1 of 87%, and a recall of 86%, outperforming ANN models, with a lower ability to predict fatal accidents. These performances are expected to assist decision makers in planning actions to avoid human factors that may cause aviation incidents, and to direct efforts to the more important areas.

1. Introduction

The problem addressed in this article is the modeling of a classification system that encompasses human factors with the circumstances of an aviation incident or accident. In this way, a predictive system could be built, expected to proactively help with increasing safety standards within the industry.
Air transportation has developed into a crucial method of long-distance travel, making widely known contributions to economic and social development on a global scale. Technological and management systems in air travel benefit from a close relationship between aviation manufacturers and regulators, aimed at safety improvement, leading to one of the safest transportation methods [1,2,3].
However, with the sharp decrease of the accident rate, not only has air traffic considerably increased, but also the absolute number of accidents fails to decrease [4,5], and market demands are such that professionals are required to work through large stretches of the day and/or night [1,6]. The majority of aviation accidents have been caused by human error (see, e.g., [7], where a detailed analysis of several aircraft accidents is performed), and studies within the industry helped prove a link with the causation of human error in aviation and the added work effort requirements [1,4,6]. Hence the interest of this paper’s approach, which aims to answer the following question: are the current human factors policies and considerations, first studied in the 1970s and introduced into the aviation industry from the late 1980s on, still relevant at present? If their relevance is no longer the same as before, there could be new threats, or other factors not yet considered, even though the aviation ecosystem is expected to respond quickly to new challenges identified in this area.
The paper is organized as follows. Section 2 presents a brief state-of-the-art of the relation between human errors and safety in aviation. Section 3 describes the algorithms used to implement this paper’s models, together with the criteria commonly used to evaluate the performance of classification models. Section 4 details the Aviation Safety Network (ASN) database, and how its data were expanded and pre-processed regarding human factors. Section 5 shows the results of models applied, their validity, and the optimization of the algorithms. Finally, the Section 6 addresses how the achieved model can be used in practice and how the results and findings of this paper can be built on.

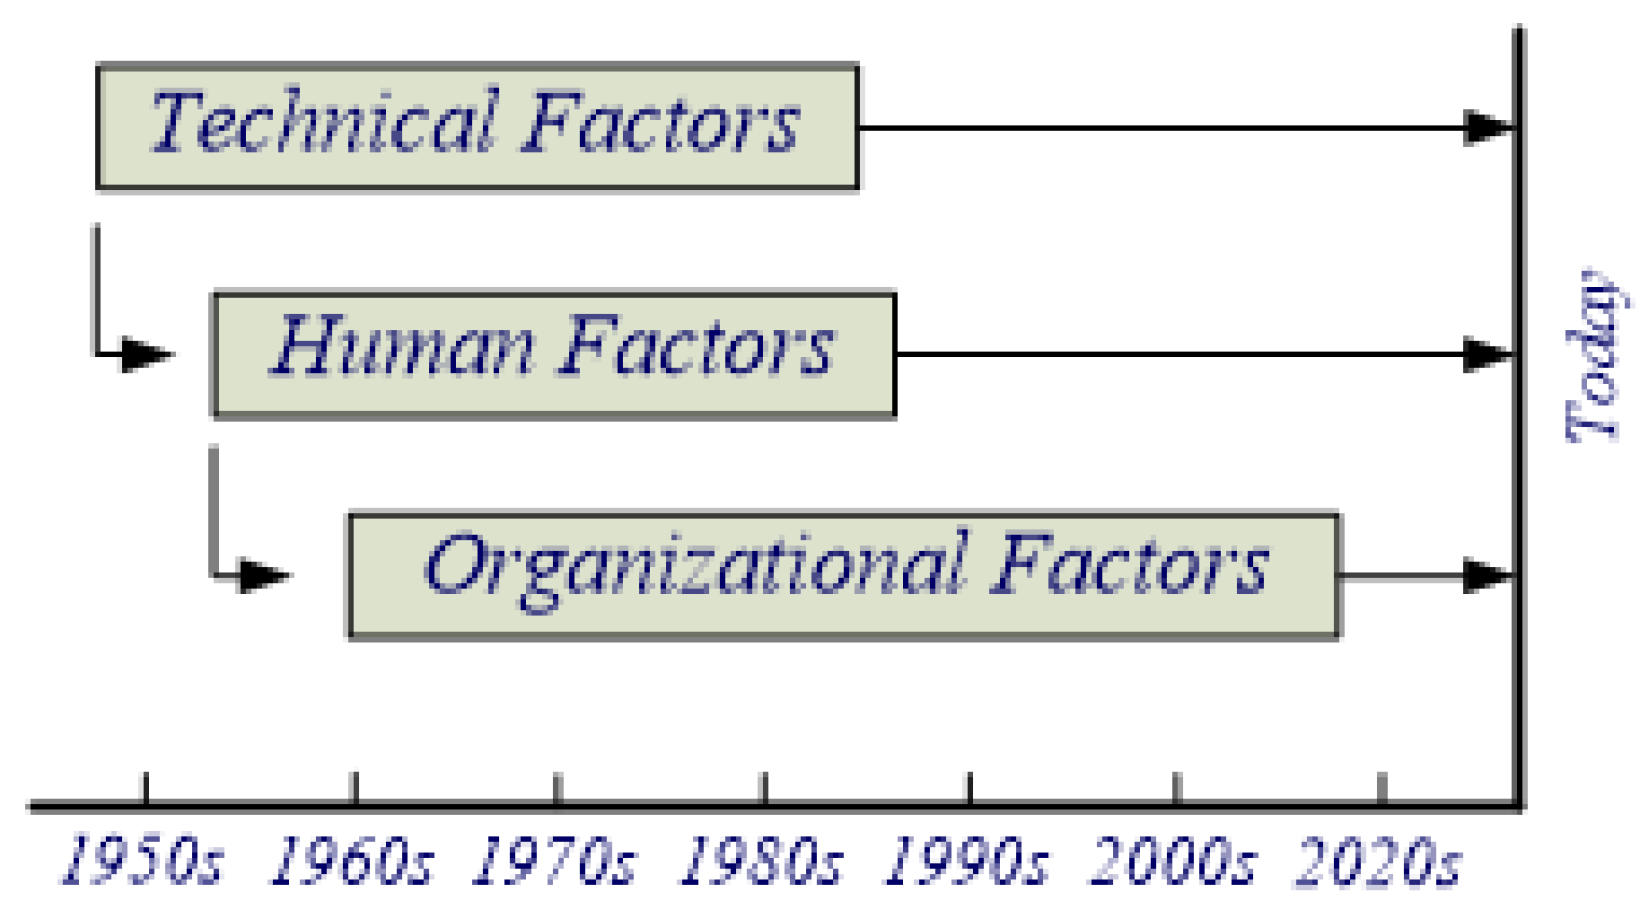
2. Safety and Human Errors in Aviation

Safety in the aircraft industry is currently defined as “the state in which the possibility of harm to persons or of property damage is reduced to, and maintained at or below, an acceptable level through a continuing process of hazard identification and safety risk management” [2].
In ICAO Annex 19 [8], the Safety Management System (SMS) assumes two phases for increasing air transport safety. Phase 1 has the main goal of eliminating the common causes of accidents, mostly related to technology, training, and procedures, among others; it is also expected to manage organizational causes. ICAO and the regulators know that eliminating the risk is an impossible task; the purpose is to detect errors by safety barriers, especially designed to prevent them from going unnoticed. With this approach it is intended to keep the risk level very low; should it even so go up, mitigation measures must be ensured [8]. The evolution of the SMS through time is shown in Figure 1.
Actions implemented in Phase 1 to handle Technical Factors were usually the introduction of better and more reliable technology, related with the technical evolution of aircraft systems. As to Human Factors, workload limitations were often implemented. In what concerns organizational factors, the actions taken were the introduction of active SMS departments focused on personal and organizational risk mitigation. An SMS is a top-down, organization-wide philosophy, that manages and controls the risk of all subjects related with the air transport. It assumes four basic pillars [8]:
  • Safety policies. It must be a proactive system that looks to identify possible risks that can compromise safety before they happen.
  • Risk management. When these risks are identified, they must be properly assessed and actions must be taken to keep the risk as low as possible.
  • Risk Performance Assessment. Tools and Keep Performance Indicators (KPI) must then be developed to better manage and visualize the safety goals for the whole organization.
  • Quality and Safety Assurance. From the monitoring of the KPI’s, actions must be deployed to mitigate, or at least to bring again to very low levels, the risk or any potential threat to the air transport safety. These actions sometimes identify new threats, requiring new actions that must be deployed.
To have success in this, a safety culture must be implemented in the entire organization. All persons and existing processes must be engaged therewith. One individual alone can compromise the entire safety culture process, if not engaged with its goals. Automated processes and actions can be an effective solution to increase safety and lower the risk, but the downside is that humans tend to rely too much on them and lower their guard, leading again to a risk increase for unidentified threats.
To better assess the types of risks, the risk matrix in Table 1, which helps to categorize all types of hazards, was developed. Red, yellow and green identify, respectively, what is unacceptable under any type of circumstance, what is tolerable with the implementation of risk mitigation actions, and the acceptable region.
Reason [9] identified two types of approaches regarding errors. One is the personal approach, where the focus is solely on individual characteristics, such as personal moral weakness, forgetfulness, and distraction. In this vein, for instance, refs. [10,11,12] concluded that, in general aviation (i.e., civil flights excluding commercial activity), pilot gender has no bearing on whether accidents result in injuries, and that the same happens with age, as the increase in experience compensates for the more challenging flights that older pilots undertake. The other is the system approach, where the focus lies on the conditions promoting human error, with the intention of building layers of defense to manage risk and mitigate hazards, resulting in a safety management model. According to this approach, for instance, Santanna et al. [13] identified dysfunctional characteristics of the offshore Brazilian aviation sector. According to Reason [9], there are, within a system, latent failures which may lay dormant for a long time if the conditions to make them apparent are not verified. However, if not addressed, a flaw in the design of a certain task or an improper routine behavior by an operator may eventually be triggered, and then propagate to either a direct error or to more latent failures, which in turn propagate again into direct errors.
Since, as already mentioned, most accidents in aviation can be blamed at least in part on human factors, the Human Factors Analysis and Classification System (HFACS) tries to provide a framework for human error so that its consequences in accidents can be measured and assessed [14,15]. This taxonomy compiles the relations between human interactions and the possibility of error through a sequential framework, achieving three levels of potential error, with each level being increasingly specific and descriptive, from supervisory practices to operators’ actions, because its failures might lead to an accident. It is usually employed in studies of human factors in aviation accidents (e.g., in [16]).
For accident prevention in aviation, the Aviation Maintenance Monitoring Process (AMMP) was proposed, for a proactive oversight of human error causal factors [17]. The process was built on the Analytical Network Process model, because the software works as a decision-making tool with inter-dependent multi-criteria, considering the causal risk factors through accident reports made by Rashid et al. [17,18]. For air traffic control operators, a network-based approach dealt particularly with fatigue as human risk, with use of the artificial immune system method with extreme gradient boosting algorithm for its implementation. The network consists of all factors that can add up to the increase of fatigue, such as environmental factors (e.g., temperature, weather, humidity), working conditions, sleep patterns and personal issues outside of the workplace, with the conclusion that around 27% of operators could reduce their fatigue by shifting their responsibilities [1,19]. There have been usages of predictive models, using artificial neural networks (ANNs), to build a model for human factors evaluation in maritime accidents [20]. The HFACS taxonomy was re-designed breaking down factors into basic, intermediate and top events, helping to develop the structure of the ANN with satisfactory results when dealing with uncertainties and dynamics of the problem being studied and the models developed.
Models found in machine learning methods have also been developed. For example, in order to study the impact of human factors in the aviation industry, text data were extracted from reports using text-related methods, and these data were then used to build a model using semi-supervised learning algorithms [21]. The influence of hazardous events in a more general sense is studied in [22] using support vector machines and deep neural networks. In the next section, some machine learning methods important for what follows are studied.
In this paper, the data we use is from real accidents and incidents in aviation, rather than using data from flight simulators as in [23], or data from both aviation and maritime traffic as in [24].

3. Data Implementation
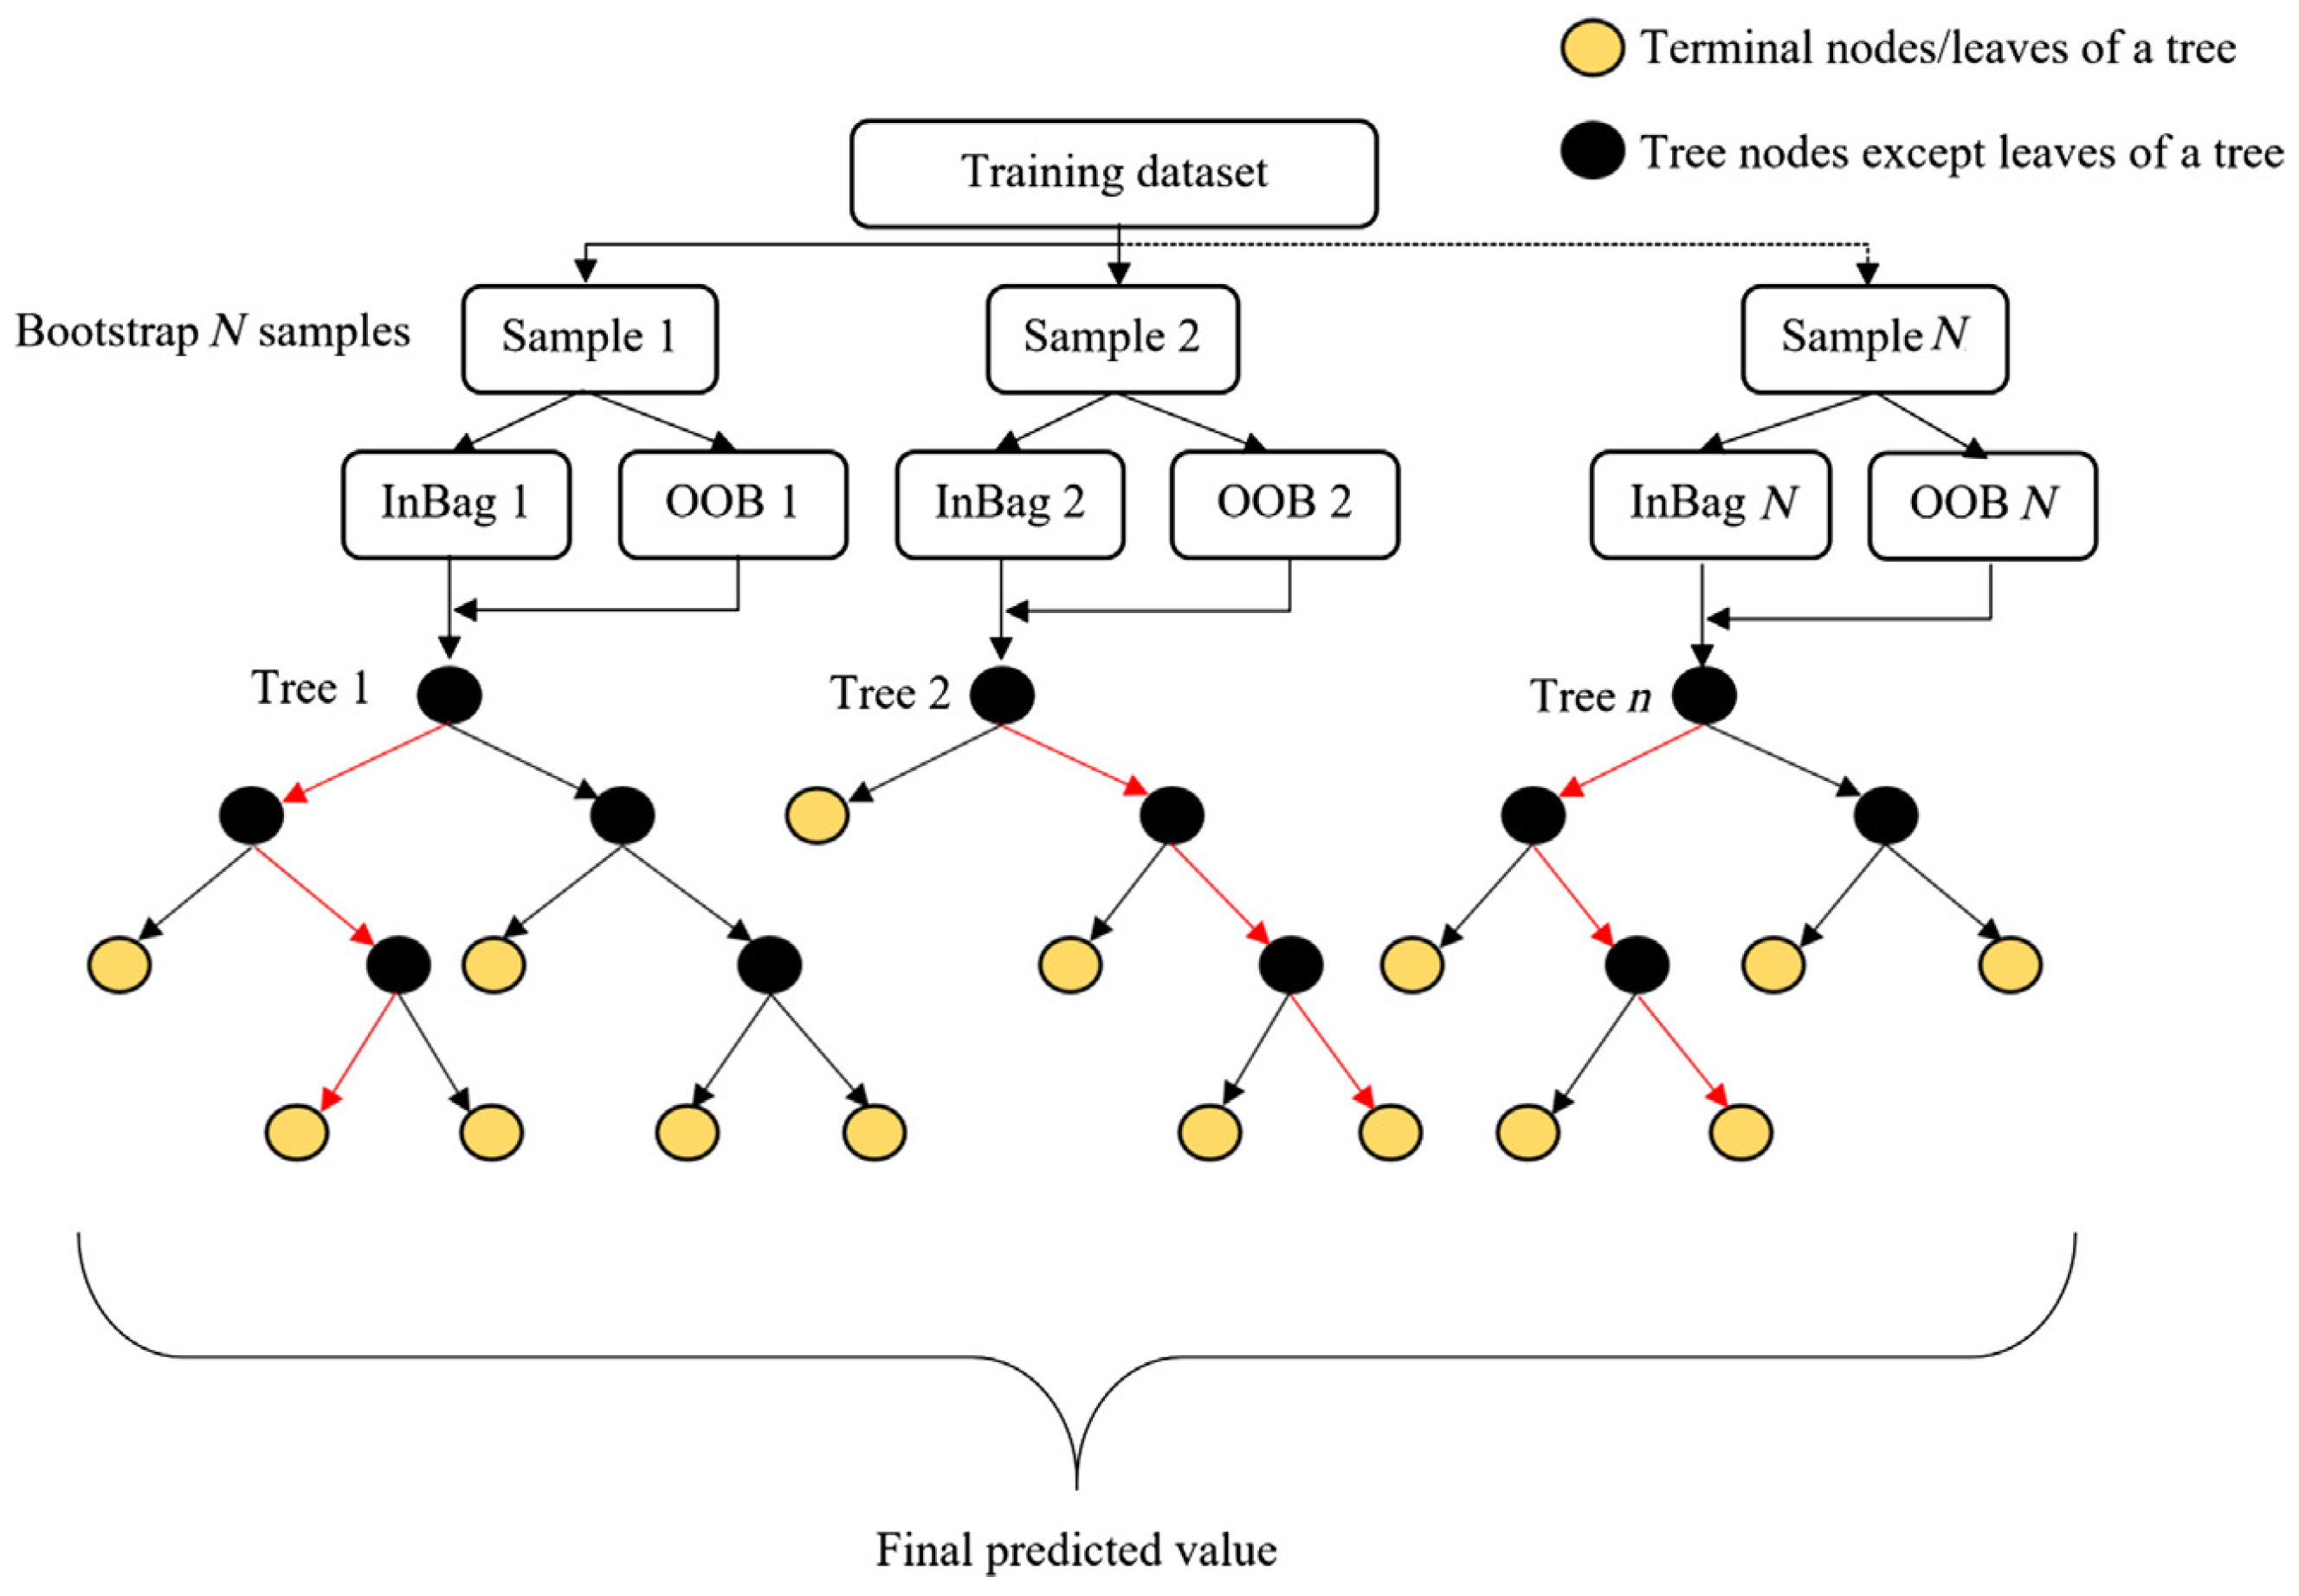
3.1. Random Forest

Random Forest (RF) is a supervised learning algorithm made up of a collection of tree-structured classifiers, defined as a decision tree, applied throughout a given dataset on multiple sub-samples [25]. The decision tree is built up from several nodes, connected by branches, descending from the root node, placed at the top by convention, to the leaf nodes [26]. Features are tested at the decision nodes, leading onto a branch. Those branches can lead to another decision node or conclude in a leaf node. The algorithm represents supervised learning, which requires a training data set provided with values of the target variable.
Originally, the specific decision trees to be used are the Classification Furthermore, Regression Trees (CART) algorithm, where each decision node produces two branches, so the tree is binary. Its growth happens through an “exhaustive search of all available variables and all possible splitting values”, selecting the optimal measurement vectors that reduce the highest impurity [26,27]. The process to generate a decision tree starts with splitting the root node into binary pieces. The splitting procedure is based on the following evaluation of candidate splits s at node t:
Δ i ( s , t ) = i ( t ) p L i ( t L ) p R i ( t R )
where Δ i ( s , t ) is a measure of impurity reduction from split s, i ( t ) represents the impurity before splitting, and i ( t L ) and i ( t R ) show the impurity of the left child node T L and of the right child node T R after halving node t by split s. In order to measure these impurities, there are several approximations [27], but the criterion for split is by default the Gini impurity [28], which measures how often a randomly chosen element from a set would be incorrectly labeled from a random distribution of labels in the subset.
A random forest, of which an example is shown in Figure 2, can be defined as a “combination of tree predictors such that each tree depends on the values of a random vector sampled independently, with the same distribution for all trees in the forest”, and each tree votes for the most popular class at a given input [25]. The procedure is as follows: a random vector θ k is generated, independent of the past random vectors θ 1 , , θ k 1 but with the same distribution; and a tree is grown using the training set and θ k , resulting in a classifier. The number of trees that can be added to a random forest can increase without limit, and should not cause overfitting problems on the model [25]. The training algorithm for the random forest is bagging, also called bootstrap aggregation, which consists of creating, or replacing, subsets of training data through random samples, represented in Figure 2 as “Out of bag” (OOB) throughout the original data, and fitting new trees onto those samples [27].

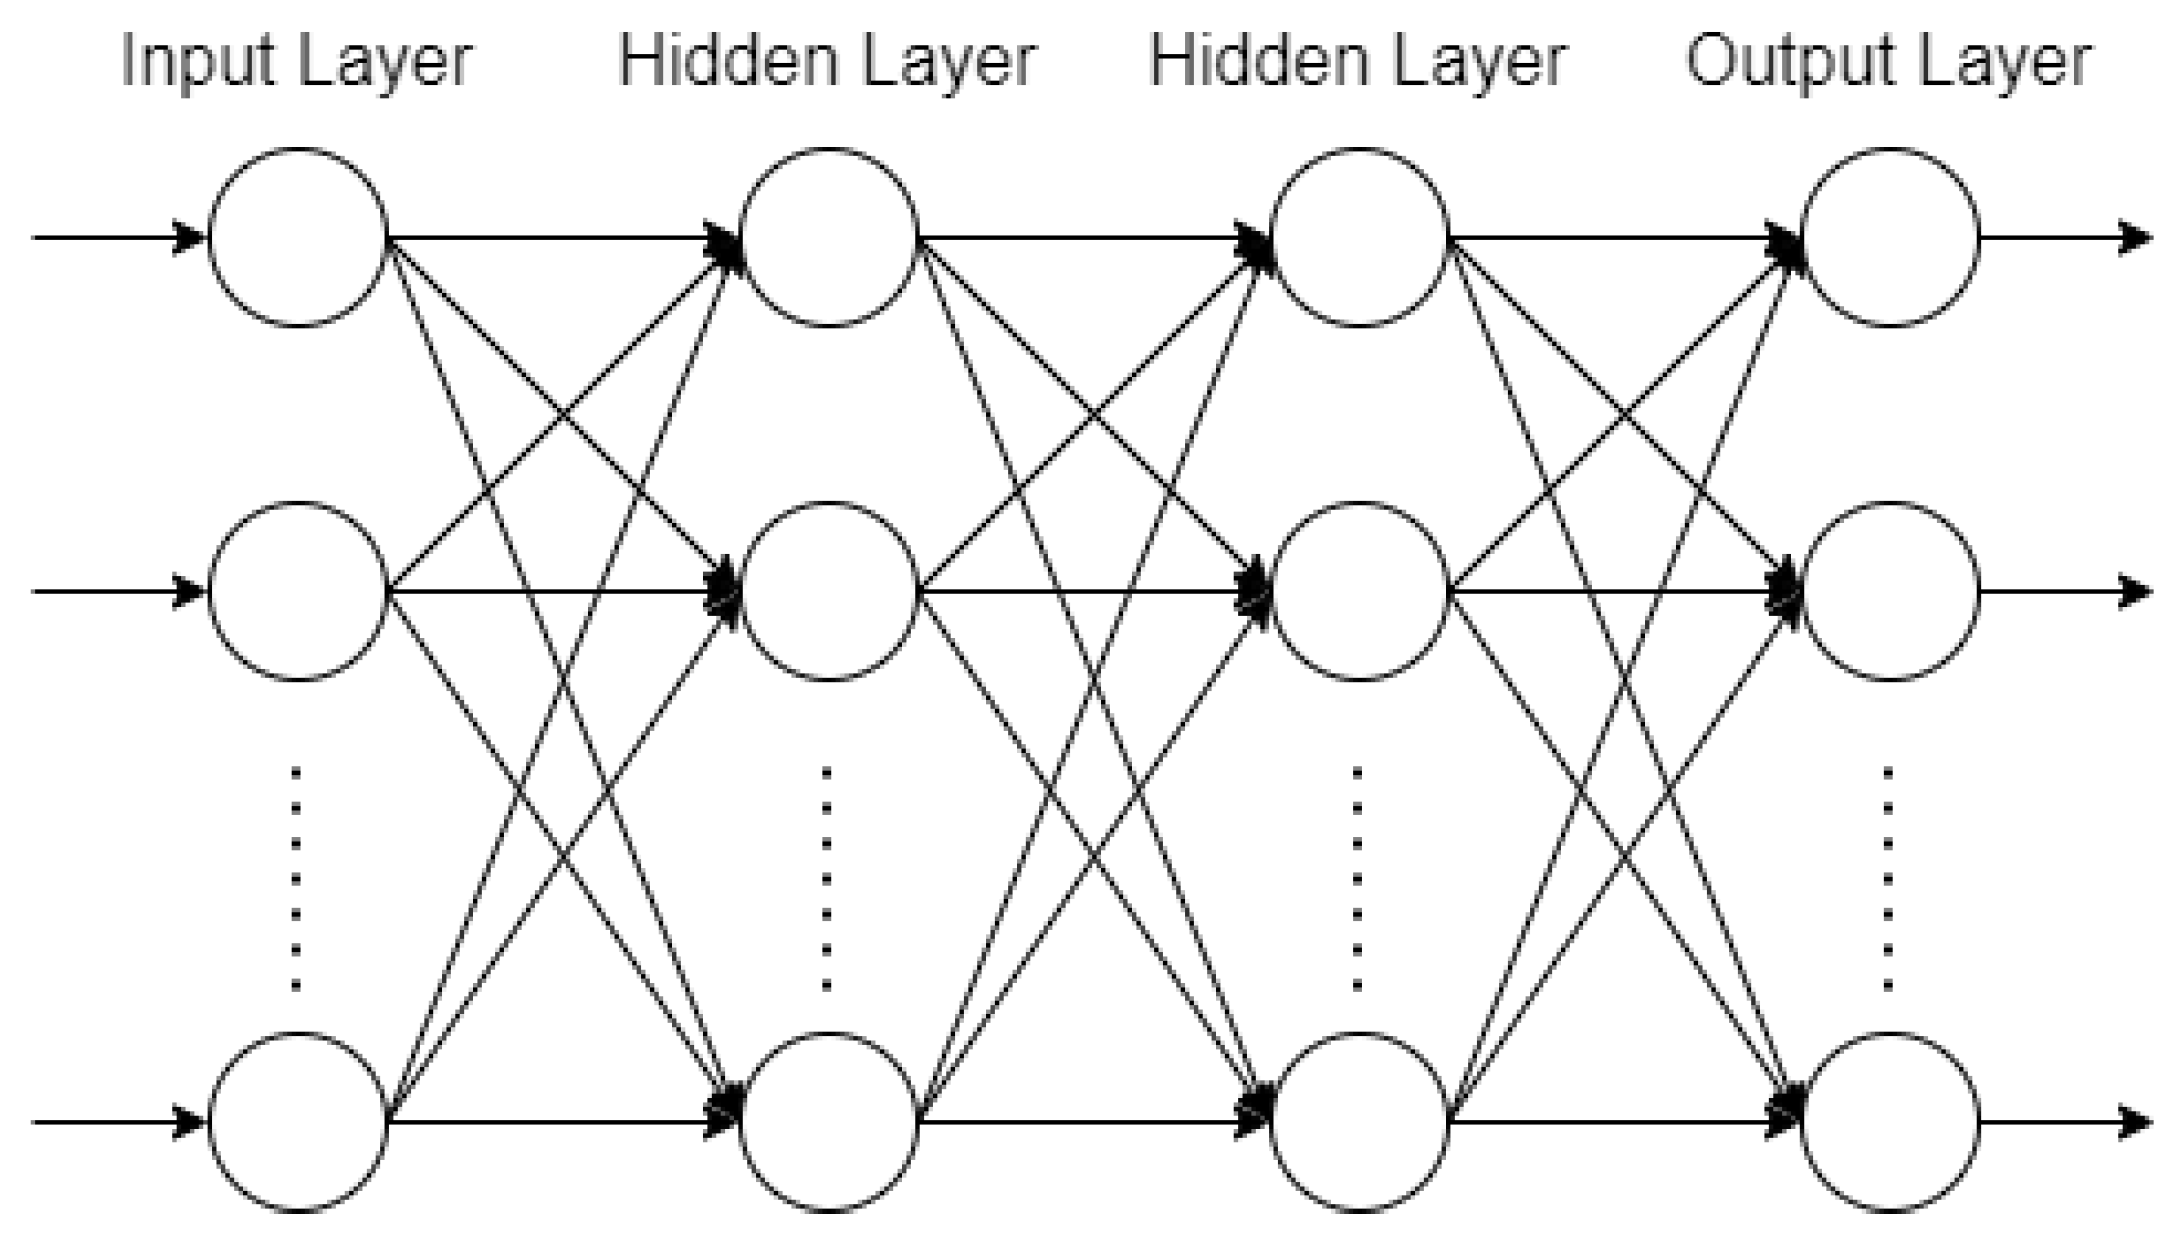
3.2. Artificial Neural Networks

The ANN is a widely used model, inspired by how the human brain processes and computes information in order to perform a specific task or function, and with a structure of information capable of performing tasks such as classification, pattern recognition and knowledge “acquired from its environment through a learning process” and stored in synapses [26,29]. A multilayered perceptron (MLP) is a type of neural network shown in Figure 3 and made of at least three layers: an input layer, one or more hidden layers, and an output layer. The input signal goes through the network in a forward direction, on a layer-by-layer basis.
The output y of neuron k is given by
y k = φ ( u k + b k ) and u k = j = 0 m w k j x j
where w k j is the synaptic weight from input x j to k, and b k is the bias that influences the input of the activation function φ . The computational power of a multilayer perceptron is due to hidden neurons, with significant connectivity between them through their synapses, facilitating pattern recognition in the network, a crucial component in solving complex problems [29].
Weights and biases can be trained by iterative algorithms, based on an error function, which for the n-the iteration on neuron i is defined as
e i ( n ) = d i ( n ) y i ( n )
where d is the desired output and y is the neuron’s output. This error function can be further developed for an output layer of size O as an error energy function:
E a v g = 1 N n = 1 N E ( n ) where E ( n ) = 1 2 i = 1 O e i 2 ( n )
N is the size of the data set. During optimization, the error energy function propagates, layer by layer, in a backward course through the network, the overall objective being to minimize it as much as possible [29]. The backpropagation (BP) algorithm represents mathematically how a neural network learns as model of supervised learning, with the propagation of errors in the opposite direction of the output layer, and corrections are made in synaptic weights with the delta rule. The delta rule for the output layer is computed:
Δ w i j = η δ i y j
where η is the learning rate and δ i is the local gradient, indicating where changes need to happen in the synaptic weight. For a hidden layer, the local gradient has to adapt the corrections made for its synaptic weights and the ones made by the earlier layer. The correction of the synaptic weights is a recursive computation, given by
w i j * = w i j + Δ w i j
where w i j * is the corrected weight, proportional to a partial derivative responsible for the direction search of the synaptic weight w i j [29]. Because the average error function is a parabolic type of function where the curve opens upwards, depending on the result of the variation of error, the synaptic weights can increase or decrease in order to minimize the error function [26]. If the partial derivative has a positive slope, the correction made is leftwards, meaning that w i j * will decrease in absolute value, whereas if the partial derivative has a negative slope, the correction made is rightwards, with an increase for the synaptic weight. The rate of how these corrections are made is what defines the neural network’s learning rate, where it sets the pace. If the learning rate is higher, the pace of correction is higher, which might lead to oscillatory and unstable behavior of the synaptic weights [29].

3.3. Hyperparameter Tuning

A hyperparameter can be defined as a parameter whose value is set before the learning process. For example, in an ANN, the number of hidden layers, the number of hidden neurons, the type of activation function and the learning rate are hyperparameters. In a random forest, the number of trees, the depth of the tree, or the number of samples required to split an internal node or a leaf node are examples of hyperparameters.
Hyperparameter tuning can be defined as an optimization problem with the intent of determining those parameters that lead into an optimal value and has been tested with success for machine learning algorithms such as RF and ANN [30]. This pursuit can be computationally expensive and time consuming, especially if a brute force type of search is performed, where all possible data points are verified. Hyperparameter tuning problems, however, can be solved through an algorithm designed for its optimization. For example, Bayesian optimization is a strategy for determining local maxima from computationally expensive functions, considering prior tested data. The maximum value, from a given search space, is determined by a combination of exploiting spaces with high values (exploitation) and exploring other areas with uncertainty (exploration), which are common in optimization algorithms. The prior distribution of Bayesian optimization is ensured with the Gaussian process (GP), which is considered flexible and easy to handle, therefore helping with a good fit of data in the algorithm [30]. The GP is a function where the variable is a Gaussian distribution:
f ( x ) G P m ( x ) , k ( x , x )
Here m ( x ) is the distribution’s mean function, and k ( x , x ) the covariance function of two tested points x and x . Function k is usually an exponential square function. If there is a strong correlation, there is less uncertainty, however, if the points are further away, there is less correlation and more uncertainty. If the number of data points are large enough, it is possible to have a general sense of how to optimize function f [30]. Given posterior information, the GP works in an iterative way and the acquisition function determines the next search.

3.4. Active Learning

Active Learning (AL) is a particular sub-environment of machine learning in which an algorithm can choose the data from which it will learn, therefore performing better with less training and less data than a supervised learning algorithm. In practice, from a small amount of labeled testing data, an AL system will add more data by asking queries from an oracle to label specific data. The goal is to achieve high accuracy from sparse labeled data, minimizing the expense of obtaining these types of data [31].
There are three main frameworks from which a learner can ask questions: Membership Query Synthesis (the learner solicits labels for any unlabeled data point and a query is generated for the learner to evaluate), Stream-Based Selective Sampling (obtaining unlabeled data is assumed to be inexpensive, and the input distribution follows a stream-based approach, in which the learner decides from one data point onto another whether to query or discard it), and Pool-Based Sampling. In the latter, the input has a small labeled data, and a larger pool of unlabeled data set is available. Queries are then drawn from the pool in a greedy way, by selecting the best data point from the entire pool [31]. The querying strategy could be uncertainty sampling, a simple framework in which the learner queries data with the least certainty on how to label it; or entropy sampling, a more general strategy, in which it tries to map the distribution of probabilities with the information given [31].

4. Database Modeling

The data used were provided by the Aviation Safety Network (ASN), which is “a private, independent initiative created in 1996”, that “covers accidents and safety issues with regards to airliners, military transport planes and corporate jets” [32]. This ASN database is public, but access was granted for use in this paper for a 10 year period between 2007 and 2017, during which 1105 occurrences were extracted. This period is the same as that used in [21], predates the perturbations caused the COVID-19 pandemic, and only includes years in which current human factors policies were in use. Each point in the database has the narrative, causes, contributory factors precluding the occurrence and outcome on the aircraft produced by those failures. These include incidents (with no damage or minor damages to the aircraft and with or without minor injuries to the occupants) and accidents (with serious injuries, or loss of human life, or extensive damage to the aircraft whether or not there are injuries or fatalities). The 1105 occurrences were studied to identify causes of the most serious and undesirable situations, accidents with fatalities.
To proceed with the analysis proposed and to factor in the human factors in aviation safety, the HFACS taxonomy is used, as its framework proved to be reliable in identifying human factors issues that were hidden, highlighting critical parts of human factor failure that required intervention, and improving data quality and quantity [33]. A human factors analysis can be performed from the contributory factors prior to the accident, relating them with either underlying conditions or probable causes that triggered or may trigger those events [9].
From the analysis of each contributory factor, it was possible to notice different ways on how the human factors were categorized in the reports. In most cases, they simply correspond to the HFACS taxonomy; in others, either part of the probable causes, or the contributory factors are maintenance failures, handled according to the maintenance extension of HFACS (HFACS-ME) that was proposed by [34]. Table 2 shows the frequency of each of the factors found in the reports analyzed.
Considering the objectives described above, it was possible to create two models for analysis considering the database features, as illustrated in Figure 4. They try to answer two questions:
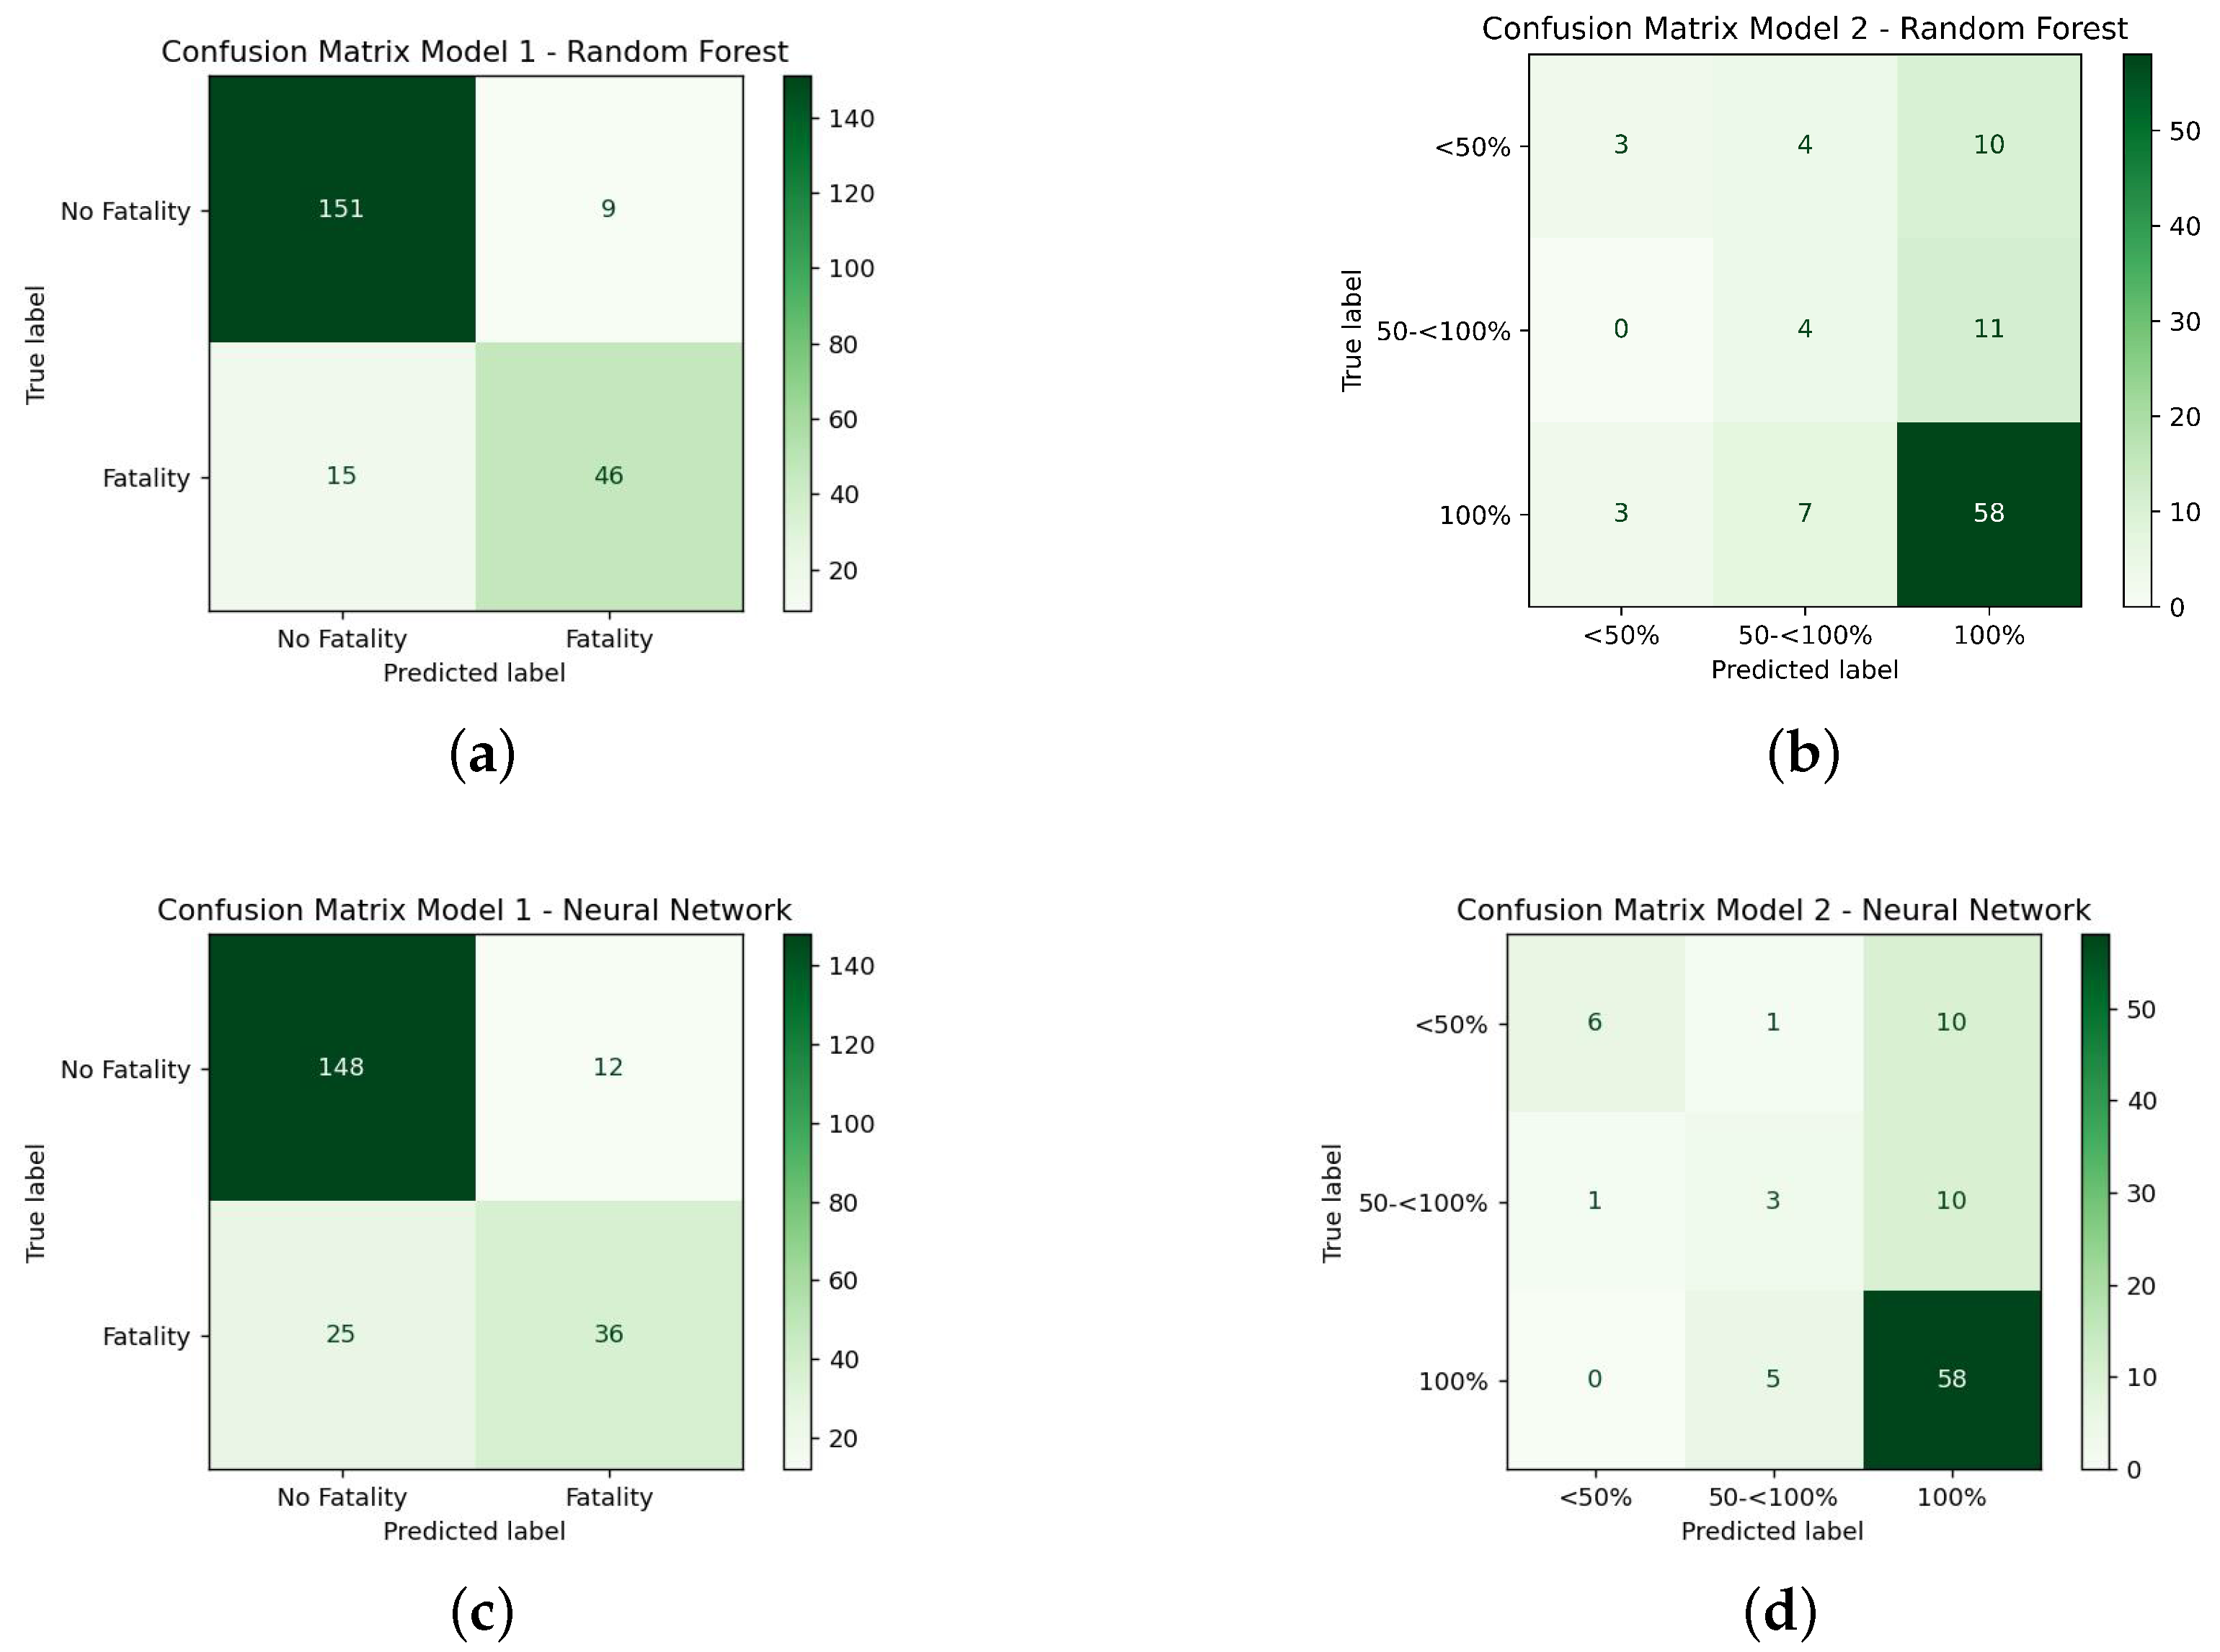
  • Is it possible to predict whether an incident or accident produced any fatality? This is the purpose of Model 1.
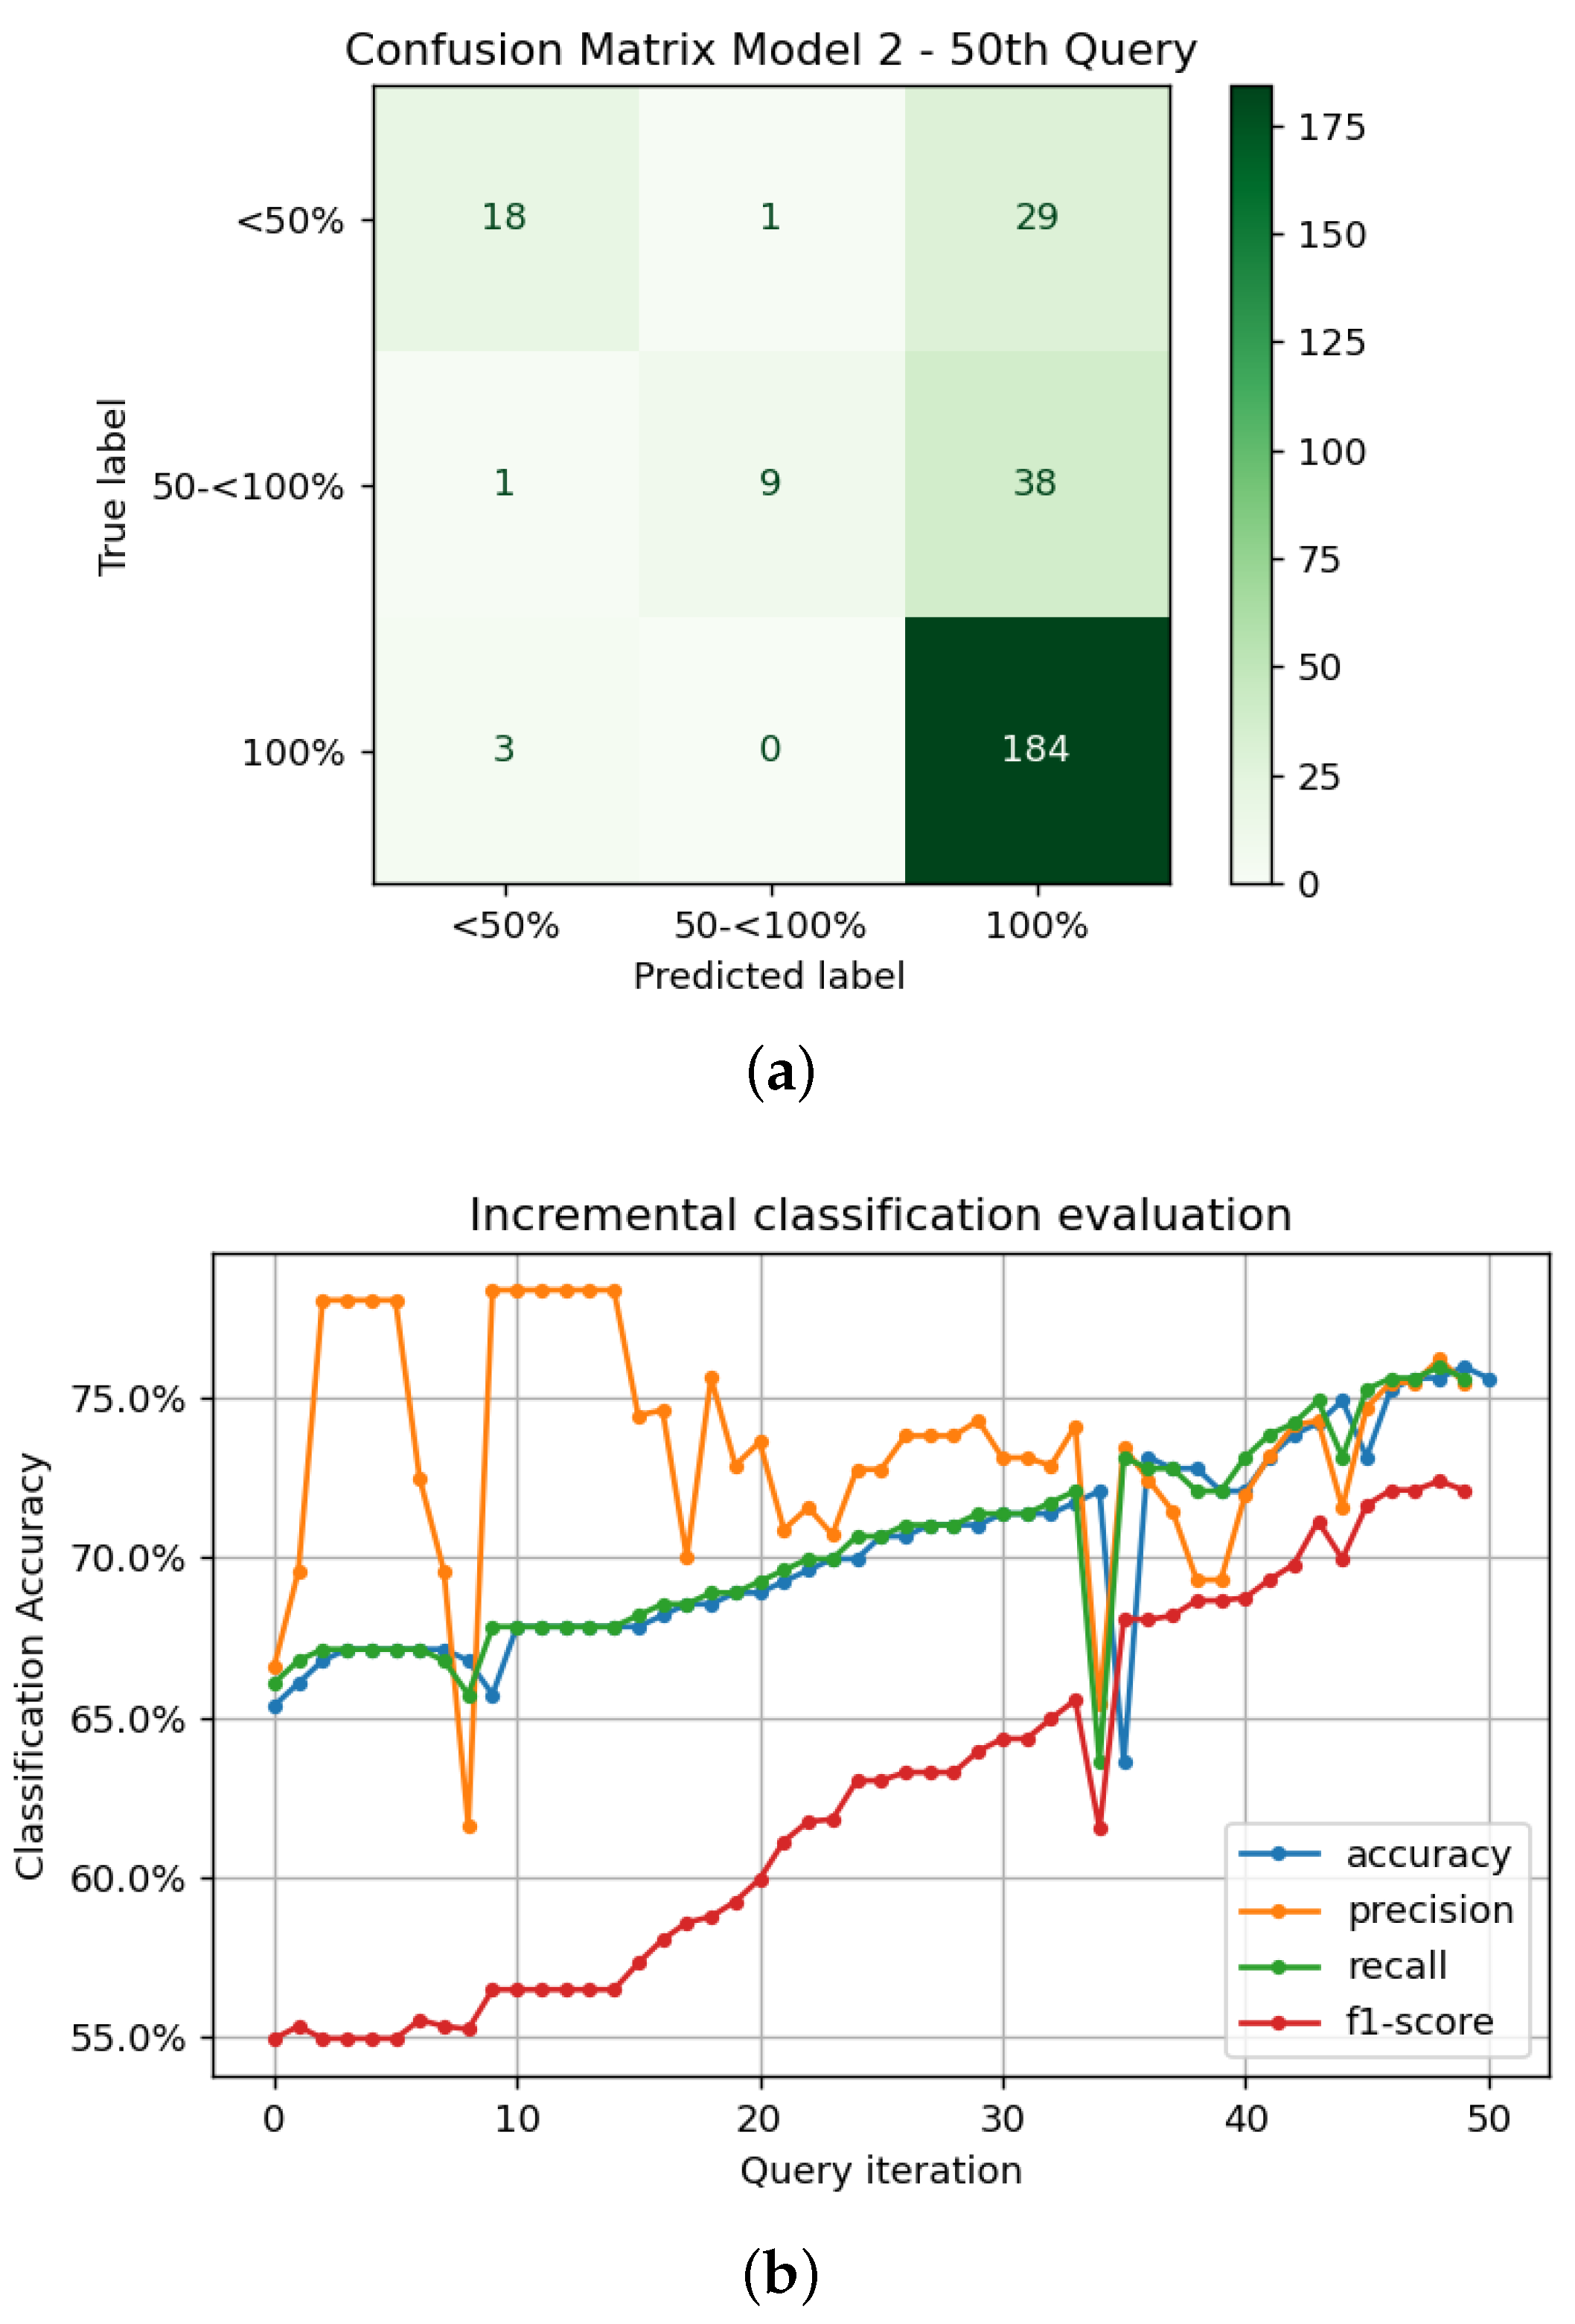
  • If an occurrence was fatal, is it possible to estimate the percentage of people killed? This is the purpose of Model 2.

5. Results

This section describes the results achieved by the two models, which were obtained using the following parameters:
  • Random forests used 1000 trees, and nodes were expanded until all leaves were pure.
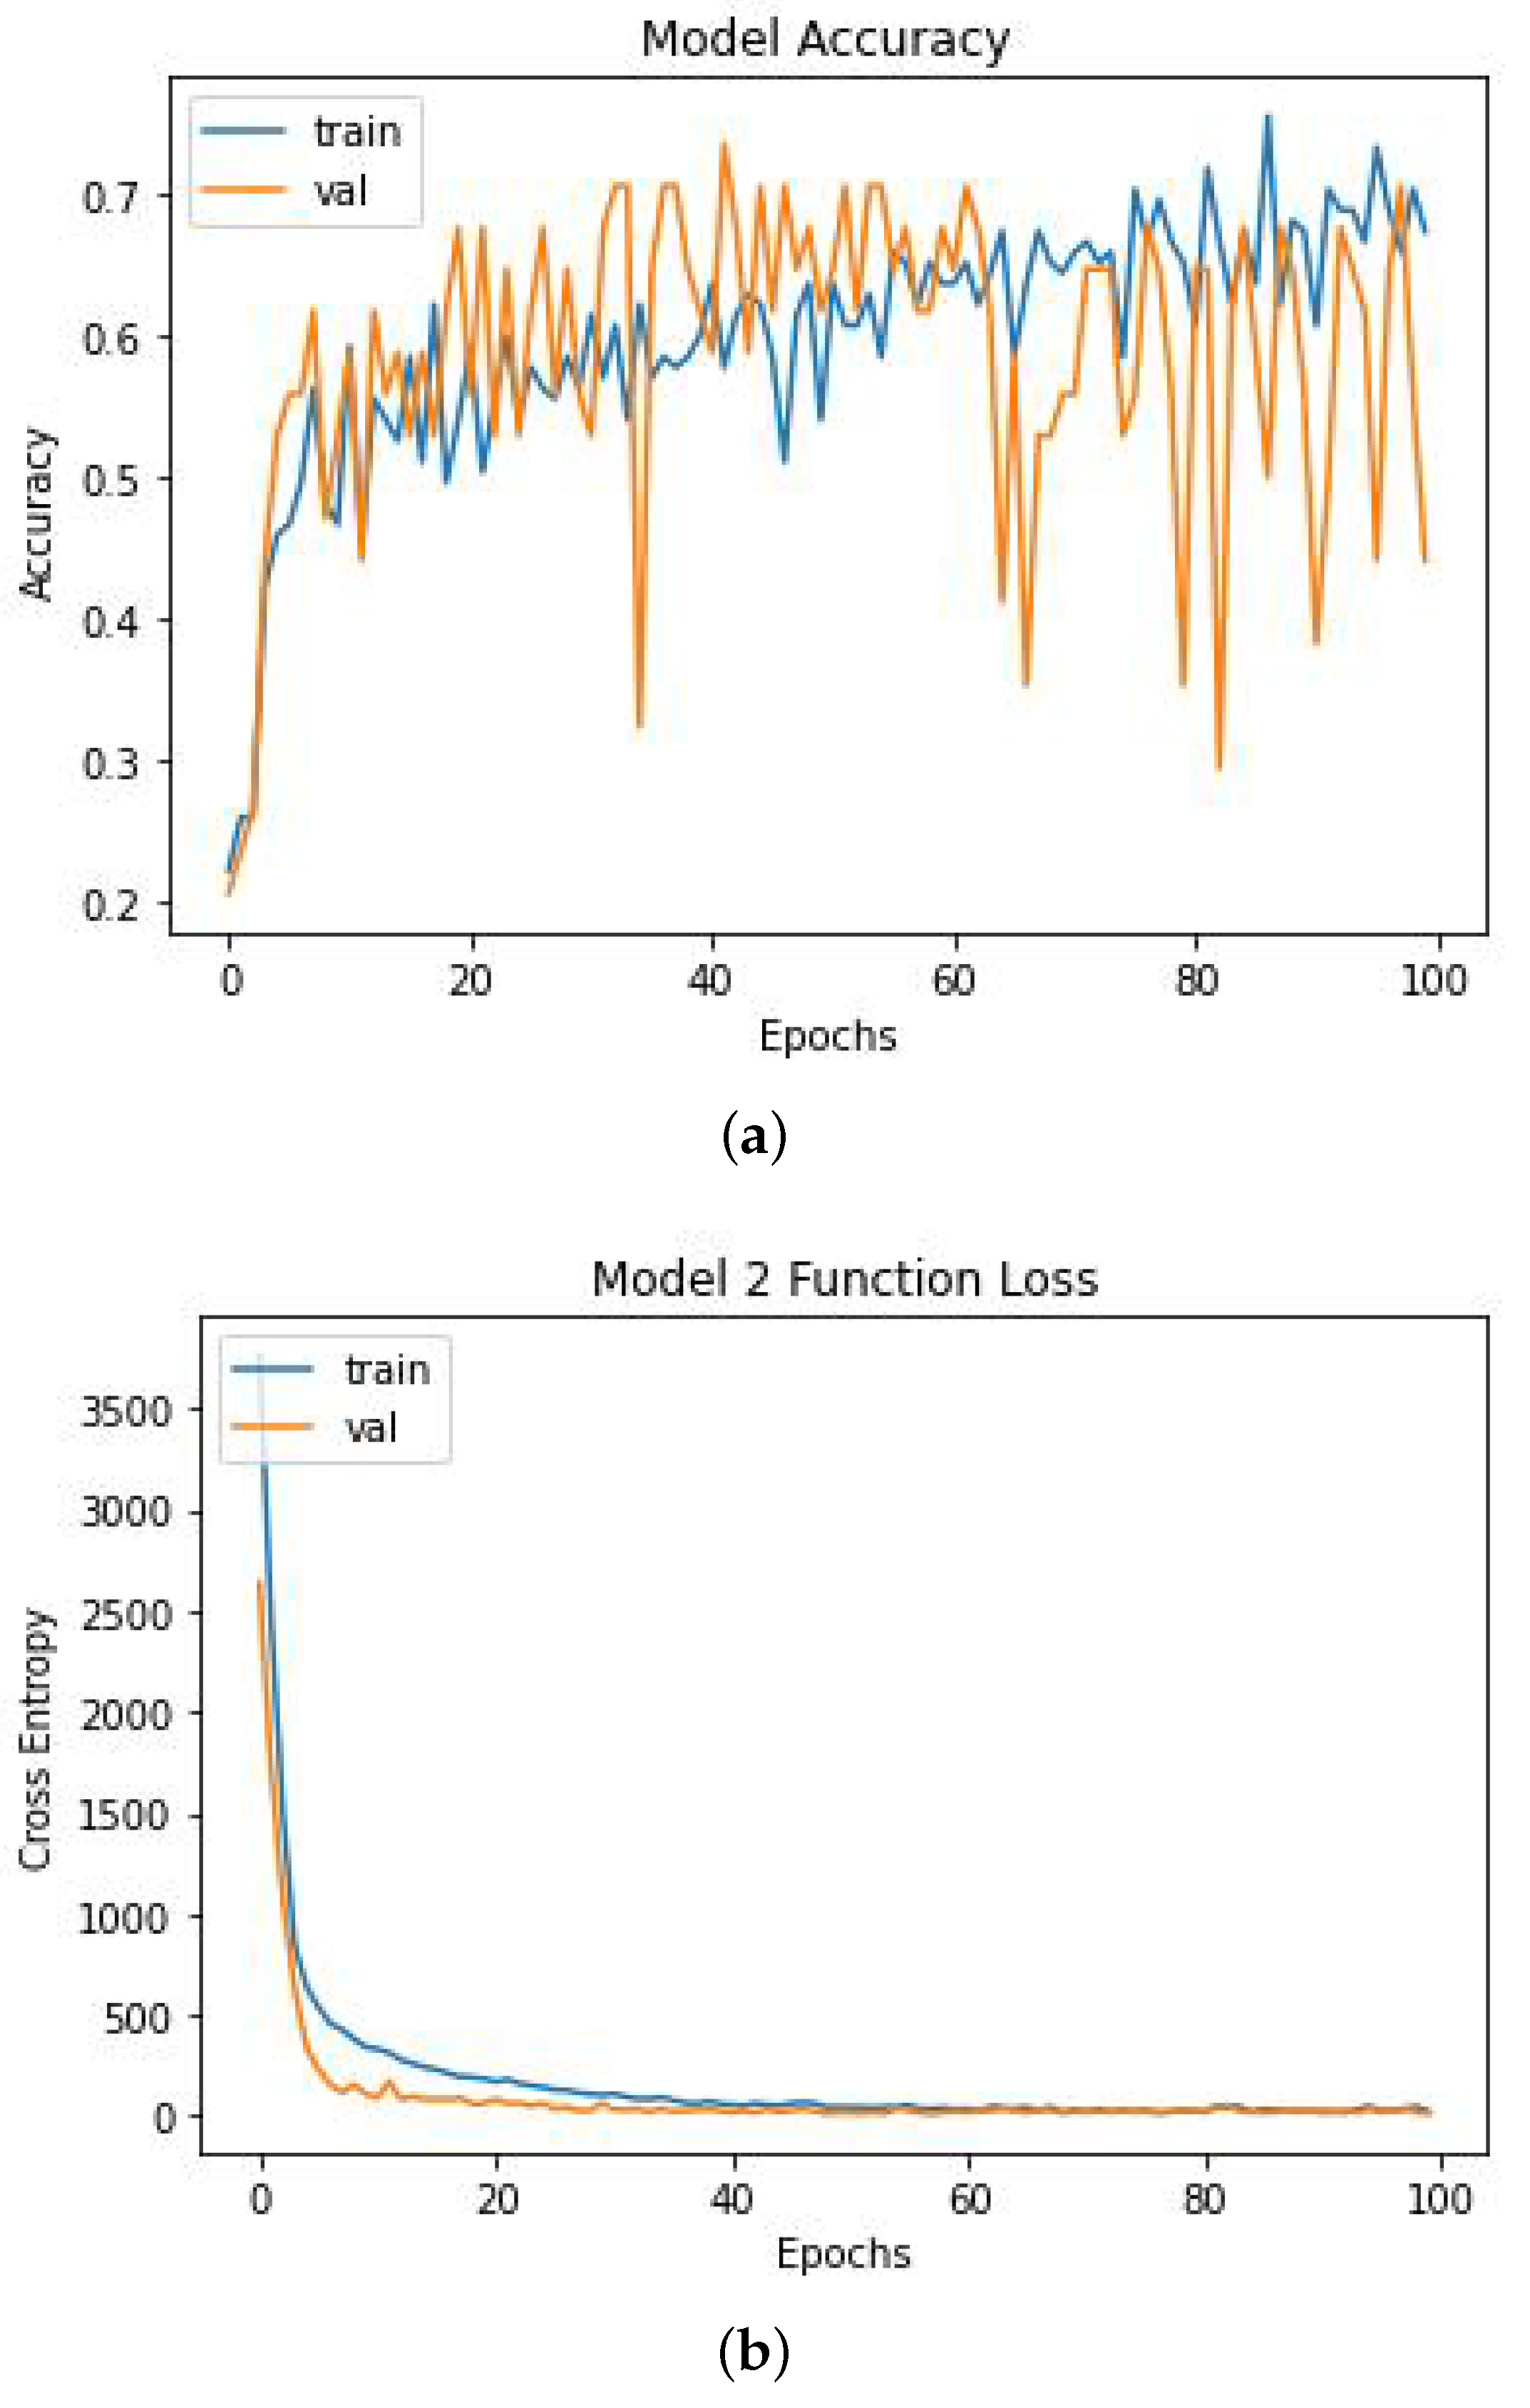
  • Neural networks used one hidden layer with a rectified linear unit activation function, and several neurons were found by trial and error as a compromise between performance and overfitting. Model 1 had 13 neurons in the hidden layer, and two neurons in the output layer with a sigmoid activation function, its purpose being a binary classification. Model 2 had 15 neurons in the hidden layer, and three neurons in the output layer with a softmax activation function, which is a usual choice when finding a probability [35].

5.1. Performance Criteria

Classification models require certain parameters to evaluate their validity, and a classifier is only valid if it can predict correctly a label when information is provided. For a binary classification problem, such as Model 1, the prediction made will belong to one element in { 0 , 1 } where 0 indicates the negative class (“No Fatality”), and 1 the positive class (“Fatality”). The results can be presented in a confusion matrix, such as in Table 3.
From this confusion matrix, several quality parameters can be determined, such as accuracy, precision, recall, and F-score:
Precision = T P T P + F P
Recall = T P T P + F N
Accuracy = T P + T N T N + F N + F P + T P
F β = ( 1 + β 2 ) Precision · Recall ( β 2 · Precision ) + Recall
Positive real factor β translates into how many times recall is more important than precision. If β = 1 , the harmonic mean of both criteria is returned, and the F-score is deemed balanced. However, if a model has class imbalances, measures such as accuracy, which is defined as the ratio between the number of correct predictions made and the total number of predictions made, can be misleading, and other measures might be more relevant [36]. This is the case in Model 1, since there is a ratio of 3:1 between the two classes; i.e., for every accident with at least one fatality there were three that had none.
This type of performance analysis that can be displayed with a confusion matrix can be extended to a multi-class analysis. In that case, there will be a i × i confusion matrix, with one column and one row for each individual class C i , and performance can be assessed using T P i , F P i , T N i , F N i , P r e c i s i o n i , R e c a l l i [36]. It is possible to estimate the overall performance of those multi-class models, by computing performances on average. They can be weighted, or macro averaged. The weighted form of average may not adequately reflect the quality of the criteria if there are severe class imbalances, because accurate predictions on a class overwhelmingly represented are to be expected, ad thus a higher performance score is misleading. To deal with class imbalances, criteria such as the Receiver Operating Characteristic (ROC) and Precision-Recall graphs can be used. The ROC curve is defined as a plot of the False Positive Rate (FPR) on the x-axis and True Positive Rate (TPR) on the y-axis.

5.2. Model Performance

For Model 1, a single-class binary output type of model was considered. To apply the supervised learning algorithms, 75% of the data set was used for training, and 25% for testing and validation, this division being heuristically enough to find good solutions for linear problems. After both algorithms are trained, a confusion matrix with the validation set is obtained for the respective algorithm implementation, and the corresponding performance criteria are determined (see Figure 5).
For each algorithm, the model can be validated by the MLP’s binary cross entropy function, which is computed between true and predicted labels, and the Precision-Recall curve for RF. For the MLP’s loss function, its behavior throughout the epochs can help determine the fit of data set, which helps shaping its structure. Both training and validation curves have an exponential decay over the first epochs, which means that the MLP quickly finds a good fit and does not seem to overfit, as the validation cross entropy curve does not seem to increase and the training curve decreases. Given the characteristics of the data set for this model, the behavior of the Precision-Recall curve evaluates the skill of the prediction, as the graph computes different thresholds for precision and recall. The area under the curve for Model 1 with RF is significant, which helps to judge favorably the quality of the prediction, thus validating the classifier.
Table 4 shows that the RF is better at correctly predicting the positive class than the MLP, because, while it is possible to observe that both algorithms are similarly capable of detecting the predominant class (No Fatality), not only the RF algorithm is able to correctly identify the Fatality class more often than the MLP, but it also does so without predicting fatal occurrences as non-fatal.
Semi-supervised learning was used with a pool-based strategy, but no improvement over the other algorithms resulted, because the amount of data is too small for this algorithm to reach a new perspective. Furthermore, with a lower score on an important metric such as recall, AL does not seem to suit this model well.
For Model 2, there is even less data, since only the accidents with fatalities are considered. Thus, MLPs face limitations due to the error function for the first epochs being very high (Figure 6b). Despite the good shape of the loss function, the loss decay of the training data set is severe, which makes it difficult to judge what is regarded as overfit or underfit of the model, and the behavior of both curves as the epochs progress. The accuracy function better demonstrates what the evolution of MLP with more training is (Figure 6a), as the training curve is consistent with a regular accurate curve, and so the data structure was considered to be well fitted.
The semi-supervised learning algorithm Active Learning (AL) was also used for Model 2, with the pool-based strategy. The labeled data selected was 1% of the total data available, with the rest being used as pooling data. The query selection was the entropy, because of the skewed distribution of the labels toward one class. After the last query, the confusion matrix can be computed. With the constant retraining of data where new testing data are added for the AL algorithm, the prediction can be improved (Figure 7).
AL is capable of performing better than RF when it comes to correctly predicted labels, as seen in Table 5 where AL has better performance across all criteria. Two other algorithms, Random Search and Bayesian Optimization, were tried for Model 2, since they were expected to be good alternatives, but this was not the case, and the results were clearly poorer than those of AL.

6. Conclusions

In this article, a model, based on data from incident and accident reports in the aviation industry, was proposed, to predict fatalities based on the cause of the accident. From the ASN database, it was possible to join existing information about contributory causes preceding the occurrence and its result for the aircraft, with more information about the phase of flight, the damaged sustained and the mortality. Since the role of human factors in safety procedures for aviation is paramount, a correlation was made applying the HFACS taxonomy. Three algorithms (MLP, RF, and AL) were proposed to create the desired models, based on previous work with the ASN database [21], and good results were reached, confirming that human factor policies and considerations remain indeed important to keep accidents and failures at bay.
In this already highly regulated industry, improving the safety standards is a main objective. Improving the safety in aviation is a constant and always ongoing objective for the entire aviation ecosystem. The results in this paper are expected to contribute to the identification of the main human factors that are root causes leading to fatal accidents, whether these root causes are related to maintenance or operations. The results in this paper are expected to contribute to selecting the areas where more investment and better procedures are more important, and more likely to have a positive impact in the reduction of fatal accidents.
A first step to build on the work herein presented is to extend the database incorporating more recent data points, since supervised learning techniques struggled because of lack of data. Regarding the HFACS taxonomy and the process of labellng, it could be possible to incorporate a relation different types of human factors in failures and the corresponding contributory causes of accidents [37].

Author Contributions

Conceptualization, R.M. and D.V.; methodology, R.P.R.N., R.M. and D.V.; software, R.P.R.N.; validation, R.M., D.V. and L.F.F.M.S.; investigation, R.P.R.N.; resources, R.M.; data curation, R.P.R.N. and R.M.; writing—original draft preparation, R.P.R.N.; writing—review and editing, R.M. and D.V.; visualization, R.P.R.N.; supervision, R.M. and D.V.; project administration, D.V.; funding acquisition, R.M. All authors have read and agreed to the published version of the manuscript.

Funding

This work was supported by: Foundation for Science and Technology—FCT, through IDMEC, under LAETA, project UIDB/50022/2020.

Institutional Review Board Statement

Not applicable.

Informed Consent Statement

Not applicable.

Data Availability Statement

Not applicable.

Acknowledgments

The authors would like to acknowledge Harro Ranter for kindly providing access to the Aviation Safety (ASN) Database for this research.

Conflicts of Interest

The authors declare no conflict of interest.

References

  1. Santos, L.F.; Melicio, R. Stress, Pressure and Fatigue on Aircraft Maintenance Personal. Int. Rev. Aerosp. Eng. 2019, 12, 35–45. [Google Scholar] [CrossRef]
  2. ICAO. Safety Management Manual, 3rd ed.; DOC 9859 AN/474; International Civil Aviation Organization: Montreal, QC, Canada, 2013. [Google Scholar]
  3. Pereira, D.P.; Gomes, I.L.; Melicio, R.; Mendes, V.M. Planning of Aircraft Fleet Maintenance Teams. Aerospace 2021, 8, 140. [Google Scholar] [CrossRef]
  4. Wiegmann, D.A.; Shappell, S.A. A Human Error Approach to Aviation Accident Analysis; Ashgate Publishing Ltd.: Farnham, UK, 2003. [Google Scholar]
  5. Mazareanu, E. Passenger AIR Traffic Each Year. 2021. Available online: https://www.statista.com/statistics/564717/airline-industry-passenger-traffic-globally/ (accessed on 10 February 2023).
  6. Dias, N.G.; Santos, L.F.; Melicio, R. Aircraft Maintenance Professionals: Stress, Pressure and Fatigue. In Proceedings of the 9th EASN International Conference on Innovation in Aviation and Space, Athens, Greece, 3–6 September 2019; Volume 304, pp. 1–7. [Google Scholar]
  7. Kharoufah, H.; Murray, J.; Baxter, G.; Wild, G. A review of human factors causations in commercial air transport accidents and incidents: From to 2000–2016. Prog. Aerosp. Sci. 2018, 99, 1–13. [Google Scholar] [CrossRef]
  8. EASA. ICAO Annex 19. In Safety Management, International Standards and Recommended Practices; European Aviation Safety Agency: Cologne, Germany, 2016. [Google Scholar]
  9. Reason, J. Human Error; Cambridge University Press: Cambridge, UK, 1990. [Google Scholar]
  10. Li, G.; Baker, S.P. Correlates of pilot fatality in general aviation crashes. Aviat. Space Environ. Med. 1999, 70, 305–309. [Google Scholar] [PubMed]
  11. Bazargan, M.; Guzhva, V.S. Impact of gender, age and experience of pilots on general aviation accidents. Accid. Anal. Prev. 2011, 43, 962–970. [Google Scholar] [CrossRef] [PubMed]
  12. Boyd, D.D. Causes and risk factors for fatal accidents in non-commercial twin engine piston general aviation aircraft. Accid. Anal. Prev. 2015, 77, 113–119. [Google Scholar] [CrossRef] [PubMed]
  13. de Sant’Anna, D.A.L.M.; de Hilal, A.V.G. The impact of human factors on pilots’ safety behavior in offshore aviation companies: A brazilian case. Saf. Sci. 2021, 140, 105272. [Google Scholar] [CrossRef]
  14. Shappell, S.A.; Wiegmann, D.A. The Human Factors Analysis and Classification System–HFACS; Civil Aeromedical Institute: Oklahoma City, OK, USA, 2000. [Google Scholar]
  15. Shappell, S.A.; Wiegmann, D.A. US naval aviation mishaps, 1977-92: Differences between single-and dual-piloted aircraft. Aviat. Space Environ. Med. 1996, 67, 65–69. [Google Scholar]
  16. Kelly, D.; Efthymiou, M. An analysis of human factors in fifty controlled flight into terrain aviation accidents from 2007 to 2017. J. Saf. Res. 2019, 69, 155–165. [Google Scholar] [CrossRef]
  17. Rashid, H.; Place, C.; Braithwaite, G.R. Eradicating root causes of aviation maintenance errors: Introducing the AMMP. Cogn. Technol. Work 2014, 16, 71–90. [Google Scholar] [CrossRef]
  18. Rashid, H.; Place, C.; Braithwaite, G. Helicopter maintenance error analysis: Beyond the third order of the HFACS-ME. Int. J. Ind. Ergon. 2010, 40, 636–647. [Google Scholar] [CrossRef]
  19. Li, F.; Chen, C.H.; Zheng, P.; Feng, S.; Xu, G.; Khoo, L.P. An explorative context-aware machine learning approach to reducing human fatigue risk of traffic control operators. Saf. Sci. 2020, 125, 104655. [Google Scholar] [CrossRef]
  20. Qiao, W.; Liu, Y.; Ma, X.; Liu, Y. A methodology to evaluate human factors contributed to maritime accident by mapping fuzzy FT into ANN based on HFACS. Ocean Eng. 2020, 197, 106892. [Google Scholar] [CrossRef]
  21. Madeira, T.; Melicio, R.; Valério, D.; Santos, L. Machine learning and natural language processing for prediction of human factors in aviation incident reports. Aerospace 2021, 8, 47. [Google Scholar] [CrossRef]
  22. Zhang, X.; Mahadevan, S. Ensemble machine learning models for aviation incident risk prediction. Decis. Support Syst. 2018, 116, 48–63. [Google Scholar] [CrossRef]
  23. Xing, G.; Sun, Y.; He, F.; Wei, P.; Wu, S.; Ren, H.; Chen, Z. Analysis of Human Factors in Typical Accident Tests of Certain Type Flight Simulator. Sustainability 2023, 15, 2791. [Google Scholar] [CrossRef]
  24. Stroeve, S.; Kirwan, B.; Turan, O.; Kurt, R.E.; van Doorn, B.; Save, L.; Jonk, P.; de Maya, B.N.; Kilner, A.; Verhoeven, R.; et al. SHIELD Human Factors Taxonomy and Database for Learning from Aviation and Maritime Safety Occurrences. Safety 2023, 9, 14. [Google Scholar] [CrossRef]
  25. Breiman, L. Random forests. Mach. Learn. 2001, 45, 5–32. [Google Scholar] [CrossRef] [Green Version]
  26. Larose, D.T.; Larose, C.D. Discovering Knowledge in Data: An Introduction to Data Mining; John Wiley & Sons: Hoboken, NJ, USA, 2014; Chapters 8–9; pp. 165–208. [Google Scholar]
  27. Hemmati-Sarapardeh, A.; Larestani, A.; Nait Amar, M.; Hajirezaie, S. Intelligent models. In Applications of Artificial Intelligence Techniques in the Petroleum Industry; Gulf Professional Publishing: Brian Romer, Chennai, India, 2020; Chapter 2; pp. 23–50. [Google Scholar]
  28. Pedregosa, F.; Varoquaux, G.; Gramfort, A.; Michel, V.; Thirion, B.; Grisel, O.; Blondel, M.; Prettenhofer, P.; Weiss, R.; Dubourg, V.; et al. Scikit-learn: Machine Learning in Python. J. Mach. Learn. Res. 2011, 12, 2825–2830. [Google Scholar]
  29. Haykin, S. Neural Networks: A Comprehensive Foundation; Prentice Hall: Hoboken, NJ, USA, 1999; Chapters 1 and 4; pp. 23, 178–278. [Google Scholar]
  30. Wu, J.; Chen, X.Y.; Zhang, H.; Xiong, L.D.; Lei, H.; Deng, S.H. Hyperparameter optimization for machine learning models based on Bayesian optimization. J. Electron. Sci. Technol. 2019, 17, 26–40. [Google Scholar]
  31. Settles, B. Active Learning Literature Survey; Technical Report 1648; Department of Computer Sciences, University of Wisconsin-Madison: Madison, WI, USA, 2009. [Google Scholar]
  32. Ranter, H.; Lujan, F.I. Aviation Safety Network. 2016. Available online: https://aviation-safety.net/about/ (accessed on 10 February 2023).
  33. Wiegmann, D.A.; Shappell, S.A. A Human Error Analysis of Commercial AVIATION Accidents Using the Human Factors Analysis and Classification System (HFACS); Technical Report; Office of Aviation Medicine, FAA: Daytona Beach, Florida, USA, 2001. [Google Scholar]
  34. Schmidt, J.; Schmorrow, D.; Hardee, M. A preliminary human factors analysis of naval aviation maintenance related mishap. Proc. Hum. Factors Ergon. Soc. Annu. Meet. 2000, 44, 775–778. [Google Scholar] [CrossRef] [Green Version]
  35. Chen, B.; Deng, W.; Du, J. Noisy Softmax: Improving the Generalization Ability of DCNN via Postponing the Early Softmax Saturation. In Proceedings of the 2017 IEEE Conference on Computer Vision and Pattern Recognition, Honolulu, HI, USA, 21–26 July 2017; IEEE: Piscataway, NJ, USA, 2017; pp. 4021–4030. [Google Scholar]
  36. Castelli, M.; Vanneschi, L.; Largo, Á.R. Supervised Learning: Classification. In Encyclopedia of Bioinformatics and Computational Biology; Ranganathan, S., Gribskov, M., Nakai, K., Schönbach, C., Eds.; Academic Press: Oxford, UK, 2019; pp. 342–349. [Google Scholar]
  37. Zarei, E.; Yazdi, M.; Abbassi, R.; Khan, F. A hybrid model for human factor analysis in process accidents: FBN-HFACS. J. Loss Prev. Process Ind. 2019, 57, 142–155. [Google Scholar] [CrossRef]
Figure 1. The evolution of the SMS through time.
Applsci 13 04069 g001
Figure 2. Structure of a random forest with N trees.
Applsci 13 04069 g002
Figure 3. Architectural graph of a MLP with four layers, of which two are hidden between the input and output layers.
Applsci 13 04069 g003
Figure 4. Schema of the database modeling.
Applsci 13 04069 g004
Figure 5. Confusion Matrixes for Model 1 (left) and Model 2 (right) with RF algorithm (top) and MLP algorithm (bottom). (a) Random Forest, Model 1. (b) Random Forest, Model 2. (c) Neural Network, Model 1. (d) Neural Network, Model 2.
Applsci 13 04069 g005
Figure 6. Accuracy (a) and function loss (b) for Model 2 with MLP algorithm.
Applsci 13 04069 g006
Figure 7. Results for Model 2 with AL after 50 queries performed with confusion matrix (a) and MLP algorithm (b).
Applsci 13 04069 g007
Table 1. Risk matrix [8].
Risk Severity
RiskCatastrophicDangerMajorMinorInsignificant
ProbabilityABCDE
Frequent—55A5B5C5D5E
Occasional—44A4B4C4D4E
Remote—33A3B3C3D3E
Improbable—22A2B2C2D2E
Extremely improbable—11A1B1C1D1E
Table 2. The HFACS and HFACS-ME manually labeled from the contributory causes of the database, with their frequency in the database.
Factor According to HFACS/HFACS-MENumber of Cases
Adverse Mental State73
Adverse Physiological State19
Crew Resource Management11
Dated/Uncertififed Equipment67
Decision Error62
Exceptional Violation20
Fail to Correct Known Problem12
Inaccessible2
Inadequate Design42
Inadequate Documentation36
Inadequate Supervision63
Inappropriate Operations76
Infraction1
Lighting1
Operational Process12
Perceptual Error131
Personal Readiness134
Physical Environment216
Physical/Mental Limitations18
Plan Inappropriate Operation1
Resource Management9
Routine114
Routine Violation39
Rule72
Skill29
Skill-Based Error104
Supervisory Violation15
Technological Environment19
Training4
Uncorrected Problem8
Table 3. Confusion matrix for binary classification.
PredictedTrue Class
Class01
0True NegativeFalse Negative
1False PositiveTrue Positive
Table 4. Classification Report for Model 1.
Type of Learning PrecisionRecallF1-ScoreAccuracy
Random
Forest
ClassNo Fatality0.920.940.930.90
Fatality0.840.770.80
AveragesMacro0.880.860.87
Weighted0.890.900.89
Multilayer
Perceptron
ClassNo Fatality0.890.920.900.83
Fatality0.750.590.66
AveragesMacro0.800.760.77
Weighted0.830.830.83
Table 5. Comparison between RF and AL for predicting sparse labels for Model 2.
Type of LearningClassesPrecisionRecallMacro F1-Score
RandomBelow 50%0.430.180.41
Forest50%–<50%0.210.21
ActiveBelow 50%0.750.380.72
Learning50%–<50%0.750.31
Disclaimer/Publisher’s Note: The statements, opinions and data contained in all publications are solely those of the individual author(s) and contributor(s) and not of MDPI and/or the editor(s). MDPI and/or the editor(s) disclaim responsibility for any injury to people or property resulting from any ideas, methods, instructions or products referred to in the content.

