Article

Failure Modelling of CP800 Using Acoustic Emission Analysis

Institute of Forming Technology and Machines (IFUM), Leibniz Universität Hannover, 30823 Garbsen, Germany
*
Author to whom correspondence should be addressed.
Appl. Sci. 2023, 13(6), 4067; https://doi.org/10.3390/app13064067
Submission received: 6 March 2023 / Revised: 17 March 2023 / Accepted: 21 March 2023 / Published: 22 March 2023

Abstract

:
Advanced high-strength steels (AHHS) are widely used in many production lines of car components. For efficient design of the forming processes, numerical methods are frequently applied in the automotive industry. To model the forming processes realistically, exact material data and analytical models are required. With respect to failure modelling, the accurate determination of failure onset continues to be a challenge. In this article, the complex phase (CP) steel CP800 is characterised for its failure characteristics using tensile tests with butterfly specimens. The material failure was determined by three evaluation methods: mechanically by a sudden drop in the forming force, optically by a crack appearing on the specimen surface, and acoustically by burst signals. As to be expected, the mechanical evaluation method determined material failure the latest, while the optical and acoustical methods showed similar values. Numerical models of the butterfly tests were created using boundary conditions determined by each evaluation method. A comparison of the experiments, regarding the forming force and the distribution of the equivalent plastic strain, showed sufficient agreement. Based on the numerical models, the characteristic stress states of each test were evaluated, which showed similar values for the mechanical and optical evaluation method. The characteristic stress states derived from the acoustical evaluation method were shifted to higher triaxialities, compared to the other methods. Matching the point in time of material failure, the equivalent plastic strain at failure was highest for the mechanical evaluation method, with lower values for the other two methods. Furter, three Johnson–Cook (JC) failure models were parametrised and subsequently compared. The major difference was in the slope of the failure models, of which the optical evaluation method showed the lowest slope. The reasons for the differences are the different stress states and the different equivalent plastic strains due to different evaluation areas.

1. Introduction

With electro mobility, lightweight construction continues to have a high priority in production technology. Electric cars, for example, are designed to be as light as possible in order to maximise the range of the battery. Meanwhile, the demand on comfort and passenger safety has not declined, leading to more systems being installed in the car and contributing to an increase in weight. As a result, AHSS such as CP800 are still frequently used to replace conventional steel grades and increase lightweight designs [1].
Nowadays, finite element simulation is used standardly for efficient process and component development. This can significantly reduce cost- and time-intensive experimental tests, as well as reworking of the tools. For the correct numerical modelling of a process, material data sets are needed. The data sets are usually described with suitable analytical functions and implemented in the numerical model. Depending on which aspects are to be predicted numerically, different material data sets are required. In forming technology, the flow and failure behaviours are often necessary to describe the forming processes. For conventional sheet metal forming processes, flow curves and forming limit diagrams are determined experimentally [2].
Since multistage or shear-stressed processes exceed the range of validity of strain-based failure models such as the forming limit diagram, stress-state-based failure models are increasingly used. Unfortunately, there is still no standardised procedure for the stress-state-based material failure characterisation, so different specimen geometries and evaluation methods are used to parametrise various failure models. Frequently, tensile tests with different specimen geometries are performed and evaluated by means of an optical measuring system [3].
Wilson-Heid et al. characterised the failure behaviour of additively manufactured stainless steel 316L and titanium alloy Ti-6Al-4V with varying pore sizes [4]. For both materials’ cylindrical notched tensile, butterfly shear tensile and biaxial punch tests were performed and tracked using an optical measuring system. The experimental tests were numerically modelled to parametrise and compare the failure models from Mohr–Coulomb [3] as well as Hosford–Coulomb [5] for different pore sizes. A strain-rate-dependent Hosford–Coulomb model was developed by Erice et al. in [6] and parametrised for the AHSS sheets DP980, CP980, and CP1120. Uniaxial tensile, notched tensile, central hole tensile, smiley shear tensile, and punch specimens were tested using optical measurement and numerically mapped for the model parametrisation. In [7] Hong et al. investigated the fracture behaviour of the aluminium alloy 6061 from an extruded tube using circular arc, shear, arc-shaped notched, and V-shaped notched tensile specimens. The tests were performed using optical measurement, numerically modelled, and evaluated to fit the JC failure model [8]. The hot formability of aluminium alloy 7075 sheet material was studied by Wang et al. [9]. Tempered tensile tests with uniaxial tension, notched tension, and shear tension specimen were performed as well as measured optically. Numerical models of the tests were created and a temperature as well as strain rate dependent JC failure model was determined. Xu et al. also performed uniaxial tensile, shear tensile, holed tensile, grooved tensile, and notched tensile tests with different notch radii for a 7075 sheet material [10]. The specimens were taken in different rolling directions, optically measured while testing, and numerically mapped. Based on the simulations, the anisotropic failure model from Lou and Yoon was calibrated [11].
The use of optical measuring and digital image correlation is common to all presented research. The optical measuring system offers the following advantages: the failure location can be precisely determined and, with sufficiently high measuring frequency, the moment of failure can be accurately detected. With this method, the material failure is determined macroscopically on the specimen surface. However, the material usually starts to fail from the inside through microscopic cracks [12]. With ongoing deformation more microcracks form and merge until material decohesion occurs. Using acoustic measuring systems, it is possible to determine the failure initiation inside the specimen [13]. Hence, acoustic emission analyses offer great potential to improve failure characterisation.
Therefore, in this paper the flow and the failure behaviour of the steel CP800 will be experimentally characterised. The failure behaviour tensile tests with butterfly specimen, which were developed at the IFUM, were performed for a wide range of stress states. Beside an optical measurement system, the tests were monitored in parallel with an acoustic measurement system as a novelty. The failure onset of the material was evaluated using three methods based on force, optical, and acoustic data. Using the three evaluation methods, the butterfly tests are numerically calculated and the JC failure model is parametrised for each evaluation method based on the simulations. The three failure models are subsequently compared to show the influence of the evaluation method on the course of each failure model. Hence, the paper combines the two different research areas of “acoustic emission analysis” and “failure modelling”, which is unique so far.

2. Materials and Methods

2.1. Flow Behaviour

The investigated steel is the complex phase steel CP800, also known as HCT780C, in 1.6 mm sheet thickness from voestalpine Stahl GmbH (Linz, Austria). The microstructure of the steel consists of different amounts of ferrite, bainite, and martensite. Table 1 displays the chemical composition [14]. Metallographic examinations of the delivered material were carried out to analyse the microstructure. To prepare cross sections, specimens were cut from the sheet metal using water jet cutting. The specimens were then embedded in epoxy resin and ground using 2000 mm, 1200 mm, and 500 mm grit SiC paper. Afterwards, the specimens were polished with diamond paste of grit size 0.003 mm and 0.001 mm. A 4 wt% alcoholic nitric acid was used at room temperature for 20 s to enable light microscopic images of the microstructure. For imaging, the light microscope Polyvar Met 66 from Reichert–Jung (Depew, NY, USA) was used.
To characterise the flow behaviour of the CP800, tensile tests in rolling direction (RD), in 45°, and in transverse direction (TD) were performed according to DIN 10275 [15]. The tests were conducted with the tensile testing machine S100/ZD from DYNA-MESS Prüfsysteme GmbH (Aachen, Germany) at room temperature for the quasistatic forming speed of 0.02 mm/s. The forming force was measured using the tensile testing machine and the displacements using the optical measuring system Aramis from Carl Zeiss GOM Metrology GmbH (Braunschweig, Germany). For the optical measurement, a stochastic pattern was applied to the surface of the specimen. It consisted of a white primer with black speckles created with a spray can, as suggested by DIN 12004 for the optical determination of forming limit in sheet metals [16]. Each test was repeated five times to identify outliers and achieve statistical validation. Based on the experimental results, a uniaxial flow curve was calculated using the conventional methods for determining the true stress and the true strain from the forming force and the displacement [17]. The begin of plastic deformation was calculated using the 0.2% offset method for determining the yield strength [17]. To extend the flow curve from the tensile test for higher equivalent plastic strains, hydraulic bulge tests were executed in accordance to DIN 16808 [18]. For the bulge tests, the hydraulic press Dunkes HD 250 from S. DUNKES GmbH Maschinenfabrik (Kirchheim, Germany) and the optical measuring system Aramis were used. As for the tensile tests, a stochastic pattern was applied on the surface of the bulge test’s specimen. Based on the experimental results, the biaxial flow curves were calculated according to DIN 16808 and transformed to the uniaxial stress state using the common approach to equivalent plastic work [19]. By using the extended flow curves, enough experimental data were available to parametrise the commonly used Swift extrapolation approach [20]. The Swift extrapolation approach
k f , S w i f t = A × ( B + ε p l ) C
describes the flow stress k f , S w i f t as a function of the equivalent plastic strain ε p l , whereas A , B , and C are material parameters [21]. Using a solver, the material parameters can be determined by the data sets.
To model the anisotropic material behaviour of the CP800, the tensile tests in RD, 45°, and TD were analysed further according to DIN 10113 to determine the anisotropy coefficients [22]. Using the anisotropy coefficients r 0 , r 45 , as well as r 90 , the Hill48 parameters
F = r 0 r 90 × 1 + r 0 ; G = 0.5 × 1 + 1 r 0 1 + r 0 ; H = 0.5 × 1 + r 0 1 1 + r 0 ; N = 1.5 × 1 + 2 r 45 × ( r 0 + r 90 ) 3 r 90 × 1 + r 0
were calculated. The Hill48 parameters L and M were set to 1.5. Further on, the parameters were used to model the yield function suggested by Hill
F × σ 22 σ 33 2 + G × ( σ 33 σ 11 ) 2 + H × σ 22 σ 33 2 + 2 × L × σ 23 2 + 2 × M × σ 31 2 + 2 × N × σ 12 2 = 1
with the tensile yield stresses σ 11 , σ 22 , as well as σ 33 and the shear yield stresses σ 12 , σ 23 , as well as σ 31 [23].

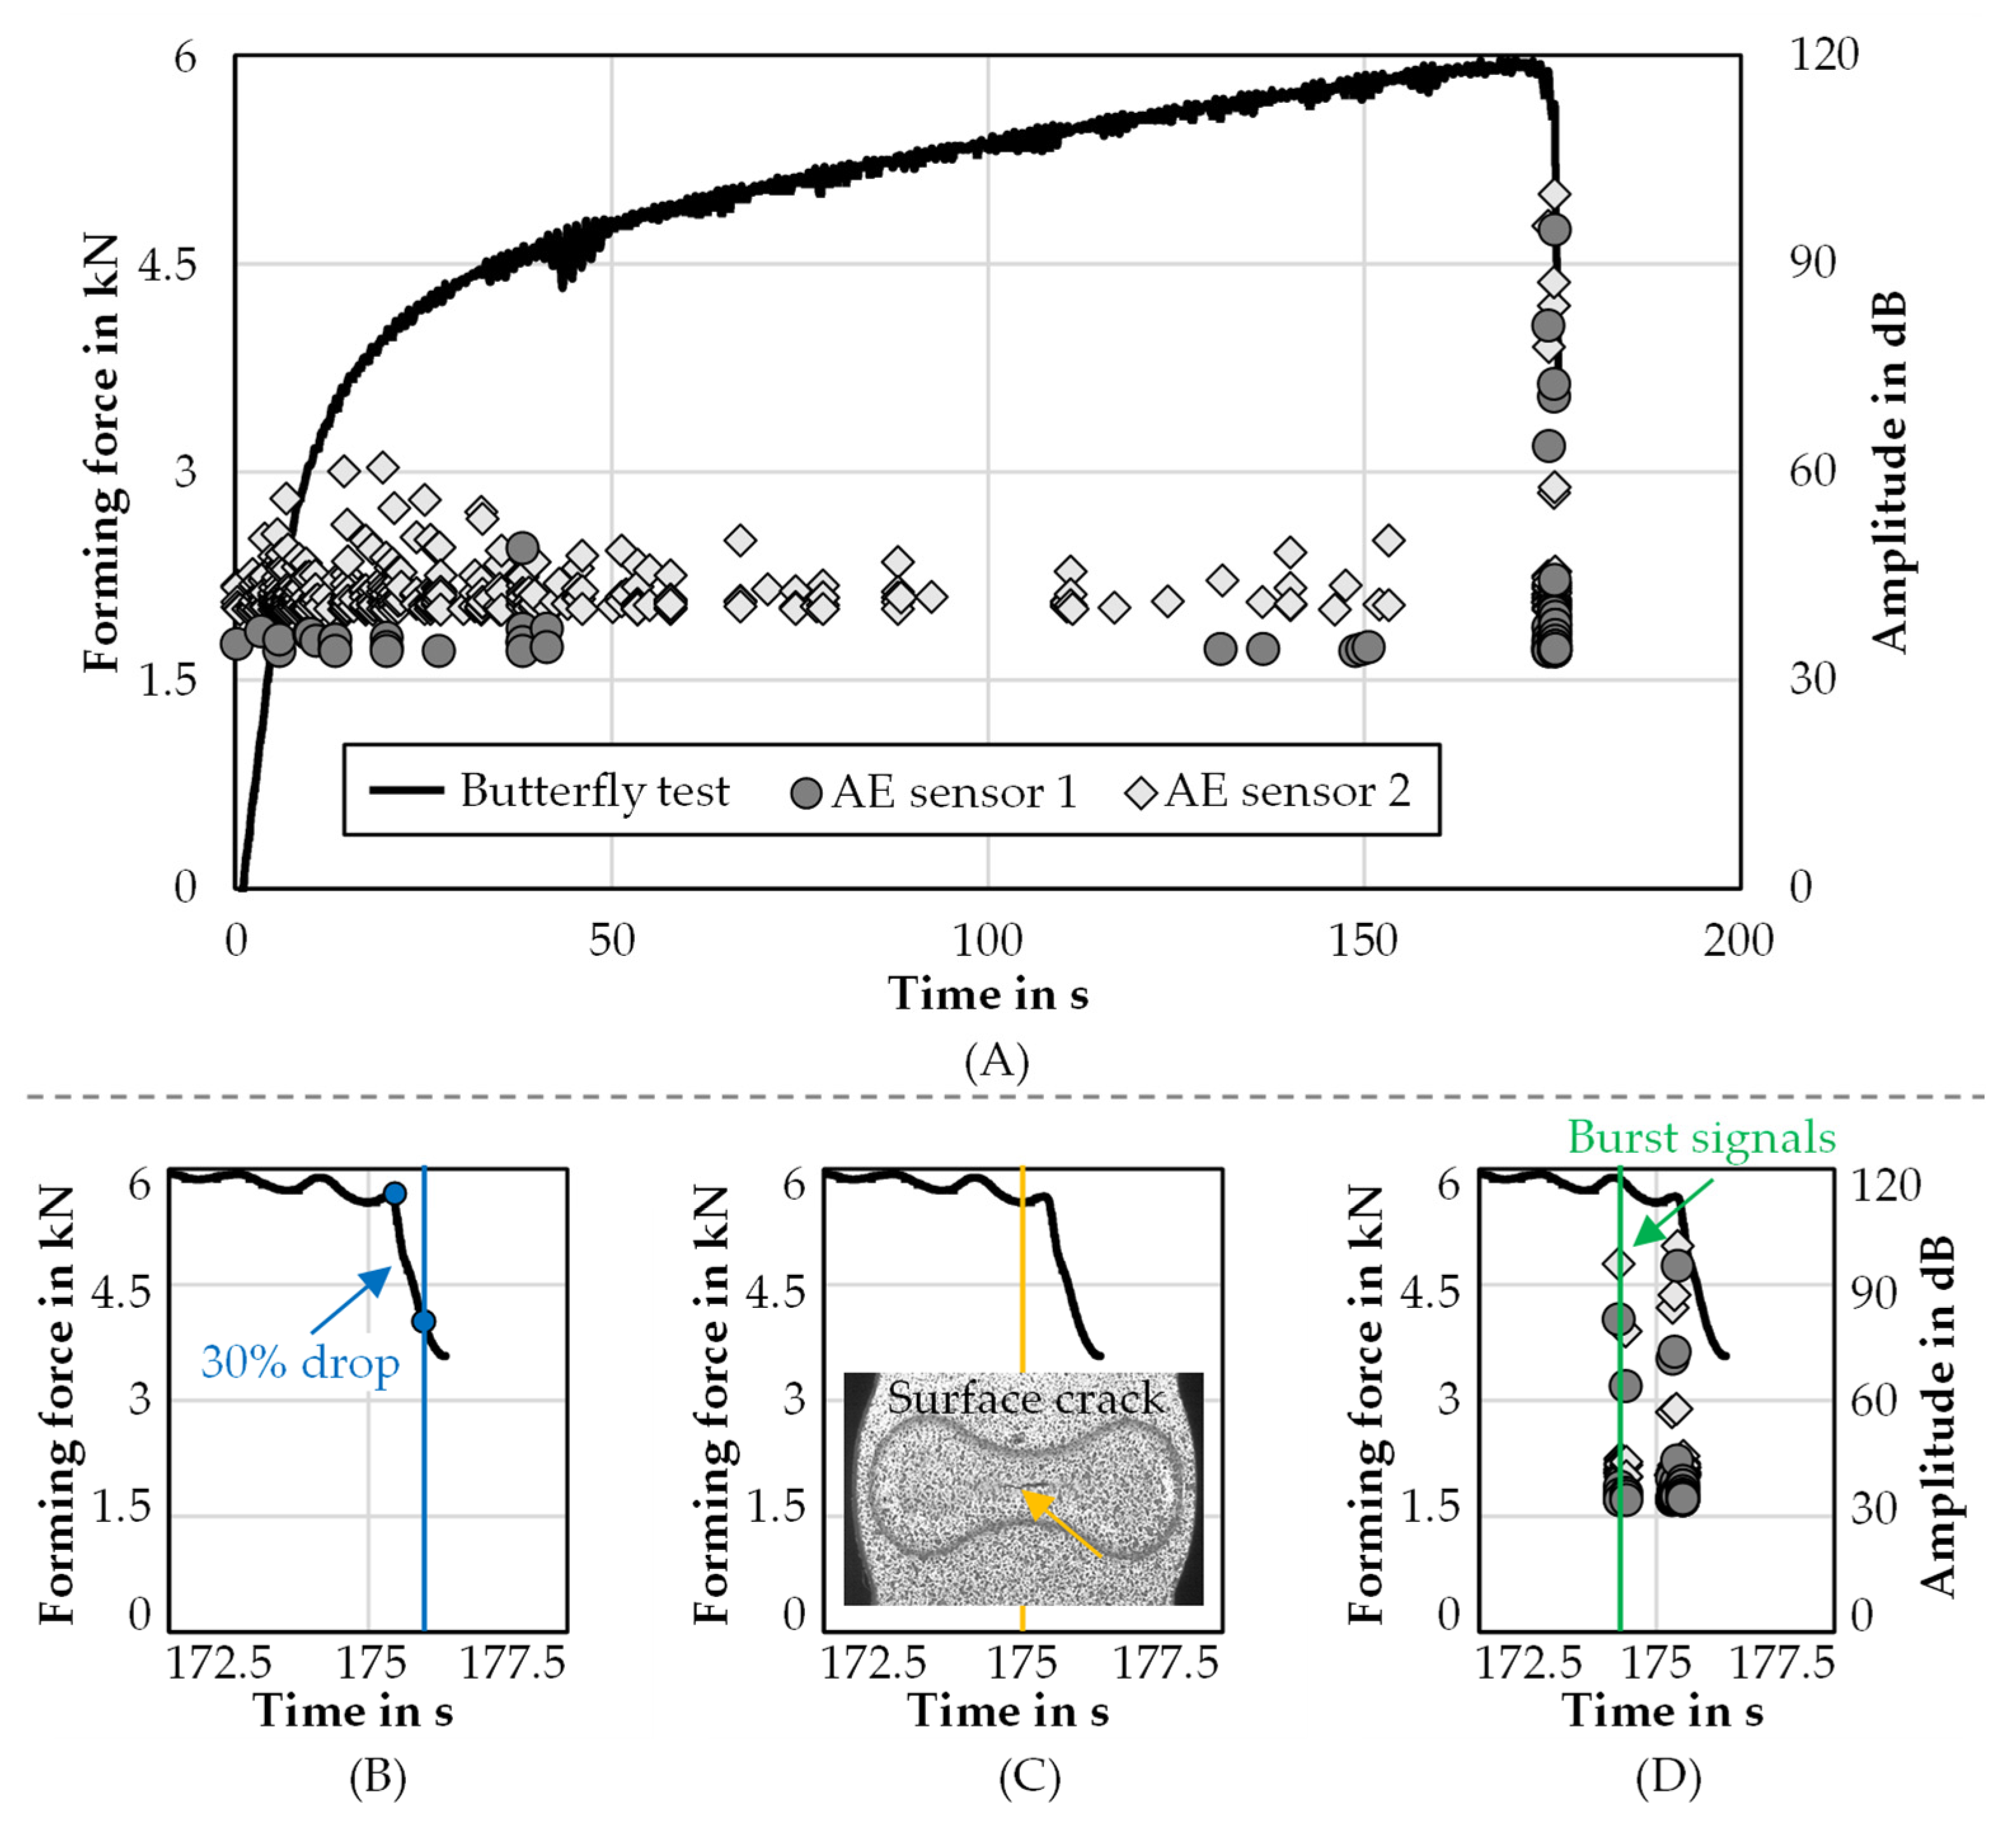
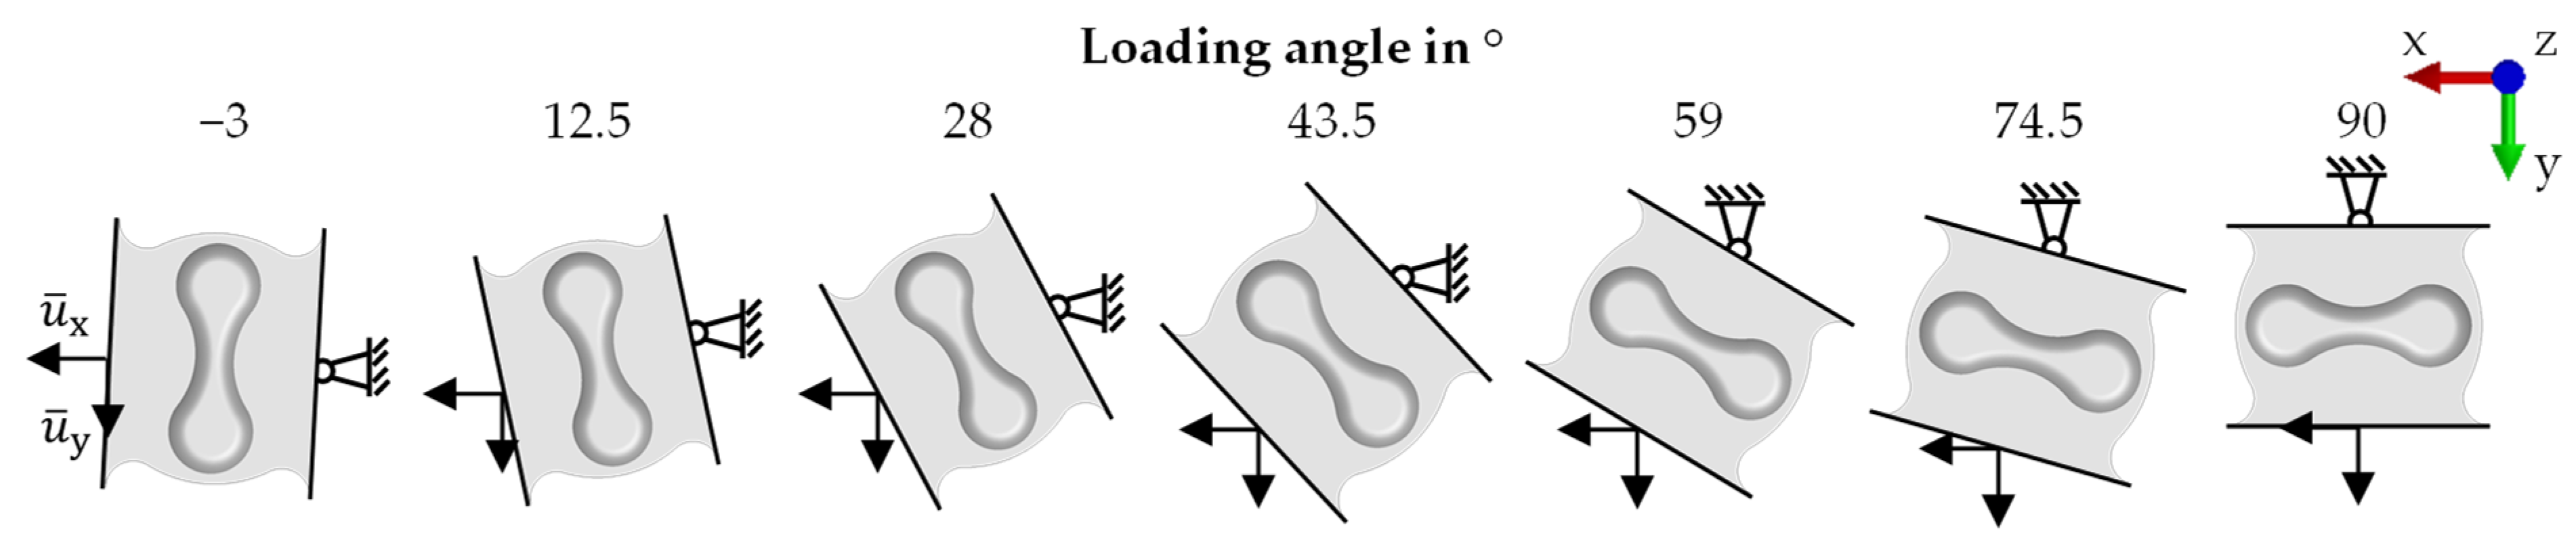
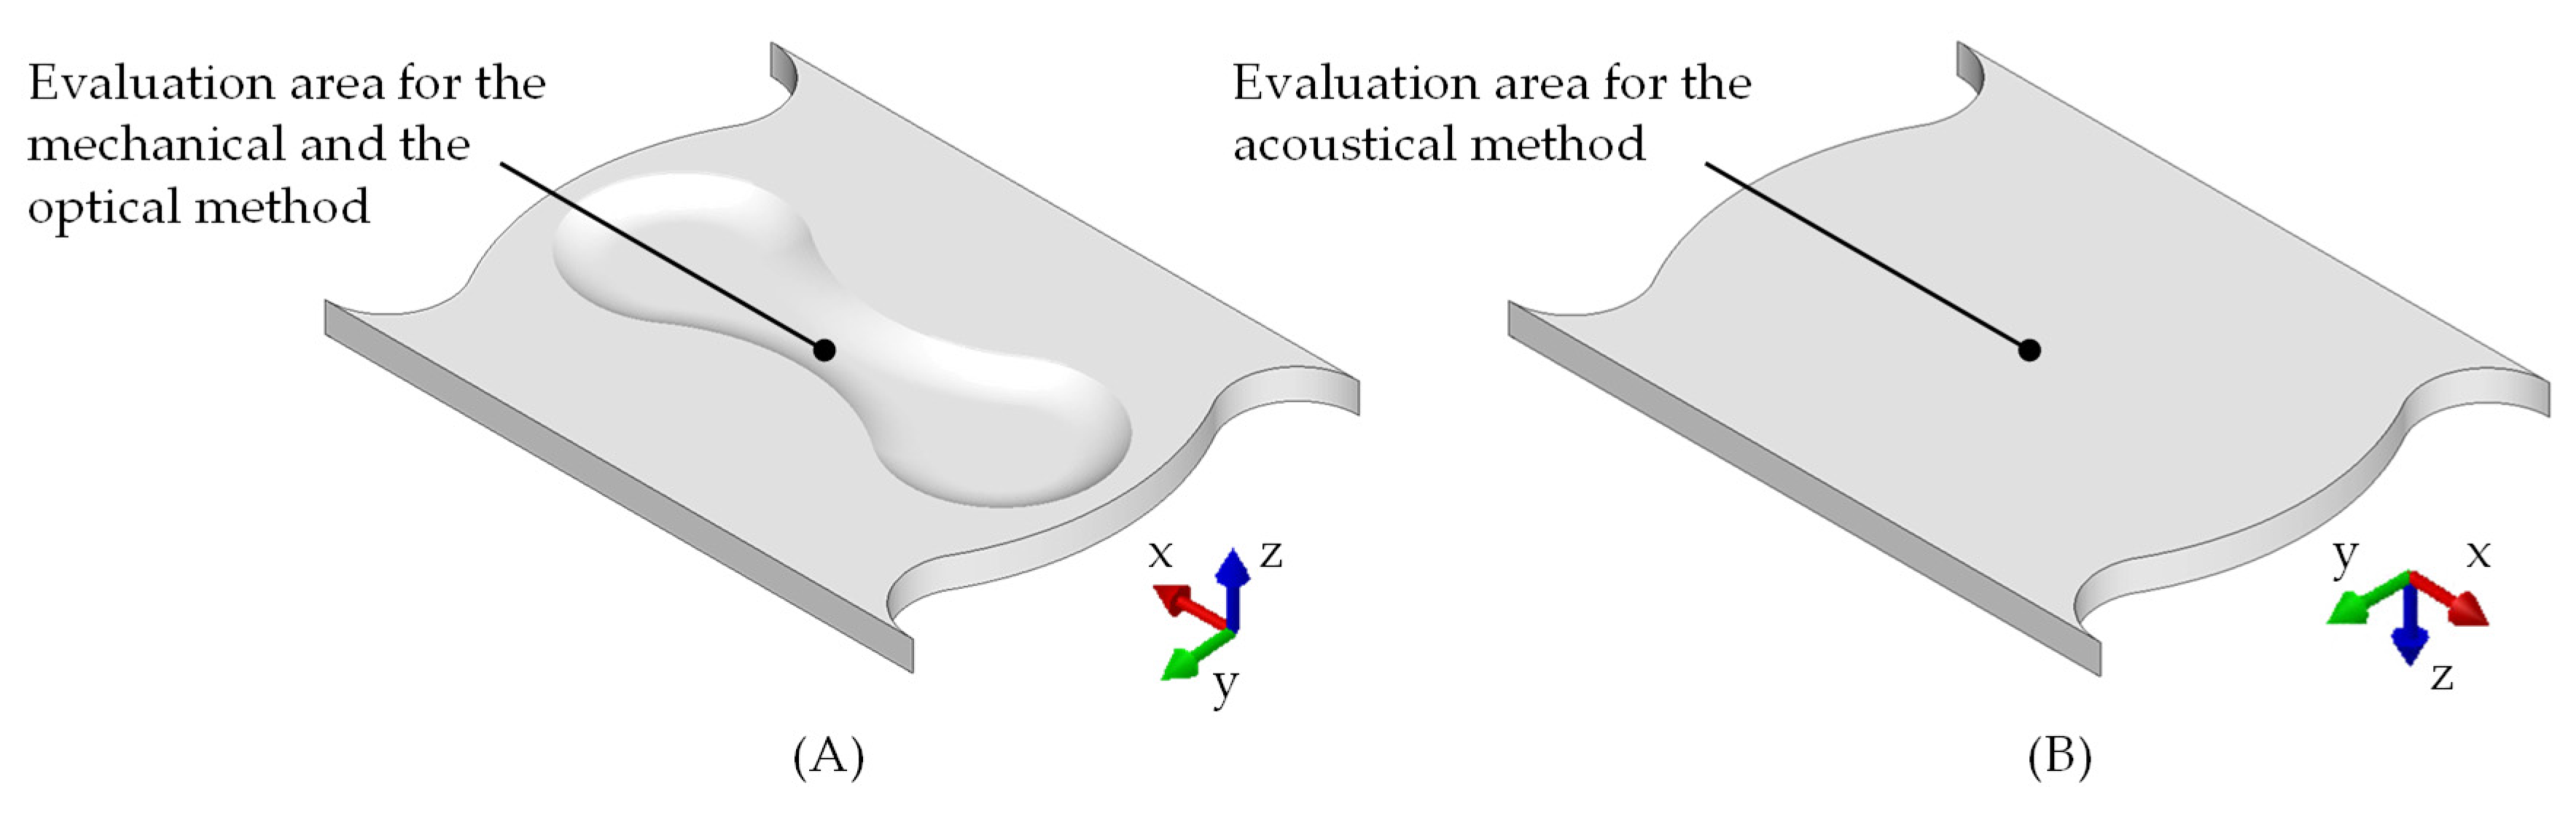
2.2. Failure Behaviour

For the characterisation of the failure behaviour of the CP800, experimental investigations with butterfly specimens were performed. The butterfly specimen and a close-up of the investigation area with its unique shape are shown in Figure 1A. The RD and TD of the specimen are indicated in the figure. The test setup shown in Figure 1B is installed in the tensile testing machine S100/ZD; the specimen can be tested under different loading angles at 15.5° intervals, varying the stress state in the investigation area. Loading angles from −3° to 90° can be induced to create stress states from shear stress to uniaxial tension. Seven loading angles were tested with a quasistatic forming speed of 0.02 mm/s at room temperature. For statistical validity, each test was performed five times. While testing, the forming force was measured by the tensile testing machine S100/ZD. The displacements in x- and y-direction of the butterfly specimens were tracked with the optical measuring system Aramis. Therefore, a stochastic pattern was applied on the investigation area of the butterfly specimens, as also shown in Figure 1A. Further, the acoustic emissions of the butterfly specimens during the tests were recorded using the acoustical measuring system AMSY-6 from Vallen Systeme GmbH (Wolfratshausen, Germany). A more detailed description of the test setup is presented by Stockburger et al. in [24].
The specimen failures are evaluated and compared with three evaluation methods: a mechanical, an optical, and an acoustical evaluation method. For an overview, a measured forming force and amplitude-over-time curve is shown in Figure 2A. The mechanical method determined the failure of the specimen by a sudden drop in the forming force over a short time period, as shown in Figure 2B. According to the optical method displayed in Figure 2C, the failure initiation time is derived from the images of the investigation area of the butterfly specimens from the optical measuring system. Using the acoustical method, the material failure is obtained by clearly recognisable burst signals, as demonstrated in Figure 2D. Based on the three evaluation methods, three different failure initiation times and, hence, three sets of failure displacements in x- and y-direction were generated for each butterfly specimen.
In order to determine the triaxiality, normalised Lode angle, and equivalent plastic strain for the parametrisation of a failure model, the butterfly tests were numerically mapped. The average failure displacements in x-direction u x and in y-direction u y from the five experiments were used as boundary conditions in the numerical models, as shown in Figure 3. The models were created in LS-PrePost for each evaluation method and each loading angle. Only the investigation area of the butterfly specimen was modelled as a half using the symmetry axis in z-direction. For each loading angle, one side of the specimen was fixed by a set of nodes and the other side was moved in x- as well as y-direction by a set of nodes. The forming speed was set to 0.02 mm/s, as in the experiments. Using hexahedron elements (constant stress solid elements) with an element edge length of 0.1 mm, the geometries were discretised. To model the material behaviour of the CP800, the material card “Mat_103_Anisotropic_Viscoplastic” was used. Density, young’s modulus and Poisson’s ratio were set according to the standard data to 7.85 × 10⁻⁹ ton/mm3, 2.1 × 10⁵ MPa and 0.3. For the flow behaviour, the extrapolated flow curve from the Swift approach and the parametrised Hill48 yield criterion were used. According to the loading angle, the RD of the butterfly specimen was adjusted in the material card. The calculation of the model was performed implicitly using the LS-Dyna Solver R12.0 (parallel multifrontal sparse solver) with double precision and hourglass control.
For the evaluation of the triaxiality, normalised Lode angle, and equivalent plastic strain, the models of the mechanical and optical evaluation methods were analysed on the surface nodes of the investigation area in the middle of the unique shape, as shown in Figure 4A. The evaluation area was placed there since the butterfly specimen failed in the same region in the tests. For the acoustical evaluation method, the material failure was assumed to be in the material core and therefore analysed inside the specimen, as shown in Figure 4B. For the three evaluation methods, the equivalent plastic strain was plotted as a function of the triaxiality and as a function of the normalised Lode angle. By using the equivalent plastic strain and the characteristic values of the triaxiality, a data set was available to parametrise the widely used JC failure model [25]. The JC failure model
ε f , J C = D 1 + D 2 × e D 3 × η
Describes the equivalent failure strain ε f , J C as a function of the triaxiality η with the material specific parameters D 1 , D 2 , and D 3 [8]. Finally, the JC failure models of the three evaluation methods were compared.

3. Results and Discussion
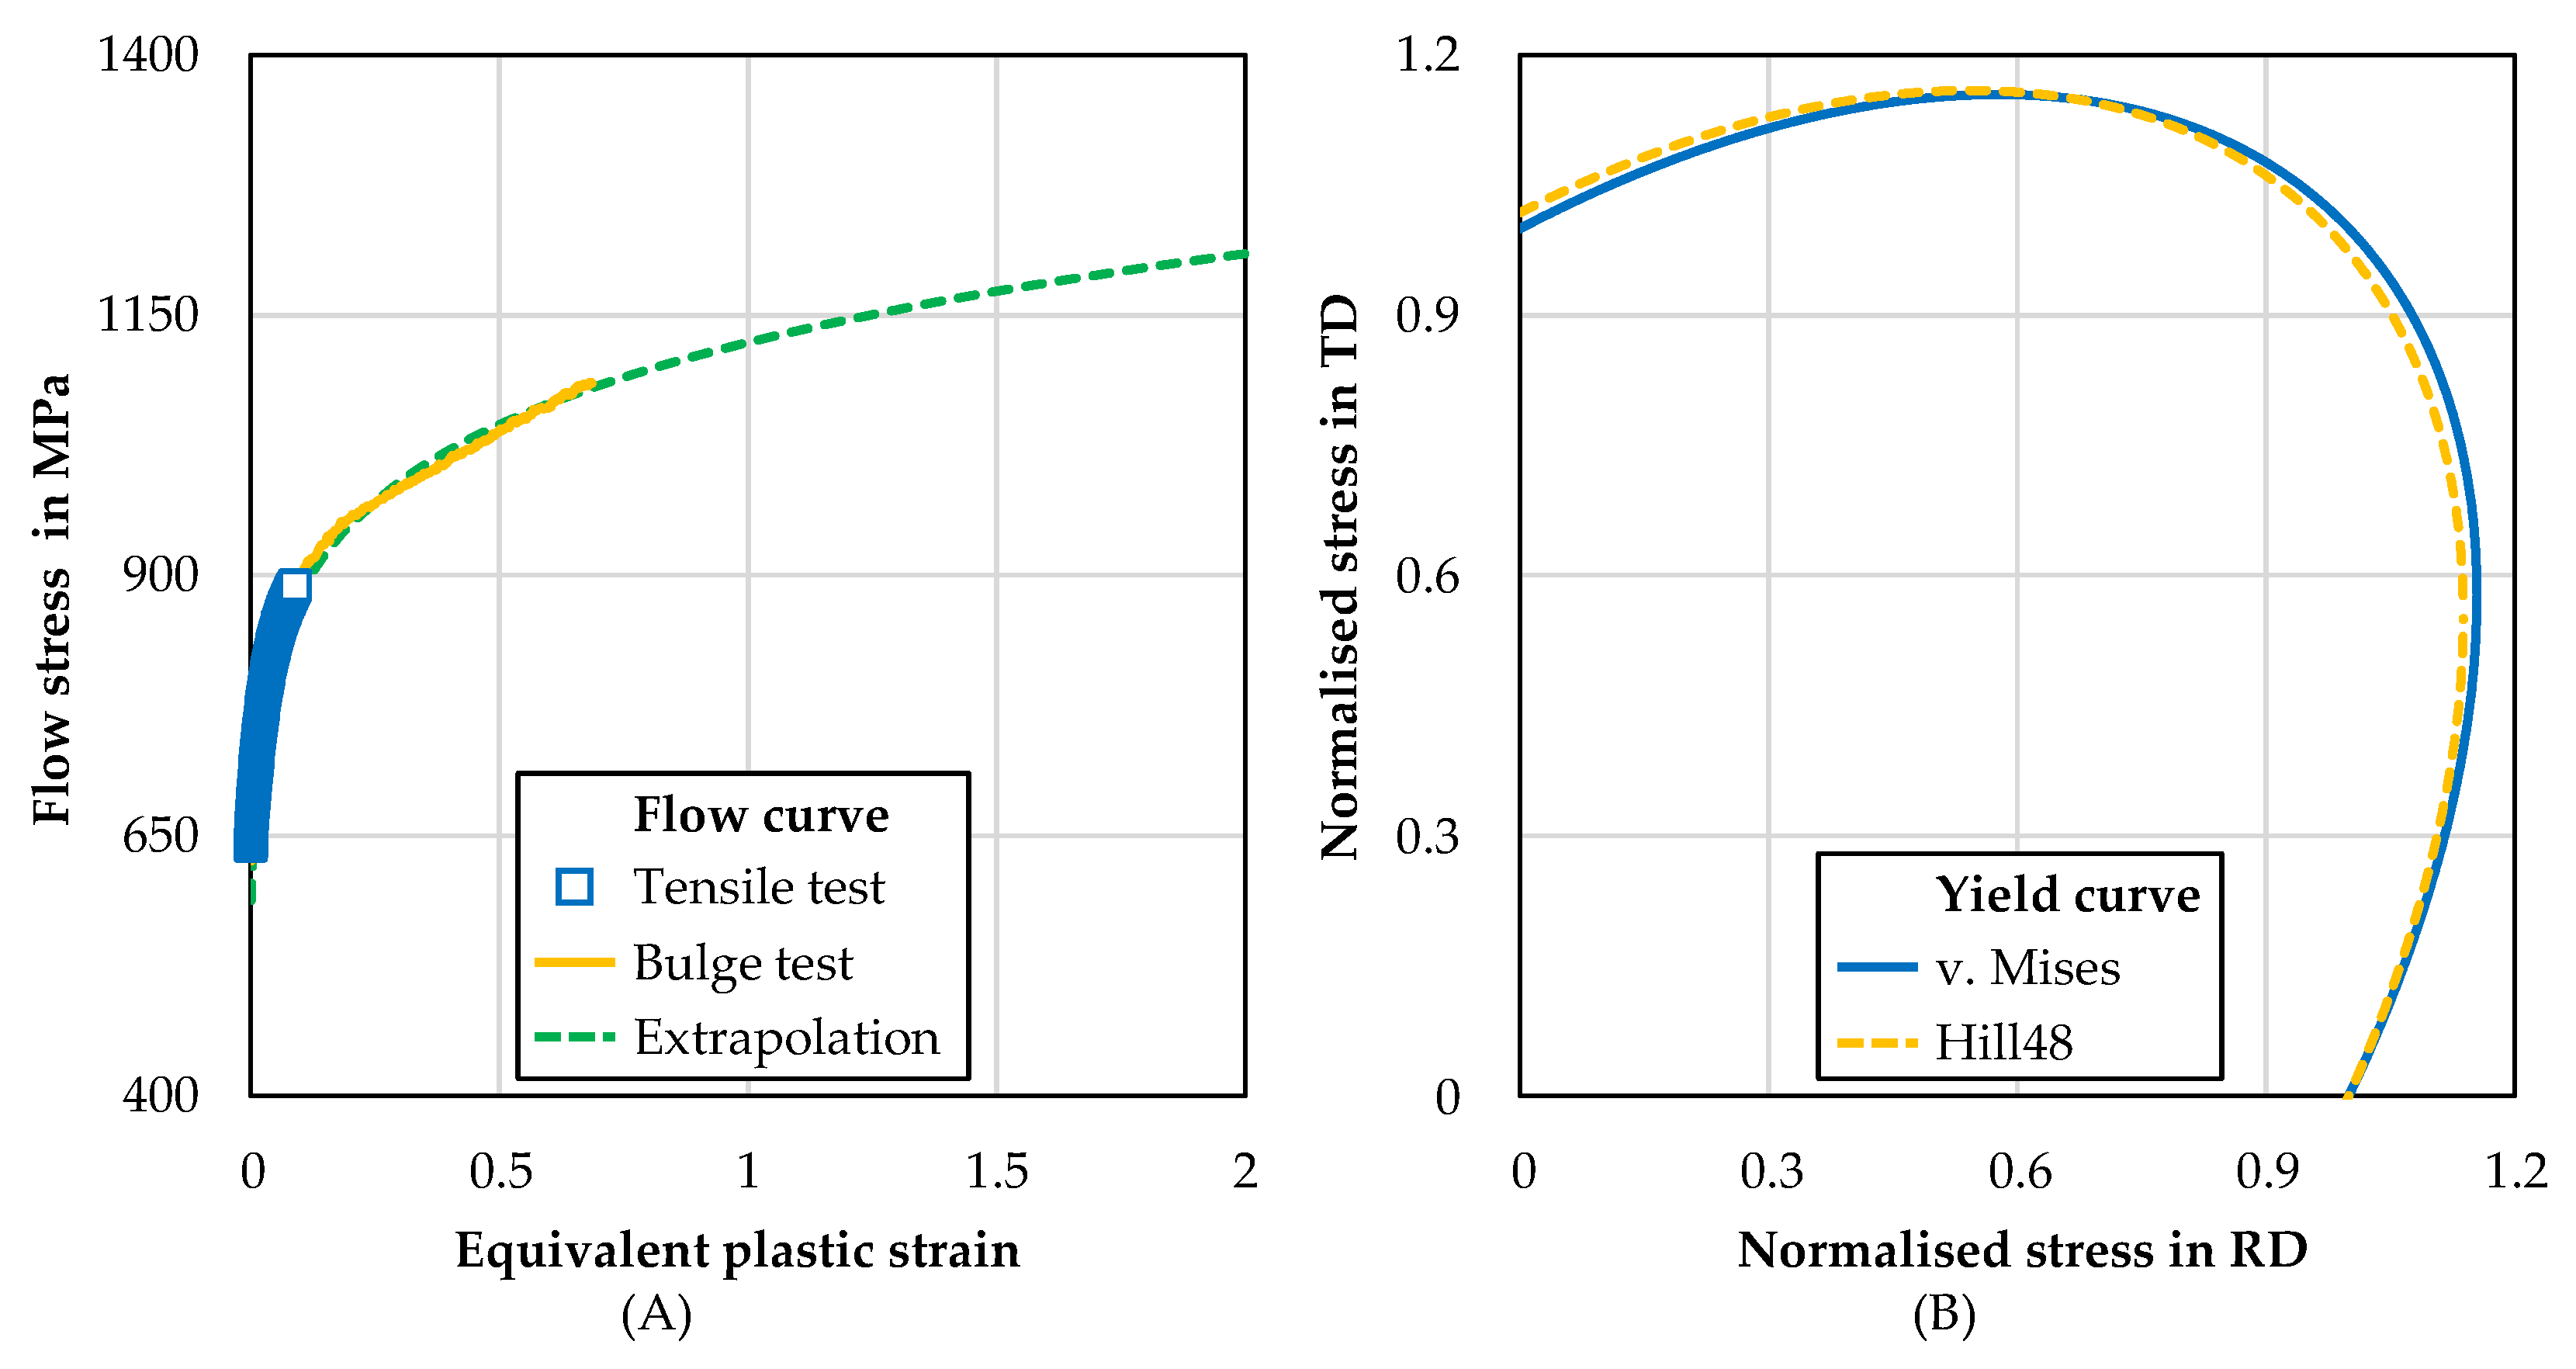
3.1. Flow Behaviour

A microscopic cross section image of the used CP800 steel is shown in Figure 5A with a close-up view in Figure 5B. The TD and normal direction (ND) are indicated. Due to its chemical composition and the hot rolling process, the complex phase steel CP800 has an extremely fine microstructure, as visible in Figure 5A. The diameters of the grains are in the range of 1–4 µm. The CP800 consists of a balanced amount of bainite and ferrite with a low amount of evenly distributed martensite 1–2% [26]. The white regions in the microscopic images are ferrite (F) due to the reaction with the acid, and the brown regions are bainite (B) with martensite (M), which are not affected by the etching [26].
Figure 6A shows the middle flow curve of the five recorded flow curves derived from the tensile test in RD of CP800. As expected, the maximum of the equivalent plastic strain is only 0.09. Using the data from the bulge test, the flow curve can be extended to an equivalent plastic strain of 0.69, as also shown in Figure 6A. Based on the experimental results, the Swift extrapolation approach was fitted using the least-squares method and a Generalized Reduced Gradient Nonlinear Solver. The coefficient of determination for the fitting is 99.34%. Based on the tensile tests in RD, 45°, and TD, the Hill48 parameters are calculated. In Figure 6B, the yield curves according to v. Mises and Hill48 are shown. Since the yield curve according to Hill48 is similar to the v. Mises yield curve, only a slight anisotropy of the material can be detected. The coefficients of the Swift extrapolation approach and the Hill48 parameters are summarised in Table 2 for the CP800.

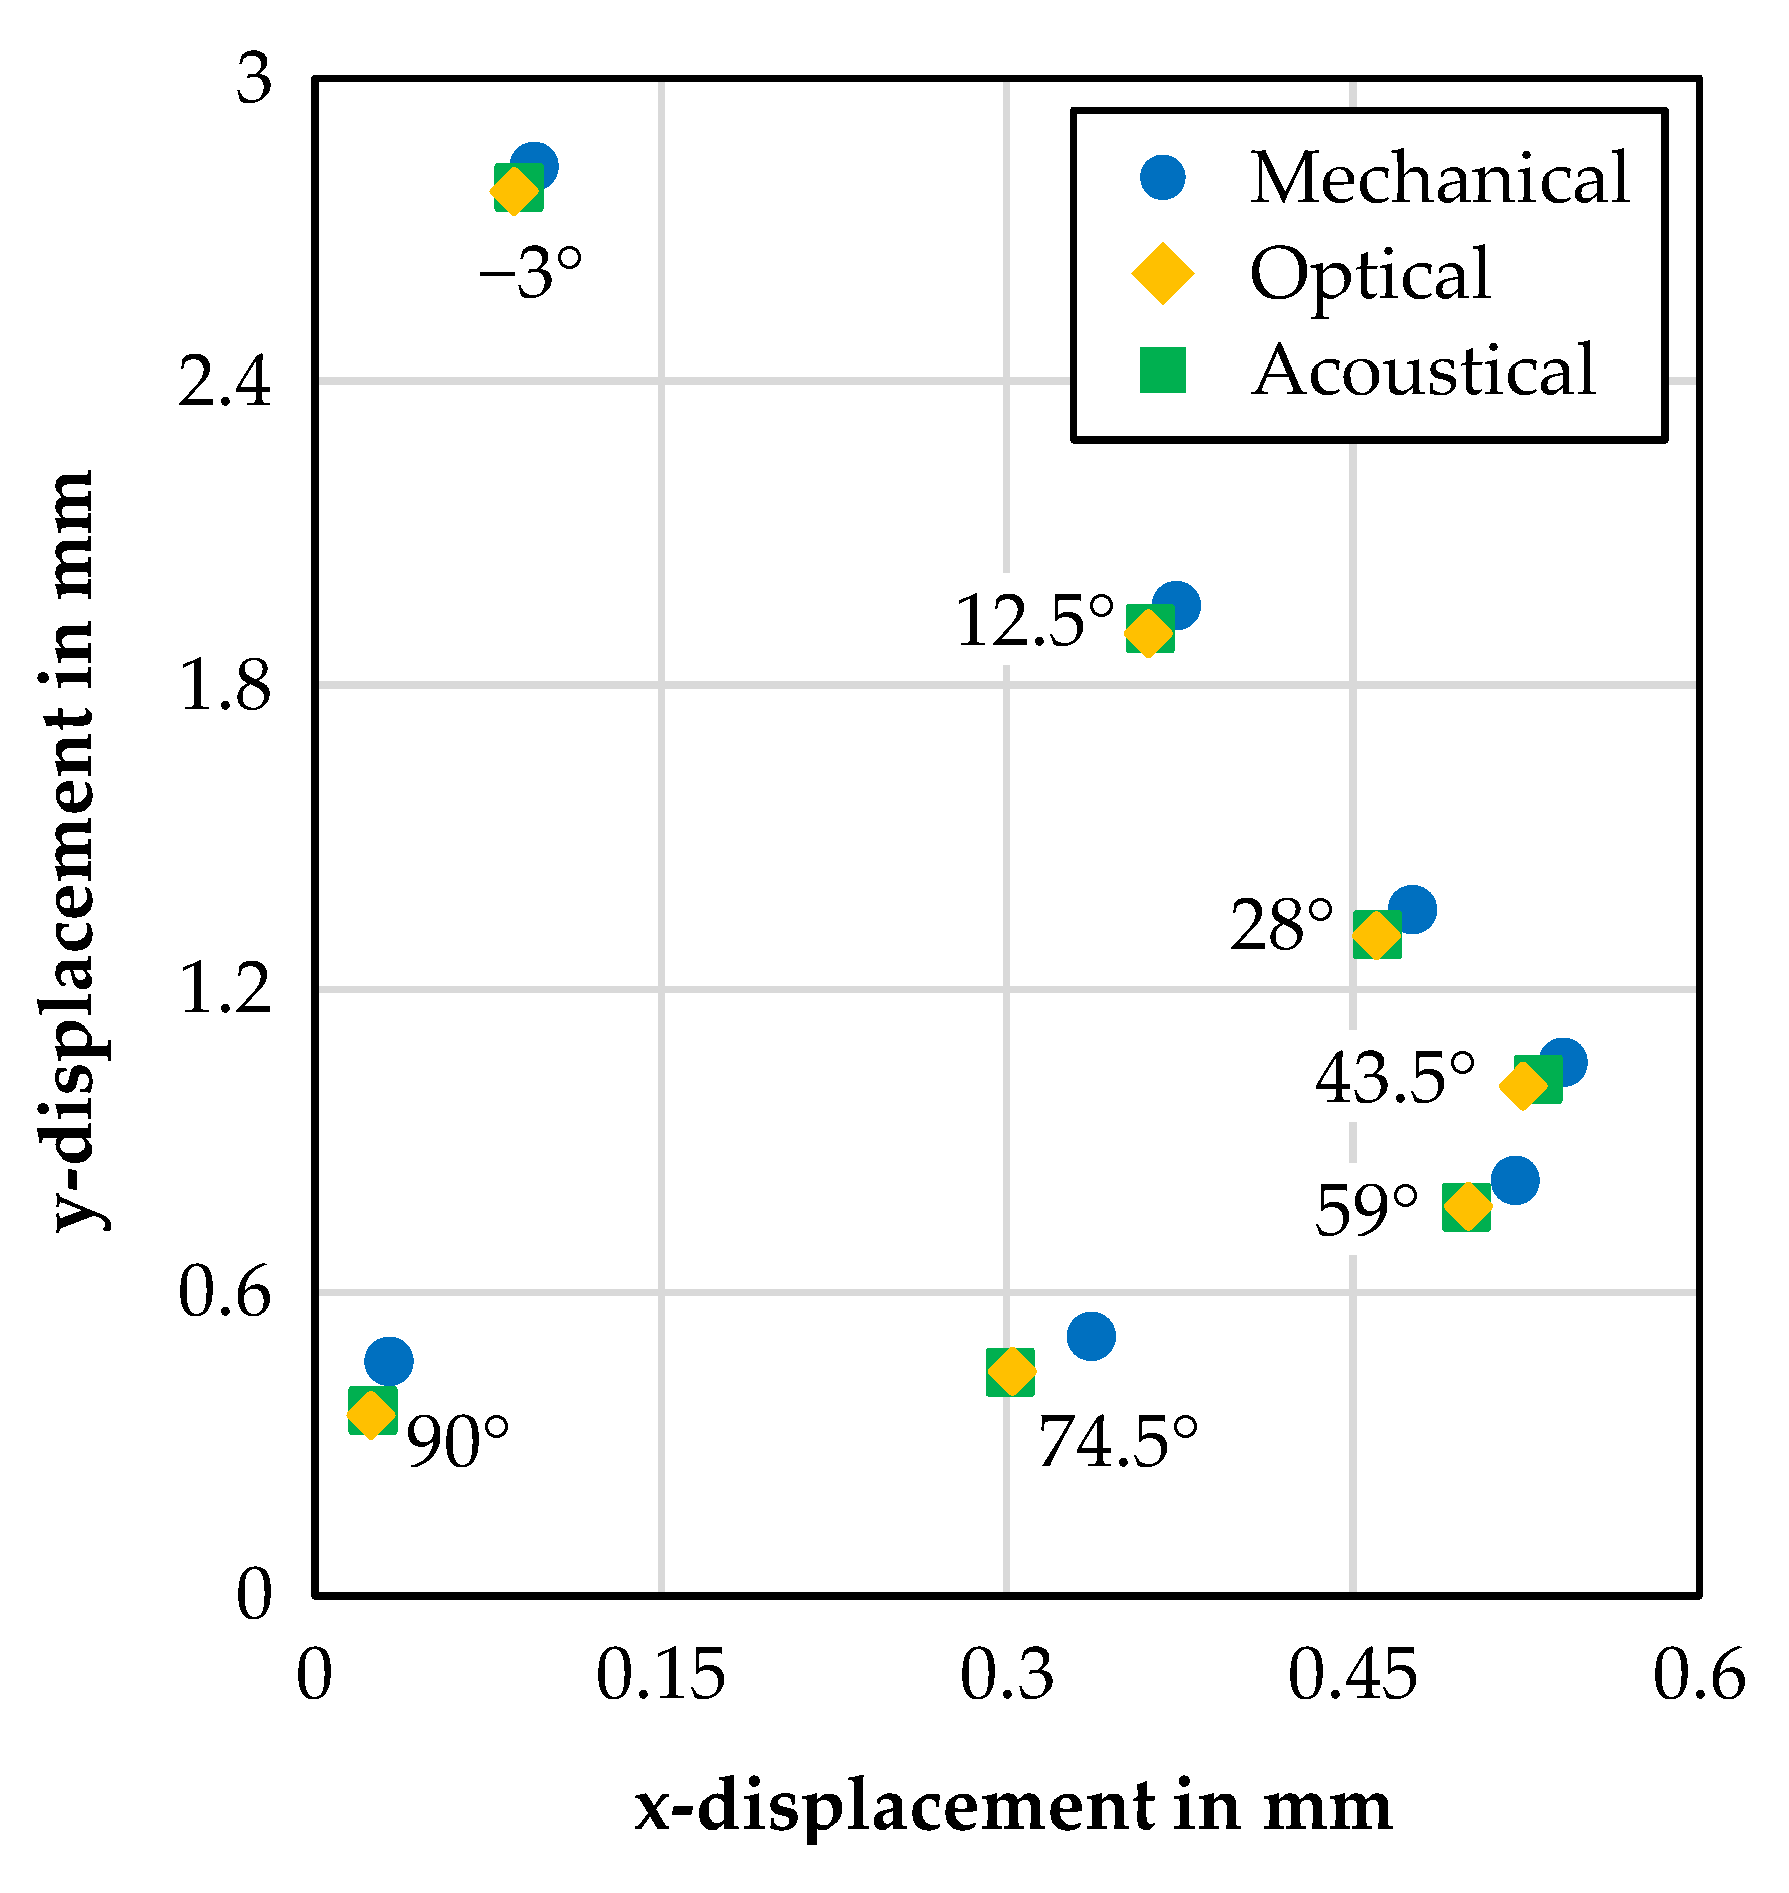
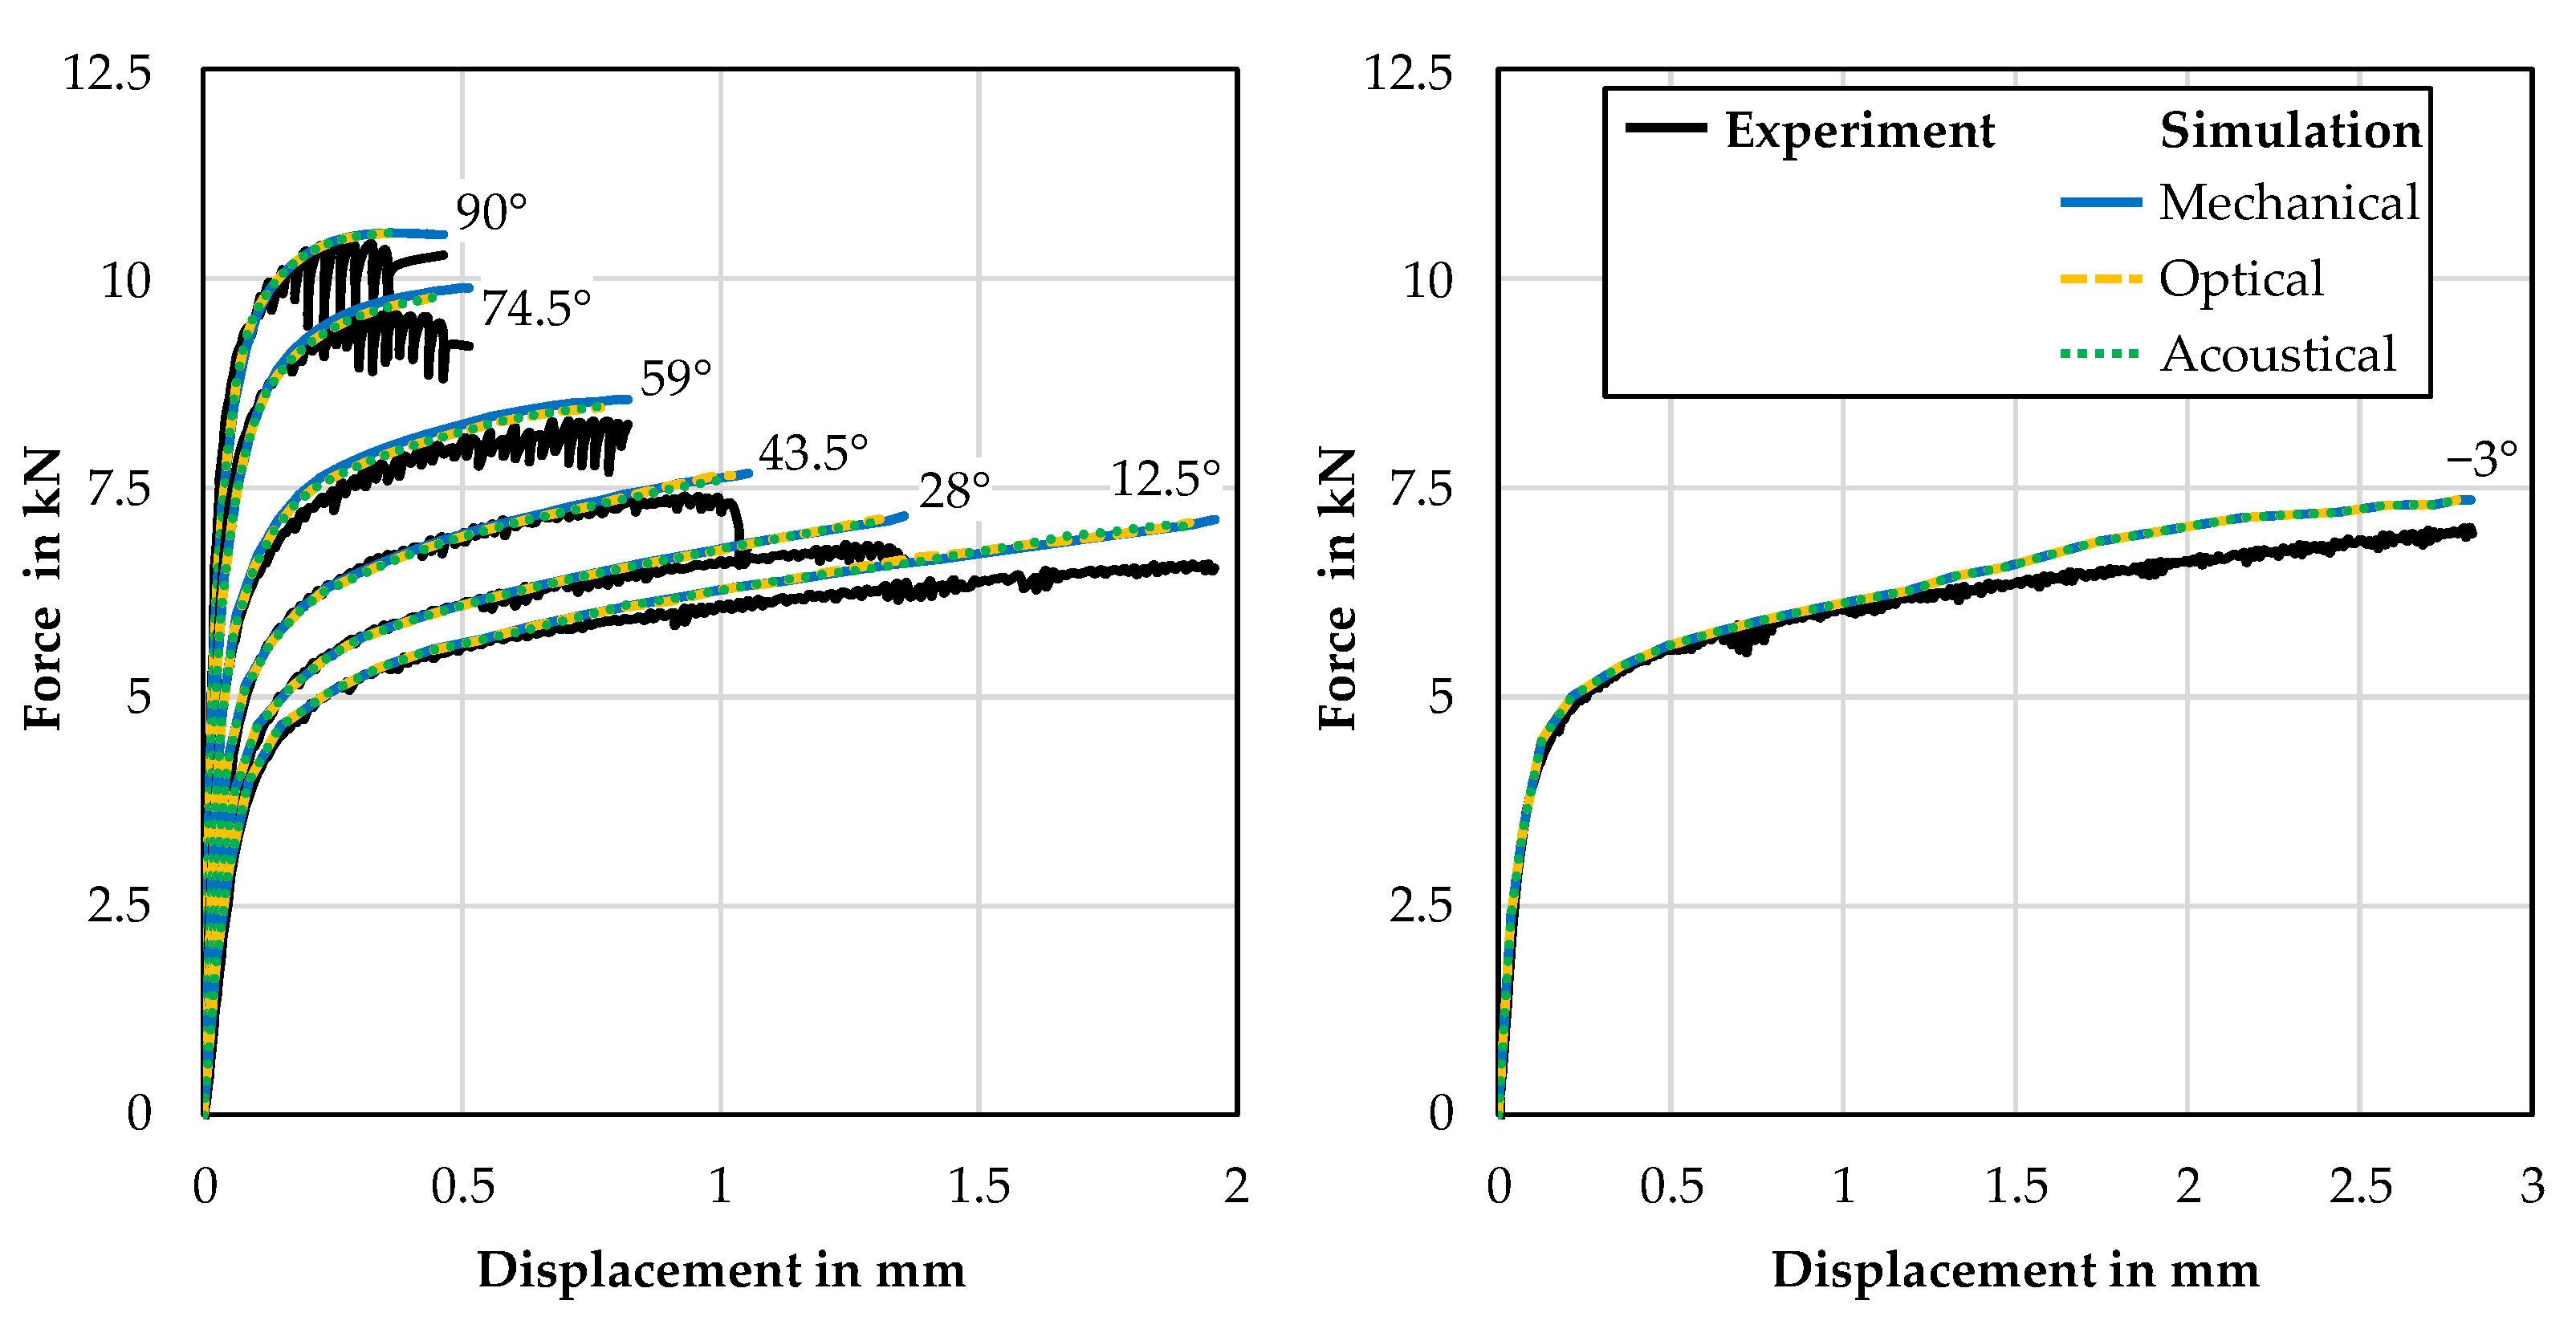
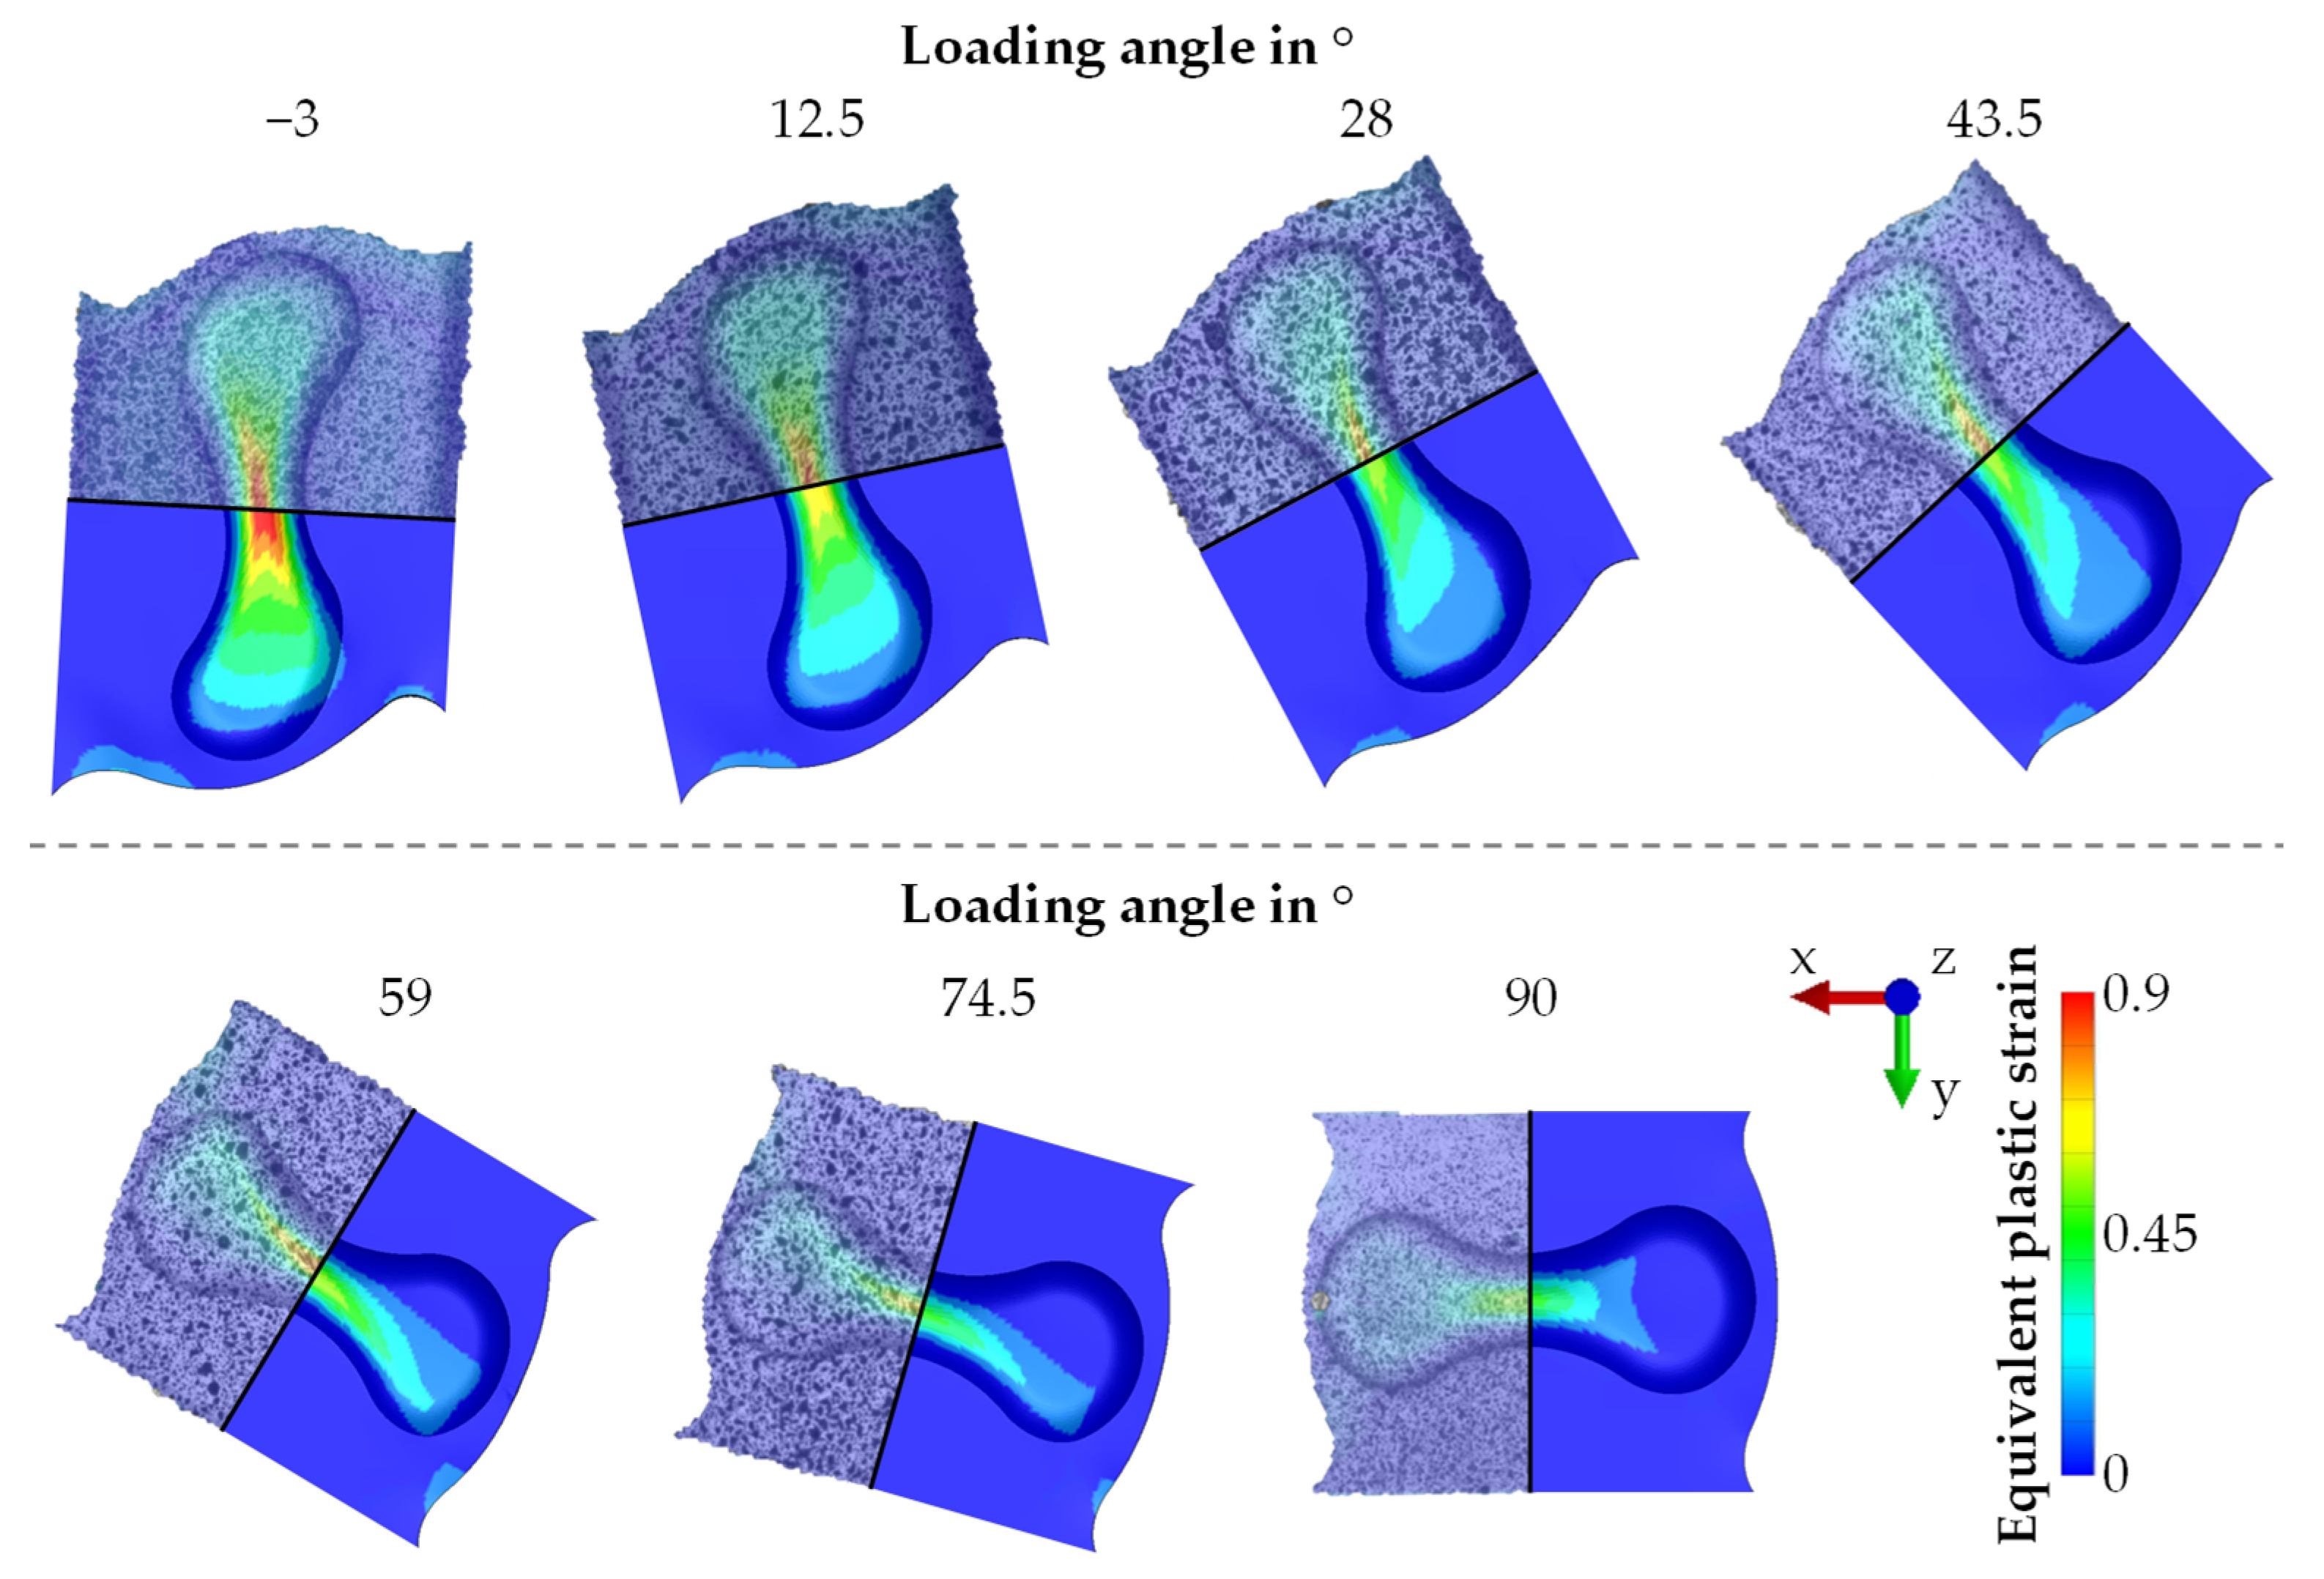
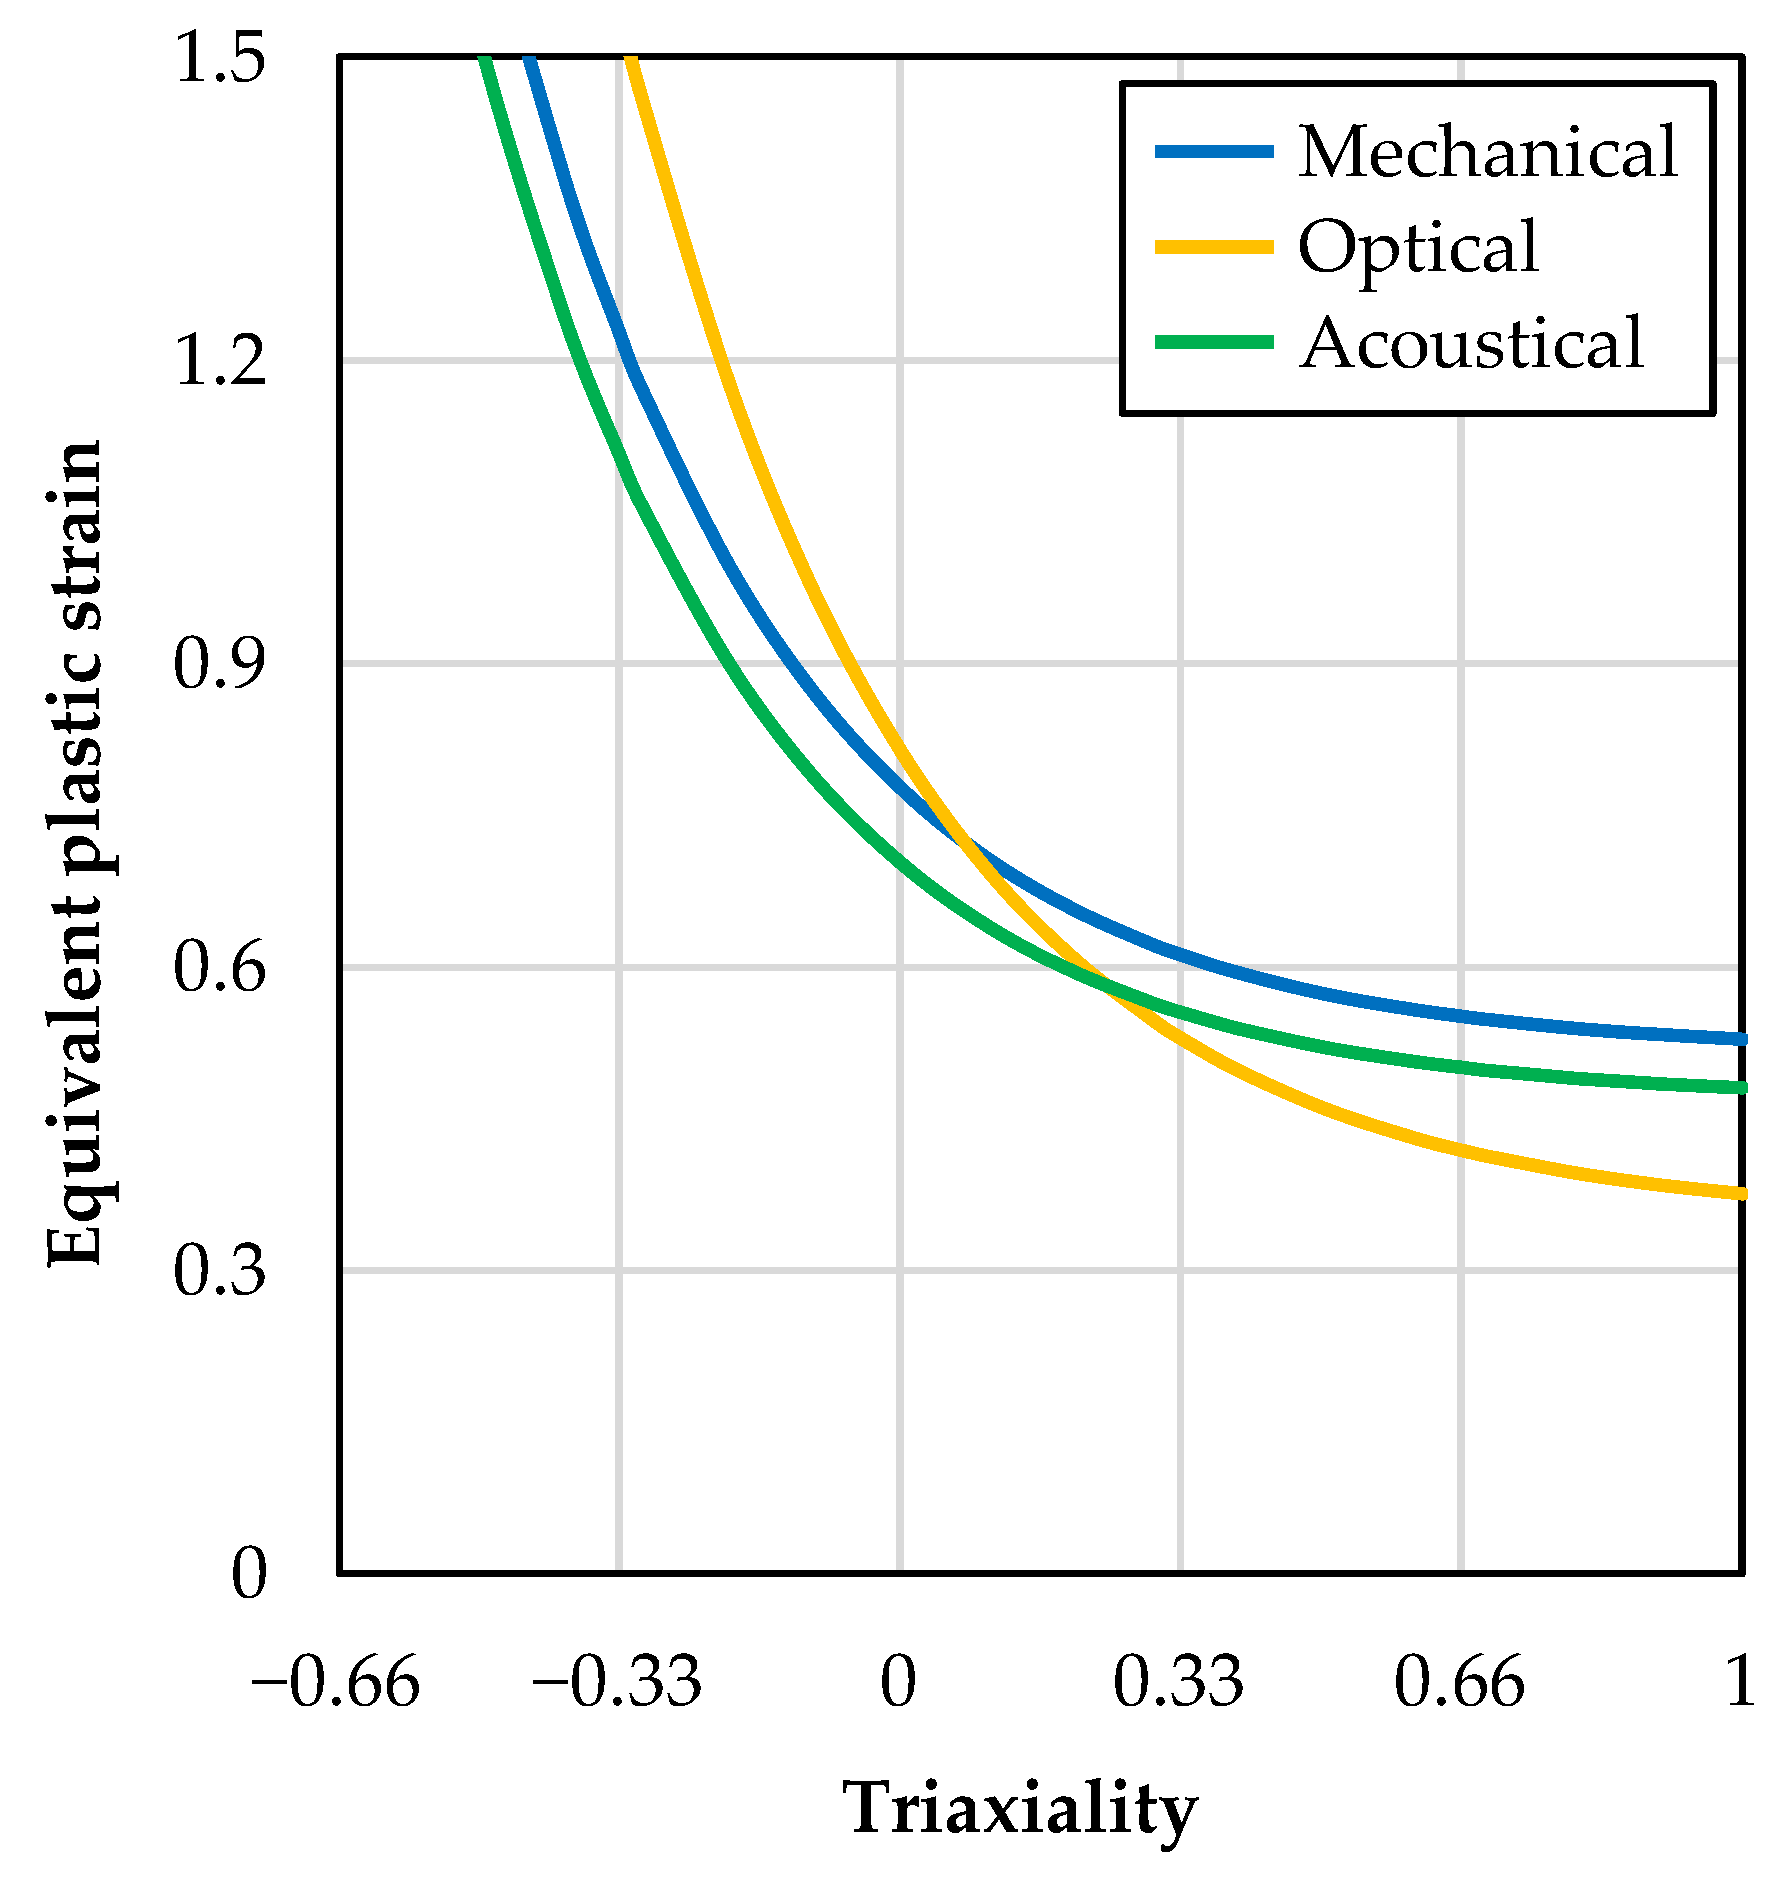
3.2. Failure Behaviour

The average failure displacements in x- and y-direction u x and u y from the butterfly tests are shown in Figure 7. Obviously, the displacement in the y-direction is larger than in the x-direction for all methods due to the test setup. The maximum displacement in x-direction is about 0.52 mm and in y-direction is 2.82 mm. In general, it can be stated that the failure displacement in y-direction is reduced from about 2.82 mm to 0.46 mm by increasing the loading angle from −3° to 90°. However, the failure displacement in x-direction increases from about 0.09 mm to 0.52 mm with a loading angle of −3° to 43.5° and decreases again at 90° to 0.03 mm, which can be explained by the rotation of the test setup. Comparing the three evaluation methods, it can be seen that for most of the specimens the average failure displacement in x- and y-direction is the highest for the mechanical evaluation method, gets lower for the optical evaluation method, and is lowest for the acoustical evaluation method, as assumed. However, the acoustical evaluation method estimates mostly marginally lower displacements than the optical evaluation method. For example, at a loading angle of 90° the displacement in y-direction is 0.464 mm, 0.366 mm, and 0.357 mm for the mechanical, optical, and acoustical evaluation methods.
The failure displacements were used as boundary conditions in the numerical models of the butterfly tests. To validate the simulation models, the force-displacement curves are compared to the experimental values from the butterfly tests in Figure 8. For both the numerical and the experimental force-displacement curves, the maximum force reduces from a loading angle of 90° to 12.5° from about 10.5 kN to 7 kN, while the maximum displacement increases from about 0.46 mm to 1.96 mm. The maximum force of about 7.3 kN for the loading angle −3° is at the same level as 12.5°, but the maximum displacement is higher for −3° with about 2.77 mm. Comparing the experimental and the numerical results, it can be seen that the numerical results fit well to the experimental. Within increasing deformation, the numerically calculated force slightly overestimates the experimental force. It can be seen well for the loading angle 43.5°. The numerical curves fit well to the experimental curve until a displacement of about 0.9 mm and proceeds above the experimental curve until 1.01 mm at the end of forming. This is because no damage model was used for the numerical models and the damage accumulation reduces the force during forming. Therefore, it is assumed that the modelling of the material and of the tests represents the flow behaviour of the material well.
In Figure 9, the distribution of the numerically calculated equivalent plastic strain is compared to the distribution measured in the experiments by the optical evaluation method. The overall distribution of the equivalent plastic strain in the investigation area of the butterfly specimen is represented well by the numerical model. In the specimen centre, the maximum equivalent plastic strain is slightly underestimated by the numerical models compared to the measured values for the loading angle of 12.5° to 90°. At the loading angle 90° for example, the optically measured maximum equivalent plastic strain is about 0.505 and the numerically calculated is 0.458. Overall, it can be stated that the numerical modelling represents the butterfly tests in an adequate way with enough precision.
In Figure 10A, the equivalent plastic strain–triaxiality curves of all loading angles for the three evaluation methods are shown. The curves of the loading angles from −3° to 28° proceed similarly for the three evaluation methods. For the other loading angles, there is a high difference for the acoustical evaluation method compared to the other two methods. The equivalent plastic strain–triaxiality curves of the acoustical evaluation method are shifted to higher triaxialities. This difference can be explained by the area, where material failure was assumed in the experiment and, therefore, evaluated in the simulations. For the mechanical and the optical evaluation methods the specimen data are analysed on the surface, while for the acoustical evaluation method the specimen data are analysed inside the specimen. A similar difference can be seen at the equivalent plastic strain-normalised Lode angle curves in Figure 10B. Here all curves for all loading angles show a similar behaviour except for a loading angle of 59° and 74.5°, where a higher difference is visible for the acoustical evaluation method.
Based on the equivalent plastic strain–triaxiality and the equivalent plastic strain-normalised Lode angle curves, the characteristic stress states were estimated. To obtain the characteristic values, the area-weighted centroid was calculated from the equivalent plastic strain—triaxiality and the equivalent plastic strain-normalised Lode angle curves. The area-weighted stress state is plotted in Figure 11A for all loading angles and the three evaluation methods. Likewise to the curves in Figure 10, the area-weighted stress state is similar for the three evaluation methods for the loading angles from −3° to 28°. For the other loading angles, the stress state of the acoustical method shows a difference to the stress state of the other two methods located at higher triaxialities. Exemplarily for the loading angle 90°, the characteristic value of the normalised Lode angle is about 0.1 for all three methods. The characteristic value of the triaxiality is about 0.61 for the mechanical and optical evaluation methods, but about 0.79 for the acoustical evaluation method.
In Figure 11B, the maximum equivalent plastic strain is shown for all loading angles and evaluation methods. The maximum equivalent plastic strain is the highest at a loading angle of −3° with about 0.85 and reduces up to 28° with about 0.53. It then rises again to about 0.61 for a loading angle of 59°, reduces to about 0.47 for a loading angle of 74.5° and rises again to about 0.54 for a loading angle of 90°. Comparing the three evaluation methods, the highest equivalent plastic strain is always present for the mechanical evaluation method due to the highest failure displacement and therefore the highest deformation. This shows the low sensitivity of the mechanical evaluation method to material failure. For the loading angles from −3° to 59°, the optical evaluation method shows higher maximum equivalent plastic strains than the acoustical evaluation method. However, for the loading angles 74.5° and 90° the acoustical evaluation method estimates higher maximum equivalent plastic strain than the optical evaluation method. The higher maximum equivalent plastic strains for the acoustical evaluation method at the loading angles 74.5° and 90° can be explained by the failure area of the material. As for the stress state, the equivalent plastic strain was evaluated on the specimen surface for the mechanical and the optical evaluation method, but inside the specimen for the acoustical method.
Based on the experimental and numerical results, the JC failure model was parametrised using the least-squares method and a Generalized Reduced Gradient Nonlinear Solver. The coefficients of the JC failure model for the three evaluation methods are summarised in Table 3.
In Figure 12, the JC failure models are shown for the different evaluation methods. The JC failure model of the mechanical evaluation method has a similar course as the JC failure model of the acoustical evaluation method, but proceeds at higher equivalent plastic strains. In contrast, the slope of the JC failure model is lower and, therefore, different for the optical evaluation method. Until triaxialities of 0.25, the JC failure model of the acoustical evaluation method has the lowest values, which changes for higher triaxialities above 0.25. Here, the JC failure model of the optical evaluation method has the lowest equivalent plastic strains of the three failure models. This progression of the curves is due to the different equivalent plastic strains and the variations in the stress states. Since the equivalent plastic strains for the acoustical evaluation method are lower at the loading angles −3° to 59° and higher at 74.5° and 90° than for the optical evaluation method, the slope of the JC failure model of the optical evaluation method is higher than that of the acoustical evaluation method.
Assuming that the JC failure model of the acoustical evaluation method is the most precise model, the material failure of a component would be predicted to late in a process simulation using the JC failure model of the mechanical evaluation method. Comparing the JC failure model of the acoustical evaluation method with that of the optical evaluation method, the material failure would be estimated too late for triaxialities up to 0.25 and too early for higher triaxialities by the JC failure model of the optical evaluation method.

4. Summary and Outlook

In this paper, the AHSS CP800 was characterised regarding its flow behaviour using tensile and hydraulic bulge tests. It was further modelled using an analytical approach. The failure behaviour was experimentally analysed using butterfly tests and evaluated using three methods: a mechanical evaluation method using the drop of the forming force, the common optical evaluation method with optical measurement, and a new acoustical evaluation method using acoustic emission analysis. The butterfly tests were numerically modelled using the determined flow behaviour and the specific failure displacement from each evaluation method, which served as the boundary condition for each simulation. Therefore, the butterfly specimen’s exact stress state at the failure area and the equivalent failure strain at failure onset could be calculated and used to parametrise and compare the JC failure model for each evaluation method.
As to be expected, the equivalent plastic strain at failure is highest for the mechanical evaluation method and lower for the other two methods. Due to the low sensitivity of the mechanical evaluation method to material failure it is detected later, resulting in high equivalent plastic strains. Therefore, the JC failure model from the mechanical evaluation method shows the highest curve. The equivalent plastic strain at failure derived for the optical evaluation method shows higher values than the acoustical evaluation method for the most loading angles, except for 74.5° and 90°. This is because the acoustical evaluation method derives the material failure mostly earlier and at a different area than the optical method. While the failure for the optical evaluation method is evaluated on the specimen surface of the simulation model, the failure for the acoustical evaluation method is analysed inside the specimen. Therefore, the course of both JC failure models varies due to the different area of material failure and hence stress state. A more accurate estimation of the material failure is assumed using the JC failure model created by the acoustical evaluation method.
In future investigations, B-pillar demonstrators, as shown in [27], will be produced using the CP800 material. The experimental tests will be reproduced numerically using the presented material model. The three created JC failure models will be used in the simulations and the impact of modelling quality, regarding failure prediction, will be analysed.

Author Contributions

Conceptualization, B.-A.B., H.W. and E.S.; methodology, E.S.; software, E.S.; validation, E.S.; formal analysis, E.S.; investigation, E.S.; resources, B.-A.B. and H.W.; data curation, E.S.; writing—original draft preparation, E.S.; writing—review and editing, B.-A.B. and H.W.; visualization, E.S.; supervision, B.-A.B. and H.W.; project administration, B.-A.B. and H.W.; funding acquisition, B.-A.B. and H.W. All authors have read and agreed to the published version of the manuscript.

Funding

This research was funded by the DFG (Deutsche Forschungsgemeinschaft/German Research Foundation) within the project “Improving the failure characterisation of advanced high-strength steel sheets by coupling measuring systems for optical forming analysis with acoustic emission technology” with the grant number “385276585”.

Institutional Review Board Statement

Not applicable.

Informed Consent Statement

Not applicable.

Data Availability Statement

Not applicable.

Acknowledgments

The authors would like to express gratitude to the company voestalpine Stahl GmbH for providing the steel CP800 for the experimental investigations. Furthermore, the authors would like to thank H. Holzapfel from the Institute of Forming Technology and Machines for the support regarding the realisation of the experiments.

Conflicts of Interest

The funders had no role in the design of the study; in the collection, analyses, or interpretation of data; in the writing of the manuscript; or in the decision to publish the results.

Abbreviations

AcronymsDescription
AHHSAdvanced high-strength steels
BBainite
CPComplex phase steel
FFerrite
JCJohnson–Cook failure model
MMartensite
NDNormal direction
RDRolling direction
TDTransverse direction
ParametersDescription
A , B , C Material parameters of the Swift extrapolation approach
D 1 , D 2 , D 3 Material parameters of the JC failure model
F , G , H , L , M , N Hill48 parameters
ε f , J C Equivalent plastic strain at failure
ε p l Equivalent plastic strain
η Triaxiality
k f , S w i f t Flow stress of the Swift extrapolation approach
r 0 , r 45 , r 90 Anisotropy coefficients
σ 11 , σ 22 , σ 33 Tensile yield stresses
σ 12 , σ 23 , σ 31 Shear yield stresses
u x Failure displacements in x-direction
u y Failure displacements in y-direction

References

  1. Fonstein, N. Dual-phase steels. In Automotive Steels—Design, Metallurgy, Processing and Applications; Elsevier: Amsterdam, The Netherlands, 2017; pp. 169–216. [Google Scholar] [CrossRef]
  2. Behrens, B.-A.; Uhe, J.; Wester, H.; Stockburger, E. Hot forming limit Curves for numerical Press Hardening Simulation of AISI 420C. In Proceedings of the 29th International Conference on Metallurgy and Materials, Brno, Czech Republic, 20–22 May 2020; pp. 350–355. [Google Scholar] [CrossRef]
  3. Bai, Y.; Wierzbicki, T. Application of extended Mohr–Coulomb criterion to ductile fracture. Int. J. Fract. 2010, 161, 1–20. [Google Scholar] [CrossRef]
  4. Wilson-Heid, A.E.; Furton, E.T.; Beese, A.M. Contrasting the Role of Pores on the Stress State Dependent Fracture Behavior of Additively Manufactured Low and High Ductility Metals. Materials 2021, 14, 3657. [Google Scholar] [CrossRef] [PubMed]
  5. Mohr, D.; Marcadet, S.J. Micromechanically-motivated phenomenological Hosford–Coulomb model for predicting ductile fracture initiation at low stress triaxialities. Int. J. Solids Struct. 2015, 67–68, 40–55. [Google Scholar] [CrossRef]
  6. Erice, B.; Roth, C.C.; Mohr, D. Stress-state and strain-rate dependent ductile fracture of dual and complex phase steel. Mech. Mater. 2018, 116, 11–32. [Google Scholar] [CrossRef]
  7. Hong, T.; Ding, F.; Chen, F.; Zhang, H.; Zeng, Q.; Wang, J. Study on the Fracture Behaviour of 6061 Aluminum Alloy Extruded Tube during Different Stress Conditions. Crystals 2023, 13, 489. [Google Scholar] [CrossRef]
  8. Johnson, G.R.; Cook, W.H. Fracture Characteristics of three Metals subjected to various Strains, Strain Rates, Temperatures, and Pressures. Eng. Fract. Mech. 1985, 21, 31–48. [Google Scholar] [CrossRef]
  9. Wang, H.; Sui, X.; Guan, Y. Prediction of Hot Formability of AA7075 Aluminum Alloy Sheet. Metals 2023, 13, 231. [Google Scholar] [CrossRef]
  10. Xu, T.; Li, F.; Wang, X.; Zhang, G. Characterization of Anisotropic Fracture Behavior of 7075-T6 Aluminum Alloy Sheet under Various Stress States. J. Materi. Eng. Perform. 2022. [Google Scholar] [CrossRef]
  11. Lou, Y.S.; Yoon, J.W. A User-friendly Anisotropic Ductile Fracture Criterion for Sheet Metal under Proportional Loading. Int. J. Solids Struct. 2021, 217, 48–59. [Google Scholar] [CrossRef]
  12. Rice, J.R.; Tracey, D.M. On the ductile enlargement of voids in triaxial stress fields. J. Mech. Phys. Sol. 1969, 17, 201–217. [Google Scholar] [CrossRef] [Green Version]
  13. Chuluunbat, T.; Lu, C.; Kostryzhev, A.; Tieu, K. Investigation of X70 line pipe steel fracture during single edge-notched tensile testing using acoustic emission monitoring. Mater. Sci. Eng. A 2015, 640, 471–479. [Google Scholar] [CrossRef]
  14. Voestalpine Steel Division. Data Sheet Complex Phase Steels, 10/2022. Available online: https://www.voestalpine.com/ultralights/en/content/download/4638/file/Complex-phase-high-ductility-steels-voestalpine-EN-14102021.pdf (accessed on 7 February 2023).
  15. DIN EN ISO 10275:2020; Metallic Materials—Sheet and Strip—Determination of Tensile Strain Hardening Exponent. Beuth: Berlin, Germany, 2020. [CrossRef]
  16. DIN EN ISO 12004-2:2021; Metallic Materials—Determination of Forming-Limit Curves for Sheet and Strip. Beuth: Berlin, Germany, 2021. [CrossRef]
  17. Pelleg, J. Mechanical Testing of Materials. In Mechanical Properties of Materials; Springer: Berlin/Heidelberg, Germany, 2013; pp. 1–84. [Google Scholar] [CrossRef]
  18. DIN EN ISO 16808:2022-08; Metallic Materials—Sheet and Strip—Determination of Biaxial Stress-Strain Curve by Means of Bulge Test with Optical Measuring Systems. Beuth: Berlin, Germany, 2022.
  19. Sigvant, M.; Mattiasson, K.; Vegter, H.; Thilderkvist, H. A viscous pressure bulge test for the determination of a plastic hardening curve and equibiaxial material data. Int. J. Mater. Form. 2009, 2, 235–242. [Google Scholar] [CrossRef]
  20. Behrens, B.-A.; Rosenbusch, D.; Wester, H.; Stockburger, E. Material Characterization and Modeling for Finite Element Simulation of Press Hardening with AISI 420C. J. Mater. Eng. Perform. 2022, 31, 825–832. [Google Scholar] [CrossRef]
  21. Swift, H.W. Plastic instability under plane stress. J. Mech. Phys. Solids 1952, 1, 1–18. [Google Scholar] [CrossRef]
  22. DIN EN ISO 10113:2020; Metallic Materials—Sheet and Strip—Determination of Plastic Strain Ratio. Beuth: Berlin, Germany, 2021. [CrossRef]
  23. Hill, R. A theory of the yielding and plastic flow of anisotropic metals. Proc. R. Soc. A 1948, 193, 281–297. [Google Scholar] [CrossRef] [Green Version]
  24. Stockburger, E.; Vogt, H.; Wester, H.; Hübner, S.; Behrens, B.-A. Evaluating Material Failure of AHSS Using Acoustic Emission Analysis. Mater. Res. Proc. 2023, 25, 379–386. [Google Scholar] [CrossRef]
  25. Behrens, B.-A.; Dröder, K.; Hürkamp, A.; Droß, M.; Wester, H.; Stockburger, E. Finite Element and Finite Volume Modelling of Friction Drilling HSLA Steel under Experimental Comparison. Materials 2021, 14, 5997. [Google Scholar] [CrossRef] [PubMed]
  26. Pathak, N.; Butcher, C.; Worswick, M.J.; Bellhouse, E.; Gao, J. Damage Evolution in Complex-Phase and Dual-Phase Steels during Edge Stretching. Materials 2017, 10, 346. [Google Scholar] [CrossRef] [PubMed] [Green Version]
  27. Behrens, B.-A.; Jüttner, S.; Brunotte, K.; Özkaya, F.; Wohner, M.; Stockburger, E. Extension of the Conventional Press Hardening Process by Local Material Influence to Improve Joining Ability. Procedia Manuf. 2020, 47, 1345–1352. [Google Scholar] [CrossRef]
Figure 1. Butterfly specimen with close-up of the investigation area as well as stochastic pattern (A), and schematic representation of the test setup for butterfly specimen with optical as well as acoustical measuring system (B).
Applsci 13 04067 g001
Figure 2. Measured forming force—amplitude over time curve (A) and used evaluation methods for determining failure of the butterfly specimen: mechanical (B), optical (C), as well as acoustical (D).
Applsci 13 04067 g002
Figure 3. Reduced simulation models of the butterfly tests with boundary conditions.
Applsci 13 04067 g003
Figure 4. Evaluation areas of the butterfly simulation models: mechanical as well as optical (A) and acoustical evaluation method (B).
Applsci 13 04067 g004
Figure 5. Microscopic image of CP800 steel (A) and close-up (B).
Applsci 13 04067 g005
Figure 6. Experimental and extrapolated flow curves (A) and yield curves (B) for CP800.
Applsci 13 04067 g006
Figure 7. Average failure displacement in x-direction u x and in y-direction u y of the butterfly tests for CP800.
Applsci 13 04067 g007
Figure 8. Comparison of the experimental and numerical force—displacement curves for the three evaluation methods.
Applsci 13 04067 g008
Figure 9. Comparison of the optically measured and numerically calculated equivalent plastic strain distributions of the butterfly tests for the optical evaluation method.
Applsci 13 04067 g009
Figure 10. Equivalent plastic strain–triaxiality curves (A) and equivalent plastic-strain-normalised Lode angle curves (B) of the butterfly specimens for the three evaluation methods.
Applsci 13 04067 g010
Figure 11. Stress state (A) and equivalent plastic strain (B) of the butterfly specimens for the three evaluation methods.
Applsci 13 04067 g011
Figure 12. JC failure models of the three evaluation methods for CP800.
Applsci 13 04067 g012
Table 1. Chemical composition of the investigated CP800.
ElementCSiMnPSAlCr + MoTi + NbBV
Amount in mass-%0.1812.50.050.010.50.740.070.0010.1
Table 2. Coefficients of the Swift extrapolation approach and the Hill48 parameters for CP800.
CoefficientABC
Value1123.7 MPa0.00220.1057
CoefficientFGHLMN
Value0.4950.5310.4691.51.51.634
Table 3. Coefficients of the JC failure model for the different evaluation methods.
CoefficientD1D2D3
Mechanical0.51580.2617−3.02
Optical0.34850.4664−3.03
Acoustical0.46910.2345−2.99
Disclaimer/Publisher’s Note: The statements, opinions and data contained in all publications are solely those of the individual author(s) and contributor(s) and not of MDPI and/or the editor(s). MDPI and/or the editor(s) disclaim responsibility for any injury to people or property resulting from any ideas, methods, instructions or products referred to in the content.

