Article

An Application of Statistical Methods in Data Mining Techniques to Predict ICT Implementation of Enterprises

Technical Faculty “Mihajlo Pupin” in Zrenjanin, University of Novi Sad, Djure Djakovica bb, 23000 Zrenjanin, Serbia
*
Author to whom correspondence should be addressed.
Appl. Sci. 2023, 13(6), 4055; https://doi.org/10.3390/app13064055
Submission received: 13 February 2023 / Revised: 11 March 2023 / Accepted: 11 March 2023 / Published: 22 March 2023
(This article belongs to the Section Computing and Artificial Intelligence)

Abstract

:
Globalization, Industry 4.0, and the dynamics of the modern business environment caused by the pandemic have created immense challenges for enterprises across industries. Achieving and maintaining competitiveness requires enterprises to adapt to the new business paradigm that characterizes the framework of the global economy. In this paper, the applications of various statistical methods in data mining are presented. The sample included data from 214 enterprises. The structured survey used for the collection of data included questions regarding ICT implementation intentions within enterprises. The main goal was to present the application of statistical methods that are used in data mining, ranging from simple/basic methods to algorithms that are more complex. First, linear regression, binary logistic regression, a multicollinearity test, and a heteroscedasticity test were conducted. Next, a classifier decision tree/QUEST (Quick, Unbiased, Efficient, Statistical Tree) algorithm and a support vector machine (SVM) were presented. Finally, to provide a contrast to these classification methods, a feed-forward neural network was trained on the same dataset. The obtained results are interesting, as they demonstrate how algorithms used for data mining can provide important insight into existing relationships that are present in large datasets. These findings are significant, and they expand the current body of literature.

1. Introduction

The globalization of markets has introduced numerous challenges to enterprises across the globe. Due to the constant and dynamic changes in the global market, competition has intensified [1,2,3,4,5]. The widespread application of modern information communication technologies (ICTs) disrupted the existing competitive relations between enterprises [6,7]. In addition, customers and consumers are becoming more educated and informed about products, services, quality, and post-purchase support [8,9,10]. There is a continuous fragmentation and segmentation of markets [11,12], which can significantly affect established business models. Therefore, the vast majority of enterprises have to capture the main driving factors of technological development and apply this knowledge to their advantage [13,14].
Furthermore, Industry 4.0 has introduced a new framework for conducting business and a need for the digitization of the business process [15,16]. Industry 4.0 is characterized by technologies including cyber–physical systems, 3D manufacturing, big data analytics, the Internet of Things, the Internet of People, cloud-based solutions, the Internet of Value, artificial neural networks, and other state-of-the-art technological solutions [17,18,19]. In addition, the next industrial revolution, Industry 5.0, is slowly gaining traction. This revolution is based on the same technological principles as Industry 4.0, but in addition to focusing on profits as the main driver of business, it also focuses on sustainable development [20,21].
Enterprises have to be aware that intellectual capital has a key role in achieving and maintaining competitiveness in the globalized market [22,23,24]. Intellectual capital not only refers to the “know-how” regarding the application of ICT but can also be conceptualized as the “engine” of the development of technology and innovation [25]. In addition to the challenges of industrial development, the pandemic has also had a large impact on enterprises in various countries [26]. It has brought about stoppages in manufacturing and bottlenecks in global supply chains and has significantly affected the global economy.
Overall, in the current body of literature, researchers have analyzed in detail the challenges and hallmarks of Industry 4.0 [17,27,28], the importance of the application of ICT technology in enterprises [29,30], business performance and competitiveness [31,32,33,34], and the globalization of markets [35,36]. However, no research has been conducted in the transitional setting, in which factors that affect the intentions regarding the implementation of ICT in enterprises are analyzed. In this current study, a dataset (n = 214) was analyzed to address this issue of ICT application. The data were obtained from micro-, small-, medium-, and large-sized enterprises that conducted business in the Republic of Serbia.
The main goal of this study was to present the application of multiple statistical methods. First, simple/basic approaches are presented, including descriptive statistics, linear regression, logistic regression, a multicollinearity test, and a heteroscedasticity test. Next, data-mining algorithms are presented, including a Quick, Unbiased, Efficient, Statistical, Tree (QUEST) decision tree and a support vector machine (SVM) [37,38,39]. In addition, a feed-forward neural network was trained in order to provide a contrast with these approaches. However, neural networks work best if the dataset is large, whereas SVMs can be appropriate for smaller datasets.
Through the use of the abovementioned statistical methods, we aimed to perform the extraction of data/data mining regarding potential predictors of ICT application and implementation intentions. This information could be of interest to entrepreneurs, managers, researchers, and governments.
This paper includes four main sections (not including Section 1 and Section 6). First, a concise overview of the research background on the modern business environment is provided. Here, the knowledge gap and the hypotheses are proposed. Next, the methodology is presented in more detail. Afterward, the research results are presented. Then, further results and the advantages and limitations of the study are discussed.

2. Research Background

2.1. Modern Business Environment

The modern business environment is affected by several main factors. Enterprises encounter obstacles in their efforts to attain and preserve competitiveness as a result of globalization, the dynamic development of advanced ICTs, post-pandemic economic mechanisms [40,41], the challenges of sustainability and sustainable development [42,43], and the concept of Society 5.0 [44].
The fast development of ICTs has significantly contributed to market, capital, and workforce globalization. This has led to intensified competitive relations between enterprises across industries. Enterprises have been forced to realize that ICT implementation is occurring slowly but surely, becoming an imperative for increasing competitiveness. ICTs can be implemented in many business processes, including manufacturing, distribution, logistics, marketing, quality management, human resource management (HRM) [45], customer relationship management (CRM) [46], accounting [47], and warehousing [48].
ICTs are the cornerstone of Industry 4.0, and for the purposes of this study, one technological concept can be highlighted—big data analytics (big data and data mining) [49]. The modern business environment relies on a constant and high volume of data from various sources. Enterprises have to address and tap into these data distribution channels and extract valuable information [50]. In addition to the challenges of Industry 4.0, few enterprises have been left unscathed by the globally widespread negative effects of the pandemic [51]. The pandemic has intensified the digitization of business models, and the reliance on the Internet as a medium for strategic business planning has intensified [52]. This trend will continue, leaving traditional business models obsolete or with inadequate competitive abilities [52]. In addition, the challenges of sustainable development, which is the cornerstone of Industry 5.0 and Society 5.0, have to be taken into consideration [53,54]. Industry 5.0 and the emerging concept of Society 5.0, in addition to sustainability in business and sustainable development goals, involve the utilization of data in enterprises, government offices, and social security-based services; the advanced implementation of social security systems; smart manufacturing; and other organizations [55,56,57]. Additionally, intellectual capital as a concept that represents a key resource for improving business performance and effectively applying advanced technologies [58,59].
When considering all the aforementioned factors as a whole, it is important to take note of one more key factor—market assessment. This refers to an enterprise’s ability to evaluate its external business environment [60,61,62]. In the value economy, which characterizes new globalized markets, enterprises are increasingly focusing on intellectual capital and innovation derived from it [63]. Additionally, appropriately assessing the market and being agile to the dynamic changes is imperative for enterprise development [64]. ICTs play an important role in determining what is needed and expected in a specific market. ICTs provide necessary tools for creating and distributing instruments such as surveys and forms for data collection. This data can be further used to understand customer preferences and behavior [65]. Thus, it is evident that market assessment has the potential to influence whether enterprises will implement and use ICTs in their business. Additionally, business performance and ICT application are inevitably related. Better business performance can lead to increased financial resources for new ICT implementation, and enterprise growth is expected to be accompanied by technological growth [66]. Therefore, an increase in business performance can affect ICT implementation. Overall, without proper mechanisms to recognize changes and trends in the market, enterprises cannot adapt or survive in the long term.

2.2. Knowledge Gap and Hypotheses

The objective of this study was to demonstrate the application of statistical methods for data mining. The research framework and dataset involve the analysis of ICT implementation and application in enterprises. The paper addresses two crucial knowledge gaps. Firstly, there is a lack of studies analyzing ICT implementation in enterprises from transitional countries. Furthermore, existing studies that partially address this subject do not utilize data mining algorithms. Secondly, this paper provides a significant overview of how basic statistical methods compare to more complex approaches.
This study presents the application of statistical methods in data mining, and the results obtained are equally significant. The results highlight factors that potentially affect an enterprise’s intention to implement and apply ICTs.
Based on the literature review and the goal of the paper, the following hypotheses are established as guidelines for data mining:
  • H1a: Manager/director age positively affects intentions to implement and apply ICTs within an enterprise.
  • H1b: Manager/director gender positively affects intentions to implement and apply ICTs within an enterprise.
  • H1c: Manager/director education positively affects intentions to implement and apply ICTs within an enterprise.
  • H1d: Enterprise size positively affects intentions to implement and apply ICTs within an enterprise.
  • H2: Business performance positively affects intentions to implement and apply ICTs within an enterprise.
  • H3: Awareness of ICT importance positively affects intentions to implement and apply ICTs within an enterprise.
  • H4: Intellectual capital positively affects intentions to implement and apply ICTs within an enterprise.
  • H5: Market assessment positively affects intentions to implement and apply ICTs within an enterprise.
The purpose of these hypotheses is to provide a research framework and guide the application of statistical methods on the acquired dataset.

3. Methodology

3.1. Research Framework and Dataset

The framework and the methodology of this study are in accordance with the best practices in this type of research [67]. The research methodology includes the following:
  • Identifying the primary goal of the research (which is to present the application of data mining algorithms and attempt to predict enterprises’ intentions of implementing and applying ICTs with multiple potential predictors);
  • Literature review (obtaining and concisely presenting a theoretical background in the domain of modern business environments);
  • Data acquisition (developing a structured survey, survey distribution, data collection, and creating an integrated dataset for data mining via various statistical methods);
  • Statistical methods (including descriptive statistics, linear regression, binary logistic regression, multicollinearity test, heteroscedasticity test, QUEST classification tree algorithm, support-vector machine–SVM);
  • Information extraction and discussion (presenting and determining whether it is possible to predict intentions of ICT implementation and application with different statistical methods).
The study was conducted through a structured survey in accordance with best practices in this domain. The dataset included survey data from 214 enterprises (n = 214), with details presented in Table 1.
The survey items and additional details are presented in Table A1 (Appendix A). Since the majority of enterprises in Serbia are SMEs, it was expected that the survey data would primarily consist of data from SMEs, with a few large enterprises included. The data collection was conducted in 2021, and the dataset included information about the respondent (gender, age, education), enterprise size, business performance, awareness of ICT importance, intellectual capital management, and market assessment. Future research may consider other potential predictors. The dataset is robust and suitable for applying data mining algorithms.
The research was conducted in three main phases. The first phase involved developing a structured survey, analyzing existing studies in this domain, and setting up the data collection process. The literature sources were analyzed, and the theoretical framework was developed. The anonymous surveys were distributed, and participants were given one month to complete them. An integrated dataset was created for statistical analysis.
The second phase focused on data analysis/data mining, utilizing statistical methods ranging from simple to complex, such as descriptive statistics, linear regression, binary logistic regression, multicollinearity test, heteroscedasticity test, QUEST classification tree algorithm, support-vector machine–SVM, and feed-forward neural network. The methods were conducted using WPS Spreadsheets and MPlus 7.11 software.
In the third phase, the obtained results were analyzed and evaluated to highlight the study’s significance, drawbacks, and advantages. The developed decision tree is a clear example of how statistical methods in classification algorithms can be applied to data mining. The SVM results provide additional insight into how data mining algorithm can extract valuable information, and the feed-forward neural network provided a contrasting perspective to the previous methods.

3.2. QUEST Algorithm for Data Mining

The applied QUEST algorithm was selected over other classification algorithms for several reasons:
  • Its accuracy is not compromised by its increased speed;
  • It uses imputations instead of surrogate splits for missing values, making it better than the CART algorithm;
  • It can handle categorical predictor variables with multiple categories;
  • It does not have a bias toward variable selection before splitting [68];
  • Its lack of bias is controlled through variation levels in the observed predictor variables [69].
  • It can be applied for nominal, ordinal, and continuous values (ANOVA for ordinal and continuous values, and Pearson’s χ2 for categorical values);
  • Cross-validation is used for pruning;
  • It can be used with variate splits as well as for a combination of linear splits [66].
The QUEST algorithm first selects the primary variable and determines its split point, making it unbiased towards categorical variables. A quadratic discriminant analysis (QDA) is used to merge multiple variable classes into two super-classes, and then binary split is performed [70,71,72]. If there are two binary split points, the QUEST algorithm chooses the one closer to the sample mean. The algorithm is constructed by selecting a split independent variable, and after selecting a split point for the selected independent variable, it stops.
A pseudocode is presented in Algorithm 1. to provide a clear overview of the QUEST algorithm. The pseudocode is presented in the same form as in similar studies in this domain.
Algorithm 1. Pseudocode for the QUEST algorithm
  1.
Specify the level of significance α, where α ∈ (0,1)
  2.
  alpha = 0.05
  3.
Set M as the total number of independent variables. Let M1 be the number of continuous and ordinal variables.
  4.
  M = total_num_independent_vars
  5.
  M1 = num_continuous_ordinal_vars
  6.
For each continuous or ordinal independent variable X, compute the smallest p-value using the ANOVA F-test to test if all categories of the dependent variable have the same mean as X and compute the smallest p-value using Pearson’s chi-squared (χ2) statistic.
  7.
For X in continuous_ordinal_vars:
  8.
    p_value_f_test = compute_p_value_using_anova_f_test(X)
  9.
    p_value_chi_squared = compute_p_value_using_chi_squared(X)
  10.
For each categorical independent variable, perform Pearson’s χ2 test for independence between Y and X, and find the p-value using the χ2 statistic.
  11.
   For X in categorical_vars:
  12.
   p_value_chi_squared = compute_p_value_using_chi_squared(X)
  13.
Identify the independent variable with the smallest p-value and denote it as X*.
  14.
   smallest_p_value = min(p_value_f_test, p_value_chi_squared)
  15.
   X* = independent_var_with_smallest_p_value
  16.
If the smallest p-value is less than α/M, where M is the total number of independent variables, then SELECT X* as the predictor for splitting the node. Otherwise, go to step 4.
  17.
    If smallest_p_value < alpha/M:
  18.
    selected_predictor = X*
  19.
   Else:
  20.
    continue_to_step_4 = True
  21.
Calculate Levene’s F statistic based on the absolute deviation of X from its class mean to test if the variances of X for different classes of Y are the same for each continuous independent variable X and find the p-value for the test.
  22.
    For X in continuous_vars:
  23.
    levene_f_statistic = calculate_levene_f_statistic(X)
  24.
    p_value_levene_test = find_p_value_for_levene_test(levene_f_statistic)
  25.
Identify the independent variable with the smallest p-value and denote it as
  26.
X**.
  27.
    smallest_p_value = min(p_value_levene_test)
  28.
    X** = independent_var_with_smallest_p_value
  29.
If the smallest p-value is less than α/(M + M1), where M1 is the number of continuous independent variables, then SELECT X** as the split independent variable for the node. Otherwise, do not split this node.
  30.
    If smallest_p_value < alpha/(M + M1):
  31.
    selected_split_var = X**
  32.
  Else:
  33.
    do_not_split_node = True
The pseudocode is further explained in more detail on how to apply the QUEST algorithm to the dataset. The steps are as follows:
Step 1: Set the level of significance α, where α ∈ (0,1). α = 0.05.
Step 2: Determine the number of independent variables, M. In the survey data, we have 8 independent variables, which are Manager Age, Manager Gender, Manager Education, Enterprise Size, Business Performance, Awareness of ICT Importance, Intellectual Capital, and Market Assessment. We also have 1 dependent variable, which is Intentions to Implement ICTs. Among the 8 independent variables, 5 are categorical (Manager Gender, Manager Education, Enterprise Size, Awareness of ICT Importance, and Market Assessment), and 3 are continuous (Manager Age, Business Performance, and Intellectual Capital).
Step 3: For each continuous independent variable X, compute the smallest p-value using the ANOVA F-test to test if all categories of the dependent variable have the same mean as X, and compute the smallest p-value using Pearson’s chi-squared (χ2) statistic to test if all categories of X have the same distribution across the dependent variable. For each categorical independent variable X, perform Pearson’s χ2 test for independence between Y and X, and find the p-value using the χ2 statistic. We can use the scipy.stats module in Python to perform these statistical tests and compute the p-values.
Step 4: Identify the independent variable with the smallest p-value and denote it as X*. If the smallest p-value is less than α/M, where M is the total number of independent variables, then SELECT X* as the predictor for splitting the node. Otherwise, go to step 5.
Step 5: If all independent variables have been tested and none have a p-value less than α/M, stop the splitting process and form a leaf node with the majority class label of the samples in the node. Otherwise, repeat steps 3 to 5 for each child node.
Step 6: Calculate Levene’s F statistic based on the absolute deviation of X from its class mean to test if the variances of X for different classes of Y are the same for each continuous independent variable X and find the p-value for the test. Identify the independent variable with the smallest p-value and denote it as X**. If the smallest p-value is less than α/(M + M1), where M1 is the number of continuous independent variables, then SELECT X** as the split independent variable for the node. Otherwise, do not split this node.
Step 7: Repeat steps 3 to 6 until all nodes are either leaf nodes or cannot be split further based on the significance level α.
Further, the established equations for Pearson’s chi-squared statistic and ANOVA F statistic are presented.
The equation for Pearson’s chi-squared statistic:
χ 2 = i ,   j O i , j E i , j 2 E i , j ¯
where Oi,j is the observed value, Ei,j is the expected value for the ith row and jth column of the data cell.
The equation for the ANOVA F statistic:
F = n j   X ¯ j X ¯ 2 / k 1   X X ¯ j 2 / N k
where nj is the sample size in the jth group, X ¯ j is the sample mean, and the X ¯ is the overall mean. N is the total number of observations, and k is the number of independent groups. In Table 2. the methodology summary is presented.

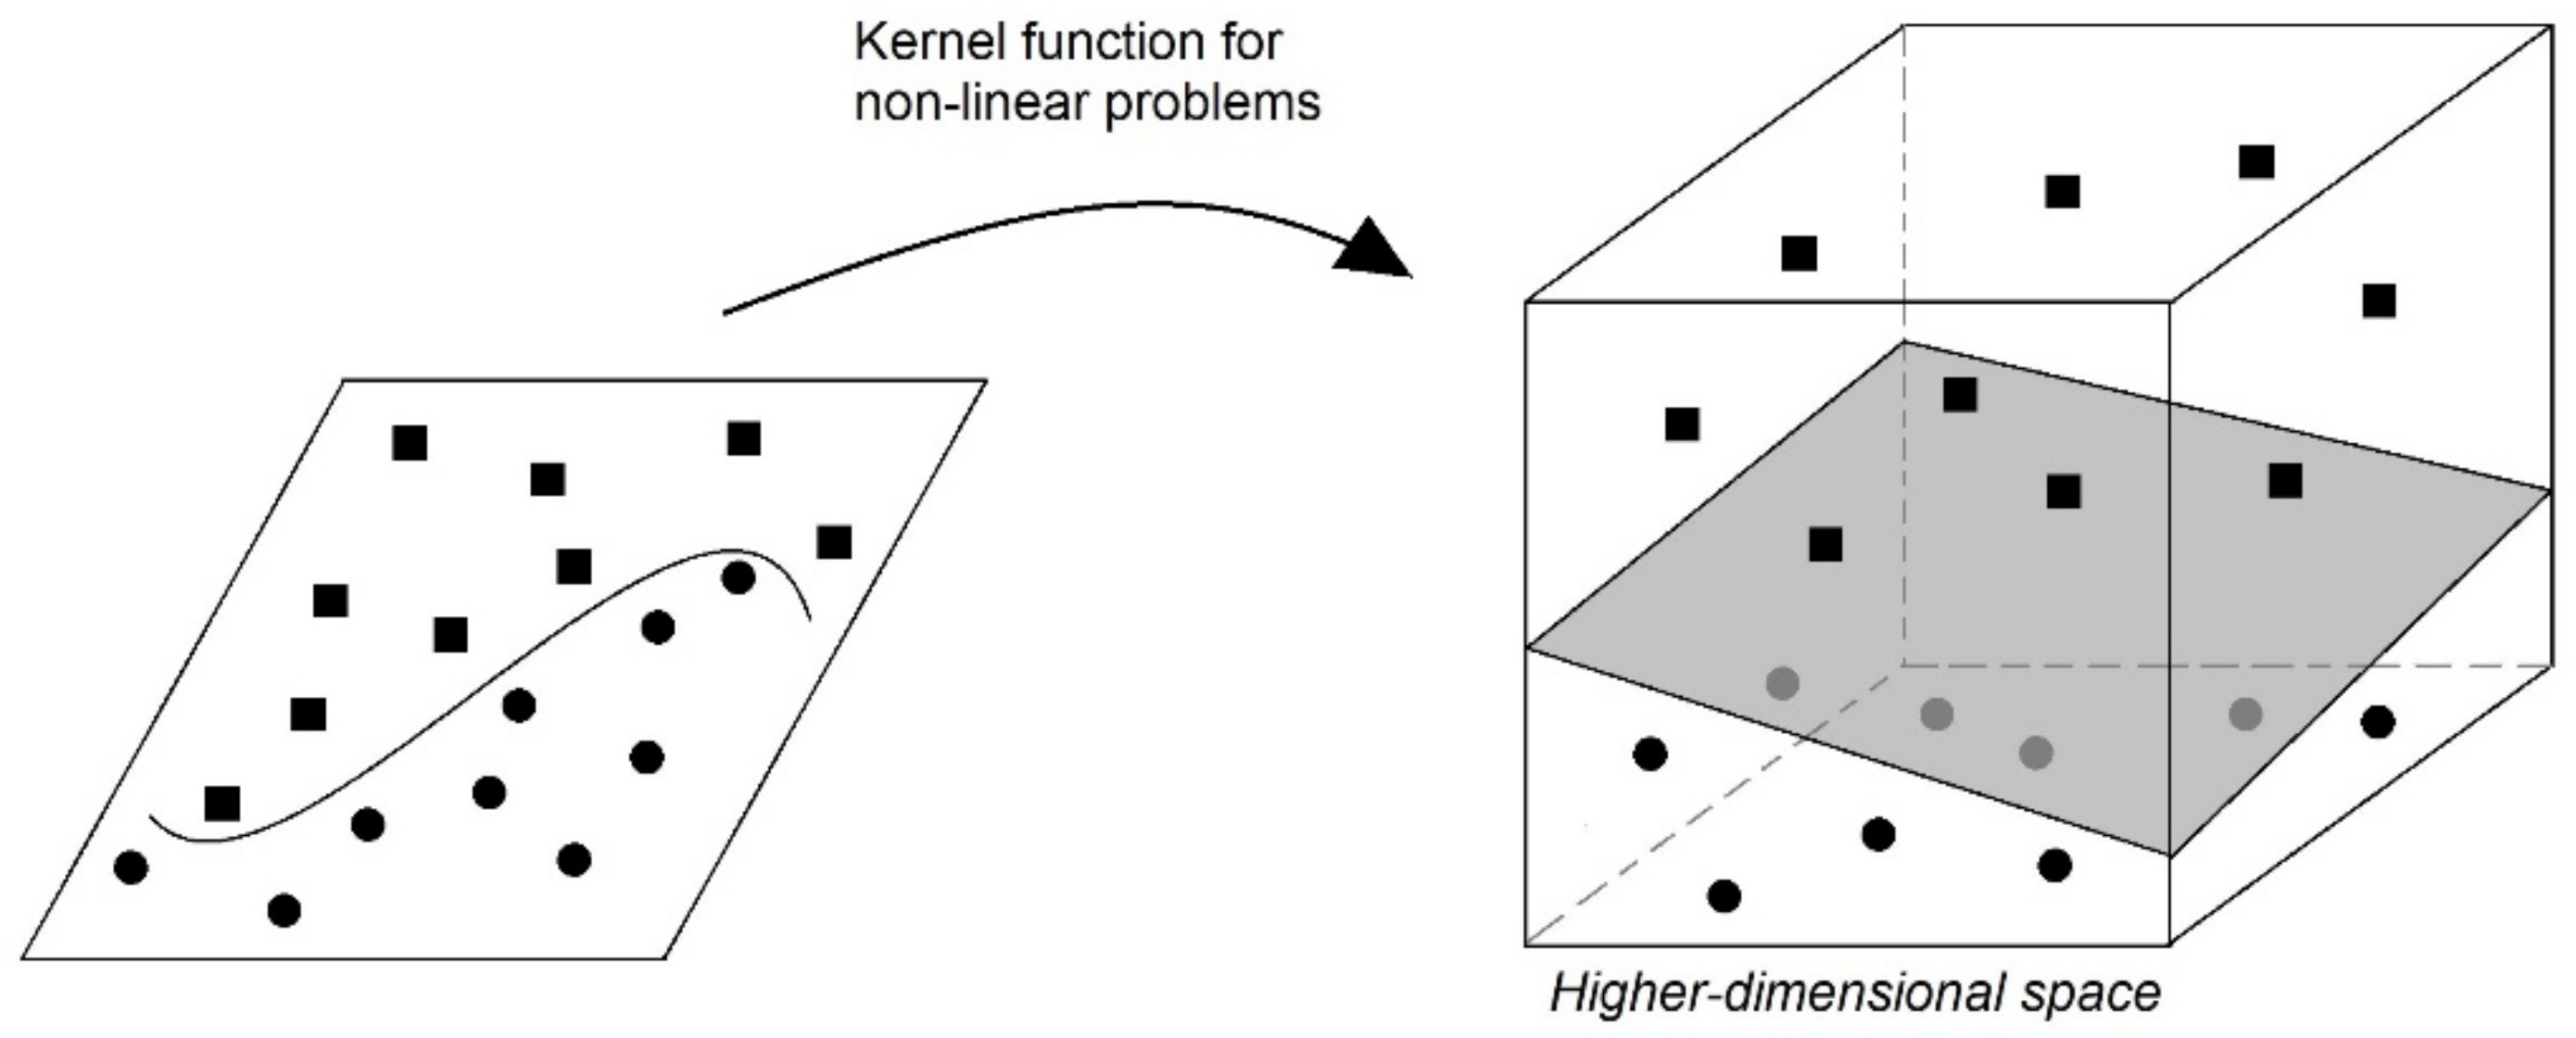
3.3. SVM Algorithm for Data Mining

Machine learning presents a significant advancement in the field of algorithms. It is a megatrend in various fields, including clustering (unsupervised learning), classification (supervised learning), and dynamic programming (reinforcement learning) [73]. Classification is an important topic in machine learning and is commonly used for predictive modeling [73]. Decision trees (such as the aforementioned QUEST algorithm) are one of the several types of machine learning classification methods. Another well-known classification algorithm is support vector machines (SVMs), which are widely applicable in various fields [74].
SVMs are trained to separate training data into two classes by determining the hyperplane that acts as the separator. The position of the hyperplane is defined by a subset of vectors called support vectors. For non-linear problems, the data are mapped into higher-dimensional spaces using kernel functions. Figure 1 illustrates the main principles of SVM for a linear problem.
Next, in Figure 2. the main principle for a non-linear problem is presented. This includes higher dimensional spaces via kernel functions.
The main mathematical principle of SVM includes [76] the input parameters, which are a series of data points (x1, y1), (x2, y2),… (xi, yi), where xi is the normalized input parameter, while yi is the normalized intention to implement an ICT under the input sample i. From here, SVM approximates the function in the following form:
f(x) = ω · ϕ(x) + b
where ϕ(x) presents the higher-dimensional space, which is non-linearly mapped. In order to find ω and b, the regularized risk function is used:
1 2   ω 2 + C 1 l i = 1 l L ε   ( y i ,   f x i )
where ω 2 is the regularized term, and by minimizing it, the function can be as flat as possible. 1 l i = 1 l L ε   ( y i ,   f x i ) is the empirical error. The error is measured by insensitive loss function (ε). This function has the following form:
L ε y i ,   f x i = 0 , y i f   x i   ε y i f x i ε ,   o t h e r w i s e
This way, the range of ε values is determined in a way that, if the prediction is accurate, the loss will be zero. If the predicted value is outside the range, the loss is the difference between the predicted value and the distance of ε value range.
Further, in order to estimate ω and b, Equation (4) is transformed into the original objective function that has the following form:
Minimize 1 2   ω 2 + C 1 l i = 1 l L ε   ( y i , f x i )
Subject to y i ω · Ø x i b     ε + ξ i
ω · Ø x i + b y i     ε + ξ i ,   i = 1 ,   1
ξ i 0
Equation (6) is hard to solve; thus, the four Lagrange multipliers are introduced, which results in the following equation:
f ( x ) = i = 1 l a i a i Ø x i · Ø x + b
Further, the kernel function K(xi, yj) for the higher-dimensional space is introduced into Equation (7):
f ( x ) = i = 1 l a i a i K x i , x + b
K(xi, xj) is equal to the inner product of vector xi and vector xj within the Ø(xi) and Ø(xj) places. The use of kernels makes it possible to conduct all calculations in the input space.
The pseudocode for the SVM is presented in Algorithm 2.
Algorithm 2. Pseudocode for the SVM.
  • # Load the dataset
  •   data = pd.read_csv(‘enterprisesict_data.csv’)
  • # Select the features and target variable
  •   X = data[[‘impict’, ‘gend’, ‘age’, ‘edu’, ‘ensi’, ‘fig’, ‘pros’, ‘gros’, ‘ictim’,
      ‘ictco’, ‘icteco’, ‘ictex’, ‘ictsol’, ‘icen’, ‘icsd’, ‘icrp’, ‘iccb’, ‘indent’, ‘indcomp’,
      ‘marcomp’, ‘findchal’, ‘covmp’]]
  •   y = data[‘target_variable’]
  • # Split the data into training and test sets
  •   X_train, X_test, y_train, y_test = train_test_split(X, y, test_size = 0.2,
      random_state = 42)
  • # Normalize the features
  •   scaler = StandardScaler()
  •   X_train = scaler.fit_transform(X_train)
  •   X_test = scaler.transform(X_test)
  • # Train a support vector machine
  •   svm = SVC()
  •   svm.fit(X_train, y_train)
  • # Test the model on the test set
  •   accuracy = svm.score(X_test, y_test)
  •   print(‘Test accuracy:’, accuracy)
The response variable is impact, which refers to the intentions to implement an ICT solution within the enterprise. For validation, 50 observations were taken randomly from the sample, and linear kernel function was used for preprocessing.

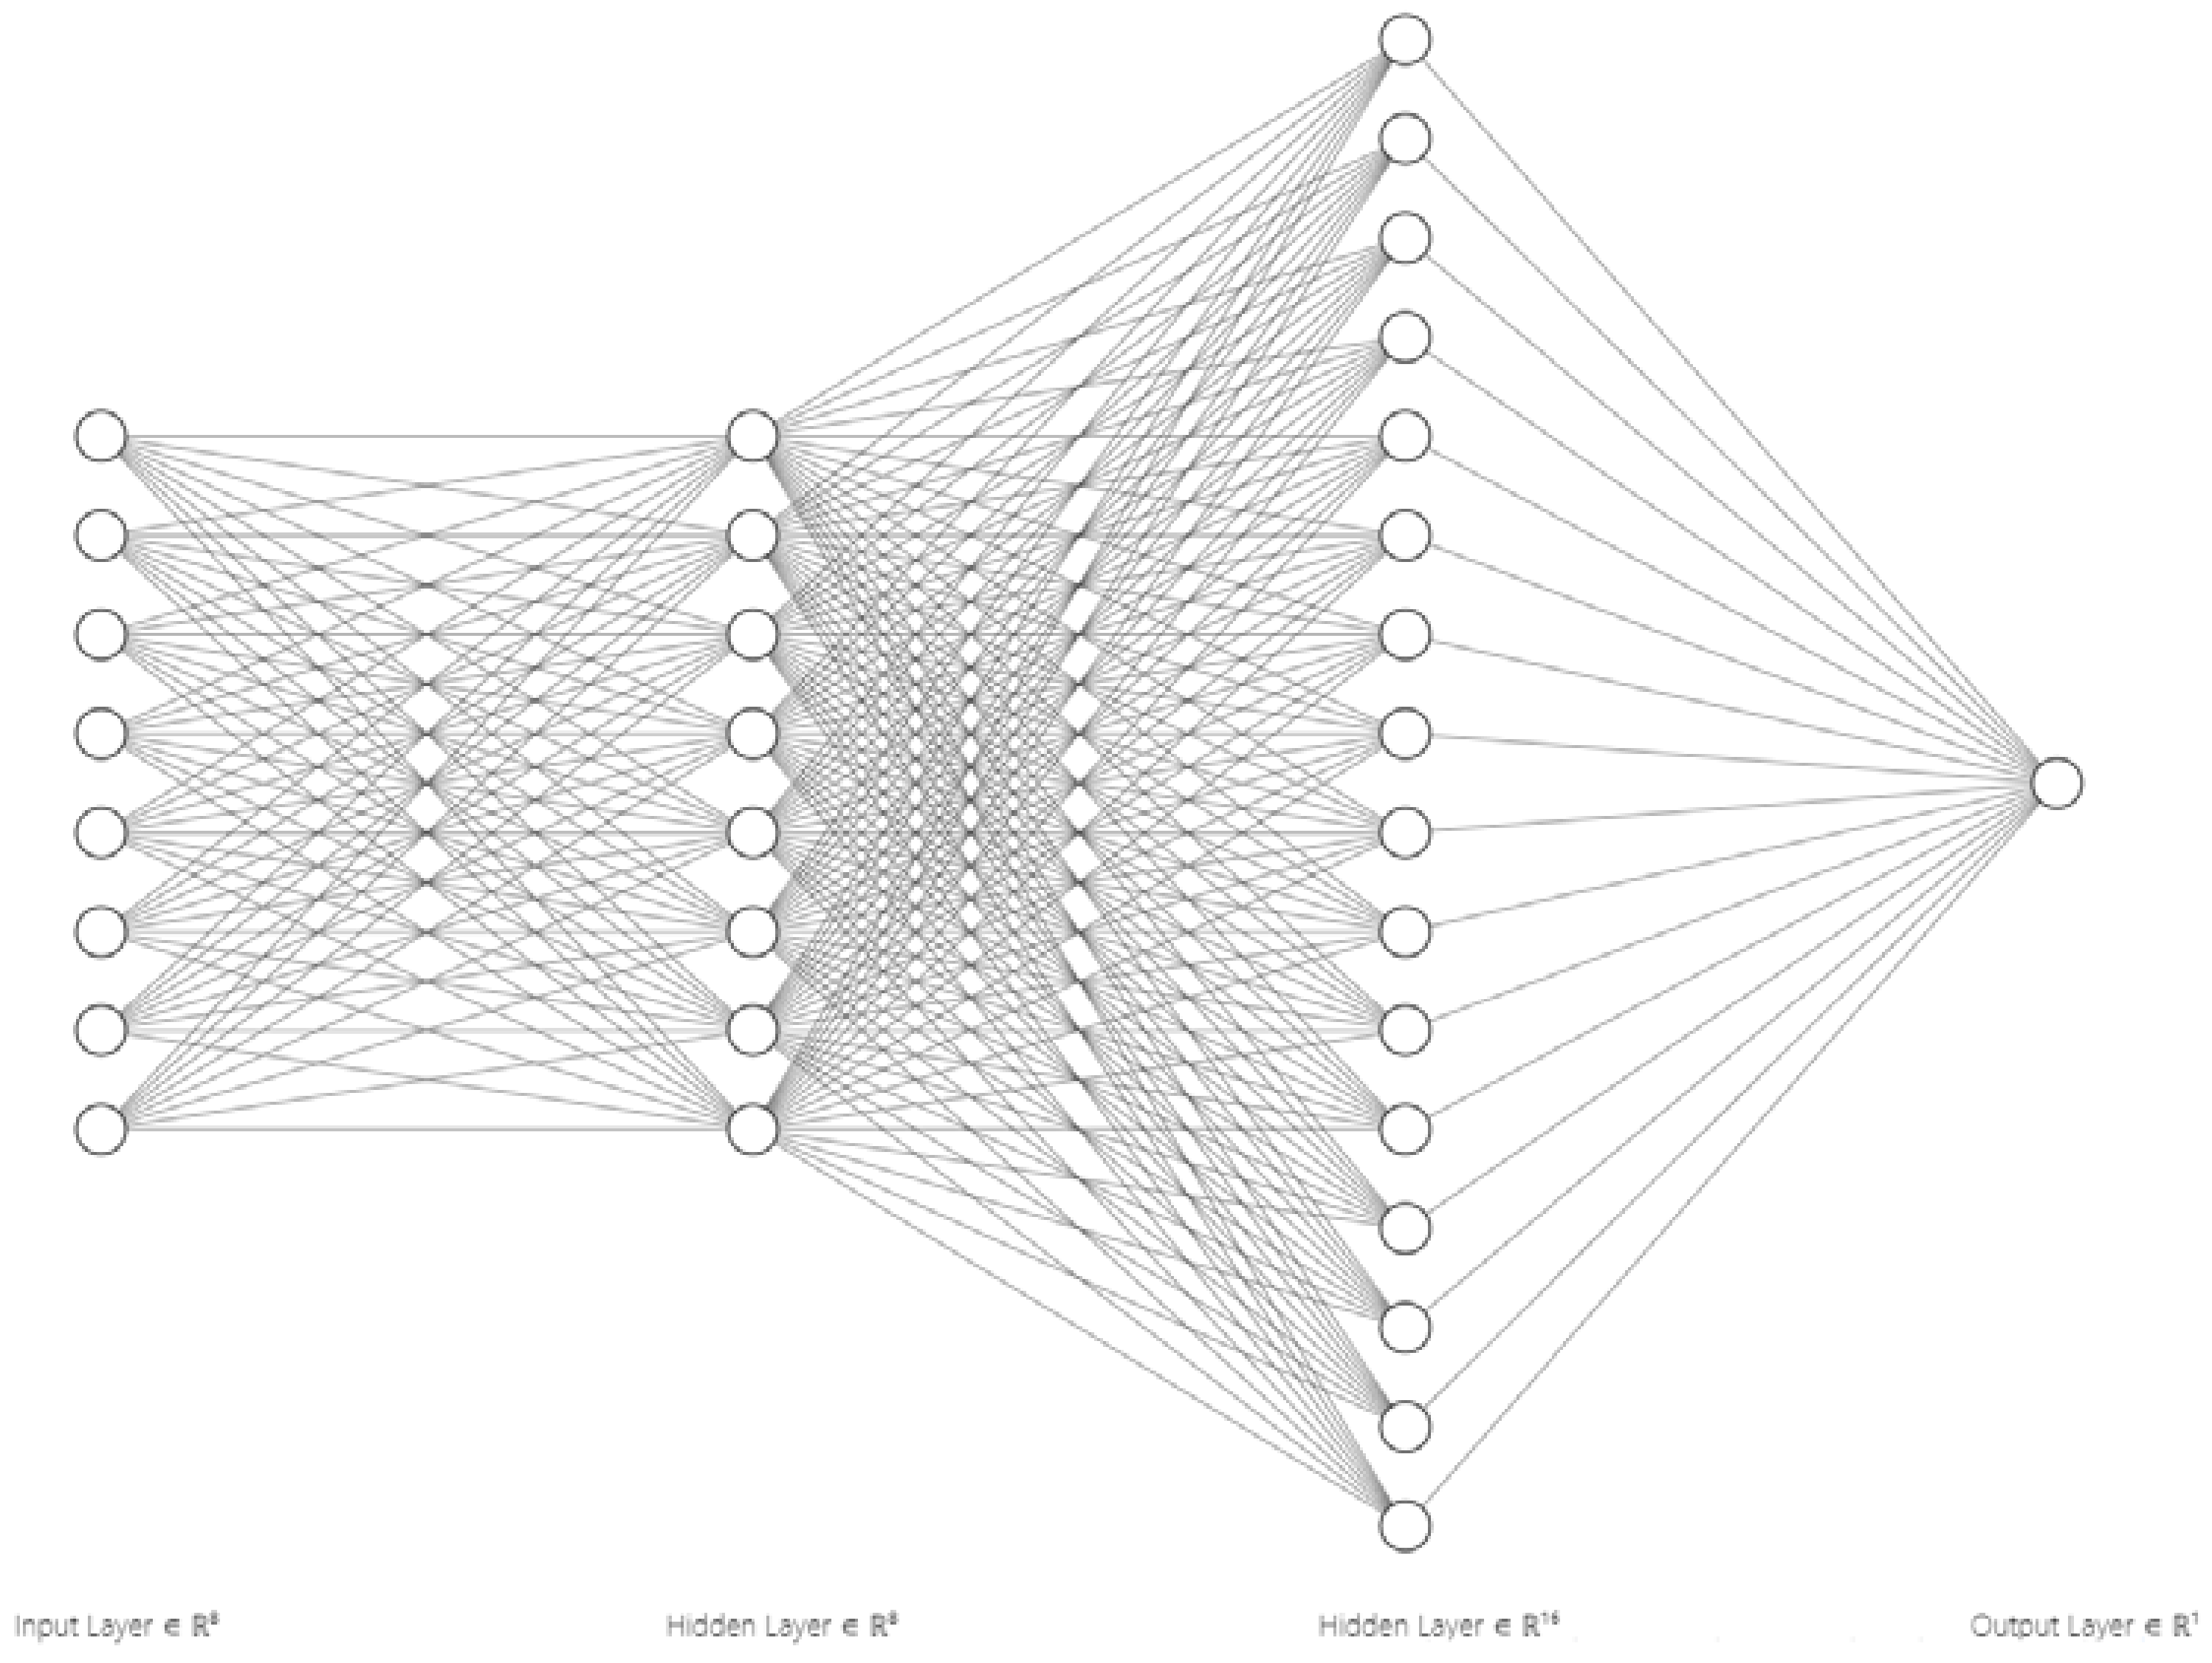
3.4. Feed-Forward Neural Network

In addition to the aforementioned algorithms and statistical approaches, a feed-forward neural network was applied to the dataset. The neural network was trained on the dataset that included the dependent and independent variables. To test the hypotheses, we can use the trained network with different combinations of values for the independent variables to analyze the relationship between each independent variable and the dependent variable. Python and Tensorflow were used for the feed-forward neural network. The Python code for the neural network training is presented in Algorithm 3.
Algorithm 3. Python Cozde for Neural Network Training.
  • import pandas as pd
  • import tensorflow as tf
  • from sklearn.model_selection import train_test_split
  • from sklearn.preprocessing import StandardScaler
  • # Load the survey data
  • df = pd.read_csv(‘enterprisesict_data.csv’)
  • # Split the data into training and testing sets
  • X_train, X_test, y_train, y_test = train_test_split(
  •   df[[‘Manager Age’, ‘Manager Gender’, ‘Manager Education’, ‘Enterprise Size’,
  •     ‘Business Performance’, ‘Awareness of ICT Importance’, ‘Intellectual Capital’, ‘Market Assessment’]],
  •   df[[‘Intentions to Implement ICTs’]],
  •   test_size = 0.3,
  •   random_state = 42)
  • # Normalize the data
  • scaler = StandardScaler()
  • X_train = scaler.fit_transform(X_train)
  • X_test = scaler.transform(X_test)
  • # Define the model architecture
  • model = tf.keras.models.Sequential([
  •   tf.keras.layers.Dense(8, activation = ‘relu’),
  •   tf.keras.layers.Dense(16, activation = ‘relu’),
  •   tf.keras.layers.Dense(1, activation = ‘sigmoid’)
  • ])
  • # Compile the model
  • model.compile(optimizer = ‘adam’, loss = ‘binary_crossentropy’, metrics = [‘accuracy’])
  • # Train the model
  • history = model.fit(X_train, y_train, epochs = 100, batch_size = 32, validation_data = (X_test, y_test))
  • # Evaluate the model on the test set
  • test_loss, test_acc = model.evaluate(X_test, y_test)
  • print(‘Test accuracy:’, test_acc)
  • # Make predictions on the test set
  • y_pred = model.predict(X_test)
  • # Convert predictions from probabilities to binary outputs
  • y_pred = (y_pred > 0.5).astype(int)
  • # Print precision, recall, and F1-score for each class
  • print(classification_report(y_test, y_pred))
The dependent variable in this study was the intention to implement ICTs. As this is a binary classification, a binary cross-entropy was used as the loss function, and the Adam optimizer was used for compiling the model. Categorical variables were encoded using one-hot encoding, and feature values were standardized with StandardScaler. Figure 3. presents the architecture schematics of the neural network used in this study.
The feed-forward neural network has 2 layers, with 8 and 16 neurons for hidden layers and sigmoid activation function for the output layer. The model was trained with a batch size of 32 and for 100 epochs. The accuracy of the model is 85.8%; precision is 91.5; recall is 82.1; and F1-score is 86.8.

4. Results

Due to the large dataset and extensive structured survey, the results of the descriptive statistics are presented in Table A2. (Appendix B). The results of the linear regression analysis are presented in Table 3.
In the linear regression, business performance, awareness of ICT importance, intellectual capital, and market assessment were observed as independent variables or predictors, while ICT implementation intentions were the dependent variable. The linear regression results showed that awareness of ICT importance and intellectual capital did not have a significant influence on ICT implementation intentions. Interestingly, the business performance had a low to medium negative influence, indicating that higher business performance would reduce ICT implementation intentions. The market assessment had a low to moderate positive influence on ICT implementation intentions.
Further, a binary logistic regression was conducted using stepwise regression to select the significant predictor variables automatically. The results of the binary logistic regression are presented in Table 4.
The results indicate that classification success is 82%, sensitivity is 85%, and specificity is 88%. In addition, multicollinearity is tested, and the results are presented in Table 5.
The variance inflation factors (VIFs) are under and slightly above 2.500. The heteroscedasticity is evaluated via the Breusch–Pagan and White test. The results are presented in Table 6. The results indicate that there is no statistically significant correlation.
The p-values of the Breusch–Pagan test and the White test indicate that the distribution of variances is homoscedastic and that there is no heteroscedasticity present in this model.
The QUEST classification decision tree was used to attempt to predict ICT implementation intentions in enterprises. The tree had a yes/no structure. The tree analyzed several influencing features. Cross-validation was also included. In this case, the following features were found to have an effect on ICT implementation intentions:
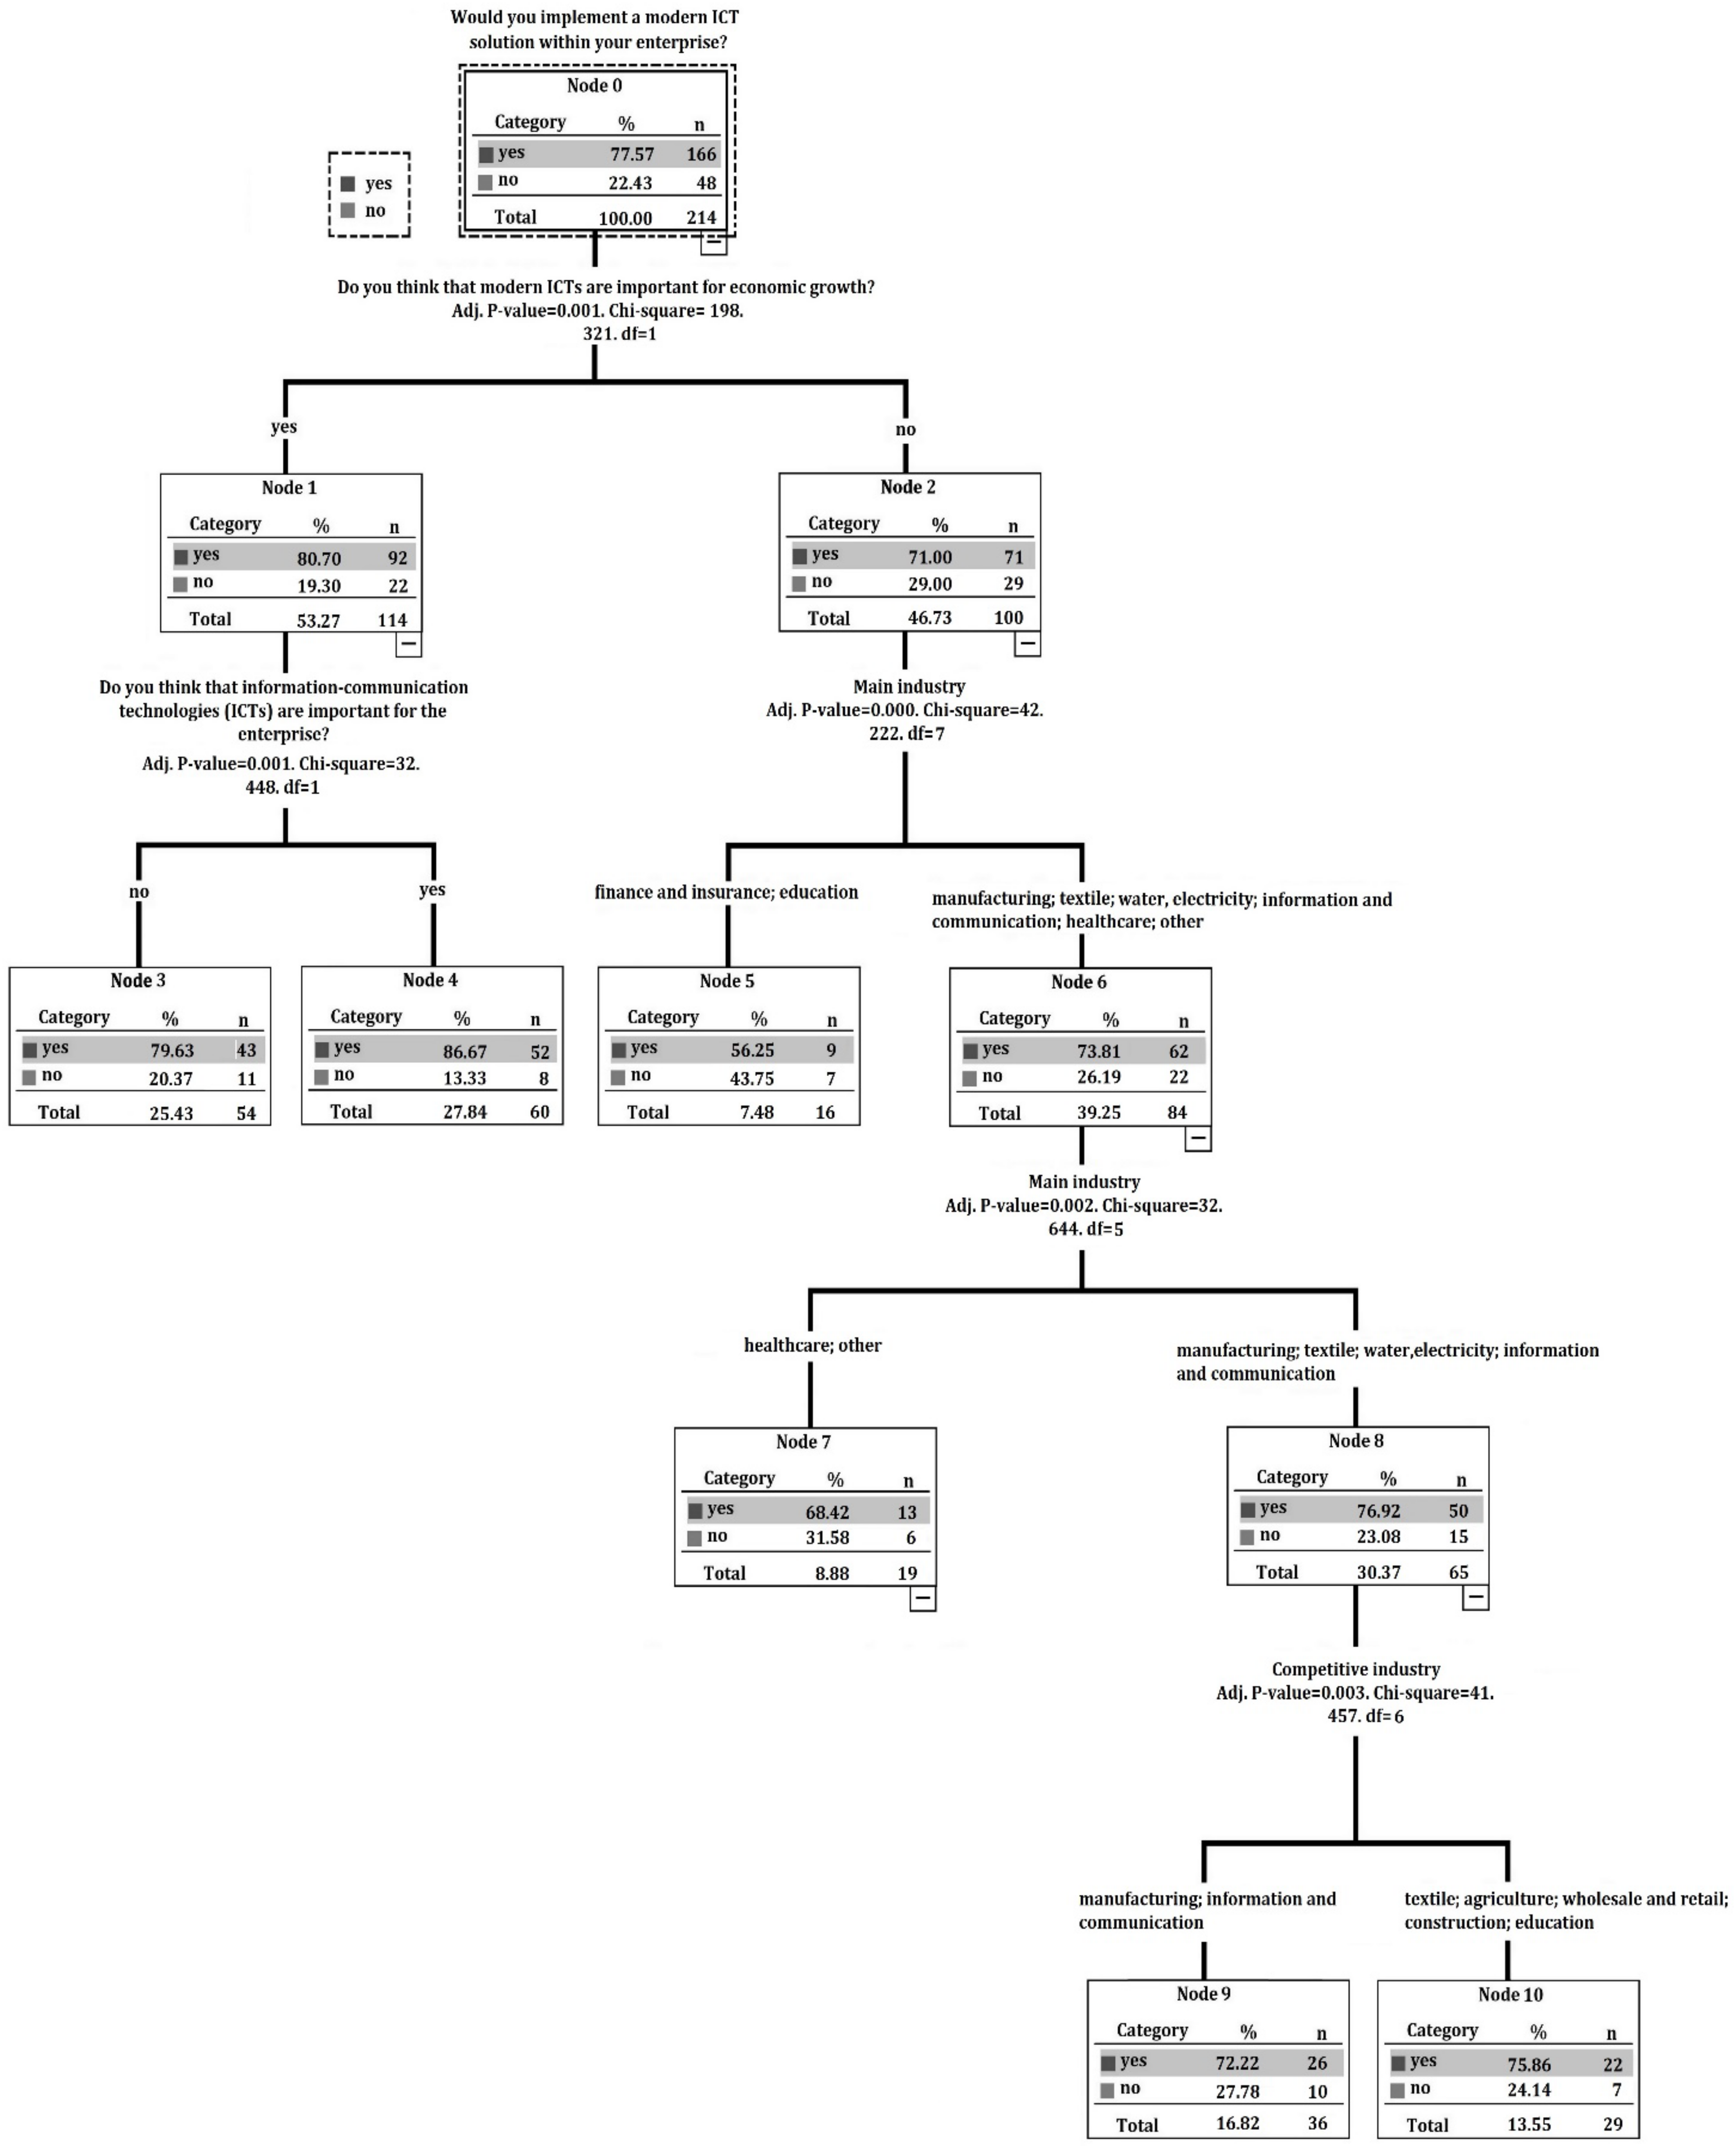
  • Awareness of ICT importance (Do you think that modern ICTs are important for economic growth-ICTECO); (Do you think that information-communication technologies (ICTs) are important for the enterprise? (ICTIM));
  • Market assessment (Main industry in which the enterprise conducts business-INDENT); (In your opinion, what industry is the most competitive? (INDCOMP));
Figure 4 presents the QUEST classification decision tree.
The rules explaining the QUEST algorithm are as follows:
  • N1: if (ICTECO = y),
    then class y = 80.70% and class n = 19.30%;
  • N2: if (ICTECO = n),
    then class y = 71.00% and class n = 29.00%;
  • N3: if (ICTIM = n),
    then class y = 79.63% and class n = 20.37%;
  • N4: if (ICTIM = y),
    then class y = 86.67% and class n = 13.33%;
  • N5: if (INDENT = [finance and insurance] OR [education]),
    then class y = 56.25% and class n = 43.75%;
  • N6: if (INDENT = [manufacturing] OR [textile] OR [water electricity] OR [information and communication] OR [healthcare] OR [other]),
    then class y = 73.81% and class n = 26.19%;
  • N7: if (INDENT = [healthcare] OR [other]),
    then class y = 68.42% and class n = 31.58%;
  • N8: if (INDENT = [manufacturing] OR [textile] OR [water electricity] OR [information and communication]),
    then class y = 76.92% and class n = 23.08%;
  • N9: if (INDCOMP = [manufacturing] OR [information and communication])),
    then class y = 72.22% and class n = 27.78%;
  • N10: if (INDCOMP = [textile] OR [agriculture] OR [wholesale and retail] OR [construction] OR [education]),
    then class y = 75.86% and class n = 24.14%.
In the first step, the model was able to predict 80.7% of the time if the participant thinks that modern ICTs are important for economic growth. In the next step, the model was able to predict ICT application 86.67% of the time.
On the other side of the first split, managers/directors/owners of enterprises who do not think that ICTs are not important for economic growth but who would implement an ICT solution are affected by the industry in which their enterprise conducts business and by the opinions on the most competitive industries. The predictive precision value of this model (risk value) is 0.224 (0.005), which means that a misclassification occurs in 22.4% of the cases. Next, the summary of the optimized SVM classifier is presented in Table 7.
The confusion matrix of the SVM analysis is presented in Table 8.
Following Table 8, the receiver operating characteristic curve–ROC curve is presented in Figure 5.
The ROC curve graphically presents the specificity and sensitivity for different thresholds. The area under the curve (AUC) value is 0.822, indicating that the model has an 82.2% chance of correctly classifying observations in accordance with the positive class. Specifically, the model has an 82.2% probability of accurately determining whether an enterprise owner/manager intends to implement and apply an ICT solution. The AUC equation for the binary SVM classifier is as follows:
AUC = i = 1 n   j = 1 n   [ y i = 1 , y j = 0 ,   f i > f j ] i = 1 n   j = 1 n   y i = 1 , y j = 0
The equation can be noted as a sum of pairwise comparisons between positive and negative samples. These samples are weighted by the predicted scores of the SVM classifier. The term [yi = 1,yj = 0, fi > fj] is computed for each positive sample i and for each negative sample j. If the SVM classifier correctly predicted a higher score for the positive sample i than for the negative j; otherwise, it is 0. The term is then summed up over all pairs (both positive and negative samples) with the goal of obtaining the numerator of the AUC equation. The denominator in the equation is simply the total number of pairwise comparisons between positive and negative samples, regardless of the SVM classifier’s prediction: [yi = 1,yj = 0]. The numerator and denominator are divided to obtain the AUC score.

5. Discussion

5.1. Assessing the Results of the Linear Regression Analysis

This study had two parallel, mutually non-exclusive goals. The first goal was to present multiple statistical methods, ranging from simple to complex, for data analysis and data mining. The second goal aimed to predict ICT implementation intentions in enterprises.
The results of the descriptive statistics do not provide a deeper understanding of the observed factors. No significant observations or causations can be derived. However, some insights can still be obtained. The majority of respondents (77.6%) stated that they would implement an ICT solution within their enterprise.
Next, based on the results of the linear regression analysis, the proposed hypotheses can be assessed as follows:
  • H1a: Manager/director age positively affects intentions to implement and apply ICTs within an enterprise. Did not gain support.
  • H1b: Manager/director gender positively affects intentions to implement and apply ICTs within an enterprise. Did not gain support.
  • H1c: Manager/director education positively affects intentions to implement and apply ICTs within an enterprise. Did not gain support.
  • H1d: Enterprise size positively affects intentions to implement and apply ICTs within an enterprise. Did not gain support.
  • H2: Business performance positively affects intentions to implement and apply ICTs within an enterprise. Did not gain support.
  • H3: Awareness of ICT importance positively affects intentions to implement and apply ICTs within an enterprise. Did not gain support.
  • H4: Intellectual capital positively affects intentions to implement and apply ICTs within an enterprise. Did not gain support.
  • H5: Market assessment positively affects intentions to implement and apply ICTs within an enterprise. Failed to be rejected.
Compared to descriptive statistics, linear regression provides a deeper analysis of the relationship between the independent variables and dependent variables.

5.2. Assessing the Results of the Binary Logistic Regression Analysis

Additional insight is provided by conducting a binary logistic regression analysis. From here, the proposed hypotheses are evaluated as follows:
  • H1a: Manager/director age positively affects intentions to implement and apply ICTs within an enterprise. Did not gain support.
  • H1b: Manager/director gender positively affects intentions to implement and apply ICTs within an enterprise. Did not gain support.
  • H1c: Manager/director education positively affects intentions to implement and apply ICTs within an enterprise. Did not gain support.
  • H1d: Enterprise size positively affects intentions to implement and apply ICTs within an enterprise. Did not gain support.
  • H2: Business performance positively affects intentions to implement and apply ICTs within an enterprise. Failed to be rejected.
  • H3: Awareness of ICT importance positively affects intentions to implement and apply ICTs within an enterprise. Did not gain support.
  • H4: Intellectual capital positively affects intentions to implement and apply ICTs within an enterprise. Did not gain support.
  • H5: Market assessment positively affects intentions to implement and apply ICTs within an enterprise. Failed to be rejected.

5.3. Assessing the Results of the QUEST Algorithm

Further, based on the QUEST decision tree results, the proposed hypotheses are assessed as follows:
  • H1a: Manager/director age positively affects intentions to implement and apply ICTs within an enterprise. Did not gain support.
  • H1b: Manager/director gender positively affects intentions to implement and apply ICTs within an enterprise. Did not gain support.
  • H1c: Manager/director education positively affects intentions to implement and apply ICTs within an enterprise. Did not gain support.
  • H1d: Enterprise size positively affects intentions to implement and apply ICTs within an enterprise. Did not gain support.
  • H2: Business performance positively affects intentions to implement and apply ICTs within an enterprise. Did not gain support.
  • H3: Awareness of ICT importance positively affects intentions to implement and apply ICTs within an enterprise. Failed to be rejected.
  • H4: Intellectual capital positively affects intentions to implement and apply ICTs within an enterprise. Did not gain support.
  • H5: Market assessment positively affects intentions to implement and apply ICTs within an enterprise. Failed to be rejected.

5.4. Assessing the Results of the SVM Classifier

Next, based on the SVM classifier, all of the proposed hypotheses can be noted as failed to be rejected. The SVM classifier parameter included all the predictors, and the results indicate a moderately high percentage of accuracy (82.2%). Therefore, the hypotheses are evaluated as follows:
  • H1a: Manager/director age positively affects intentions to implement and apply ICTs within an enterprise. Failed to be rejected.
  • H1b: Manager/director gender positively affects intentions to implement and apply ICTs within an enterprise. Failed to be rejected.
  • H1c: Manager/director education positively affects intentions to implement and apply ICTs within an enterprise. Failed to be rejected.
  • H1d: Enterprise size positively affects intentions to implement and apply ICTs within an enterprise. Failed to be rejected.
  • H2: Business performance positively affects intentions to implement and apply ICTs within an enterprise. Failed to be rejected.
  • H3: Awareness of ICT importance positively affects intentions to implement and apply ICTs within an enterprise. Failed to be rejected.
  • H4: Intellectual capital positively affects intentions to implement and apply ICTs within an enterprise. Failed to be rejected.
  • H5: Market assessment positively affects intentions to implement and apply ICTs within an enterprise. Failed to be rejected.

5.5. Assessing the Results of the Feed-Forward Neural Network

Finally, the modeled feed-forward neural network was used to assess the proposed hypotheses. The results are as follows:
H1a: Manager/director age positively affects intentions to implement and apply ICTs within an enterprise.
Accuracy (proportion of true positive predictions over the total number of actual positives): 84.6%.
Precision (proportion of true positive predictions over the total number of positive predictions): 75.4%.
Recall (recall of predicting positive intentions): 79.0%.
F1-score (harmonic mean of precision and recall): 77.2%.
Based on the results, the proposed hypothesis failed to be rejected.
H1b: Manager/director gender positively affects intentions to implement and apply ICTs within an enterprise.
Accuracy: 80.7%; Precision: 83.3%; Recall: 77.6%; F1-score: 80.45%.
Based on the results, the proposed hypothesis failed to be rejected.
H1c: Manager/director education positively affects intentions to implement and apply ICTs within an enterprise.
Accuracy: 83.8%; Precision: 73.8%; Recall: 89.1%; F1-score: 81.45%.
Based on the results, the proposed hypothesis failed to be rejected.
H1d: Enterprise size positively affects intentions to implement and apply ICTs within an enterprise.
Accuracy: 83.8%; Precision: 83.2%; Recall: 79.9%; F1-score: 81.55%.
Based on the results, the proposed hypothesis failed to be rejected.
H2: Business performance positively affects intentions to implement and apply ICTs within an enterprise.
Accuracy: 83.8%; Precision: 83.2%; Recall: 79.9%; F1-score: 81.55%.
Based on the results, the proposed hypothesis failed to be rejected.
H3: Awareness of ICT importance positively affects intentions to implement and apply ICTs within an enterprise.
Accuracy: 86.2%; Precision: 81.2%; Recall: 79.4%; F1-score: 80.3%.
Based on the results, the proposed hypothesis failed to be rejected.
H4: Intellectual capital positively affects intentions to implement and apply ICTs within an enterprise.
Accuracy: 87.1%; Precision: 81.4%; Recall: 76,1%; F1-score: 78.75%.
Based on the results, the proposed hypothesis failed to be rejected.
H5: Market assessment positively affects intentions to implement and apply ICTs within an enterprise.
Accuracy: 85.7%; Precision: 92.1%; Recall: 80.0%; F1-score: 86.1%.
Based on the results, the proposed hypothesis failed to be rejected.
It is interesting to note that various statistical methods produced different results with varying levels of detail. It is important for data mining processes to avoid bias and to set up parameters properly. In this study, the QUEST algorithm was chosen over other classifiers, such as CHAID (chi-squared automatic interaction detection) and CART (classification and regression tree), as it was deemed most appropriate for a dataset that includes ordinal, nominal, and quantitative data. Additionally, the support-vector machine (SVM) provided significant insights into the use of machine learning in data mining. Similarly, the feed-forward neural network produced similar results regarding the evaluation of the hypotheses.

5.6. Other Studies

Feed-forward neural networks have gained significant attention for their flexibility and ability to process large datasets, often achieving training accuracy between 78% to 95%, depending on the dataset [77]. In this study, the accuracy of the trained model falls within the noted range. Neural networks can be applied in various fields, including mechanics, physics, chemistry, genetics, optimization, transport, material testing, and more [78,79]. The role of neural networks in this study was to provide a contrast to the main approach, which was SVM. Compared to neural networks, SVM is powerful even with limited information and modest dataset sizes, making it more appropriate for this study’s dataset of 214 employees [80]. SVMs have been successfully used for face detection, text categorization, data classification, image classification, and other applications across various industries [81]. Therefore, the approach taken in this study is appropriate, given the flexibility and wide range of applications of SVM. There are a lot of studies that applied SVMs to datasets from various sources. This study manages to present a basic-to-complex approach in data mining and a contrasting example of applying neural networks.

5.7. Limitations, Future Research, and Implications

The study has several limitations that should be taken into consideration in future research. The limitations of this study include the following:
  • Mainly English literature in the theoretical background section;
  • Unexplained variance in the results, which indicates that there may be other factors that affect the dependent variable (this is expected with social studies);
  • Pie charts and histograms were not developed;
  • Analysis was conducted only on enterprises within Serbia. However, transitional economies tend to have the same issues when it comes to competitiveness.
  • Extensive equations were not included (the methods derive from well-established equations).
Considering the noted limitations, the study still contributes to the existing body of the literature in the domain of statistical methods in data analysis/data mining.
For future research, the following is recommended:
  • Consider the limitations noted above;
  • Use a structured approach to future research;
  • Introduce additional predictor factors such as human resource management, employee productivity, and marketing management;
  • Analyze datasets consisting of enterprises from other countries and compare them to this current paper’s findings;
  • Conduct meta-analysis when similar studies are published;
  • Apply CHART, CHAID, and other classifiers in future studies.
Practical implications of the results presented in this manuscript include:
  • Governments (increasing strategic incentive programs for ICT adoption across industries would improve national competitiveness).
  • Schools and universities can address this paper by presenting the necessity and imperative role of ICTs in the modern global economy.
  • Fellow scholars can address this study for their own research. This paper provides an adequate basis and guidelines for future analysis in this domain.
Overall, the study expands the existing body of literature from two significant aspects. Firstly, it applies statistical methods to a robust dataset. Secondly, it addresses trending aspects of the modern business environment. No other similar studies were conducted, and the findings can be used in future research.

6. Conclusions

In this paper, various statistical methods were applied to analyze potential predictor variables in order to understand their influence on ICT implementation intentions in enterprises. The results showed that different statistical methods provided different outcomes, highlighting the importance of selecting appropriate methods in data mining. Descriptive statistics provided an overview of the analyzed dataset, while regression analyses (linear and binary logistic) provided additional insights. The QUEST algorithm indicates that opinions on ICT’s importance for economic growth and opinions on ICT’s importance for the enterprise affect ICT implementation intentions. The SVM classifier demonstrated the potential of machine learning for data mining. Finally, a feed-forward neural network was trained with the dataset in contrast to the previously conducted methods. Future studies are recommended to analyze multiple classifiers across different datasets to further broaden the application of statistical methods.
Overall, this research provides valuable insights into the potential factors influencing ICT implementation intentions and establishes a foundation for future studies in the field.

Author Contributions

M.B. conceptualization, writing, and original draft preparation; D.C. project administration and supervision; M.K. investigation; E.T.S. editing; V.G. data curation. All authors have read and agreed to the published version of the manuscript.

Funding

This research was funded by the Provincial Secretariat for Higher Education and Scientific Research of the Autonomous Province of Vojvodina, number: 142-451-2706/2021-01.

Institutional Review Board Statement

The study did not require a Review Board Statement.

Informed Consent Statement

The survey was anonymous, and no personal data were collected. No experiments were conducted on humans.

Data Availability Statement

The data presented in this study are available on request from the corresponding author.

Conflicts of Interest

The authors declare no conflict of interest.

Appendix A

Survey items, codes, attributes, available answers, and variables are presented in Table A1.
Table A1. Survey, attributes, available answers, and predictor groups.
First Predictor Group: Sample Size and Structure (Demographic Information)
LabelVariableAvailable Answers
GENDGender
Male
Female
AGEAgeevery age is observed individually
EDUEducation (acquaired)
HS
BSc
MSc
PhD
ENSIEnterprise size
micro (<10 employees)
small (10–49 employees)
medium (50–249 employees)
large (250 > employees)
Second predictor group: Business performance
CodeAttributeAvailable answers
ENBUDo you think that the enterprise’s business performance is satisfactory?
Yes
No
QPSQuality of products is satisfactory.
Agree
Mostly agree
Don’t know
Mostly disagree
Disagree
FIGFinancial goals are easily achieved.
Agree
Mostly agree
Don’t know
Mostly disagree
Disagree
PROSStrategic long-term profitability is sustainable.
Agree
Mostly agree
Don’t know
Mostly disagree
Disagree
GROSGrowth of new customers and customer retention is adequate.
Agree
Mostly agree
Don’t know
Mostly disagree
Disagree
Third predictor group: Awareness of ICT importance
CodeAttributeAvailable answers
ICTIMDo you think that information-communication technologies (ICTs) are important for the enterprise?
Yes
No
ICTCODo you think enterprises that implement modern ICTs are more competitive compared to enterprises that don’t?
Yes
No
ICTECODo you think that modern ICTs are important for economic growth?
Yes
No
ICTEXDo you think ICTs are expensive compared to what improvements they offer to the enterprise?
Yes
No
ICTSOLWhat kind of ICT solution do you think can help an enterprise when it comes to conducting business?
Cloud-based solution
ERP system
Management information system
Decision-making support system
Other
Fourth predictor group: Intellectual capital
CodeAttributeAvailable answers
ICENIntellectual capital is effectively applied in the enterprise.
Agree
Mostly agree
Don’t know
Mostly disagree
Disagree
ICSDIntellectual capital is applied to make strategic decisions.
Agree
Mostly agree
Don’t know
Mostly disagree
Disagree
ICRPIntellectual capital is reported periodically within the enterprise.
Agree
Mostly agree
Don’t know
Mostly disagree
Disagree
ICCBIntellectual capital is regarded as an important part of conducting business.
Yes
No
Fifth predictor group: Market assessment
CODEAttributeAvailable answers
INDENTMain industry within the enterprise conducts business
manufacturing
textile
agriculture
mining and quarrying
information and communication
wholesale and retail
construction
finance and insurance
healthcare and social work
water, electricity, gas supply
education
other
INDCOMPIn your opinion, what industry is the most competitive?
manufacturing
textile
agriculture
mining and quarrying
information and communication
wholesale and retail
construction
finance and insurance
healthcare and social work
water, electricity, gas supply
education
other
MARCOMPDo you think the market is competitive within your enterprise’s industry?
Yes
No
FINDCHALDo you think the fourth industrial revolution has brought additional challenges to enterprises?
Yes
No
COVMPDo you think the COVID-19 pandemic has negatively affected the enterprise’s market performance?
Yes
No
Dependent variable: Intention to implement and modern ICT solution
CODEAttributeAvailable answers
IMPICT
(dependent variable)
Would you implement a modern ICT solution within your enterprise?
Yes
No

Appendix B

The results of the descriptive statistics are presented in Table A2.
Table A2. Descriptive statistics.
Sample Size and Structure (Demographic Information)
GenderMale (135 answers; 63.08%)
Female (79 answers; 36.92%)
AgeMean 43.47
Variance 52.27
Standard deviation 7.23
Median 41
Mode 40
Percentages:
29 (2 answers; 0.93%)
32 (7 answers; 3.27%)
33 (5 answers; 2.34%)
36 (11 answers; 5.14%)
37 (15 answers; 7.01%)
38 (22 answers; 10.28%)
40 (31 answers; 14.49%)
41 (28 answers; 13.08%)
42 (11 answers; 5.14%)
45 (17 answers; 7.79%)
49 (14 answers; 6.54%)
50 (2 answers; 0.93%)
51 (8 answers; 3.74%)
52 (5 answers; 2.34%)
53 (14 answers; 6.54%)
55 (3 answers; 1.40%)
56 (6 answers; 2.80%)
57 (4 answers; 1.87%)
58 (4 answers; 1.87%)
59 (4 answers; 1.87%)
61 (1 respondent; 0.47%)
Education (completed)HS (5 answers; 2.34%)
BSc (159 answers; 74.30%)
MSc (42 answers; 19.63%)
PhD (8 answers, 3.74%)
Enterprise sizemicro (<10 employees) (78 answers, 36.45%)
small (10–49 employees) (105 answers, 49.07%)
medium (50–249 employees) (25 answers, 11.68%)
large (250 > employees) (6 answers, 2.80%)
Business performance
Do you think that the enterprise’s business performance is satisfactory?Yes (85 answers; 39.5%)
No (129 answers; 60.5%)
Quality of products is satisfactory.Agree (52 answers; 24.1%)
Mostly agree (43 answers; 20.3%)
Don’t know (35 answers; 16.4%)
Mostly disagree (60 answers; 28%)
Disagree (24 answers; 11.2%)
Financial goals are easily achieved. Agree (17 answers; 7.9%)
Mostly agree (42 answers; 19.4%)
Don’t know (39 answers; 18.4%)
Mostly disagree (82 answers; 38.5%)
Disagree (34 answers; 15.8%)
Strategic long-term profitability is sustainable.Agree (52 answers; 24.4%)
Mostly agree (13 answers; 6.1%)
Don’t know (38 answers; 17.7%)
Mostly disagree (41 answers; 19.1%)
Disagree (70 answers; 32.7%)
Growth of new customers and customer retention is adequate.Agree (90 answers; 41.9%)
Mostly agree (30 answers; 14%)
Don’t know (10 answers; 4.7%)
Mostly disagree (42 answers; 19.8%)
Disagree (42 answers; 19.6%)
Awareness of ICT importance
Do you think that information-communication technologies (ICTs) are important for the enterprise?Yes (100 responses; 46.4%)
No (114 responses; 53.6%)
Do you think enterprises that implement modern ICTs are more competitive compared to enterprises that don’t?Yes (95 responses; 44.6%)
No (119 responses; 55.4%)
Do you think that modern ICTs are important for economic growth?Yes (113 responses; 52.7%)
No (101 responses; 47.3%)
Do you think ICTs are expensive compared to what improvements they offer to the enterprise?Yes (120 responses; 56.2%)
No (94 responses; 43.8%)
What kind of ICT solution do you think can help an enterprise when it comes to conducting business?Cloud-based solution (131 responses; 61.2%)
ERP system (10 responses; 4.7%)
Management information system (27 responses; 12.7%)
Decision making support system (18 responses; 8.3%)
Other (28 responses; 13.1%)
Would you implement a modern ICT solution within your enterprise?Yes 166 (166 responses; 77.6%)
No 48 (48 responses; 22.4%)
Intellectual capital
Intellectual capital is effectively applied in the enterprise.Agree (52 answers; 24.5%)
Mostly agree (25 answers; 11.4%)
Don’t know (30 answers; 13.9%)
Mostly disagree (80 answers; 37.5%)
Disagree (27 answers; 12.7%)
Intellectual capital is applied to make strategic decisions.Agree (53 answers; 24.7%)
Mostly agree (24 answers; 11.6%)
Don’t know (79 answers; 36.9%)
Mostly disagree (27 answers; 12.5%)
Disagree (31 answers; 14.3%)
Intellectual capital is reported periodically within the enterprise.Agree (69 answers; 32.14%)
Mostly agree (54 answers; 25.4%)
Don’t know (25 answers; 11.6%)
Mostly disagree (48 answers; 22.5%)
Disagree (18 answers; 8.36%)
Intellectual capital is regarded as an important part of conducting business.Yes (57 answers; 26.6%)
No (157 answers; 73.4%)
Market assessment
Main industry within the enterprise conducts business
  • manufacturing (58 answers; 27%)
  • textile (28 answers; 13%)
  • agriculture (4 answers; 2%)
  • mining and quarrying (2 answers; 1%)
  • information and communication (41 answers; 19%)
  • wholesale and retail (9 answers; 4%)
  • construction (9 answers; 4%)
  • finance and insurance (26 answers; 12%)
  • healthcare and social work (9 answers; 4%)
  • water, electricity, gas supply (12 answers; 6%)
  • education (10 answers; 5%)
  • other (6 answers; 3%)
In your opinion, what industry is the most competitive?
  • manufacturing (62 answers; 29%)
  • textile (19 answers; 9%)
  • agriculture (24 answers; 11%)
  • mining and quarrying (4 answers; 2%)
  • information and communication (28 answers; 13%)
  • wholesale and retail (32 answers; 15%)
  • construction (9 answers; 4%)
  • finance and insurance (6 answers; 3%)
  • healthcare and social work (9 answers; 4%)
  • water, electricity, gas supply (6 answers; 3%)
  • education (9 answers; 4%)
  • other (6 answers; 3%)
Do you think the market is competitive within your enterprise’s industry?Yes (90 answers; 42.3%)
No (124 answers; 57.7%)
Do you think the fourth industrial revolution has brought additional challenges to enterprises?Yes (127 answers; 59.4%)
No (87 answers; 40.6%)
Do you think the COVID-19 pandemic has negatively affected the enterprise’s market performance?Yes (144 answers; 67.45%)
No (70 answers; 32.55%)

References

  1. Ulutaş, A.; Meidute-Kavaliauskiene, I.; Topal, A.; Demir, E. Assessment of Collaboration-Based and Non-Collaboration-Based Logistics Risks with Plithogenic SWARA Method. Logistics 2021, 5, 82. [Google Scholar] [CrossRef]
  2. Özdemir, L. Testing for Asymmetric Causality Between Developed and Emerging Markets. In Uncertainty and Challenges in Contemporary Economic Behaviour; Emerald Studies in Finance, Insurance, and Risk Management; Emerald Publishing Limited: Bingley, UK, 2020; pp. 145–158. [Google Scholar] [CrossRef]
  3. Bakator, M.; Đorđević, D.; Ćoćkalo, D. Developing a model for improving business and competitiveness of domestic enterprises. J. Eng. Manag. Compet. 2019, 9, 287–296. [Google Scholar] [CrossRef]
  4. Surya, B.; Menne, F.; Sabhan, H.; Suriani, S.; Abubakar, H.; Idris, M. Economic Growth, Increasing Productivity of SMEs, and Open Innovation. J. Open Innov. Technol. Mark. Complex. 2021, 7, 20. [Google Scholar] [CrossRef]
  5. Ćoćkalo, D.; Đorđević, D.; Bogetić, S.; Bakator, M. Youth entrepreneurship development: A review of literature and ten-year research results. J. Eng. Manag. Competitiveness 2020, 10, 151–161. [Google Scholar] [CrossRef]
  6. Fani, V.; Antomarioni, S.; Bandinelli, R.; Ciarapica, F.E. Data Mining and Augmented Reality: An Application to the Fashion Industry. Appl. Sci. 2023, 13, 2317. [Google Scholar] [CrossRef]
  7. Barba-Sánchez, V.; Calderón-Milán, M.J.; Atienza-Sahuquillo, C. A Study of the Value of ICT in Improving Corporate Performance: A Corporate Competitiveness View. Technol. Econ. Dev. Econ. 2018, 24, 1388–1407. [Google Scholar] [CrossRef] [Green Version]
  8. Alam, M.M.D.; Al Karim, R.; Habiba, W. The relationship between CRM and customer loyalty: The moderating role of customer trust. Int. J. Bank Mark. 2021, 39, 1248–1272. [Google Scholar] [CrossRef]
  9. Hamby, A.; Brinberg, D. Cause-Related Marketing Persuasion Knowledge: Measuring Consumers’ Knowledge and Ability to Interpret CrM Promotions. J. Consum. Aff. 2017, 52, 373–392. [Google Scholar] [CrossRef]
  10. Zand, J.D.; Keramati, A.; Shakouri, F.; Noori, H. Assessing the impact of customer knowledge management on organizational performance. Knowl. Process. Manag. 2018, 25, 268–278. [Google Scholar] [CrossRef]
  11. Rua, O.; França, A.; Ortiz, R.F. Key drivers of SMEs export performance: The mediating effect of competitive advantage. J. Knowl. Manag. 2018, 22, 257–279. [Google Scholar] [CrossRef]
  12. Djalic, N.; Nikolic, M.; Bakator, M.; Erceg, Z. Modeling the Influence of Information Systems on Sustainable Business Performance and Competitiveness. Sustainability 2021, 13, 9619. [Google Scholar] [CrossRef]
  13. Nurqamarani, A.S.; Sogiarto, E.; Nurlaeli, N. Technology Adoption in Small-Medium Enterprises based on Technology Ac-ceptance Model: A Critical Review. J. Info. Sys. Eng. Bus. Intel. 2021, 7, 2, 162–172. [Google Scholar] [CrossRef]
  14. Molero, G.D.; Santarremigia, F.E.; Poveda-Reyes, S.; Mayrhofer, M.; Awad-Núñez, S.; Kassabji, A. Key factors for the implementation and integration of innovative ICT solutions in SMEs and large companies involved in the multimodal transport of dangerous goods. Eur. Transp. Res. Rev. 2019, 11, 28. [Google Scholar] [CrossRef]
  15. Ghobakhloo, M. Industry 4.0, digitization, and opportunities for sustainability. J. Clean. Prod. 2019, 252, 119869. [Google Scholar] [CrossRef]
  16. Javaid, M.; Haleem, A.; Vaishya, R.; Bahl, S.; Suman, R.; Vaish, A. Industry 4.0 technologies and their applications in fighting COVID-19 pandemic. Diabetes Metab. Syndr. Clin. Res. Rev. 2020, 14, 419–422. [Google Scholar] [CrossRef]
  17. Bai, C.; Dallasega, P.; Orzes, G.; Sarkis, J. Industry 4.0 technologies assessment: A sustainability perspective. Int. J. Prod. Econ. 2020, 229, 107776. [Google Scholar] [CrossRef]
  18. Kumar, R.; Singh, R.K.; Dwivedi, Y.K. Application of industry 4.0 technologies in SMEs for ethical and sustainable operations: Analysis of challenges. J. Clean. Prod. 2020, 275, 124063. [Google Scholar] [CrossRef] [PubMed]
  19. Trzaska, R.; Sulich, A.; Organa, M.; Niemczyk, J.; Jasiński, B. Digitalization Business Strategies in Energy Sector: Solving Problems with Uncertainty under Industry 4.0 Conditions. Energies 2021, 14, 7997. [Google Scholar] [CrossRef]
  20. Aslam, F.; Aimin, W.; Li, M.; Ur Rehman, K. Innovation in the Era of IoT and Industry 5.0: Absolute Innovation Management (AIM) Framework. Information 2020, 11, 124. [Google Scholar] [CrossRef] [Green Version]
  21. Maddikunta, P.K.R.; Pham, Q.-V.; Prabadevi, B.; Deepa, N.; Dev, K.; Gadekallu, T.R.; Ruby, R.; Liyanage, M. Industry 5.0: A survey on enabling technologies and potential applications. J. Ind. Inf. Integr. 2021, 26, 100257. [Google Scholar] [CrossRef]
  22. Quintero-Quintero, W.; Blanco-Ariza, A.B.; Garzón-Castrillón, M.A. Intellectual Capital: A Review and Bibliometric Analysis. Publications 2021, 9, 46. [Google Scholar] [CrossRef]
  23. Ali, M.A.; Hussin, N.; Haddad, H.; Al-Araj, R.; Abed, I.A. Intellectual Capital and Innovation Performance: Systematic Literature Review. Risks 2021, 9, 170. [Google Scholar] [CrossRef]
  24. Secundo, G.; Ndou, V.; Del Vecchio, P.; De Pascale, G. Sustainable development, intellectual capital and technology policies: A structured literature review and future research agenda. Technol. Forecast. Soc. Chang. 2020, 153, 119917. [Google Scholar] [CrossRef]
  25. Alvino, F.; Di Vaio, A.; Hassan, R.; Palladino, R. Intellectual capital and sustainable development: A systematic literature review. J. Intellect. Cap. 2020, 22, 76–94. [Google Scholar] [CrossRef]
  26. Juergensen, J.; Guimón, J.; Narula, R. European SMEs amidst the COVID-19 crisis: Assessing impact and policy responses. J. Ind. Bus. Econ. 2020, 47, 499–510. [Google Scholar] [CrossRef]
  27. Mubarak, M.F.; Petraite, M. Industry 4.0 technologies, digital trust and technological orientation: What matters in open in-novation? Technol Forecast. Soc. Chang. 2020, 161, 120332. [Google Scholar] [CrossRef]
  28. Zheng, T.; Ardolino, M.; Bacchetti, A.; Perona, M. The applications of Industry 4.0 technologies in manufacturing context: A systematic literature review. Int. J. Prod. Res. 2020, 59, 1922–1954. [Google Scholar] [CrossRef]
  29. Amoako, T.; Sheng, Z.H.; Dogbe, C.S.K.; Pomegbe, W.W.K. Effect of internal integration on SMEs’ performance: The role of external integration and ICT. Int. J. Prod. Perform. Manag. 2020, 71, 643–665. [Google Scholar] [CrossRef]
  30. Cataldo, A.; Pino, G.; McQueen, R.J. Size matters: The impact of combinations of ICT assets on the performance of Chilean micro, small and medium enterprises. Inf. Technol. Dev. 2019, 26, 292–315. [Google Scholar] [CrossRef]
  31. Arsawan, I.W.E.; Koval, V.; Rajiani, I.; Rustiarini, N.W.; Supartha, W.G.; Suryantini, N.P.S. Leveraging knowledge sharing and innovation culture into SMEs sustainable competitive advantage. Int. J. Prod. Perform. Manag. 2020, 71, 405–428. [Google Scholar] [CrossRef]
  32. Abdissa, G.; Ayalew, A.; Illés, C.B.; Dunay, A. Effects of Corporate Entrepreneurship Dimensions on Organizational Performance: Case of Small and Medium Enterprises in Holeta Town, Ethiopia. J. Open Innov. Technol. Mark. Complex. 2021, 7, 234. [Google Scholar] [CrossRef]
  33. Stroumpoulis, A.; Kopanaki, E.; Karaganis, G. Examining the Relationship between Information Systems, Sustainable SCM, and Competitive Advantage. Sustainability 2021, 13, 11715. [Google Scholar] [CrossRef]
  34. Yoon, J.; Sung, S.; Ryu, D. The Role of Networks in Improving International Performance and Competitiveness: Perspective View of Open Innovation. Sustainability 2020, 12, 1269. [Google Scholar] [CrossRef]
  35. Liñán, F.; Paul, J.; Fayolle, A. SMEs and entrepreneurship in the era of globalization: Advances and theoretical approaches. Small Bus. Econ. 2019, 55, 695–703. [Google Scholar] [CrossRef]
  36. Gujrati, R. Trends toward globalization: Challenges & issues. Splint Int. J. Prof. 2019, 6, 63–72. [Google Scholar]
  37. Wen, Y. Remote sensing image land type data mining based on QUEST decision tree. Clust. Comput. 2018, 22, 8437–8443. [Google Scholar] [CrossRef]
  38. Kahraman, C.; Cevik Onar, S.; Oztaysi, B.; Sari, I.U.; Cebi, S.; Tolga, A.C. (Eds.) Intelligent and Fuzzy Techniques: Smart and Innovative Solutions. In Advances in Intelligent Systems and Computing; Springer: Berlin/Heidelberg, Germany, 2021. [Google Scholar] [CrossRef]
  39. Djordjevic, D.; Cockalo, D.; Bogetic, S.; Bakator, M. Predicting Entrepreneurial Intentions among the Youth in Serbia with a Classification Decision Tree Model with the QUEST Algorithm. Mathematics 2021, 9, 1487. [Google Scholar] [CrossRef]
  40. Acioli, C.; Scavarda, A.; Reis, A. Applying Industry 4.0 technologies in the COVID–19 sustainable chains. Int. J. Prod. Perform. Manag. 2021, 70, 988–1016. [Google Scholar] [CrossRef]
  41. Cyfert, S.; Glabiszewski, W.; Zastempowski, M. Impact of Management Tools Supporting Industry 4.0 on the Importance of CSR during COVID-19. Generation Z. Energies 2021, 14, 1642. [Google Scholar] [CrossRef]
  42. Nahavandi, S. Industry 5.0—A Human-Centric Solution. Sustainability 2019, 11, 4371. [Google Scholar] [CrossRef] [Green Version]
  43. Sachs, J.D.; Schmidt-Traub, G.; Mazzucato, M.; Messner, D.; Nakicenovic, N.; Rockström, J. Six Transformations to achieve the Sustainable Development Goals. Nat. Sustain. 2019, 2, 805–814. [Google Scholar] [CrossRef]
  44. De Felice, F.; Travaglioni, M.; Petrillo, A. Innovation Trajectories for a Society 5.0. Data 2021, 6, 115. [Google Scholar] [CrossRef]
  45. Santoro, G.; Usai, A. Knowledge exploration and ICT knowledge exploitation through human resource management: A study of Italian firms. Manag. Res. Rev. 2018, 41, 701–715. [Google Scholar] [CrossRef]
  46. Chatterjee, S.; Chaudhuri, R.; Vrontis, D.; Thrassou, A.; Ghosh, S.K. ICT-enabled CRM system adoption: A dual Indian qualitative case study and conceptual framework development. J. Asia Bus. Stud. 2020, 15, 257–277. [Google Scholar] [CrossRef]
  47. Salau, O.; Osibanjo, A.; Adeniji, A.; Igbinoba, E. An integrated dataset on organisational retention attributes and commitment of selected ICT and accounting firms. Data Brief 2018, 18, 1930–1936. [Google Scholar] [CrossRef]
  48. Minashkina, D.; Happonen, A. A Systematic Literature Mapping of Current Academic Research Connecting Sustainability into the Warehouse Management Systems Context. Curr. Approaches Sci. Technol. Res. 2021, 5, 52–80. [Google Scholar]
  49. Dolan-Canning, R. Sensor-based and cognitive assistance systems in industry 4.0: Big data analytics, smart production, and sustainable value creation. Econ. Manag. Financ. Mark. 2019, 14, 3, 16–22. [Google Scholar]
  50. Karunagaran, S.; Mathew, S.K.; Lehner, F. Differential cloud adoption: A comparative case study of large enterprises and SMEs in Germany. Inf. Syst. Front. 2017, 21, 861–875. [Google Scholar] [CrossRef]
  51. Shen, H.; Fu, M.; Pan, H.; Yu, Z.; Chen, Y. The Impact of the COVID-19 Pandemic on Firm Performance. Emerg. Mark. Finance Trade 2020, 56, 2213–2230. [Google Scholar] [CrossRef]
  52. Caballero-Morales, S.-O. Innovation as recovery strategy for SMEs in emerging economies during the COVID-19 pandemic. Res. Int. Bus. Finance 2021, 57, 101396. [Google Scholar] [CrossRef]
  53. Fukuyama, M. Society 5.0: Aiming for a New Human-Centered Society. Jpn. Spotlight 2018, 1, 47–50. [Google Scholar]
  54. Potočan, V.; Mulej, M.; Nedelko, Z. Society 5.0: Balancing of Industry 4.0, economic advancement and social problems. Kybernetes 2020, 50, 794–811. [Google Scholar] [CrossRef]
  55. Onday, O. Japan’s society 5.0: Going beyond Industry 4.0. Bus. Econ. J. 2019, 10, 1–6. [Google Scholar]
  56. Skobelev, P.O.; Borovik, S.Y. On the way from Industry 4.0 to Industry 5.0: From digital manufacturing to digital society. Industry 4.0 2017, 2, 307–311. [Google Scholar]
  57. Zengin, Y.; Naktiyok, S.; Kaygın, E.; Kavak, O.; Topçuoğlu, E. An Investigation upon Industry 4.0 and Society 5.0 within the Context of Sustainable Development Goals. Sustainability 2021, 13, 2682. [Google Scholar] [CrossRef]
  58. Ahmed, S.S.; Guozhu, J.; Mubarik, S.; Khan, M.; Khan, E. Intellectual capital and business performance: The role of dimensions of absorptive capacity. J. Intellect. Cap. 2019, 21, 23–39. [Google Scholar] [CrossRef]
  59. McDowell, W.C.; Peake, W.O.; Coder, L.A.; Harris, M.L. Building small firm performance through intellectual capital development: Exploring innovation as the “black box”. J. Bus. Res. 2018, 88, 321–327. [Google Scholar] [CrossRef]
  60. Varadarajan, R. Customer information resources advantage, marketing strategy and business performance: A market resources based view. Ind. Mark. Manag. 2020, 89, 89–97. [Google Scholar] [CrossRef]
  61. Kwan, S.H.; Mertens, T.M. Market assessment of COVID-19. FRBSF Econ. Lett. 2020, 14, 1–5. [Google Scholar]
  62. Mahmoud, M.A.; Blankson, C.; Owusu-Frimpong, N.; Nwankwo, S.; Trang, T.P. Market orientation, learning orientation and business performance: The mediating role of innovation. Int. J. Bank Mark. 2016, 34, 623–648. [Google Scholar] [CrossRef]
  63. Edvinsson, L.; Mas, F.D.; Pablos, P.O.D.; Massaro, M.; Dumay, J. From a value-based knowledge economy to a worth economy. New reflections and perspectives on intellectual capital research. Int. J. Learn. Intellect. Cap. 2021, 19, 83–101. [Google Scholar] [CrossRef]
  64. Nailevich, I.R. Ways to Increase the Competitiveness of Enterprises. Cent. Asian J. Innov. Tour. Manag. Financ. 2023, 4, 174–177. [Google Scholar] [CrossRef]
  65. Chatterjee, S.; Chaudhuri, R. Adoption of Artificial Intelligence Integrated Customer Relationship Management in Organizations for Sustainability. In Business Under Crisis, Volume III: Avenues for Innovation, Entrepreneurship and Sustainability; Palgrave Macmillan: Cham, Switzerland, 2022; pp. 137–156. [Google Scholar] [CrossRef]
  66. Alam, K.; Ali, M.A.; Erdiaw-Kwasie, M.; Shahiduzzaman; Velayutham, E.; Murray, P.A.; Wiesner, R. Impact of ICTs on Innovation and Performance of Firms: Do Start-ups, Regional Proximity and Skills Matter? Sustainability 2022, 14, 5801. [Google Scholar] [CrossRef]
  67. Liñán, F.; Chen, Y.-W. Development and Cross–Cultural Application of a Specific Instrument to Measure Entrepreneurial Intentions. Entrep. Theory Pract. 2009, 33, 593–617. [Google Scholar] [CrossRef]
  68. Martínez-González, J.A.; Kobylinska, U.; García-Rodríguez, F.J.; Nazarko, L. Antecedents of Entrepreneurial Intention among Young People: Model and Regional Evidence. Sustainability 2019, 11, 6993. [Google Scholar] [CrossRef] [Green Version]
  69. Shirokova, G.; Tsukanova, T.; Morris, M.H. The Moderating Role of National Culture in the Relationship Between University Entrepreneurship Offerings and Student Start-Up Activity: An Embeddedness Perspective. J. Small Bus. Manag. 2017, 56, 103–130. [Google Scholar] [CrossRef]
  70. Loh, W.; Shih, Y. Split selection methods for classification trees. Stat. Sin. 1997, 7, 815–840. [Google Scholar]
  71. Díaz-Casero, J.C.; Fernández-Portillo, A.; Sánchez-Escobedo, M.-C.; Hernández-Mogollón, R. The Influence of University Context on Entrepreneurial Intentions. In Entrepreneurial Universities; Springer: Berlin/Heidelberg, Germany, 2016; pp. 65–81. [Google Scholar]
  72. Gunduz, M.; Lutfi, H. Go/No-Go Decision Model for Owners Using Exhaustive CHAID and QUEST Decision Tree Algorithms. Sustainability 2021, 13, 815. [Google Scholar] [CrossRef]
  73. Guo, Y.; Logan, H.L.; Glueck, D.H.; Muller, K.E. Selecting a sample size for studies with repeated measures. BMC Med Res. Methodol. 2013, 13, 100. [Google Scholar] [CrossRef] [Green Version]
  74. Chittam, S.; Gokaraju, B.; Xu, Z.; Sankar, J.; Roy, K. Big Data Mining and Classification of Intelligent Material Science Data Using Machine Learning. Appl. Sci. 2021, 11, 8596. [Google Scholar] [CrossRef]
  75. Shao, J.; Liu, X.; He, W. Kernel Based Data-Adaptive Support Vector Machines for Multi-Class Classification. Mathematics 2021, 9, 936. [Google Scholar] [CrossRef]
  76. Huang, Y.; Zhao, L. Review on landslide susceptibility mapping using support vector machines. Catena 2018, 165, 520–529. [Google Scholar] [CrossRef]
  77. Zhang, Z.; Feng, F.; Huang, T. FNNS: An Effective Feedforward Neural Network Scheme with Random Weights for Processing Large-Scale Datasets. Appl. Sci. 2022, 12, 12478. [Google Scholar] [CrossRef]
  78. Aldakheel, F.; Satari, R.; Wriggers, P. Feed-Forward Neural Networks for Failure Mechanics Problems. Appl. Sci. 2021, 11, 6483. [Google Scholar] [CrossRef]
  79. Ling, C.; Lei, J.; Kuo, W. Support Vector Machine-Assisted Importance Sampling for Optimal Reliability Design. Appl. Sci. 2022, 12, 12750. [Google Scholar] [CrossRef]
  80. Zhao, M.; Li, Z.; He, W. Classifying Four Carbon Fiber Fabrics via Machine Learning: A Comparative Study Using ANNs and SVM. Appl. Sci. 2016, 6, 209. [Google Scholar] [CrossRef] [Green Version]
  81. Cemiloglu, A.; Zhu, L.; Arslan, S.; Xu, J.; Yuan, X.; Azarafza, M.; Derakhshani, R. Support Vector Machine (SVM) Application for Uniaxial Compression Strength (UCS) Prediction: A Case Study for Maragheh Limestone. Appl. Sci. 2023, 13, 2217. [Google Scholar] [CrossRef]
Figure 1. Illustration of the main SVM principle for a linear problem (modified) [73].
Applsci 13 04055 g001
Figure 2. Illustration of the SVM principle for a non-linear problem (modified) [75].
Applsci 13 04055 g002
Figure 3. Neural network architecture schematics.
Applsci 13 04055 g003
Figure 4. QUEST algorithm decision tree for predicting intentions on ICT solution implementation.
Applsci 13 04055 g004
Figure 5. ROC curve for the validation samples.
Applsci 13 04055 g005
Table 1. Dataset details.
InformationDetail
Number of participants214
Participants
  • Managers;
  • Directors;
  • Owners of micro-, small-, medium-, and large-sized enterprises;
  • 135 male participants;
  • 79 female participants;
  • Average age of 43;
  • Youngest participant 29; oldest participant 61;
  • The majority has BSc degree—159 participants;
EnterpriseThe majority of enterprises are micro-sized (36.45%) and small-sized (49.07%). This is expected as the majority of enterprises in the Republic of Serbia are micro- and small-sized enterprises.
Industries in which the enterprises conduct their business: manufacturing (58); textile (28); agriculture (4); mining and quarrying (2); information and communication (41);
wholesale and retail (9); construction (9);
finance and insurance (26); healthcare and social work (9); water, electricity, gas supply (12); education (10); other (6).
Note:Additional details are presented in the Appendix A.
Table 2. Research methodology summary.
Methodology AspectsInfo
Number of completed surveys214 (n = 214)
Study lengthLess than a year (finalized in 2021)
Sample structureManagers/directors/owners of micro-, small-, medium-, and large-sized enterprises
Study research instrumentSurvey (attached as an Appendix A)
Conducted data analysis
  • Basic (descriptive) statistics;
  • Regression analysis (linear and binary logistic);
  • QUEST decision tree algorithm;
  • Classification supervised learning model-support vector machines/support vector networks.
  • Feed-forward neural network (Python and Tensorflow)
Predictor groupsDemographic and basic information (gender, age, education, enterprise size)
  • Business performance
  • Awareness of ICT importance
  • Intellectual capital
  • Market assessment
Dependent variableIntention to implement and apply ICT within the enterprise
Table 3. Results of the linear regression analysis.
Independent Variables (Viewed as Predictor Groups)Dependent VariableStandardized Coefficientsp
Business performanceICT implementation intentions−0.1580.000
Awareness of ICT importance0.1120.722
Intellectual capital0.0570.602
Market assessment0.1660.000
Table 4. Results of the binary logistic regression.
Feature ItemFeature Groupβp95% CI
Financial goals are easily achieved.Business performance1.200.0011.171.54
Strategic long-term profitability is sustainable.Business performance0.740.0000.680.78
Quality of products is satisfactory.Business performance0.940.0011.010.99
Do you think that information-communication technologies (ICTs) are important for the enterprise?Awareness ICT importance0.960.0000.680.96
Do you think that enterprises that implement modern ICTs are more competitive compared to enterprises that don’t?Awareness of ICT importance0.380.010.441.01
Intellectual capital is effectively applied in the enterprise.Intellectual capital1.140.0001.021.33
Intellectual capital is reported periodically within the enterprise.Intellectual capital0.800.1880.831.02
Do you think the COVID-19 pandemic has negatively affected the enterprise’s market performance?Market assessment0.810.0550.810.94
Do you think the market is competitive within your enterprise’s industry?Market assessment0.790.0060.721.08
Table 5. Multicollinearity test.
Business Performance Awareness of ICT ImportanceIntellectual CapitalMarket Assessment
Tolerance0.4540.4220.3510.490
Variance Inflation Factor (VIF)1.9551.9471.8442.505
Table 6. Results of the heteroscedasticity test.
Breusch–Pagan TestWhite Test
LM (Observed value)0.7456.02
LM (Critical Value)2.9956.147
DF12
p-value (Two-tailed)0.0340.04
alpha0.050.05
Table 7. Summary of the optimized SVM classifier.
Positive class1
Number of observations in the training set157
Bias0.000
Number of support vectors76
Features used (the features were selected based on the structured survey). The features are the independent variables.Manager Age
Manager Gender
Manager Education
Enterprise Size
Business Performance
Awareness of ICT Importance
Intellectual Capital
Market Assessment
Table 8. Confusion matrix of SVM.
From/To01Total% Correct
02763381.82
14131776.47
Total31195079.14
Disclaimer/Publisher’s Note: The statements, opinions and data contained in all publications are solely those of the individual author(s) and contributor(s) and not of MDPI and/or the editor(s). MDPI and/or the editor(s) disclaim responsibility for any injury to people or property resulting from any ideas, methods, instructions or products referred to in the content.

