Article

CFD Investigation of an Innovative Additive Manufactured POCS Substrate as Electrical Heated Solution for After-Treatment Systems

Department of Energy, Polytechnic of Milan, 20156 Milan, Italy
*
Authors to whom correspondence should be addressed.
Appl. Sci. 2023, 13(6), 4017; https://doi.org/10.3390/app13064017
Submission received: 28 February 2023 / Revised: 15 March 2023 / Accepted: 20 March 2023 / Published: 22 March 2023

Abstract

:
In the last decade, additive manufacturing (AM) techniques have been progressively applied to the manufacturing of many mechanical components. Compared to traditional techniques, this technology is characterized by disruptive potential in terms of the complexity of the objects that can be produced. This opens new frontiers in terms of design flexibility, making it possible to create new components with optimized performances in terms of mechanical properties and weight. In this work, the focus is on a specific field of application: the development of novel porous media structures which can be the basis of advanced after-treatment systems for internal combustion engines. In particular, the possibility to design periodic open cellular structures (POCSs) that can be applied as catalytic substrates opens new perspectives in terms of flexibility and integrated functionalities. The present study investigates an innovative solution where the catalytic substrates are located in the pipes of the exhaust manifolds of a high-performance engine. A preliminary characterization of the pressure drop induced by the POCS structure is carried out, with a particular focus on the impact of the backpressure on the engine performances. Moreover, each POCS integrates an electrical circuit which is used to promote the heating of the device, with beneficial effects on the light-off of the catalytic reactions. An advanced CFD model is applied to evaluate the potential of the solution, comparing the pollutant conversion with that of the baseline configuration equipped with a standard after-treatment system solution.

1. Introduction

During the last twenty years, several studies were carried out on the application of open cell foams as heat-exchange devices, catalytic reactors, or substitutes for traditional after-treatment honeycombs. Giani et al. [1] performed the characterization of the mass-transfer properties of metallic foams for structured catalysis. For fast-diffusion limited processes, such structures were found to provide conversion efficiencies equivalent to those of traditional honeycombs, with the benefits of a reduction in the required reactor size. Lucci et al. [2] demonstrated that, as a function of the open cell foams geometrical features, higher momentum and mass-transfer properties could be achieved with respect to traditional honeycombs. A further development of such applications relies on the advancements of the additive layer manufacturing technology, which offer the possibility for investigating and evolving the open-cell foams to periodic open cell structures (POCS). The resulting higher flexibility in the production process leads to an optimization of the structures’ shapes and to the capability of achieving peculiar features, as a function of the obtained porosity, surface area-to-volume ratio, and permeability. Klumpp et al. [3] studied the influence of the main geometrical features of ideal cubic cell POCS, namely porosity and cell orientation, on the induced pressure drop. Bastos et al. [4] carried out an experimental campaign on eight different cubic cells to study the effects of different design parameters, such as the struts and cell dimensions or the angular orientation, on the pressure drop and heat transfer properties. The cells’ shapes and geometrical features strongly influenced the behavior of the working fluid and the spatial distribution of the different flow fields. Kaur and Singh [5] performed a characterization of the pressure drop, interstitial heat transfer and flow dynamics properties of four different unit cells. In particular, the octet topology resulted in the highest heat dissipation, weighted by the increment in the required pumping power.
In the field of after-treatment systems (ATS) for internal combustion engines (ICEs), the open-cell foams’ peculiar features and the enhancements that derive from the AM application are such that their equipment is significantly appealing for a further improvement in the after-treatment performances. In this context, Bach et al. [6] performed a dedicated study on open-cell foams equipped on a small heavy-duty truck. Such an application was tested on a chassis dynamometer and the experimental results showed that comparable pollutants’ conversion efficiencies, with respect to traditional honeycombs, could be obtained with a lower amount of catalyst loading. Vespertini et al. [7] conducted a preliminary numerical investigation on the application of a cubic POCS as an innovative mixing device for selective catalytic reduction (SCR) systems. Papetti et al. [8] performed a comprehensive characterization of POCS structures as automotive catalysts. The observed mass transfer enhancement with respect to traditional honeycombs allows to achieve the same target pollutants’ conversion with a lower wetted surface area and consequently a lower quantity of precious metals.
However, as a response to the tightening emission legislations, the specific field of application that the after-treatment systems have to address is that of the pollutants’ abatement efficiencies for some critical conditions. The pollutants’ conversion is strongly dependent on the temperature of the after-treatment system components, commonly the three-way catalyst (TWC), diesel oxidation catalyst (DOC), or SCR devices. In the early 1990s, Shayler et al. [9] pointed out that the typical characteristic time of the catalyst warm-up operations is such that the registered cumulative emissions before the light-off event constitute over 70–80% of the total cumulative emissions in a test cycle. A similar behavior still characterizes the operations of modern ICEs, especially if different levels of hybridization are considered. Bagheri et al. [10] analyzed how the successive shutdowns of ICEs and the successive high-power cold start have a negative impact on the exhaust line conversion efficiency in an hybrid vehicle, as the catalyst temperature is significantly reduced. Similarly, Wang et al. [11] observed that, after an extended e-drive phase, the thermal transient of the catalyst is substantially affected. As a consequence, the thermal management of the catalyst is regarded as a fundamental aspect to improve the after-treatment system performances in the case of critical operating conditions.
Given the flexibility granted by the AM and the requirement to address the ICEs cold start pollutants emission, the proposed work consists of a preliminary evaluation of an innovative POCS structure as a pre-catalyst in the exhaust line of a high-performance engine. The POCS design is carried out to achieve some relevant features, in terms of high permeability, not to introduce penalties on the engine performances due to the induced pressure drop, high mass transfer coefficients, and a high surface area-to-volume ratio, with the aim of maximizing the wetted surface area. Such beneficial features are exploited to promote both the heat and the mass transfer between the POCS and the exhaust gases. In particular, the structure is assumed to be coated, so that catalytic reactions take place in correspondence of the different struts of the POCS. Moreover, in order to address the engine cold start pollutants’ emission, the structure is integrated with an electrical circuit: accordingly, the Joule heating effect can be exploited to heat up the POCS and to reduce the light-off time of the exhaust line catalysts.
This work is structured as follows. At first, a brief overview of the employed computational methodology is presented, with a specific description of the implementation of the Joule heating modeling. Then, the test case is described. The results of a first set of simulations are presented, so that the POCS-induced pressure drop can be evaluated for two different configurations. To completely characterize such an application, the results of the 1D simulation of a reference high-performance ICE equipped with the POCS structure are analyzed. Then, the effects of the integration of an electrical circuit are assessed so that the POCS behaves as an electrically heated catalyst (EHC). After a brief analysis of the achievable thermal energy supply, the potential of the proposed solution is evaluated: a comparison of the behavior at the engine cold start of a simplified exhaust line is carried out, evaluating the equipment of the EHC–POCS structure with respect to a baseline configuration.

2. Methods

The employed computational model exploits the open source OpenFOAM environment. The CFD framework consists of a conjugate heat transfer (CHT) multi-region methodology developed by the authors [12,13], which extends the OpenFOAM functionalities with specific libraries. In the context of ICE after-treatment systems, such extensions are required to address the interaction between the exhaust gases and the generic after-treatment devices of typical exhaust lines. Different physical phenomena occurring at different scales characterize the overall behavior of an after-treatment system, such as the porous media-induced flow resistance, the consequent heat-mass transfer, and the catalytic chemical reactions for the pollutants’ conversion. After a general description of the multi-region approach adopted for the research work, a detailed explanation of how the Joule heating effects were integrated in such framework is provided.

2.1. Multi-Region Framework

The adopted modeling strategy relies on the identification of the different domains that are considered for the case under investigation. In particular, the different types of simulation domains can be classified as follows: (a) fluid region, which describes the exhaust gas flow through the exhaust line; (b) solid regions, representing the solid walls of the generic metal pipes and cannings; (c) porous regions, which account for the presence of the equipped after-treatment devices, eventually catalyzed, in the exhaust line. Such components are modeled through the porous media approach, relying on overlapping meshes, associated with the fluid and the specific device computational domains. A block representation of such an approach for a simplified exhaust line is reported in Figure 1, highlighting the different equations solved for each computational domains. In addition, it is possible to appreciate the coupling achieved between the fluid and the porous domain (namely Substrate Domain ) through the inter-phase heat and mass transfer source terms, Q w g and J i w g respectively. With regard to the other depicted source terms, S Y i , g describes the rate of the gas phase homogeneous reactions; S E , g models the gas phase reaction heat; S E , s is considered to describe the eventual external heating and the catalytic surface reaction heat; S Y i , w accounts for the catalytic surface reactions rate.
The effects induced by the presence of the after-treatment component, in terms of inter-phase heat transfer, inter-phase mass transfer, and the flow resistance due to the permeability of the porous domain, are accounted for by means of the addition of specific source terms. The computation of such terms relies on the proper coupling models available in the literature for common honeycomb monoliths. In this context, the flow resistance component R g is typically modeled by the Hagen–Poiseuille theory for laminar flows [14] or exploiting the Churchill [15] or Darcy–Forchheimer correlations. The inter-phase heat and mass transfer terms (Equations (1) and (2)) are typically computed resorting to Hawthorn correlations [16,17] for the estimation of Nusselt and Sherwood numbers as a function of Reynolds, Prandtl, and Schmidt numbers:
Q w g = N u ( R e , P r ) λ d c S V V C ( T g T w )
J i w g = S h ( R e , S c ) D d c S V V C ( C g C w )
where subscripts w and g denote the washcoat and gas phases, λ denotes the fluid thermal conductivity, d c denotes the fluid characteristic dimension inside the after-treatment device channels, S V denotes the characteristic surface-to-volume ratio of the component, V C denotes the considered computational element volume, T denotes the temperature, D denotes the fluid mass diffusivity, and C denotes the species i concentration. Typically, in order to reduce the computational burden, the mass diffusivity is computed, assuming the Schmidt number is equal to 1. In addition, an alternative approach relies on the adoption of constant user-defined Nusselt and Sherwood numbers.
In the context of POCS structures, the described approach is still valid, upon a reformulation of the coupling source terms. In particular, the POCS-associated region is treated as a standard solid domain. In case a coated structure is considered, the multi-region methodology relies on the identification of the washcoat layer as a simil-porous domain. The first layer of the fluid computational cells next to the POCS solid region is selected for the creation of the washcoat layer. The fluid flow-induced resistance is neglected, while the inter-phase heat and mass transfer terms are computed, resorting to the following formulations:
Q w g = λ A L ( T g T w )
J i w g = D A L ( C g C w )
where L and A represent the considered grid element length and boundary face area, respectively. Such expressions are derived assuming Nusselt and Schmidt numbers equal to 1. For coated structures, either standard after-treatment devices or coated POCS, a surface reaction model is employed to evaluate the species conversion occurring on the catalytic washcoat. The Langmuir–Hinshelwood type reaction model [18] is considered to account for the competition of the chemical species on the active sites. The expression of the reaction rate r i (Equation (5)) of a generic reaction i (Equation (6)) is computed through the Arrhenius term k r , i , the partial pressure of the reactants is divided by a reference pressure p ^ A and p ^ B , and the inhibition term G i and the substrate temperature T:
r i = k r , i p ^ A p ^ B T G i
a A + b B c C + d D
To reduce the required computational burden, a quasi-steady-state approximation is applied, for which the accumulation of the reactants into the washcoat is neglected. This implies that the chemical reaction rates are equal to the rates of diffusion of the chemical species to the active sites. The resulting nonlinear system of equations is solved by means of an iterative approach [12].

2.2. Electrical Heating Modeling

The basic principle of electrical heating relies on the dissipation of the supplied electrical power by the Joule effect due to the considered component of electrical resistance. A certain amount of electrical current flows through the structure if an electrical potential difference is established: typically, the considered component is connected to the ground and to the power supply through two different pins. As a result, as a function of the shape and of the geometrical details of the component itself, heat is generated. The presented modeling strategy provides the resolution of the electrical circuit of the considered domain and the consequent power distribution. Exploiting the differential formulation of Gauss’ law, the electrical potential equation is expressed as a Poisson’s equation. Assuming that no magnetic field is present and a zero total volume charge of density, a Laplace’s equation for the electrical potential was obtained:
E = V
· E = 2 V = 0
where E stands for the electric field, while V is the electric potential. The potential distribution is obtained by solving Equation (8). Once the current density is computed, the power per unit volume Q J H can be derived according to the differential formulation of the Joule effect:
J = σ V
Q J H = J · V
where J is the current density and σ is the material conductivity. The described methodology is general and can be applied to obtain a reliable distribution of the generated heat power for components featured by different geometries. With regard to the simulation framework depicted in Figure 1, the contribution of Q J H is added to the S E , s source term.
If the considered structure is composed of a combination of two different materials, a coupling procedure is required to address the closure of the electrical circuit. This is the typical case of a traditional incandescent light bulb: the Joule heating is exploited only within the central filament and the voltage difference is applied by means of the two contact wires. As will be described in the case-study section, the POCS under investigation is composed of two different materials and the obtained structure electrically behaves as a light bulb. For this reason, a dedicated boundary condition was implemented. In particular, the voltage field on the two regions is coupled imposing an equal current density between the considered solid domains, as shown in Equation (11):
J 1 = σ 1 V 1 = J 2 = σ 2 V 2
where subscripts 1 and 2 identify the different solid regions. The implementation considers Equation (11) and applies it to the boundary faces of the domains. In particular, for each region i the voltage gradient term can be expressed as follows:
V i = V c , i V f L i
where V c , i represents the computed value at the region i boundary cell center, V f is the voltage at the common boundary face, and L i stands for the distance between the considered cell and face centers. By applying Equations (11) and (12) to the two different regions, the voltage value at the interface can be computed for each boundary face.

3. Case Study

The presented numerical analysis aims at investigating the application of an innovative POCS structure as a pre-catalyst in the after-treatment system of a gasoline spark ignition ICE. It is meant to be located upstream of a conventional catalyst, in particular, in the initial portion of each exhaust manifold. At first, the geometrical details of the preliminary design of the POCS structure are presented. In addition, the geometry is modified to be compliant with the characteristic shape of a selected exhaust manifold. The induced pressure drop is analyzed for both configurations as a function of different flow velocities. The obtained data are employed to estimate an equivalent friction factor and to perform the 1D simulation of a reference ICE; as such, the impact of the considered POCS application on the engine performances can be assessed. Finally, the effects related to Joule heating are investigated; after a sensitivity analysis on the applied potential difference, the selected operating conditions are employed to simulate the thermal transient of the complete exhaust line for simplified cold start conditions. The obtained results are compared to the reference case, consisting of the same geometry excluding the equipment of the POCS structures.
The computational grids employed for the present work were generated using a Cartesian mesh generator in the OpenFOAM environment. The resulting mesh is predominantly hexahedral with a small percentage of polyhedral elements near the boundary walls. The advanced grid generator includes automatic meshing features for the addition of boundary layers. In the case of turbulent simulations, for a progressive description of the centerline of the cells and an accurate reconstruction of the fluid fields gradients, computational meshes with structured O-grids along the walls were employed.

3.1. POCS Design

The design of the proposed structure was carried out on the basis of radial geometry. Eight struts, equally distributed around a central pipe, are periodically repeated along the axial coordinate of the geometry. With regard to the field of application under investigation, the central pipe plays a key role in the achievement of a proper heat distribution all over the POCS. In order to maximize the wetted surface area, inclined structs connecting the different periodic sections of the geometry are created. Table 1 reports the main geometrical data of the proposed geometry.
The obtained POCS is presented in Figure 2, referring to its frontal section and a longitudinal clip of the structure. The achieved geometry is featured by a module that is axially repeated the entire length of the considered duct. The radial strut axial spacing identifies the module length. In particular, the geometrical properties of the identified module can be further evaluated.
The porosity of the structure, defined as the ratio between the available area open to the flow over the theoretical cross-section of the pipe, results as dependent on the axial coordinate along the module. The computed porosity all over the module length is reported in Figure 3. As expected, the initial and last sections are featured by the lowest values, given the presence of the eight radial struts. The intermediate values are of approximately 0.94 , due to the lower impact of the inclined struts on the available axial cross-section. A visualization of the corresponding sections as function of the axial coordinate is shown in Figure 4, highlighting the available area for the flow circulation.
Given the electrical heating application, the inner pipe of the structure has been elongated so that it can be connected to the power supply in the external parts of the manifolds. Such geometrical detail can be observed in the bottom portion of Figure 5. To preserve the desired electrical circuit, an insulating material is supposed to be interposed between the metallic duct and the elongated inner pipe.
In addition, the obtained structure is modified to be fitted inside a given exhaust manifold. As a consequence, the geometrical properties previously evaluated are slightly modified. A visualization of the achieved geometry is reported in Figure 5. With respect to the straight configuration, the module is repeated six times. The inclined struts are not parallel everywhere and periodicity is not strictly preserved.

3.2. Assessment of the POCS Pressure Drop

3.2.1. Three-Dimensional CFD Configurations

The investigation into the fluid pressure difference established across the POCS structure was carried out for both the configurations reported in the previous subsection, namely straight and curved geometries. Six different flow velocities are imposed at the inlet of the considered ducts ( 0.5 , 1.0 , 5.0 , 10.0 , 25.0 , and 50.0 m/s), while three different meshes are employed for each configuration. Table 2 reports the details related to the global number of cells for each considered mesh. The applied refinements on the geometrical walls, in terms of increments with respect to the base cell dimension, are preserved between the different mesh versions. A reference computational grid was created (namely B), in addition to coarse and fine configurations (A and C, respectively).
A total of thirty-six simulations were performed to deeply characterize the fluid-dynamic performances of the structure under investigation. The fluid region is handled through a multi-component mixture, whose thermal properties are computed on the basis of the JANAF tables. Similarly, the transport properties are determined according to the Sutherland model to account for the dependency of the fluid viscosity on the temperature. The analysis is conducted considering an inlet fluid temperature equal to 1273 K, while adiabatic boundary conditions are applied to all the walls of the geometry. The concentration of each fluid species is given in Table 3, according to a given representative exhaust gases composition: the 1D simulation of a reference engine operating under low load conditions is carried out and the exhaust gases composition is extracted. Such a modeling approach is selected in order to simulate the interaction between the POCS and the exhaust gases for realistic operating conditions, neglecting the contributions related to heat transfer.
The numerical methodology relies on the simulation framework described in the previous section, by solving a single region (fluid domain) for steady-state conditions and laminar flow. The turbulence modeling, given the shape of the structure and its subsequent interaction with the fluid flow, is expected to provide a negligible contribution for the pressure difference characterization. The POCS-induced flow mixing is strongly associated with the designed structure’s shape and geometrical features, and hence, the laminar simulation is supposed to consistently represent the pressure losses without the need to model the turbulence. As such, the required computational power can be reduced. An additional simulation has been run to verify such an aspect, considering the operating condition corresponding to the highest inlet velocity.

3.2.2. One-Dimensional Performance Simulation

To provide a complete characterization of such an application, a 1D engine simulation is performed, resorting to a 1D thermo-fluid dynamic model (Gasdyn) capable of simulating the whole engine system with a limited computational time. The code allows one to determine the volumetric efficiency, torque, power, fuel consumption, pollutant emissions, and tailpipe noise on the basis of the operating conditions of the engine [19,20]. The 1D setup is made on a prototype engine for high-performance applications with the aim of comparing a base case with the case in which the POCS is inserted in the exhaust ducts. The single bank of a V12 reference engine is considered and the POCS presence is modeled by introducing a dedicated source term in the momentum conservation equation. The source term is in the form of:
Δ p l = f w 2 d · ρ U 2
where Δ p represents the induced pressure difference across the POCS, ρ is the fluid density, d is the pipe diameter, l is the structure length, U is the mean flow velocity, and f w is the friction factor (estimated by means of the 3D CFD results). The full-load behavior of the engine is investigated through the described simulation framework, starting from 1500 to 9000 rpm.

3.3. Assessment of the Emissions Abatement at the Cold Start

The behavior and the potential of the curved POCS application as a pre-catalyst are investigated through an assessment of its performances under simplified cold start conditions. The proposed structure was designed to be suitable for the application of an electrical circuit, so that an EHC–POCS could be obtained. In particular, two different materials were employed: steel for the inner and outer pipes and silicon carbide for the struts. As such, the characteristic behavior of a light bulb is achieved; and the difference in terms of the electrical conductivity of the two materials ( 10 7 and 10 2 S/m, respectively) is such that the electrical current flows through the whole length of the inner pipe (connected to the power supply), and then it starts to propagate through the POCS struts. As briefly addressed in the previous section, the inner pipe is extended towards the outside of the duct, while insulating material is interposed between the inner pipe and the exhaust manifold to avoid gas leaks and to preserve the integrity of the electrical circuit. To verify the effects of the electrical current on the POCS temperature, a sensitivity analysis on the applied potential difference (1, 10, 20, 30 and 38 V) was carried out for a total of five seconds. The upper limit is set to be representative of the maximum potential difference that is available from the common battery of a traditional vehicle for the application under investigation. The CFD framework is applied and the performed simulations consist only of the two different solid regions, duct and struts, respectively. The employed mesh is created similarly to the reference computational grid (B-curved version, whose details are presented in Table 2) and were employed for the pressure difference investigation. Once the effects of Joule heating were verified, simplified cold start conditions were considered. The assessment was carried out on an exhaust line equipped with two different catalysts. Four different domains were included in the multi-region simulation framework, whose details were reported in Table 4.
A schematization of the considered exhaust line is reported in Figure 6. The fluid region describes the exhaust gas flow, the two three-way catalysts account for the presence of the two different catalytic converters while the solid region describes the solid walls of the line. The time-varying boundary conditions for a total of twenty seconds are assigned at the inlet of the exhaust manifolds, imposing the values of the exhaust gas mass flow rates and temperatures. The imposed profiles are constructed to replicate the engine behavior at cold start, where the cranking phase influences the exhaust gases’ features. After an initial period of approximately ten seconds, the engine is supposed to reach a steady-state condition of approximately 130 kg/h of exhaust gases with a temperature equal to 1273.5 K.
The imposed profiles at the inlet of each exhaust manifold, in terms of temperature and mass flow rate, are reported in Figure 7. The imposed chemical species concentrations are kept constant and equal to the values reported in Table 3.
Four different simulations are considered. The first one is related to the initial portion of a single exhaust manifold equipped with the EHC–POCS (B-curved mesh version), including the fluid region, the duct, and struts solid domains. An additional region is considered to mimic the washcoat deposition on the POCS structure and to obtain a pre-catalyst behavior. The first layer of cells next to the POCS structure is selected and employed to identify the washcoat region. The cold start boundary conditions are considered. The imposed potential difference profile is specified, so that the electrical heating corresponding to 38 V is active in the first six seconds of the cold start. As such, the beneficial effects of the selected heating strategy can be assessed. The second simulation is performed on the considered exhaust line by imposing, as inlet boundary conditions, the values of mass flow rates, temperatures and chemical species concentrations obtained by means of the first simulation. Accordingly, the effects of the EHC–POCS structure are accounted for in each exhaust manifold. The combination of the described simulations provides a preliminary assessment of the after-treatment system equipped with the EHC–POCS structures with a considerable reduction in the required computational cost. The third simulation refers to the B-Curved mesh, excluding the presence of the EHC–POCS structure. As such, the thermal inertia of the first portion of the exhaust manifold is evaluated. The obtained results, in terms of mass flow rates, temperatures, and chemical species concentrations, are employed as inlet boundary conditions for the fourth simulation. In particular, it consists of the exhaust line under investigation, evaluating the response and the thermal transient of the after-treatment system. The second and the last simulations can be consistently compared, providing the assessment of the effects of the EHC–POCS application. As suggested in [21], a standard reaction model was considered for all the studied catalysts (washcoat of the EHC–POCS, CAT1, and CAT2), being a reasonable choice for a preliminary analysis. Even though the laminar flow assumption is considered for the pressure drop evaluation, a turbulent model is expected to be required when the exhaust gases–POCS heat and mass transfer need to be properly addressed. The k- ω - S S T turbulence model was selected for all the described simulations. The employed computational grids were generated to be compliant with the y + requirements for the turbulent simulations.

4. Results and Discussion

The numerical investigation was performed in two main steps. At first, the results of the flow permeability of the designed POCS structure are presented. Then, the effects of the application of the EHC–POCS, equipped as a pre-catalyst in an exhaust line, are discussed.

4.1. Assessment of the POCS Pressure Drop

The permeability of the designed structure was characterized by means of 3D simulations in terms of the induced pressure drop across the POCS. Then, the influence of the structure on the full-load behavior of a reference engine was investigated by means of the results of a 1D simulation.

4.1.1. 3D CFD Configurations

The investigation into the fluid pressure drop induced by the POCS structure has been carried out for two different configurations, namely straight and curved. The achieved results are presented in Figure 8. In particular, the pressure difference was analyzed for different flow inlet velocities. Overall, the straight configuration is responsible for lower pressure drops, while the curved version leads to higher values. Such differences are present due to the different length of the considered structures.
As described in the previous section, the POCS characteristic module is axially repeated four times for the straight version. Considering the fine mesh (label C-Straight), the obtained pressure drops show a maximum value that is approximately 10 mbar for an inlet velocity of 50.0 m/s, while a 3 mbar pressure difference is registered for 25.0 m/s. Given the subsequent electrical heating application, the POCS geometry for the curved configuration was accordingly designed: the axial module is repeated six times, with the aim of maximizing the wetted surface area. The obtained pressure drops increase with respect to the straight configurations, leading to approximately 5 and 20 mbar for the 25.0 and 50.0 m/s inlet velocities. As shown in Figure 8, the different employed computational grids result in a similar estimation of the pressure drops. The percentage difference between the reference and fine meshes, namely B-Curved and C-Curved, is at maximum approximately the 3%. Hence, the reference mesh was selected for the cold start assessment. A qualitative estimation of the differences induced by the utilization of different computational grids can be carried out through Figure 9, where a visualization of the fluid pressure field is presented for the A-Straight and C-Straight meshes. In addition, the POCS boundary walls have been superimposed, so that the grid resolution corresponding to the structure under investigation can be appreciated.
At last, a turbulent simulation of the curved configuration was carried out with the aim of verifying the impact of the assumption of laminar simulations on the achieved pressure drops. The selected operating condition refers to the inlet velocity equal to 50.0 m/s, for which the highest variability in terms of pressure drop was registered. Furthermore, as shown in Table 5, it is one of the operating points characterized by a turbulent flow regime (Reynolds number > 2900). The reported Reynolds number is computed through the results of the fine mesh (label C-Curved). The y + requirements for the selected turbulence model, that is the k- ω - S S T , can be met according to the fine mesh only. The computed pressure drop is 17.98 mbar, which needs to be compared with the 18.05 mbar of the laminar simulation. As expected, the obtained difference is negligible and the assumption of laminar simulations does not introduce significant errors into the performed numerical analysis.

4.1.2. One-Dimensional Performance Simulation

The full-load behavior of a single bank of a V12 reference engine was investigated. In particular, a dedicated approach needs to be formulated to couple the 1D description of the friction effects and the obtained pressure differences across the POCS by means of the 3D simulations. The value of the friction coefficient f w was determined by means of the upscaling of the pressure drop results obtained from the detailed CFD simulation of the POCS. The achieved friction factor results in 0.61 . The obtained results are reported in Figure 10, analyzing the impact of the POCS presence on the engine behavior in terms of brake power and brake specific fuel consumption.
As expected, the influence of the POCS structure is negligible for low rotational speeds, the flow velocities in the exhaust manifolds being relatively small. If higher rotational speeds are considered, the flow velocity is such that the flow resistance is significant, inducing a relevant engine backpressure that influences the performances of the power unit. In particular, Table 6 reports the maximum percentage reduction, in terms of brake power and total efficiency, and the brake specific fuel consumption (BSFC) percentage increase obtained by comparing the reference and the POCS equipped cases. All the maximum values are obtained for the 9000 rpm regime.

4.2. Assessment of the Emissions Abatement at the Cold Start

A sensitivity analysis on the application of the Joule heating strategy on the designed POCS is carried out. Then, the selected operating conditions are applied to simulate the response of an after-treatment system equipped with EHC–POCS and to evaluate the computed abatement performances with respect to the reference exhaust line.

4.2.1. Electrical Heating Sensitivity Analysis

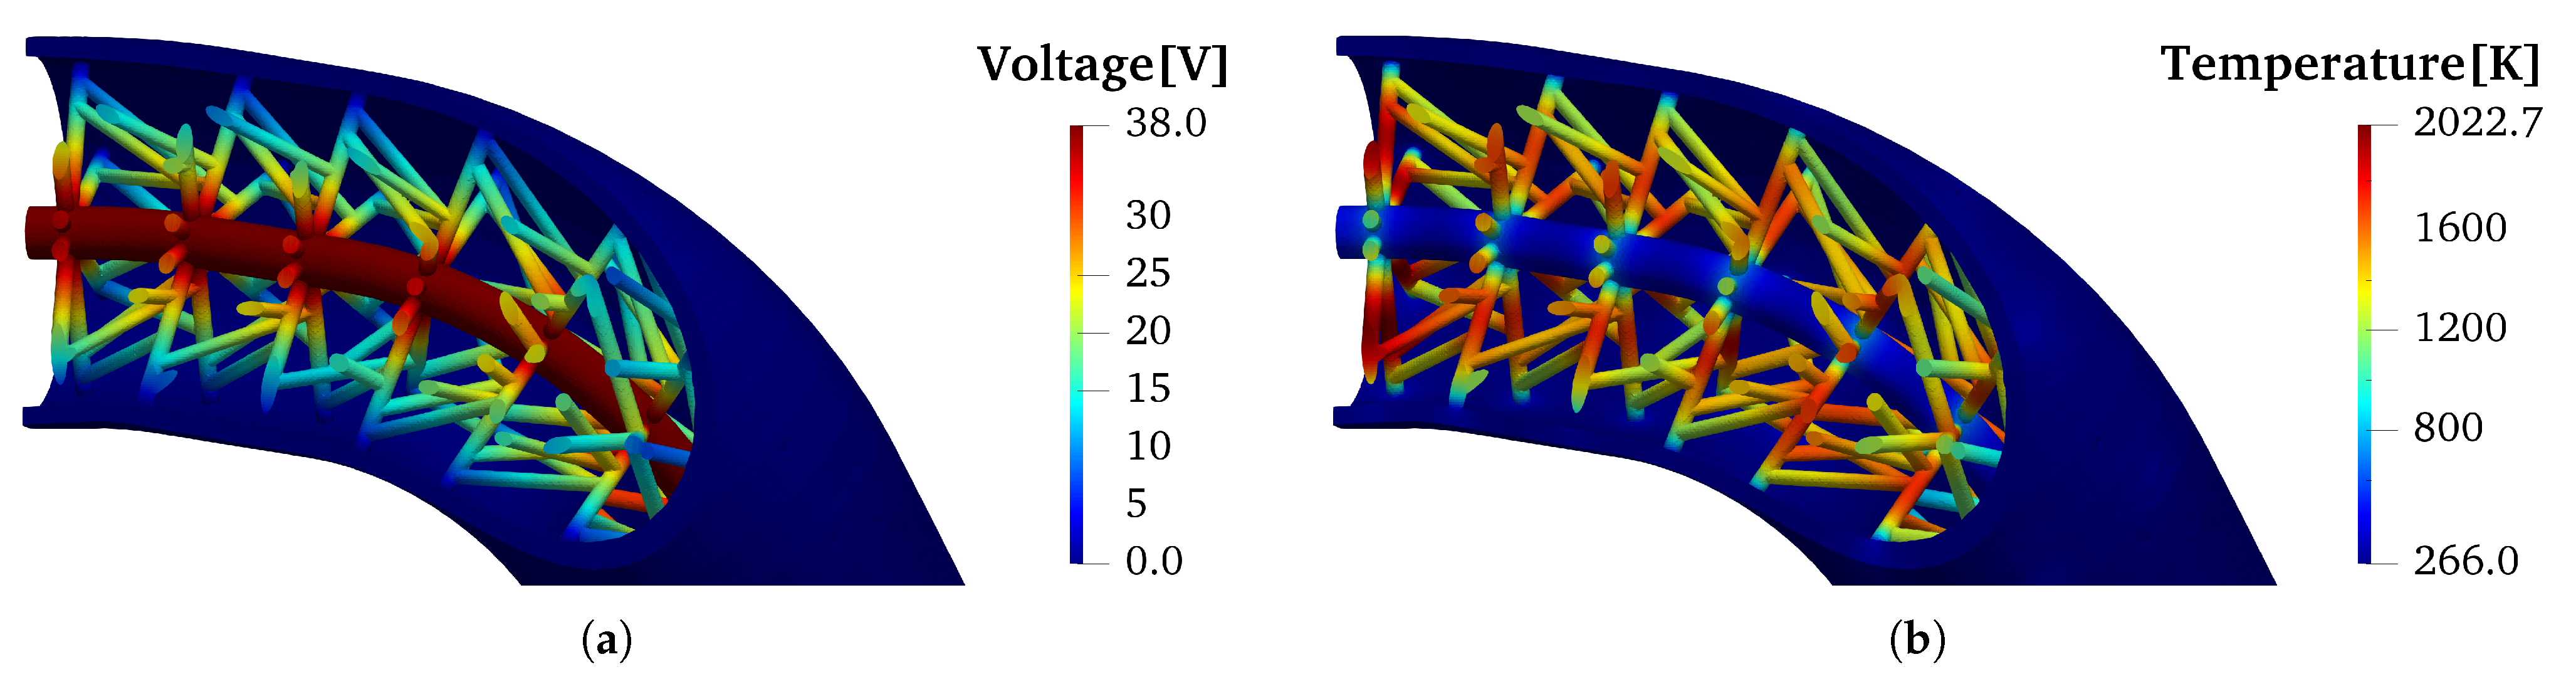
The results obtained according to the different applied potential differences are presented. A visualization of the simulated domains’ temperature and voltage fields is reported in 
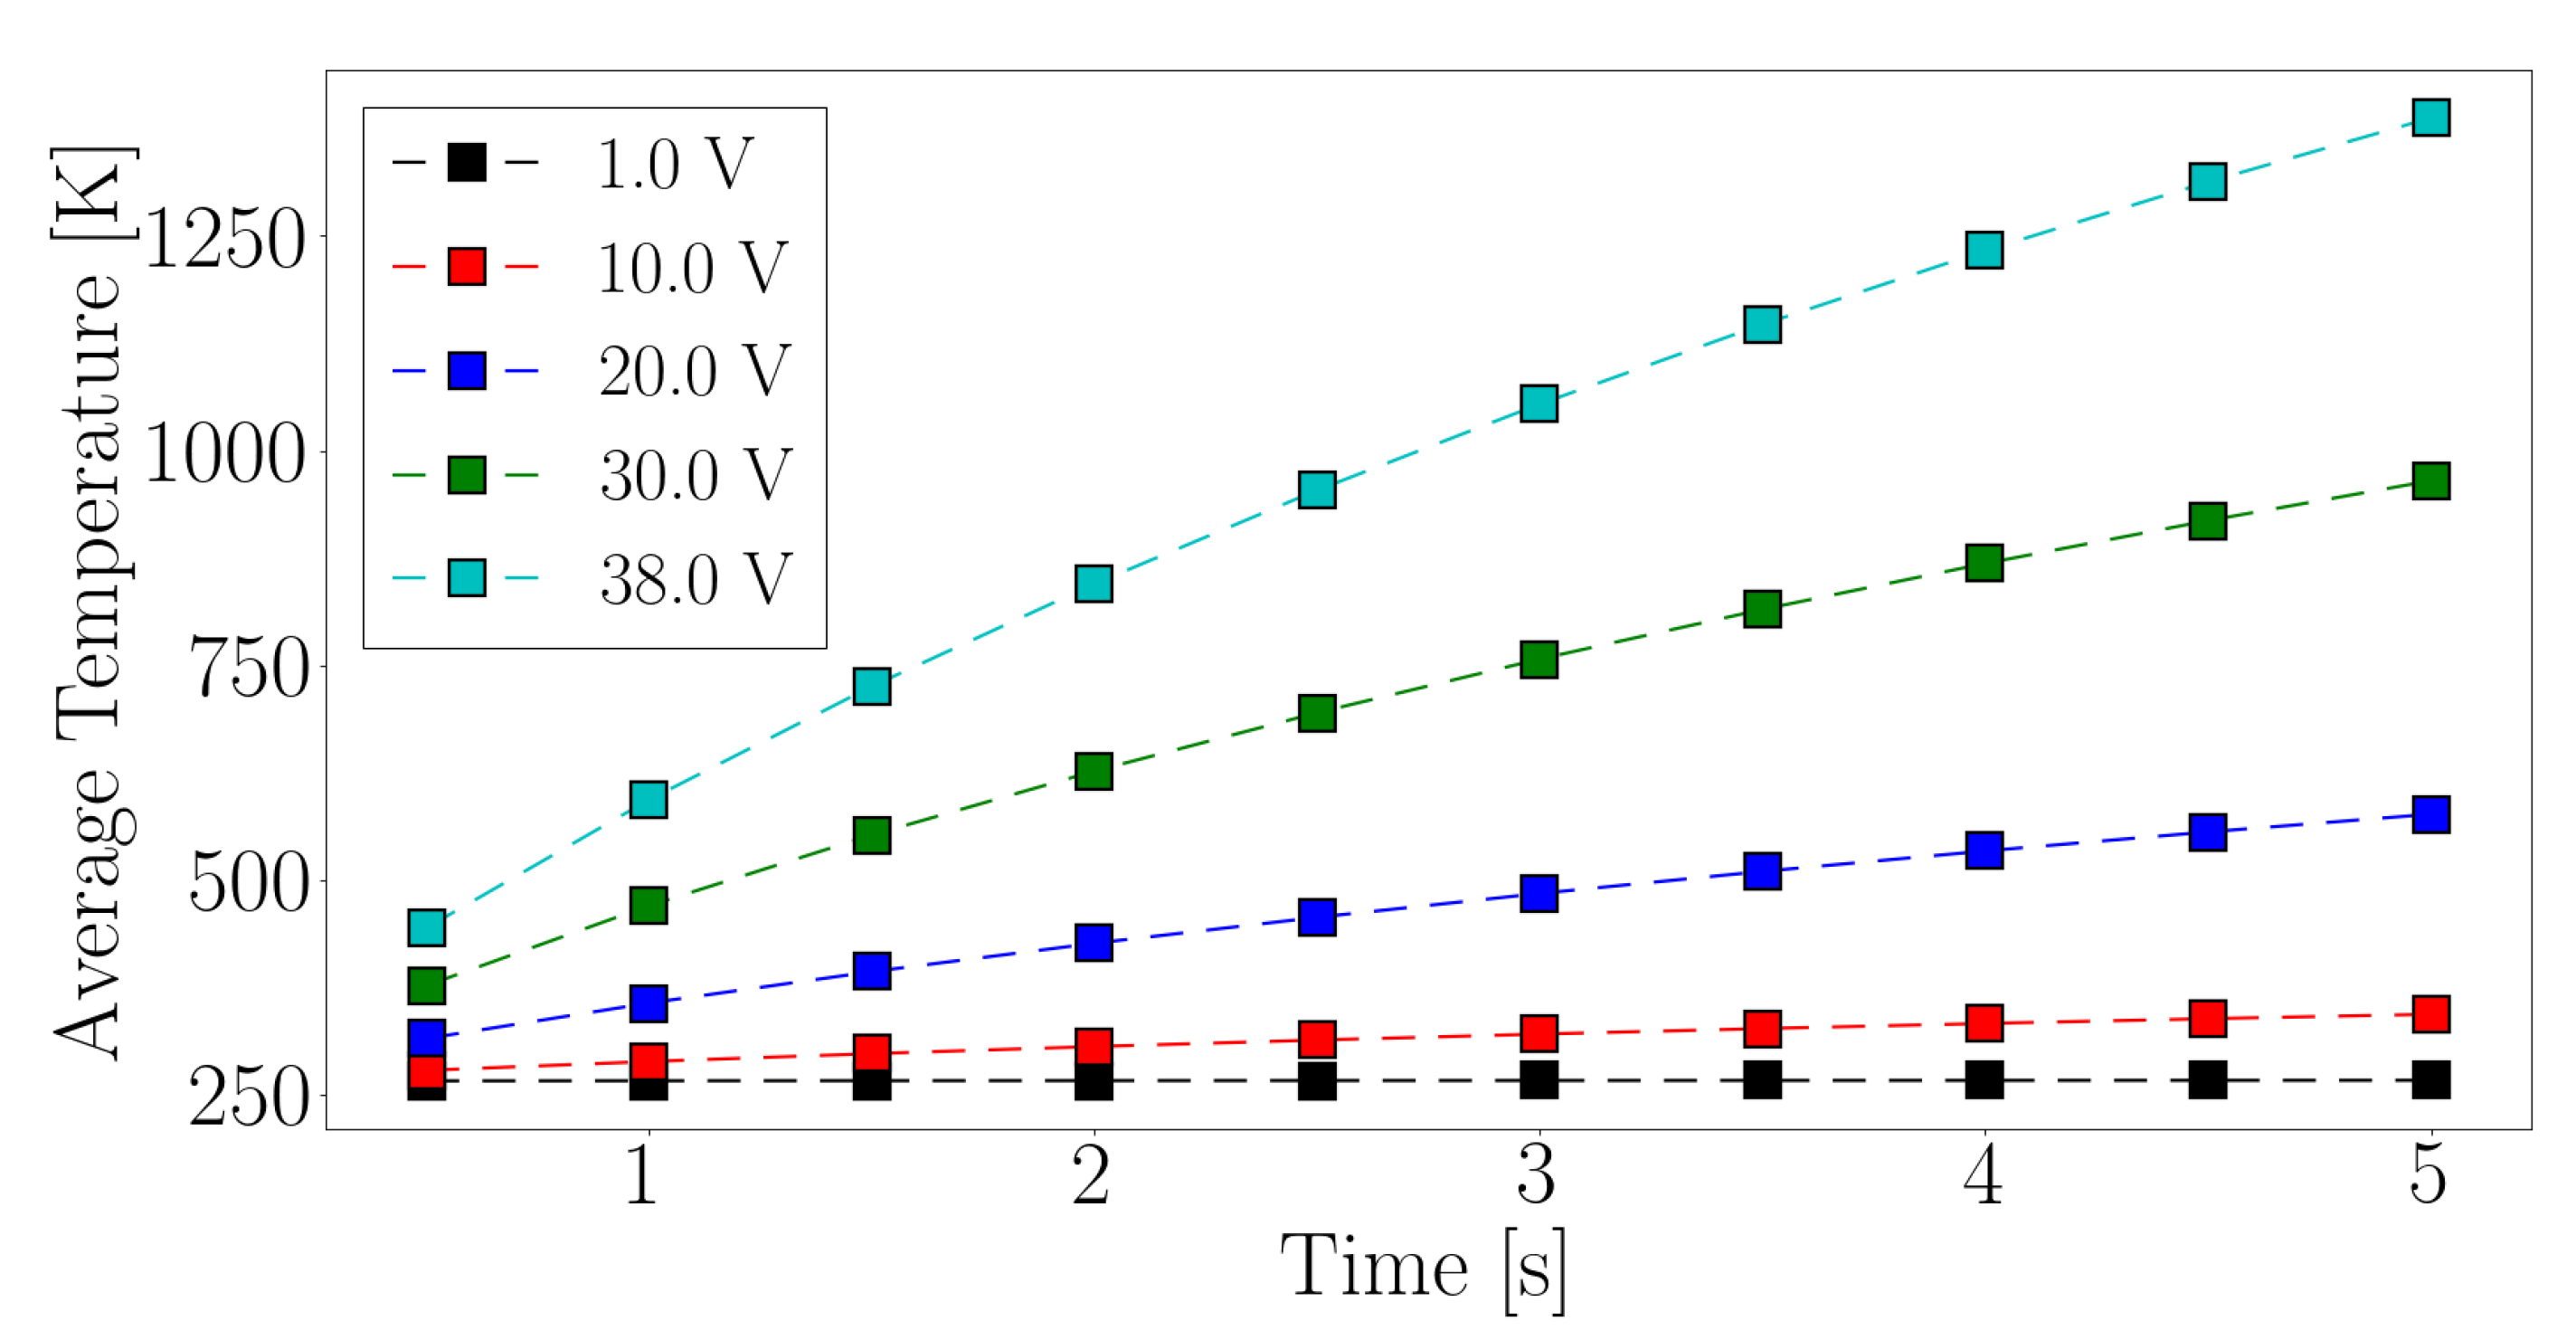
Figure 11, referring to the simulation end-time of the 38 V potential difference. The shown distributions prove the goodness of the designed electrical circuit, resulting in the significant heating of the struts region only. The struts’ average temperature profile all over the simulated time range is reported in Figure 12. The applied boundary condition significantly influences the Joule heating power that is produced as the electrical current flows through the silicon carbide struts, as reported in Table 7.
Given the expected interaction in the first phases of a cold start between the exhaust gases and the POCS, a potential difference higher than 20.0 
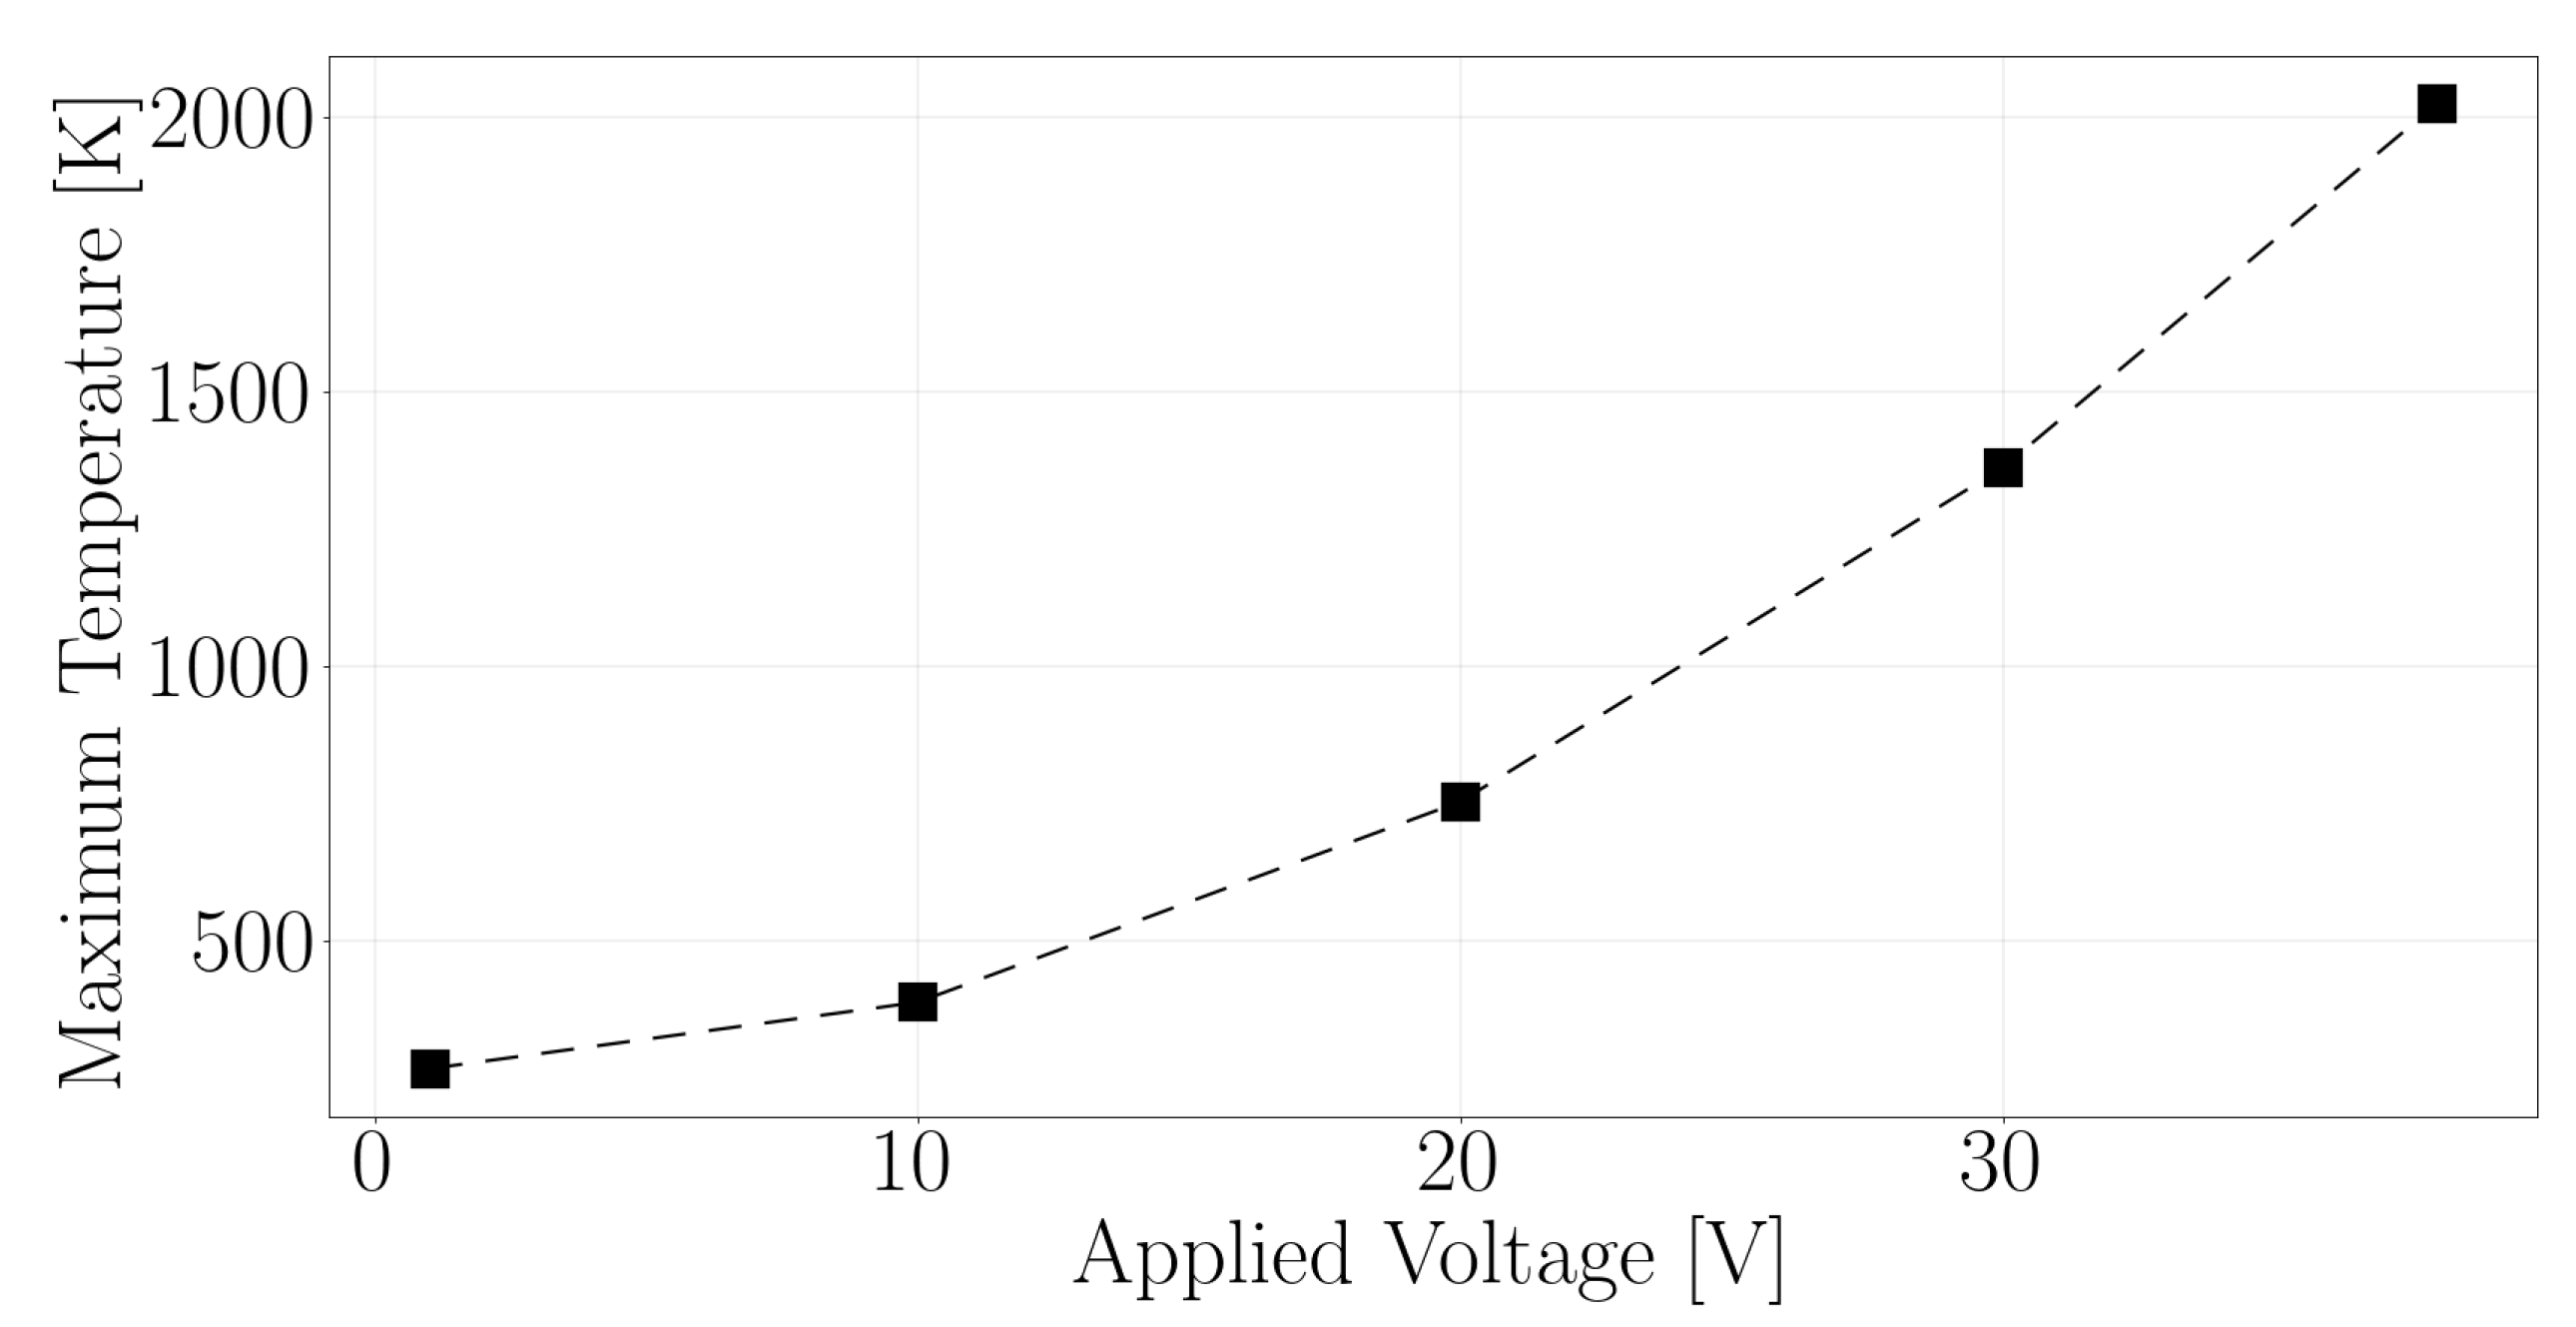
V is required: the identified maximum average temperature is slightly higher than 500 K and no beneficial effects in the cold start abatement efficiencies are expected below the highlighted temperature. However, the associated supplied electrical power would exceed 500 W for a single duct; the application of such a structure in all the exhaust manifolds could significantly affect the vehicle battery’s operational life. In addition, the maximum temperature that characterizes the POCS struts after the simulated five seconds could exceed the material limit temperature. The maximum values for each investigated condition are reported in Figure 13. Nonetheless, the interaction between the cold exhaust gases and the struts could limit the achieved maximum temperatures, ensuring that the material limits are respected. For this reason, the formulated heating strategy is modified and a total of six seconds of electrical heating are applied for the cold start assessment simulations. Even though the overall supplied electrical power could be critical for a real exhaust line application, the 38.0 V operating condition was selected for the cold start assessment. As such, the maximum capability of the EHC–POCS could be investigated.

4.2.2. Exhaust Line Equipped with EHC–POCS Assessment

The results related to the application of the EHC–POCS as a pre-catalyst are reported. In particular, the obtained data of two different scenarios (with and without the designed structure) are analyzed in order to evaluate the application of the EHC–POCS and the resulting beneficial effects in terms of ATS performances. The EHC operating conditions are selected to exploit the electrical heating sensitivity analysis: 38.0 
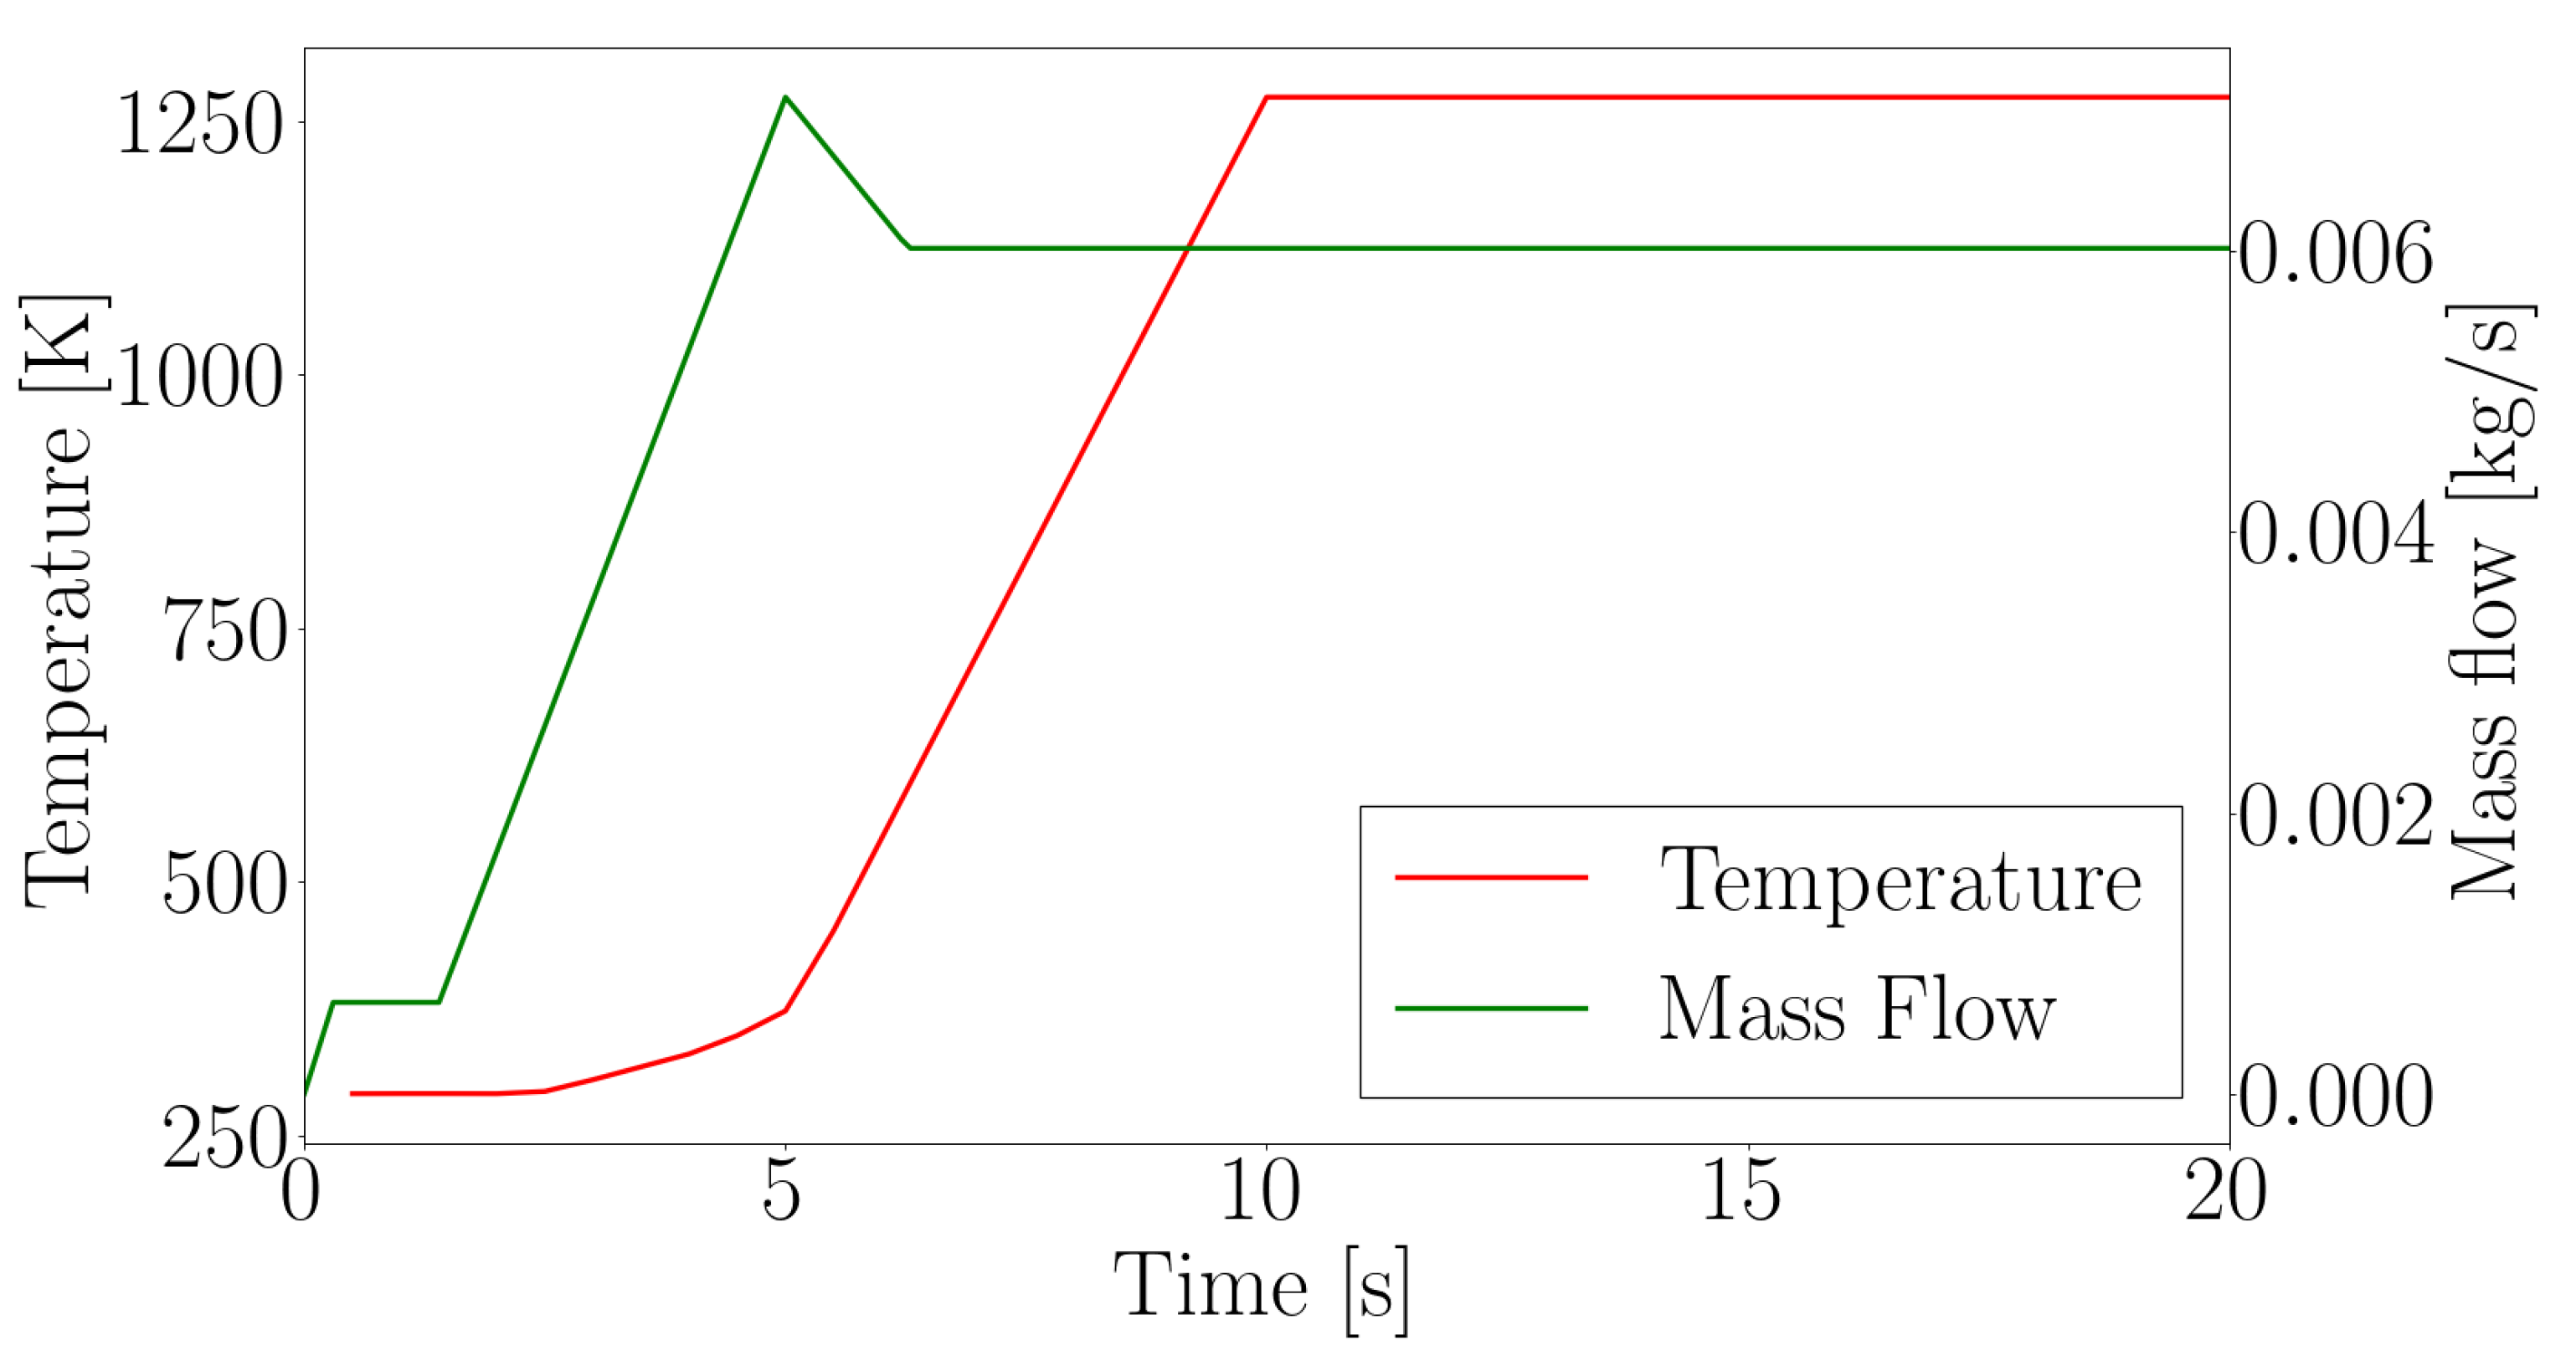
V for a total of six seconds. At first, the heat transfer phenomena occurring in the first portion of a single exhaust manifolds are investigated in case the EHC–POCS is equipped in the exhaust line. To carry out a consistent comparison, the thermal response of the same first portion of the exhaust manifold is simulated excluding the presence of the designed structure. The analysis of the obtained temperature profile at the outlet of the considered geometry provides a clear understanding of the effects related to the electrical heating application and to the fluid–POCS heat transfer phenomena. In particular, the outlet temperature profiles computed through the two different simulations, superimposed over the inlet temperature trend, are shown in Figure 14.
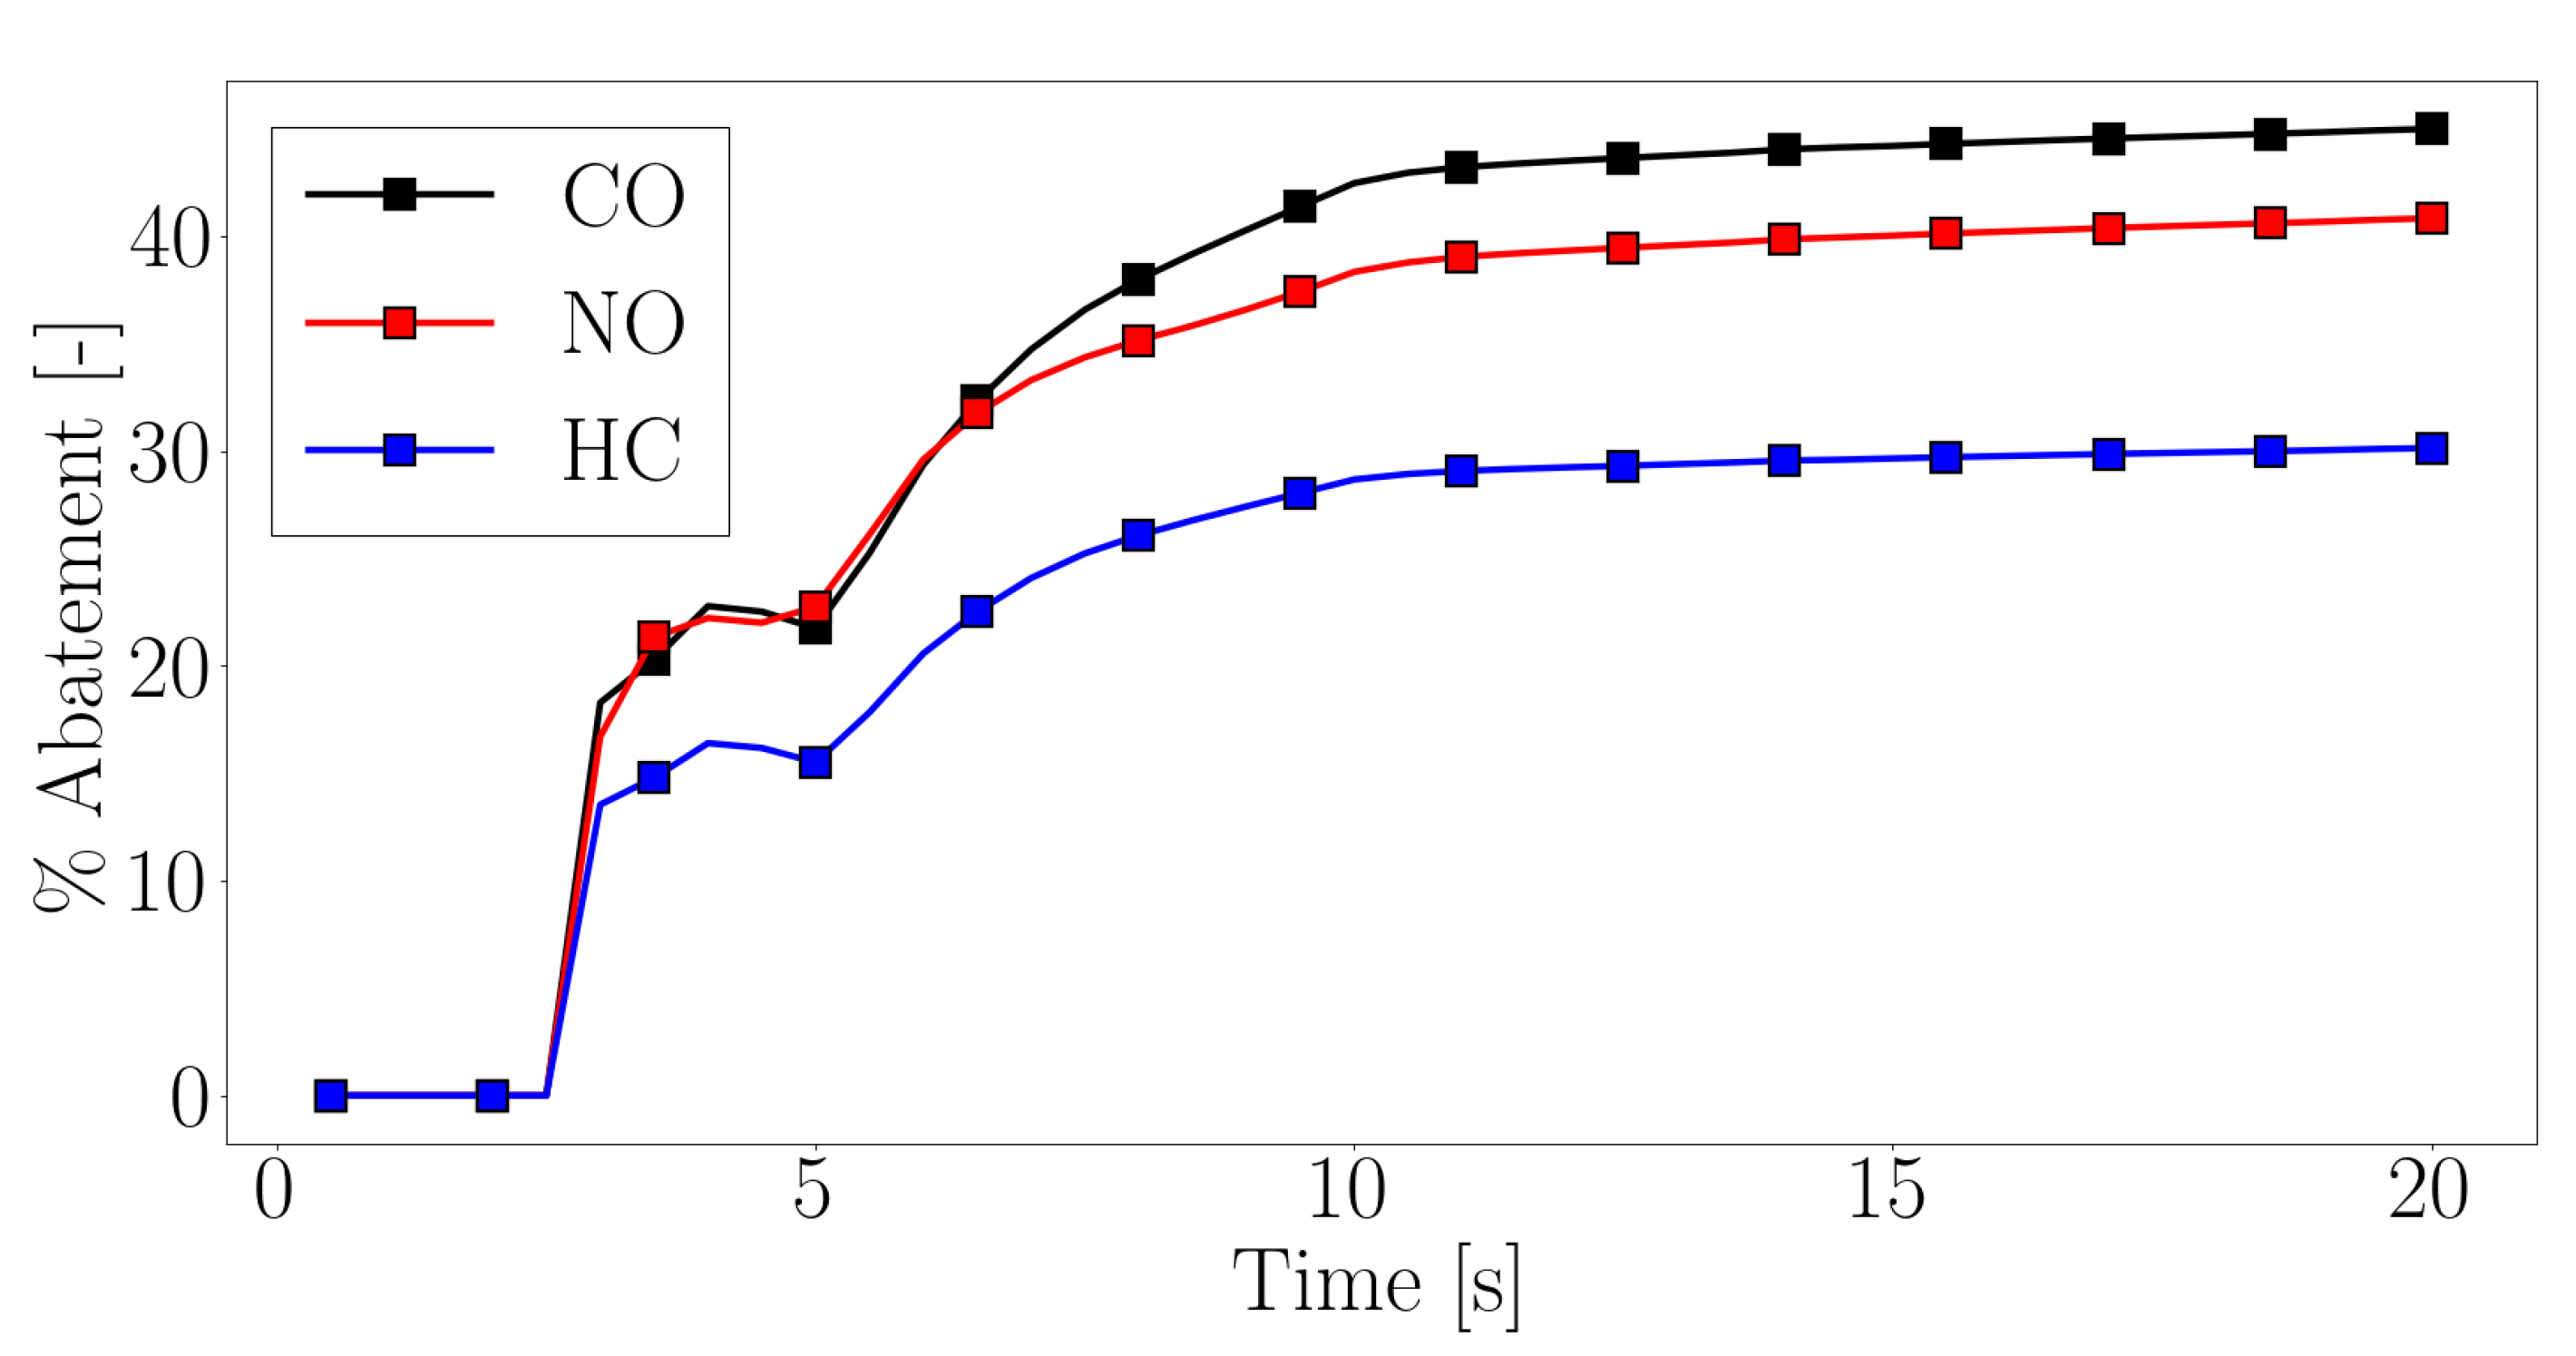
The heating strategy is effective in increasing the temperature of the fluid flow. In particular, the achieved temperatures are such that the catalytic reactions are active in the first seconds of the cold start, which are commonly referred to as the most critical phases and are responsible for most of the pollutants emissions. As soon as the electrical heating is deactivated, the thermal inertia of the EHC–POCS is such that part of the fluid enthalpy is employed to heat up the designed structure. Two seconds after the deactivation, the EHC–POCS structure is responsible for lower outlet temperatures than what can be observed for the case without POCS. To account for the effectiveness of the obtained pre-catalyst behavior, the pollutants’ percentage abatements are computed and their profiles all over the simulated time-range are presented in Figure 15. Considerable pollutant abatement is achieved three seconds after the engine cold start, which is approximately 20% for all the considered pollutants.
After the initial activation of the catalytic reactions, the pollutant abatement increase is slowed down around the time instant corresponding to 5 s: the maximum exhaust gas mass flow is being discharged while the gas temperatures are still below the characteristic reactions’ light-off values. As a consequence, even though the electrical power is continuously being supplied, the local maximum temperatures are slightly reduced. As time advances and the inlet fluid temperatures increase, the pre-catalyst is more and more effective. The final CO, NO and HC percentage abatements are approximately 45, 40, and 32%. The analyzed data prove the effectiveness of the pre-catalyst, resulting in higher fluid temperatures during the initial phases of the cold start and a considerable reduction in the pollutant emissions prior to the standard ATS devices. A visualization of the HC pollutants concentration and fluid temperature distributions for different selected time instants is presented in Figure 16. A minimum temperature threshold equal to 500 K is employed in order to identify the domain portions where the catalytic activity is expected. From a qualitative point of view, it is possible to appreciate how the electrical power supply is effective in increasing the fluid temperature which grows as the radial distance from the POCS decreases (Figure 16a,b). Once the heating strategy is over, the fluid temperature distribution is ruled by the imposed inlet profile (Figure 16c,d). In addition, the pollutant abatement due to the washcoat-induced catalytic activity corresponding to the struts walls can be appreciated.
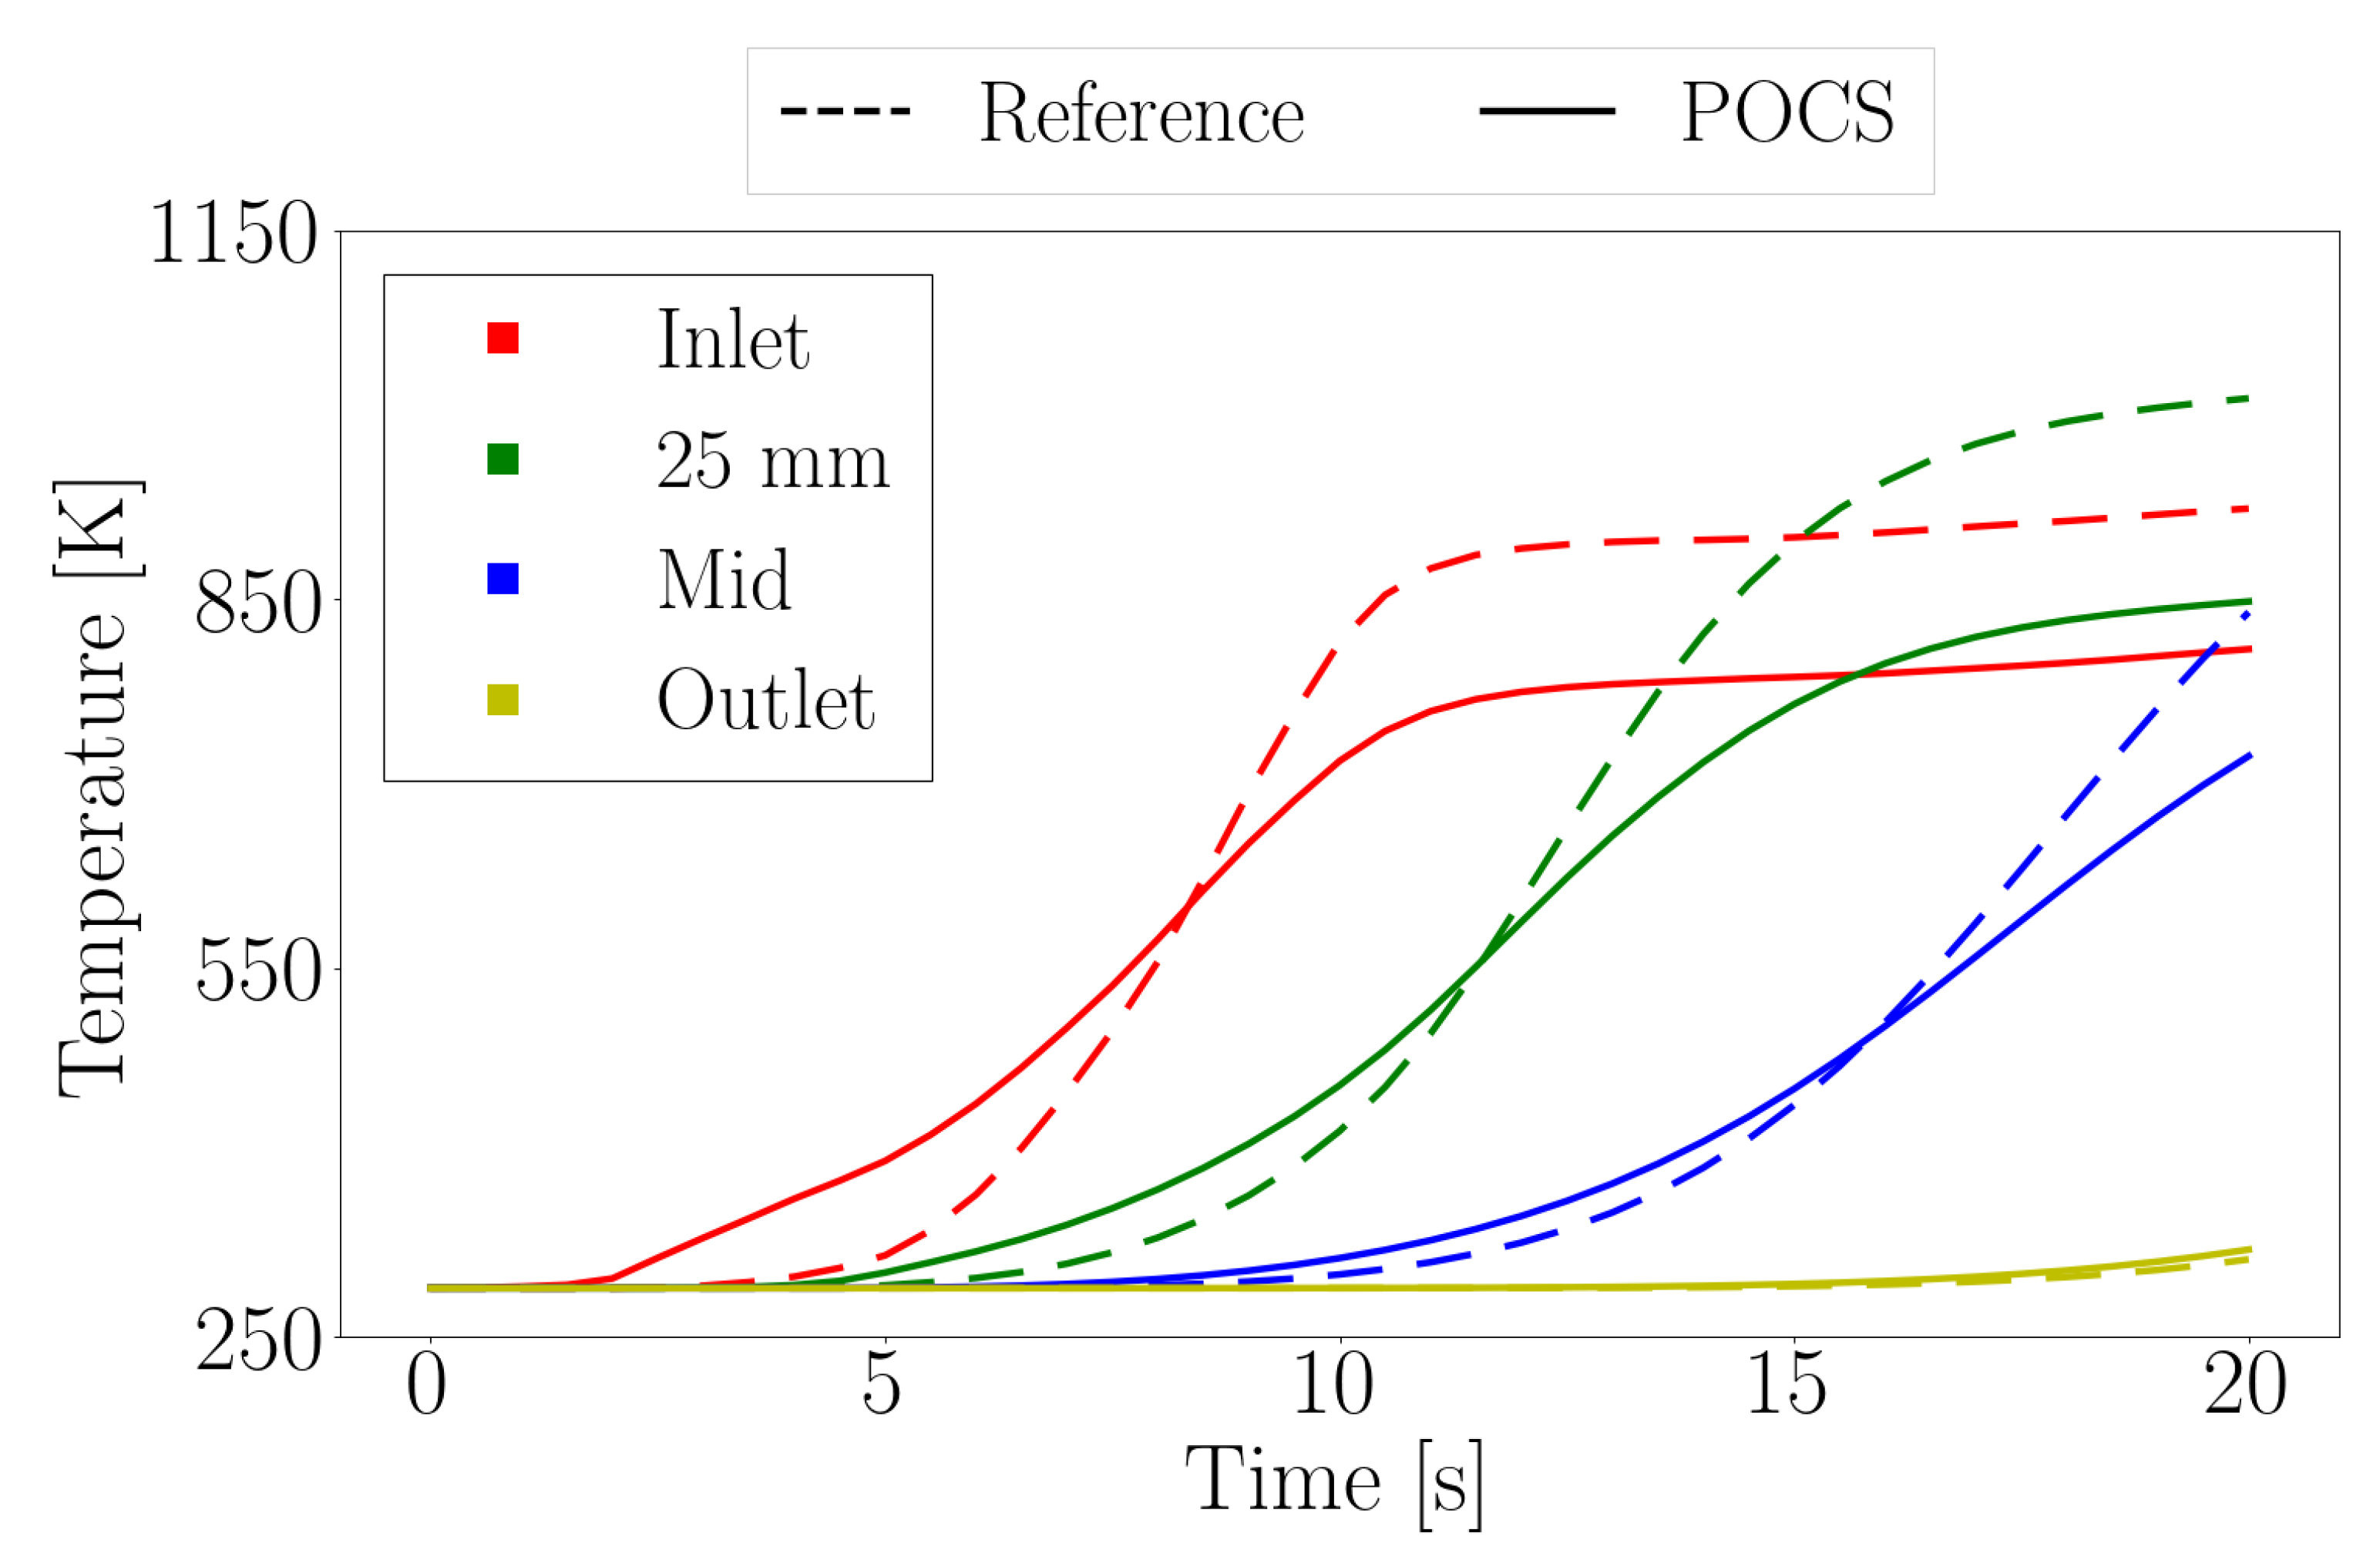
The proposed results are employed as boundary conditions for the exhaust line simulations. As such, the beneficial effects of the EHC–POCS equipment can be investigated, both in terms of the increase in the catalysts’ temperature and the pollutant abatement prior the ATS devices. An evaluation of the thermal transient of the first catalyst is presented in Figure 17. In particular, the surface average temperature of four different sections are analyzed over the simulated time-range. The selected axial coordinates for which such an evaluation is carried out corresponds to the inlet, 25 mm after the inlet, mid, and outlet coordinates.
The electrical heating phase results in a significant spur of the heating of the first portion of the CAT1. After five seconds, the temperature of the inlet section for the ATS configuration equipped with the EHC–POCS is 100 K higher than what can be observed for the reference case. However, once the electrical heating strategy is over, the presence of the EHC–POCS induces a heat loss that becomes significant as the exhaust gas temperatures increase: the initial spur is gradually recovered until the heat transfer between the exhaust gases and the designed POCS results in an overall cooling of the fluid flow. In particular, the inlet section temperature profile of the reference case overcomes the profile of the ATS equipped with the EHC–POCS after eight seconds, while the 25 mm and mid-sections after eleven and sixteen seconds, respectively.
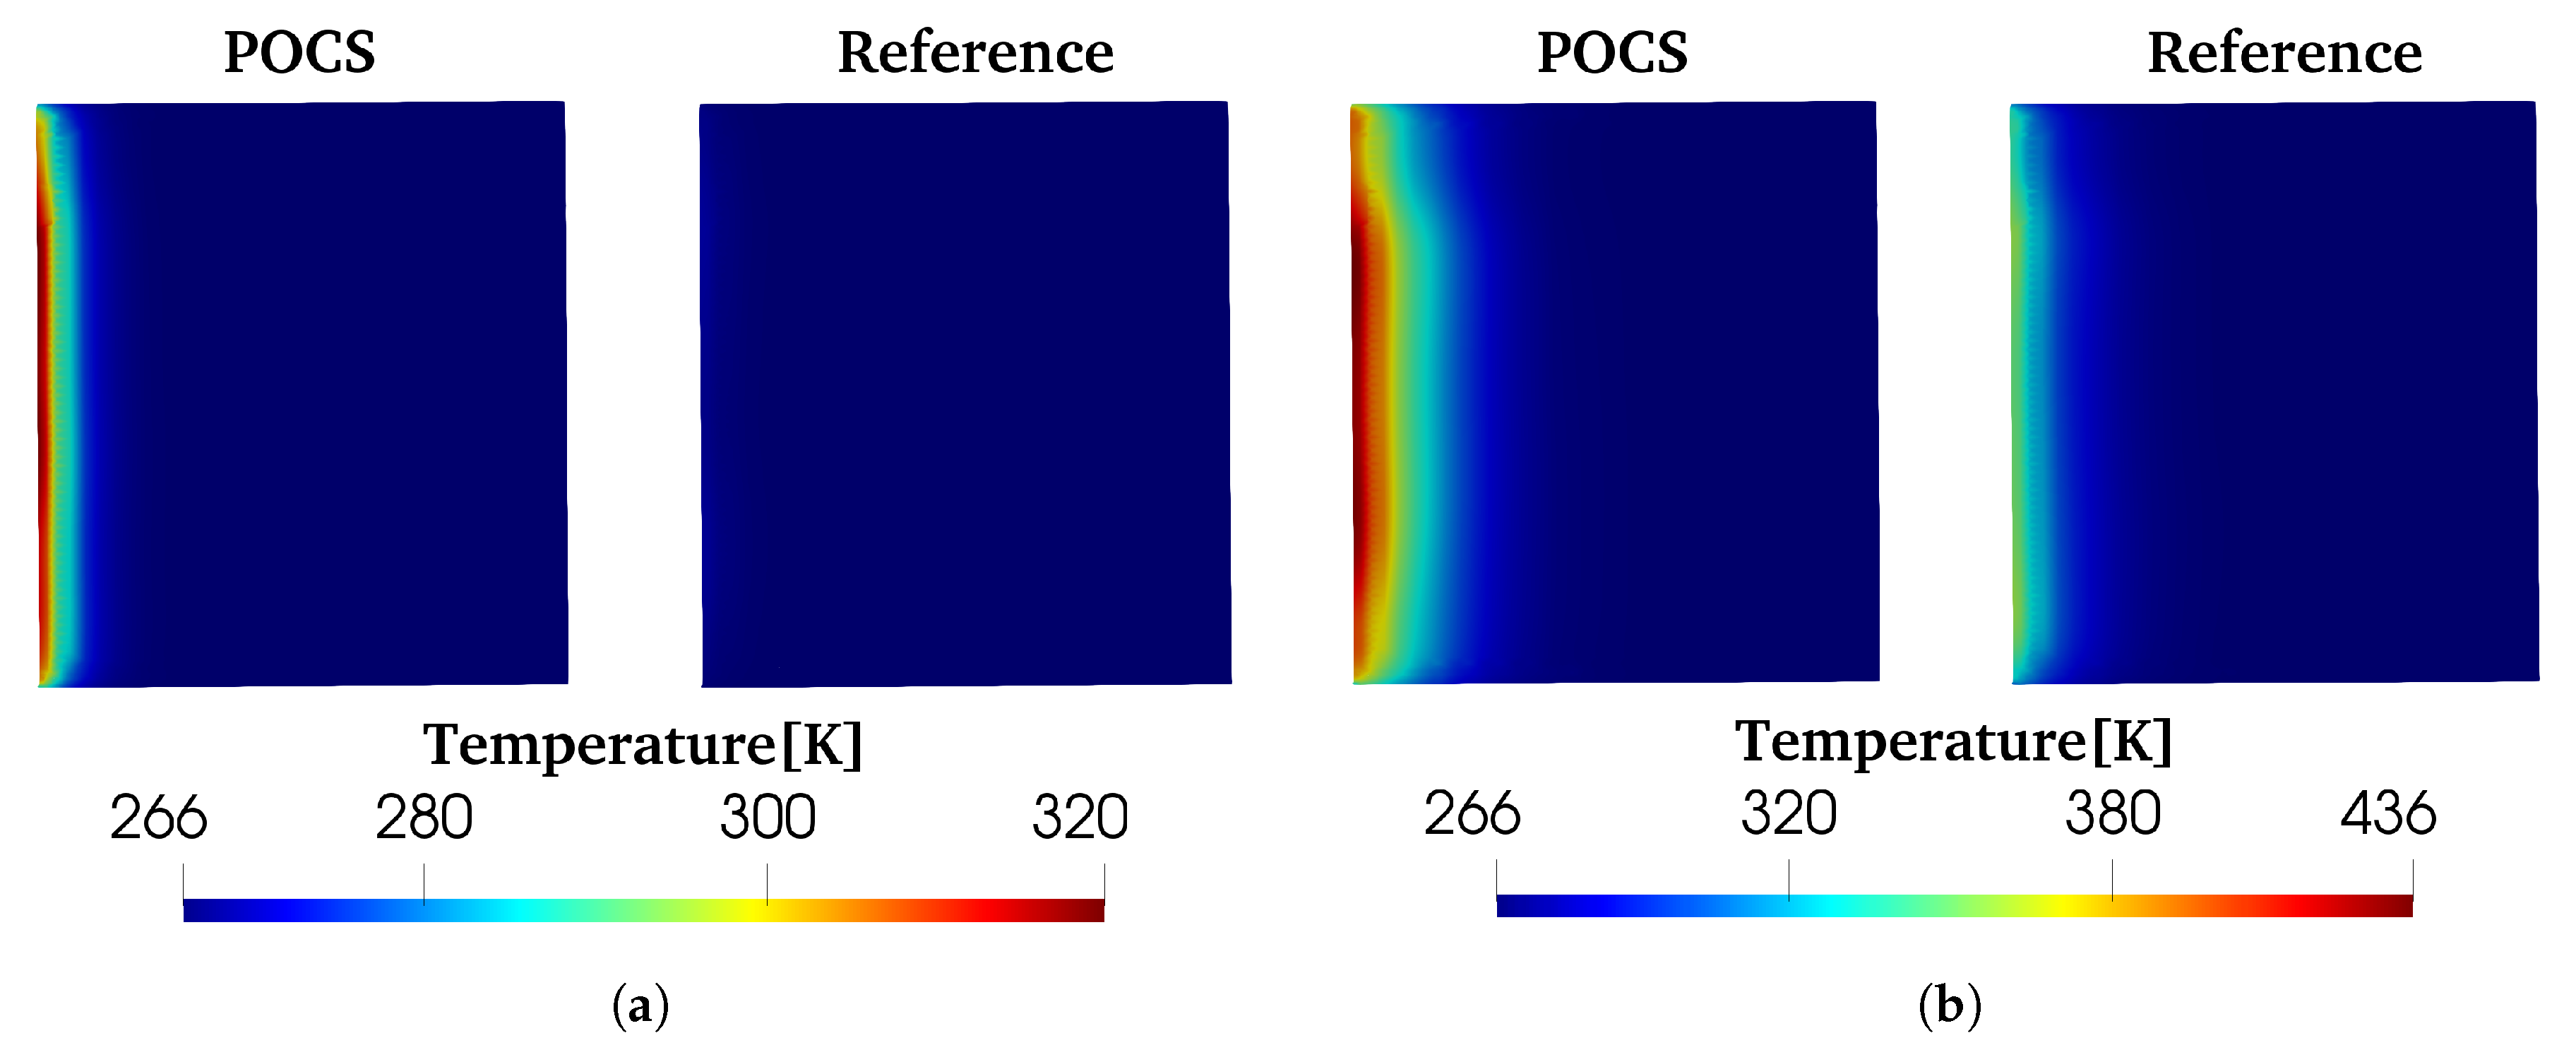
The improved heating of the first portion of the CAT1 catalyst can be additionally analyzed by evaluating the temperature fields of the device for the two different configurations. In particular, the distribution of a slice of the temperature fields for two selected time intervals is presented in Figure 18, referring to half and to the end of the applied electrical heating strategy.
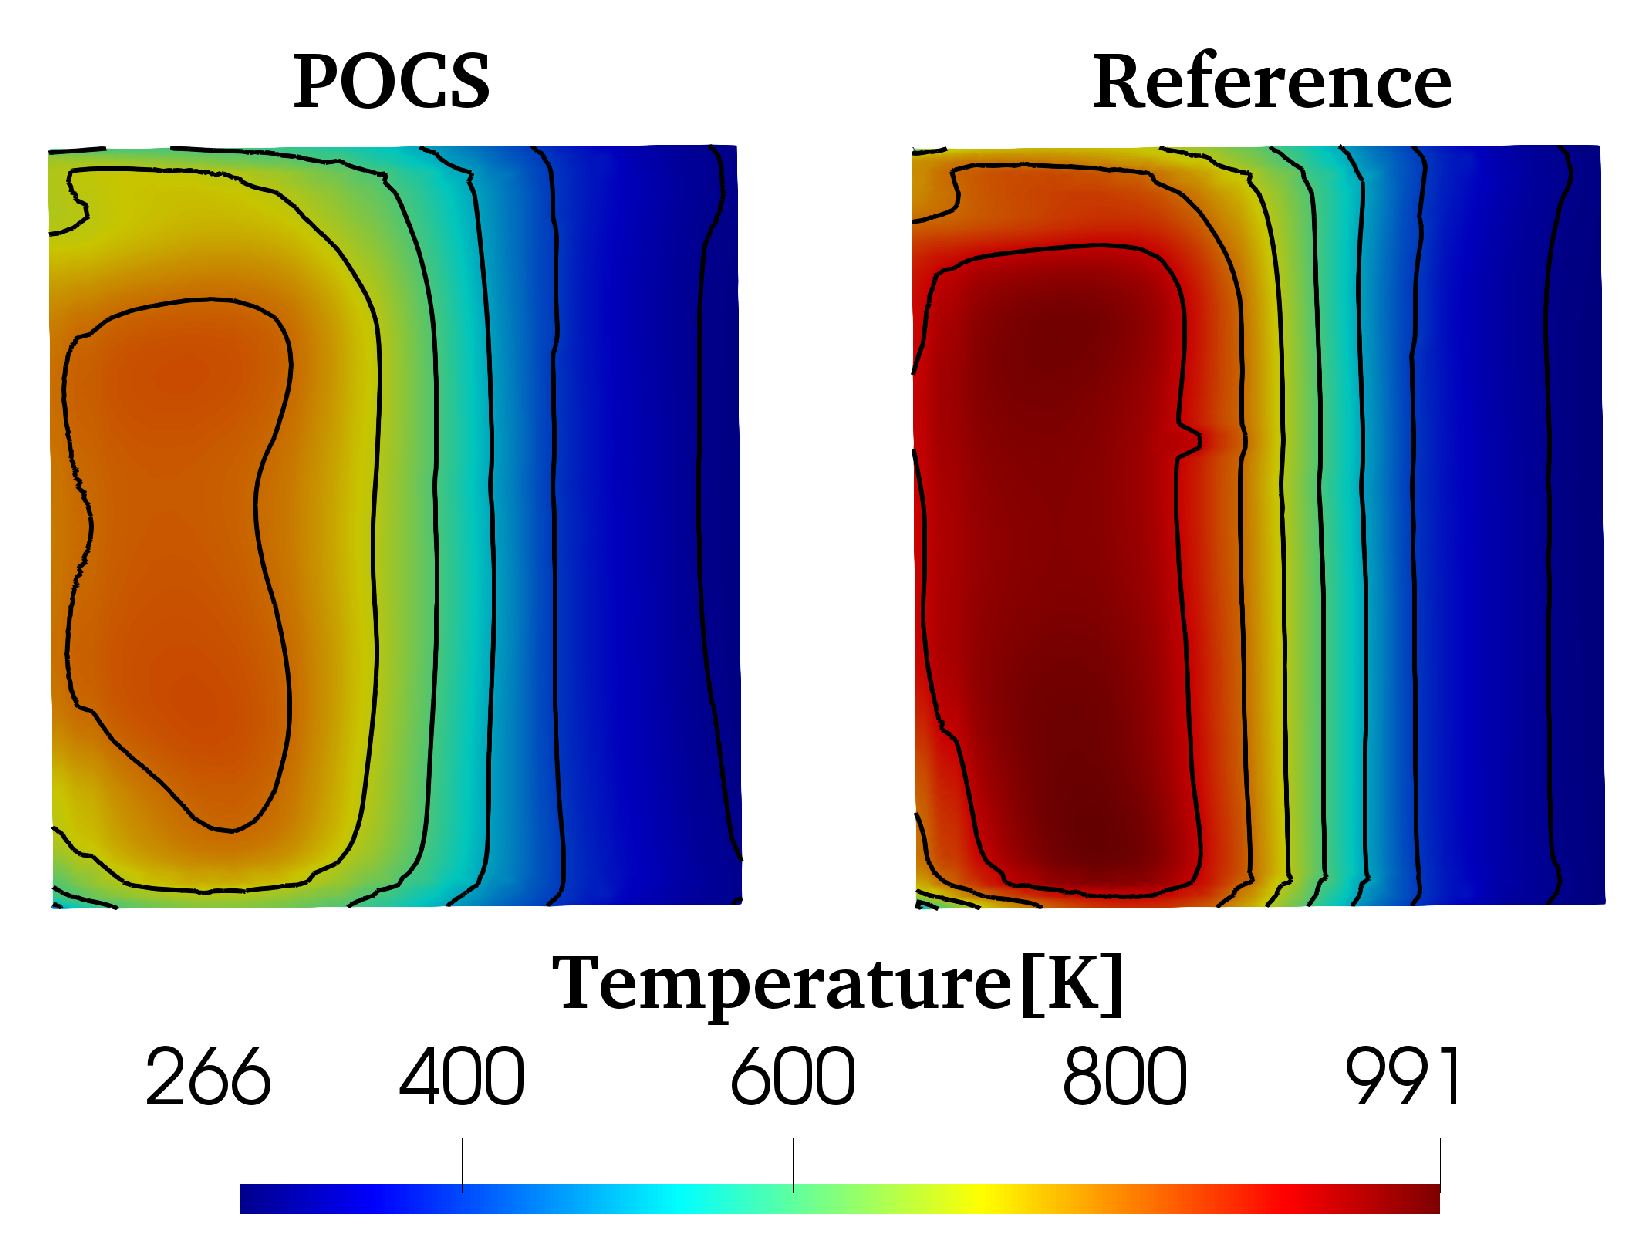
However, the exhaust gas mass flow rates and the pre-defined voltage boundary conditions are such that the overall energy contribution that is provided to the catalytic substrate is limited. In addition, the EHC–POCS structures are located in the initial portion of the exhaust manifolds: before reaching the standard catalyst, the heated fluid flow exchanges a significant amount of wall heat power with the exhaust manifolds. As a consequence, at the end of the heating strategy, only a small portion of the ATS device was significantly heated up. As the exhaust gas flow rates and temperatures increase, the induced heat transfer between the hot gases and the designed POCS are responsible for a significant reduction in the first catalyst temperature with respect to the reference case. The temperature field distributions of the first catalyst at the simulation end-time is reported in Figure 19 for both of the ATS configurations analyzed. In particular, different regions featured by a temperature difference of 100 K have been highlighted through the identification of temperature iso-lines.
Only the thermal transient of the first catalyst was investigated, while the second substrate was not considered. The simulated operating conditions are such that no relevant effects affect the thermal response of the second catalyst. Indeed, at the simulation end-time, the outlet temperature of the CAT1 increased by approximately 50 K only under the assigned initial conditions. The thermally related effects discussed herein are strongly coupled to the obtained pollutants’ conversions. In particular, the percentage abatement profiles of the three considered pollutants are reported in Figure 20.
The heating strategy and the pre-catalyst behavior achieved through the EHC–POCS are effective in inducing significant pollutant conversions. Even in the first phases of the cold start, the abatement of the three pollutants resulted in 25% due to the combination of the POCS pre-catalyst behavior and a modest spur of the CAT1 light-off. When the maximum exhaust gas mass flow rate was discharged, the abatement efficiency was slightly affected, while it was promoted as the inlet exhaust gases temperature increases. In addition, the tail-pipe pollutants’ cumulative emissions are evaluated for both the configurations under investigation, which are the ATS equipped with the EHC–POCS and the base exhaust line. The reductions induced by the POCS structure are reported in Table 8. The presented values show how the EHC–POCS behavior as a pre-catalyst is effective in reducing the pollutants’ emissions in the first phases of a cold start.
However, the heat losses associated with the late exhaust gases and EHC–POCS interaction result in a reduction in the fluid temperatures prior the first catalytic device. As a consequence, the chemical reactions characterized by a high activation energy could be penalized. For most of the simulated time-range, the reference exhaust line provides a lower conversion efficiency than what can be obtained by exploiting the EHC–POCS. Towards the end of the simulation, the previously addressed thermal inertia effects are such that the maximum temperatures of the first catalyst are lower than those of the reference case and a lower HC abatement is obtained (
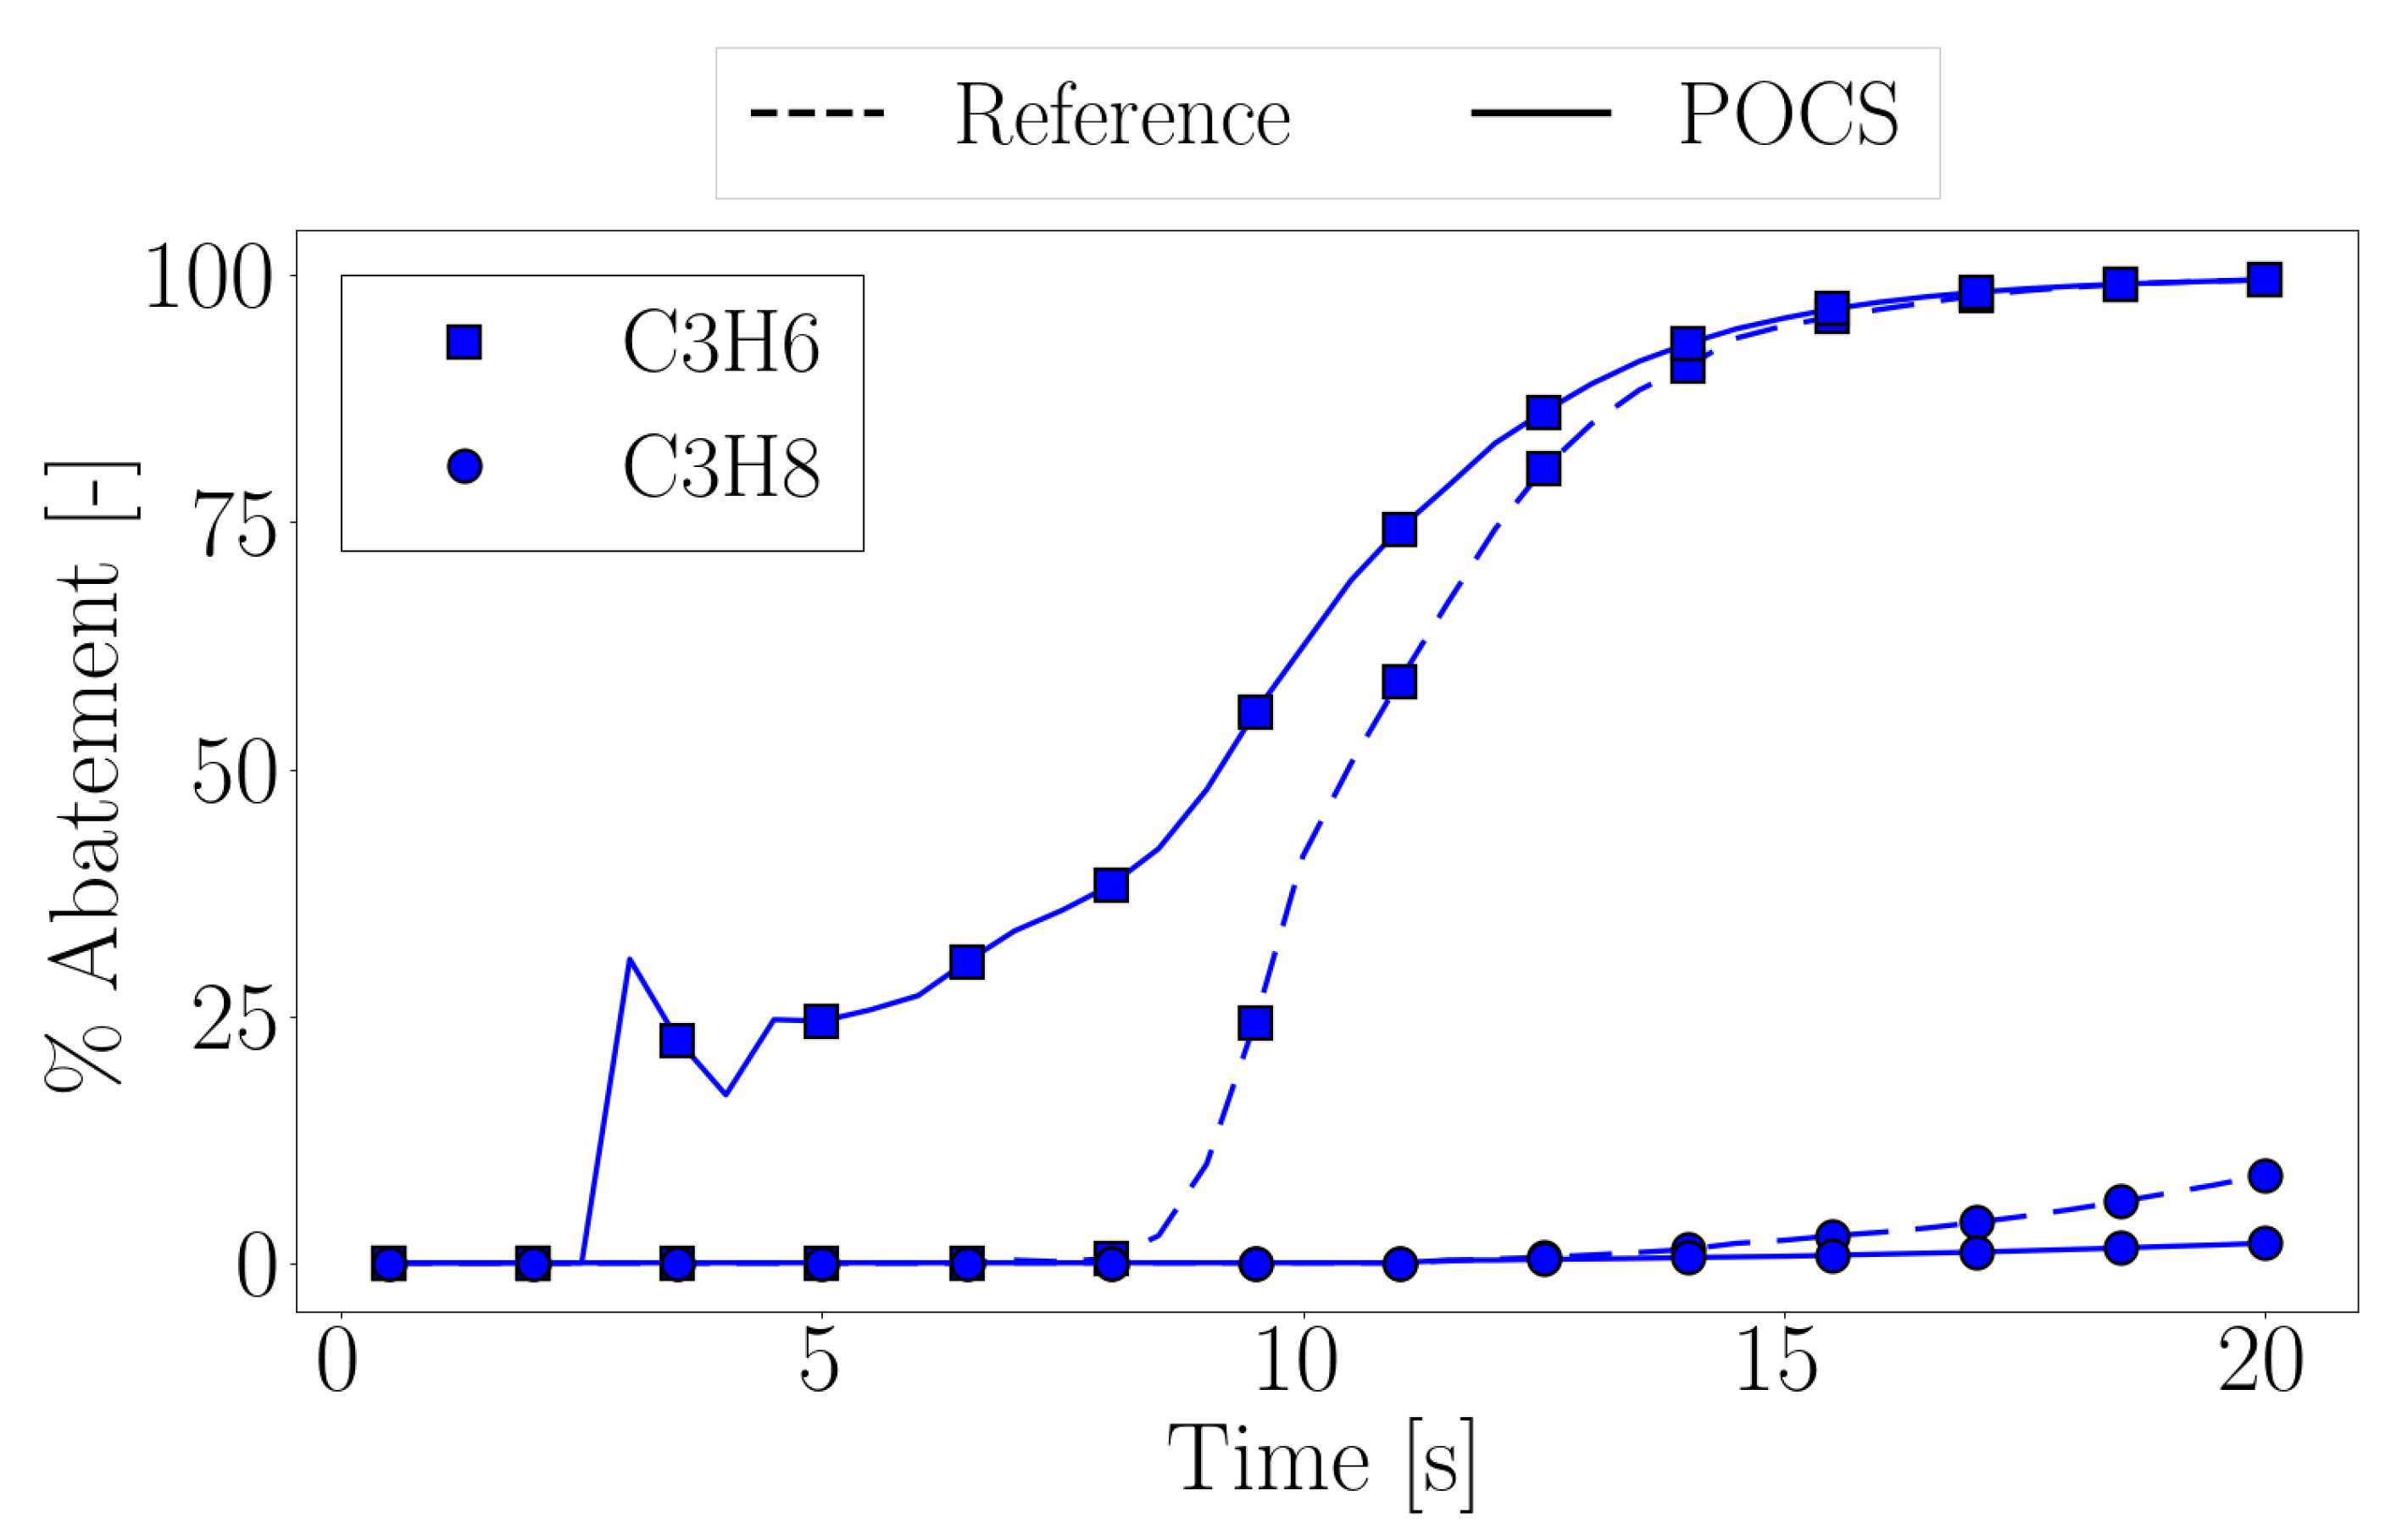
Figure 20). This aspect is detrimental for the abatement of the C3H8 chemical species, whose reaction rate strongly depends on the temperature. The percentage abatement of the two considered hydrocarbons is reported in Figure 21, highlighting the appointed phenomena: towards the end of the simulation, the C3H8 conversions in the reference case are higher than in the POCS case results.

5. Conclusions

The discussed numerical analysis consists of a preliminary investigation into the adoption of an innovative POCS as a pre-catalyst for the ATS of a gasoline engine. The effects related to the induced pressure drop on the engine performances were investigated. The designed structure has been further integrated with an electrical circuit to exploit the joule heating effects and to achieve an EHC behavior. The main findings of the work are discussed hereafter.
  • A dedicated simulation campaign was carried out to characterize the fluid-dynamic performances of the designed POCS. A combination of the 3D and 1D CFD analysis provided a clear assessment of the influence of the POCS-induced pressure drop on the engine performances. Despite the achieved results showing a non-negligible impact, one consisting of a maximum reduction in the brake power and an efficiency of 14.8 and 8.3 %, respectively, the beneficial aspects of the EHC–POCS equipment could make up for the observed limitations.
  • The application of the Joule heating on the designed POCS was studied. A parametric analysis was performed, as a function of the applied potential difference. The obtained results show that the POCS material limit temperature can be achieved if the heating strategy relies on high potential differences and long heating time. Exploiting the parametric analysis, a dedicated heating strategy has been formulated and the assessment of the equipment of EHC–POCS in a realistic exhaust line was performed. The transient response of the ATS and the pollutants’ conversion efficiencies were monitored when the overall system is subjected to simplified cold start conditions. As a consequence of the fluid–POCS interaction, the electrical heating application is such that higher exhaust gas temperatures were registered in the first phases of the thermal transient. The achieved energy levels are such that the catalytic reaction of the pre-catalyst can be activated. As a result, significant improvements in the pollutant abatement in the early phases of the cold start were obtained. However, with respect to a traditional EHC application, no significant improvements were obtained in terms of the light-off time of the standard catalyst. Furthermore, once the heating strategy was switched off, the POCS thermal inertia was responsible for a reduction in the exhaust gas temperatures and a lower catalytic activity (for the slow HC) was registered.
  • Overall, the designed EHC–POCS showed a promising behavior as a pre-catalyst to be equipped for advanced emission controls. Further improvements could be achieved with the definition of an ad hoc heating strategy, which could be dynamically activated as a function of temperature measurements, or through different POCS design principles, in order to reach an optimal trade-off between the required electrical power and the achieved temperatures. In addition, the exhaust line location in which the POCS structures are equipped could be significant. Moving the EHC–POCS near the standard ATS catalyst could reduce the exchanged heat power with the exhaust manifolds and significantly improve the beneficial effects associated with an early catalyst light-off. Finally, further studies are required to investigate the application of the EHC–POCS as a function of realistic cold start conditions and dedicated heating strategies.

Author Contributions

Conceptualization, L.B., A.D.T., G.M. and A.O.; Methodology, L.B., A.D.T., G.M. and A.O.; Software, L.B., A.D.T. and G.M.; Validation, L.B., A.D.T. and G.M.; Writing—original draft, L.B.; Writing—review & editing, A.D.T., G.M. and A.O.; Supervision, A.D.T., G.M. and A.O. All authors have read and agreed to the published version of the manuscript.

Funding

This research received no external funding.

Institutional Review Board Statement

Not applicable.

Informed Consent Statement

Not applicable.

Data Availability Statement

Data sharing not applicable.

Acknowledgments

The authors gratefully acknowledge the contribution of Giulia Zanetta, who worked with commitment to the development of this project during her M.Sc. thesis. The obtained results provided the basis for the investigation presented in this research work.

Conflicts of Interest

The authors declare no conflict of interest.

Abbreviations

The following abbreviations are used in this manuscript:
AMAdditive Manufacturing
POCSPeriodic Open Cellular Structure
CFDComputational Fluid Dynamics
SCRSelective Catalytic Reduction
TWCThree-Way Catalyst
DOCDiesel Oxidation Catalyst
ICEInternal Combustion Engine
EHCElectrically Heated Catalyst
CHTConjugate Heat Transfer
ATSAfter Treatment System

References

  1. Giani, L.; Groppi, G.; Tronconi, E. Mass-Transfer Characterization of Metallic Foams as Supports for Structured Catalysts. Ind. Eng. Chem. Res. 2005, 44, 4993–5002. [Google Scholar] [CrossRef]
  2. Lucci, F.; Della Torre, A.; Montenegro, G.; Dimopoulos Eggenschwiler, P. On the catalytic performance of open cell structures versus honeycombs. J. Chem. Eng. 2015, 264, 514–521. [Google Scholar] [CrossRef]
  3. Klummp, M.; Inayat, A.; Schwerdtfeger, J.; Körner, C.; Singer, R.F.; Freund, H.; Schwieger, W. Periodic open cellular structures with ideal cubic cell geometry: Effect of porosity and cell orientation on pressure drop behavior. J. Chem. Eng. 2014, 242, 364–378. [Google Scholar] [CrossRef]
  4. Bastos Rebelo Núria, F.; Andreassen, K.A.; Suarez Ríos, L.I.; Piquero Camblor, J.C.; Zander, H.J.; Carlos Grande, A. Pressure drop and heat transfer properties of cubic iso-reticular foams. Chem. Eng. Process. 2018, 127, 36–42. [Google Scholar] [CrossRef]
  5. Kaur, I.; Singh, P. Flow and Thermal Transport Through Unit Cell Topologies of Cubic and Octahedron Families. Int. J. Heat Mass Transf. 2020, 158, 119784. [Google Scholar] [CrossRef]
  6. Bach, C.; Dimopoulos Eggenschwiler, P. Ceramic Foam Catalyst Substrates for Diesel Oxidation Catalysts: Pollutant Conversion and Operational Issues; SAE Technical Paper; SAE International: Warrendale, PA, USA, 2011. [Google Scholar]
  7. Vespertini, A.; Della Torre, A.; Montenegro, G.; Onorati, A.; Tronconi, E.; Nova, I. An appraisal of the application of open-cell foams in automotive SCR systems. E3S Web Conf. 2020, 197, 06007. [Google Scholar] [CrossRef]
  8. Papetti, V.; Dimopoulos Eggenschwiler, P.; Della Torre, A.; Lucci, F.; Ortona, A.; Montenegro, G. Additive Manufactured open cell polyhedral structures as substrates for automotive catalysts. Int. J. Heat Mass Transf. 2018, 126, 1035–1047. [Google Scholar] [CrossRef]
  9. Shayler, P.J.; Tinwell, P.R.; Dixon, J. A Development Methodology for Improving the Cold Start Performance of Spark Ignition Engines; SAE Technical Paper; SAE International: Warrendale, PA, USA, 1994. [Google Scholar]
  10. Bagheri, S.; Huang, Y.; Walker, P.D.; Zhou, J.L.; Surawski, N.C. Strategies for improving the emission performance of hybrid electric vehicles. Sci. Total Environ. 2021, 771, 144901. [Google Scholar] [CrossRef] [PubMed]
  11. Wang, Y.; Wen, Y.; Zhu, Q.; Luo, J.; Yang, Z.; Su, S.; Wang, X.; Hao, L.; Tan, J.; Yin, H.; et al. Real driving energy consumption and CO2 & pollutant emission characteristics of a parallel plug-in hybrid electric vehicle under different propulsion modes. Energy J. 2022, 244, 123076. [Google Scholar]
  12. Della Torre, A.; Barillari, L.; Montenegro, G.; Onorati, A.; Rulli, F.; Paltrinieri, S.; Rossi, V.; Pulvirenti, F. Numerical Assessment of an After-Treatment System Equipped with a Burner to Speed-Up the Light-Off during Engine Cold Start; SAE Technical Paper; SAE International: Warrendale, PA, USA, 2021. [Google Scholar]
  13. Della Torre, A.; Montenegro, G.; Onorati, A.; Cerri, T. CFD Investigation of the Impact of Electrical Heating on the Light-off of a Diesel Oxidation Catalyst; SAE Technical Paper; SAE International: Warrendale, PA, USA, 2018. [Google Scholar]
  14. Cybulski, A.; Moulijn, J.A. Monoliths in Heterogeneous Catalysis. Catal. Rev. Sci. Eng. 1994, 36, 179–270. [Google Scholar] [CrossRef]
  15. Churchill, S.W. Comprehensive Correlating Equations for Heat, Mass and Momentum Transfer in Fully Developed Flow in Smooth Tubes. Ind. Eng. Chem. 1977, 16, 109–116. [Google Scholar] [CrossRef]
  16. Montenegro, G.; Onorati, A. 1D Thermo-Fluid Dynamic Modeling of Reacting Flows inside Three-Way Catalytic Converters. SAE Int. J. Engines 2009, 2, 1444–1459. [Google Scholar] [CrossRef]
  17. Wieting, A.R. Empirical Correlations for Heat Transfer and Flow Friction Characteristics of Rectangular Offset-Fin Plate-Fin Heat Exchangers. J. Heat Transf. 1975, 97, 488–490. [Google Scholar] [CrossRef]
  18. Koltsakis, G.C.; Konstantinidis, P.A.; Stamatelos, A.M. Development and application range of mathematical models for 3-way catalytic converters. Appl. Catal. B 1997, 12, 161–191. [Google Scholar] [CrossRef]
  19. Marinoni, A.M.; Onorati, A.; Montenegro, G.; Sforza, A.; Cerri, T.; Olmeda, P.; Dreif, A. RDE cycle simulation by 0D/1D models to investigate IC engine performance and cylinder-out emissions. Int. J. Engine Res. 2022. [Google Scholar] [CrossRef]
  20. Onorati, A.; Montenegro, G. 1D and Multi-D Modeling Techniques for IC Engine Simulation, 1st ed.; SAE International: Warrendale, PA, USA, 2020. [Google Scholar]
  21. Della Torre, A.; Montenegro, G.; Onorati, A.; Paltrinieri, S.; Rulli, F.; Rossi, V. Calibration of the Oxygen Storage Reactions for the Modeling of an Automotive Three-Way Catalyst. Ind. Eng. Chem. Res. 2021, 60, 6653–6661. [Google Scholar] [CrossRef]
Figure 1. Simulation framework: multi-region approach.
Applsci 13 04017 g001
Figure 2. POCS geometrical characterization: Straight configuration: (a) Frontal section; and (b) Longitudinal clip.
Applsci 13 04017 g002
Figure 3. POCS geometrical characterization: Porosity trend with respect to the module axial coordinate.
Applsci 13 04017 g003
Figure 4. POCS geometrical characterization: visualization of the POCS module section for an increasing axial coordinate.
Applsci 13 04017 g004
Figure 5. POCS geometrical characterization: Curved configuration—fitting inside an exhaust manifold.
Applsci 13 04017 g005
Figure 6. Assessment of the emissions abatement at the cold start: exhaust line schematization.
Applsci 13 04017 g006
Figure 7. Assessment of the emissions’ abatement at the cold start: imposed exhaust gases’ temperature and mass flow rate profiles.
Applsci 13 04017 g007
Figure 8. Assessment of the POCS pressure drop: straight and curved POCS configurations.
Applsci 13 04017 g008
Figure 9. Assessment of the POCS pressure drop: Qualitative estimation of the computational grid effects. Fluid pressure field visualization. (a) mesh A-Straight; and (b) mesh C-Straight.
Applsci 13 04017 g009
Figure 10. Assessment of the POCS pressure drop: 1D performance simulation—brake power and brake specific fuel consumption: reference vs. POCS.
Applsci 13 04017 g010
Figure 11. Electrical heating sensitivity analysis: qualitative estimation of the computational grid effects. (a) Voltage distribution; and (b) temperature distribution.
Applsci 13 04017 g011
Figure 12. Electrical heating sensitivity analysis: struts’ domain average temperature profiles.
Applsci 13 04017 g012
Figure 13. Electrical heating sensitivity analysis: Struts domain maximum temperature profiles.
Applsci 13 04017 g013
Figure 14. EHC–POCS influence on the fluid temperature profile.
Applsci 13 04017 g014
Figure 15. Pollutant abatement with the activation of the EHC–POCS structure.
Applsci 13 04017 g015
Figure 16. Cold start assessment: EHC–POCS single manifold—HC concentration and temperature distributions. (a) time = 2.5 s; (b) time = 5.0 s; (c) Time = 7.5 s; (d) time = 10.0 s.
Applsci 13 04017 g016
Figure 17. Cold start assessment: CAT1 thermal transient evaluation.
Applsci 13 04017 g017
Figure 18. Cold start assessment: CAT1 temperature fields comparison—POCS vs. reference ATS: (a) time instant 3 s: half of the heating strategy; and (b) time instant 6 s: end of the heating strategy.
Applsci 13 04017 g018
Figure 19. Cold start assessment: CAT1 temperature fields comparison—simulation end-time.
Applsci 13 04017 g019
Figure 20. Cold start assessment: pollutants’ percentage abatement comparison.
Applsci 13 04017 g020
Figure 21. Cold start assessment: HC percentage abatement comparison.
Applsci 13 04017 g021
Table 1. POCS geometrical data.
Strut Diameter (mm)Radial Strut Axial Spacing (mm)Internal Pipe Diameter (mm)External Diameter (mm)
2.015.06.040.0
Table 2. Fluid computational domains details.
MeshCells NumberBase Cell Length (mm)
A-Straight 1.15 · 10 6 2.00
B-Straight 4.96 · 10 6 1.00
C-Straight 9.06 · 10 6 0.75
A-Curved 1.15 · 10 6 2.00
B-Curved 5.18 · 10 6 1.00
C-Curved 9.94 · 10 6 0.75
Table 3. Exhaust gases species concentrations: Mass fractions.
SpeciesC3H6C3H8CO2H2ON2O2COH2NO
-0.00390.00200.16350.07180.71700.03200.00820.00070.0009
Table 4. Assessment of the emissions’ abatement at the cold start: computational domain details.
RegionFluidCAT1CAT2Solid
Cells number 17.65 · 10 6 0.42 · 10 6 0.57 · 10 6 6.28 · 10 6
Table 5. Assessment of the POCS pressure drop: fluid flow Reynolds numbers.
Velocity (m/s)0.51.05.010.025.050.0
Reynolds number (-)28.4283.51417.52837.17113.414,329.9
Table 6. Assessment of the POCS pressure drop: engine performances analysis.
Brake Power Reduction (-)Total Efficiency Reduction (-)BSFC Increase (-)
14.8%8.3%9.1%
Table 7. Electrical heating sensitivity analysis: supplied electrical power.
Voltage (V)1.010.020.030.038.0
Power (W)1.2122.3489.01100.31765.3
Table 8. Tail-pipe pollutants cumulative emissions.
PollutantCONOHC
% Reduction26.925.514.6
Disclaimer/Publisher’s Note: The statements, opinions and data contained in all publications are solely those of the individual author(s) and contributor(s) and not of MDPI and/or the editor(s). MDPI and/or the editor(s) disclaim responsibility for any injury to people or property resulting from any ideas, methods, instructions or products referred to in the content.

