
The Comprehensive Reduction Capacity of Five Riparian Vegetation Buffer Strips for Primary Pollutants in Surface Runoff

1
Hubei Water Resources Research Institute, Wuhan 430070, China
2
Hubei Water Resources and Hydropower Science and Technology Information Center, Wuhan 430070, China
3
School of Environmental Studies, China University of Geosciences, Wuhan 430074, China
*
Authors to whom correspondence should be addressed.
Appl. Sci. 2023, 13(6), 3898; https://doi.org/10.3390/app13063898
Submission received: 21 February 2023
/
Revised: 16 March 2023
/
Accepted: 16 March 2023
/
Published: 19 March 2023
(This article belongs to the Special Issue Environmental Pollution: Advances in Analysis of Emerging Pollutants and Their Removal Methods)
Abstract
:Featured Application
It provided a theoretical basis for removing agricultural non-point source pollution by herbaceous riparian buffer in the Plain Lake area of Hubei Province.
Abstract
Most studies on the effects of plants on reducing pollutants in surface runoff focus on the elimination of a single pollutant by a single plant species. We take into account the fact that natural riparian herbaceous vegetation buffer strips remove multiple pollutants at the same time, and vegetation species need to be selected according to actual conditions. In an indoor simulation, processed soil samples were taken, and collected rainwater was used to prepare standard solutions for simulating surface runoff, which includes five primary water pollutants: total suspended solids (TSS), total nitrogen (TN), total phosphorus (TP), ammonia nitrogen (NH3-N), and chemical oxygen demand (COD). Pollutant concentrations were measured after the experiments. We found that the reduction capacity of vegetation buffer strips differs due to the differentiation of biological structure and growth characteristics. Dichondra repens Forst and Cynodon dactylon (Linn.) Pers had high biomass, and their vegetation was creeping on the ground with well-developed roots, showing a strong comprehensive ability to reduce pollutants. The comprehensive reduction capability of five vegetation buffer strips for pollutants is ranked as follows: Dichondra repens Forst > Cynodon dactylon (Linn.) Pers > Zoysia matrella > Festuca elata Keng ex E. Alexeev > Lolium perenne.
1. Introduction
All environmental problems are social problems [1]. Rapid social development increases the emission quantity of pollutants [2,3,4]. Nowadays, the water environment pollution of rivers and lakes has become an urgent ecological and environmental problem that needs to be solved [5,6]. Among them, non-point source pollution of agriculture is hard to control and involves a wide range due to its characteristics of dispersive, covert, random, latent, accumulated, and ambiguous [7,8,9,10]. Non-point source pollution of agriculture has been a significant source of pollution that affects water quality [11,12,13]. In China, pesticides and fertilizers in agriculture cause considerable pollution to surface waters [14]. In particular, the excessive use of nitrogen and phosphorous can contaminate water bodies by leaching and surface runoff. In agricultural non-point source pollution entering the surface water, riparian herbaceous vegetation buffer strips significantly affect elimination as an ecological link between terrestrial and aquatic ecosystems [15]. Riparian herbaceous vegetation buffer strips increase the biodiversity of ecosystems and retard sediment [16,17]. In terms of ecological functions, they protect the river water environment, maintain water quality, and improve biodiversity. Concurrently, riparian herbaceous vegetation buffer strips can significantly contribute to controlling non-point pollution by absorption, increasing dissolved oxygen, providing biological habitats, loosening soil, retarding runoff, and adjusting microclimate [18,19]. Due to these reasons, riparian herbaceous vegetation buffer strips are used to reduce non-point source pollution in water bodies [20,21,22].
In recent years, some researchers found that riparian herbaceous vegetation buffer strips can significantly reduce total nitrogen (TN), total phosphorus (TP), or other pollutants through physical, chemical, and biological actions (e.g., intercept, filter, and absorb) [23,24,25]. Further, groups of papers are devoted to the factors influencing riparian herbaceous vegetation buffer strips’ non-point source pollution reduction [24,25,26,27]. The main influencing factors are filter conditions, pollutants concentration, and vegetation configurations [28]. For instance, total suspended solids (TSS) interception and the reduction of other pollutants mainly happen at the front end of riparian herbaceous vegetation buffer strips. This is because herbaceous vegetation that grows intensively and covers the surface can retard runoff; intercept runoff pollutants; and degrade, absorb, and deposit pollutants effectively. Riparian herbaceous vegetation buffer strips can significantly block TP of surface runoff better than artificial forest land and potentially reduce NO3-N by 55–90% in outflows from the subbasin under average rainfall conditions [29,30,31]. The broad and gentle bank slope and the riparian herbaceous vegetation buffer strips have relatively better effects on the interception of pollutants [32]. However, the above studies were limited to the mechanism of single pollutant elimination by a single plant species or groups of plants or focused on qualitative analysis of the effect of buffer strips for retarding runoff and reducing pollutant concentrations. Relatively few researchers have focused on the combined reduction ability of different riparian herbaceous vegetation buffer strips for multiple pollutants [33,34].
This study intends to compare and analyze the prevention and control of non-point source pollution in surface runoff using different riparian herbaceous vegetation buffer strips. Riparian herbaceous vegetation buffer strips can simultaneously remove multiple types of water pollutants, but the actual effectiveness of their removal is greatly influenced by natural conditions. Therefore, the selection of herbaceous vegetation species in this study is based on the actual situation in the research area [35,36]. In this study, the choice of herbaceous vegetation considers the local climate, precipitation, soil, and pollutant characteristics of plain lake areas (Liangzi Lake) in Hubei Province. Moreover, the riparian herbaceous vegetation buffer strips should play a long-term role in reducing non-point source pollution; the plants with high temperature and cold resistance were selected, respectively. Based on the on-site investigation, three types of plants resistant to high temperature and drought were identified: Zoysia matrella, Cynodon dactylon (Linn.) Pers, and Dichondra repens Forst; and two types of plants preferring cold and humid environments were selected: Festuca elata Keng ex E. Alexeev and Lolium perenne. Therefore, the five riparian herbaceous vegetation buffer strips were chosen and analyzed for the reduction capacity of five primary pollutants in surface runoff. Pollutants include TSS, TN, TP, ammonia nitrogen (NH3-N), and chemical oxygen demand (COD). The results can provide a theoretical basis for plant selection in riparian herbaceous vegetation buffer strips suitable for the objective conditions of the lake area in the Hubei Plain. Therefore, the elimination effect of agricultural non-point source pollution by herbaceous riparian buffer strips in the process of ecological restoration can be brought into full play.
2. Materials and Methods
2.1. Materials
Synthetic wastewater, which was close to the conventional concentration of non-point source runoff pollutants, was used to guarantee that the experiment was close to the objective reality. A certain amount of soil particles and standard solutions of TN, TP, and NH3-N were added to collected rainwater [14,37], and its composition was TSS (149 mg/L), TN (4.44 mg/L), TP (0.67 mg/L), NH3-N (0.40 mg/L), and COD (74.2 mg/L). The above solutions were prepared manually using ammonium bicarbonate (NH4HCO3), potassium dihydrogen phosphate (KH2PO4), ammonium chloride (NH4Cl), and potassium hydrogen phthalate (C8H5O4K), all of which were of Analytical Reagent (AR; >99.7%). The pollutants concentration and measuring methods of TN, TP, and other indicators are listed in Table 1.
2.2. Methods
The riparian herbaceous vegetation buffer strips simulation box, 55 cm × 32 cm × 35 cm, with the slope’s hill was 30°. We filled the soil particles in the simulation box. The soil particles were sampled from the bank slope of the river channel entering Liangzi Lake, with plant roots, stones, and other impurities removed. After drying and grinding, the soil particles were sieved through a 2 mm mesh screen. The soil properties are shown in Table 2. The moisture content of the planting was determined according to the natural water content of the soil, which is 26%, and the seeding rate of various herbaceous vegetation types was controlled at 7.5 g/m2. After 60 days of growth, the runoff pollutants reduction experiment was carried out. The indoor simulation experimental device is shown in Figure 1.
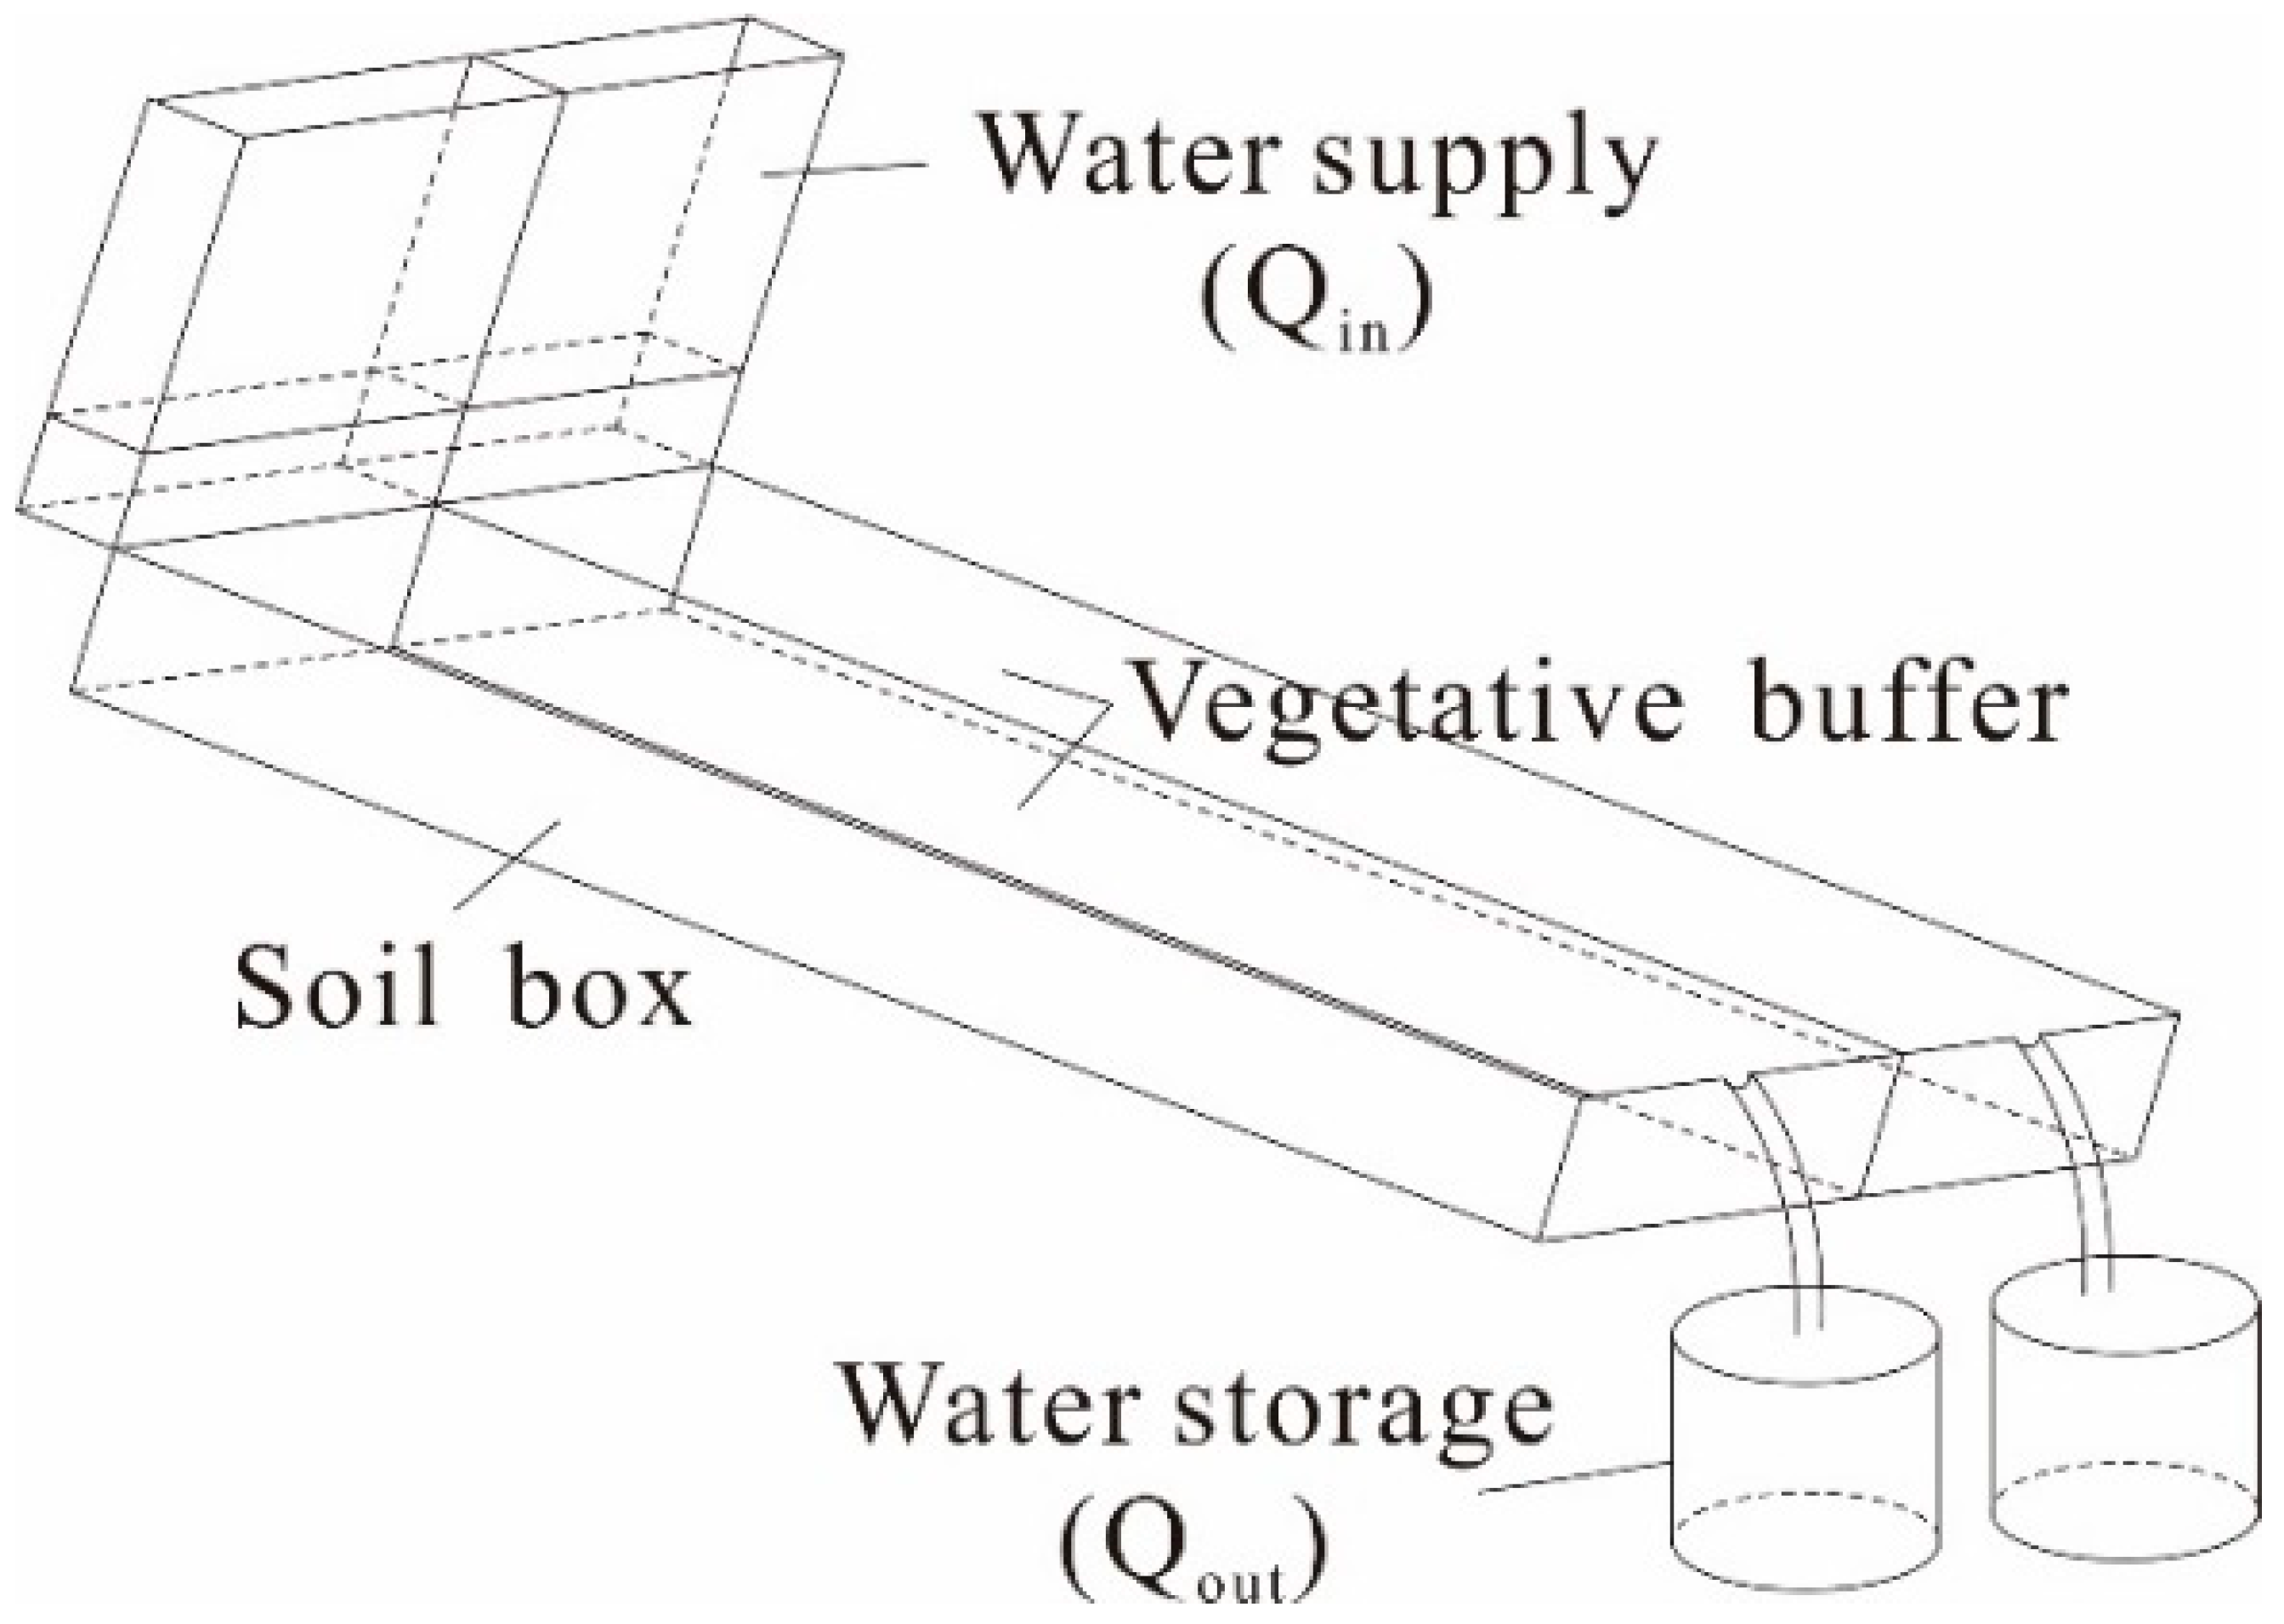
Based on summarizing the experience parameters of previous experiments, we considered that surface runoff in farmland under natural rainfall often flows slowly through riverbank riparian herbaceous vegetation buffer strips, combining factors such as herbaceous vegetation growth and container specifications. The riparian herbaceous vegetation buffer strips simulation device had a water volume of 2 L and a flow rate of 0.5 L/h. The indoor simulation test schematic diagram is shown in Figure 2. The runoff process was completed within 4 h. Timing started when the runoff flowed into the soil box, then recorded when the runoff outflowed from the bottom of the riparian herbaceous vegetation buffer strips. Porcelain plates were used to collect the runoff water. After the porcelain plate in the experimental process was washed with 1:3 diluted hydrochloric acid, it was rinsed with deionized water and dried before use.
The reduction ability (, %) of riparian herbaceous vegetation buffer strips for individual pollutants was calculated by the following Equation (1). Based on the above calculation results, the comprehensive reduction ability (R, %) of riparian herbaceous vegetation buffer strips on five pollutants was calculated by the arithmetic mean method, Equation (2) [24].
where cin is the concentration of water quality indicators in the inflow (mg/L), cout is the concentration of water quality indicators in the outflow (mg/L), Qin is the inflow water volume of the soil box (m3/d), and Qout is the outflow volume from the soil box (m3/d).
3. Results
3.1. Reduction of TSS
When the inflow concentration of TSS was 149 mg/L, the initial and after reduction volume was 2 L and 1.7 L, and the reduction effects of runoff TSS by five herbaceous vegetation and bare soil are shown in Table 3.
The results showed that riparian herbaceous vegetation buffer strips had a significant reduction effect on TSS. The concentration of TSS increased to 170 mg/L after bare soil treatment. The average concentrations of TSS in the outflow of the slope made by Cynodon dactylon (Linn.) Pers, Dichondra repens Forst, Zoysia matrella, Festuca elata Keng ex E. Alexeev and Lolium perenne were 62 mg/L, 75 mg/L, 93 mg/L, 107 mg/L, and 123 mg/L, respectively. Among them, Cynodon dactylon (Linn.) Pers had the highest interception rate of TSS, which was 64.6%. The apparent reduction of TSS was due to sedimentation, infiltration, retention, dilution, and adsorption processes in soil and litter layers, and during the process of pollutants flowing through the riparian herbaceous vegetation buffer strips in the surface runoff, the riparian herbaceous vegetation buffer strips increased the runoff resistance and reduced the water flow velocity, resulting in the deposition of most particulate matter. Cynodon dactylon (Linn.) Pers had a better intercept capacity of TSS because it has many stolons covering the entire soil surface.
3.2. Reduction of TN
When the inflow concentration of TN was 4.44 mg/L, the volume of initial and after reduction was 2 L and 1.7 L, and the reduction effects of TN by five kinds of herbaceous vegetation and bare soil are shown in Table 4.
Five riparian herbaceous vegetation buffer strips all reduced the concentration of TN in the effluent to varying degrees compared with the bare soil. The TN concentration in the outflow was in the following order: Cynodon dactylon (Linn.) Pers exhibited the highest retention rate of TN (44.5%), while the Lolium perenne exhibited the lowest retention rate (23.4%).
3.3. Reduction of NH3-N
When the inflow concentration of NH3-N was 0.4 mg/L, the volume of initial and after reduction was 2 L and 1.7 L, and the reduction effects of NH3-N by five kinds of herbaceous vegetation and bare soil are shown in Table 5.
The results showed that the concentration of NH3-N in the effluent from the five kinds of herbaceous vegetation slope had little difference, ranging from 0.30 to 0.35 mg/L, slightly lower than 0.37 mg/L in the effluent from bare soil. The main reason these riparian herbaceous vegetation buffer strips have a limited adsorption capacity of NH3-N is that ammonia nitrogen exists in the form of dissociated ammonia (NH3) and ammonium ion (NH4+) in water, which has a high solubility in water and slight adsorption on the solid surface. In addition, when the local surface runoff flow rate is high, it reduces the reaction time between pollutants and riparian herbaceous vegetation buffer strips. Therefore, the high runoff flow velocity also limited the adsorption capacity of riparian herbaceous vegetation buffer strips for NH3-N.
3.4. Reduction of TP
When the inflow concentration of TP was 0.67 mg/L, the volume of initial and after reduction was 2 L and 1.7 L, and the reduction effects of TP by five kinds of herbaceous vegetation and bare soil are shown in Table 6.
Compared with the bare soil, five kinds of plants all reduced the concentration of TP to varying degrees. The interception of TP by Dichondra repens Forst was the highest (69.6%), and TP by Lolium perenne was the lowest (36.6%). Because the runoff flow velocity was high and particulate phosphorus was the primary form of total phosphorus in the non-point source runoff, the TP retained by the ecological slope protection was primarily particulate phosphorus.
3.5. Reduction of COD
When the inflow concentration of COD was 74 mg/L, the volume of initial and after reduction was 2 L and 1.7 L, and the reduction effects of COD by five kinds of herbaceous vegetation and bare soil are shown in Table 7.
As can be seen, compared with the bare soil without herbaceous vegetation protection, the five plants reduced the concentration of COD to varying degrees. The retention of COD by Cynodon dactylon (Linn.) Pers was the highest (27.6%), and the COD retention by Lolium perenne was the lowest (18.4%).
4. Discussion
The above was an experimental study on the reduction effects for single pollutants by each herbaceous riparian buffer strip. The overall reduction capacity of multiple pollutants by each herbaceous vegetation may be more instructive to engineering practice because various pollutants exceeding the standard may coexist in the runoff. According to the above experimental results, the total removal loads of TSS, TN, TP, NH3-N, and COD per unit area were calculated on different buffer strips. Although the calculation and analysis may deviate from the actual situation, it also reflected the total reduction capacity of plants to a certain extent [37]. The reduction effects for TSS, TN, TP, NH3-N, TP, and COD by five riparian herbaceous vegetation buffer strips (i.e., Zoysia matrella, Cynodon dactylon (Linn.) Pers, Dichondra repens Forst, Festuca elata Keng ex E. Alexeev and Lolium perenne) are summarized in Table 8.
Adding the reduction rates for various pollutants by the five riparian herbaceous vegetation buffer strips and converting them into total scores according to the percentage system can be roughly regarded as the comprehensive reduction capacity. In Table 8, we can find that the vast reduction capacity follows the order: Dichondra repens Forst (45.0) > Cynodon dactylon (Linn.) Pers (44.5) > Zoysia matrella (40.4) > Festuca elata Keng ex E. Alexeev (38.2) > Lolium perenne (26.8). Cynodon dactylon (Linn.) Pers and Dichondra repens Forst exhibited the best comprehensive reduction effects on pollutants among the five riparian herbaceous vegetation buffer strips selected in this experiment because of the fastest growth of biomass. The other three herbaceous vegetation have poorer reduction ability. Meanwhile, the above five herbaceous buffer strips have better reduction ability for suspended solids, TN, and TP in the surface runoff but have lower reduction rates for NH3-N and COD.
Five riparian herbaceous vegetation buffer strips significantly reduce pollutants more than bare soil, especially in reducing TSS and TN pollutants. Taking the better-performing Cynodon dactylon (Linn.) Pers and the weaker-performing Lolium perenne as examples, Cynodon dactylon (Linn.) Pers has 21.5 times greater ability to reduce TSS than bare soil and 6.2 times greater ability to reduce TN than bare soil. In comparison, Lolium perenne has 9.9 times greater ability to reduce TSS than bare soil and 3.3 times greater ability to reduce TN than bare soil.
Based on the relevant research results, the interception effects on pollutants by ecological slope protection are affected by various factors, such as runoff, slope, and herbaceous vegetation coverage rate [18,38]. In this study, the types of pollutants and herbaceous vegetation significantly influence the reduction effect under the same runoff velocity and slope. Among the pollutants in this experiment, TP and TSS were cut off at a high rate, TN at a moderate rate, and NH3-N and COD at the lowest rate. Based on a comprehensive analysis, physical interception is the most simple and effective measure for reducing TSS solids. Significantly, the reduction rate for TSS was higher when the specific surface area of contact was large between surface runoff and specific density herbaceous vegetation [10,39,40]. Phosphorus compounds in sewage are divided into organic and inorganic phosphorus; inorganic phosphorus exists in almost all phosphate forms, most incompatible with water, and in colloid and granular forms. However, soluble phosphorus and Ca2+, Fe3+, and Al3+ ions form precipitates, and the relative mobility of phosphorus is poor [41,42]. Therefore, TP is more easily removed than TN and NH3-N. Compared with phosphorus, nitrogen is more mobile; it is not easily adsorbed or intercepted. NH3-N mainly comprises nitrate nitrogen (NO3−) in water, which is released into the air after nitrification–denitrification chemical reactions. In addition, when the surface runoff velocity is high, on the one hand, it reduces the reaction time between pollutants and riparian herbaceous vegetation buffer strips; on the other hand, it weakens the physical interception effect of riparian herbaceous vegetation buffer strips and further weakens their ability to reduce pollutants [43]. Under high runoff velocity and short time conditions, the chemical action is insufficient, and the reduction rate is low [44,45,46].
Herbaceous morphology and biomass are important factors affecting the rate of reduction. Physical adsorption is the most direct way to reduce pollutants, and herbaceous vegetation biomass and growth morphology are the main factors affecting physical adsorption efficiency. Vegetation biomass reflects the total amount of living organisms per unit area at a particular moment. Under the same herbaceous vegetation and external environment, the greater the biomass, the stronger its ability to reduce pollutants [47]. In shallow surface runoff situations, herbaceous vegetation with well-developed leaves and stems that grow close to or along the ground have a stronger ability to reduce pollutants [48]. Dichondra repens Forst is a small creeping herb with adventitious roots on nodes fixed to the ground; Cynodon dactylon (Linn.) Pers is a low, stalking ground with a firm root-spreading force, spreading widely on the ground. The above two kinds of herbaceous vegetation grow fast, prostrate on the ground, and have suitable biomass during the experiment. This is the main reason for its strong ability to reduce pollutants. Zoysia matrella is a perennial plant with slender fibrous roots, a stem height of 20 cm, dense growth, and a good cutting ability. Festuca elata Keng ex E. Alexeev has sparse or solitary stems, which can be up to 120 cm in height, and ryegrass, which has thin rhizomes and 90 cm in length, has relatively poor vegetation coverage, resulting in a general reduction in surface runoff. In addition, Lolium perenne and Festuca elata Keng ex E. Alexeev belong to the cold-loving herbaceous, and the season is usually between October and May; insufficient biological growth during the experiment is also one of the factors affecting the poor reduction of pollutants.
5. Conclusions
The main conclusions of the simulation experiments of non-point source pollutants by five riparian herbaceous vegetation buffer strips treatment were as follows.
Riparian herbaceous vegetation buffer strips have a particular ability to reduce runoff pollutants. They can most effectively slow down runoff and intercept surface runoff pollutants because of their intensive growth and high surface cover rate. However, different herbaceous riparian buffer strips have different interception effects of contaminants due to the biological structure and growth characteristics of various riparian herbaceous vegetation buffer strips. Herbaceous vegetation morphology and biomass are essential factors that affect the differences in pollutant attenuation ability among different vegetation types. Among the five riparian herbaceous vegetation buffer strips selected in this study, Cynodon dactylon (Linn.) Pers can reduce TSS, TN, COD, and Dichondra repens Forst has the best ability to reduce NH3-N and TP. In contrast, Lolium perenne has a poor ability to reduce all kinds of pollutants. The research results can provide data support for applying herbaceous vegetation buffer strips to reduce pollutants in surface runoff, thereby blocking the migration process of agricultural non-point source pollutants in plain lake areas.
Considering the coexistence of multiple pollutants in the runoff, a herbaceous riparian buffer strip is required not only to have a solid for reducing single pollutants but also to reduce various pollutants simultaneously. Therefore, the comprehensive reduction capacity is calculated in this study according to the single pollutants reduction rate. At the same time, its calculation method and practical reference still need to be further explored, and how to quantitatively analyze the impact of vegetation biomass and morphology on pollutant removal, as well as its underlying mechanisms, is worth further exploration.
Author Contributions
Conceptualization and design, Y.H. and L.G.; methodology, acquisition, and analysis of data, Y.H., L.G., H.W. and C.Z.; validation, Y.H.; writing—original draft preparation, L.G. and Y.H.; funding acquisition, Y.H. and C.M. All authors have read and agreed to the published version of the manuscript.
Funding
This study was supported by the Water Resources Key Research Project of Hubei Province, granted number HBSLKY201815.
Institutional Review Board Statement
Not applicable.
Informed Consent Statement
Not applicable.
Data Availability Statement
The data supporting this study’s findings are available on request from the corresponding author. The data are not publicly available due to privacy or ethical restrictions. Therefore, they are available from the corresponding author upon reasonable request.
Acknowledgments
The authors thanks Chengyi, Zhang for her modification of the language structure. At the same time, the authors would like to thank the five reviewers’ comments. Their opinions significantly improve the quality of this article.
Conflicts of Interest
The authors declare no conflict of interest. The funders had no role in the design of the study; in the collection and analyses of data; in the writing of the manuscript; or in the decision to publish the results.
References
- Foster, S. Diffuse Agricultural Pollution of Groundwater: Addressing Impacts in Denmark and Eastern England. Water Qual. Res. J. 2023, 58, 14–21. [Google Scholar] [CrossRef]
- Valkama, E.; Usva, K.; Saarinen, M.; Uusi-Kämppä, J. A Meta-Analysis on Nitrogen Retention by Buffer Zones. J. Environ. Qual. 2019, 48, 270–279. [Google Scholar] [CrossRef] [Green Version]
- Zhang, X.; Zhang, Y.; Shi, P.; Bi, Z.; Shan, Z.; Ren, L. The Deep Challenge of Nitrate Pollution in River Water of China. Sci. Total Environ. 2021, 770, 144674. [Google Scholar] [CrossRef]
- Shyamala, S.; Arul Manikandan, N.; Pakshirajan, K.; Tang, V.T.; Rene, E.R.; Park, H.S.; Behera, S.K. Phytoremediation of Nitrate Contaminated Water Using Ornamental Plants. J. Water Supply Res. Technol. AQUA 2019, 68, 731–743. [Google Scholar] [CrossRef]
- Palmer, M.A.; Stewart, G.A. Ecosystem Restoration Is Risky … but We Can Change That. One Earth 2020, 3, 661–664. [Google Scholar] [CrossRef]
- Gao, L.; Zhang, C.; Sun, Y.; Ma, C. Effect and Mechanism of Modification Treatment on Ammonium and Phosphate Removal by Ferric-Modified Zeolite. Environ. Technol. 2019, 40, 1959–1968. [Google Scholar] [CrossRef] [PubMed]
- Liu, X.; Zhang, X.; Zhang, M. Major Factors Influencing the Efficacy of Vegetated Buffers on Sediment Trapping: A Review and Analysis. J. Environ. Qual. 2008, 37, 1667–1674. [Google Scholar] [CrossRef]
- Latsiou, A.; Kouvarda, T.; Stefanidis, K.; Papaioannou, G.; Gritzalis, K.; Dimitriou, E. Pressures and Status of the Riparian Vegetation in Greek Rivers: Overview and Preliminary Assessment. Hydrology 2021, 8, 55. [Google Scholar] [CrossRef]
- Rojas, A. Research Repository. Bursa Malaysia 2020, 60, 315–493. [Google Scholar]
- Kaushal, S.S.; Groffman, P.M.; Band, L.E.; Elliott, E.M.; Shields, C.A.; Kendall, C. Tracking Nonpoint Source Nitrogen Pollution in Human-Impacted Watersheds. Environ. Sci. Technol. 2011, 45, 8225–8232. [Google Scholar] [CrossRef]
- Wang, S.; Pi, Y.; Jiang, Y.; Pan, H.; Wang, X.; Wang, X.; Zhou, J.; Zhu, G. Nitrate Reduction in the Reed Rhizosphere of a Riparian Zone: From Functional Genes to Activity and Contribution. Environ. Res. 2020, 180, 108867. [Google Scholar] [CrossRef]
- Cole, L.J.; Stockan, J.; Helliwell, R. Managing Riparian Buffer Strips to Optimise Ecosystem Services: A Review. Agric. Ecosyst. Environ. 2020, 296, 106891. [Google Scholar] [CrossRef]
- Chen, Z.; Liu, H.-Y.; Rao, C.; Jiang, C.; Tan, Y.C.; Yu, T.; Yu, E.J.; Wu, P. Soil Microbial Community Dynamics Indicate Disruption of Nitrogen Cycling by Pollution in Vegetation Buffer Zones. Pedobiologia 2021, 85–86, 150722. [Google Scholar] [CrossRef]
- Zongchu, H.; Xiangmin, Z.; Chunxia, Y. The Study of Nonirrigated Farmaland Nitrogen and Phosphorus Loss with Surface Runoff in ShangHai (in Chinese). Yunnan Geogr. Environ. Res. 2007, 19, 7–11. [Google Scholar]
- Jian-qiang, W.; Shen-fa, H.; Jian, W.; Li-jun, X. Pollutant Removal Efficiency of Sward Buffers to Runoff and the Correlation with Biomass. J. Lake Sci. 2008, 20, 761–765. [Google Scholar] [CrossRef] [Green Version]
- Li, Y.; Shao, X.; Sheng, Z. Field Experiments on Reducing Pollutants in Agricultural-Drained Water Using Soil-Vegetation Buffer Strips. Pol. J. Environ. Stud. 2016, 25, 195–204. [Google Scholar] [CrossRef] [PubMed]
- Schoonover, J.E.; Williard, K.W.J.; Zaczek, J.J.; Mangun, J.C.; Carver, A.D. Nutrient Attenuation in Agricultural Surface Runoff by Riparian Buffer Zones in Southern Illinois, USA. Agrofor. Syst. 2005, 64, 169–180. [Google Scholar] [CrossRef]
- Syversen, N. Effect and Design of Buffer Zones in the Nordic Climate: The Influence of Width, Amount of Surface Runoff, Seasonal Variation and Vegetation Type on Retention Efficiency for Nutrient and Particle Runoff. Ecol. Eng. 2005, 24, 483–490. [Google Scholar] [CrossRef]
- Ramião, J.P.; Carvalho-Santos, C.; Pinto, R.; Pascoal, C. Modeling the Effectiveness of Sustainable Agricultural Practices in Reducing Sediments and Nutrient Export from a River Basin. Water 2022, 14, 3962. [Google Scholar] [CrossRef]
- Hill, A.R. Groundwater Nitrate Removal in Riparian Buffer Zones: A Review of Research Progress in the Past 20 Years. Biogeochemistry 2019, 143, 347–369. [Google Scholar] [CrossRef]
- Bolo, P.; Brachet, C. Agricultural Non-Point Source Pollution. Spat. Manag. Risks 2010, 39–70. [Google Scholar] [CrossRef]
- Piniewski, M.; Marcinkowski, P.; Kardel, I.; Giełczewski, M.; Izydorczyk, K.; Fratczak, W. Spatial Quantification of Non-Point Source Pollution in a Meso-Scale Catchment for an Assessment of Buffer Zones Efficiency. Water 2015, 7, 1889–1920. [Google Scholar] [CrossRef] [Green Version]
- Hu, W.; Wang, Y.; Chu, Z. Reduction Effect of Non-Point Pollution in Erhai Lake Basin through Sward Buffer Strips. Chin. J. Environ. Eng. 2015, 9, 4138–4144. [Google Scholar]
- Huaien, L.; Yaping, Z.; Ming, C.; Qinghua, W.; Yue, L. Quantitative Calculation Methods for Vegetative Filter Strips. Chin. J. Ecol. 2006, 25, 108–112. [Google Scholar] [CrossRef]
- Oshunsanya, S.O.; Li, Y.; Yu, H. Vetiver Grass Hedgerows Significantly Reduce Nitrogen and Phosphorus Losses from Fertilized Sloping Lands. Sci. Total Environ. 2019, 661, 86–94. [Google Scholar] [CrossRef] [PubMed]
- Mayer, P.M.; Reynolds, S.K.; McCutchen, M.D.; Canfield, T.J. Meta-Analysis of Nitrogen Removal in Riparian Buffers. J. Environ. Qual. 2007, 36, 1172–1180. [Google Scholar] [CrossRef] [Green Version]
- Mancuso, G.; Bencresciuto, G.F.; Lavrnić, S.; Toscano, A. Diffuse Water Pollution from Agriculture: A Review of Nature-Based Solutions for Nitrogen Removal and Recovery. Water 2021, 13, 1893. [Google Scholar] [CrossRef]
- Lyu, C.; Li, X.; Yuan, P.; Song, Y.; Gao, H.; Liu, X.; Liu, R.; Yu, H. Nitrogen Retention Effect of Riparian Zones in Agricultural Areas: A Meta-Analysis. J. Clean. Prod. 2021, 315, 128143. [Google Scholar] [CrossRef]
- Shen-fa, H.; Jian-qiang, W.; Tang, H.; Jian, W.; Min, W. Study of Clarification for Riparian-Buffer to Non-Point Pollution. Adv. Water Sci. 2008, 19, 722–727. [Google Scholar] [CrossRef]
- Jian, W.; Min, W.; Jianqiang, W.; Zesheng, Y.; Hao, T. Optimization of Plants Community of Riparian Buffer Zones. J. Ecol. Rural Environ. 2008, 24, 42–45. [Google Scholar]
- Mao, C.Y.; Wang, Y.Q.; Ma, R.; Xia, Y.; Wang, J.; Xiang, L.J.; Zhang, S.H. Effects of Soil and Water Conservation and Water Purification by Vegetative Filter Strips. Beijing Linye Daxue Xuebao/J. Beijing For. Univ. 2017, 39, 65–74. [Google Scholar] [CrossRef]
- Petersen, R.J.; Blicher-Mathiesen, G.; Rolighed, J.; Andersen, H.E.; Kronvang, B. Three Decades of Regulation of Agricultural Nitrogen Losses: Experiences from the Danish Agricultural Monitoring Program. Sci. Total Environ. 2021, 787, 147619. [Google Scholar] [CrossRef] [PubMed]
- Aguiar, T.R.; Rasera, K.; Parron, L.M.; Brito, A.G.; Ferreira, M.T. Nutrient Removal Effectiveness by Riparian Buffer Zones in Rural Temperate Watersheds: The Impact of No-till Crops Practices. Agric. Water Manag. 2015, 149, 74–80. [Google Scholar] [CrossRef] [Green Version]
- Hopkins, I.; Gall, H.; Lin, H. Natural and Anthropogenic Controls on the Frequency of Preferential Flow Occurrence in a Wastewater Spray Irrigation Field. Agric. Water Manag. 2016, 178, 248–257. [Google Scholar] [CrossRef]
- Dlamini, J.C.; Cardenas, L.M.; Tesfamariam, E.H.; Dunn, R.M.; Loick, N.; Charteris, A.F.; Cocciaglia, L.; Vangeli, S.; Blackwell, M.S.A.; Upadhayay, H.R.; et al. Riparian Buffer Strips Influence Nitrogen Losses as Nitrous Oxide and Leached N from Upslope Permanent Pasture. Agric. Ecosyst. Environ. 2022, 336, 108031. [Google Scholar] [CrossRef]
- Gao, L.; Hu, X.; Ma, C.; Kuang, H.; Qi, H.; He, Z. Geoenvironmental Risk Evaluation of High-Efficiency Eco-Economic Zone in Weifang City, China. Nat. Hazards Rev. 2020, 21, 05020005. [Google Scholar] [CrossRef]
- Wu, J.Q.; Xiong, L.J.; Sha, C.Y. Removal of N, P from Seepage and Runoff by Different Vegetated and Slope Buffer Strips. Water Sci. Technol. 2020, 82, 351–363. [Google Scholar] [CrossRef]
- Berger, M.; Canty, S.W.J.; Tuholske, C.; Halpern, B.S. Sources and Discharge of Nitrogen Pollution from Agriculture and Wastewater in the Mesoamerican Reef Region. Ocean Coast. Manag. 2022, 227, 106269. [Google Scholar] [CrossRef]
- Dunn, R.M.; Hawkins, J.M.B.; Blackwell, M.S.A.; Zhang, Y.; Collins, A.L. Impacts of Different Vegetation in Riparian Buffer Strips on Runoff and Sediment Loss. Hydrol. Process. 2022, 36, e14733. [Google Scholar] [CrossRef]
- Gericke, A.; Nguyen, H.H.; Fischer, P.; Kail, J.; Venohr, M. Deriving a Bayesian Network to Assess the Retention Efficacy of Riparian Buffer Zones. Water 2020, 12, 617. [Google Scholar] [CrossRef] [Green Version]
- Cong, W.F.; Suriyagoda, L.D.B.; Lambers, H. Tightening the Phosphorus Cycle through Phosphorus-Efficient Crop Genotypes. Trends Plant Sci. 2020, 25, 967–975. [Google Scholar] [CrossRef] [PubMed]
- Xu, S.; Martin, N.F.; Matthews, J.W.; Arai, Y. Accumulation and Release of Organic Phosphorus (P) from Legacy P-Affected Soils to Adjacent Drainage Water. Environ. Sci. Pollut. Res. 2022, 29, 33885–33899. [Google Scholar] [CrossRef] [PubMed]
- Otto, S.; Vianello, M.; Infantino, A.; Zanin, G.; Di Guardo, A. Effect of a Full-Grown Vegetative Filter Strip on Herbicide Runoff: Maintaining of Filter Capacity over Time. Chemosphere 2008, 71, 74–82. [Google Scholar] [CrossRef]
- Usharani, K.; Keerthi, K.V. Nitrate Bioremoval by Phytotechnology Using Utricularia Aurea Collected from Eutrophic Lake of Theerthamkara, Kerala, India. Pollution 2020, 6, 149–157. [Google Scholar] [CrossRef]
- Regni, L.; Bartucca, M.L.; Pannacci, E.; Tei, F.; Del Buono, D.; Proietti, P. Phytodepuration of Nitrate Contaminated Water Using Four Different Tree Species. Plants 2021, 10, 515. [Google Scholar] [CrossRef] [PubMed]
- Almeida, A.; Ribeiro, C.; Carvalho, F.; Durao, A.; Bugajski, P.; Kurek, K.; Pochwatka, P.; Jóźwiakowski, K. Phytoremediation Potential of Vetiveria zizanioides and Oryza sativa to Nitrate and Organic Substance Removal in Vertical Flow Constructed Wetland Systems. Ecol. Eng. 2019, 138, 19–27. [Google Scholar] [CrossRef]
- Popov, V.H.; Cornish, P.S.; Sun, H. Vegetated Biofilters: The Relative Importance of Infiltration and Adsorption in Reducing Loads of Water-Soluble Herbicides in Agricultural Runoff. Agric. Ecosyst. Environ. 2006, 114, 351–359. [Google Scholar] [CrossRef]
- Abu-Zreig, M.; Rudra, R.P.; Whiteley, H.R.; Lalonde, M.N.; Kaushik, N.K. Phosphorus Removal in Vegetated Filter Strips. J. Environ. Qual. 2003, 32, 613–619. [Google Scholar] [CrossRef]
Figure 1.
The experimental simulation device: (a) Festuca elata Keng ex E. Alexeev; (b) Lolium perenne, (c) Cynodon dactylon (Linn.) Pers; (d) Zoysia matrella; (e) Dichondra repens Forst.
Figure 1.
The experimental simulation device: (a) Festuca elata Keng ex E. Alexeev; (b) Lolium perenne, (c) Cynodon dactylon (Linn.) Pers; (d) Zoysia matrella; (e) Dichondra repens Forst.

Figure 2.
Schematic simulation of the indoor experimental device.


Table 1.
The pollutants concentration and measuring method (mg/L).
| Monitored Indices | Collected Rainwater | Standard Solutions | Measuring Method | Instrument Type |
|---|---|---|---|---|
| TSS | 4 | 149 | GB 11901-89 | |
| TN | 1.4 | 4.44 | HJ 636-2012 | Shimadzu UV2550 spectrophotometer |
| NH3-N | 0.38 | 0.40 | HJ 535-2009 | Shimadzu UV2550 spectrophotometer |
| TP | 0.01 | 0.67 | GB/T 11893-1989 | Shimadzu UV2550 spectrophotometer |
| COD | 6 | 74.2 | HJ/T 399-2007 | Hach DR2800 |
Table 2.
The characteristics of soil particles.
| pH | Cation Exchange Capacity (cmol/kg) | Organic Carbon (%) | Particle Proportion | Clay Minerals | ||||
|---|---|---|---|---|---|---|---|---|
| Sand (%) | Silt (%) | Clay (%) | Vermiculite (%) | Illite (%) | Kaolinite (%) | |||
| 7.0 | 11.8 | 0.95 | 10.0 | 64.6 | 25.4 | 6.0 | 74.0 | 20.0 |
Table 3.
The comparison reduction capacity of five herbaceous vegetation buffer strips on TSS.
| Plant Species | Concentration (mg/L) | Rate (%) |
|---|---|---|
| Cynodon dactylon (Linn.) Pers | 62 | 64.6 |
| Dichondra repens Forst | 75 | 57.2 |
| Zoysia matrella | 93 | 46.9 |
| Festuca elata Keng ex E. Alexeev | 107 | 39.0 |
| Lolium perenne | 123 | 29.8 |
| bare soil | 170 | 3.0 |
Table 4.
The comparison reduction capacity of five herbaceous vegetation buffer strips on TN.
| Plant Species | Concentration (mg/L) | Rate (%) |
|---|---|---|
| Cynodon dactylon (Linn.) Pers | 2.9 | 44.5 |
| Dichondra repens Forst | 3.3 | 36.8 |
| Zoysia matrella | 3.5 | 33.0 |
| Festuca elata Keng ex E. Alexeev | 3.7 | 29.2 |
| Lolium perenne | 4.0 | 23.4 |
| bare soil | 4.85 | 7.2 |
Table 5.
The comparison reduction capacity of five herbaceous vegetation buffer strips on NH3-N.
| Plant Species | Concentration (mg/L) | Rate (%) |
|---|---|---|
| Cynodon dactylon (Linn.) Pers | 0.34 | 27.8 |
| Dichondra repens Forst | 0.30 | 36.3 |
| Zoysia matrella | 0.32 | 32.0 |
| Festuca elata Keng ex E. Alexeev | 0.32 | 32.0 |
| Lolium perenne | 0.35 | 25.6 |
| bare soil | 0.37 | 21.4 |
Table 6.
The comparison reduction capacity of five herbaceous vegetation buffer strips on TP.
| Plant Species | Concentration (mg/L) | Rate (%) |
|---|---|---|
| Cynodon dactylon (Linn.) Pers | 0.33 | 58.1 |
| Dichondra repens Forst | 0.24 | 69.6 |
| Zoysia matrella | 0.27 | 65.7 |
| Festuca elata Keng ex E. Alexeev | 0.27 | 65.7 |
| Lolium perenne | 0.50 | 36.6 |
| bare soil | 0.63 | 20.1 |
Table 7.
The comparison reduction capacity of five herbaceous vegetation buffer strips on COD.
| Plant Species | Concentration (mg/L) | Rate (%) |
|---|---|---|
| Cynodon dactylon (Linn.) Pers | 63.0 | 27.6 |
| Dichondra repens Forst | 65.0 | 25.3 |
| Zoysia matrella | 66.0 | 24.2 |
| Festuca elata Keng ex E. Alexeev | 65.0 | 25.3 |
| Lolium perenne | 71.0 | 18.4 |
| bare soil | 73.0 | 16.1 |
Table 8.
The comprehensive reduction capacity of five herbaceous vegetation buffer strips.
| Plant Species | Rate of TSS (%) | Rate of TN (%) | Rate of NH3-N (%) | Rate of TP (%) | Rate of COD (%) | Synthesis Score |
|---|---|---|---|---|---|---|
| Cynodon dactylon (Linn.) Pers | 64.6 | 44.5 | 27.8 | 58.1 | 27.6 | 44.5 |
| Dichondra repens Forst | 57.2 | 36.8 | 36.3 | 69.6 | 25.3 | 45.0 |
| Zoysia matrella | 46.9 | 33.0 | 32.0 | 65.7 | 24.2 | 40.4 |
| Festuca elata Keng ex E. Alexeev | 39.0 | 29.2 | 32.0 | 65.7 | 25.3 | 38.2 |
| Lolium perenne | 29.8 | 23.4 | 25.6 | 36.6 | 18.4 | 26.8 |
| bare soil | 3.0 | 7.2 | 21.4 | 20.1 | 16.1 | 13.6 |
Disclaimer/Publisher’s Note: The statements, opinions and data contained in all publications are solely those of the individual author(s) and contributor(s) and not of MDPI and/or the editor(s). MDPI and/or the editor(s) disclaim responsibility for any injury to people or property resulting from any ideas, methods, instructions or products referred to in the content. |
© 2023 by the authors. Licensee MDPI, Basel, Switzerland. This article is an open access article distributed under the terms and conditions of the Creative Commons Attribution (CC BY) license (https://creativecommons.org/licenses/by/4.0/).
Share and Cite
MDPI and ACS Style
Hu, Y.; Gao, L.; Ma, C.; Wang, H.; Zhou, C. The Comprehensive Reduction Capacity of Five Riparian Vegetation Buffer Strips for Primary Pollutants in Surface Runoff. Appl. Sci. 2023, 13, 3898. https://doi.org/10.3390/app13063898
AMA Style
Hu Y, Gao L, Ma C, Wang H, Zhou C. The Comprehensive Reduction Capacity of Five Riparian Vegetation Buffer Strips for Primary Pollutants in Surface Runoff. Applied Sciences. 2023; 13(6):3898. https://doi.org/10.3390/app13063898
Chicago/Turabian StyleHu, Yanxin, Lin Gao, Chuanming Ma, Hao Wang, and Chi Zhou. 2023. "The Comprehensive Reduction Capacity of Five Riparian Vegetation Buffer Strips for Primary Pollutants in Surface Runoff" Applied Sciences 13, no. 6: 3898. https://doi.org/10.3390/app13063898
Note that from the first issue of 2016, this journal uses article numbers instead of page numbers. See further details here.