

A Study on Aerodynamic and Structural Design of Fairing Using Glass Fabric Composite Structure

Department of Mechanical Engineering, Kunsan National University, 558 Daehak-ro, Miryong-dong, Gunsan 54150, Republic of Korea
*
Author to whom correspondence should be addressed.
Appl. Sci. 2023, 13(6), 3765; https://doi.org/10.3390/app13063765
Submission received: 17 February 2023
/
Revised: 13 March 2023
/
Accepted: 14 March 2023
/
Published: 15 March 2023
(This article belongs to the Topic Composites in Aerospace and Mechanical Engineering)
Abstract
:In this work, the aerodynamic and structural design of the fairing for vehicles was carried out. The Rankine half body theory, which is one of the theories being used for the aircraft gas turbine engine inlets and turboprop nose cones was adopted for aerodynamic design. The glass fabric composite materials were adopted for the structural design. The structural design was performed by analyzing aerodynamic design loads. Structural analysis was performed based on the structural design results to investigate structural safety. The structural design results were manufactured by applying the resin transfer molding method. The newly designed fairing was reviewed for its mounting possibility with the existing vehicle. The final design results were confirmed to be safe.
1. Introduction
The commercial vehicle is a term referring to ones used for business use. It is an important means of freight transportation by land, which is widely used throughout the world, as well as within the country. In Korea, commercial vehicles of more than about 155,000 are registered and operated as of 2019. It could be confirmed that the increase rate of commercial vehicle registration reaches 6% compared with the previous year.
In modern land logistics transport, commercial vehicles are very important transport means, but the increase in commercial vehicles using internal combustion engines exacerbated the problem of NOx and carbon dioxide. As COVID-19 spread seriously across the world from the beginning of 2020, the proportion of indirect transactions, such as online, grew bigger than direct ones. Therefore, logistics transport increased significantly compared to before. Since most Korean vehicles depend on imported oil energy, this increase in logistics transport led to an increase in import costs of oil energy. Accordingly, the fuel efficiency of commercial vehicles is very important in economic terms of commercial vehicle operation. If the fuel efficiency is improved through this study, it could contribute to the improvement of commercial vehicle operating costs and environmental problems. In this study, the design was performed by applying the aircraft drag reduction technique to commercial vehicles.
The fuel efficiency of vehicles is influenced not only by the drive unit but also by the drag of the external shape. Commercial vehicles structurally have a container on the rear side. With freight loaded, they cannot avoid aerodynamic resistance in the vehicle driving direction. For increasing the fuel efficiency by improving this drag, a diversity of technologies was studied, such as cab roof fairing (CRF), boat tail, side skirt, and gap fairing.
In the previous research work, C. Kim et al. performed the study on the aerodynamic effect of a roof fairing system of a heavy-duty truck [1]. Richard M. Wood verified 15% or more reduction of drag coefficient by equipping a tractor trailer with gap fairing and boat tail [2]. Pereira et al. confirmed the fuel efficiency was improved as 2.9% by installing CRF on a tractor trailer [3]. To study the effect of the truck on air resistance, A. Gilhaus considered the shape parameter of the driver cab together with truck arrangement and height to verify reduction of drag [4].
In Korea, Cheolho Kim confirmed the effect of 13.5% drag reduction by equipping a tractor trailer with CRF [5]. Jeongjae Kim et al. verified the effect of 19.5% drag reduction for the case of equipping a commercial vehicle with bio-inspired CRF [6]. Uijae Lee et al. confirmed the effect of up to 36.8% drag reduction by equipping a commercial vehicle with CRF, side skirt, and boat tail together [7]. Haecheon Choi et al. checked vortexes from the side edge of inclined surfaces, large-scale separation from the upper surface, gap and underbody flow, etc., through the fluid flow at various positions for tractor trailers [8].
To check structural safety in terms of structure, it should be checked under not the normal driving condition, but the worst one. For commercial vehicles equipped with CRF, therefore, the gust and overspeed conditions when driving should be considered to check structural safety of the fairing. As a result of analyzing the trend of domestic and oversea studies, it was analyzed that studies on overall structural safety of the fairing were partially performed, but ones on lightening compared to the existing structure were insufficient.
In the case of foreign countries, Libove. C verified weight lightening and stiffness through variable thickness sandwich structures [9]. In Korea, Cheolmin Park et al. performed the optimum design of shapes for sandwich structures by introducing the analysis method of the beam and plate theories, and confirmed higher stiffness and weight lightening [10]. For small and medium-sized commercial vehicles being used for domestic logistics distribution, CRF is installed on the front of them to use. This reduces most of the air resistance by controlling air resistance due to flow separation occurring on the front of the vehicles. In this study, therefore, the drag coefficient values effected on commercial vehicles were analyzed through the shape change in CRF to derive appropriate drag coefficients. In aerodynamic design, the result of fairing design depending on respective design variables was reviewed enough through the analysis of various design variables. The design variables were reviewed, and then they were optimized to be suited to the purpose of use. For the result of aerodynamic design, ANSYS FLUENT 2020R2, a commercial program, was used to perform the aerodynamic analysis. In addition, load conditions were defined to perform structural design based on the aerodynamic load derived under the most dangerous condition. Various composite lamination methods were analyzed to study the manufacturing method. The final lightweight composite fairing was designed. The design result was verified through structural analysis.
2. Requirement of Design
2.1. Target of Design
As a result of checking studies on drag reduction for vehicles operated in Korea, the studies were performed mostly for cars and vans used for personal purposes. It is considered to be different because for commercial vehicles centered on performance, such as freight transport capacity, their size and external shape are almost standardized, while vehicles for personal purpose have various sizes and shapes. As mentioned above, commercial vehicles are standardized according to their transport capacity, and mostly delivery service and food resource circulation uses small and medium-sized ones (1–3.5 ton), and the vehicles transporting construction machinery consist of large ones (5–20 ton). In Korea, COVID-19 and the spread of digital culture led to the increase in indirect transactions, which are purchase online, rather than direct ones, in which people go to the market and purchase things. Accordingly, transport companies are directly building and operating delivery transport systems (HUB), etc., to increase transport efficiency. There was a significant rise in the use of small and medium-sized commercial vehicles that are relatively efficient to operate in the city by such a delivery transport system.
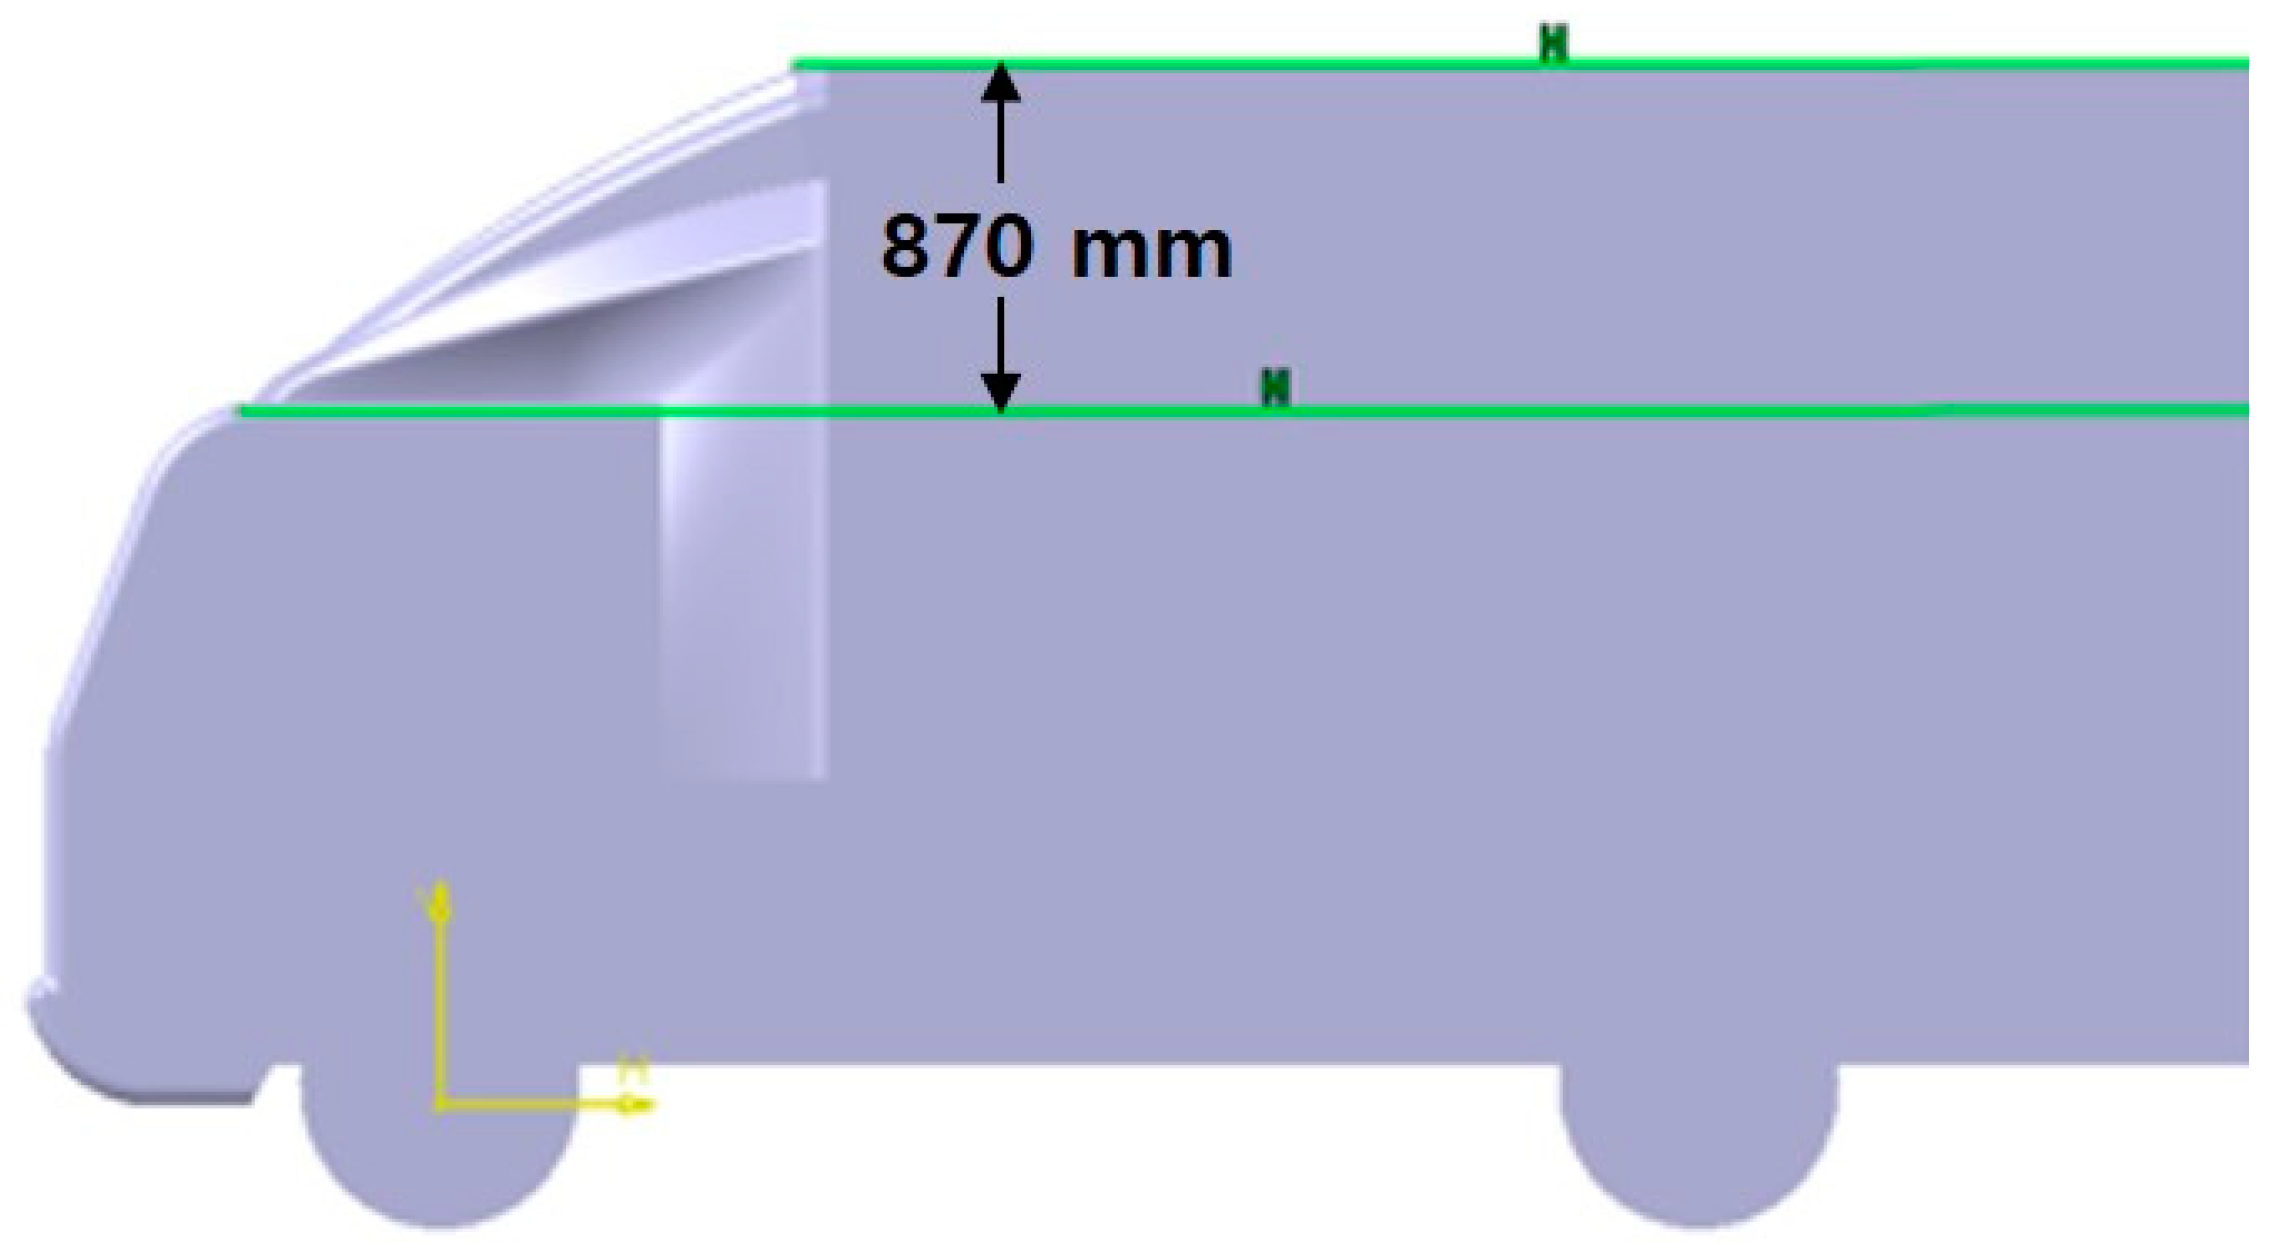
This study was carried out for 3.5-ton class commercial vehicles among small and medium-sized ones. To perform actual design and analysis on 3.5-ton class commercial vehicles selected for the study target, 6.6 freezer mighty from the Korean ‘H’ company in Seoul, Republic of Korea was selected for the detailed application model. Table 1 shows the specification of the vehicle to be applied to the study [11]. Figure 1 shows a 3D view of the conceptual aerodynamic configuration.
This study carried out design and analysis on the optimum fairing, which could reduce the drag of commercial vehicles. The requirement for this is as shown in Table 2. As a result of reviewing studies on the fairing performed until the present in Korea, it was confirmed that the drag reduction effect of the fairing was about 15–19%. Therefore, this study set up a goal that the effect of fairing becomes 19% or more, which is the highest level in Korea. The size of the fairing is restricted in length and width by the target vehicle’s cab roof size and in height by the space between the loading container top and the cab roof.
In aerodynamic design, 80 km/h, the normal fuel efficiency driving speed on the highway, was applied to the vehicle speed in design and analysis for the optimum performance. In the structural design, for the vehicle speed in design and analysis, the highest driving speed and gust condition as in Table 3 were considered together to perform the analysis. The highest driving speed of commercial vehicles equipped with the fairing was set as 130 km/h. As a result of inquiring the national weather service, it was defined as a gust when the maximum instantaneous wind speed was 10 m/s or more, and this study used 72 km/h (20 m/s). This was because of considering that a tropical depression with wind speed of more than 17 m/s is defined as a typhoon [12].
2.2. Design and Analysis Procedure
The length, height, and width of CRF are restricted by the cab roof size, and the aerodynamic shape of CRF was designed through the Rankine half body theory. The performance of the shape designed was examined through aerodynamic analysis, and then the design result was improved and determined. In this study, the fairing, which is a curved line, was assumed as a flat plate to perform structural design for convenience of design. The structural design result of the fairing assumed as a flat plate was compared with the structural analysis result of that to secure the reliability of design procedures. The structural shape, which was assumed as a flat plate to design, and the lamination method, were applied to the actual curved plate, which was the aerodynamic design result, and structural analysis for two load cases was performed to verify the final structural safety. The structural design of the fairing was carried out by using the uniform thickness composite lamination method, variable thickness composite lamination method, uniform thickness sandwich structure method, and variable thickness sandwich structure method I/II, and the design result with structural safety was secured and the weight requirement satisfied was decided as the final design.
3. Aerodynamic Design and Analysis
3.1. Rankine Half Body Theory
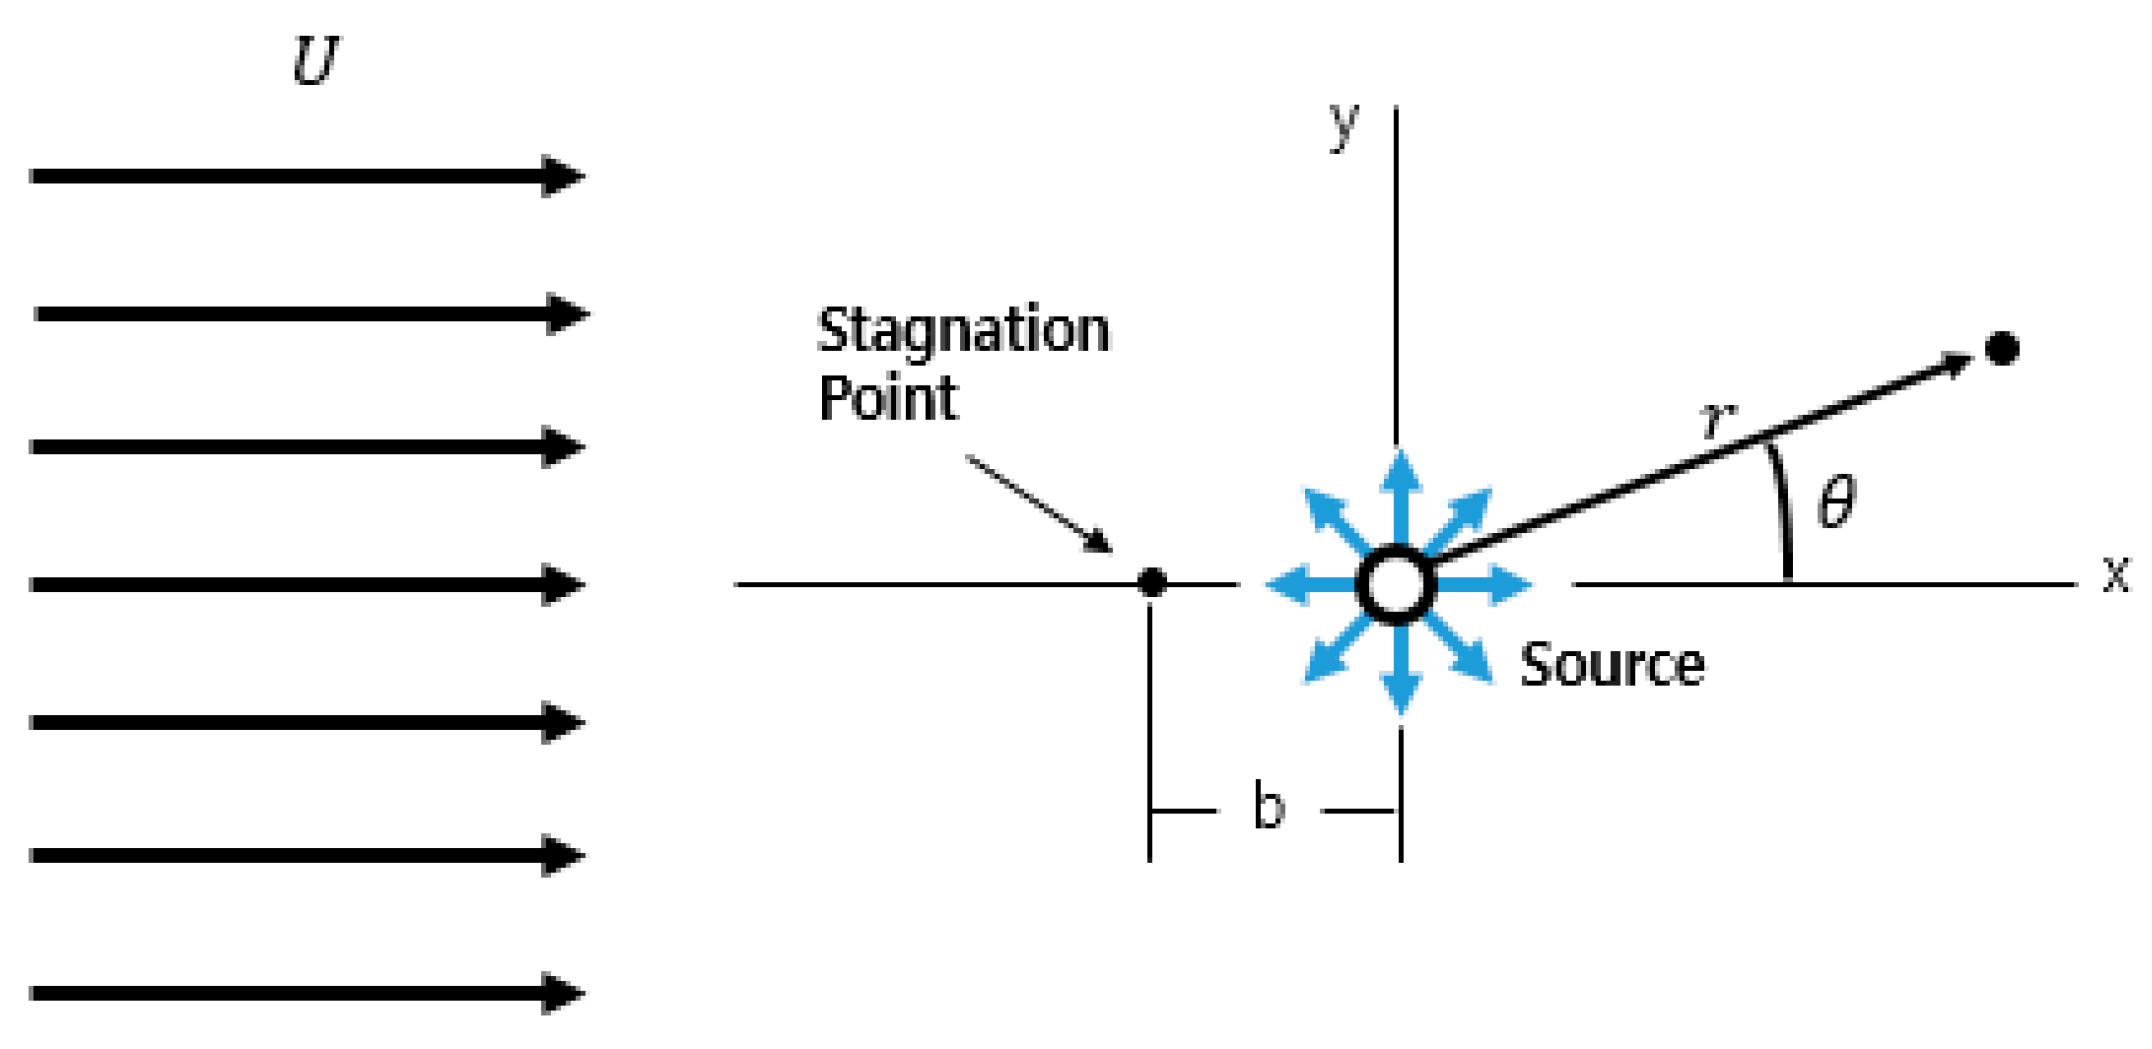
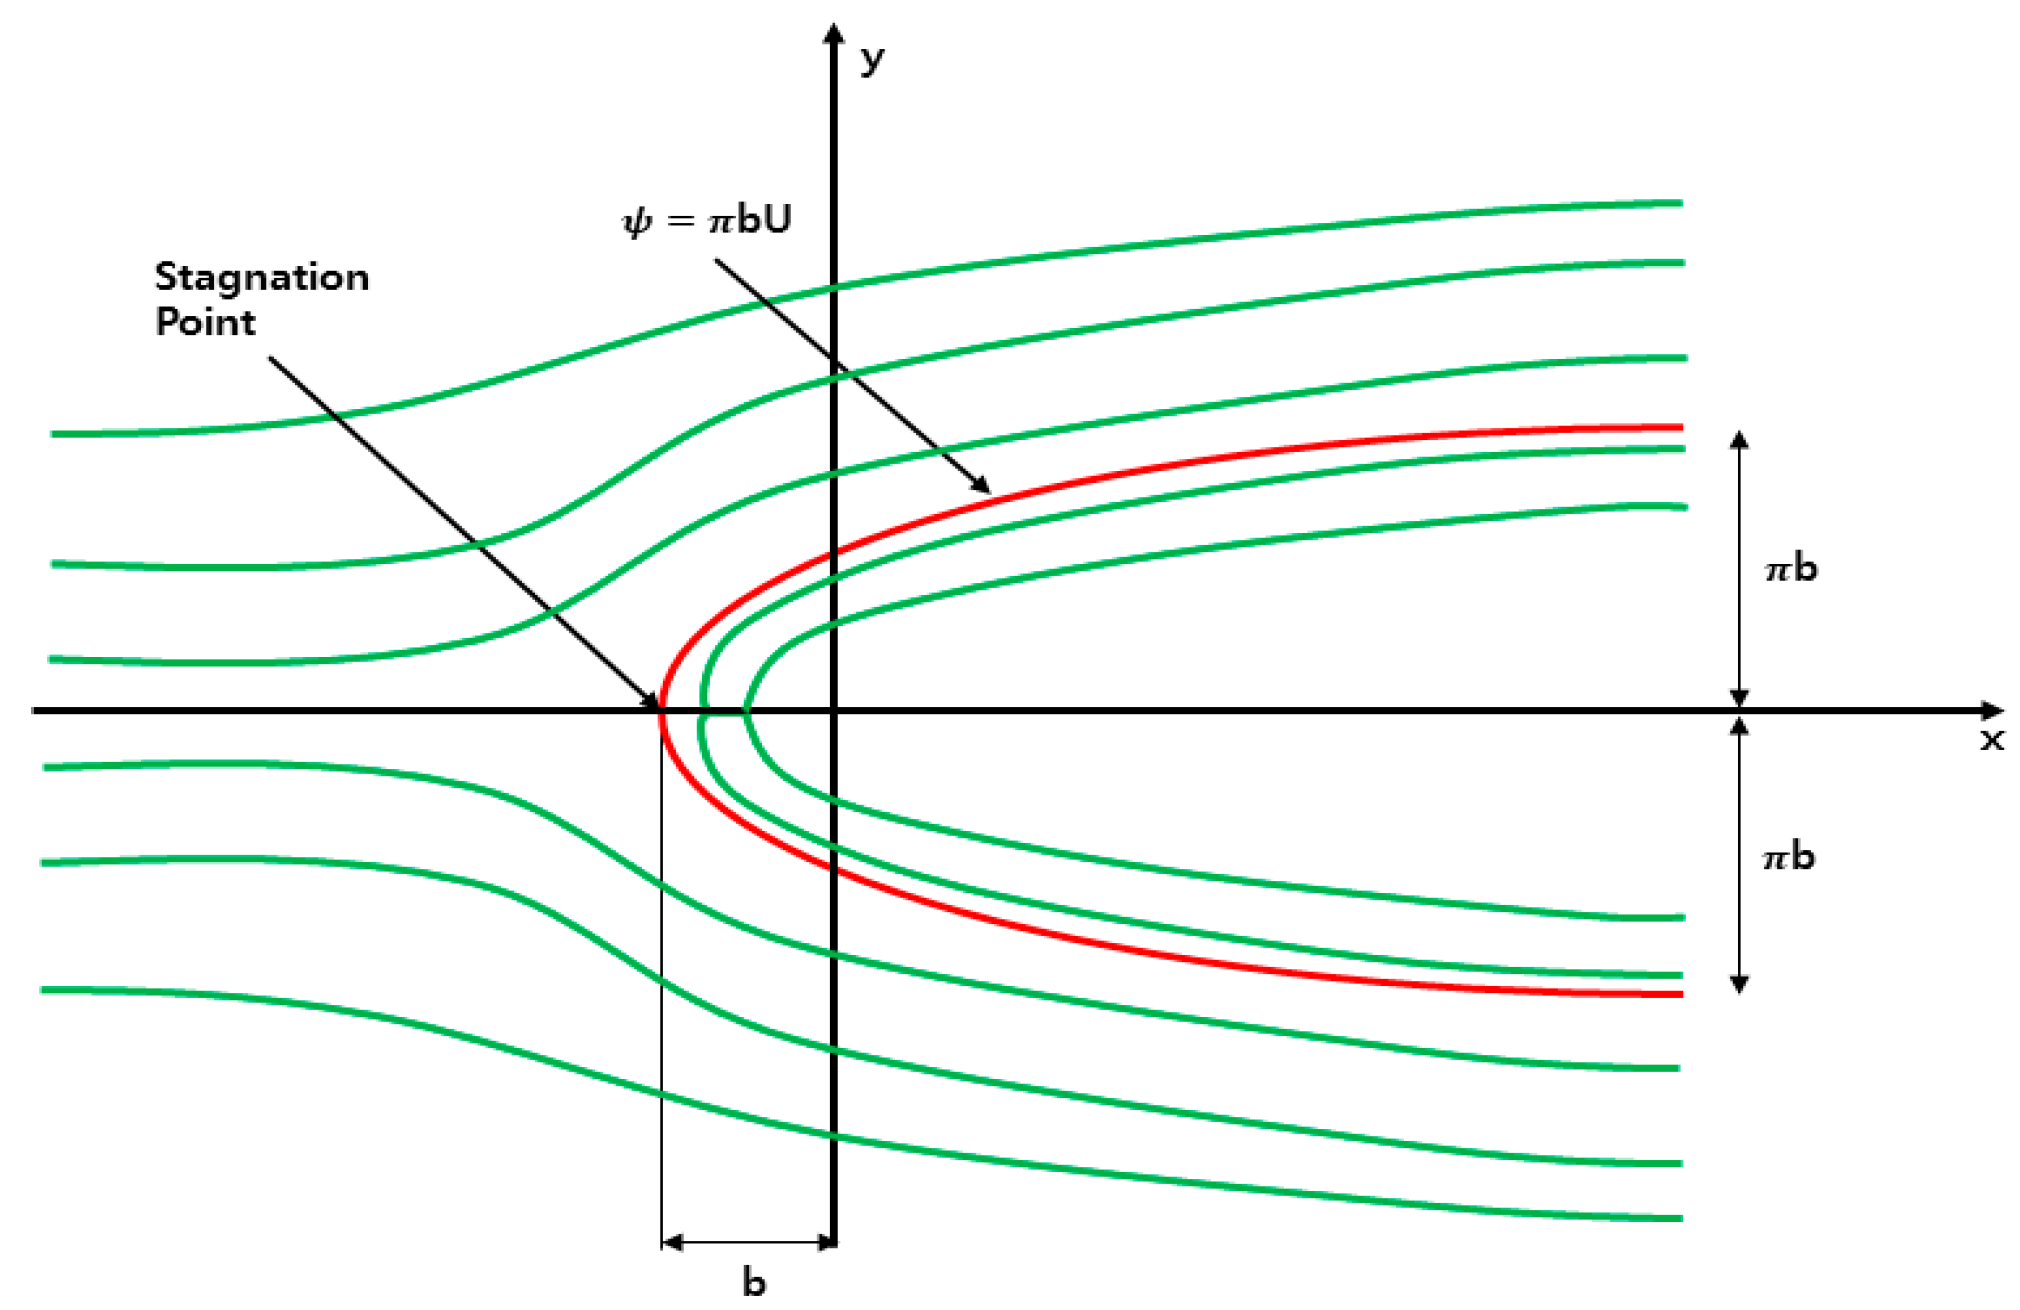
The core of aerodynamic design for the fairing in this study is to reduce the whole drag of commercial vehicles when installing the fairing. As a result of reviewing studies, there were various aerodynamic design theories for the fairing, such as circular, elliptic, hyper-elliptic, and bio-mimic types. In this study, unlike the existing studies, the Rankine half body theory, which is one of the theories being used for the aircraft gas turbine engine inlet and turboprop nose cone, was grafted onto the fairing shape design to perform aerodynamic design. The Rankine half body theory is a feature of fluid flow, in which uniform flow and a source fluid occurring at the origin are added to form the Rankine half body flow. Figure 2 means superposition of source flow and uniform flow, and Figure 3 shows the flow of the Rankine half body [13].
The core of aerodynamic design for the fairing in this study is to reduce the whole drag of commercial vehicles when installing the fairing. As a result of reviewing studies, there were various aerodynamic design theories for the fairing, such as circular, elliptic, hyper-elliptic, and bio-mimic types. In this study, unlike the existing studies, the Rankine half body theory, which is one of the theories being used for the aircraft gas turbine engine inlet and turboprop nose cone, was grafted onto the fairing shape design to perform aerodynamic design. The Rankine half body theory is a feature of fluid flow, in which uniform flow and a source fluid that occurred at the origin are added to form the Rankine half body flow. Figure 2 shows superposition of source flow and uniform flow, and Figure 3 shows flow of Rankine half body [13].
The aerodynamic design was performed considering the flow function of the result by superposition of uniform flow and source. The superposition is shown in Equation (1).
where is the flow function, and is the velocity.
The source and uniform flow are offset of each other to form a stagnation point where the velocity becomes zero. Equation (2) is the value when considering the source flow only.
The value of flow function at the stagnation point is and it is used to find at so if converting into an equation about , it is obtained as the following Equation (3):
Equation (4) is a Cartesian velocity vector, which is a value partial differentiated with respect to . Equation (5) is a Cartesian velocity vector, which is a value partial differentiated with respect to . In Equation (6), is a velocity value used in the Bernoulli equation.
where is a velocity value used in the Bernoulli equation. Equation (7) above is the Bernoulli equation, and the pressure difference could be found through the value obtained from Equations (1) to (5). is the initial velocity. The point where it has the maxim velocity in the half body is one where becomes . At this point, . The lowest velocity and the maximum pressure occur at the ellipse’s nose, which is the stagnation point. The Rankine half body shape has the maximum dynamic pressure at a point that the velocity is the maximum, and at that point, the voltage has the minimum value. Therefore, the effect of the drag coefficient reduction becomes larger. Accordingly, this study grafted onto the fairing design through the Rankine half body shape.
3.2. Aerodynamic Design
The aerodynamic design of the fairing in this study is to determine a Rankine half body shape and the height, length, and width of a fairing that satisfies drag reduction.
In the equation above, is the length of the fairing (mm), is the distance from the origin to the maximum height in the fairing shape. The length from the ellipse’s nose to the origin is .
where y is the height of the fairing (mm). Applying Equations (8) and (9) to determine a shape, the Rankine half body shape is obtained.
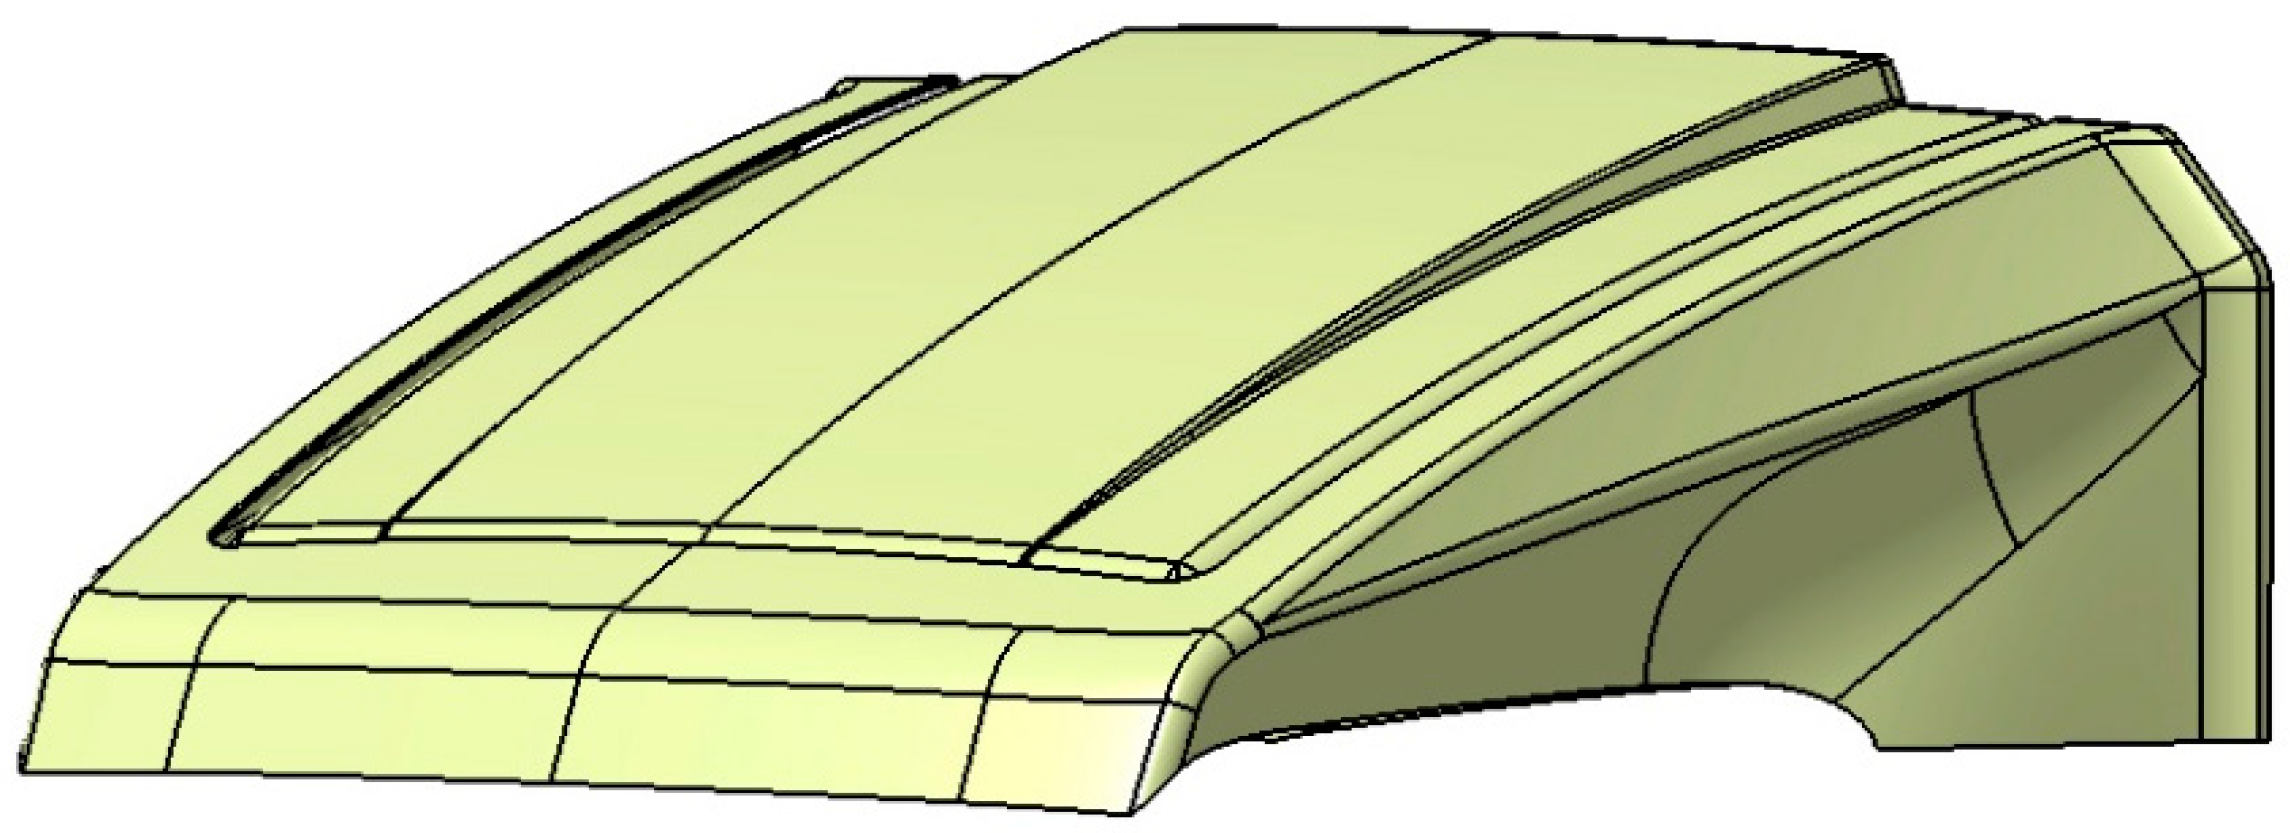
To evaluate the performance of the fairing designed, the target commercial vehicle’s principal dimensions were referred to carry out 3D modelling. The modelling combined with the 2D fairing shape, which applies the Rankine half body to the basic shape modelling of commercial vehicles. Figure 4 shows the 3D modelling result for CFD analysis.
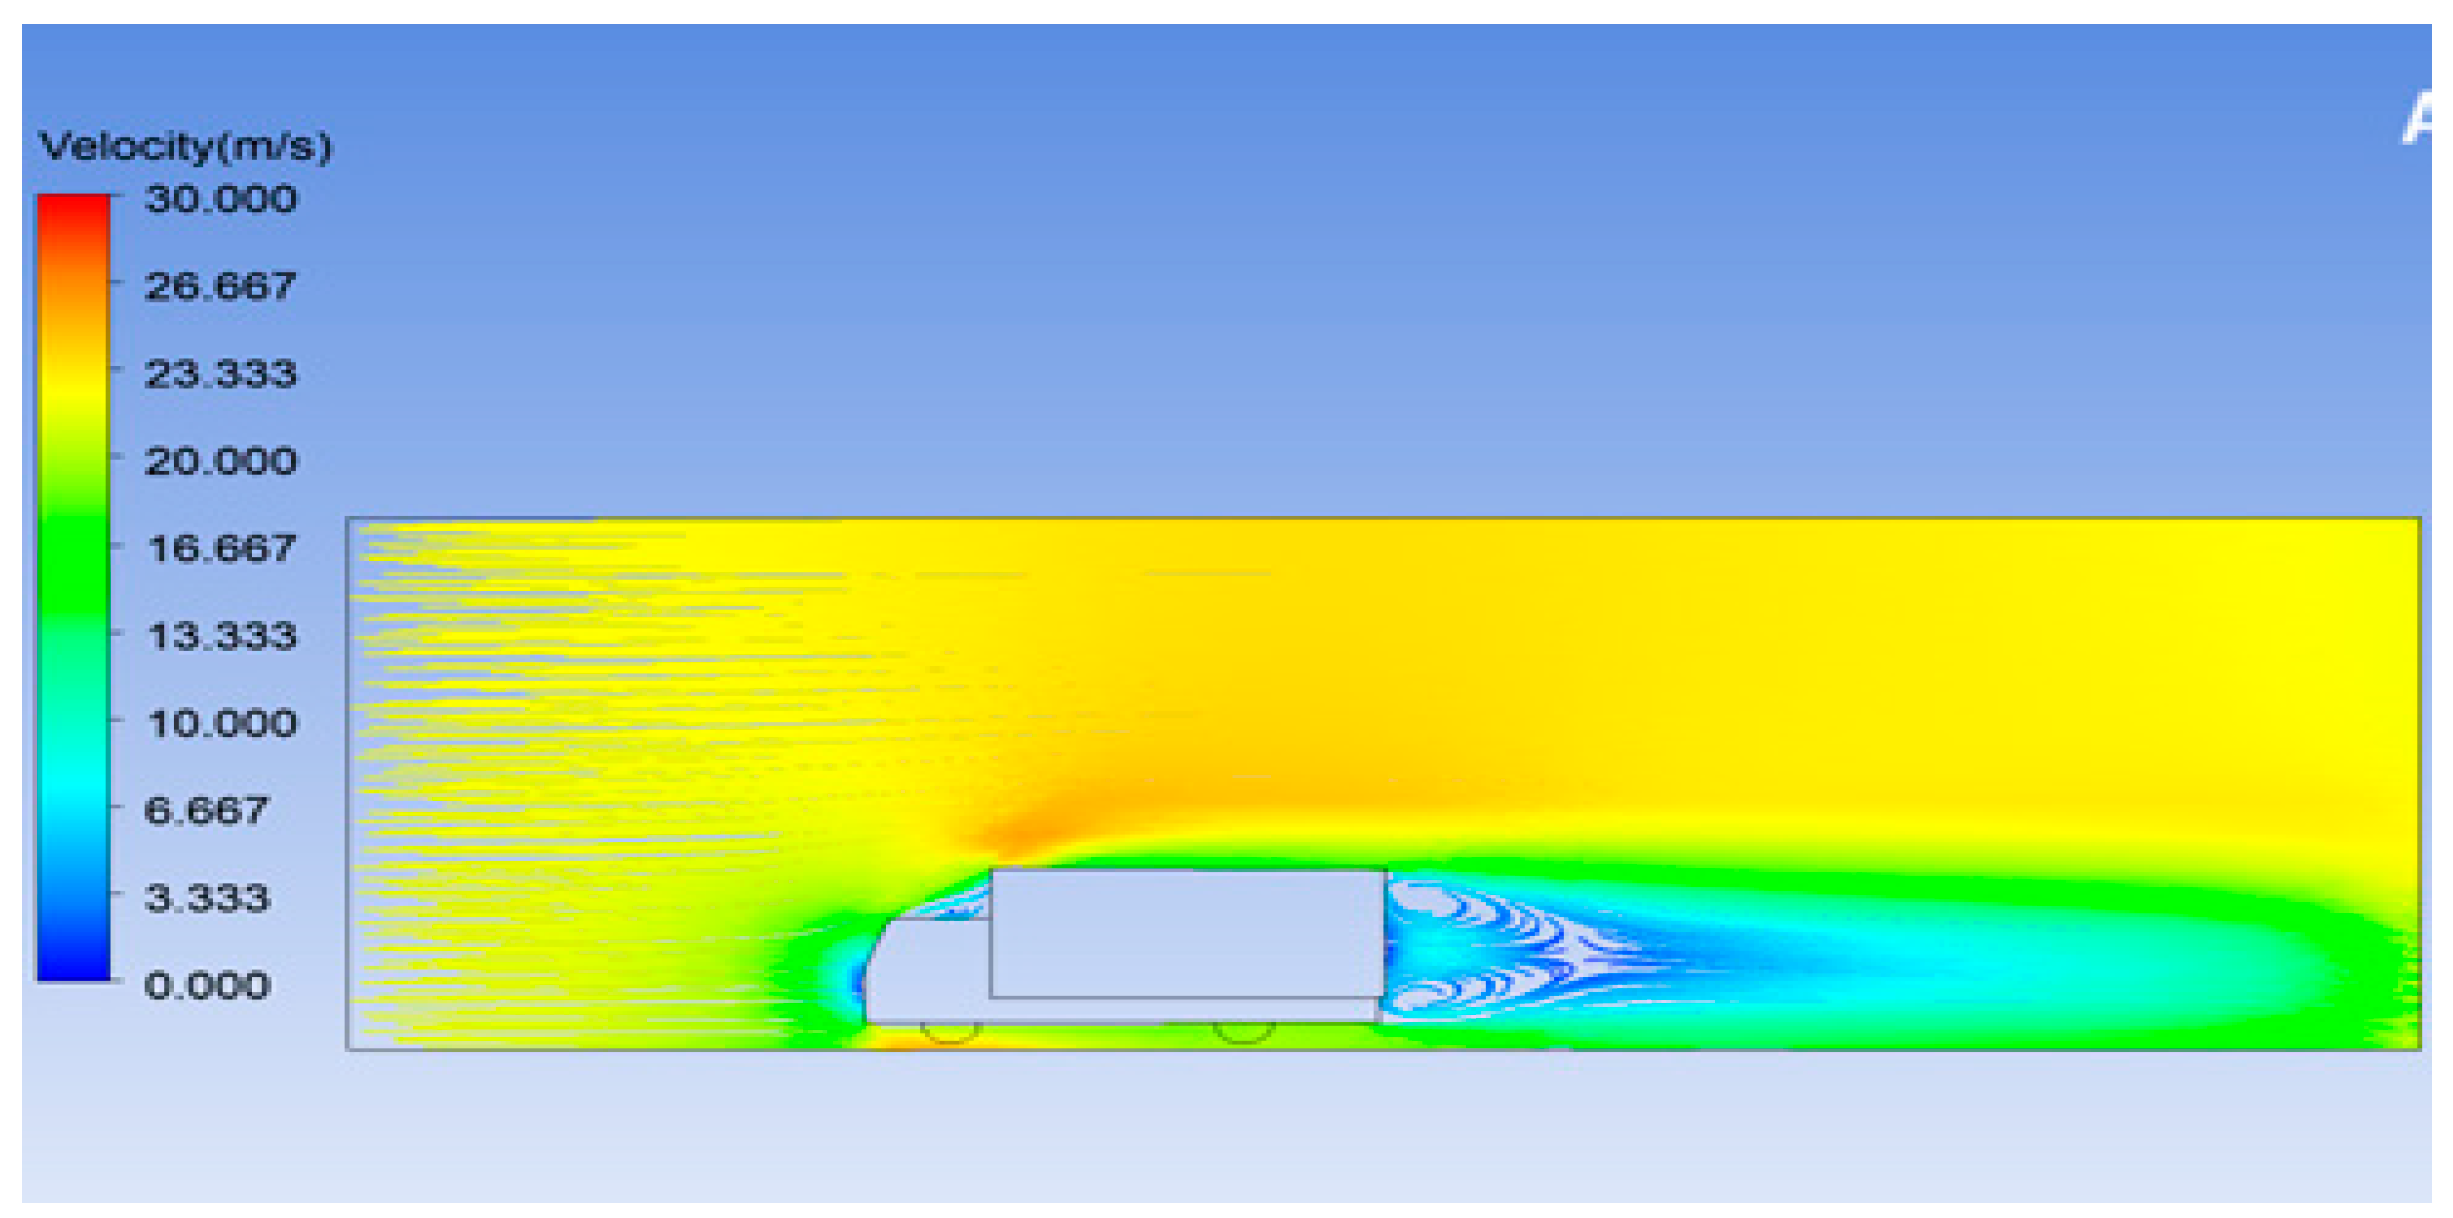
Prior to the 3D design, a flow analysis on the truck shape was performed to check characteristics of the flow separation that occurred on the front of commercial vehicles. As a result of the analysis, it was verified that the pressure distribution was higher on the top corner. On the contrary, it could be verified there was no difference in pressure distribution between the container’s side and the surrounding environments. This is because flow separation was occurring on the front of commercial vehicles. Figure 5 shows the shape that flow separation occurs on the top. This study predicted flow directions on the front of commercial vehicles through analyses, and carried out 3D aerodynamic designs for the fairing. Figure 6 is the aerodynamic design result of the final 3D fairing designed by considering the fluid flow.
3.3. Evaluation of Aerodynamic Performance
The drag coefficients are obtained as Equation (10) below after measuring drag values through a wind tunnel test [13].
In this work, since there was no wind tunnel test, Reynold’s numbers were found to evaluate drag coefficients of the commercial vehicle equipped with the fairing, and the drag coefficients by the Reynold’s number and shape were investigated.
The above equation is the equation of Reynold’s number. The is air density. The is velocity. The is the value of full length, width, and height, which is a characteristic length of commercial vehicles. The is viscosity coefficients of air, respectively. The value of is 1.184 kg/m3, is 80 km/h, which is the average speed when commercial vehicles are driving on the highway. The is 1.85 × 10⁻⁵ N·s/m2. It could be verified that the characteristic of drag coefficients for commercial vehicles in this study is between a flat plate and a circle. Therefore, the drag coefficient of commercial vehicles is expected to be about 0.5–0.7.
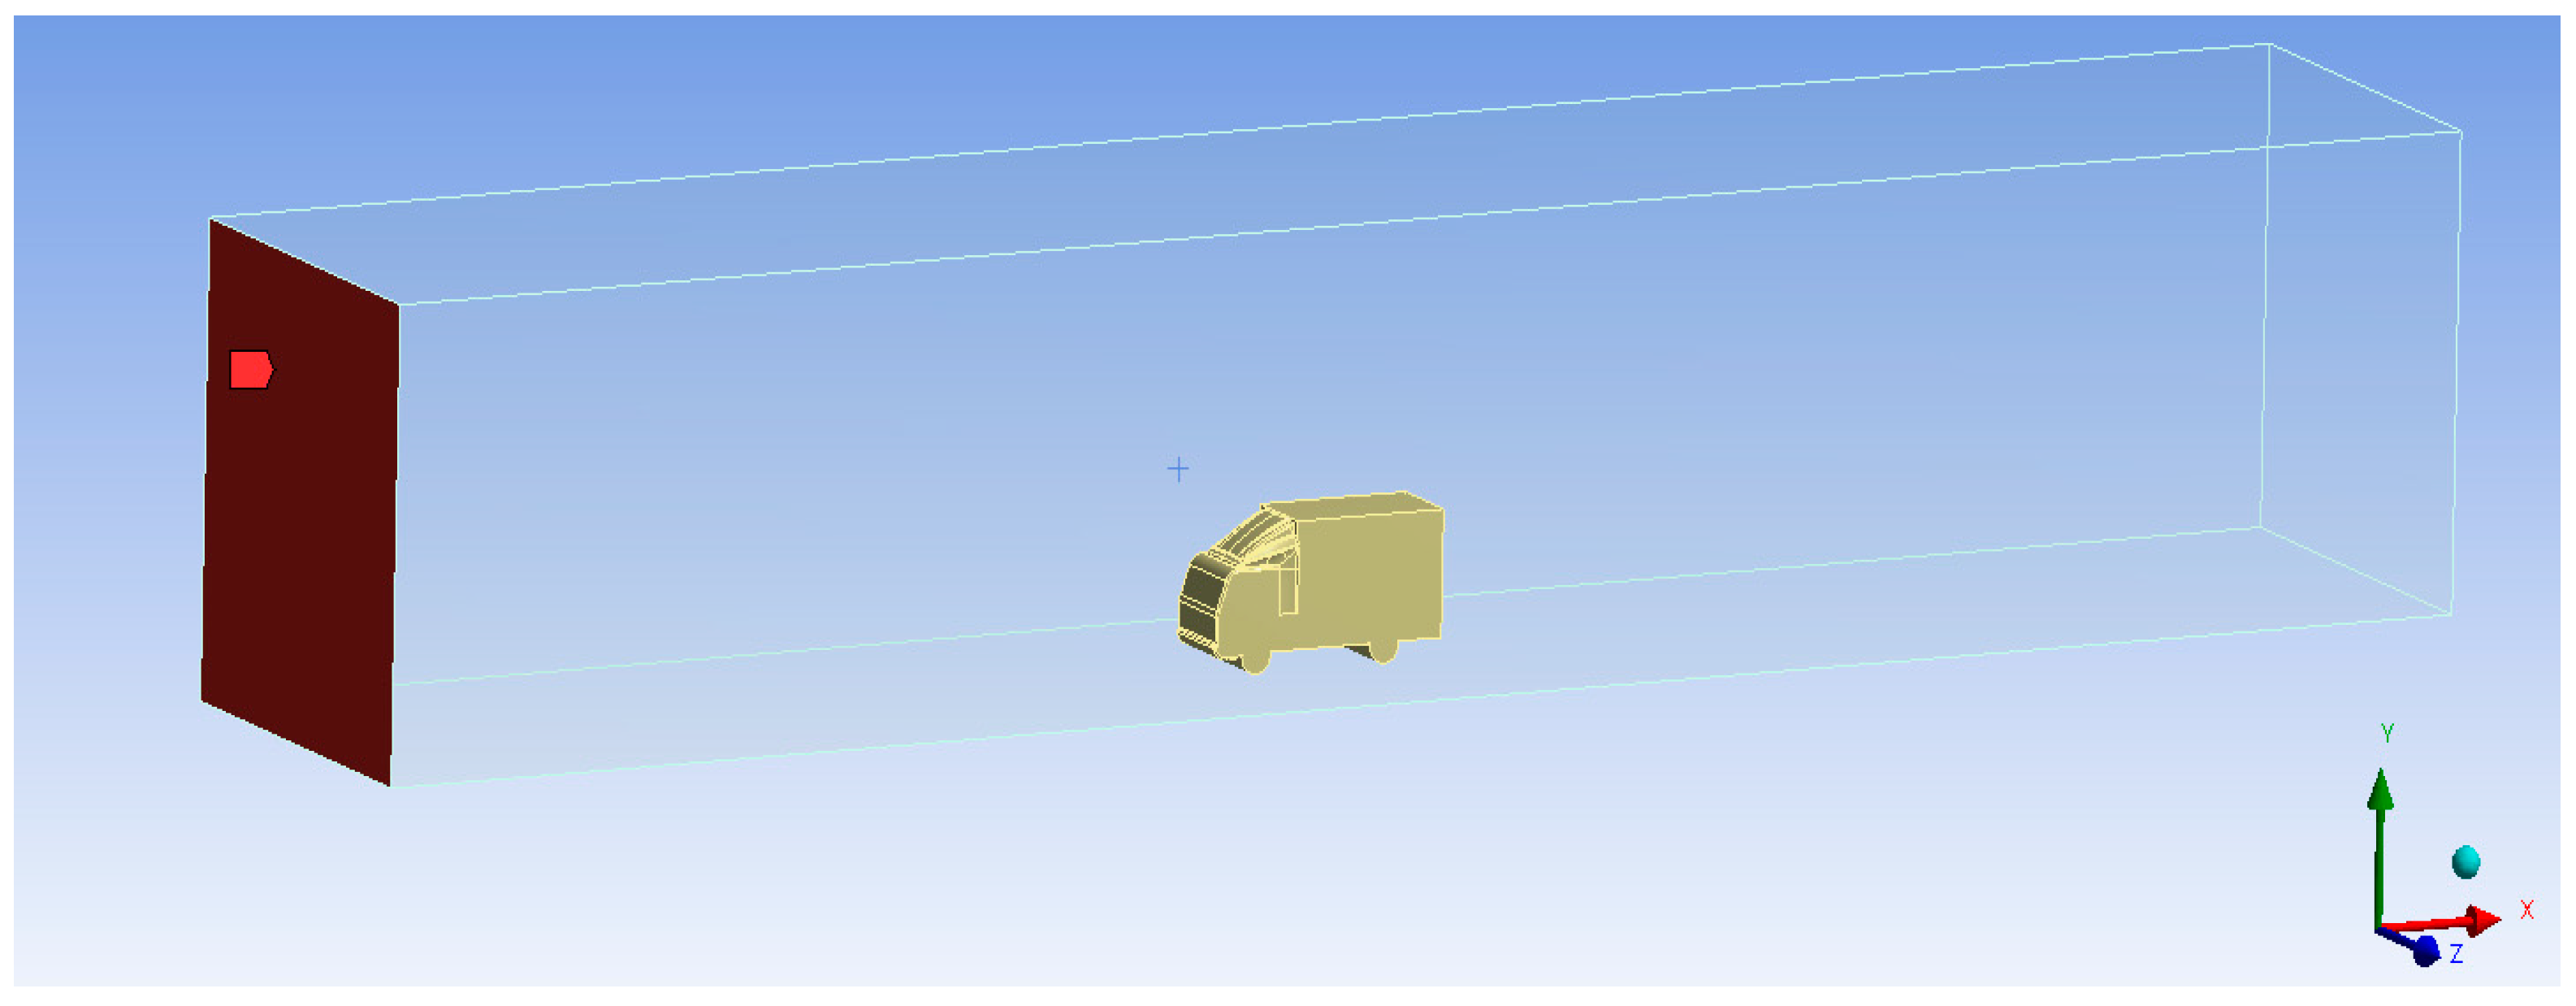
To do precise performance evaluation for the fairing designed, Fluent, a commercial program, was used to perform flow analysis. Figure 7 shows definition of inlet and outlet for analysis. The scope of analysis was set as the size that the flow separation occurred on commercial vehicles that could be recovered enough, and the commercial vehicle and fairing area was composed with hexa grids by considering boundary layers and the remaining area was made up of tetra grids [14].
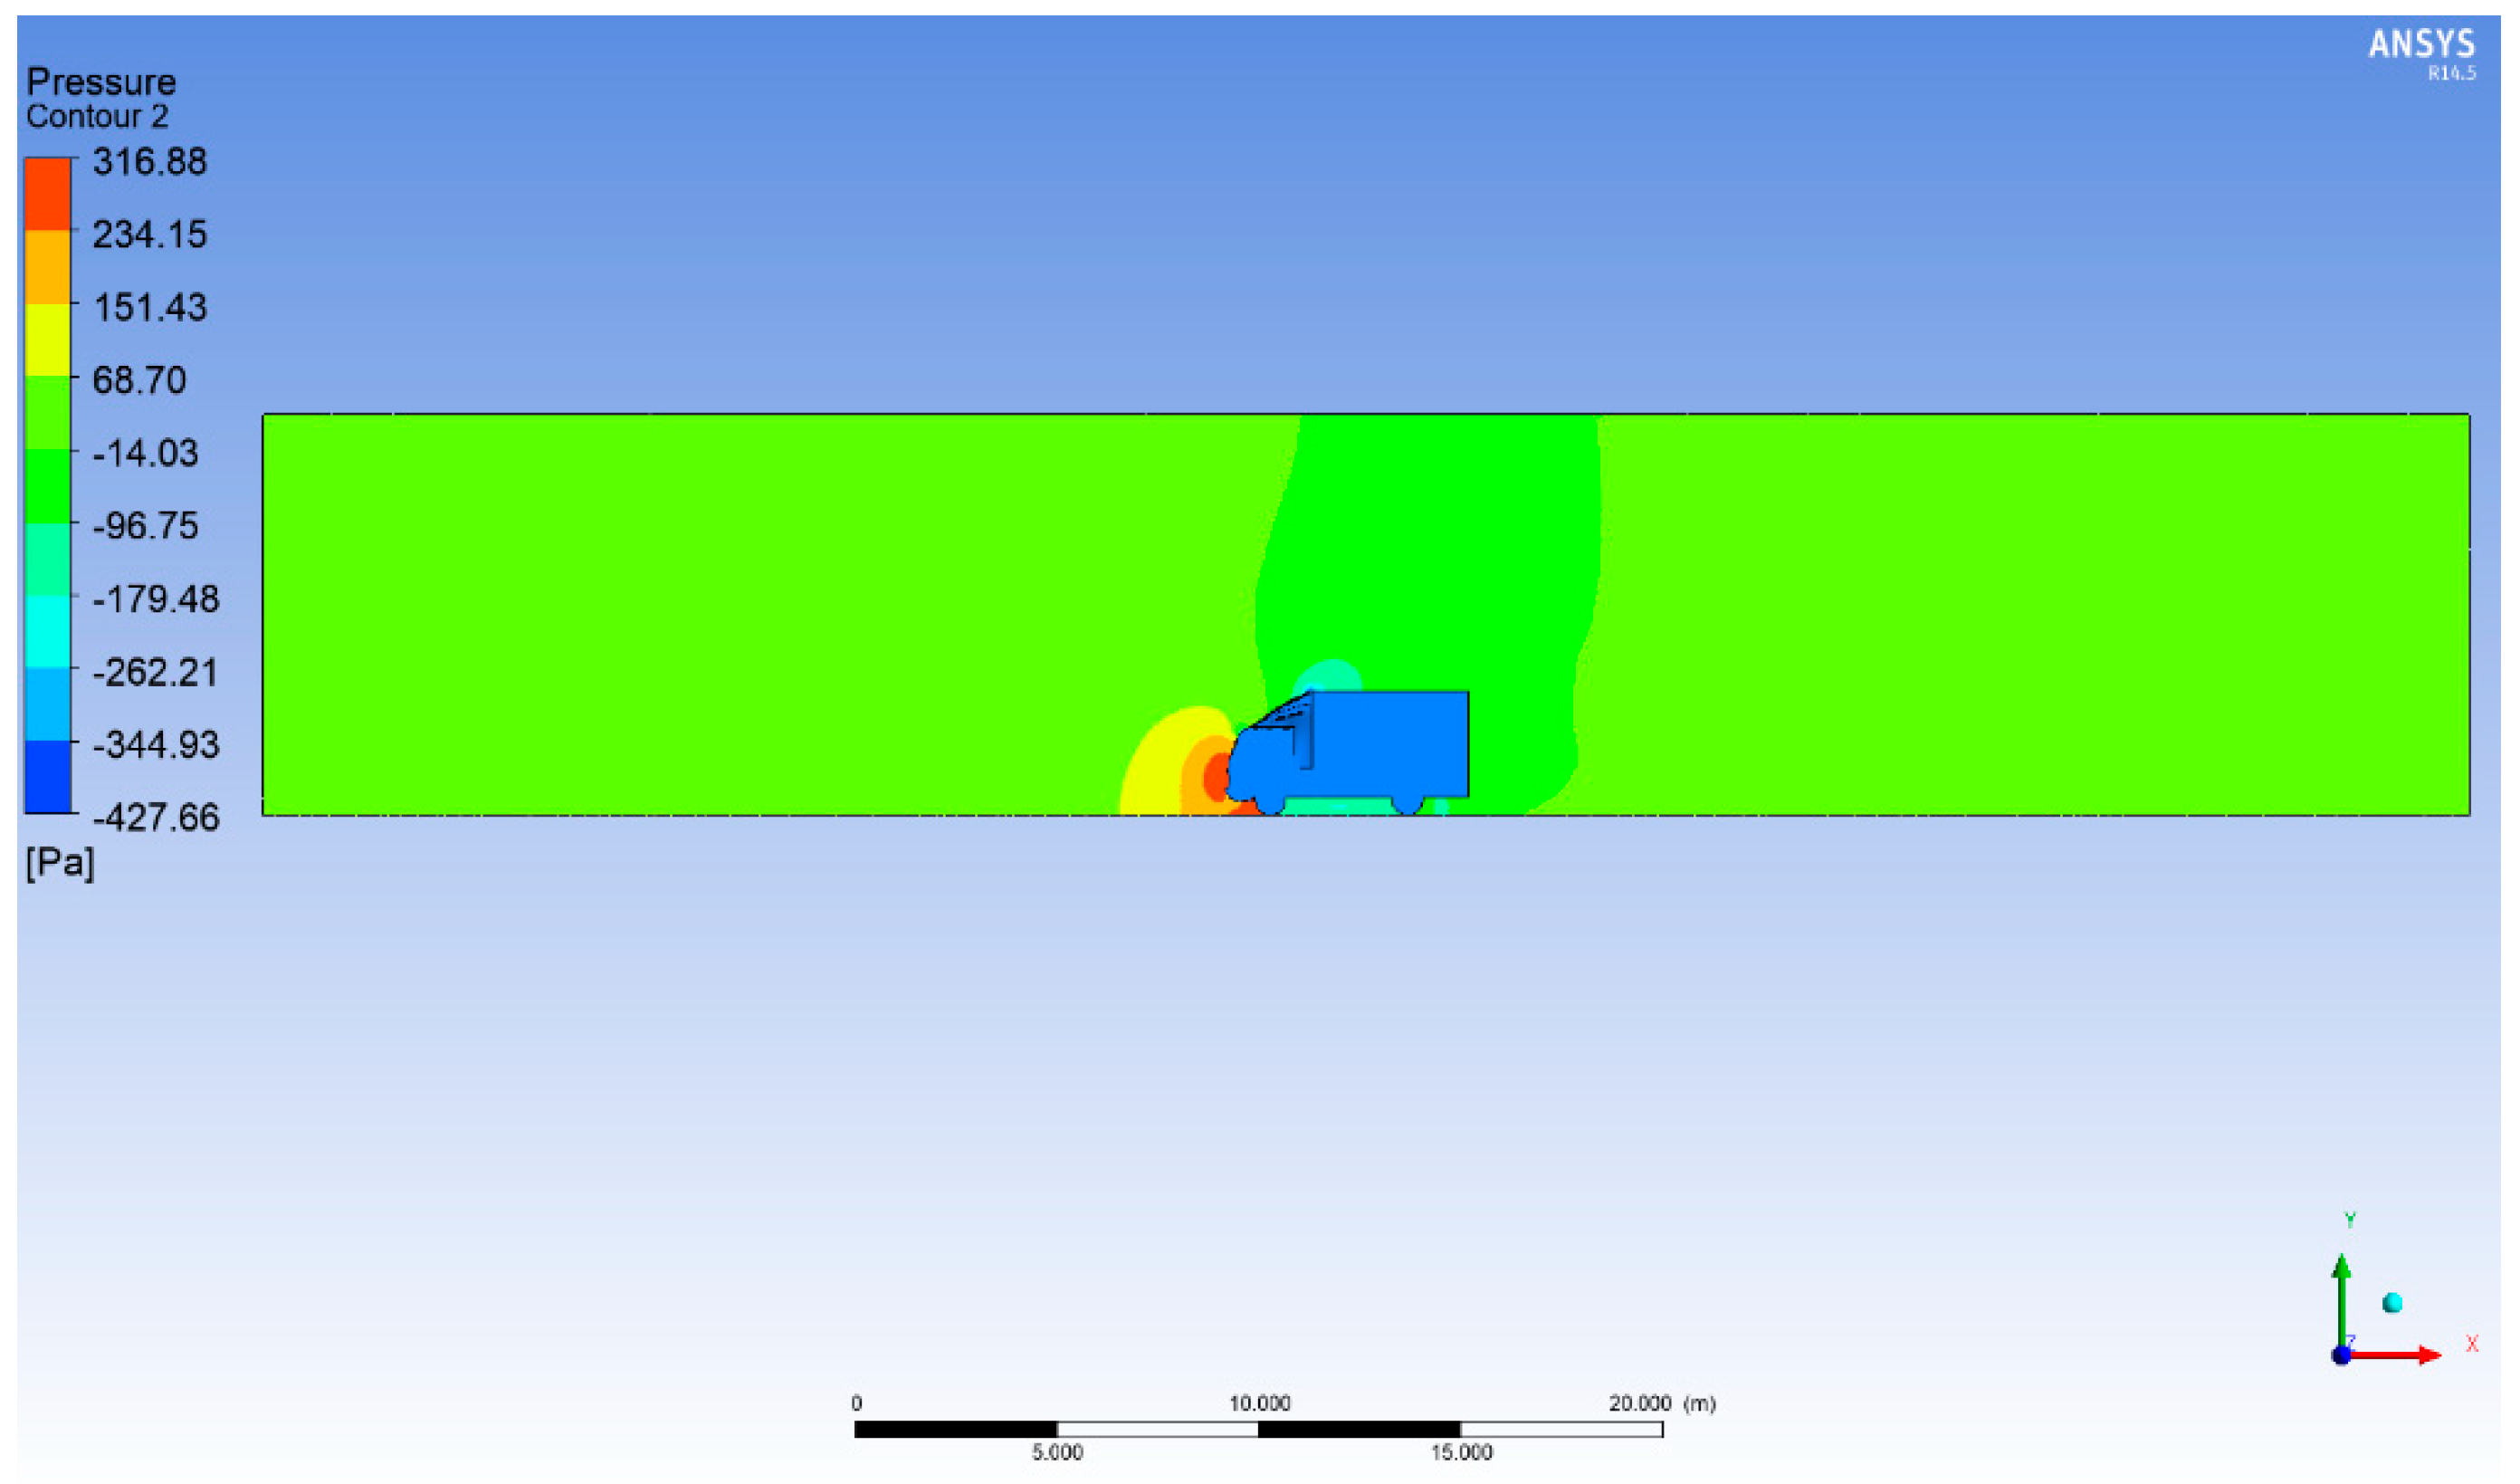
The principal boundary conditions for the flow analysis on the fairing are as shown in Table 4 below. The flow analysis was simulated the same way as a wind tunnel test, the basic air model within Fluent was used for the fluid model, and for the turbulence model, the shear stress transport (SST) transition model, which is based on -ω model with high reliability for the transition region from laminar flow to turbulence, was applied [15]. The target drag reduction value of the aerodynamic design is 20%, and by examining the result of the numerical analysis using commercial codes as shown in Table 5, it was verified that the drag coefficients of the commercial vehicle’s basic shape with no fairing, the 2D aerodynamic designed fairing, and the 3D aerodynamic designed fairing were 0.523, 0.423, and 0.417, respectively. It could be verified that the drag was reduced by 20.1% when installing the fairing with 3D aerodynamic design, compared to the basic commercial vehicle’s shape. Figure 8 shows the pressure distribution of CFD analysis.
4. Structural Design
4.1. Structural Design Concept
In this study, the laminate and sandwich structural design applying relatively low-priced glass fiber reinforced plastic (GFRP) woven fabric were performed. The structural design was performed considering compressive strength. The safety factor is 3. The thickness and stacking sequence was defined considering a safety factor of 3. The principal load of structural design was the load case 2, the condition of which was set as the velocity of 202 km/h, in which 130 km/h, considering when a special vehicle is speeding, is added to 72 km/h, that is the domestic gust condition. Aerodynamic analysis was performed with the load condition as above to derive aerodynamic load. Figure 8 is the pressure distribution of the fairing obtained from 3D aerodynamic analysis. Since this study should consider the maximum load for structural safety of the fairing, it was carried out with the distributed load of 3519 Pa, which is the maximum pressure value.
The fairing was assumed as a flat plate for convenience of structural design, and the reliability of the design results was secured by comparing the subsequent design result with the analysis result of the flat plate fairing. It was designed with laminate and sandwich to lighten the structure, and the structural design result and weight were compared. The thickness and lamination method of the structure, which was the structural design result of a flat plate fairing, were applied to the curved fairing of aerodynamic design results, and its structural safety was confirmed through structural analysis.
4.2. Design of Uniform Thickness for Composite Laminate
The fairing is supported by the cab part of commercial vehicles. The maximum load was considered for structural safety, and it used 3519 Pa, the maximum pressure that was the aerodynamic analysis result. On the bottom of the fairing, positive pressure was produced in the direction perpendicular to the tangential plane on the basis of the front of the fairing, and on the top, negative pressure was generated in the direction perpendicular to the tangential plane; however, negative pressure is greater than positive one, so its structural design was performed with the distributed load of 3519 Pa which was the maximum of negative pressure. The GFRP woven fabric was used for the materials of the fairing, and it was designed to satisfy the safety factor of 3 against compressive stress. The final thickness of the structures was derived by using the equation below [16].
In Equation (12), , and are the load value, the maximum pressure, which is the aerodynamic analysis result, and the projected area to the front of the fairing, respectively.
In Equation (13), and are the distributed load and the length of the top member of the fairing, respectively.
In Equation (14), is the bending moment of the top member of the fairing.
In Equation (15), and are the allowable section modulus and allowable stress, respectively.
In Equation (16), b and t are the curved length and thickness of the fairing, respectively.
The uniform thickness lamination method for composite was applied for structural design. The distributed load was applied to the laminate structure. Table 6 is the structural design specification required at the uniform thickness composite lamination method stage. As a result of structural design, the thickness and mass were 12.2 mm and 125 kg.
4.3. Design of Variable Thickness for Composite Laminate
In this study, the target mass of the fairing is 10% reduction compared to the fairing mass previously studied. The mass of the fairing previously studied is 23 kg. In the stage of the uniform thickness composite lamination method, the total mass of the fairing was 125 kg, and the front of the fairing was divided into ten equal parts in the vertical direction for a lightweight fairing. The structural design of each section was performed considering the locally maximum load for each divided section. The thickness values determined by considering respective maximum load when dividing the fairing into ten equal parts. Since the thickness of the GFRP applied in this study was 0.25 mm for one ply, the designed thickness value of each section could not be exactly made as multiples, so the number of lamination layers satisfying more than the designed thickness was derived. Additionally in the stage of the variable thickness composite lamination method, the fairing thickness could be found with the values obtained through Equations (12)–(16) as the stage studied earlier. The safety factor value satisfies 3, which is the existing set value, or more. The mass of the whole fairing at that time is 82.3 kg.
4.4. Design of Uniform Thickness for Sandwich Composite Structure
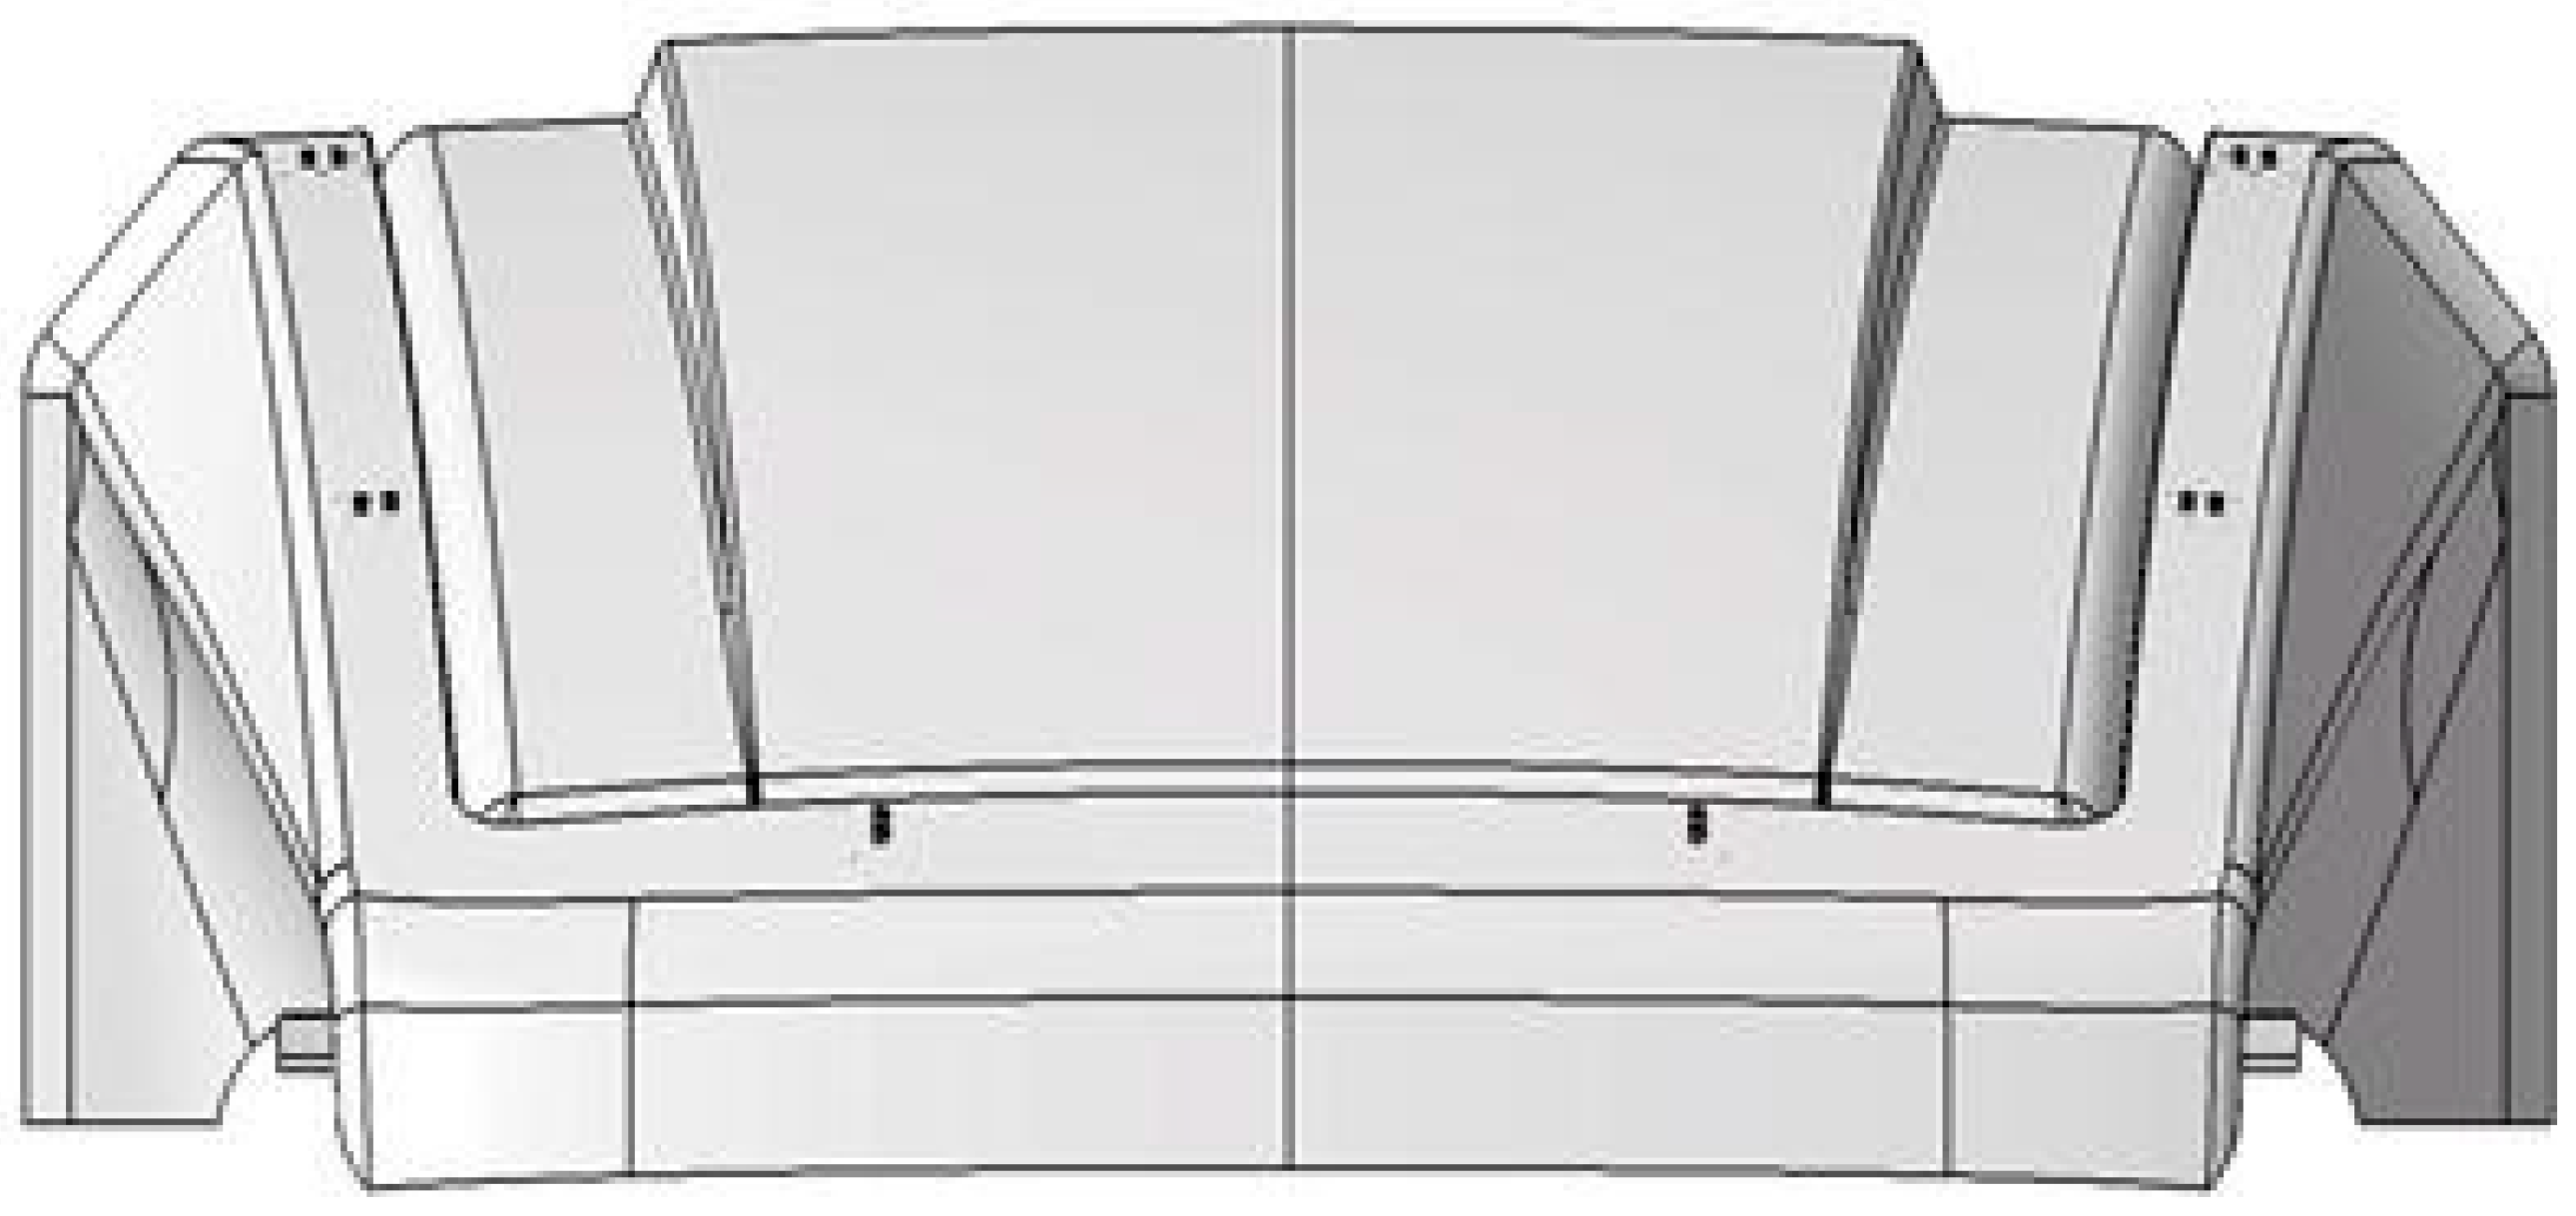
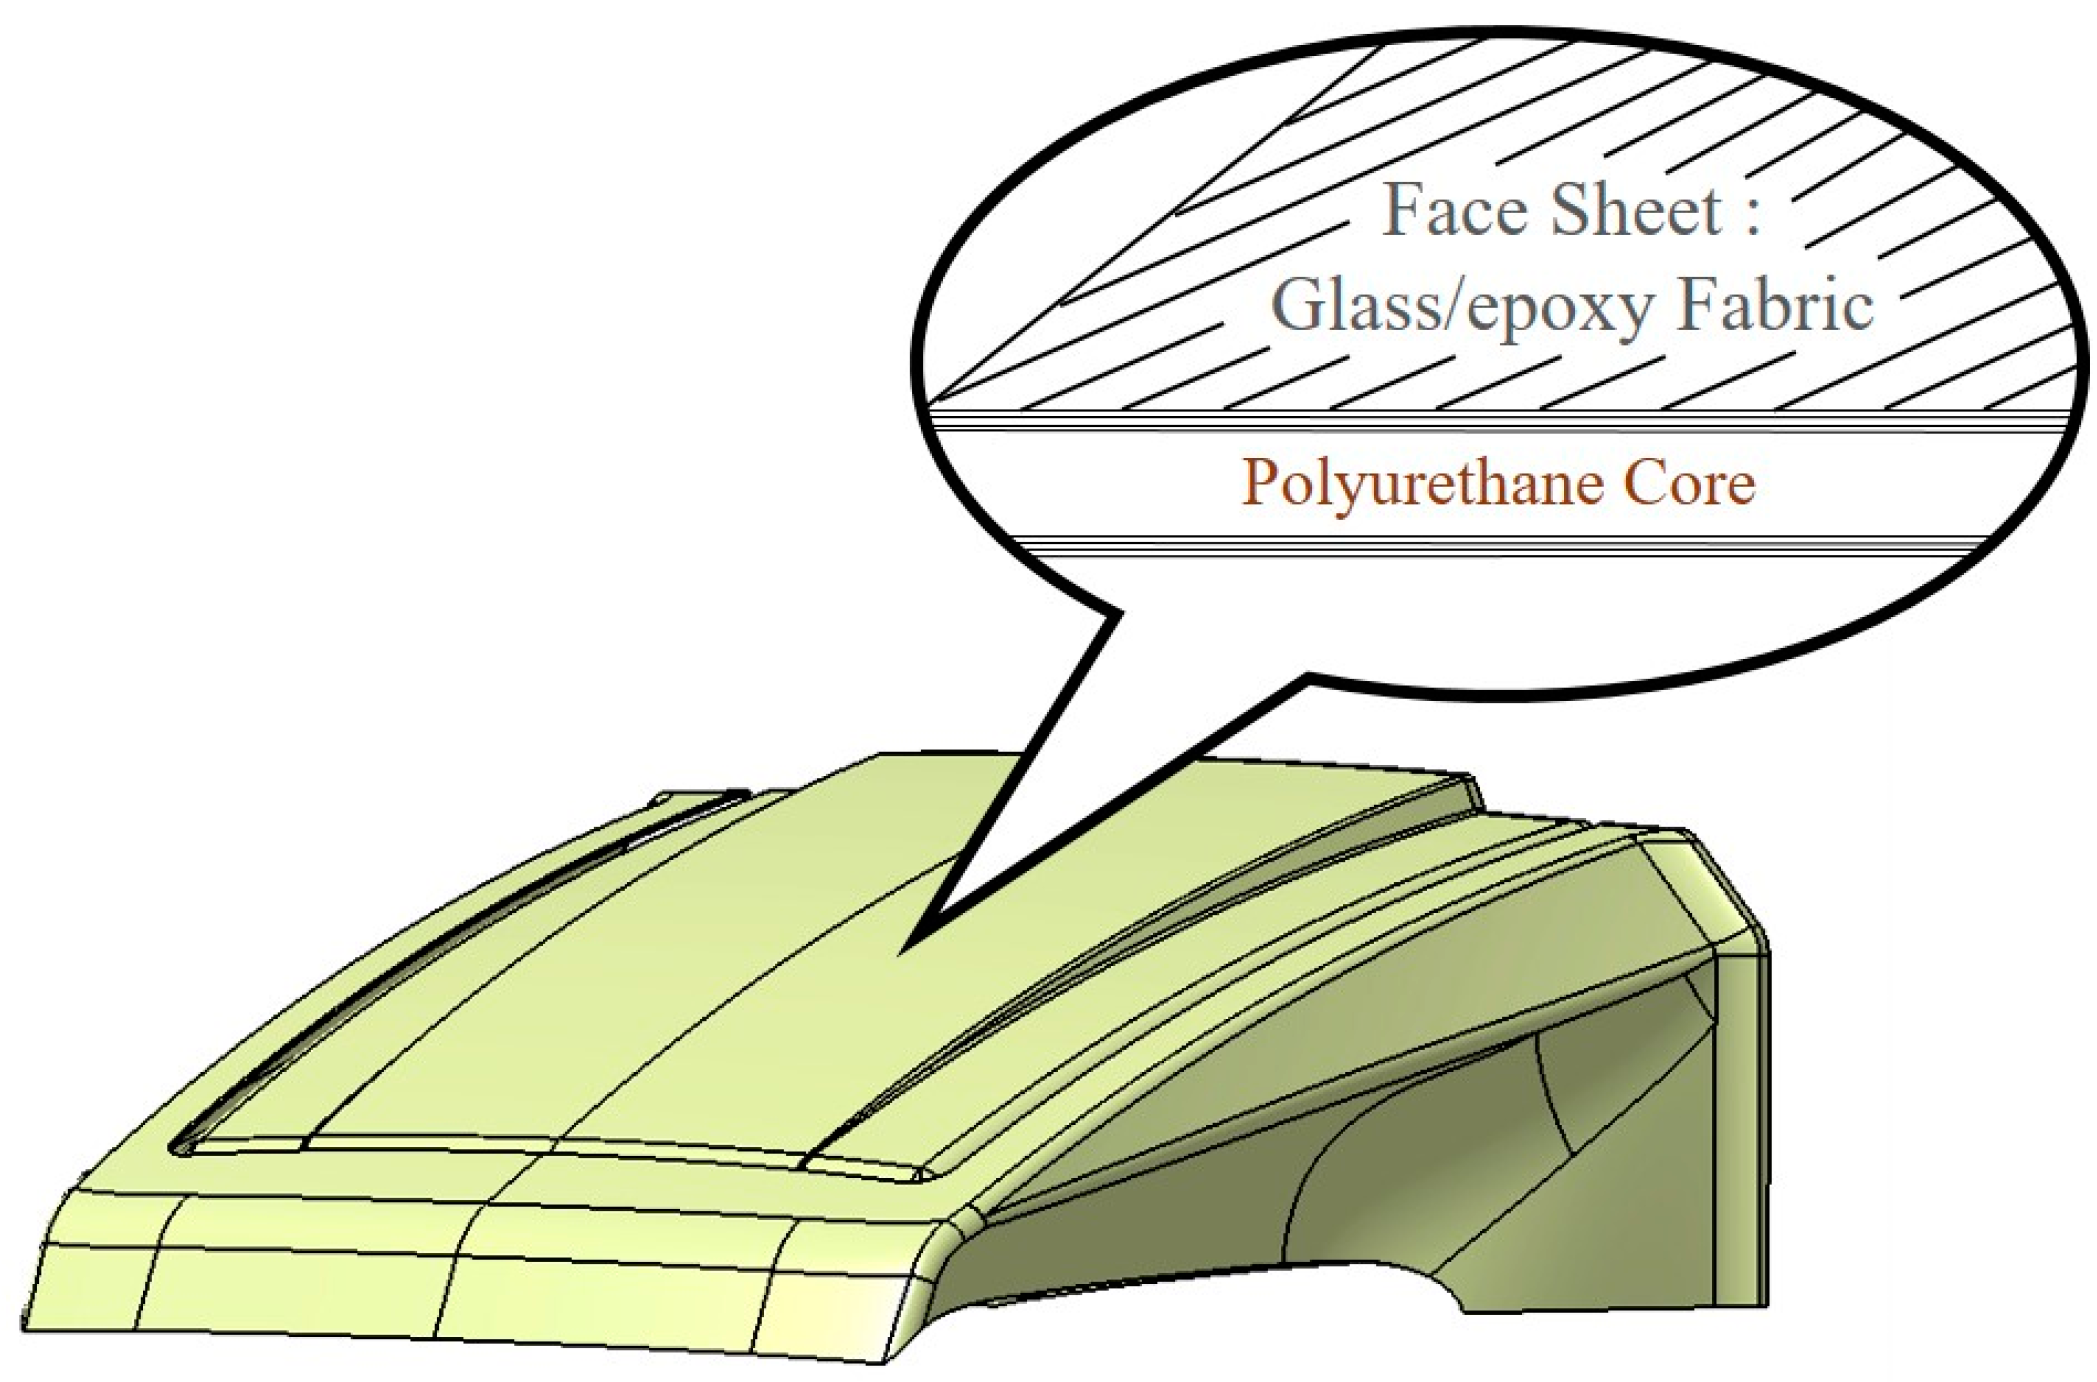
The design concept was improved by applying the sandwich structure for a lightweight fairing. GFRP, same as the simple flat plate design, was applied to the face skin, and polyurethane foam was used for the core. Polyurethane foam was selected considering the manufacturing aspect when actually manufacturing the fairing. The mechanical property of GFRP and polyurethane for the design of sandwich structures is as shown in Table 6 [13]. The safety evaluation of sandwich structures uses the material property of GFRP and polyurethane when designing, and the safety factor of 3 is considered for two yield stress values. In this study, the allowable stress of GFRP and polyurethane was more than the safety factor value of 3 when designing based on the allowable stress, so it was verified to be safe enough. Figure 9 is the shape of sandwich structures.
The theoretical equation for the thickness of the fairing using sandwich structures is determined by the following equation after the finding moment [16]:
In Equation (17), , , , and are the moment of inertia about glass fiber, length of the fairing’s top, height of sandwich structures, and height of the foam, respectively.
In Equation (18), is the moment of inertia about polyurethane.
In Equation (19), is the compressive strength of glass fiber considering the safety factor of 3. The reason for selecting compressive strength is that glass fiber is more vulnerable to compression than tension. and are elastic coefficients of glass fiber and polyurethane foam, respectively.
In Equation (20), is the compressive strength of polyurethane considering the safety factor of 3. The thickness and mass of GFRP and foam are derived by Equations (17)–(20), the thickness of the foam was derived according to the number of plies of the skin satisfying the safety factor of 3 or more, and at that time, 1–24 was applied to the number of the skin’s plies. It could be shown that as the number of glass fiber plies increases, the thickness of the fairing decreases and the mass grows. This is because the density of GFRP is 36 times larger than polyurethane. Because the mass of the fairing is targeted as 10% reduction of the mass of the preceding product, five plies of GFRP were applied in this study. This is because the thickness reduction rate gradually gets lower when being five plies, and the fairing mass value desired in this study could be checked. The total mass of the fairing could be checked to be 30.563 kg when designing the fairing structure with five plies of GFRP.
4.5. Design of Varialbe Thickness for Sandwich Composite Structure
In the uniform thickness sandwich structure stage, the total mass of adding the member of the fairing’s front and the member of the side triangle is 30.563 kg. For a little bit more lightweight, the variable thickness composite lamination method was grafted onto sandwich structures to perform weight lightening. In the variable thickness sandwich lamination method I, the fairing’s front is divided into 10 equal parts in the vertical direction, and the load is the maximum load of each divided section. At that time, the thickness of GFRP is fixed as five plies, and it could be shown that the thickness of foam also gets lower gradually as the load decreases. Then, the total mass of the fairing is 27.93 kg. Comparing the variable thickness sandwich lamination method I with the uniform thickness sandwich lamination method, it could be checked that the mass was different by about 10%.
In the variable thickness sandwich lamination method II, the fairing’s front is divided into 10 equal parts in the vertical direction, and the load is the maximum load of each divided section. At that time, the thickness of GFRP was changed, the section in which load rapidly decreased was set, and it could be checked that the thickness of both GFRP and foam also became lower gradually. The total mass of a fairing could be checked to be 20.534 kg in the final design method. The mass was lightened by about 30%.
5. Structural Analysis
In this study, the plate was modeled to be fitted to the fairing dimension because the fairing’s front was simulated as the simply supported beam where uniform distributed load worked when designing the fairing structure. The design theory of the sandwich structure design stage in the previous section was applied to the plate, and the plate’s face skin was verified to be 1.25 mm (five plies) for GFRP and 19.78 mm for polyurethane foam. Since the safety factor of 3 was considered with compressive strength of 184.6 MPa in the structural design, the allowable stress value of glass fiber on the plate was expected to be 61.53 MPa using the ANSYS program when analyzing structures [18]. As a result of structural analysis, it was verified that the face skin had the maximum stress of 60.129 MPa and safety factor of 3.07 on the plate. As a result of structural analysis, the foam had the maximum stress of 0.441 MPa on the plate, and the error between design theory and analysis value for GFRP could be checked to be about 2.3% because the design was performed on the basis of GFRP. Therefore, structural safety was confirmed when analyzing the fairing, and this study verified the reliability of structural design procedures for the fairing.
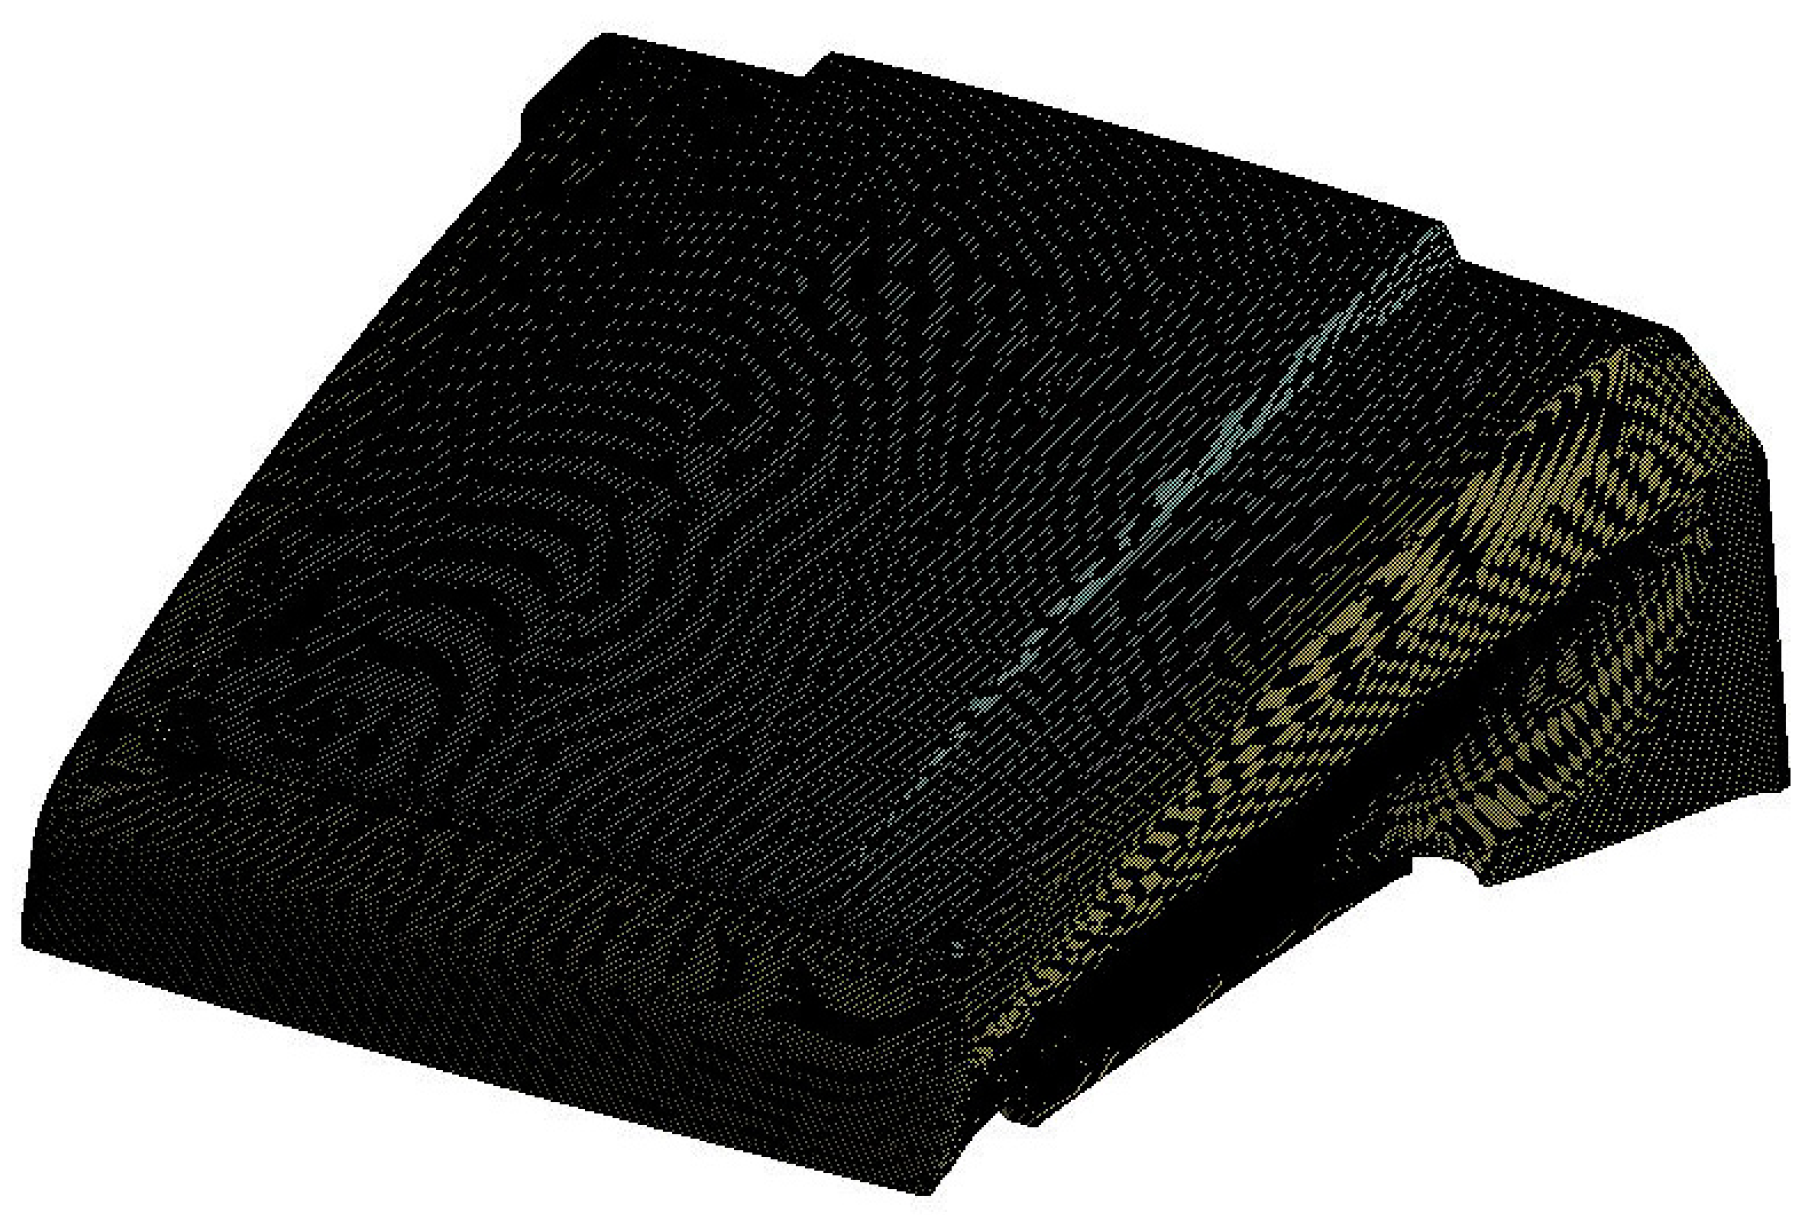
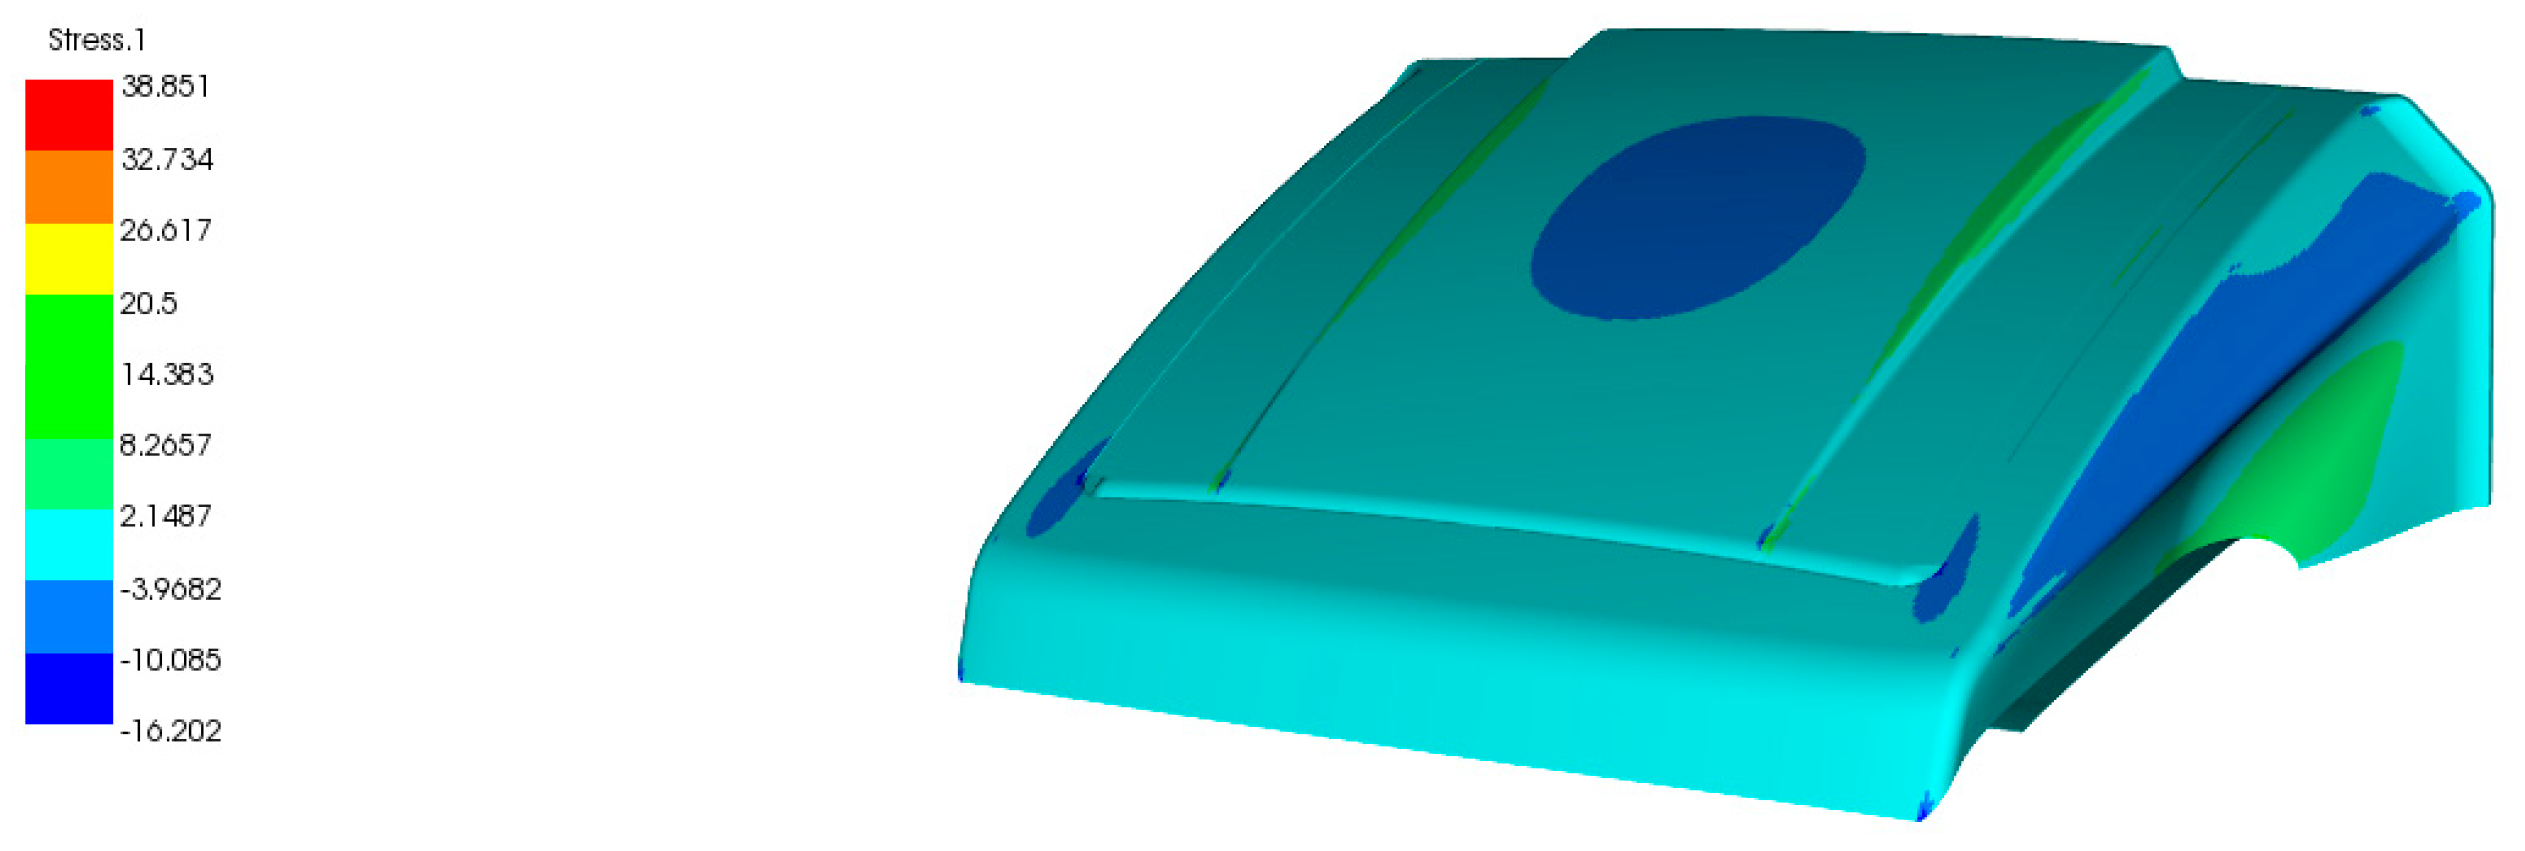
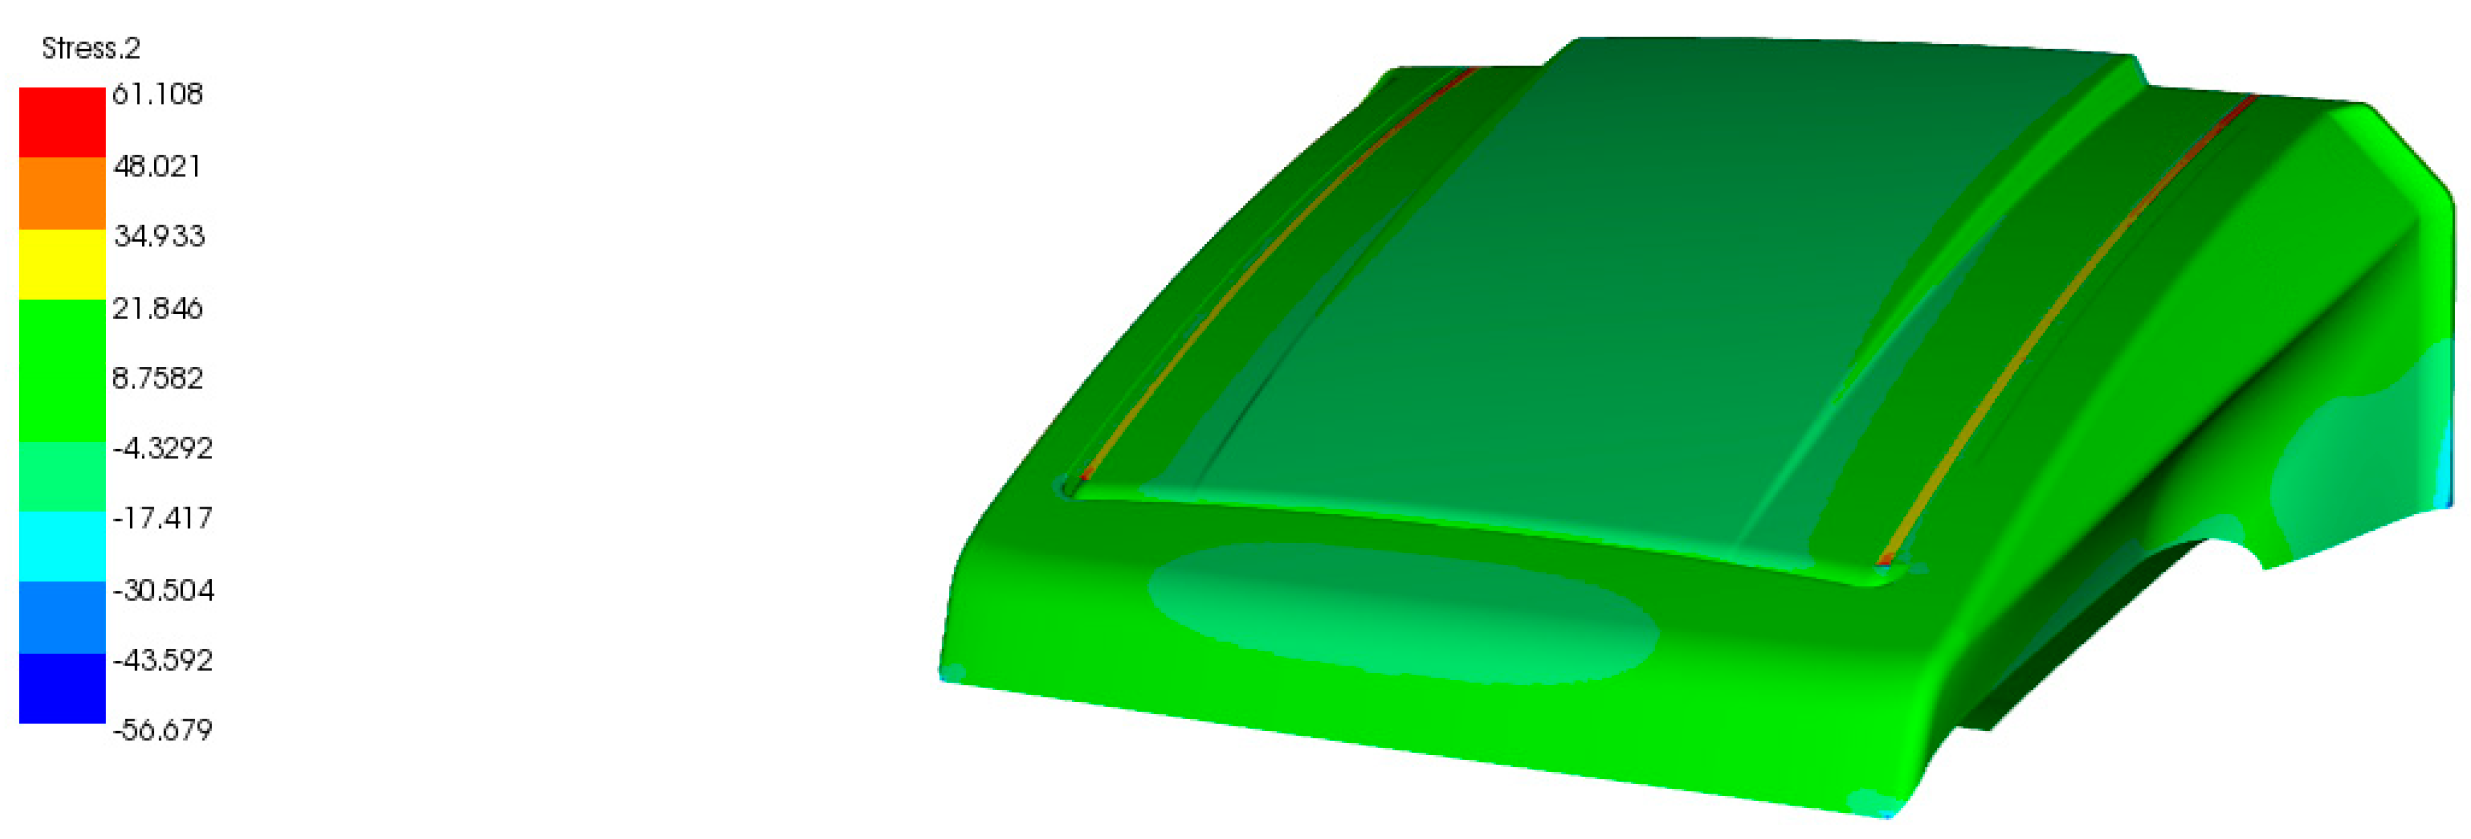
The structural analysis of target structure was performed by applying the analysis procedure being verified through the plate analysis. The finite element modeling was performed. The number of elements is 213,054 elements. The TRI3 and QUAD4 element was used. The mechanical properties of GFRP were used. As the boundary condition, a fixed condition was applied to the connection part. Figure 10 shows the result of finite element modeling. The structural analysis on the fairing by applying the load case 2 were performed. The stress, deformation, and buckling analysis were formed. It was confirmed the maximum stress of the face skin occurs on the fairing’s bottom part. Then, the result of stress analysis was confirmed to be 38.85 MPa. Because the allowable stress value with the safety factor of 3 applied was 61.53 MPa. Therefore, it was confirmed that the structural design result was safe. The fairing was confirmed to be safe structurally when using the load case 2, which is the maximum load condition, to analyze the structure. Table 7 shows the structural analysis result of each ply. The target structure is a structure that is weak to buckling. Therefore, stability against buckling should be evaluated. The buckling load factor is the safety factor against buckling. In this work, the buckling analysis was performed. The buckling load factor is 4.6. Therefore, it was confirmed that the stability about buckling is reasonable. Figure 11 shows stress analysis result. Figure 12 shows the result of buckling analysis.
6. Manufacturing of Design Result
In this work, the resin transfer molding (RTM) method was adopted to manufacture the spoiler. RTM is a three step process. A mold is loaded with reinforcement material, the mold is closed and held in a clamping press, and then a catalyzed, low-velocity resin is injected into the mold where it cures to form the finished part. RTM has a higher production rate, is more consistent, results in lower monomer emissions, and requires less labor and materials than lay-up or spray-up to produce a given part.
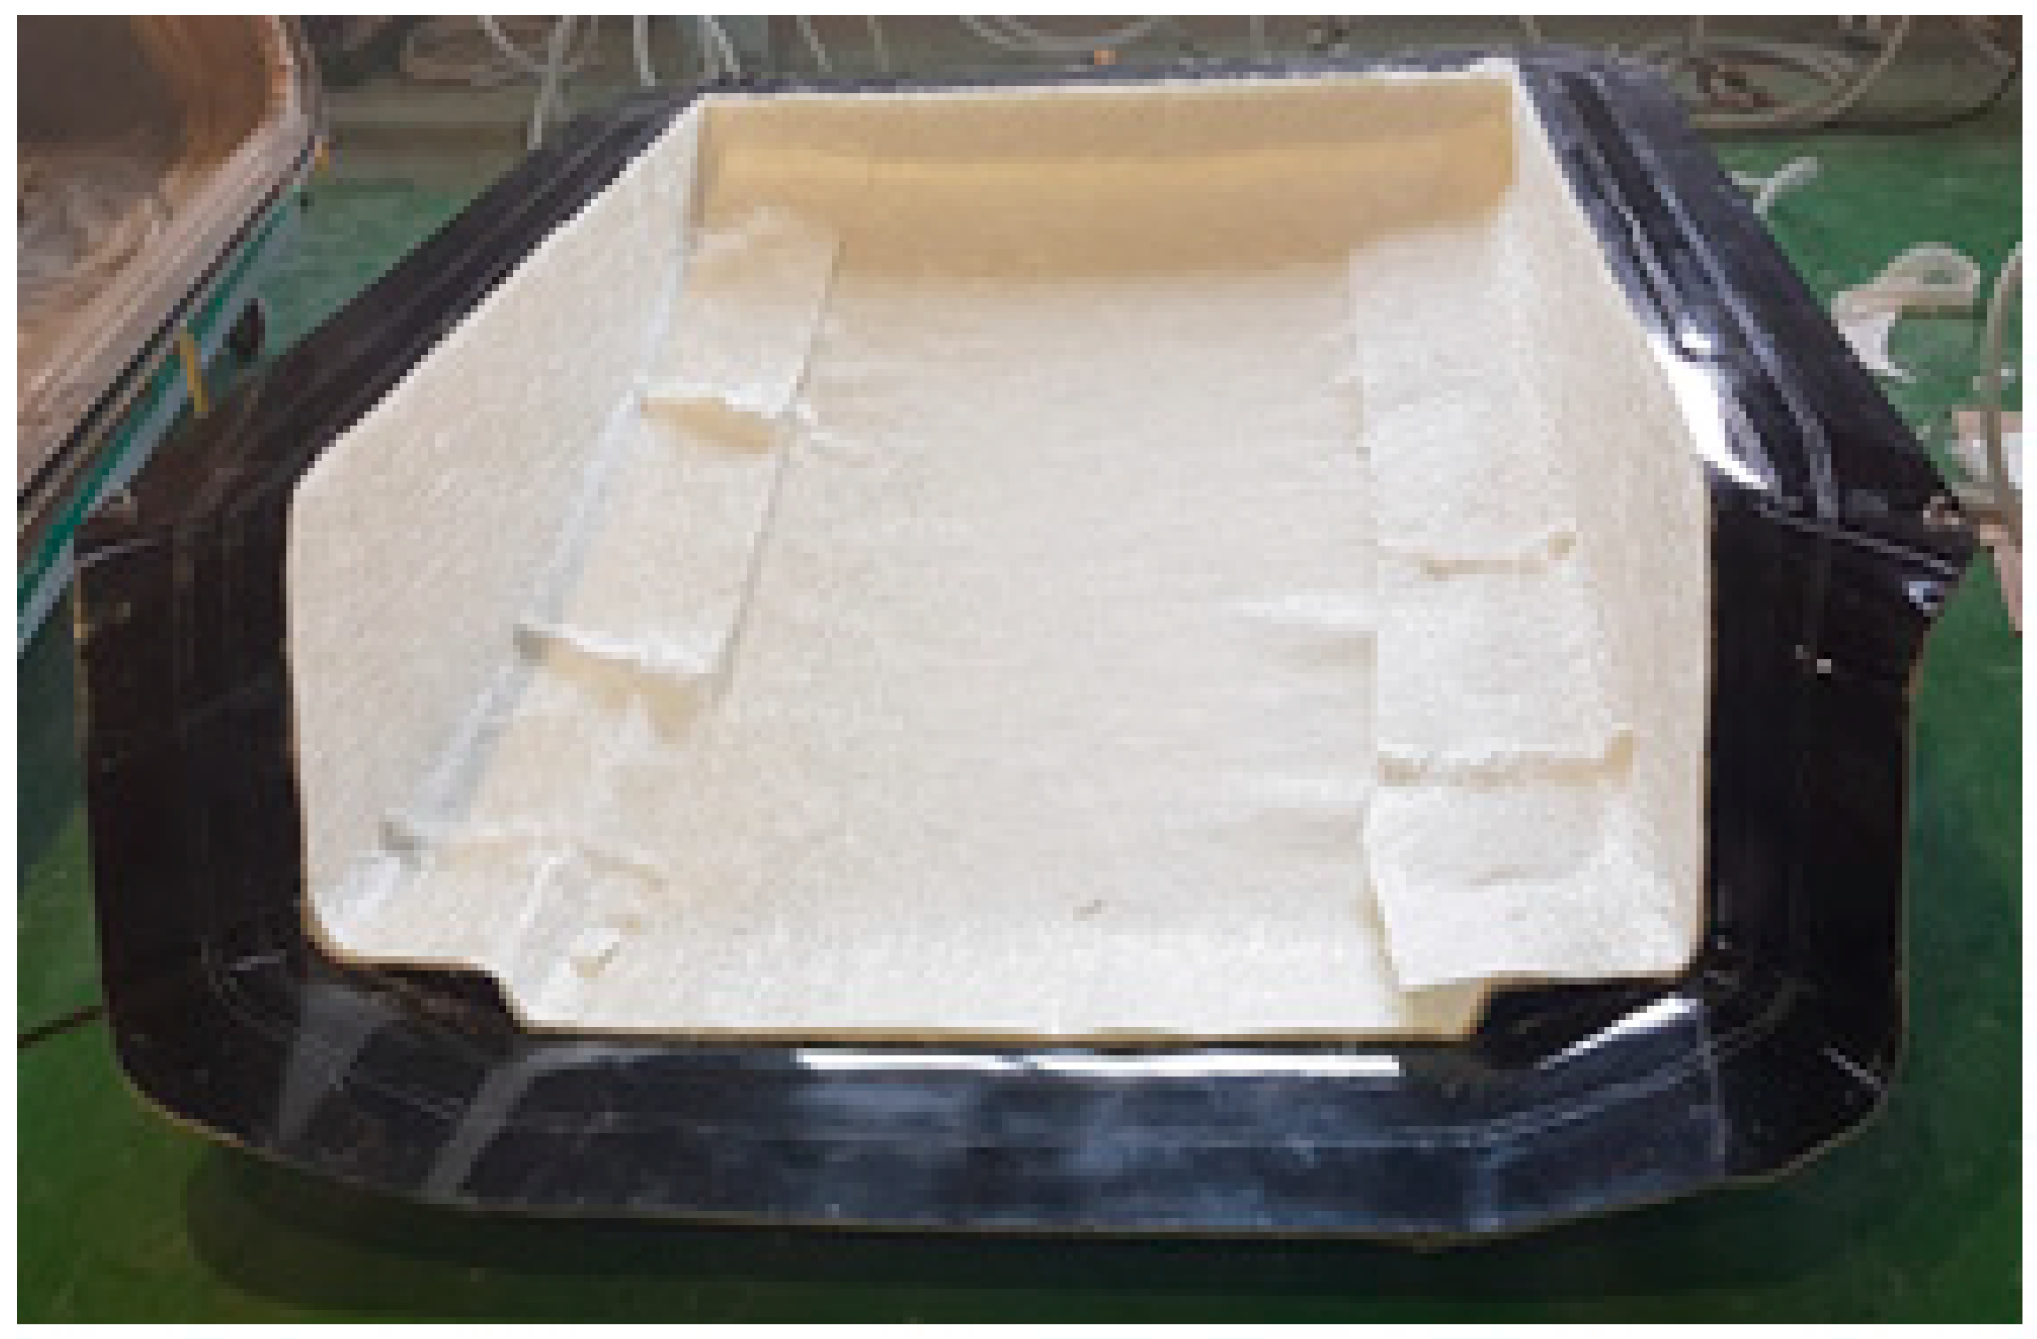
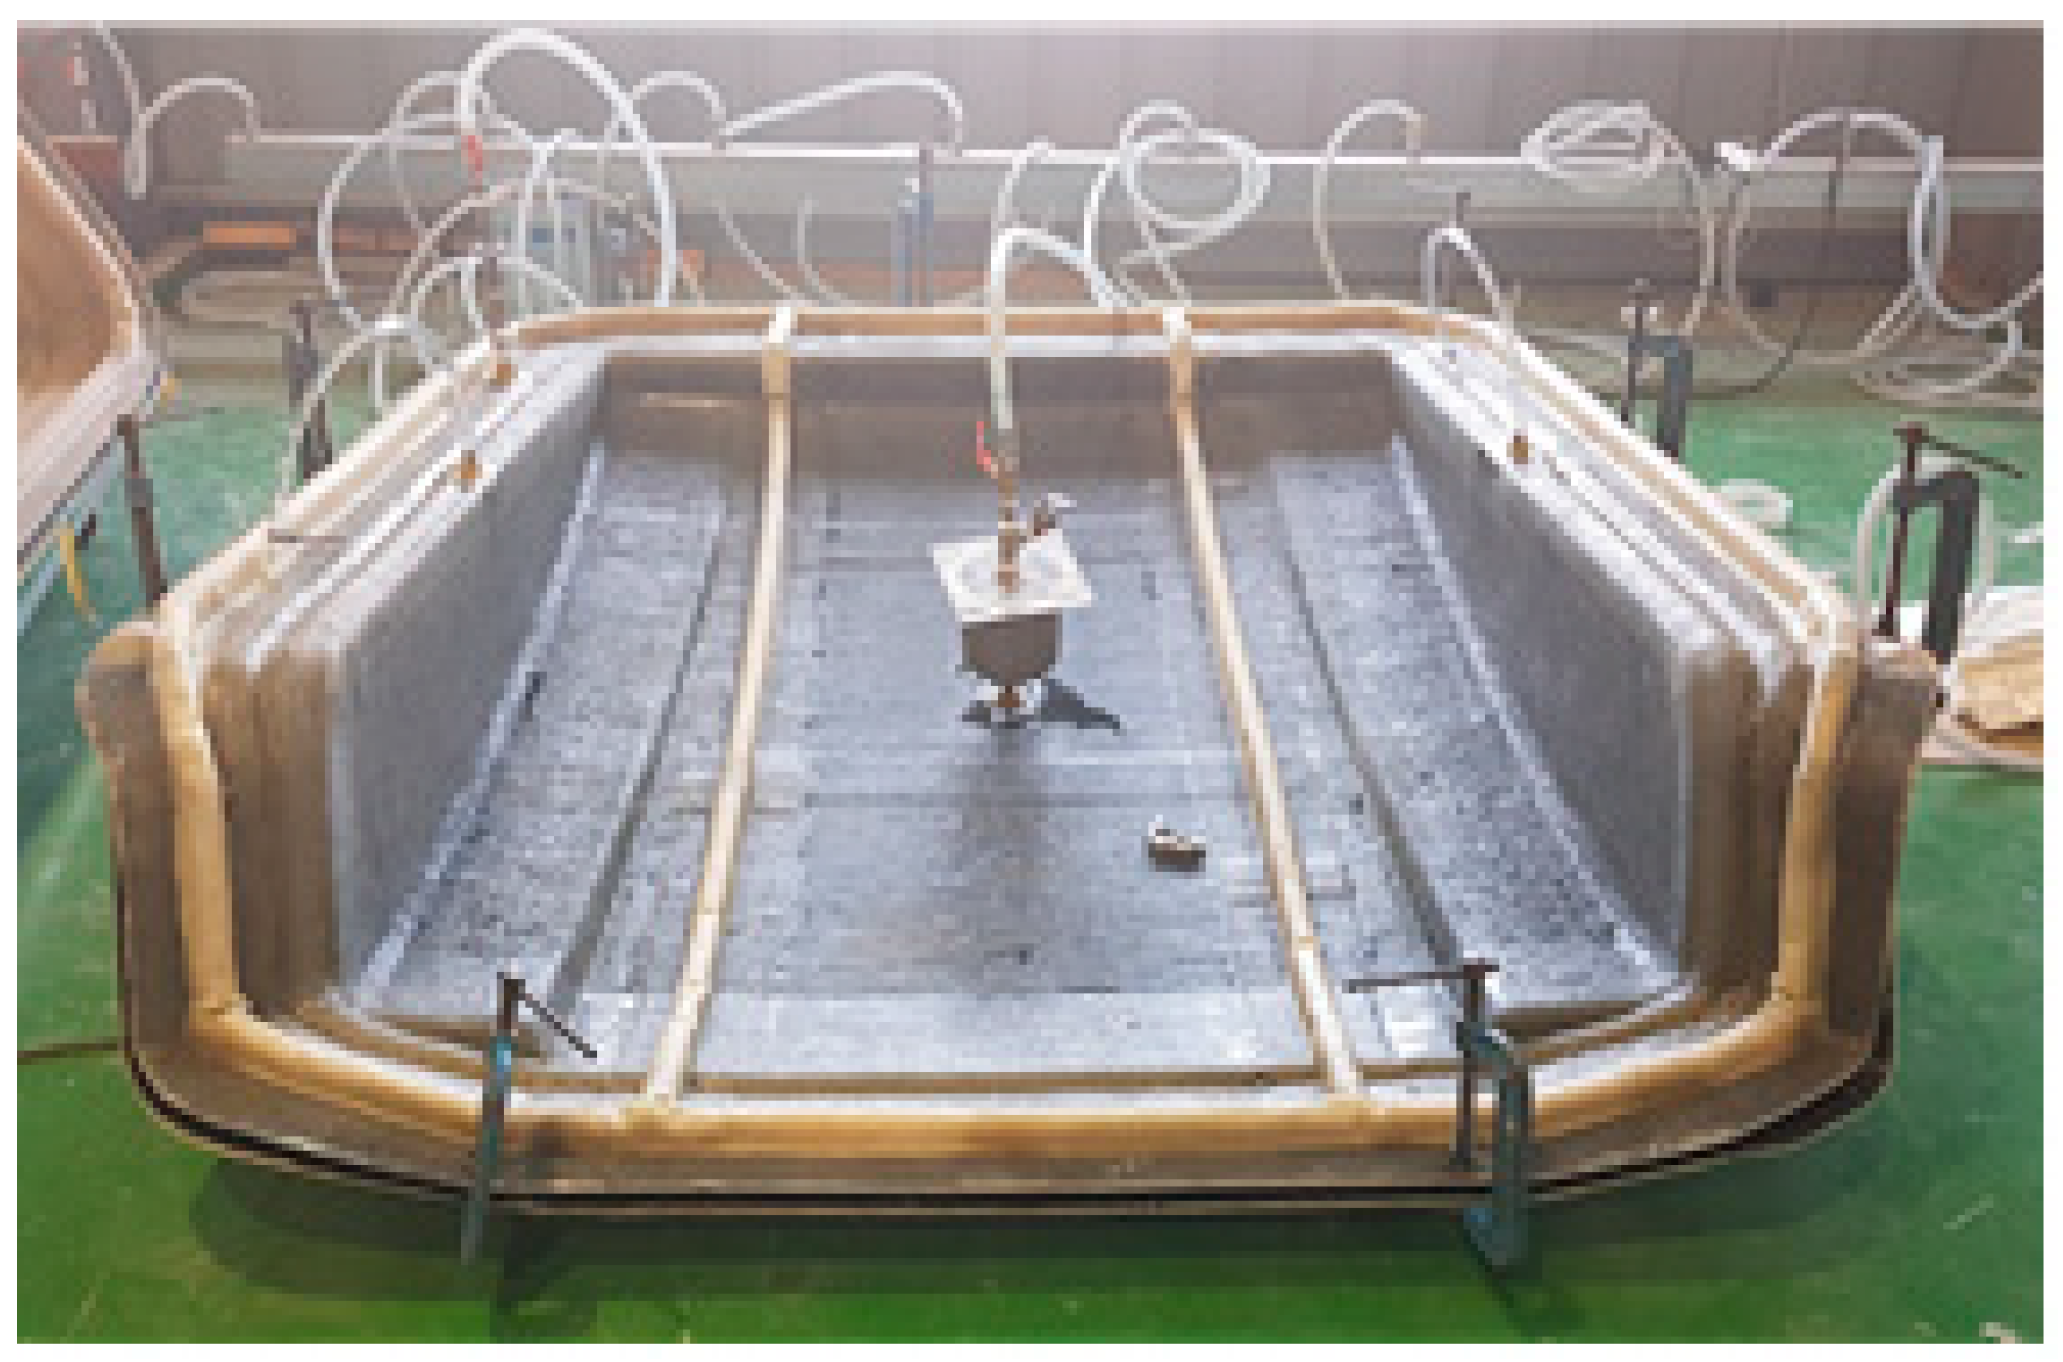
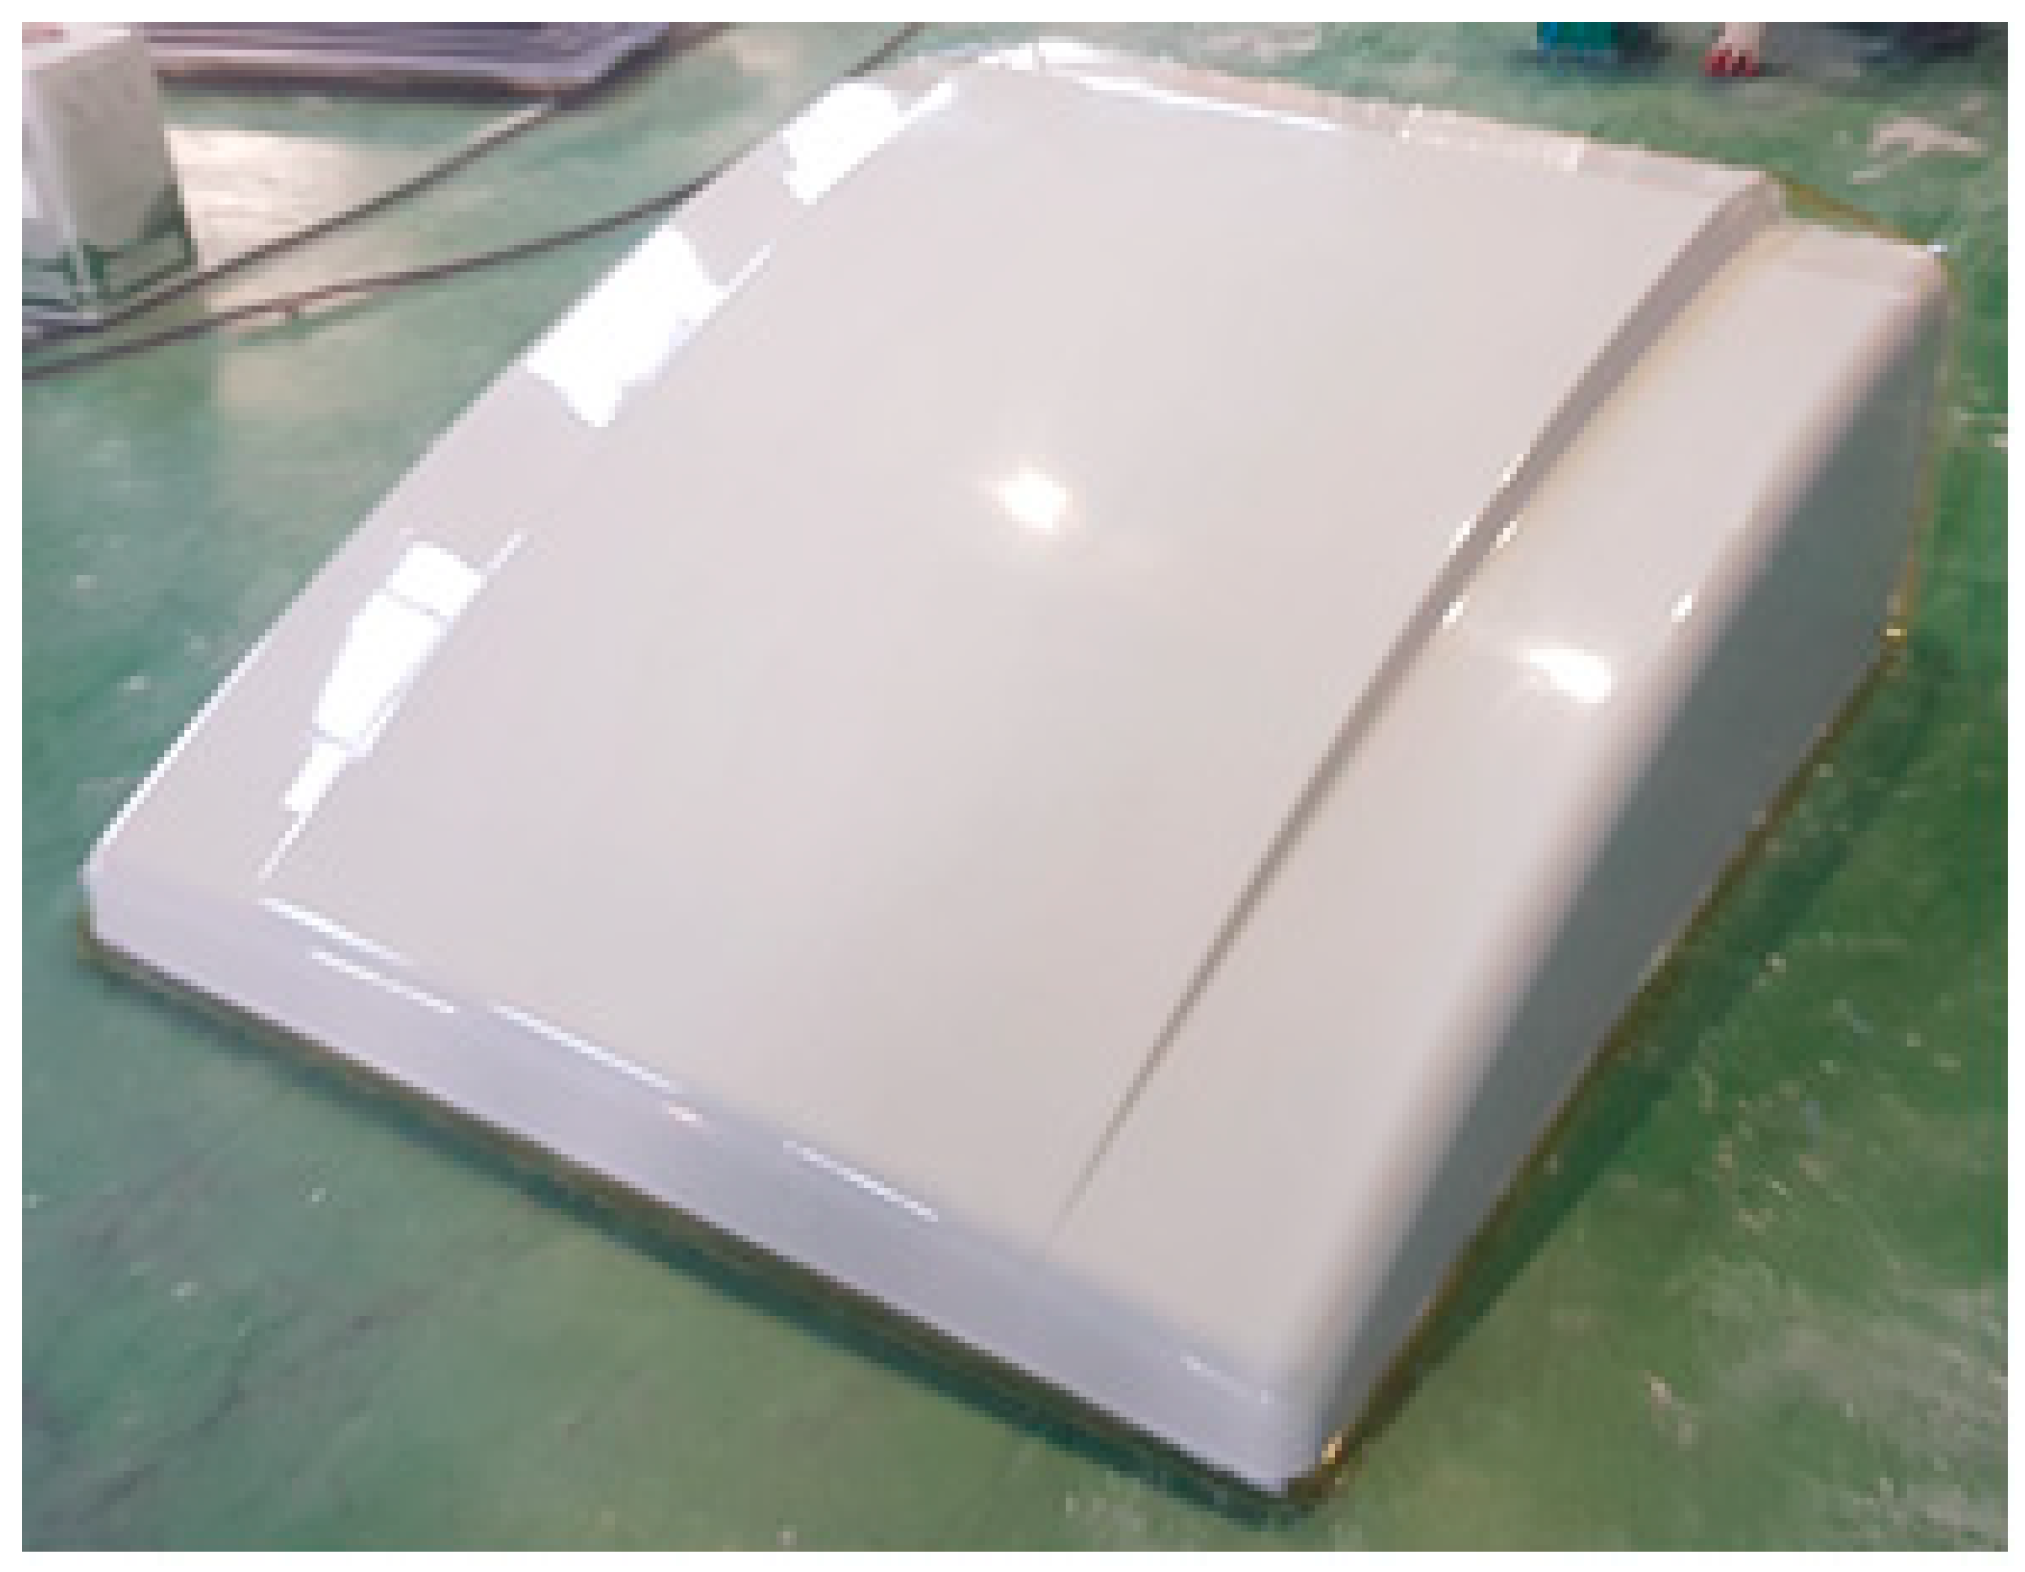
In this study, an optimization technology for resin infusion was developed. The location of the vacuum line and resin injection line was optimized and designed. In addition, the resin impregnability of the bleeder and core mat was analyzed and reflected. In order to shorten the curing time, the vacuum line and resin injection line were determined through simulation. The manufacturing process is presented in the following figures: Figure 13 shows the lamination process of glass fiber. Figure 14 shows the resin transfer process. Finally, the manufacture spoiler is shown in Figure 15.
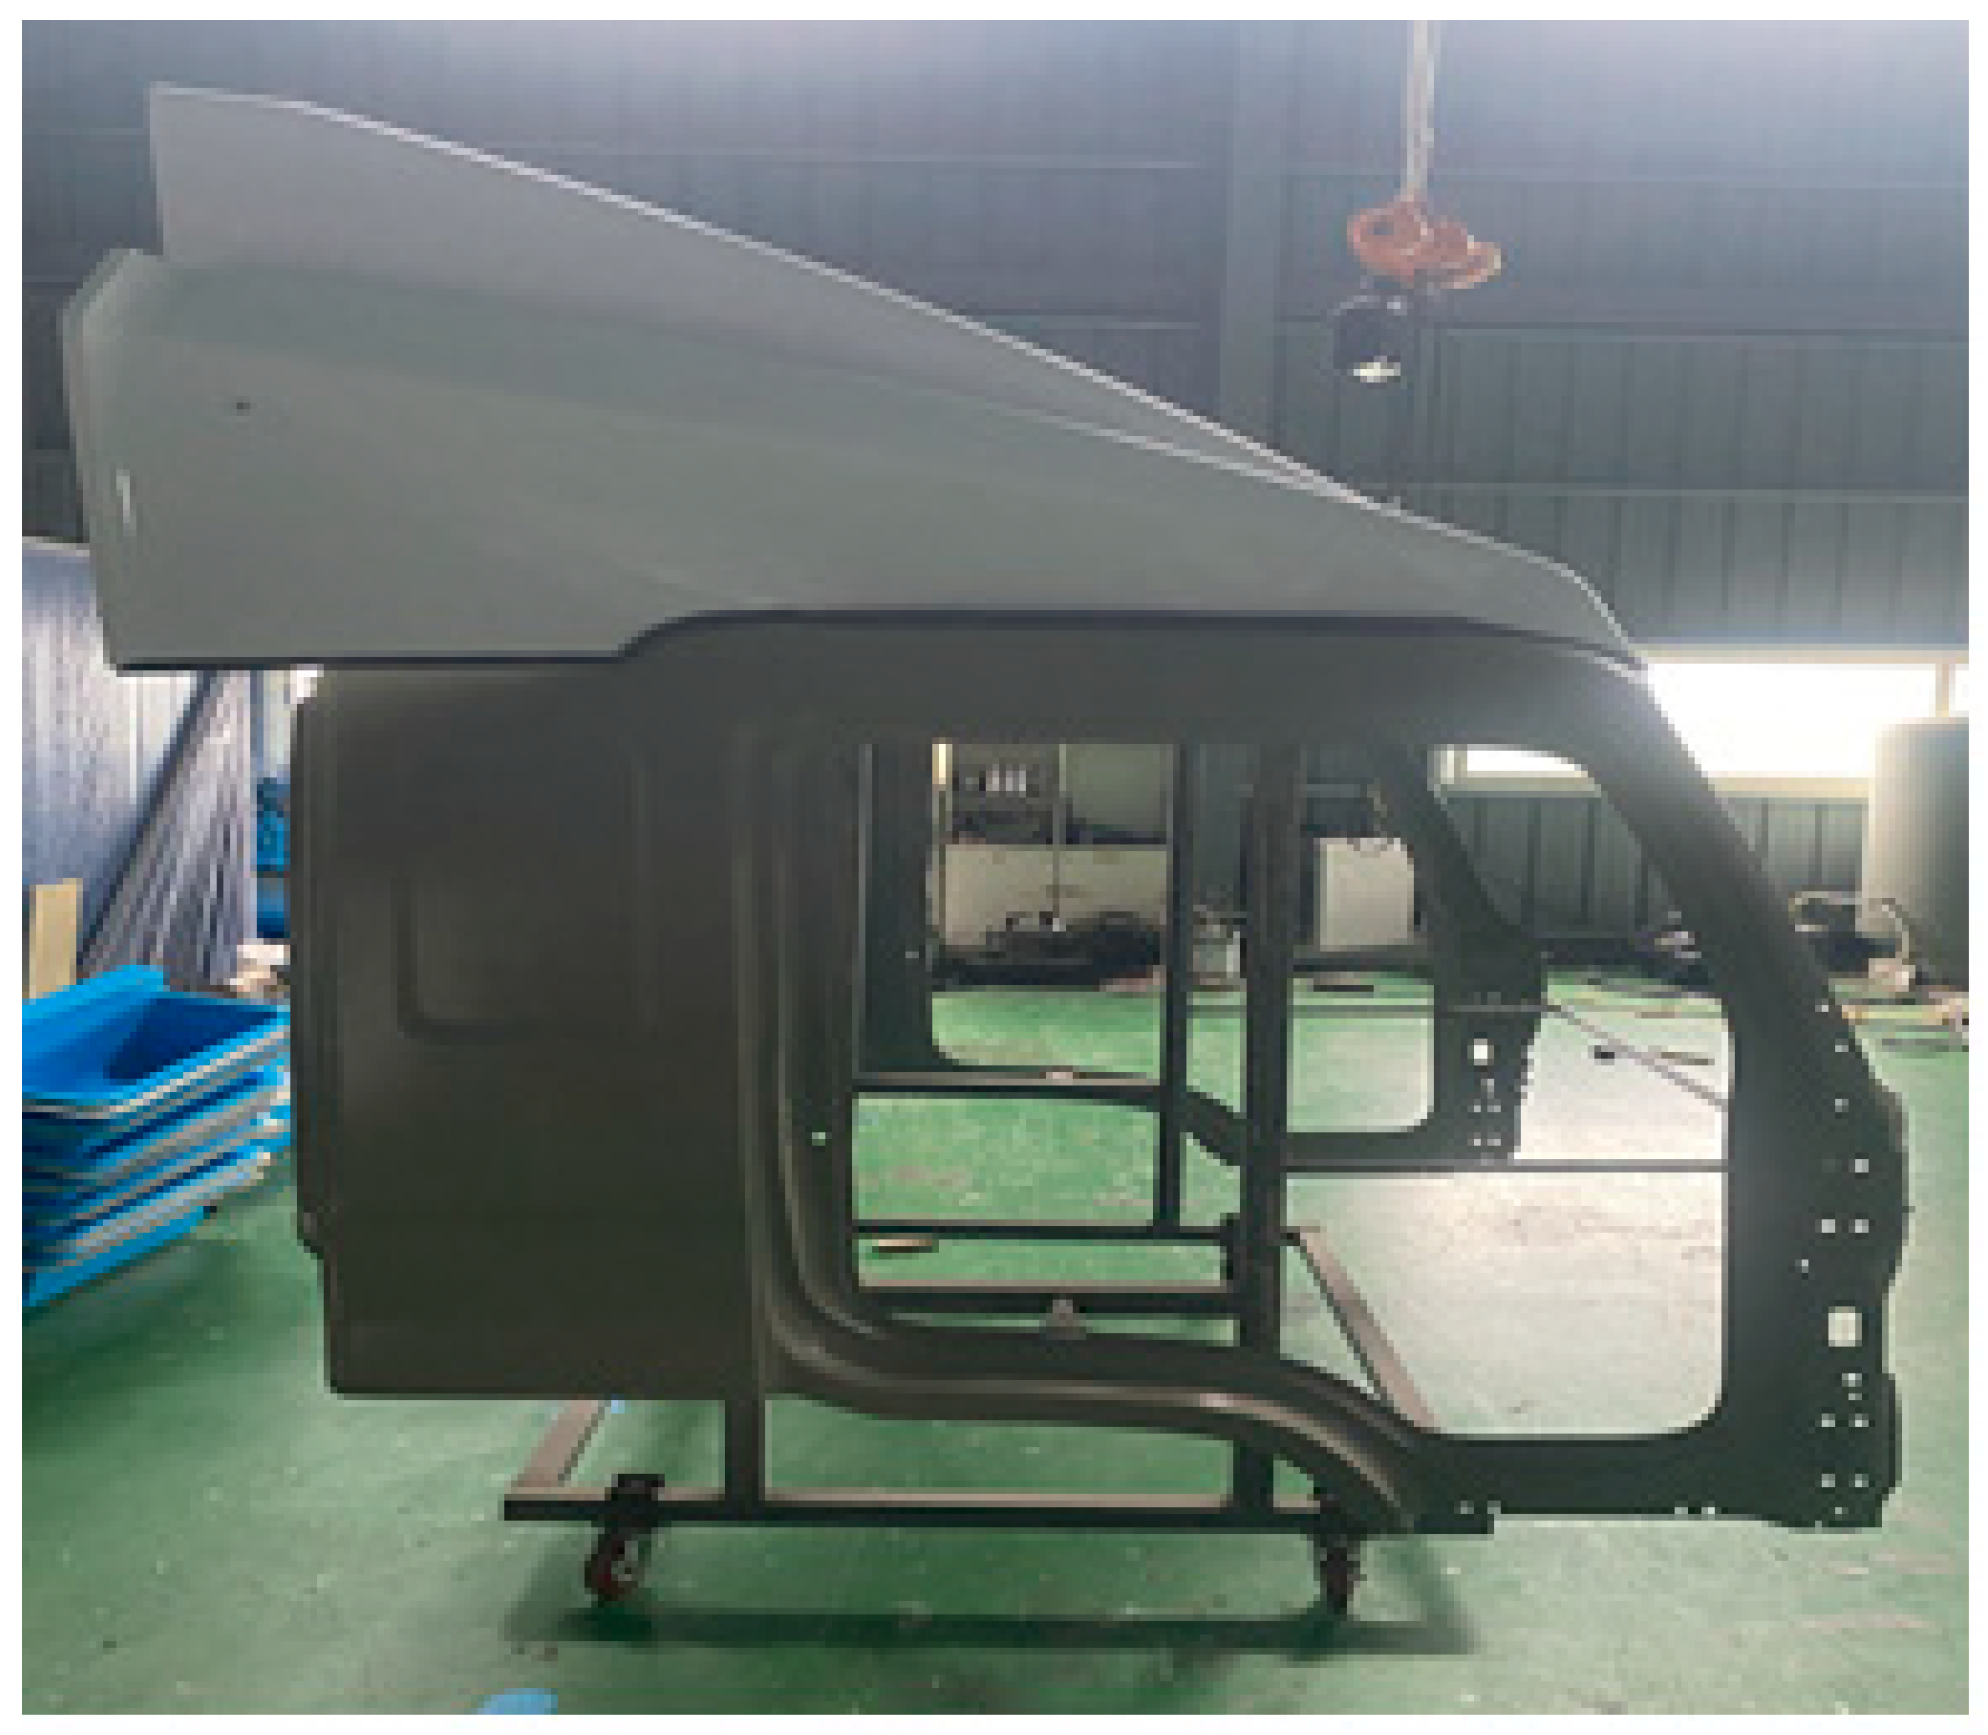
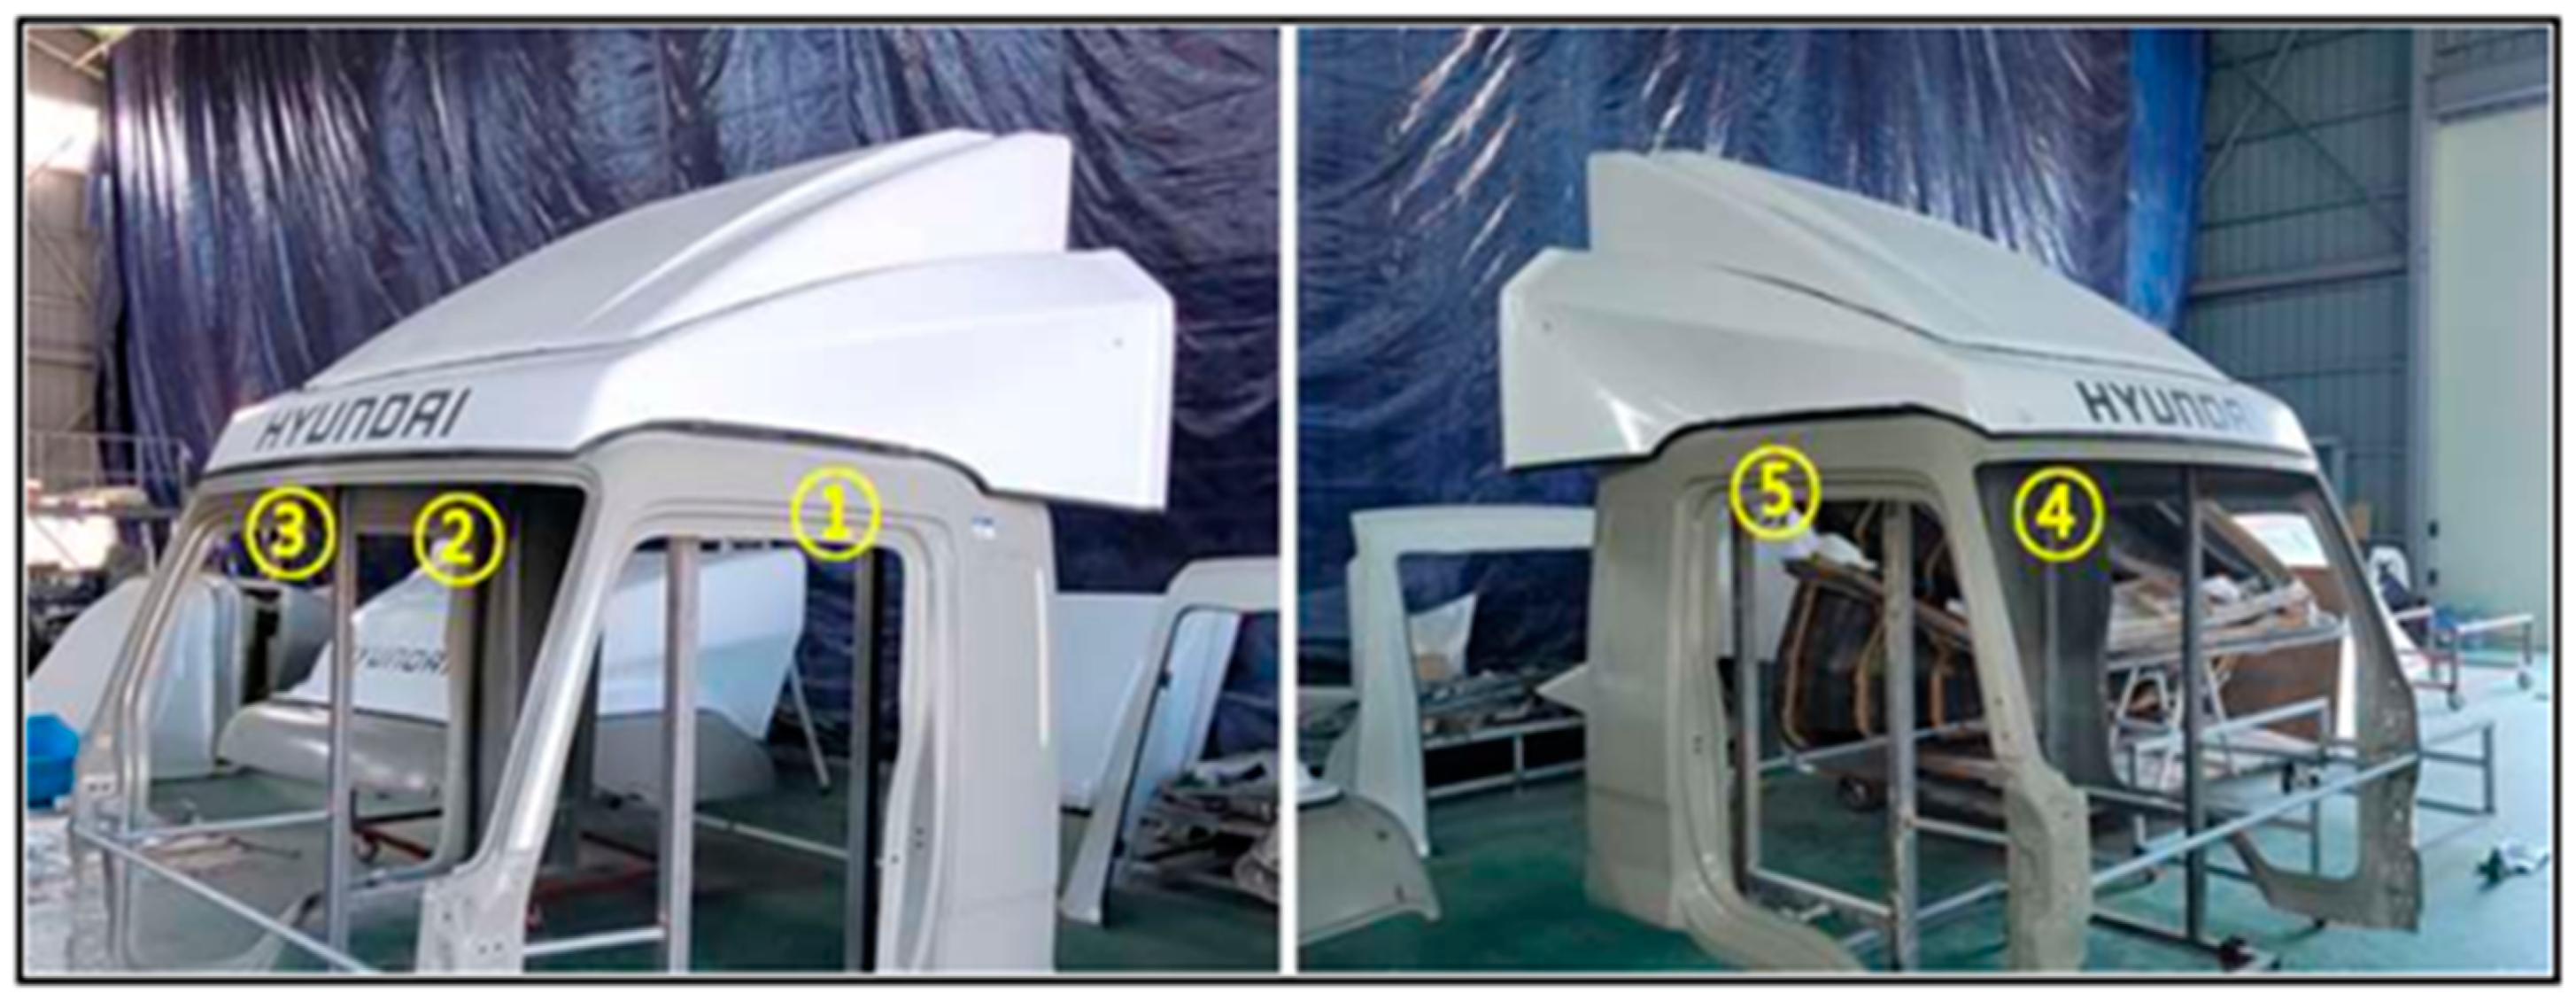
The newly designed fairing was reviewed for its mounting possibility with the existing vehicle. After combining the developed fairing, the tolerance was investigated. After mounting on the actual vehicle, the tolerance of five points was investigated. As a result of the tolerance test, a tolerance of ±5 mm was confirmed. Table 8 shows the result of the tolerance test. Figure 16 shows the process of the tolerance test. Figure 17 shows the measurement point for the tolerance test. The number of 1, 5 are measurement point of side part. The number of 2, 3, 4 are measurement point of upper part.
7. Conclusions
In this study, structural design and analysis was performed for 3.5-ton commercial vehicles equipped with a fairing, and the following conclusion was drawn: The load case 2 condition, which is the highest driving speed (130 km/h) of commercial vehicles and gust condition (72 km/h), was set as the maximum load condition for the fairing. The mass was lightened by 10% or more than the required target one by applying the variable thickness sandwich composite design method. The total mass was examined to be 20.534 kg. As a result of performing structural analysis on the fairing, by which the final structural design was decided, the safety factor was derived as 3.04, and it was confirmed to be safe under the maximum load condition.
The composite fairing design method was suggested through the composite material design and manufacturing techniques performed in this study. The spread of the lightweight fairing design method, verified by performing this study, could contribute to improving the fuel efficiency of various commercial vehicles.
Author Contributions
Y.L. Conceptualization and writing—original draft preparation. H.P. Writing—review and editing and work guidance. All authors have read and agreed to the published version of the manuscript.
Funding
This research was supported by Korea Institute for Advancement of Technology (KIAT) grant funded by the Korea Government (MOTIE) (P0012769, The Competency Development Program for Industry Specialist). This research was supported by Basic Science Research Program through the National Research Foundation of Korea (NRF) funded by the Ministry of Education (No. 2018R1D1A1B07043553).
Institutional Review Board Statement
Not applicable.
Informed Consent Statement
Not applicable.
Data Availability Statement
The data presented in this study are available on reasonable request from the corresponding author.
Acknowledgments
The authors would like to thank Changduk Kong.
Conflicts of Interest
The authors declare no conflict of interest.
Abbreviations
| flow function | |
| U | velocity |
| V | a velocity value used in the Bernoulli equation |
| x | length of fairing |
| y | height of fairing |
| a | length from the ellipse’s nose to the origin |
| Re | Reynold’s number |
| ρ | density |
| μ | viscosity coefficients of air |
| Mmax | bending moment |
| Smin | allowable section modulus |
| σall | allowable stress |
| I1 | moment of inertia about glass fiber |
| I2 | moment of inertia about polyurethane |
References
- Kim, C.; Cha, J. A numerical study on an aerodynamic effect of a roof fairing system of a heavy duty truck. Korean Soc. Automot. Eng. 2002, 3, 1499–1505. [Google Scholar]
- Wood, R.M. A discussion of a heavy truck advanced aerodynamic trailer system. In International Symposium on Heavy Vehicle Weights and Dimensions, 9th ed.; Pennsylvania Transportation Institute: University Park, PA, USA, 2006. [Google Scholar]
- Pereira, C.; Morton, M.; Martin, C.; Schellekens, G. Drag reduction optimization of a day cab roof fairing-design and validation. SAE Tech. Pap. 2015, 1, 2892. [Google Scholar]
- Gilhaus, A. The influence of cab shape on air drag of trucks. J. Wind. Eng. Ind. Aerodyn. 1981, 9, 77–87. [Google Scholar] [CrossRef]
- Kim, C. An effect of roof fairing and deflector system on the reduction of aerodynamic drag of a heavy duty truck. Korean Soc. Automot. Eng. 2006, 14, 194–201. [Google Scholar]
- Kim, J.; Lee, S.; Kim, M.; You, D.; Lee, S. Salient drag reduction of a heavy vehicle using modified cab-roof fairing. J. Wind. Eng. Ind. Aerodyn. 2017, 164, 138–151. [Google Scholar] [CrossRef]
- Lee, E.; Hwang, B.; Kim, J.; Lee, S. Wind tunnel study on drag reduction of 5 ton truck using additive devices. J. Korean Soc. Vis. 2015, 13, 9–14. [Google Scholar]
- Choi, H.; Lee, J.; Park, H. Aerodynamic of heavy vehicles. Annu. Rev. Fluid Mech. 2014, 46, 441–468. [Google Scholar] [CrossRef]
- Libove, C.; Lu, C. Beam like bending of variable-thickness sandwich plates. Am. Inst. Aeronaut. Astronaut. 1988, 4, 500–507. [Google Scholar] [CrossRef]
- Park, C.; Park, G.; Lee, W. Optimal design of the shape of variable sandwich structures. J. Korean Soc. Mech. 1993, 17, 2162–2171. [Google Scholar]
- Hyundai Motors. 3.5 t Mighty. Available online: www-truckbus.hyundai.com (accessed on 1 March 2022).
- Jo, E. A study on the gust with thunderstorm in honam area. J. Chosun Nat. Sci. 2009, 2, 101–130. [Google Scholar]
- Brice, R. Fluid mechanics. Wiley 2011, 7, 369–372. [Google Scholar]
- Sim, D. Development of Induced Drag Reduction Device for an Aerodynamic Drag Reduction of a Heavy Duty Truck. Master’s Thesis, Seoul National University of Science and Technology, Seoul, Republic of Korea, 2015. [Google Scholar]
- Lee, H. A Study on Design of Small Vertical Axis Wind Turbine System with High Efficiency and Low Noise. Ph.D. Thesis, Chosun University, Gwangju, Republic of Korea, 2015. [Google Scholar]
- James, M. Mechanics of materials. Thomson Learn. 2001, 5, 417–427. [Google Scholar]
- Bang, J. A Study on the Design and Analysis of High-Efficiency and Light-Weight Design of Small Wind Power Generation System. Ph.D. Thesis, Chosun University, Gwangju, Republic of Korea, 2004. [Google Scholar]
- Ansys. Ansys User’s Manual Version 17.2; Ansys Inc.: Canonsburg, PA, USA, 2016. [Google Scholar]
Figure 1.
3D view of conceptual aerodynamic configuration.

Figure 2.
Superposition of source flow and uniform flow.

Figure 3.
Flow of the Rankine half body.

Figure 4.
3D modelling result for CFD analysis.

Figure 5.
The result of CFD analysis.

Figure 6.
The aerodynamic design result of the final 3D fairing.

Figure 7.
The definition of inlet and outlet for analysis.

Figure 8.
The pressure distribution of CFD analysis.

Figure 9.
The shape of sandwich structures.

Figure 10.
Finite element model of faring.

Figure 11.
The result of stress analysis about 0° direction.

Figure 12.
The result of buckling analysis.

Figure 13.
The lamination process of glass fiber.

Figure 14.
The resin transfer process.

Figure 15.
The manufactured fairing.

Figure 16.
The process of tolerance test.

Figure 17.
The measurement point for the tolerance test.


Table 1.
Specification of target vehicle.
| Specification | Value | |
|---|---|---|
| Overall length | 6735 mm | |
| Overall width | 2230 mm | |
| Overall height | 3180 mm | |
| Container size | Length | 5100 mm |
| Width | 2280 mm | |
| Height | 2200 mm | |
| Wheel base | 3850 mm | |
| Cab roof area size | Length | 1350 mm |
| Width | 1410 mm | |
| Height | 870 mm | |
Table 2.
Design requirements.
| Specification | Value |
|---|---|
| Target drag coefficient reduce | 19%↑ |
| Structural safety assessment | Maximum velocity: 130 km/h Average velocity: 80 km/h Gust speed: 72 km/h |
| Fairing size | Length: 1350 mm Width: 1810 mm Height: 870 mm |
Table 3.
Load case for structural design.
| Load Case | Case I | Case II |
|---|---|---|
| Gust condition | With gust | With gust |
| Wind speed | 72 km/h | 72 km/h |
| Vehicle speed | 90 km/h | 130 km/h |
| Total speed | 162 km/h | 202 km/h |
Table 4.
Boundary condition for CFD analysis.
| Specification | Value | |
|---|---|---|
| Inlet | V = 80 km/h | |
| Outlet | Pt = 1 atm, Tt = 25 °C | |
| Opening | Gauge Pressure = 0 (Pa) | |
| Working fluid | Air ideal gas | |
| Turbulence model | Shear stress transport | |
| Heat transfer | Total energy model | |
| Wall | Truck | No slip wall |
| Fairing | No slip wall | |
| Bottom | No slip wall | |
Table 5.
Drag coefficient data.
| Fairing | NO | 2D | 3D | (%) | |
|---|---|---|---|---|---|
| Drag Coefficient | 2D | 3D | |||
| Fluent | 0.523 | 0.423 | 0.417 | 19 | 20.1 |
Table 6.
Mechanical properties of materials used in the present fairing design [17].
Table 6.
Mechanical properties of materials used in the present fairing design [17].
| Item | Face Skin [Glass/Epoxy Fabric] | Core [Polyurethane] |
|---|---|---|
| E1 (Elastic modulus of x axis) | 10,500 MPa | 60.86 MPa |
| E2 (Elastic modulus of y axis) | 10,500 MPa | 59.86 MPa |
| G12 (Shear modulus) | 1450 MPa | 19.18 MPa |
| ν (Poisson’s ratio) | 0.27 | 0.2 |
| Xt (Tensile strength of x axis) | 283.9 MPa | 2.63 MPa |
| Xc (Compressive strength of x axis) | 184.6 MPa | 1.41 MPa |
| Yt (Tensile strength of y axis) | 283.9 MPa | 2.49 MPa |
| Yc (Compressive strength of y axis) | 184.6 MPa | 1.41 MPa |
| S1 (Shear strength of x axis) | 15.0 | 0.71 |
| S2 (Shear strength of y axis) | 1.705 | 0.1197 |
| Thickness | 0.25 mm | 19.78 mm |
| Density | 1800 kg/m3 | 50 kg/m3 |
Table 7.
Structural analysis result.
| Ply | Stress of 0° Direction | Margin of Safety of 0° Direction | Stress of 90° Direction | Margin of Safety of 90° Direction |
|---|---|---|---|---|
| 1(GFRP) | 34.38 | 5.37 | 61.11 | 3.02 |
| 2(GFRP) | 34.43 | 5.36 | 60.39 | 3.06 |
| 3(GFRP) | 34.48 | 5.35 | 59.68 | 3.09 |
| 4(GFRP) | 34.53 | 5.35 | 58.96 | 3.13 |
| 5(GFRP) | 34.58 | 5.34 | 58.25 | 3.17 |
| 6(Core) | 0.198 | 7.13 | 0.31 | 4.55 |
| 7(GFRP) | 38.65 | 4.78 | 34.37 | 5.37 |
| 8(GFRP) | 38.70 | 4.77 | 34.76 | 5.31 |
| 9(GFRP) | 38.75 | 4.76 | 35.15 | 5.25 |
| 10(GFRP) | 38.80 | 4.76 | 35.54 | 5.19 |
| 11(GFRP) | 38.85 | 4.75 | 35.93 | 5.14 |
Table 8.
Tolerance test.
| P1 | P2 | P3 | P4 | P5 |
|---|---|---|---|---|
| 2.3 mm | 0.5 mm | 0.5 mm | 1.0 mm | 1.5 mm |
Disclaimer/Publisher’s Note: The statements, opinions and data contained in all publications are solely those of the individual author(s) and contributor(s) and not of MDPI and/or the editor(s). MDPI and/or the editor(s) disclaim responsibility for any injury to people or property resulting from any ideas, methods, instructions or products referred to in the content. |
© 2023 by the authors. Licensee MDPI, Basel, Switzerland. This article is an open access article distributed under the terms and conditions of the Creative Commons Attribution (CC BY) license (https://creativecommons.org/licenses/by/4.0/).
Share and Cite
MDPI and ACS Style
Lee, Y.; Park, H. A Study on Aerodynamic and Structural Design of Fairing Using Glass Fabric Composite Structure. Appl. Sci. 2023, 13, 3765. https://doi.org/10.3390/app13063765
AMA Style
Lee Y, Park H. A Study on Aerodynamic and Structural Design of Fairing Using Glass Fabric Composite Structure. Applied Sciences. 2023; 13(6):3765. https://doi.org/10.3390/app13063765
Chicago/Turabian StyleLee, Younggyu, and Hyunbum Park. 2023. "A Study on Aerodynamic and Structural Design of Fairing Using Glass Fabric Composite Structure" Applied Sciences 13, no. 6: 3765. https://doi.org/10.3390/app13063765
Note that from the first issue of 2016, this journal uses article numbers instead of page numbers. See further details here.