Article

Examination of the Effect of Cooling Rate after Extrusion to Formability of 6061 Automotive Profiles

by
Athanasios Vazdirvanidis
1,*,
Sofia Papadopoulou
1,
Grigoris Symeonidis
2,
Fivos Aslanis
1,
Andreas Rikos
1 and
Eva Stachouli
1
1
ELKEME Hellenic Research Centre for Metals S.A., 61st km Athens–Lamia National Road, 32011 Oinofyta, Greece
2
ETEM-GESTAMP Extrusion Company, Bul. “Iliyantsi” 119, 1220 Sofia, Bulgaria
*
Author to whom correspondence should be addressed.
Appl. Sci. 2023, 13(6), 3763; https://doi.org/10.3390/app13063763
Submission received: 22 February 2023 / Revised: 6 March 2023 / Accepted: 10 March 2023 / Published: 15 March 2023
(This article belongs to the Special Issue Alloys: Evolution of Microstructure and Texture)

Abstract

:
As part of the present project, an inquiry is being conducted into the impact of the cooling rate subsequent to extrusion on both the mechanical characteristics and microstructure of 6061 alloy extruded profiles tailored for application in the automotive industry. Water quenching, air cooling, and step-cooling (combination of air cooling and water quenching) were performed after a solution heat treatment for simulating different cooling processes on the exit of the extrusion press. Microstructure examination was performed after artificial aging for every cooling method accompanied by three-point bending and tensile testing for investigation of differences in formability characteristics in each one of the three cases. Electron fractography, texture, and grain boundary misorientation analysis consisted the main analytical techniques, allowing the correlation between grains orientation resulting from the extrusion process with cracking initiation behavior in mechanical testing and for the determination of the regions which were more prone to cracking. From the examination, the positive role of rapid cooling for improved formability was highlighted. Through the grain boundary misorientation analysis and the formation of Taylor factor maps, it was shown that crack initiation preferably took place at subsurface regions even though “roughening” of the bent surface was obvious and expected to lead to crack initiation in the more ductile samples. Considerable amounts of LAGBs (Low Angle Grain Boundaries) (14.7%) and SGBs (Subgrain Boundaries) (4.5%) were detected in the sample which was subjected to step cooling accompanied by an outer and inner surface layers (surface zone) of 200–250 μm thicknesses exhibiting different orientations. The results of this project will be used for optimization of the automotive extruded profiles production process, ensuring improved mechanical performance and resistance to premature fracture.

1. Introduction

The mechanical attributes of extruded profiles are subject to modification, among other factors, by the cooling rate implemented after extrusion. This is due to the fact that the process significantly influences the concentration of alloying elements, such as silicon and magnesium, which remain in a solid-state solution. This amount will be later available for precipitation hardening through Mg2Si formation in the subsequent artificial aging process [1,2,3]. The metallurgical condition of profiles affects the formability, and currently, a lot of investigations have been carried out in order to discover the most appropriate thermal processing for achieving the desirable combination of strength and ductility as this is manifested by tensile, compression, and three-point bend testing [4,5,6]. This happens, because as the strength of the material is increased and the metallurgical condition reaches the T6 condition the ductility is decreased. Fracture toughness does not follow a specific trend, as this property consists of a combination of strength and ductility. In terms of phase transformations during aging, two processes occurring simultaneously affect seriously the mechanical properties. One effect, identified in the literature [7,8,9], involves the formation of precipitate-free zones (PFZs) at the boundaries of grains. This occurrence has the potential to result in a lack of coherence between grains, which can be consequential under the application of tensile stresses. In order to assess the mechanical characteristics of samples, the application of tensile stresses is executed by means of a three-point bending test, which acts upon the outer bent surface of specimens. The PFZs constitute weak regions inside a matrix of higher strength (intragranular areas), since they lean on alloying elements and no precipitation hardening occurs. The reduction in ductility can be attributed to a second factor, namely the occurrence of grain boundary precipitation. This phenomenon is notably accentuated, when precipitates achieve a thermodynamically stable and non-coherent β-phase state. In this scenario, they act as stress concentrators, similar to coarser AlFeSi intermetallic particles that are widely disseminated throughout the matrix [10,11,12]. This process of precipitation is highly effective in diminishing ductility, as it serves to exacerbate the concentration of stress at specific sites within the material. These phase transformations are well explained by the mechanism of rapid vacancies diffusion at high temperature annealing and vacancies-depleted zones formation.
With regard to the outcomes of three-point bending tests, it has been demonstrated that the inception of macroscopic cracking transpires primarily on the outer bent surface and that ultimate fracture results from a sequence of mechanisms. Such mechanisms include the development of shear bands in intragranular locations, the rotation and decohesion of grain boundaries, and the amplification of the number of grain boundary decohesion sites, culminating in the final failure of the sample. This is assisted by coalescence of voids formed and extended among coarse intermetallic particles and grain boundaries precipitation [12]. In another work, it has been shown that the load direction is important and transverse testing can reveal differences in formability more easily than longitudinal tests [13,14].
Texture analysis has emerged as a pivotal tool in the investigation of fracture performance of extruded profiles, with software packages providing a range of options for identifying sites that are susceptible to crack initiation. Among the available methods, Taylor factor maps have been proven to be highly informative in portraying this tendency, with the frequency and location of interfaces characterized by high Taylor factor values being indicative of the bending performance of a material. The work of Inoue [15] has previously demonstrated the utility of such maps in this context. Furthermore, electron backscatter diffraction (EBSD) enables precise mean grain size analysis in aluminum alloys, providing a notable advantage over optical microscopy, particularly with respect to the identification of fine grains [16,17]. Other valuable techniques for fracture-analysis-related projects include the calculation of recrystallization amounts and mapping of grain boundary angle misorientation, as evidenced in the existing literature [18,19,20,21,22,23,24]. Extruded profiles are frequently characterized by a high degree of texturing, with the nature and intensity of this texturing varying depending on the specific alloy employed [25,26,27,28,29,30,31]. Notably, disparities can be observed between the surface texture and that of the material’s mid-thickness. In order to better understand and evaluate these variations, the application of inverse pole figure (IPF) plots has proven to be an invaluable analytical tool. Through the utilization of such techniques, it is possible to discern the presence of both single and double fiber textures, which can arise as a direct result of the hot extrusion process. The surface texture is affected by a high amount of shear deformation and temperatures higher than 580 °C in the extrusion die. The recrystallization percentage varies among the alloys based upon the presence of grain inhibitors, and it can be also different in different areas of the same profile. With regard to automotive alloys, studies have demonstrated that deformation texture on the surface zones of extruded profiles is conducive to the formation of shear bands, whereas random texture is associated with delayed fracture initiation. Additionally, the size and distribution of constituent particles on the free surface of bent specimens have been shown to significantly influence bending performance, as reported in previous investigations [18,19]. The study conducted by Vazdirvanidis et al. [13] has highlighted the valuable contribution of finite element analysis (FEM) in elucidating the results of three-point bend and tensile tests. Specifically, the FEM approach enables the visualization of the stress fields that emerge between intermetallic particles and the surrounding aluminum matrix, which in turn act as stress raisers depending on their morphology. According to the findings, globular particles can function as constant stress raiser points, irrespective of the loading direction, while non-equiaxed particles exhibit a higher sensitivity to the direction of the applied load. In the current research, the focus has been given to the comparison of the texture and the grain boundary misorientation between the surface zone and the mid-thickness areas (core) and to the correlation of precipitation potential with grain boundaries misorientation. In this aspect, the boundaries are divided to three different categories, i.e., high-angle grain boundaries (HAGBs, >15 degrees), low-angle grain boundaries (LAGBs, 5–15 degrees), and sub-grain boundaries (SGBs, 2–5 degrees). HAGBs have not been further categorized, but this will be performed in future work.

2. Materials and Methods

2.1. Materials Production

6061 alloy extruded profiles were provided by ETEM-GESTAMP Bulgaria S.A. (see a typical chemical composition in Table 1). The samples were subjected to solid-solution heat treatment for 20 min at 570 °C and were then cooled down by three different processes: (i) water quenching (WQ); (ii) air cooling (AC); and (iii) step cooling including air cooling from 570 to 420 °C and then water quenching (SC). The samples were naturally aged for 24 h and were then artificially aged at 210 °C for 3 h.

2.2. Microstructure Characterization

A comprehensive analysis of the fracture surfaces of the bent areas from three-point bending tests was conducted utilizing advanced microscopy techniques. The macroscopic examination was performed using a Nikon SMZ 1500 stereo-microscope (Nikon, Tokyo, Japan), while a Nikon Epiphot 300 (Nikon, Tokyo, Japan) inverted metallographic microscope equipped with Image Pro Plus software was utilized for optical microscopy examination. The samples were initially assessed in the as-polished state to identify the location and morphology of the cracks resulting from the bending test, followed by polarized light illumination after Barker’s electrolytic etch to reveal the grain structure. In-depth microscopic and fractographic observations were conducted using a JEOL IT-800 HL scanning electron microscope (SEM) (JEOL Ltd., Tokyo, Japan). To obtain information on the crystallographic orientation of the samples, electron backscatter diffraction (EBSD) analysis was performed on transverse to extrusion direction sections using an EDAX Hikari XP camera (AMETEK BV, Berwyn, PA, USA).

2.3. Mechanical Testing

Three-point bending tests were carried out under ambient temperature conditions, with a flexure extension of 25 mm using an Instron 5567 30 kN electromechanical testing machine (Instron, Norwood, MA, USA), where early cracking was observed in the AC sample. The tensile tests were performed according to ISO 6892 standard using a Zwick Z100 (Zwick, Ulm, Germany) at a constant speed of 10 mm/min. Tensile specimens were extracted from the original aluminum profile and tested parallel to the extrusion direction.

3. Results

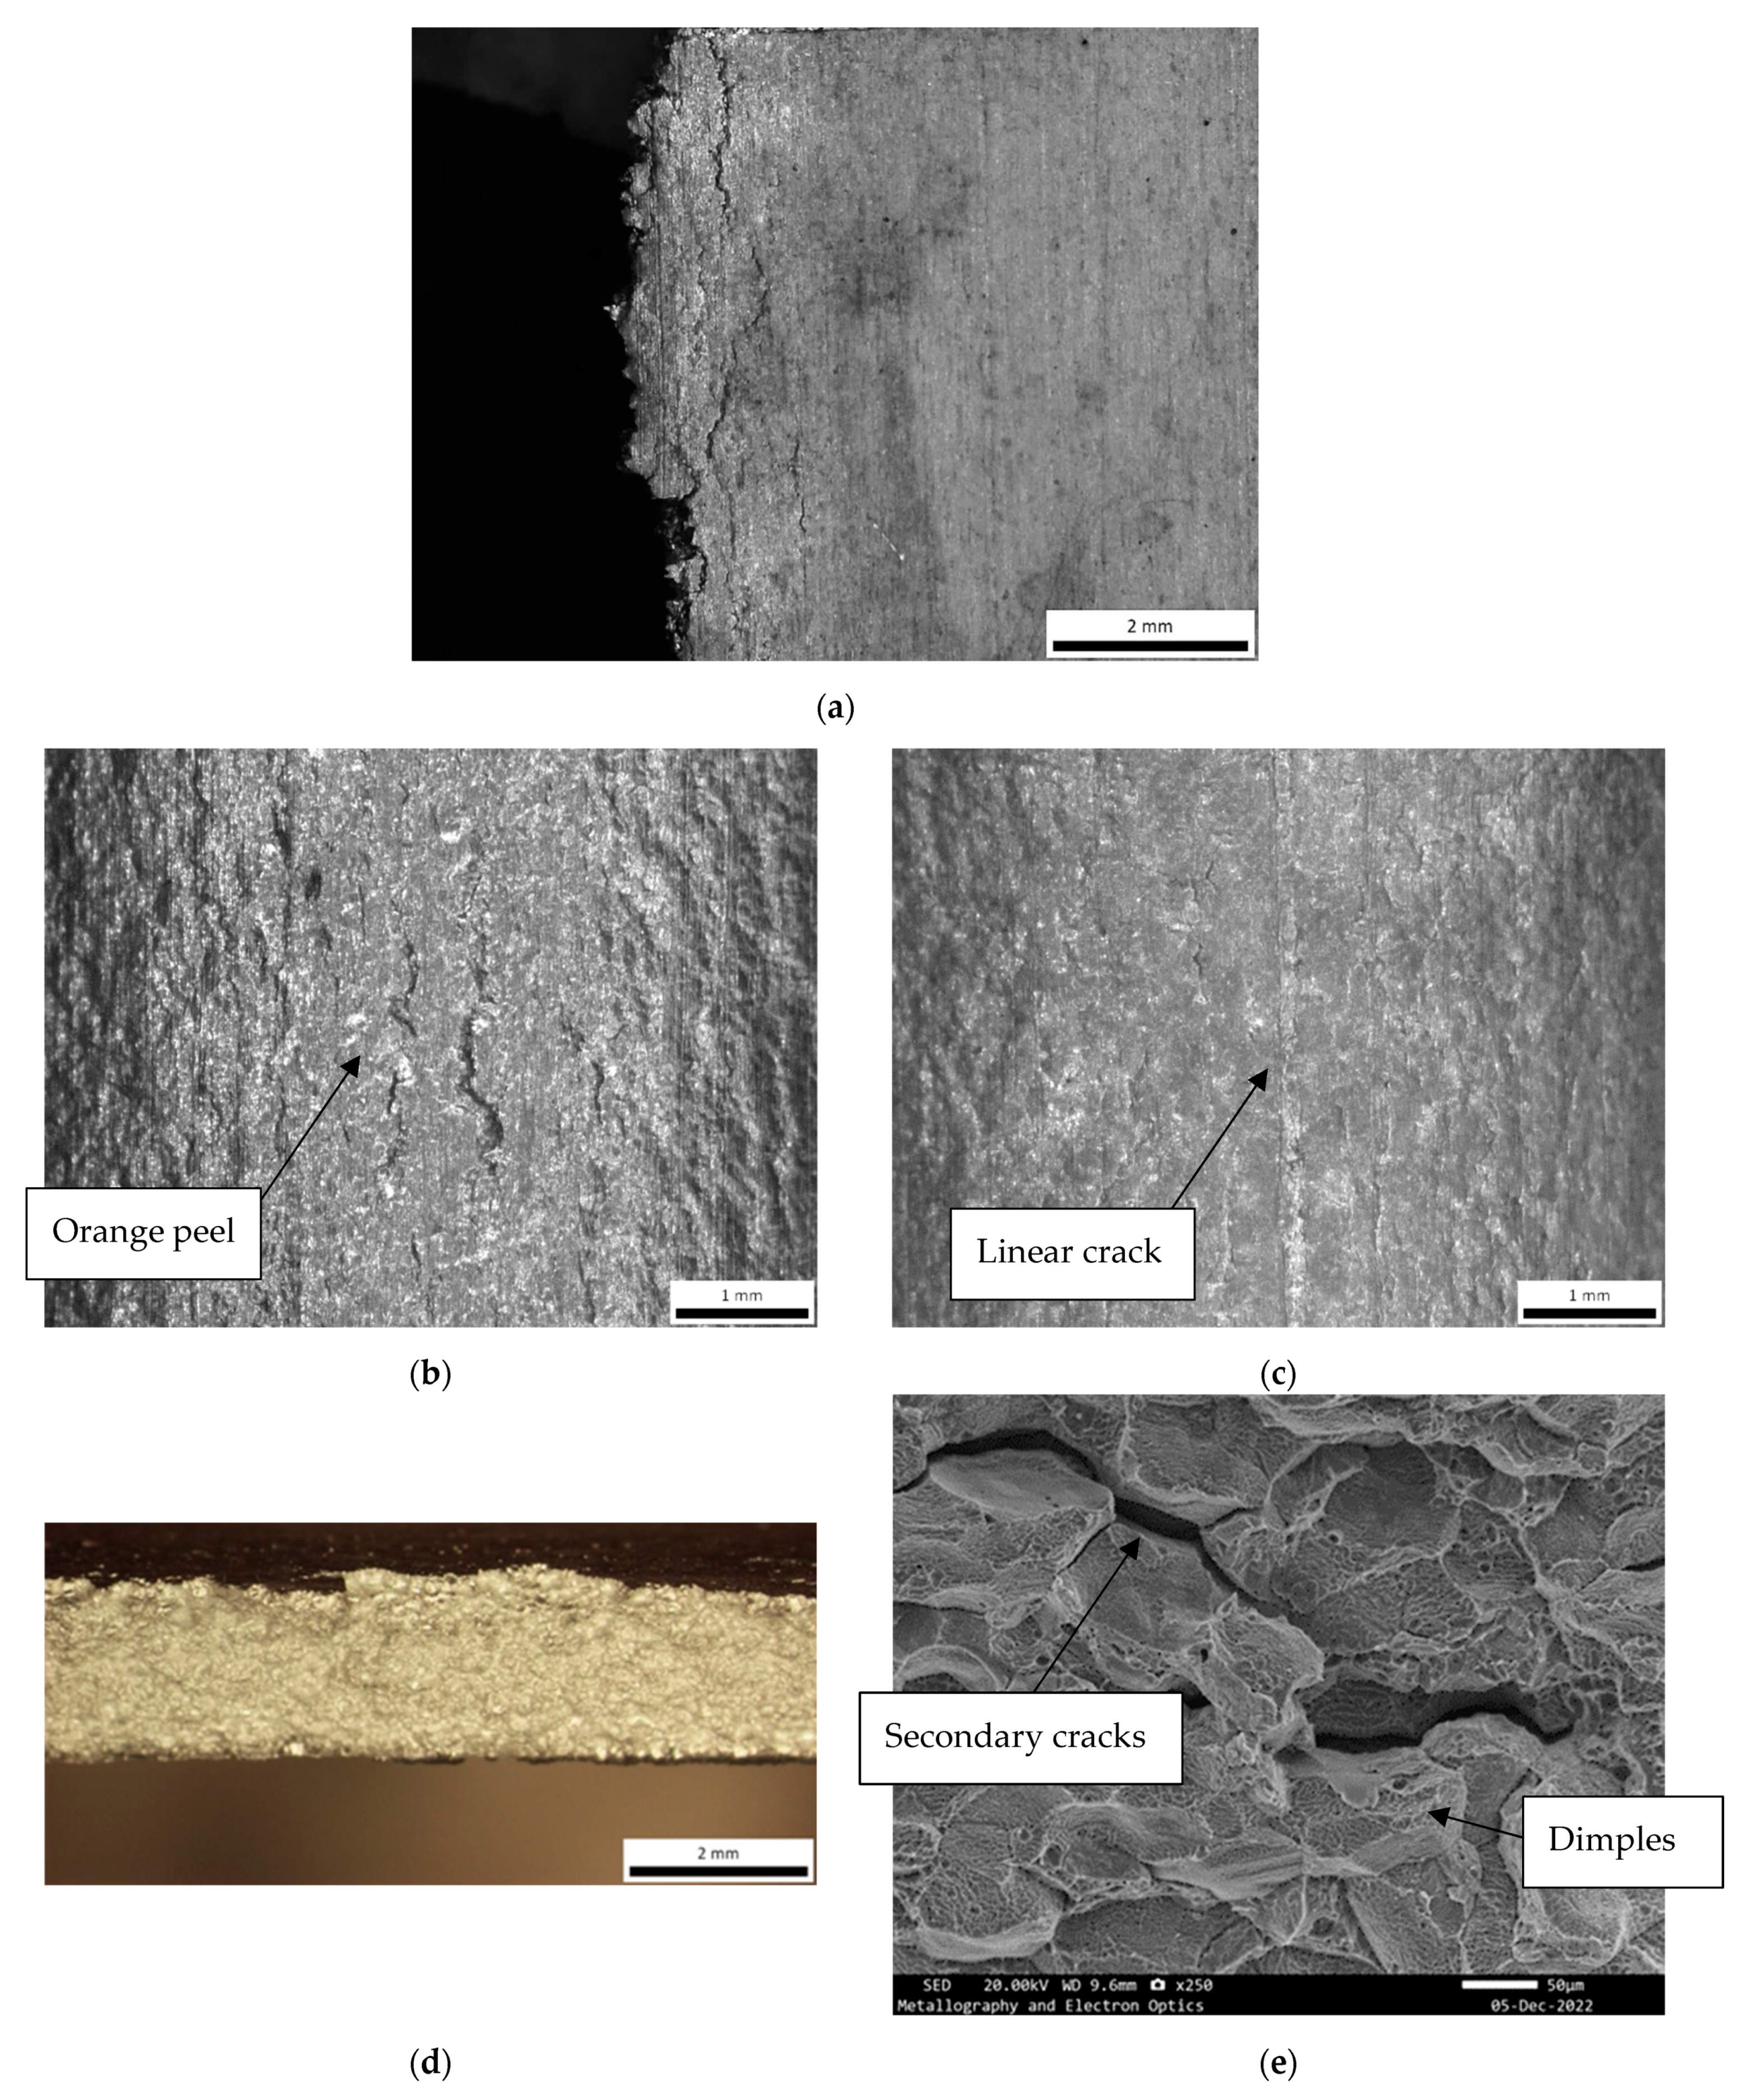
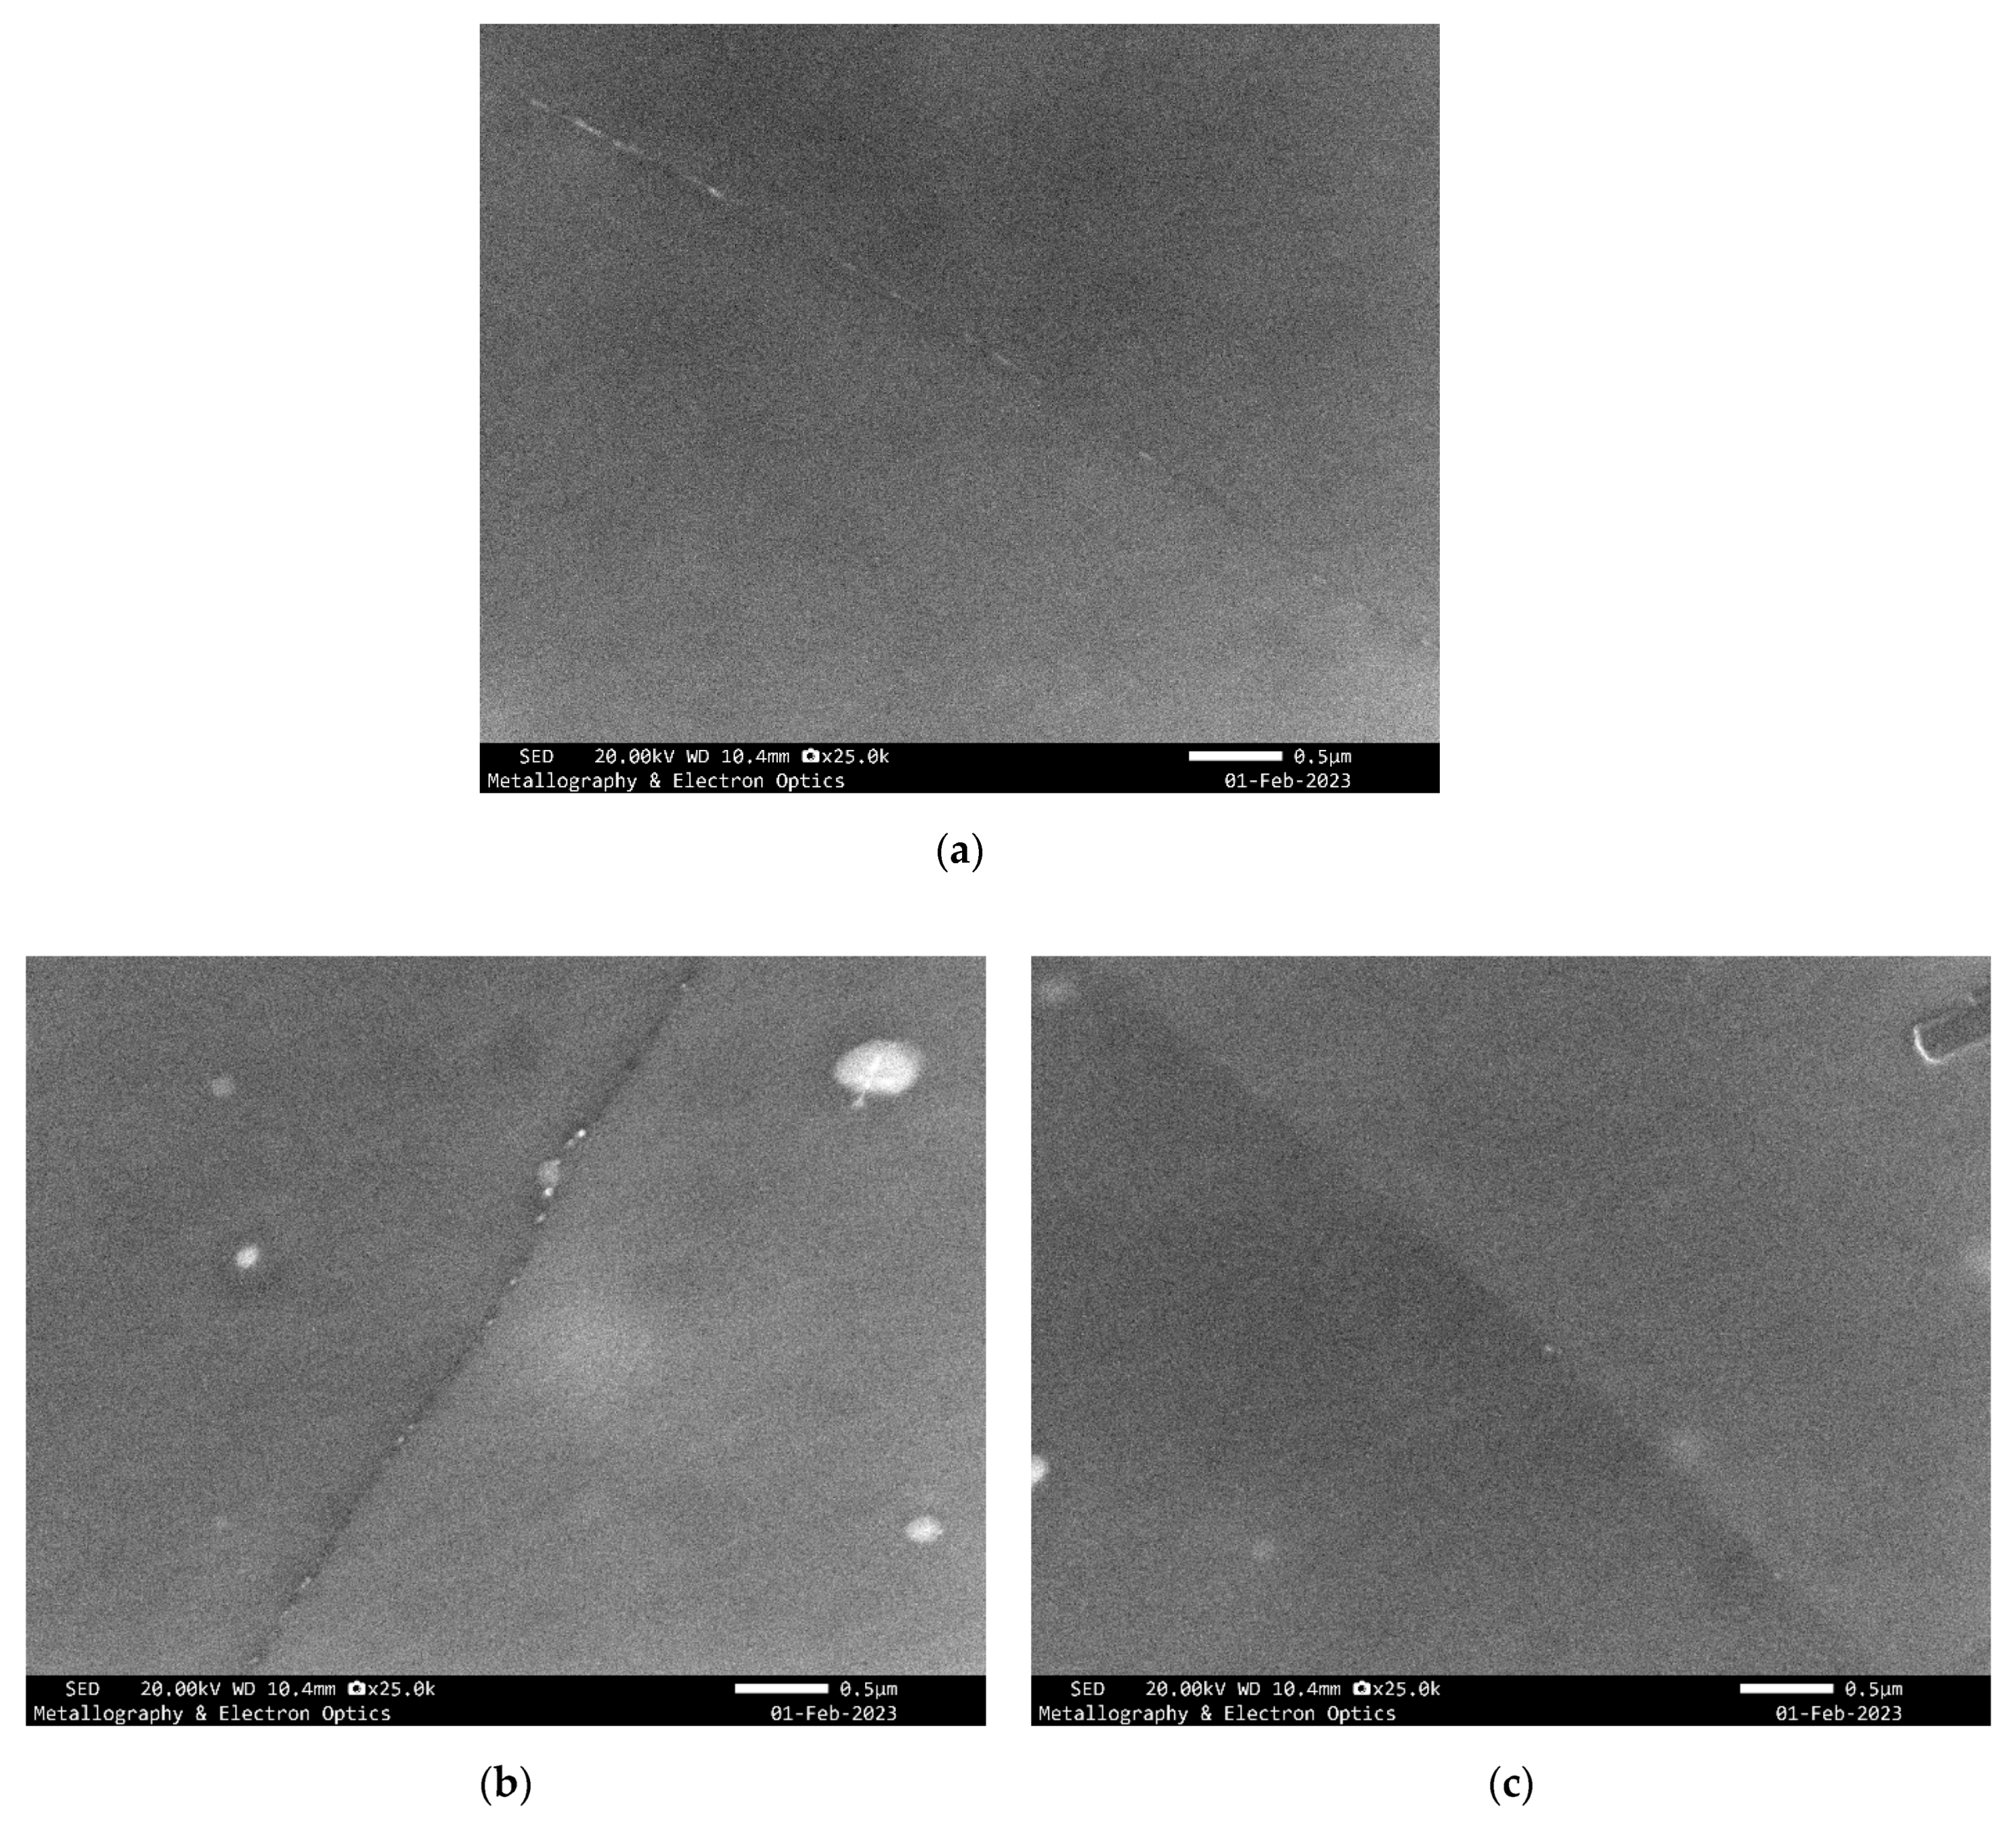
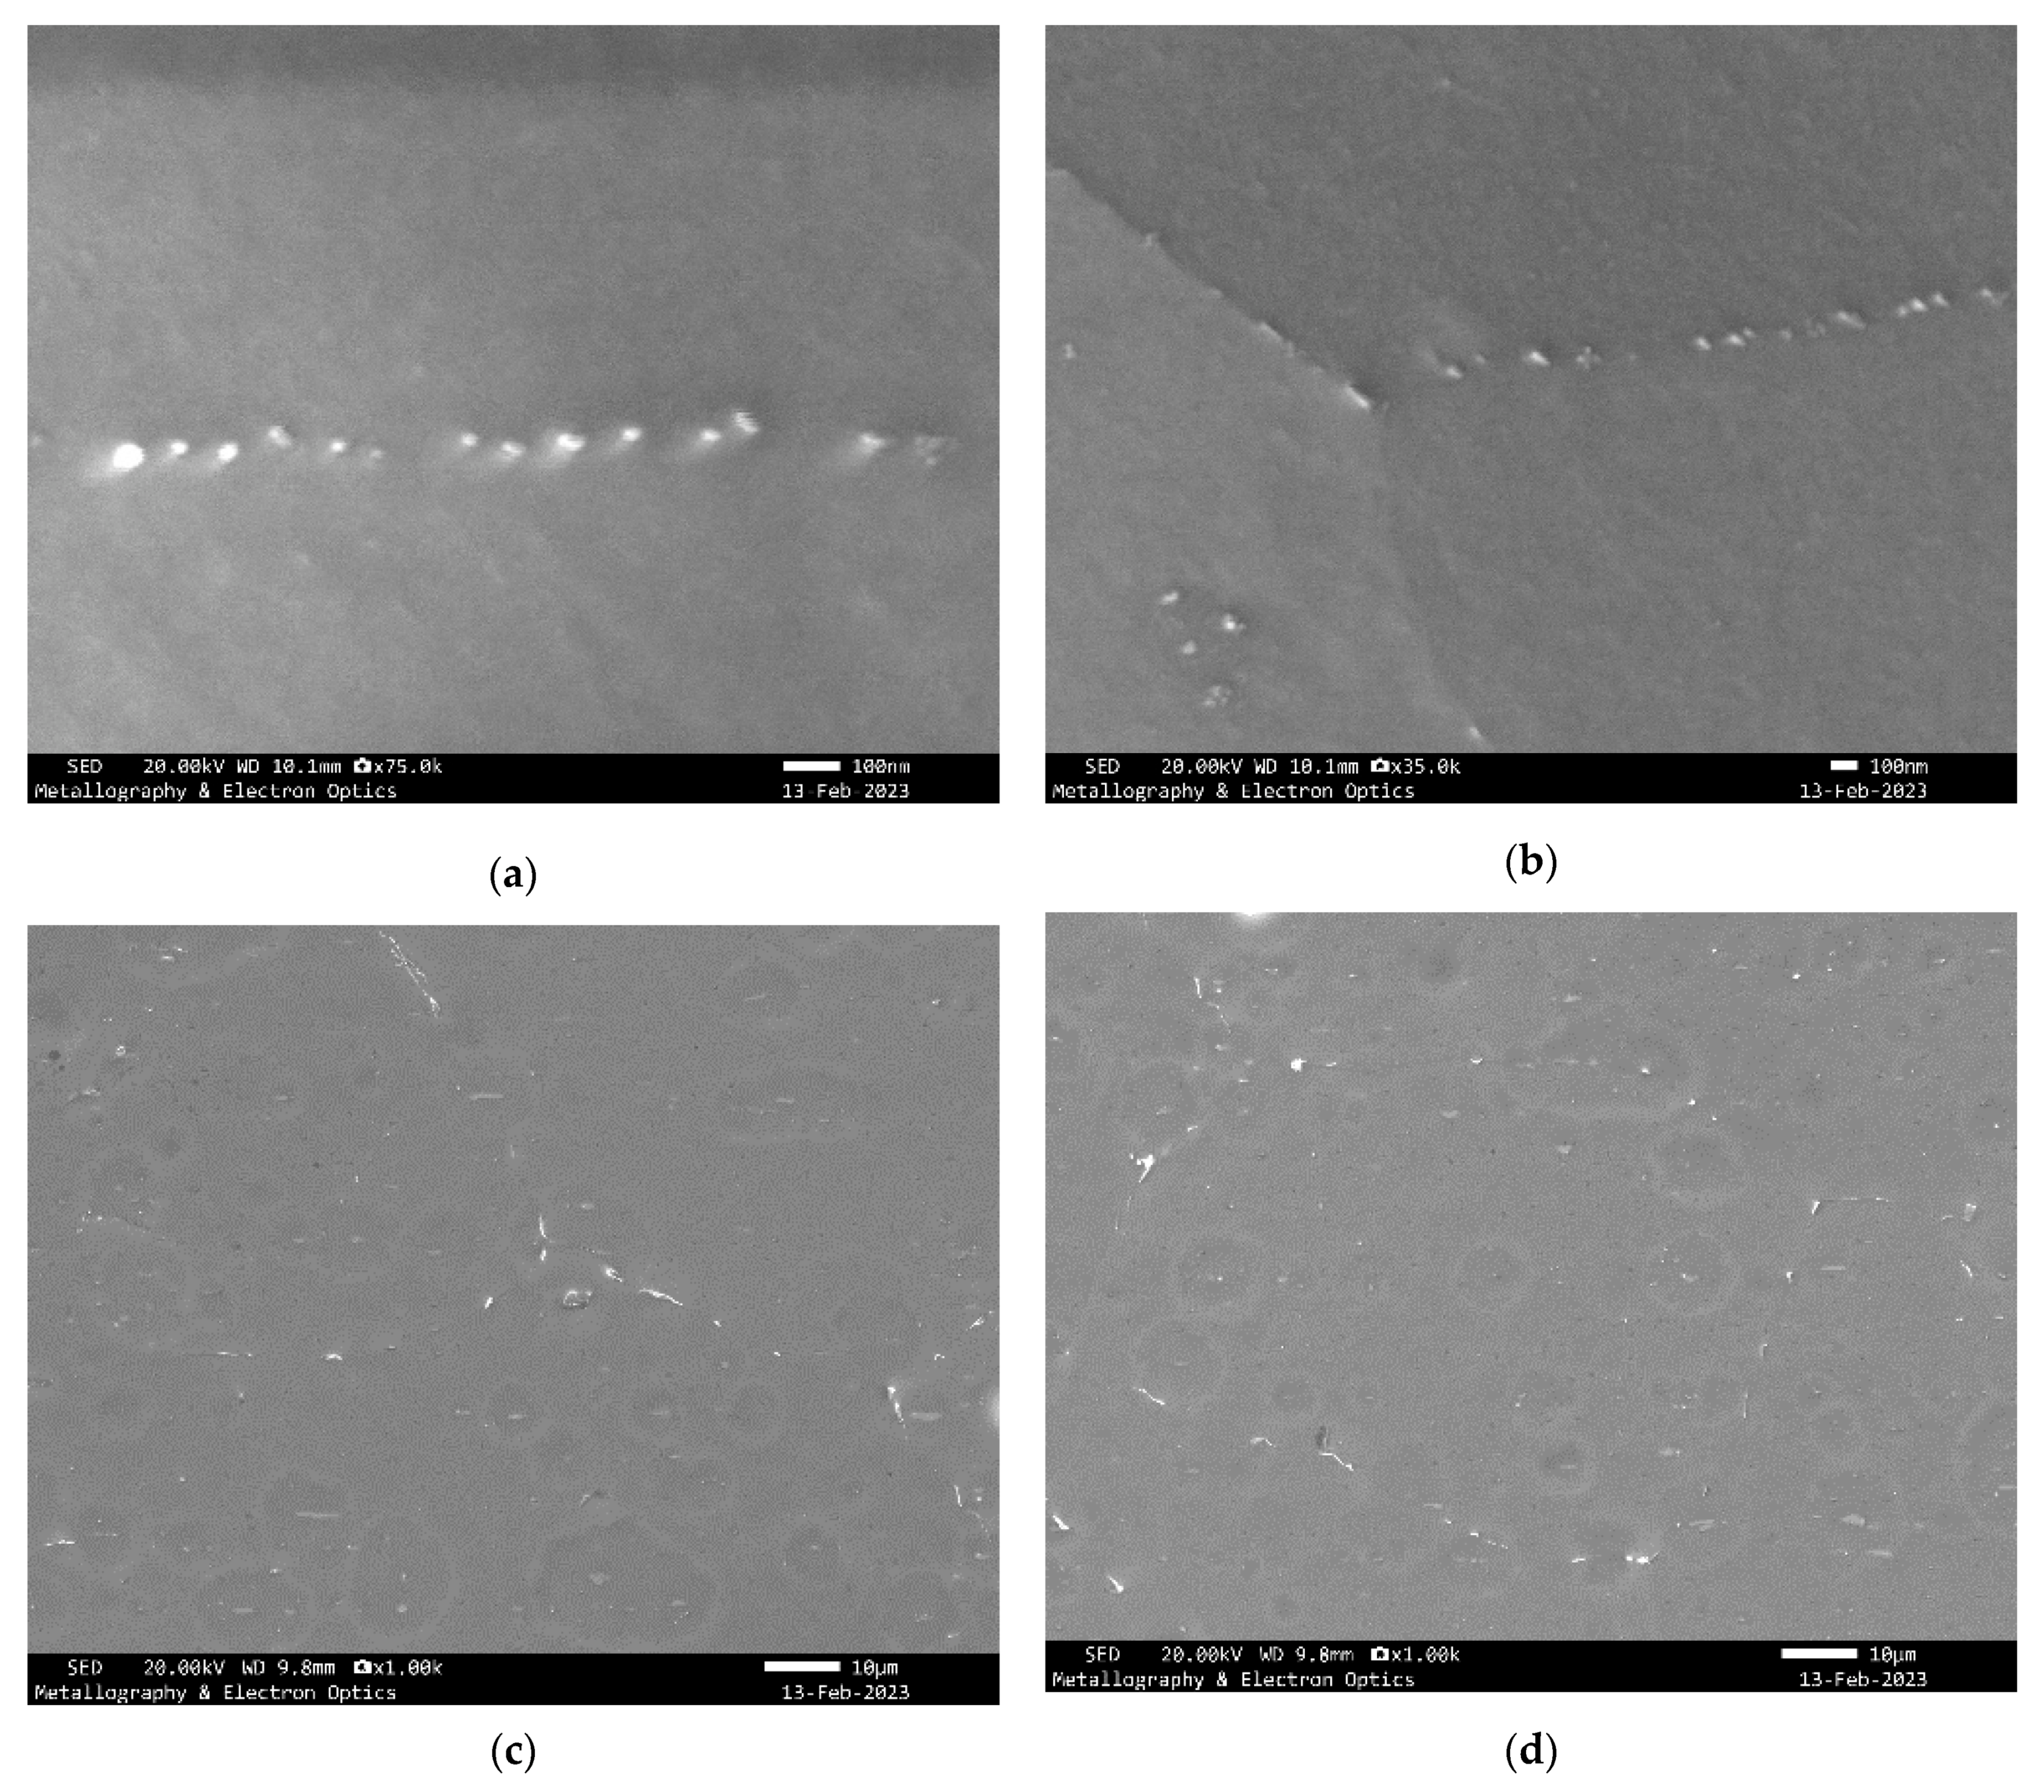
3.1. Mechanical Testing and Electron Fractography

Five (5) tensile specimens were retrieved for each cooling method. The results of the tensile tests are summarized in Table 2. It is shown that the WQ sample attained higher yield and tensile stress values (304 and 315 MPa) and an intermediate value of elongation at fracture (12.1%), signifying an acceptable combination of strength and ductility. The AC sample did not reach the desired values for the tensile strength (284 MPa with a minimum value of 300 MPa), the yield strength (241 MPa with a minimum value of 280 MPa), and the elongation (9.6% with a minimum value of 10%). The SC sample exhibited acceptable values of strength and ductility (tensile strength: 310 MPa; yield strength: 298 MPa; elongation: 12.8%), which were intermediate regarding the strength and the highest regarding ductility, among the three conditions. These results are indicative of the positive contribution of the increased cooling rate from homogenization or the solution temperature to both strength and ductility.
During three-point bending tests, the AC sample was severely fractured at a 22 mm vertical distance (Figure 1a), and it was separated into two pieces. The fracture mode was intergranural, and brittle secondary cracks were developed transverse to the main fracture surface (Figure 1b,c). Electron fractography revealed fine and shallow dimples developed on the grain facets, indicating minor ductility behavior. The prevailing mechanism is microvoid coalescence on the grain boundaries caused by Mg2Si precipitation. This behavior characterized the whole samples’ thickness, and no difference in fracture mode was observed between the surface and mid-thickness regions. The WQ sample exhibited “orange peeling” on the bent region, while the sample on the bending line of the SC sample revealed a thin longitudinal crack parallel to the extrusion direction (Figure 1d,e).

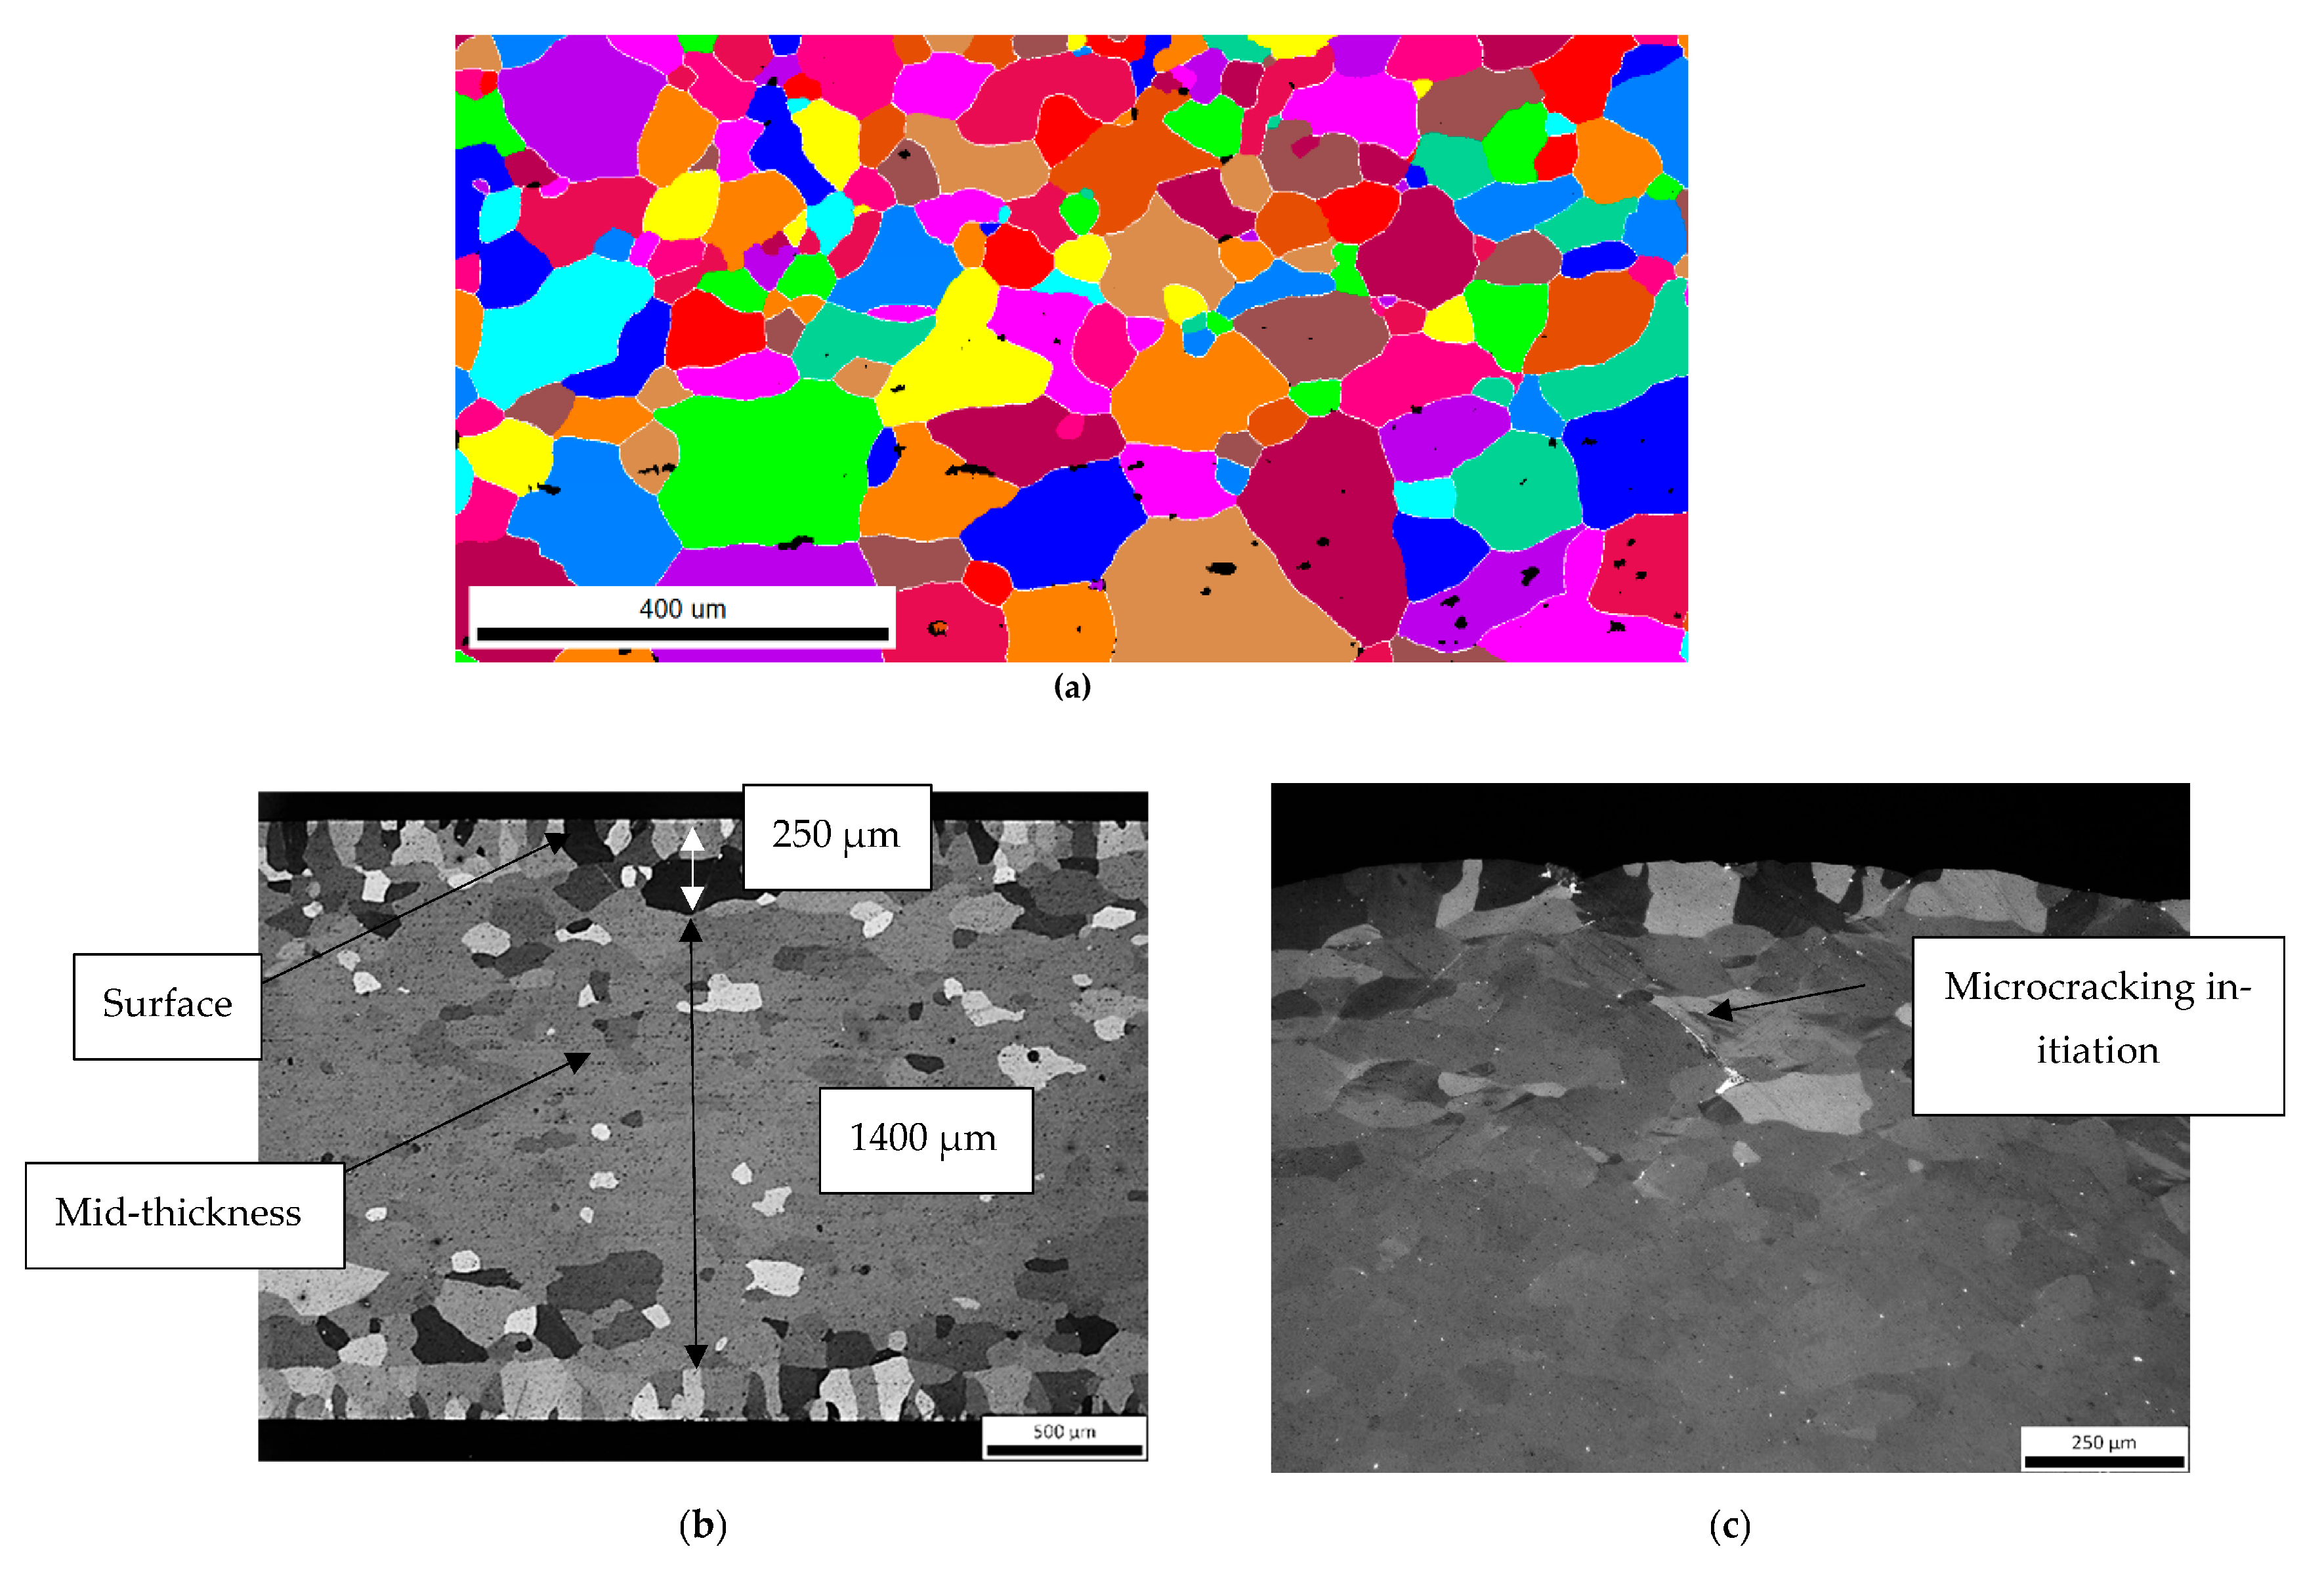
3.2. Microstructure Characterization

The microstructure of the profiles was fully recrystallized with a mean grain size of 56 μm (Figure 2a). The grains of the outer and inner surface layers (surface zone) of 200–250 μm thickness exhibited different orientations, which rendered different anodizing responses to the specific regions after Barkers’ electrolytic etch (Figure 2b). In the mid-thickness, the grains were not easily identified because of the strong extrusion texture resulting from the hot extrusion process. No differences were detected on the microstructure among the WQ, AC, and SC samples regarding the grain size, morphology, and texture, as these were formed during extrusion and they were not affected by the subsequent laboratory heat treatment. Upon the examination of the bent region of the three-point bent SC specimen, it was discovered that “orange peeling” and microcracking developed on the outer surface, with a maximum crack depth of 25 μm (Figure 2c). However, more pronounced microcracking was observed in the subsurface region, between the surface zone and the mid-thickness region. Moreover, it was observed that surface roughening and the formation of shear bands coincided with the development of intergranular discontinuities, predominantly not only on the surface, but also in the subsurface regions. These discontinuities could occur due to strain accommodation differences in neighboring grains and were formed along grain boundaries. Shear bands were also observed in traversing different grains on the surface and subsurface regions, characterized by intergranular cracks with approximately 100 μm in size, coinciding with the location of slip bands that extended from the surface to the interior of the profile. In addition, the formation of discontinuities was observed between constituent intermetallic particles, both intergranularly and transgranularly. The optical and electron microscopy analysis of the intermetallic particles’ size, morphology, and general appearance in this particular type of Al-alloy provided typical evidence of AlFeSi secondary phases that underwent deformation during processing (extrusion). The intermetallic particles not only served as sites for discontinuities formation during bending testing, but also promoted cracking due to their inherent brittleness.
The samples were further etched by a HF solution for revealing PFZs. It was observed that in the AC sample a semi-continuous network of wide PFZs existed across thickness. Due to the size of the zones they were easily discerned by optical microscopy. In some areas, their width reached 7.8 μm (Figure 3). PFZs were also detected in the WQ and SC samples, but not at the same degree of continuity, and with a lower width compared to in the AC sample (Figure 4).
The observed differences in the size of the PFZs were strongly related with the cooling rate after solution heat treatment. It was considered that through air cooling the vacancies which were near the grain boundaries diffused rapidly towards them and created vacancy-depleted zones, which were responsible for the formation of the PFZs. It is worth noting that even though water quenching was an extremely rapid process, vacancies still diffused towards the grain boundaries, but to a very lower extent. As a result, even in the WQ and SC samples, PFZs formation was not prevented (see Figure 4).

3.3. Electron Backscatter Diffraction

EBSD scans were performed for texture characterization across the thickness of the profiles, for the examination of the grain boundaries characteristics on the surface and the mid-thickness regions and the correlation of misorientation with precipitation behavior. Scans were performed on transverse sections, as these are considered more representative for texture observation of extruded products. The SC sample was selected for the specific examination, but the same results regarding texture applied for the AC and WQ samples as well.
The sample in terms of texture characterization can be divided into two distinct zones, i.e., the surface zones (inner and outer) with an approximate thickness of 200 μm and a mid-thickness (Figure 5). The subsurface zones did not exhibit strong, preferred texture; however, the (001) orientations had a higher density (4.5 times random in the inverse pole texture plot). On the other hand, the mid-thickness region was strongly textured, exhibiting a single (001) fiber texture which was typical for extruded products (17.6 times random). This preferred texture was responsible for the poor response of the profiles to Barker’s electrolytic etch.
The surface zones were mostly characterized by HAGBs, a low percentage of LAGBs, and a minor percentage of SGBs (81/15/4 fraction, Figure 6a). The precipitation behavior was observed in different grain boundaries of the same area. After electrolytic polishing the HAGBs were easily discerned, while the LAGBs were not so easily detected and only at high magnifications greater than 10k X were they fully traceable. In area of interest (AOI) 1, it was observed that extensive grain boundary precipitation occurred on the HAGBs with 20 nm precipitates in length and limited precipitation on the LAGB, while on the triple boundary a coarse precipitate of a 100 nm length was observed (Figure 6c). However, this behavior was not identical on the other boundaries. In AOI 2, grain boundary precipitation was observed on an LAGB with characteristics similar to those of the precipitation of HAGBs of AOI 1. The precipitates were almost globular with a 15 nm mean diameter, and they were met at a random spacing between two successive precipitates ranging between 20 and 500 nm (Figure 6d). In AOI 3, it is shown that precipitation occurred at both HAGBs and LAGBs but the size of the precipitates was coarser on the HAGBs, taking into consideration both length and thickness reaching a length of 90 nm and a thickness of 8 nm in the HAGB (Figure 7). The precipitates of the LAGBs boundaries reached a maximum length of 75 nm, and the spacing between them was higher than that of the HAGBs. Similar behaviors were observed on the other areas of interest of the subsurface-recrystallized regions of the profile.
On the other hand, mid-thickness region was characterized by the presence of HAGBs, LAGBs, and SGBs at a fraction of 51/32/17 approximately (Figure 8a). The mean grain size was 52 μm. It is worth noting that the relatively high amount of SGBs was present in a region, which was considered fully recrystallized judged also from the size and the morphology of equiaxed grains. Regarding the grain boundaries characteristics, the results differed a lot in the mid-thickness region. Considerable amounts of LAGBs (14.7%) and SGBs (4.5%) were detected as can be observed in Figure 8. In AOI 4, it is presented that the precipitates were rounded to elliptical with a mean diameter of 40 nm on the HAGBs and globular with a 30 nm diameter in LAGBs and minor precipitation of few nanometers scale was also detectable on SGBs. The inter-spacing was comparable for LAGBs and HAGBs boundaries. In AOI 5, precipitation on the HAGBs was semi-continuous; however, the precipitates did not exhibit considerable thickness. On the LAGBs, the sizes of the precipitates were finer, not exceeding 25 nm, and in no case were they continuous as in HAGBs. Isolated-only particles were detected on the SGB (Figure 9).
The precipitation behavior in the WQ sample did not differ significantly from this of the SC sample; however, the grain boundaries where relatively coarser precipitation occurred were more dispersed (Figure 10a,b). In the AC sample, coarse Mg2Si particles were easily detected even at low magnifications, forming a continuous network surrounding the grain boundaries and rendering them brittle (Figure 10c,d).
In Figure 6b, a Taylor factor map of the subsurface region is shown. The arrows indicate the areas which were prone to cracking in the presence of tensile stresses, as they acted as stress concentration sites. These coincided with the boundaries where high Taylor factor values differences were observed as is the case of interfaces between blue- and red-colored grains. The frequency of such interfaces was considered adequate, as a high fraction of these boundaries belonged to this category in the observed region.

4. Discussion

The above findings are indicative of the important effect of the cooling rate from the homogenization temperature, which was accomplished in this project for simulating the hot working temperature of the extrusion process, on the mechanical properties of extruded profiles. Water quenching led to profiles which had superior properties regarding strength. The main reason for this behavior is that by very rapid cooling a high percentage of the alloying elements were retained in a solid solution (Si and Mg in this case) and the formation of the maximum possible Mg2Si precipitates quantity was allowed during aging. The maximum grain boundary precipitate particles length was 150 nm, but the lengths of the majority were finer than 30 nm. On the AC sample, the precipitation behavior was characterized by the presence of up to microscopic-size β (Mg2Si) particles with an elongated morphology located on the grain boundaries. These did not contribute to strength, as they had non-coherent phases. In addition, they were preferable sites for stress concentration limiting the overall ductility. Therefore, even after three hours of aging, the AC sample exhibited low strength levels and unacceptable ductility in tensile testing. As a result, the sample is expected to exhibit unacceptable crashworthiness and formability performance in general.
One of the main targets of this project was to observe the precipitation behavior in different boundaries. In this frame, the SC sample was examined. The precipitates (mainly β′) were nucleated in the areas which were considered as energetically favored (grain boundaries). The electrolytic polishing process enabled the observation of the precipitates on the various grain boundaries types (HAGBs, LAGB, and SGBs), and they could be easily measured at magnifications higher than 25 k. The ones that were located on triple grain boundaries were generally quite coarser than those found on the other grain boundary interfaces exhibiting a higher length and thickness. In most cases, the precipitates on the triple boundaries extended on all double boundaries, rendering them a star-like morphology.
The texture of the profiles was formed at the end of the extrusion process. The SC sample was selected for viewing the texture in the subsurface zone and the mid-thickness region. The texture differed significantly between these two areas. It was observed that the mid-thickness region was strongly textured with a (001) single fiber texture while the subsurface zone exhibited a more random texture. However, the biggest difference between these two areas lied in the grain boundaries characteristics. Even though the sample was recrystallized, in the mid-thickness region, SGBs were observed as a result of the extrusion process and the respective flow of the material through the die. These boundaries were not removed after solution and aging heat treatments. Extrusion conditions and more specifically a high amount of shear were, on the other hand, adequate for the elimination of SGBs and the limitation of LAGBs in subsurface zones. In terms of crack initiation, texture analysis revealed with high accuracy where this would be observed. The largest cracks after three-point bending testing were formed in the transition zone between the more random subsurface and the mid-thickness region. At this area, the grains which were more favorably oriented towards rotation during bending created a minute discontinuity which evolved to a crack during the stress increase. The Taylor factor maps clearly indicated that in the examined samples such interfaces and a lot of boundaries were present. The surface roughening of the bent SC sample was linearly connected with slip lines development and grain boundaries with favorable orientation for cracking.
The amounts of precipitation were different on HAGBs, LAGBs, and SGBs. Coarser Mg2Si precipitates in terms of length and thickness were located on HAGBs. It was found that the size and thickness of the precipitates as well as the inter-particle distance were not the same for all HAGBs and this was also proved for LAGBs. However, in neighboring areas where for instance an HAGB met with an LAGB the size of the precipitates was coarser in the HAGB. The morphology of the precipitates was globular in most cases for the LAGBs, while for the HAGBs the size was globular, elliptical and in some cases they were semi-continuous as a layer on the interfaces. In the SGBs, any precipitation was difficulty discerned, and the interfaces on the whole leaned on such particles. The precipitation behavior was comparable between the surface and mid-thickness locations, and by high-magnification imaging, one could not easily distinguish if one of the two areas was observed.
Optical microscopy can prove as a very useful tool for signifying low ductility performance in automotive profiles for crash systems and bumpers. In case the thermomechanical process leads to inferior formability, this can be clearly demonstrated by the formation of PFZs which are recognizable at even a 500× magnification by optical microscopy. They appear as white, thin zones on the grain boundaries. The more continuous they are, the more probable it is that intergranular cracking will appear in mechanical tests in the respective profiles. It is obvious that the delineation of the grain boundaries with PFZs revealed some of the HAGBs which were those with higher precipitation propensity and formed thicker PFZs.
From the point of fractographic examination, a low-ductility sample exhibited ductile, intergranular cracking, resulting from the combination of a low-strength intergranular zone depleted in alloying elements surrounding the higher-strength grains interiors, including β″ and β′precipitates of nanometer size, which were not easily discernible with an SEM. In the case of the harder 6xxx alloys which contained higher Si and Mg contents as well as other strengthening elements such as Mn and Cr, a grain boundary decision across the thickness was not observed and can be only noticed on subsurface layers in case secondary recrystallization occur [13]. After the initiation of the initial crack when it reached the recovered region of the profile in the mid-thickness location of the profile, it propagated at a transgranular mode of low or high ductility with dimples formation, depending on the metallurgical condition (aging). Additionally, since no other low-energy paths existed, the constituent α-AlFeSi particles played this role and cracking could be detected between two adjacent particles. In the current investigation, similar behaviors were observed in the WQ and SC three-point bent specimens which had elongation values higher than 12%.

5. Conclusions

The following conclusions could be derived from the performed examination and analysis of the results:
  • Texture analysis can be very useful in the determination of the areas which are prone to crack initiation and affect formability properties of automotive profiles. Apart from the typical analysis of the orientation and grain size analysis, Taylor factor maps should be constructed for the observation of areas with high differences in respective values.
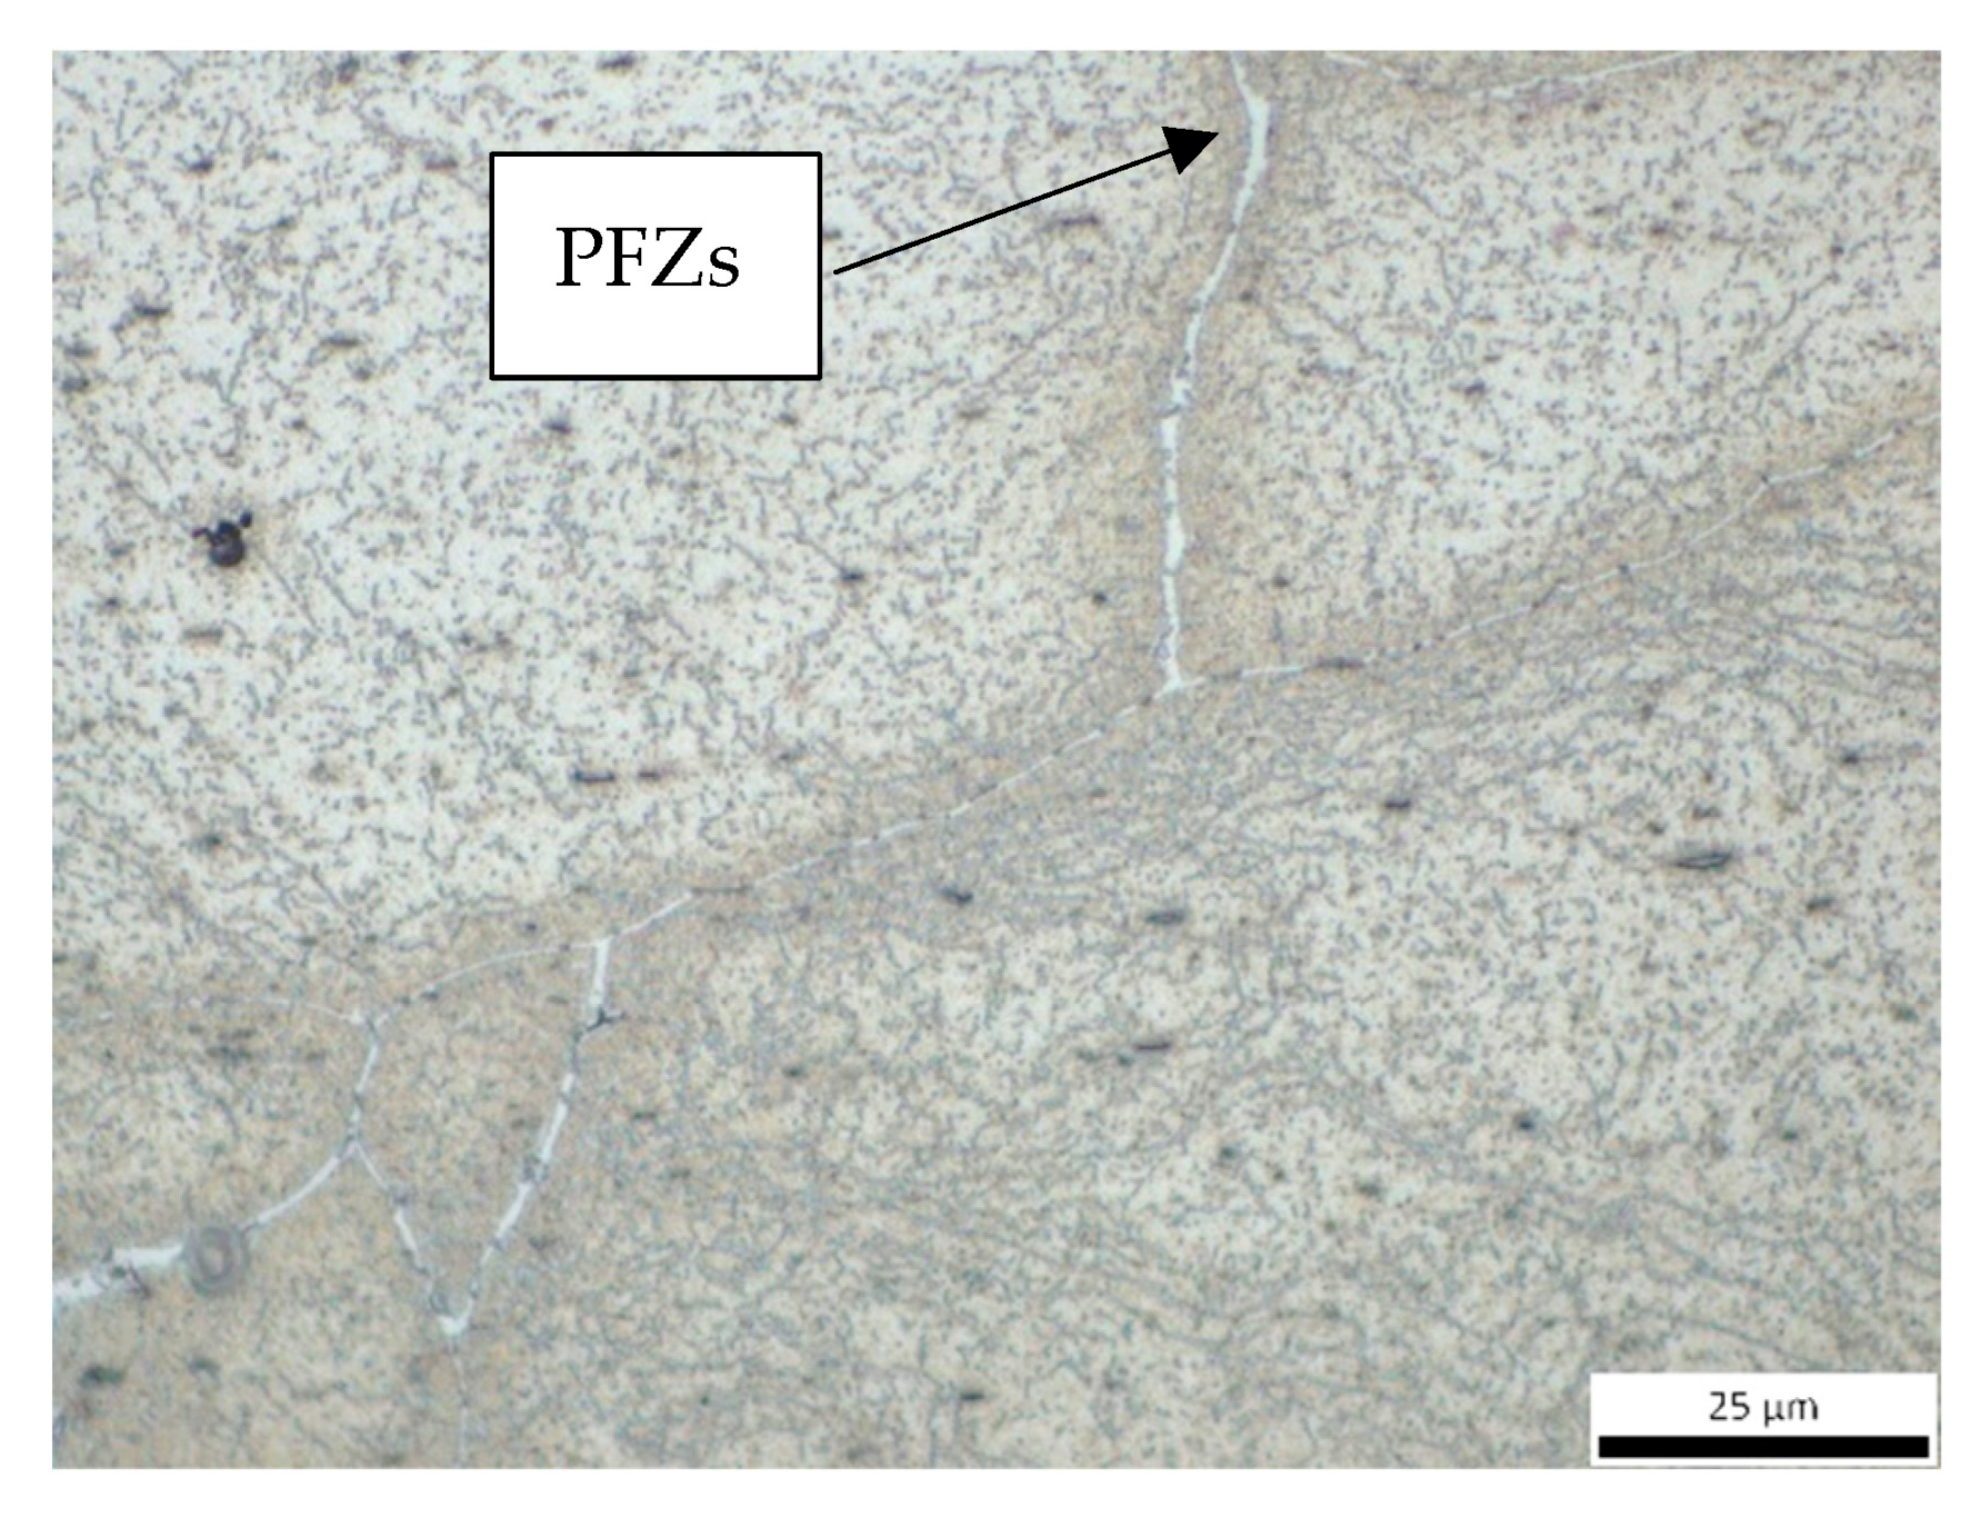
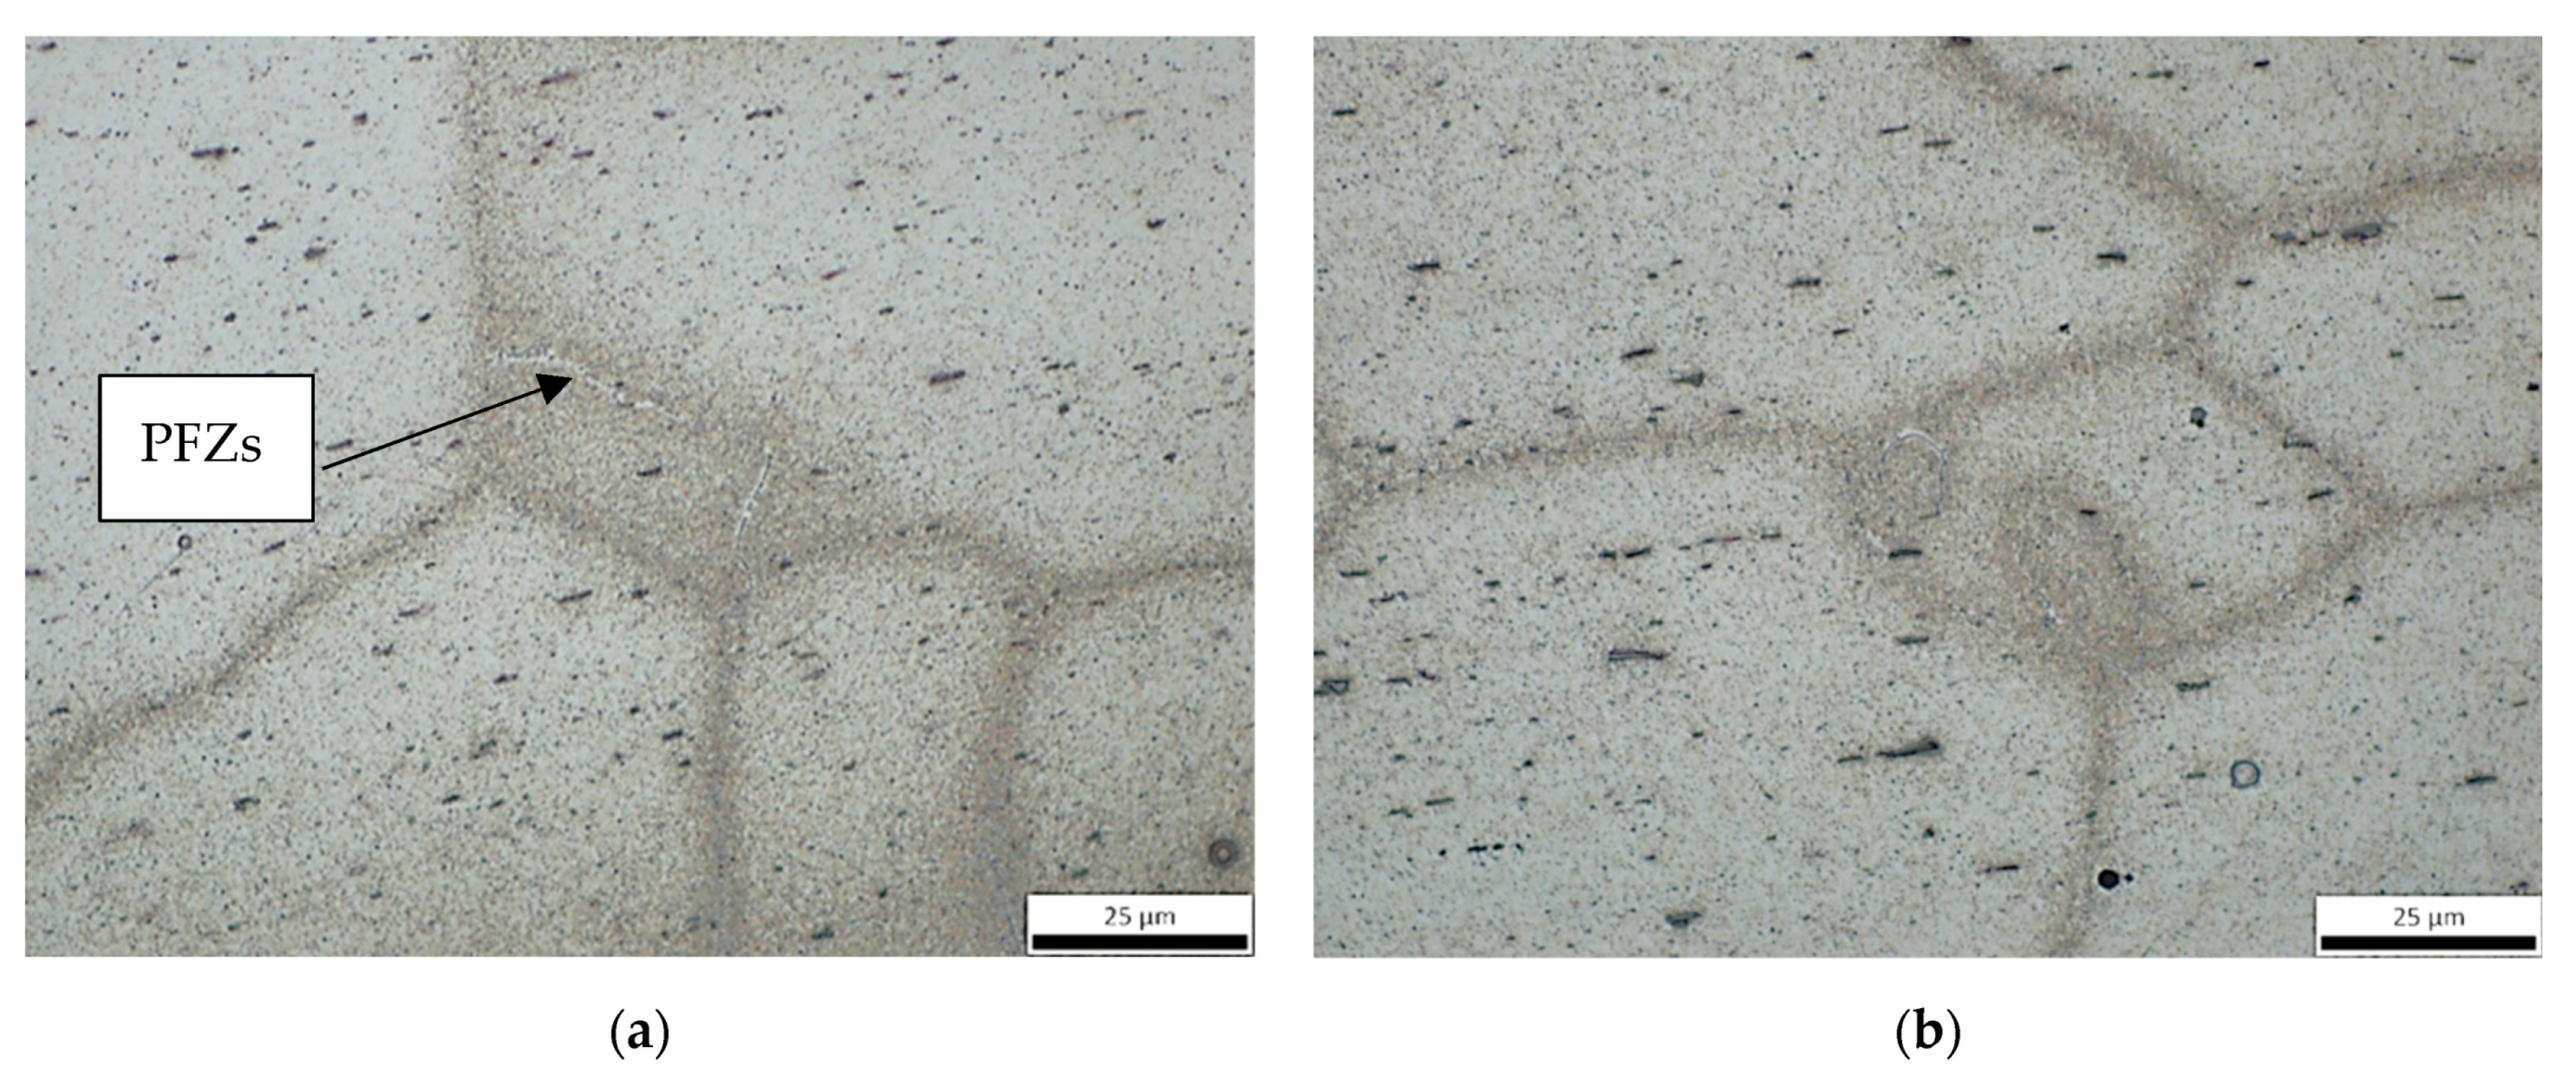
  • A plausible scenario for crack initiation in automotive profiles involves a subsurface region where the convergence of slip lines and the presence of grain boundaries with relatively high susceptibility to crack initiation and propagation may promote this phenomenon. The outer surface, however, may not be the most likely site of crack initiation. Misorientation maps can be used for observation of grain boundaries which are based on their types (HAGBs, LAGBs, and SGBs) which are related with different propensity values for precipitation. On HAGBs, coarser precipitates are formed, and this is accompanied by the formation of PFZs which are visible with optical microscopy.
  • Slow cooling is related with unacceptable formability, as it can lead to substantial grain boundary sensitization and early fracture in mechanical tests due to coarse Mg2Si non-coherent particles formation. In addition, the strength of the material is lower due to a lower alloying elements amount available for precipitation hardening by artificial aging.
  • Step cooling can lead to mechanical performance which are comparable with water quenching and therefore leaves space for further investigation, as it is directly related with the extrusion process and the cooling method setup.

Author Contributions

Conceptualization, G.S. and A.V.; methodology, A.V.; software, A.V. and S.P.; validation, F.A., E.S. and A.R.; formal analysis, F.A., E.S. and A.R.; investigation, A.V. and G.S.; resources, A.V. and S.P.; writing—original draft preparation, A.V. and S.P.; writing—review and editing A.V.; visualization, A.V. and S.P.; supervision, A.V. and G.S.; project administration, S.P. All authors have read and agreed to the published version of the manuscript.

Funding

This research received no external funding.

Institutional Review Board Statement

Not applicable.

Informed Consent Statement

Not applicable.

Data Availability Statement

All data are available.

Acknowledgments

The authors would like to express their gratitude towards the ELKEME SA and ETEM GESTAMP SA managements.

Conflicts of Interest

The authors declare no conflict of interest.

References

  1. Bajor, T.; Kawałek, A.; Berski, S.; Jurczak, H.; Borowski, J. Analysis of the Extrusion Process of Aluminium Alloy Profiles. Materials 2022, 15, 8311. [Google Scholar] [CrossRef] [PubMed]
  2. Shen, X.; Liu, S.; Wang, X.; Cui, C.; Gong, P.; Zhao, L.; Han, X.; Li, Z. Effect of Cooling Rate on the Microstructure Evolution and Mechanical Properties of Iron-Rich Al–Si Alloy. Materials 2022, 15, 411. [Google Scholar] [CrossRef]
  3. Xu, Z.; Wang, S.; Wang, H.; Song, H.; Li, S.; Chen, X. Effect of Cooling Rate on Microstructure and Properties of Twin-Roll Casting 6061 Aluminum Alloy Sheet. Metals 2020, 10, 1168. [Google Scholar] [CrossRef]
  4. Zhang, W.; Li, H.; Hu, Z.; Hua, L. Investigation on the deformation behavior and post-formed microstructure/properties of AA7075-T6 alloy under pre-hardened hot forming process. Mater. Sci. Eng. A 2020, 792, 139749. [Google Scholar] [CrossRef]
  5. Hu, J.; Zhang, W.; Teng, D.; Zhang, H. Improvement of the mechanical properties of Al–Mg–Si alloys with nano-scale precipitates after repetitive continuous extrusion forming and T8 tempering. J. Mater. Res. Technol. 2019, 8, 5950–5960. [Google Scholar] [CrossRef]
  6. Bourget, J.-P.; Fafard, M.; Shakeri, H.R.; Côté, T. Optimization of heat treatment in cold-drawn 6063 aluminium tubes. J. Mater. Process. Technol. 2009, 209, 5035–5041. [Google Scholar] [CrossRef] [Green Version]
  7. Zupanič, F.; Steinacher, M.; Žist, S.; Bončina, T. Microstructure and Properties of a Novel Al-Mg-Si Alloy AA 6086. Metals 2021, 11, 368. [Google Scholar] [CrossRef]
  8. Mao, H.; Bai, X.; Song, F.; Song, Y.; Jia, Z.; Xu, H.; Wang, Y. Effect of Cd on Mechanical Properties of Al-Si-Cu-Mg Alloys under Different Multi-Stage Solution Heat Treatment. Materials 2022, 15, 5101. [Google Scholar] [CrossRef]
  9. Zhao, B.; Ye, B.; Wang, L.; Bai, Y.; Yu, X.; Wang, Q.; Yang, W. Effect of ageing and thermal exposure on microstructure and mechanical properties of a HPDC Al–Si–Cu–Mg alloy. Mater. Sci. Eng. A 2022, 849, 143463. [Google Scholar] [CrossRef]
  10. Türkmen, M.; Akdemir, O.; Taşpınar, Y.; Yıldız, M.; Gündüz, S. The Effect of Cooling Rate on Microstructure and Mechanical Properties of Al-Mg-Si (6063) Alloy. Pamukkale Üniversitesi Mühendislik Bilim. Derg. 2015, 21, 11–14. [Google Scholar] [CrossRef] [Green Version]
  11. Ye, Y.; Sanders, R., Jr.; Yang, X. The Influence of Microstructure on the Fracture Resistance of 6xxx Alloy Sheet. In Proceedings of the 16th International Aluminum Alloys Conference (ICAA16), Montreal, QC, Canada, 17–21 June 2018; Canadian Institute of Mining, Metallurgy & Petroleum: Westmount, QC, Canada, 2018. [Google Scholar]
  12. Westermann, I.; Snilsberg, K.; Holmedal, B.; Hopperstad, O. Bendability and Fracture Behaviour of Heat-Treatable Extruded Aluminium Alloys. In Proceedings of the 12th International Conference on Aluminium Alloys, ICAA12, Yokohama, Japan, 5–9 September 2010; pp. 595–600. [Google Scholar]
  13. Vazdirvanidis, A.; Pressas, I.; Papadopoulou, S.; Toulfatzis, A.; Rikos, A.; Katsivarda, M.; Symeonidis, G.; Pantazopoulos, G. Examination of formability properties of 6063 alloy extruded profiles for the automotive industry. Materials 2019, 12, 1875. [Google Scholar] [CrossRef] [Green Version]
  14. Papadopoulou, S.; Gavalas, E.; Vourlakou, C.; Papaefthymiou, S. The influence of second phase particles on texture during rolling of Al 3104. J. Mater. Sci. 2012, 47, 7754–7764. [Google Scholar] [CrossRef]
  15. Inoue, H. Prediction of in-plane anisotropy of bendability based on orientation distribution function for polycrystalline face-centered cubic metal sheets with various textures. Mater. Trans. 2015, 56, 61–69. [Google Scholar] [CrossRef] [Green Version]
  16. Hernández-Sánchez, A.; Amigó, V.; Fernández, R.; González-Doncel, G. Microstructure and fracture toughness of as-cast and heat-treated Al-Mg-Si alloys. J. Mater. Sci. 2016, 51, 10668–10682. [Google Scholar] [CrossRef]
  17. Mbuya, S.O.; Amigó, V.; Fernández, R.; González-Doncel, G. The effect of Cu addition on the mechanical properties of Al-Mg-Si alloy. J. Alloy. Compd. 2020, 825, 154045. [Google Scholar] [CrossRef]
  18. Ghribi, N.M.; Keddam, M.; Bacroix, B. Effect of aging on microstructure and fracture toughness of Al-Mg-Si-Cu alloys. Mater. Sci. Eng. A 2016, 671, 177–186. [Google Scholar] [CrossRef]
  19. Katsivarda, M.; Vazdirvanidis, A.; Pantazopoulos, G.; Kolioubas, N.; Papadopoulou, S.; Rikos, A.; Spiropoulou, E.; Papaefthymiou, S. Investigation of the effect of homogenization practice of 6063 alloy billets on beta to alpha transformation and of the effect of cooling rate on precipitation kinetics. Mater. Sci. Forum 2018, 941, 884–889. [Google Scholar] [CrossRef]
  20. Papadopoulou, S.; Loukadakis, V.; Zacharopoulos, Z.; Papaefthymiou, S. Influence of uniaxial deformation on texture evolution and anisotropy of 3104 Al sheet with different initial microstructure. Metals 2021, 11, 1729. [Google Scholar] [CrossRef]
  21. Papadopoulou, S.; Kontopoulou, A.; Gavalas, E.; Papaefthymiou, S. The Effects of Reduction and Thermal Treatment on the Recrystallization and Crystallographic Texture Evolution of 5182 Aluminum Alloy. Metals 2020, 10, 1380. [Google Scholar] [CrossRef]
  22. Vazdirvanidis, A.; Skordilis, I.; Katsivarda, M.; Stavroulakis, P.; Papaefthymiou, S. Study of Grain structure and crystallographic orientation of extruded 6xxx series alloy profiles. In Proceedings of the 14th International Scientific Congress Machines, Technologies, Materials (MTM 2017), Varna, Bulgaria, 13–16 September 2017; Volume 11, pp. 457–459. [Google Scholar]
  23. Dao, M.; Li, M. A micromechanics study on strain-localization-induced fracture initiation in bending using crystal plasticity models. Philos. Mag. A 2001, 81, 1997–2020. [Google Scholar] [CrossRef]
  24. Alexopoulos, N.D.; Robson, J.D.; Stefanou, G.; Stergiou, V.; Karanika, A.; Kourkoulis, S.K. Microstructural and Mechanical Characterization of the Aging Response of Wrought 6156 (Al-Mg-Si) Aluminum Alloy. Alloys 2022, 1, 180–195. [Google Scholar] [CrossRef]
  25. Vazdirvanidis, A.; Koumarioti, A.; Pantazopoulos, G.; Rikos, A.; Toulfatzis, A.; Kostazos, P.; Manolakos, D. Examination of Buckling Behavior of Thin-Walled Al-Mg-Si Alloy Extrusions. In Proceedings of the 12th International Conference on Aluminium Alloys, Pittsburgh, PA, USA, 3–7 June 2012. [Google Scholar]
  26. Papadopoulou, S.; Gavalas, E.; Papaefthymiou, S. Methodology for the Identification of Nucleation Sites in Aluminum Alloy by Use of Misorientatation Mapping. Mater. Proc. 2021, 3, 11. [Google Scholar] [CrossRef]
  27. Koumarioti, I.; Ping, S.; Vazdirvanidis, A.; Pantazopoulos, G.; Zormalia, S. Influence of Homogenizing and Ageing Practices on Microstructure and Dynamic Compression of Crash Relevant Al-Alloy Extrusions. In Proceedings of the 12th International Conference on Aluminium Alloys, Yokohama, Japan, 5–9 September 2010; pp. 1124–1129. [Google Scholar]
  28. Westermann, I.; Snilsberg, K.E.; Sharifi, Z.; Hopperstad, O.S.; Marthinsen, K. Three-Point Bending of Heat-Treatable Aluminum Alloys: Influence of Microstructure and Texture on Bendability and Fracture Behavior. Metall. Mater. Trans. A 2011, 42, 3386–3398. [Google Scholar] [CrossRef] [Green Version]
  29. Das, S.; Heyen, M.; Kamat, R.; Hamerton, R. Improving Bendability of Al-Mg-Si Alloy Sheet by Minor Alloying Element Addition. In Light Metals; TMS; Martin, O., Ed.; Springer: Berlin/Heidelberg, Germany, 2018; pp. 325–331. [Google Scholar]
  30. Lloyd, D. Aspects of plasticity and fracture under bending in Al alloys. In Proceedings of the 16th International Aluminum Alloys Conference (ICAA16), Montreal, QC, Canada, 17–21 June 2018; Canadian Institute of Mining, Metallurgy & Petroleum: Westmount, QC, Canada, 2018; pp. 309–314, ISBN 978-1-926872-41-4. [Google Scholar]
  31. 6061 Aluminum Composition Spec. The Aluminum Association. 2017. Available online: https://www.aluminum.org/sites/default/files/Aluminum-Standards-Data-2017_0.pdf (accessed on 14 January 2023).
Figure 1. (a) AC sample divided into two pieces during a three-point bending test from the top-view imaging of the fracture area; (b) “orange peel” on the bent region of the WQ ample after a three-point bending test; (c) linear minor crack coinciding with the bending line on the bent region of the SC sample; (d) fracture surface of the sample AC after a three-point bending test. The intergranular fracture mode was noticed; (e) electron fractograph of the same area. The intergranular fracture mode accompanied by fine, shallow dimples on the grain faces and brittle intergranular secondary cracks was noted.
Applsci 13 03763 g001
Figure 2. (a) EBSD grain structure map of the profile. (b) Grain structure of the WQ sample away from the bending region (unaffected area). (c) Development of “orange peeling” on the bent surface and subsurface microcracking initiation in the SC sample.
Applsci 13 03763 g002
Figure 3. Continuous network of grain boundary PFZs in the AC sample (white color).
Applsci 13 03763 g003
Figure 4. PFZs formation in the WQ sample (a) and in the SC sample (b).
Applsci 13 03763 g004
Figure 5. IPF maps of the subsurface zone (a) and the mid-thickness region (b); respective IPF texture plots of the SC samples in the subsurface zone (c) and the mid-thickness region (d).
Applsci 13 03763 g005
Figure 6. (a) EBSD misorientation map of the subsurface region of the SC sample. (b) Taylor factor map of the same area. (c) Grain boundary precipitation on HAGBs and absence of precipitates on LAGBs in AOI 1. Coarse precipitates formed on the triple grain boundary. (d) Grain boundary precipitation on another LAGB (AOI 2).
Applsci 13 03763 g006
Figure 7. In AOI 3, grain boundary precipitation on LA boundaries (a) and HAG boundaries (b) of the SC sample. The differences in length (i), thickness (ii), and inter-particle distance (iii) of the precipitates were noticed.
Applsci 13 03763 g007
Figure 8. (a) EBSD misorientation map of the mid-thickness area of the profile of the SC sample in AOI 4; precipitation behaviors on HA (b), LA (c), and SB (d).
Applsci 13 03763 g008
Figure 9. Precipitation behaviors on HAGBs (a), LAGBs (b), and SGB (c) of the SC sample in AOI 5 in the mid-thickness region of the profile.
Applsci 13 03763 g009
Figure 10. Indicative SEM micrographs indicating precipitation behavior on the WQ (a,b) and the AC (c,d) samples.
Applsci 13 03763 g010
Table 1. The nominal chemical composition of the 6061 alloy extruded profiles [31].
Element (%)SiFeCuMnMgCrZnTiAl
0.4–0.80.70.15–0.40.150.8–1.20.04–0.350.250.15Bal.
Table 2. Tensile test results (mean of five measurements).
SampleTS (MPa)YS (MPa)El. (%)
WQ31530412.1
AC2842419.6
SC31029812.8
Disclaimer/Publisher’s Note: The statements, opinions and data contained in all publications are solely those of the individual author(s) and contributor(s) and not of MDPI and/or the editor(s). MDPI and/or the editor(s) disclaim responsibility for any injury to people or property resulting from any ideas, methods, instructions or products referred to in the content.

