Article

Influence of Microwave Radiation on Pollutant Removal and Biomethane Production Efficiency in Anaerobic Treatment of High-Load Poultry Wastewater

by
Marcin Zieliński
1,
Marcin Dębowski
1,*,
Paulina Rusanowska
1 and
Joanna Kazimierowicz
2
1
Department of Environmental Engineering, Faculty of Geoengineering, University of Warmia and Mazury in Olsztyn, 10-720 Olsztyn, Poland
2
Department of Water Supply and Sewage Systems, Faculty of Civil Engineering and Environmental Sciences, Bialystok University of Technology, 15-351 Bialystok, Poland
*
Author to whom correspondence should be addressed.
Appl. Sci. 2023, 13(6), 3553; https://doi.org/10.3390/app13063553
Submission received: 18 February 2023 / Revised: 7 March 2023 / Accepted: 8 March 2023 / Published: 10 March 2023
(This article belongs to the Special Issue Production, Treatment, Utilization and Future Opportunities of Biogas)

Abstract

:
The growing consumption of poultry meat has spurred the development of meat-processing plants and an associated rise in wastewater generation. Anaerobic digestion is one of the preferred processes for treating such waste. The current push towards biogas upgrading and out-of-plant use necessitates new, competitive ways of heating digesters. One such alternative is to use electromagnetic microwave radiation (EMR). The aim of the study was to assessment how EMR used as a heat source impacts the anaerobic processing of high-load poultry slaughterhouse wastewater (H-LPSW) and its performance. Microwave heating (MWH) was found to boost the CH4 fraction in the biogas under mesophilic conditions (35 °C) as long as the organic load rate (OLR) was maintained within 1.0 kgCOD/dm3·d to 4.0 kgCOD/dm3·d. The best performing variant—EPM heating (55 °C), OLR = 3.0 kgCOD/dm3·d, HRT = 5 days—produced 70.4 ± 2.7% CH4. High COD and TOC removal, as well as the highest biogas yields, were achieved for loadings of 1.0 gCOD/dm3·d to 4.0 gCOD/dm3·d. Effluent from the EMR-heated reactors (1.0 gCOD/dm3·d) contained, on average, 0.30 ± 0.07 gO2/dm3 at 55 °C and 0.38 ± 0.10 gO2/dm3 at 35 °C. The corresponding COD removal rates were 97.8 ± 0.6% and 98.1 ± 0.4%, respectively. The 5.0 gCOD/dm3·d and 6.0 gCOD/dm3·d OLR variants showed incremental decreases in performance. Based on the polymerase chain reaction results of 16S rDNA analysis, diversity of bacterial communities were mostly determined by OLR, not way of heating.

1. Introduction

Increased demand for poultry preparations and meat around the world has triggered a rise in meat processing facilities [1]. This directly affects the volume of processed meat and the generation of waste—including high-OLR (organic load rate), high-nutrient sewage [2]. This type of effluent poses a substantial environmental hazard, necessitating methods for its treatment, effective neutralization, and safe discharge to surface water [3]. The hazard relates to sanitary risk, malodorous emissions, and potential contribution to eutrophication and degradation of natural water bodies [4]. One of the preferred methods of treating industry effluent—shown to be effective both in experimental studies and in large-scale facilities—is anaerobic digestion (AD) [5]. AD provides effective biodegradation of organic matter with concurrent production of methane-rich biogas [6,7]. This method is also in line with the principles of circular economy, renewable energy, and greenhouse gas mitigation [8]. Neutralization of meat-industry waste requires efficient processing methods. This, combined with the general profile of the waste, means that mesophilic anaerobic treatment is usually used [9]. The high temperature of the processes accelerates waste degradation, improves treatment efficiency, ensures partial sanitization of the effluent, and boosts methane production [10]. This does, however, require some energy input to keep the reactor temperature within the 50–55 °C range [11]. To that end, efficient, effective, and energy-saving solutions are needed to provide and maintain heat in the system [12].
CHP (combined heat and power plants), common in biogas production and processing, are often used for this purpose [13]. Such plants generate both electricity (fed into the power grid) and waste heat, the latter of which can be reused to heat digesters [14]. However, operators are increasingly turning to other, competitive methods of harnessing and utilizing biogas that eliminate free heat exposure. It has been noted that it is more economically and environmentally sound to instead condition/upgrade biogas and feed it into gas pipelines and/or use it as vehicle fuel [15]. This necessitates other, competitive methods for heating anaerobic digesters to ensure stable temperatures and maintain high rates of waste biodegradation during AD. Sought-after methods should also successfully eliminate processing complications, i.e., fouling and blockage occurring when using exchangers, water jackets, or vapor injectors [16].
One such alternative is to use electromagnetic microwave radiation (EMR). This technique has been shown to be effective in studies, but requires additional validation and experimental work before it can be implemented in practical settings [17]. Microwaves (MW) are part of the electromagnetic spectrum with a wavelength ranging from 1 mm to 1 m, which corresponds to a frequency range of 300 MHz to 300 GHz [18]. MW radiation is selective, meaning that it interacts exclusively with materials characterized by specific dielectric properties [19]. In conventional heating, heat energy radiates into the material through convection and heat transfer from the surface. By contrast, MW energy is delivered directly to the material through molecular interaction with the electromagnetic field. This means that the inside of the exposed material is quicker to heat, with lower temperature gradients between the surface and the core—a process referred to as “volumetric heating” [20]. MW heating is much quicker and more energy-efficient [21]. Furthermore, heat transfer can be stopped immediately by turning off the power [22]. MW heating of a medium via a wave-guide eliminates energy waste and problematic fouling/blockage of heat exchangers [23]. Microwaves can also be focused and directed as needed [24]. Many literature reports have noted increased enzymatic activity in systems heated with MW. This is directly attributable to the nonthermal effects of microwave radiation, which induces the microbial community to develop within specific lines [25].
Therefore, there is real basis for examining the applicability of MW as a heat source for anaerobic digestion. So far, little attention has been given to research on the use of EMR to stimulate thermal conditions in fully stirred fermentation reactors (ACSTRs). These were only preliminary and quite limited studies on the possibility of methane fermentation of expired food products, focusing only on the production efficiency and qualitative composition of biogas in mesophilic conditions [21]. The presented research is the first such comprehensive and multivariant research, where the type of heating used and thermal conditions (mesophilic, thermophilic) for biogas production were taken into account. They also assessed the impact of these elements on the biodegradation of organic pollutants and the removal of biogenic compounds, and the taxonomic characteristics of the population of anaerobic bacteria.
The aim of this study was to assess the influence of electromagnetic microwave radiation used as a heat source on impacts to anaerobic processing of high-load poultry wastewater, and to compare the performance of the MW-heated system against a conventionally heated one. The investigation also includes studying the bacterial communities with PCR-DGGE.

2. Materials and Methods

2.1. Materials

Actual H-LPW from turkey slaughter and meat processing was used as the test material. The commercial offer from the producer encompasses a wide assortment of products, including turkey wings, hearts, quarters, drumsticks, cutlets, necks, gizzards, turkey breast fillets, tenderloins, livers, and shanks. The company also sells a wide range of sandwich meats, including hams, fillets, mortadellas, cooked breasts, tenderloins, frankfurters, and pâtés. The plant generates approx. 1200 m3/d H-LPW, including 16 m3 blood and 25 ton/d of soft-tissue postslaughter waste. The profile of typical poultry slaughterhouse waste (PSW) used in the experiment is presented in Table 1.
Anaerobic sludge was obtained from a commercial-scale agricultural biogas plant. The plant processes a biomass mixture that includes maize silage, turkey manure, and slaughterhouse waste. The plant operated at T = 42 ± 1 °C, OLR = 3.8 kgVS/m3·d, and HTR = 42 days. Prior to the AD process, the slaughterhouse waste (category K3) was fragmented into small pieces (average 40 mm) then pretreated (heated) at 70 °C for 60 min. The digester inoculum profile is given in Table 2.

2.2. Experimental Design

High-load poultry wastewater (H-LPW) served as the test material. The study was conducted in dynamic conditions using model anaerobic continuous stirred-tank reactors (ACSTR) running in semicontinuous mode. The experiment was divided into two stages (S) with different methods used to raise the temperature inside the ACSTR. For stage 1 (S2), the reactors were conventionally heated (C) with electric heaters, whereas for stage 2 (S2), microwave heating (MW) was used instead. The experimental works were also divided into two series (SER), depending on the temperature of the anaerobic digestion (AD) process—mesophilic digestion (35 °C) in series 1 (SER1) and thermophilic digestion (55 °C) in series 2 (SER2). Each experimental series was further subdivided into 6 process variants (V) with different OLR. Shorter hydraulic retention times (HRT) resulted in higher OLRs. Key process parameters for the different variants are given in Table 3.

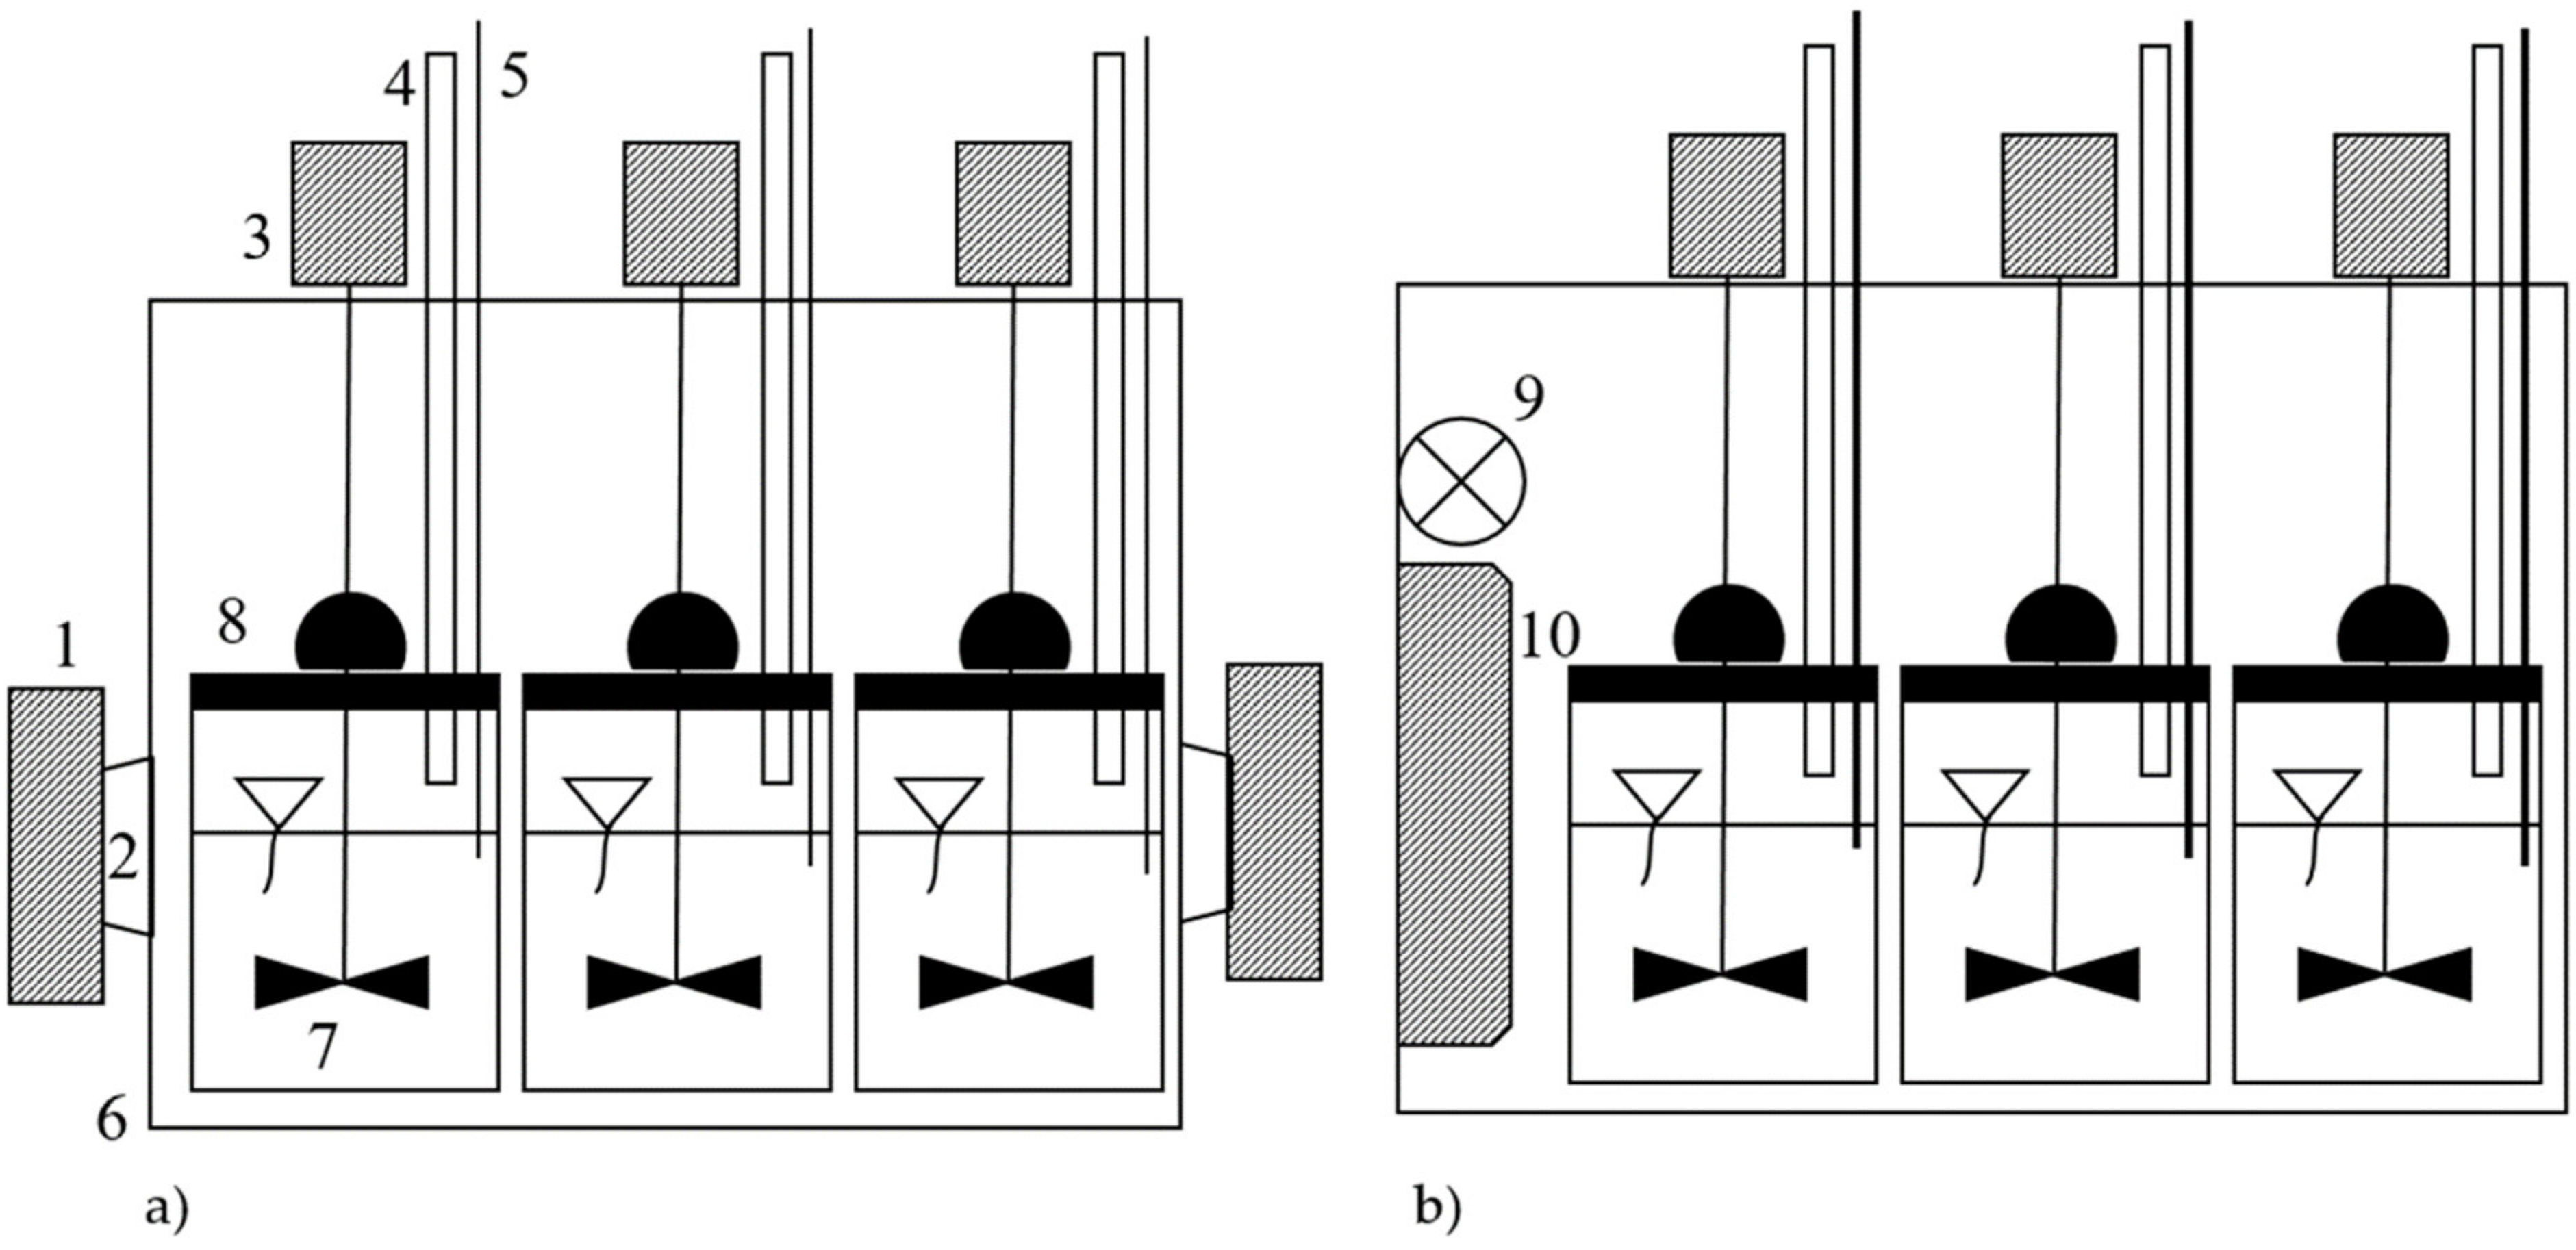
2.3. Laboratory Equipment

The H-LPW was ground using a PULVERISETTE 11 knife mill (Fritsch GmbH, Idar-Oberstein, Germany). The tank was filled with 1.0 dm3 H-LPW, which was then blended at 10,000 rpm for 90 s with a titanium four-blade knife. The thermal pretreatment (70 °C, 60 min) was performed in a FWS-30 water bath (Chemland Ltd., Stargard Szczeciński, Poland). The reactors used in the experiment were 4.0 dm3 ACSTRs, equipped with vertical agitators rotating at 40 rpm. The ACSTRs were constructed with polypropylene—a material transparent to EMR. The reactors were filled with anaerobic sludge to 11.5 ± 0.5 TS/dm3. S1 reactors were heated using 400 W electric heaters with built-in 12 W fans. In S2, the reactors were heated with MW generated by a magnetron and directed to the reactors via a wave-guide. The MW generator had a capacity of 300 W and operated at a frequency of 2.45 GHz (Plazmatronika Ltd., Wroclaw, Poland). The heating systems were activated automatically by controllers, based on temperature readings from reactor sensors. The assumed hysteresis was ± 1 °C. The experiment was conducted at 35 °C (SER1) and 55 °C (SER2). The feedstock HRT in the digester was 20 days. Once per day, the digestate was removed, and the reactor refilled with fresh, pretreated slaughterhouse waste. A diagram of the reactors is shown in Figure 1.

2.4. Analytical Methods

TP, COD, TN, and N–NH4 in the wastewater were measured using a DR 5000 spectrophotometer with an HT 200 s mineralizer (Hach-Lange GmbH, Düsseldorf, Germany). TOC content was determined by means of a TOC-L analyzer (Shimadzu, Kyoto, Japan). VS, MS, and TS were determined by weighing using the dry-matter/ignition method (PN-EN 15935:2022-01). TC, TOC, and TN in the digestate were measured with a Flash 2000 analyzer (Thermo Scientific, Waltham, MA, USA). TP was determined colorimetrically at 390 nm (DR 2800 spectrophotometer, Hach-Lange GmbH, Düsseldorf, Germany) after prior mineralization. Total protein was determined by multiplying the TN value by 6.25. Reducing sugars were detected colorimetrically with an anthrone reagent at 600 nm (DR 2800, Hach-Lange GmbH, Düsseldorf, Germany). Lipids were determined using the Soxhlet method (Buchi AG, Flawil, Switzerland). The pH was measured using a pH meter (HQ11D, Hach-Lange GmbH, Düsseldorf, Germany).
The instantaneous and total biogas amounts were measured with a mass flow meter (Aalborg Instruments Inc., Orangeburg, NY, USA). The composition of biogas produced at each section of reactor was measured every 24 h using a gas-tight syringe (20 cm3 injection volume) and a gas chromatograph (GC, 7890A Agilent) equipped with a thermal conductivity detector (TCD). The GC was fitted with a Porapak Q column (80/100), two molecular sieve columns (60/80 mesh), and two Hayesep Q columns (80/100 mesh), operating at 70 °C. The temperature at the injection and detector ports was 150 and 250 °C, respectively. Argon and helium were used as the carrier gases at a flow rate of 15 cm3/min. The levels of methane (CH4) and carbon dioxide (CO2) were also measured.

2.5. PCR-DGGE

Biomass from each experimental variant was collected in two replicates to molecular analysis. DNA was extracted following the protocol of a FastDNA® SPIN®Kit (Q-BIOgene). Concentration of the DNA was measured spectrophotometrically using NanoDrop One (Thermo Scientific). PCRs were performed in an Eppendorf® Mastercycler Gradient (Eppendorf, Hamburg, Germany). The bacterial diversity in the experiments was based on an analysis of the V3 region within the bacterial 16S rDNA with primer set 341F/515R [26]. The PCR-DGGE conditions are described elsewhere [27].

2.6. Statistical Methods

The duration of each variant was 30 days, which allowed for a full hydraulic exchange of the active volume of the bioreactor from about 2 times in V1 (1.0 gCOD/dm3·d) to 11 times in V6 (6.0 gCOD/dm3·d). Samples for H-LPW analysis were collected six times (every 5 days) during each research variant. Statistical analysis of the results was performed using the STATISTICA 13.1 PL package (StatSoft, Inc., Tulsa, OK, USA). The verification of the hypothesis concerning the distribution of each tested variable was determined on the basis of the Shapiro–Wilk test. One-way analysis of variance (ANOVA) was used to determine significant differences between variables. The homogeneity of variance in the groups was checked using Levene’s test. Additionally, Tukey’s HSD test was used to determine the significance of differences between the analyzed variables. The results were considered significant at p = 0.05.

3. Results

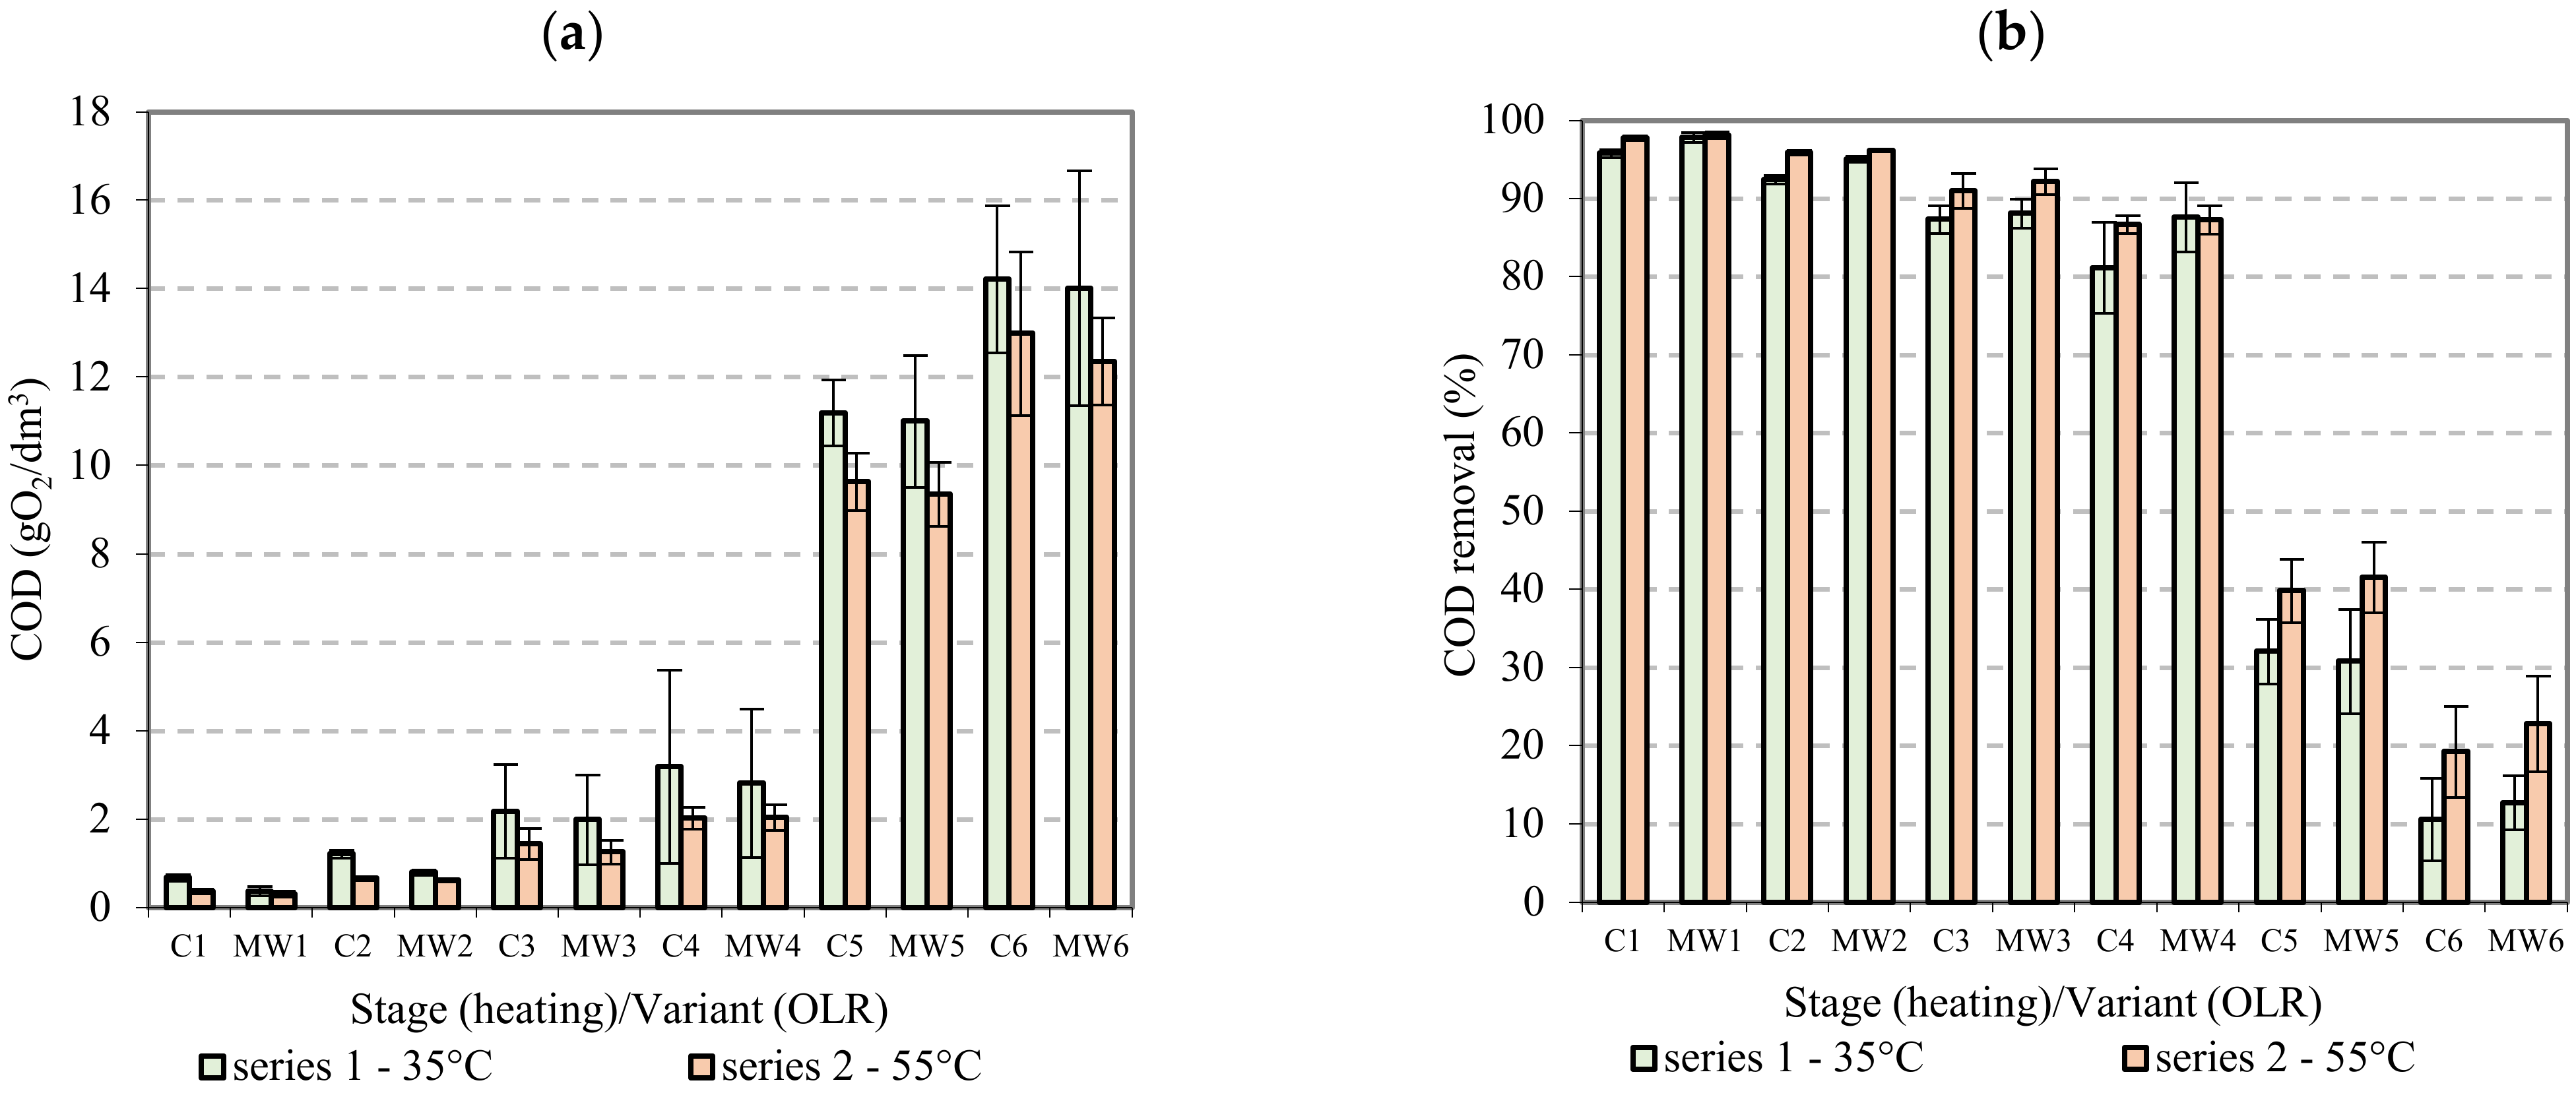
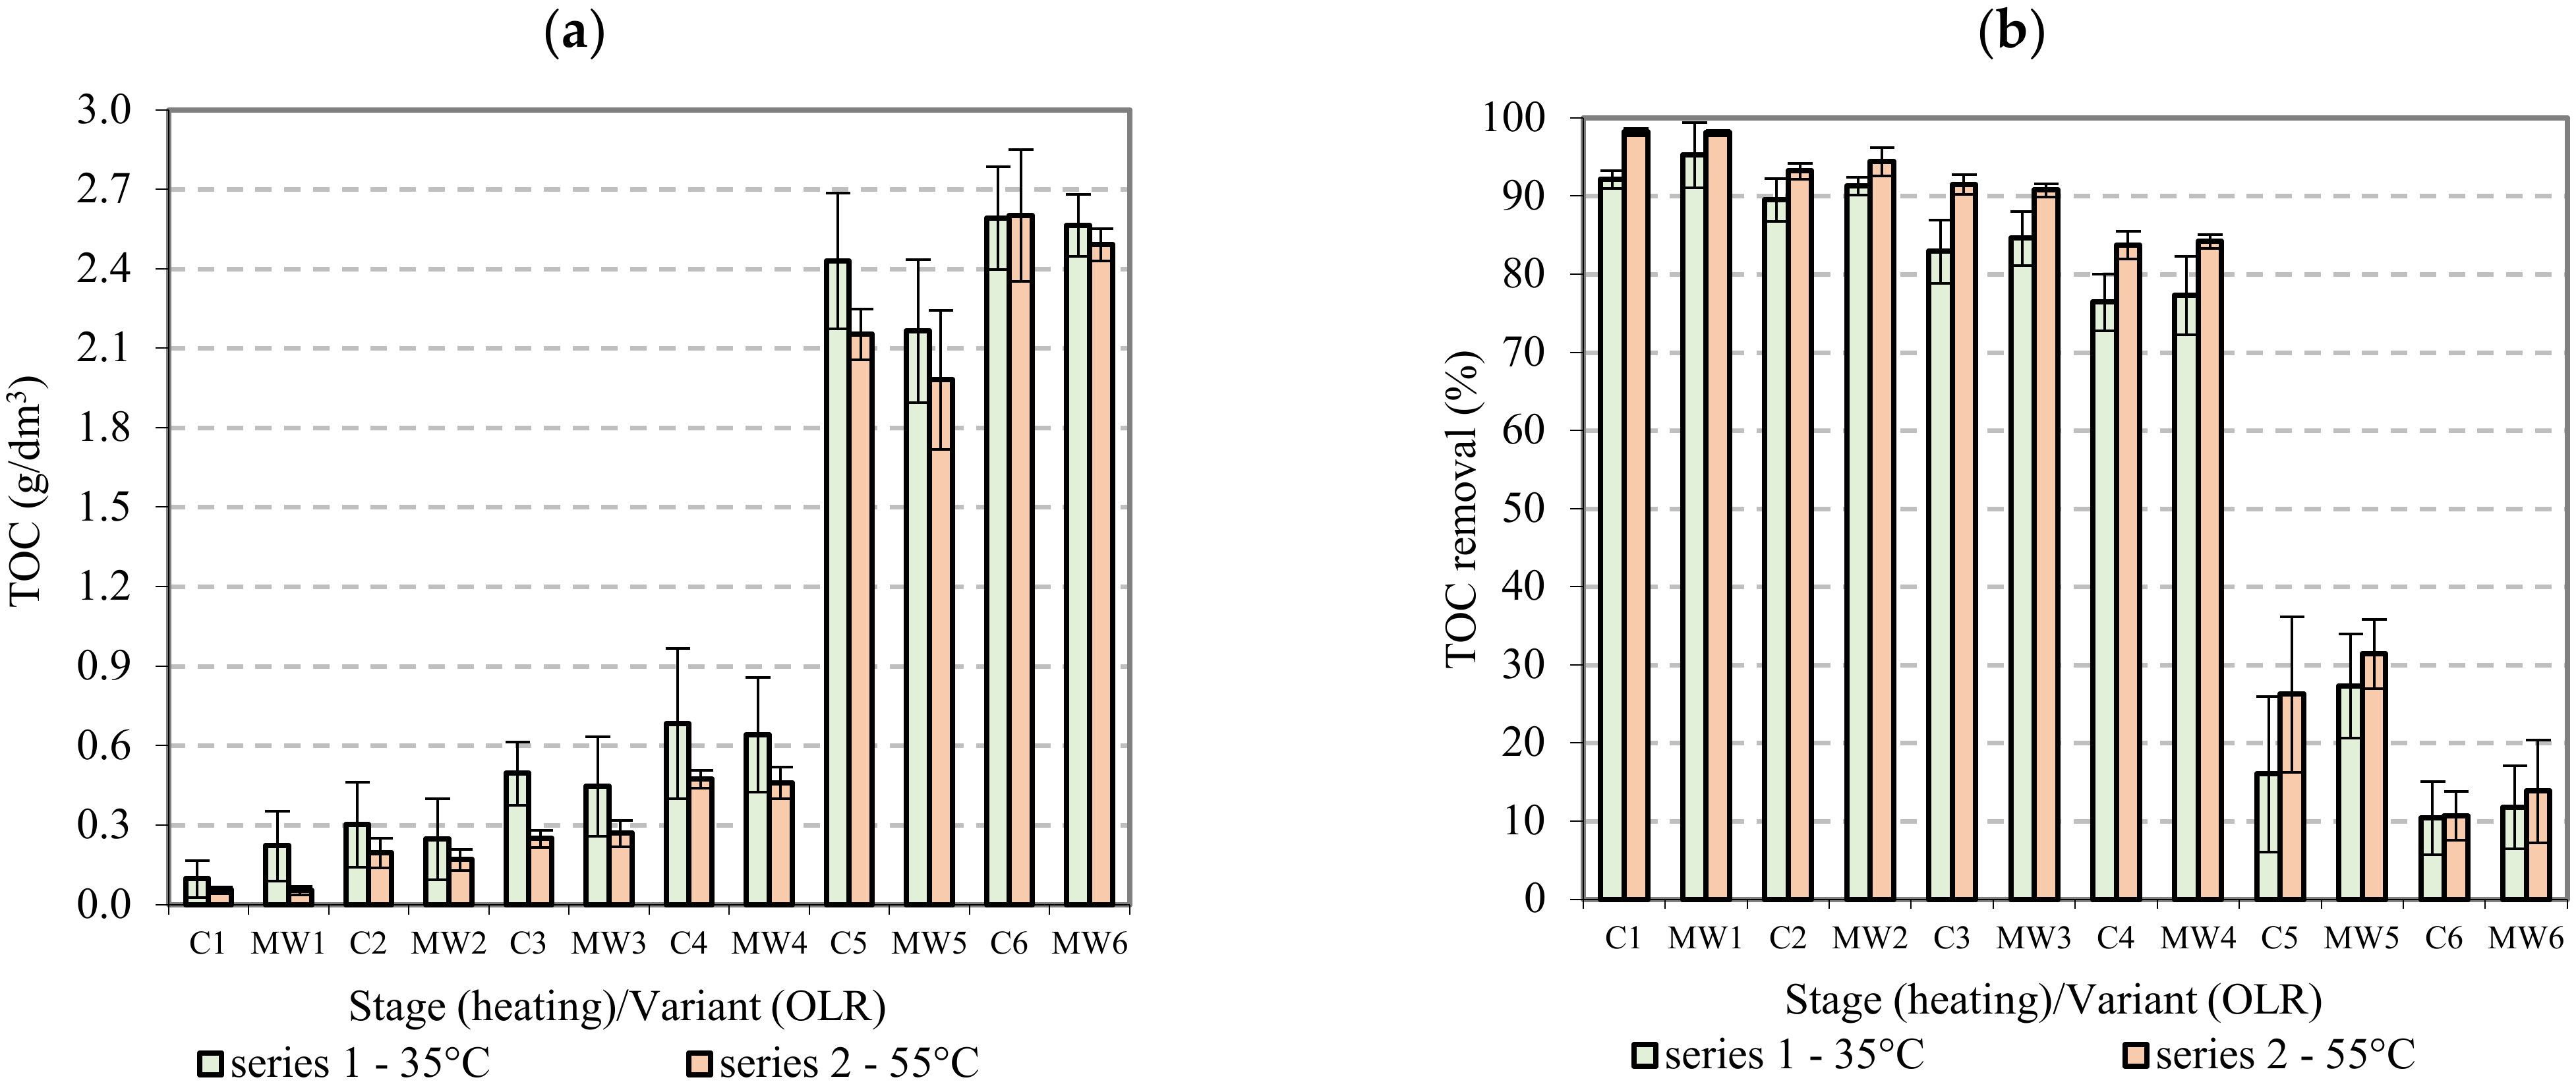
3.1. Organic Compounds
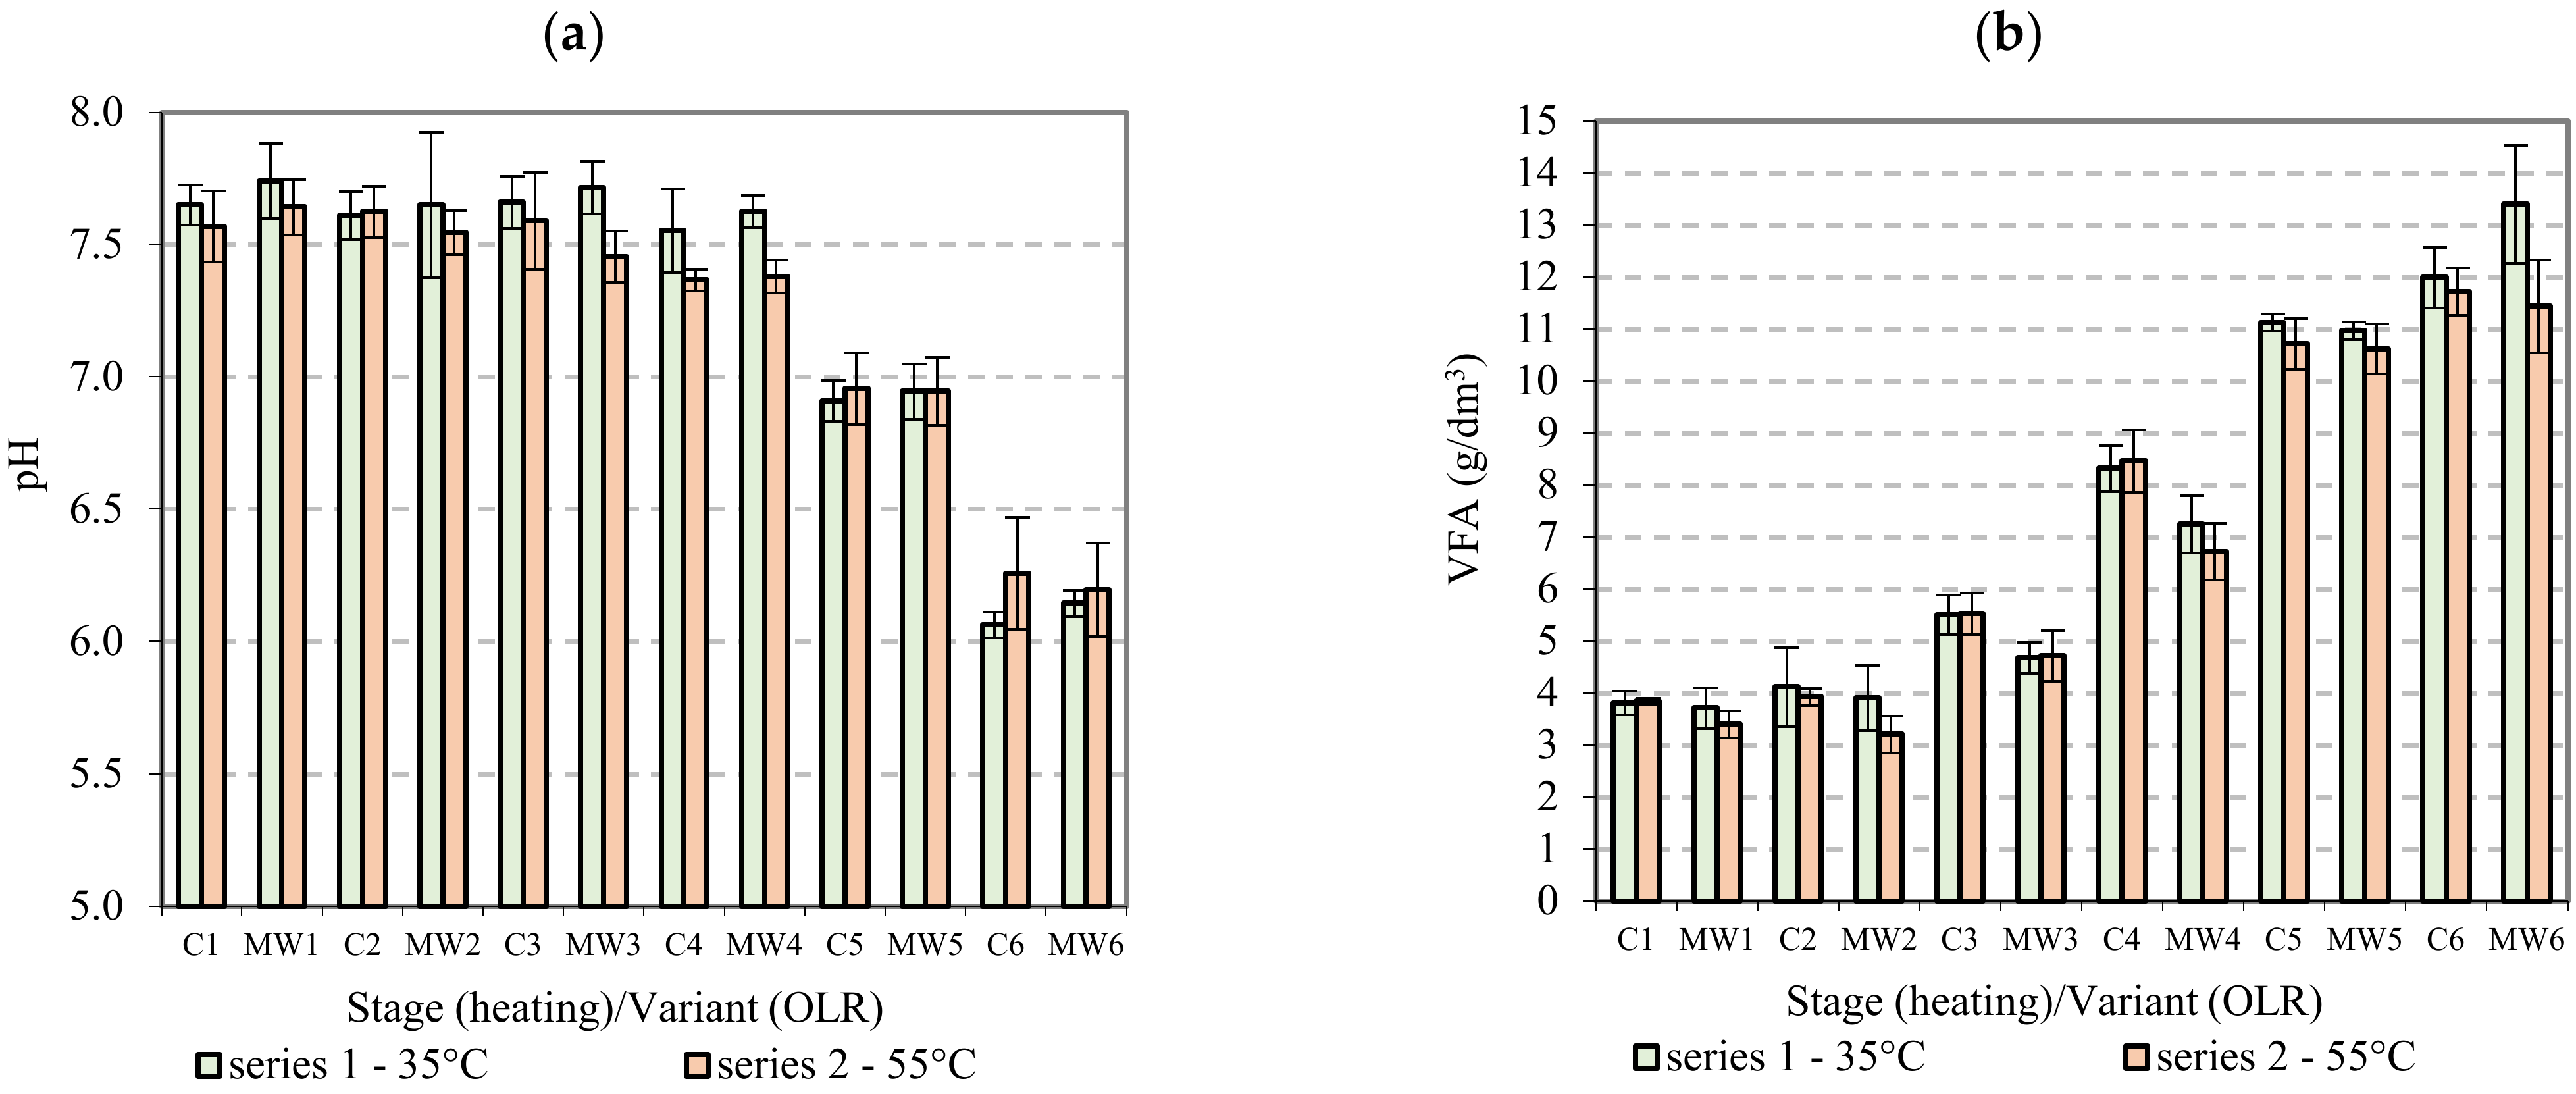
S2V1 had the lowest level of COD. Effluent from the MW-heated reactors contained, on average, 0.30 ± 0.07 gO2/dm3 in SER2 (55 °C) and 0.38 ± 0.10 gO2/dm3 in SER1 (35 °C) (Table 4, Figure 2a). The corresponding COD removal rates were 97.8 ± 0.6% and 98.1 ± 0.4%, respectively (Table 4, Figure 2b). S1 (C) had significantly higher COD. The SER1 (35 °C) effluent contained 0.68 ± 0.08 g O2/dm3, whereas SER2 (55 °C) effluent had 0.37 ± 0.05 gO2/dm3 (Table 4, Figure 2a). Removal rates were 95.7 ± 0.5% and 97.7 ± 0.3%, respectively (Table 4, Figure 2b). Increasing the OLR to 2.0 gCOD/dm3·d (V2) led to a parallel increase in the effluent COD. The lowest COD values within V2 were noted in S2 (MW) at 0.80 ± 0.06 gO2/dm3 (SER1/35 °C) and 0.62 ± 0.03 gO2/dm3 (SER2/55 °C) (Table 4, Figure 2a). This translated to COD removal rates of 95.0 ± 0.4% in SER1 and 96.1 ± 0.2% in SER2 (Table 4, Figure 2b). Effluent COD in S1SER1 was 1.21 ± 0.09 gO2/dm3 (Table 4, Figure 2a), at a removal rate of 92.4 ± 0.5% (Table 4, Figure 2b). The results for S1SER2 (55 °C) were comparable to S2SER2, with COD levels of 0.66 ± 0.05 gO2/dm3 (Table 4, Figure 2a). COD removal rate was 95.9 ± 0.3%, being significantly higher than in S1SER1 (Table 4, Figure 2b).
Systems working under V3 conditions (3.0 gCOD/dm3·d) had similar levels of organic compounds in the final effluent, with no significant differences between heating types. COD removal rates were also comparable. On the other hand, individual series (SER) did exhibit significant differences. S1SER2 effluent contained 1.44 ± 0.35 gO2/dm3, compared to the 2.18 ± 0.83 gO2/dm3 noted for S1SER1 (Table 4, Figure 2a). A similar pattern emerged for S2, with COD removal of approx. 92.1 ± 1.7% at 55 °C and 88.1 ± 1.9% at 35 °C (Table 4, Figure 2b). A significant reduction in H-LPSW treatment performance was observed for V5 (OLR = 5.0 gCOD/dm3·d). The levels for S1SER1 (35 °C) and S2SER1 were 11.19 ± 0.75 g O2/dm3 and 11.07 ± 1.49 mg O2/dm3, respectively (Figure 2a), with corresponding COD removal rates of 32.1 ± 4.1% and 30.8 ± 6.7%, respectively (Table 4, Figure 2b). The 55 °C (SER2) process provided significantly better performance. S2SER2 managed to remove 41.6 ± 4.5% COD, compared to only 39.8 ± 4.1% in S1SER2 (Table 4, Figure 2b). Setting the OLR at the V6 level led to a total cessation of COD removal. COD levels in the final effluents were fairly similar, with only nonsignificant differences. The lowest COD value was 12.35 ± 0.98 g O2/dm3 (S2SER2), whereas the highest one peaked at 14.31 ± 2.66 g O2/dm3 (S1SER1) (Table 4, Figure 2a). This means that S2SER2 (55 °C) performed the best in terms of COD removal (22.8 ± 6.1%) (Table 4, Figure 2b).
Similar trends were observed for TOC. SER2V1 (both stages) had the lowest TOC levels in the effluent at 0.06 ± 0.01 g/dm3 (Table 4, Figure 3a), which translated to the removal rate of 98 ± 0.3% (Table 4, Figure 3b). Significantly higher TOCs were observed for S2SER1—0.22 ± 0.13 g/dm3—whereas S1SER1 produced 0.10 ± 0.07 g/dm3 (Table 4, Figure 3a). An increase in OLR to 2.0 gCOD/dm3·d led to a corresponding spike in the effluent TOC. In this case, the MW-heated series (S2) produced the lowest values: 0.25 ± 0.15 g/dm3 in SER1 (35 °C) and 1.70 ± 0.04 g/dm3 in SER2 (55 °C) (Table 4, Figure 3a). The V2 reactors thus managed to remove over 91% TOC (Table 4, Figure 3b). On the other hand, there were no statistically significant differences in TOC between the two stages of V3 (3.0 gCOD/dm3·d). The H-LPSW treatment performance was also similar across all series. The TOC in S1SER1 (35 °C) reached 0.50 ± 0.19 g/dm3 (82.9 ± 4.1%) versus 0.45 ± 0.18 g/dm3 (84.6 ± 3.5%) in S2SER1 (Table 4, Figure 3a,b). Significantly better results were obtained in SER2 (55 °C), with removal rates exceeding 90% (Table 4, Figure 3b). Incremental increases in effluent TOC were noted for variant V5 (5.0 gCOD/dm3). Final TOCs for S1SER2 (55 °C) and S2SER2 were 2.15 ± 0.10 g/dm3 and 1.98 ± 0.26 g/dm3, respectively (Table 4, Figure 3a). Effluent TOC in the V6 groups ranged from 2.49 ± 0.06 g/dm3 (S2SER2) to 2.60 ± 0.25 g/dm3 (S1SER1) (Table 4, Figure 3a). Peak efficiency, reaching 13.8 ± 6.5%, was demonstrated for S2SER2 (Table 4, Figure 3b).

3.2. pH and VFA

The pH was fairly stable across the tested OLR range (1.0 gCOD/dm3·d to 4.0 gCOD/dm3·d). The pH fell within the narrow range of 7.74 ± 0.14 pH to 7.37 ± 0.04 pH in both stages and series (Figure 4a). Significantly lower pH was noted in V5, with values of 6.91 ± 0.08 pH for S1SER1 and up to 6.96 ± 0.14 pH in S1SER2 (Figure 4a). All series of S2 had similar pH at 6.95 ± 0.13 (Figure 4a). An increase in OLR to 6.0 gCOD/dm3·d led to a significant decrease in the pH. The values in this variant fell within the narrow range of 6.06 ± 0.05 pH to 6.26 ± 0.21 pH, depending on the stage and series (Figure 4a).
The lowest values regarding VFA levels in the effluent were noted for S2V1 and S2V2. In the former, the final concentration was 0.34 ± 0.03 g/dm3 in SER2 (55 °C) and 0.37 ± 0.04 g/dm3 in SER1 (35 °C) (Figure 4b). The corresponding values for S2V2 were 0.32 ± 0.03 g/dm3 (SER2) and 0.39 ± 0.06 g/dm3 (SER1) (Figure 4b). V3 showed a significant rise in effluent VFA. The final concentrations in S1SER1 and S2SER1 were 0.55 ± 0.04 g/dm3 and 0.47 ± 0.03 g/dm3, respectively (Figure 4b). Significant differences between the two stages were also noted for SER2 (55 °C). S1 had effluent VFA levels of 0.55 ± 0.04 g/dm3, compared to the 0.47 ± 0.05 g/dm3 noted in S2 (Figure 4b). V3 had significantly higher VFA levels—0.83 ± 0.05 g/dm3 in S1SER1 and 0.85 ± 0.06 g/dm3 in S1SER2 (Figure 4b). The MW heating (S2) significantly decreased the VFA levels, with 0.72 ± 0.06 g/dm3 in SER1 (35 °C) and 0.67 ± 0.05 g/dm3 in SER2 (Figure 4b). Further increases in effluent VFA were noted for variant V5 (5.0 gCOD/dm3). S1SER1 (35 °C) and S2SER1 produced 1.11 ± 0.02 g/dm3 and 1.07 ± 0.05 g/dm3, respectively (Figure 4b). By comparison, the values for SER2 (55 °C) were 1.09 ± 0.02 g/dm3 (S1) and 1.06 ± 0.05 g/dm3 (S2) (Figure 4b). The OLR 6.0 gCOD/dm3 groups exhibited even higher concentrations of VFAs in the effluent, up to a level of 1.34 ± 0.11g/dm3 (S2SER1) (Figure 4b).

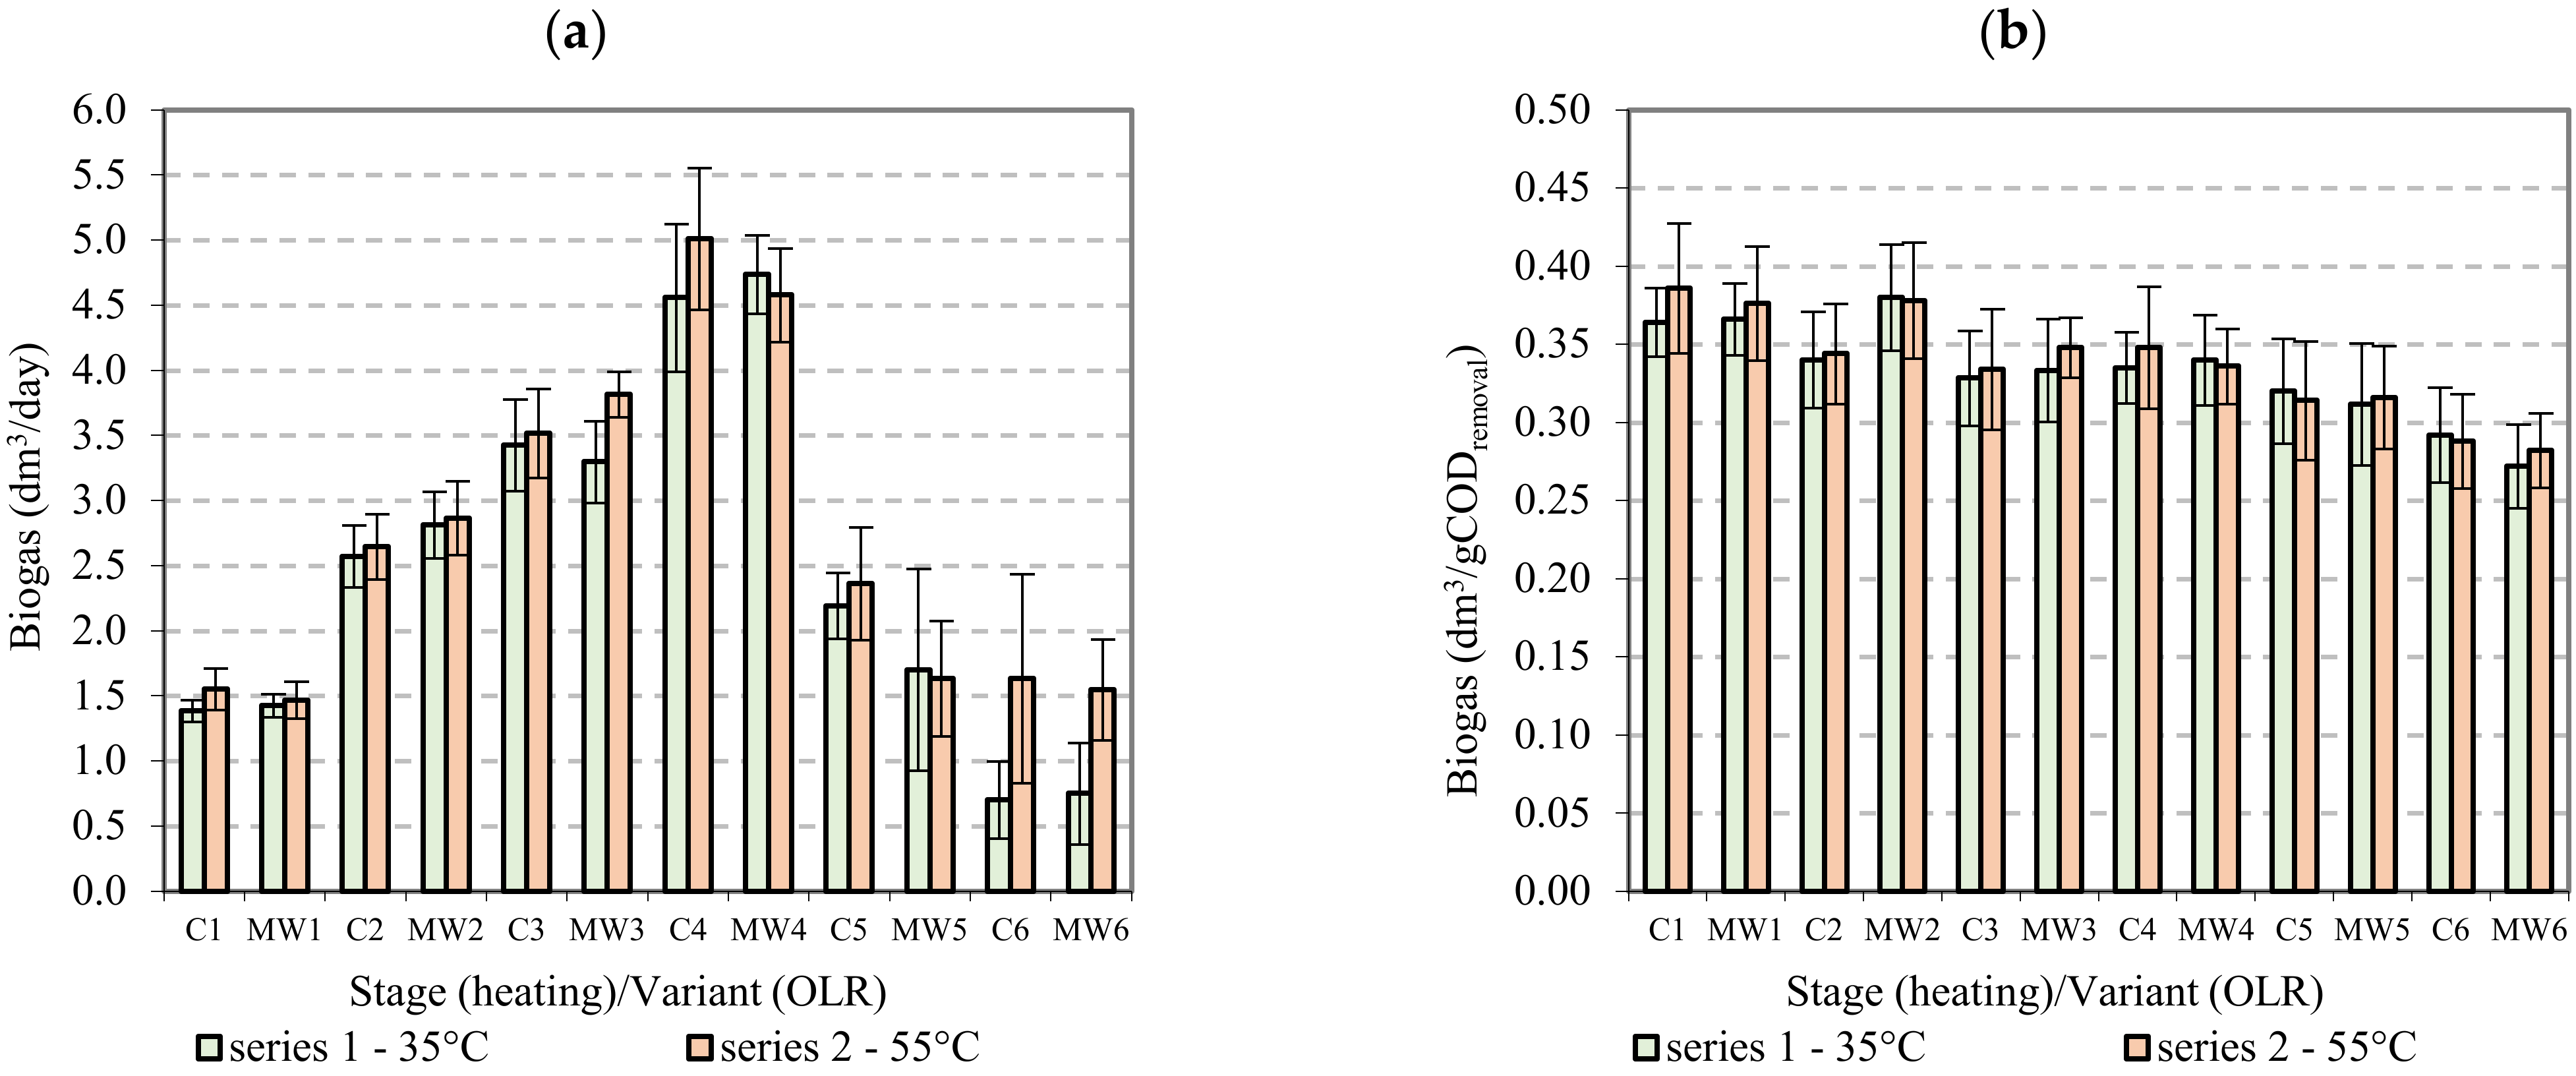
3.3. Biogas and Methane

S1SER1V1 produced 1.39 ± 0.08 dm3 biogas/day (Figure 5a), which contained 54.8 ± 3.9% CH4 on average. By comparison, S2SER1V1 yielded 1.42 ± 0.09 dm3 biogas/day (Figure 5a), with a CH4 fraction of 64.9 ± 3.0%. S1SER2 (55 °C) showed increased biogas output at 1.55 ± 0.16 dm3/day, (62.6 ± 3.2% CH4), whereas S2SER2 produced 1.47 ± 0.14 dm3/day (67.0 ± 3.0% CH4) (Figure 5a). In the OLR = 2.0 gCOD/dm3·d variant (V2), the specific biogas production was at 0.34 ± 0.03 dm3/gCODrem. (Figure 5b). The CH4 fractions were 66.2 ± 4.2% in S1SER1 and 68.3 ± 2.6% in S1SER2, with nominal yields of 2.57 ± 0.24 dm3/day and 2.65 ± 0.25 dm3/day (Figure 6a). The CH4 fractions in S2SER1 (35 °C) and S2SER2 were 67.4 ± 6.1%. and 68.5 ± 3.8%, respectively (Figure 6a). Daily biogas production was around 2.81 ± 0.26 dm3/day in SER1 and 2.86 ± 0.28 dm3/day in SER2 (Figure 5a). The specific methane production was about 0.26 ± 0.02 dm3/gCODin in E2SER1 and E2SER2 (Figure 6b). The methane fraction in the biogas peaked in V3. The MW-heated series (S2) produced 66.7 ± 2.9% CH4 (SER1/35 °C) and 70.4 ± 2.7% (SER2/55 °C) (Figure 6a). Biogas yields significantly exceeded those in V2, reaching 3.30 ± 0.31 dm3/day in SER1 and 3.82 ± 0.18 dm3/day in SER2 (Figure 5a). The corresponding production rates were 0.33 ± 0.03 dm3/gCODrem. and 0.35 ± 0.02 dm3/gCODrem., respectively (Figure 5b). S1 boasted similar output. CH4 levels in the biogas were significantly lower in V4: 42.3 ± 2.9% in S1SER1 and 53.3 ± 5.5% in S1SER2, with production rates of 4.56 ± 0.57 dm3/day and 5.01 ± 0.54 dm3/day, respectively. Daily yields, however, were the highest among the tested OLR variants. Specific biogas output was around 0.34 ± 0.02 dm3/gCODrem. in SER1 (35 °C) and 0.30 ± 0.04 dm3/gCOD in SER2 (55 °C) (Figure 5b). The biogas produced in the MW-heated reactors (S2) contained 49.4 ± 3.4% CH4 in SER1 and 56.7 ± 3.7% CH4 in SER2, with yields of 4.74 ± 0.30 dm3/day and 4.58 ± 0.36 dm3/day, respectively (Figure 6a).
Anaerobic digestion performance was significantly worse at higher OLRs. The 6.0 kgCOD/dm3·d groups had the lowest methane fractions of all, producing just 29.2 ± 2.2% to 30.4 ± 1.9% CH4 (Figure 6a). Nominal biogas output was also lower in V5 and V6 compared to the earlier variants. Yields in V5 ranged from 1.70 ± 0.78 dm3/day to 2.36 ± 0.43 dm3/day, whereas V6 produced only 0.70 ± 0.30 dm3/day to 1.63 ± 0.80 dm3/day, depending on the process used. Of the V6 groups, SER2 (55 °C) boasted significantly higher biogas production, both in conventionally heated and MW-heated reactors.

3.4. Nitrogen and Phosphorus

The V1 groups showed no statistically significant differences in effluent TN. S2SER1 (35 °C) and S2SER2 (55 °C) effluent contained 0.263 ± 0.029 gTN/dm3 and 0.273 ± 0.027 gTN/dm3, respectively, meaning that 48.5 ± 3.7% and 49.2 ± 5.2% of nitrogen was removed, respectively (Table 5). Conventionally heated reactors (S1) showed similar performance, with TN in the effluent ranging from 0.283 ± 0.033 gTN/dm3 (SER1) to 0.291 ± 0.029 gTN/dm3 (SER2) (Table 5). Effluent TN was positively correlated with the OLR. At loadings of 2.0 gCOD/m3·d, TN levels in the effluent were 0.351 ± 0.026 gTN/dm3 in S1SER1 and 0.343 ± 0.016 gTN/dm3 in S1SER2, which translated to TN removal rates of 31.5 ± 5.0% and 34.3 ± 3.2% (Table 5). Similar levels were observed for S2 effluent, with removal rates between 31.7 ± 4.7% (S2SER1) and 39.6 ± 9.5% (S2SER2) (Table 5). Subsequent variants featured diminishing TN removal rates. In V4, TN levels were 0.404 ± 0.032 gTN/dm3 in S1SER1 and 0.401 ± 0.030 gTN/dm3 in S2SER2, meaning that 21.1 ± 6.3% and 21.5 ± 4.2% of TN was removed, respectively (Table 5). The levels in S2 ranged from 0.386 ± 0.034 gTN/dm3 to 0.0389 ± 0.022 gTN/dm3, with removal rates of 24.0 ± 6.7% in SER1 and 24.6 ± 5.9% in SER2 (Table 5). Nitrogen levels in the reactor effluent peaked in V5 and V6, falling within the narrow range of 0.419 ± 0.013 gTN/dm3 to 0.470 ± 0.032 gTN/dm3 (Table 5). Removal performance was significantly worse in the 5.0 gCOD/dm3·d and 6.0 gCOD/dm3·d variants compared to the lower loadings. The poorest removal rate, reaching 8.1 ± 5.4%, was noted in S1SER1V6. SER2 (55 °C) performed slightly better, ensuring TN removal rate at 11.3 ± 6.3% (Table 5).
Among the V1 groups, effluent TP was the lowest in S2. The effluent from this MW-heated series was found to contain 0.068 ± 0.006 gTP/dm3 (SER1/35 °C) and 0.067 ± 0.007 gTP/dm3 (SER2/55 °C) (Table 5). This translated to almost 40% TP removal, regardless of anaerobic digestion temperature. S1 reactors managed to remove 30.2 ± 8.3% of TP in SER1 and 35.8 ± 4.3% of TP in SER2 (Table 5). At OLR = 2.0 gCOD/m3 (V2), the final levels were 0.082 ± 0.004 gTP/dm3 in S1SER1 and 0.075 ± 0.005 gTP/dm3 in S1SER2, translating to 28.3 ± 3.6% and 34.5 ± 4.1% removal, respectively (Table 5). Significantly lower TP values were observed for S2, i.e., 0.074 ± 0.003 g TP/dm3 in SER1 and 0.069 ± 0.003 gTP/dm3 in SER2 (Table 5). Changing the heating method and temperature did not produce any statistically significant differences in effluent TP across V3 and V4, with phosphorus levels consistently hovering around 0.090 gTP/dm3. TP in the digester effluent peaked at the highest OLRs. The values for V6 ranged from 0.102 ± 0.004 gTP/dm3 to 0.103 ± 0.004 gTP/dm3 in S1 and from 0.100 ± 0.005 gTP/dm3 to 0.101 ± 0.007 gTP/dm3 in S2 (Table 5).

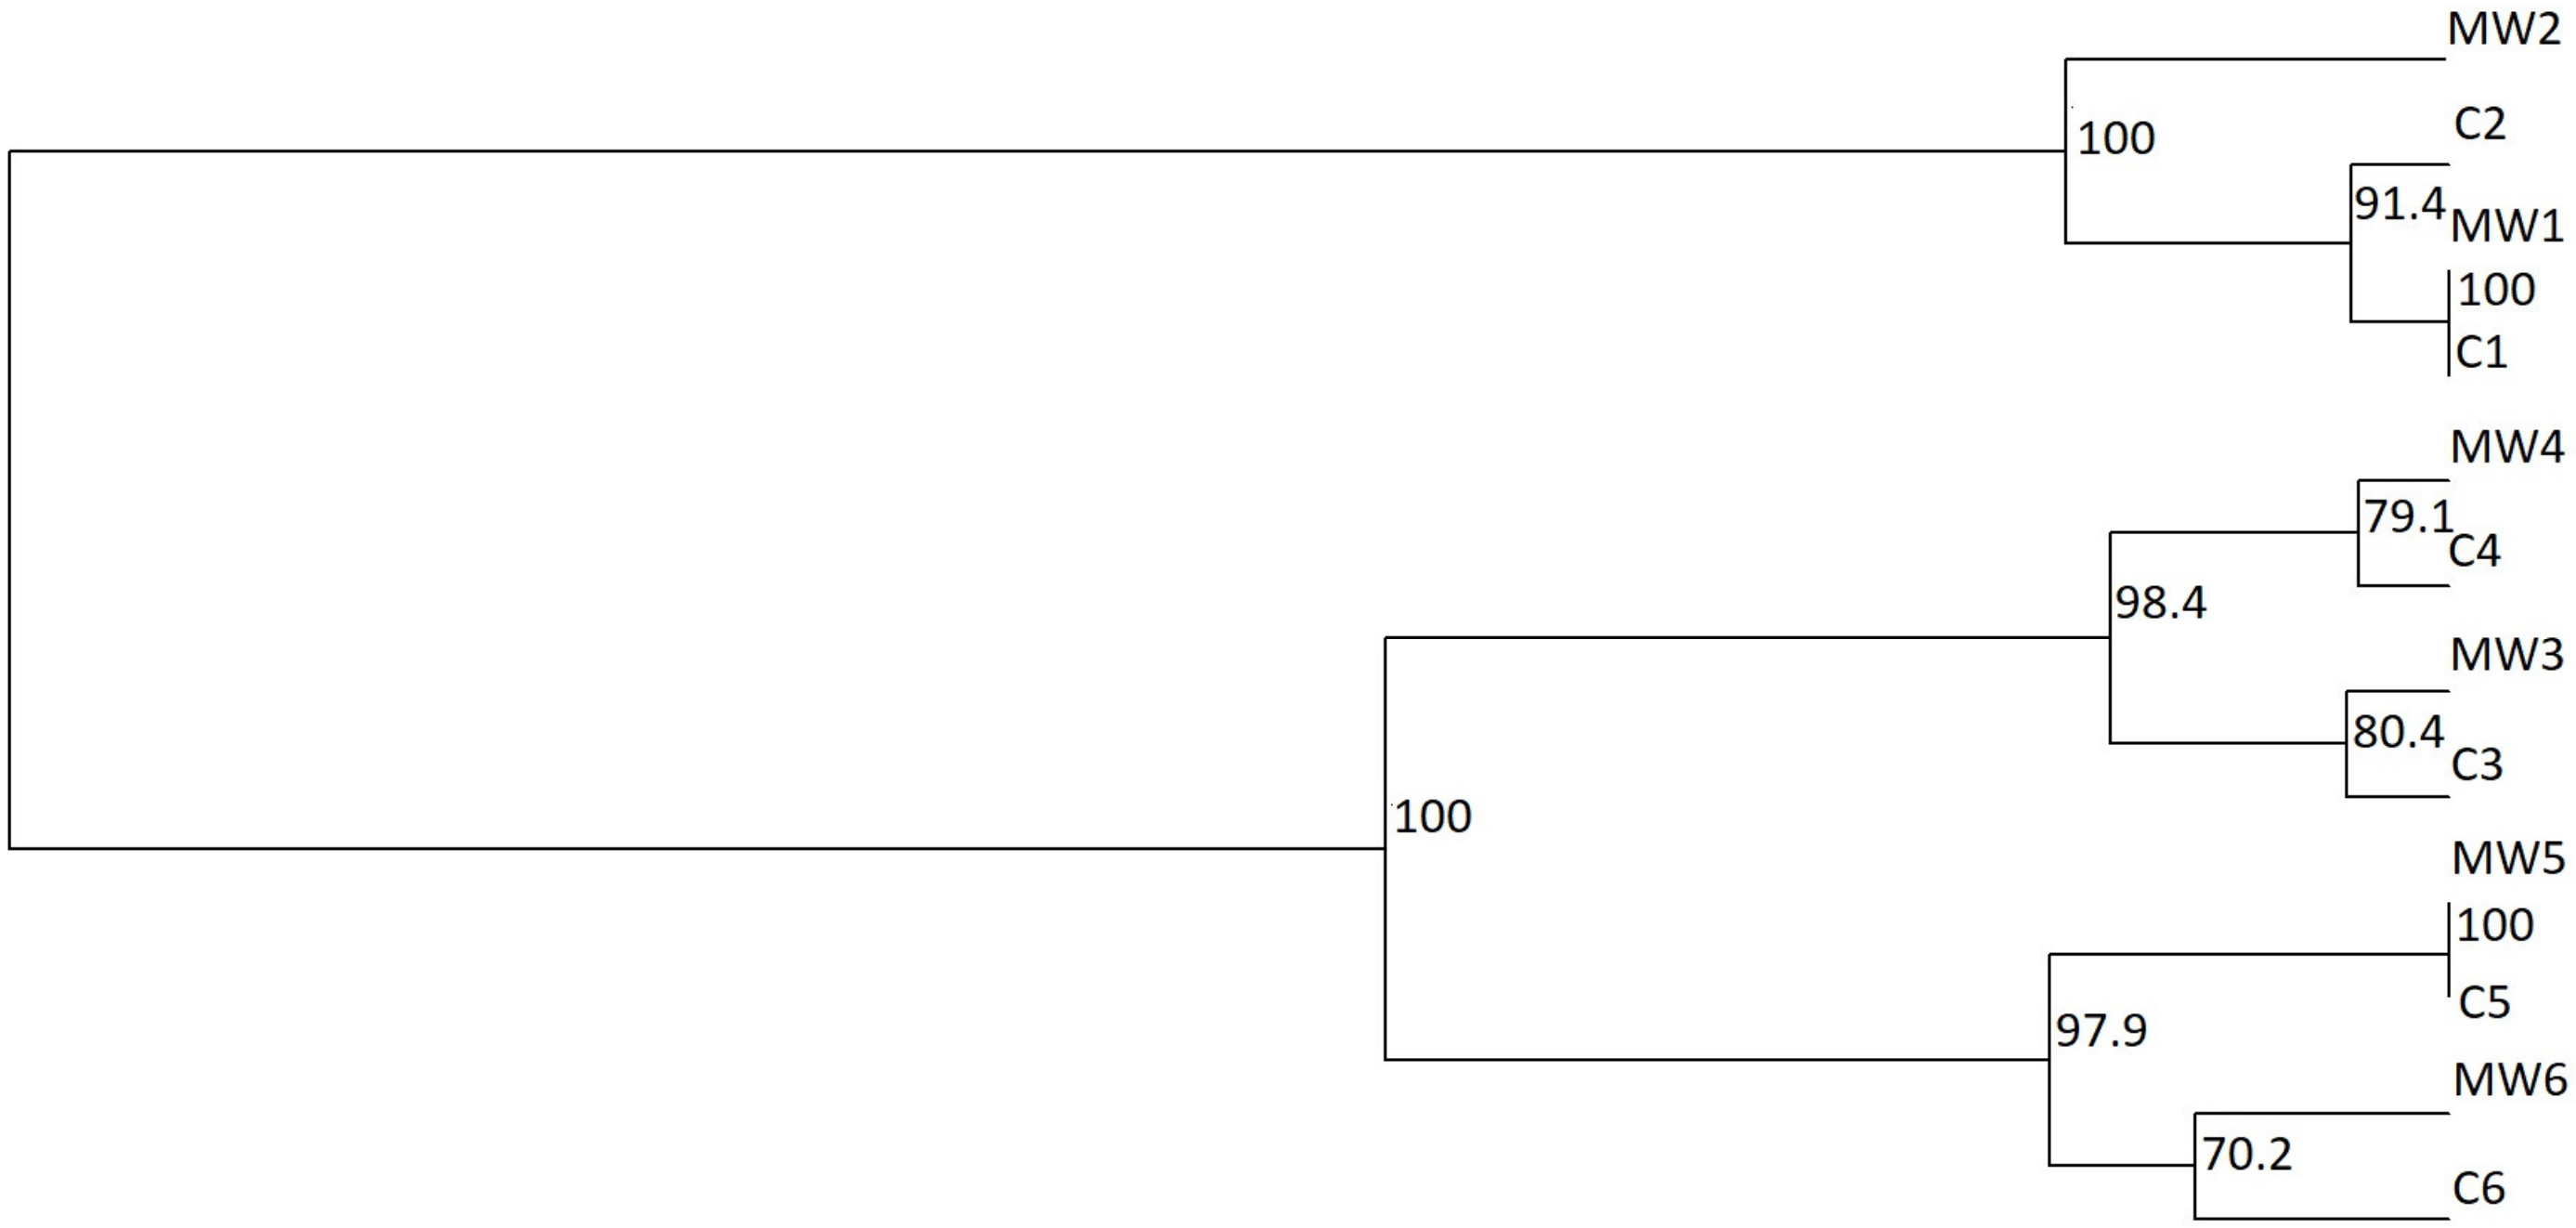
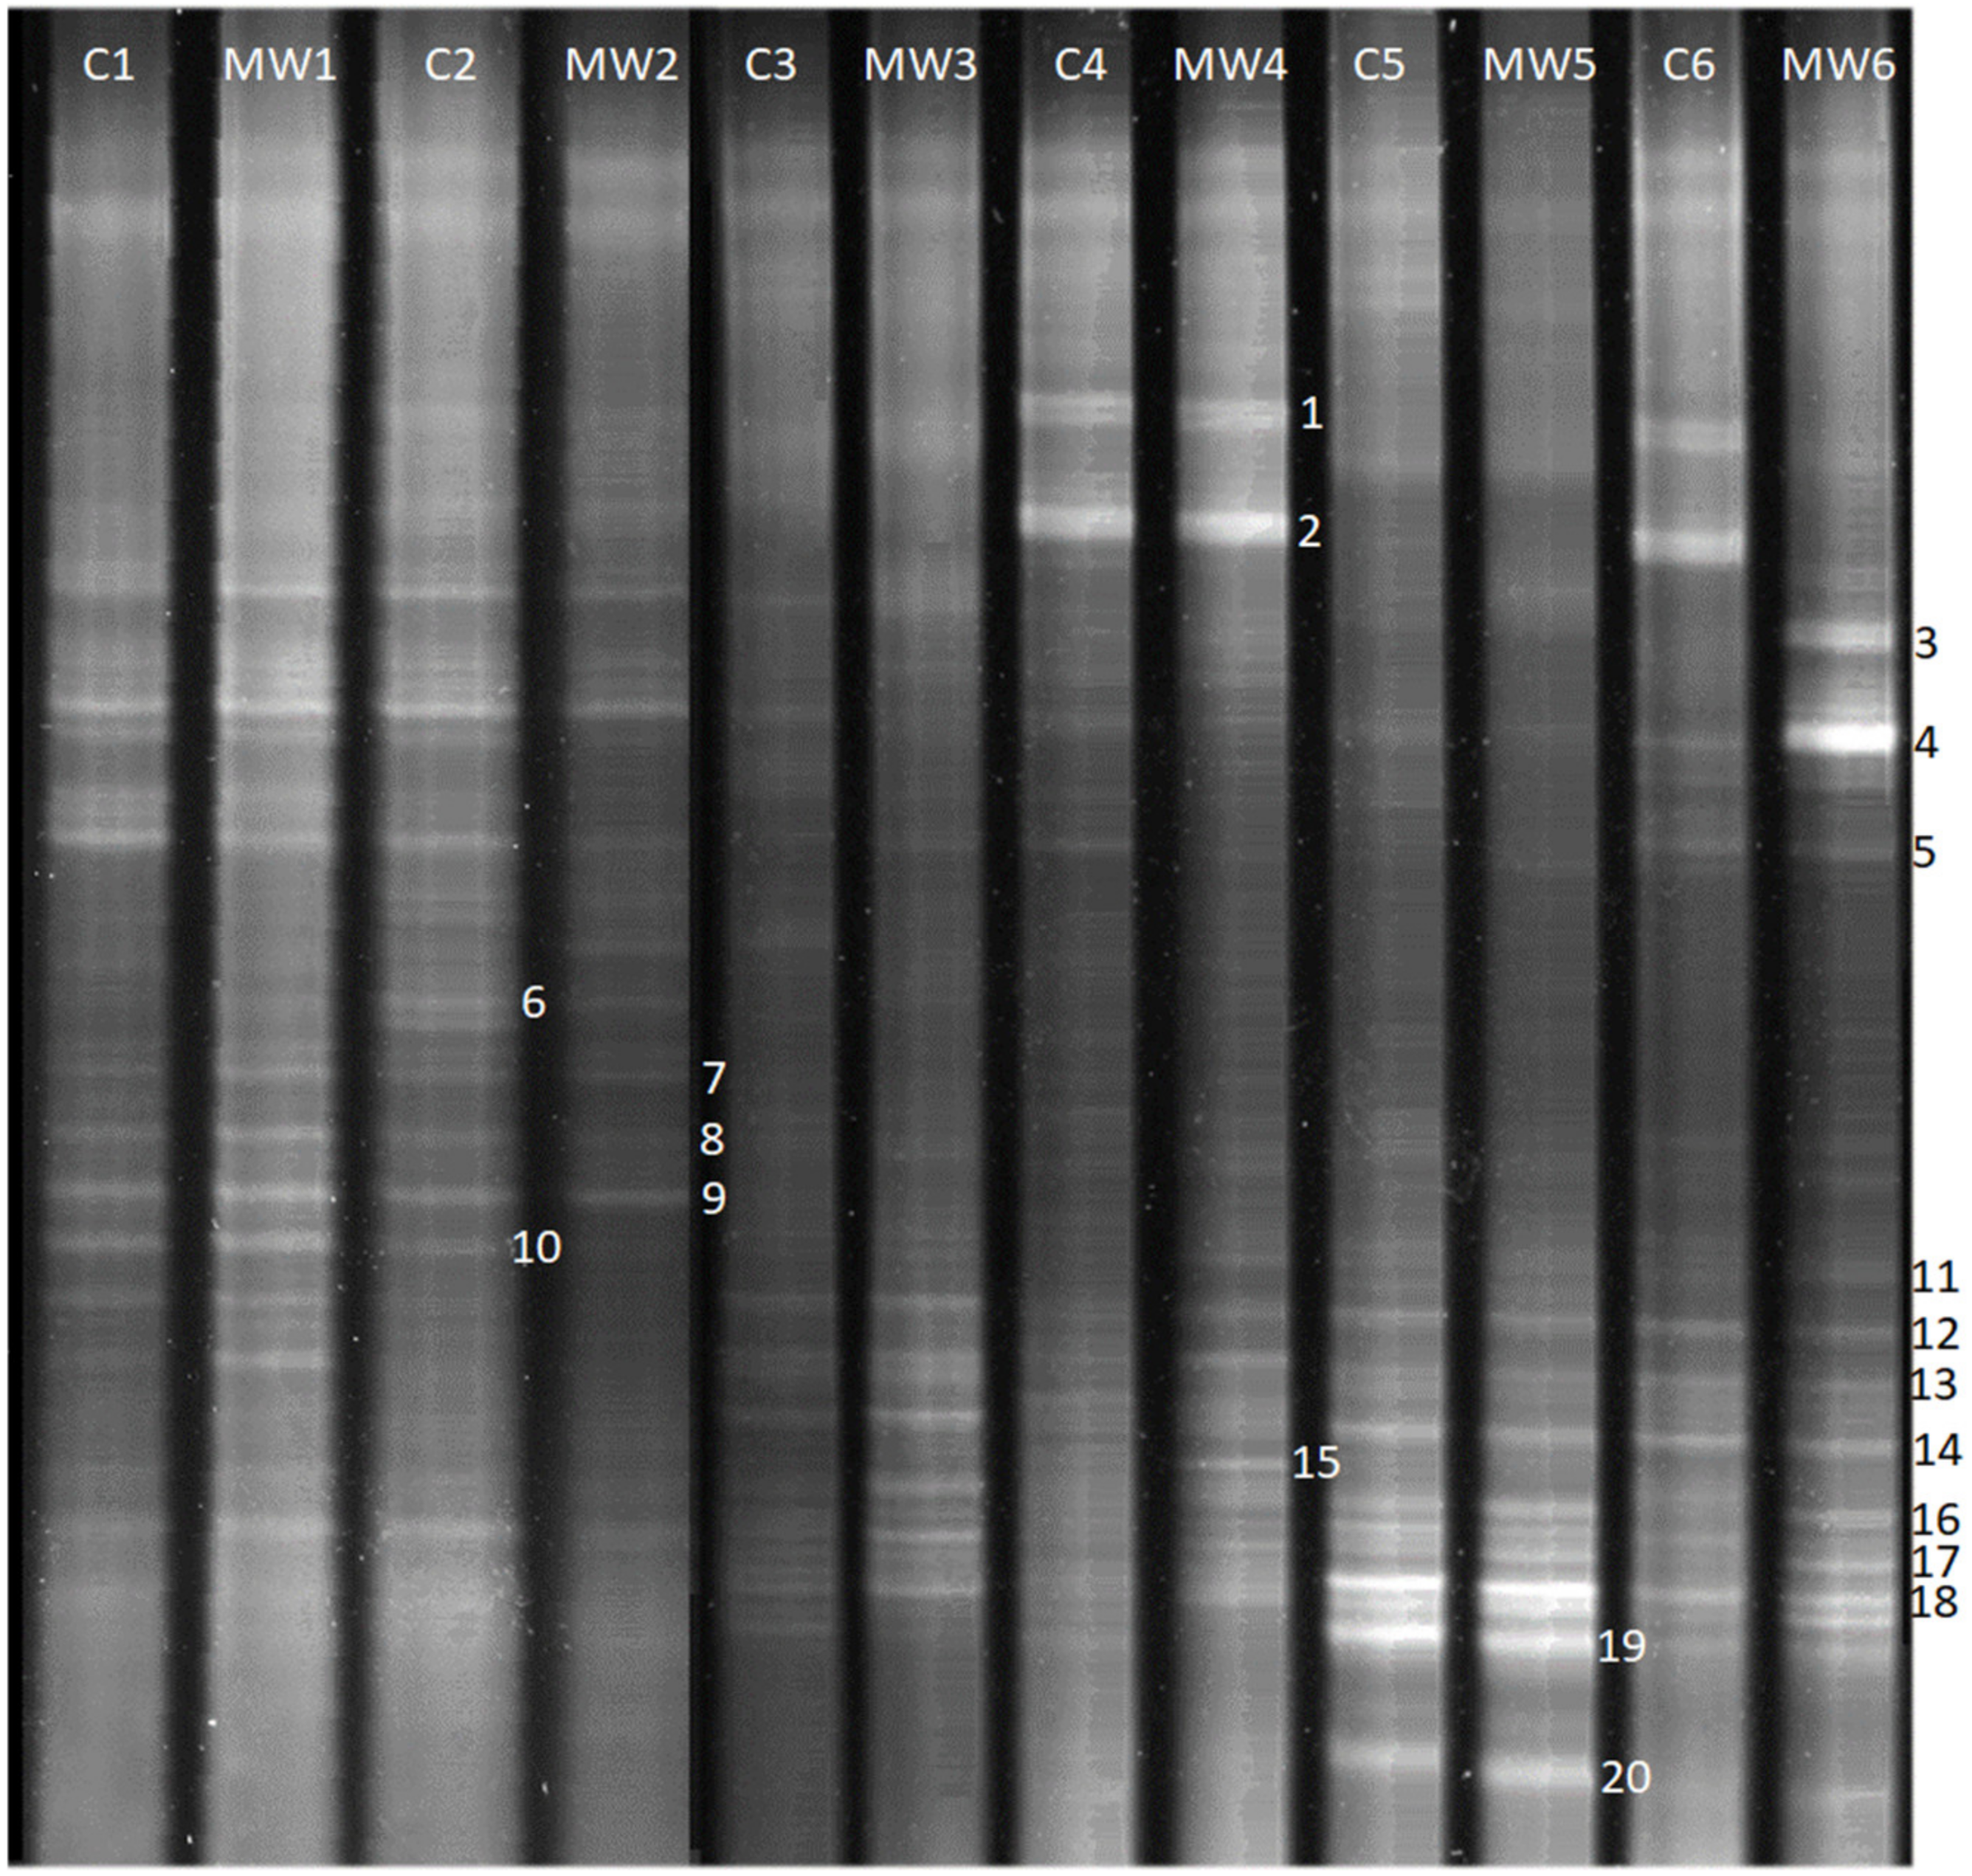
3.5. Bacterial Community

PCR-DGGE profiles from different variants of experiments differed concerning the absence and density of the bands. A phylogenetic dendrogram shows that bacterial communities were grouped into two main branches (Figure 7). One branch represents communities from digesters operated with OLRs at 1.0 gCOD/dm3·d and 2.0 gCOD/dm3·d. Under the OLR of 2.0 gCOD/dm3·d, the bacterial community in the control system showed greater similarity to communities in conditions for an OLR of 1.0 gCOD/dm3·d than the community operated with the same OLR, but with a different heating method. The second main branch was formed by communities from digesters operated with an OLR of 3.0–6.0 gCOD/dm3·d. The band patterns showed similarities between bacterial communities from variants with the same OLR, despite different heating methods (MW4 and C4; MW3 and C3; MW5 and C5; MW6 and C6; C1 and MW1).
Greater bacterial diversity was observed in digesters operated with a higher OLR. The Shannon diversity index (H) was used to calculate the diversity of the bacterial communities, and it ranged from 1.44 to 1.91. Higher H values were observed at 5.0 gCOD/dm3·d and 6.0 gCOD/dm3·d OLRs, indicating higher numbers of species (species richness) and higher relative abundances in the digesters operated with these OLRs. Some bands were common in almost all samples (e.g., bands 4 and 5), while others were only present in some of the digesters (e.g., band 3—MW6; band 15—MW4) (Figure 8). Some of the bands characterized digesters with lower OLR (bands 7, 8, 9, 10), some of them characterized digesters with higher OLR (bands 18, 19, 20).
Only bands 1, 2, and 20 had sufficient quality for the studies of phylogenetic analysis. When the 16S rDNA partial sequences from these bands were compared with the database in GenBank, bands 1 and 2 showed the highest similarity to Flavobacteriaceae (Bacteroides) (78.2% and 94.3%, respectively), and band 20 was closely related to Tissierella sp. (98.3%).

4. Discussion

The quality standards for slaughterhouse wastewater discharged into the environment are set out in applicable legislation. In the EU, the issue is regulated by the Urban Waste-water Treatment Directive (91/271/EEC) [28]. Other regulatory measures include the US “Effluent Limitations Guidelines and New Source Performance Standards for the Meat and Poultry Products Point Source” [29], and the Chinese “Integrated Wastewater Disposal Standard (GB 8978-1996)” [30]. Similarly, guidelines and recommendations to mitigate meat-industry environmental impacts have been released in the form of reference documents on best available techniques [31]. Finally, there are legislative acts such as the Polish Wastewater Regulation (“Rozporządzenie w sprawie ścieków”), intended to transpose the Water Framework Directive into national law [32].
Slaughterhouse wastewater treatment is usually a multistep process and a major technical challenge due to its complex nature, the high organic loadings involved, and the potentially huge impact on the environment. Individual process steps needed to obtain safe-to-discharge effluent include: flotation [33], ultrafiltration, [34,35], electrocoagulation [36,37], reverse osmosis [38,39], electrochemical oxidation [40,41], the aerobic activated sludge process [42,43], and combined processes harnessing bacteria–microalgae consortia [44,45]. Anaerobic digestion is an important and fast-advancing method of treating slaughterhouse wastewater. A major advantage of AD is its capacity to reuse waste by converting it into biomethane and biofertilizer [46]. It is believed that the conditions for AD should be kept within the following limits: the COD concentration should be between 1.5 and 40 gO2/dm3 (to maintain commercial viability), dry matter content should be less than 15%, and the N/C ratio should fall between 1/5 and 1/20 (to ensure COD removal of at least 50%) [47]. The H-LPSW used in the present experiment satisfied these criteria at 15.6 ± 1.6 gO2/dm3 COD, 1.04 ± 0.28 g/dm3 TS, and a C/N (TOC/TN) ratio of 11.52 ± 1.3.
Anaerobic digestion is a fairly popular choice for treating poultry-processing wastewater. However, it is important to note that research results have been nonconclusive and highly variable. Process performance is determined by pollutant load, reactor type, and anaerobic digestion parameters. Mesophilic and thermophytic digestion processes (both with upflow anaerobic filters) have been found to remove 90% and 72% of COD, respectively, at OLR = 9.0 gCOD/dm3·day [48]. In another experiment, 79% COD removal rate was achieved with OLR maintained at 10 gCOD/dm3·day and 35 °C. The CH4 content of the biogas ranged from 46% to 56% [49]. UASB reactors have been used to effectively remove pollutants from poultry-processing wastewater. One group managed to remove 90% of COD under mesophilic conditions from wastewater containing 820 mgO2/dm3 to 12,800 mgO2/dm3 [50]. Chávez et al. [51] achieved very high (95%) COD degradation in a UASB reactor despite a very high OLR of 31 gCOD/dm3·d at HRTs between 3.5 and 4.5 h and a temperature of 35 °C. Anaerobic digestion of high-lipid poultry wastewater has been shown to remove 66–70% of COD while providing specific biomethane yields of 562 cm3/gCODrem. to 777cm3/gCODrem. [52].
PSW treatment performance has also been tested across various OLRs in UASB reactors. In one study, 90% COD removal was achieved at an OLR of 0.4 gCOD/dm3·d, which subsequently dropped to 70% when the OLR increased to 3.0 gCOD/dm3·d, decreased further to 65% at an OLR of 10 gCOD/dm3·d, and finally fell below 50% when the OLR was increased to 15 gCOD/dm3·d [53]. This is in line with our own findings, as we also observed diminishing treatment performance as the OLR increased from 1.0 to 6.0 gCOD/dm3·d. Musa et al. [53] further demonstrated biogas yields of approx. 5.0 dm3/day and methane yields of 0.38 dm3/gCODintroduced at OLR = 10 gCOD/dm3·d. Again, these results are close to those obtained in our study, where OLR ≈ 4.0 gCOD/dm3·d led to biogas yields of 4.56 ± 0.57 dm3/day to 5.01 ± 0.54 dm3/day, with CH4 production of approx. 0.26 dm3/gCODintroduced.
Loganath and Mazumder [54] tested a packed UASB reactor, reaching 95% COD removal at OLR = 7 gCOD/dm3·d and HRT 10 h. Similar TOC removal rates were achieved in the present study, but only at lower OLRs (1.0 gCOD/dm3·d to 4.0 gCOD/dm3·d). Increasing OLR to 5–6 gCOD/dm3·d significantly diminished TOC biodegradation. Chollom et al. [55] set out to optimize PSW treatment in a UASB reactor. The highest pollutant removal performance was achieved at 35 °C, HRT 15 h, OLR 3.5 gCOD/dm3·d, and pH 7. The biogas output was 0.46 dm3/gCOD with a COD removal rate of 80%. Similar parameters were achieved with ACSTR in the present study at loadings of 1–4 gCOD/dm3·d.
These examples clearly show that studies on poultry slaughterhouse wastewater treatment focus primarily on UASB reactors. However, it is important to note that such reactors require that the wastewater be efficiently pretreated via filtration, flotation, and/or coagulation to remove lipids, suspended solids, and protein [56]. The waste fed into the reactor is thus clear of suspended solids, with most of the COD being dissolved [57]. This conditioning enables high OLRs and short HRTs while maintaining high treatment performance [58]. The drawback, however, is that the pretreatment process generates additional investment and operating costs, while also limiting the volume of organic feedstock used for biogas production [59]. This is why we chose to use the ACSTR design instead for our study.
Anaerobic treatment of slaughterhouse waste carries a number of technological challenges, such as the high nitrogen content. Degradation of nitrogen during hydrolysis and subsequent acidogenesis can release free (un-ionized) NH3-N and ionized ammonia N (NH4-N). Inhibition of AD is related to the levels of these nitrogen species [60]. High levels of total ammonia (NH3 and NH4+), toxic and inhibitory to bacteria, are observed during anaerobic digestion of slaughterhouse wastewater [61,62]. Another problem is the production of sulfides and odors (H2S) during biodegradation of proteins [63]. Furthermore, the presence of sulfur allows sulfate-reducing bacteria to divert electron equivalents from CH4-forming pathways to H2S-forming pathways. Approx. 0.7 dm3 CH4 of methane is consumed for each gram of H2S produced [64].
The present study aimed to investigate the effect of electromagnetic microwave radiation on the performance of anaerobic treatment and digestion of H-LPSW. It was based on and inspired by studies demonstrating that MW improve wastewater treatment in aerobic [65] and anaerobic biofilters [66], and can also boost biogas yields [17]. However, the benefits of microwaves have mostly been touted in the context of pretreatment and hydrothermal depolymerization of various organic matter prior to waste-to-energy processing [67,68]. MW disintegration has been shown to improve anaerobic digestion of plant biomass [69], microalgae [70], sludge [71], and organic fraction of municipal waste [72].
On the other hand, there is a dearth of research on MW as a way to heat anaerobic continuous stirred-tank reactors (ACSTRs) [21,73]. This application would seem to be a promising direction, given the push towards upgrading and enrichment of biogas for subsequent harvesting as biomethane and its use outside of the treatment plant [74]. However, this biogas use strategy requires alternative heat sources to provide optimum temperature parameters in digesters. Electromagnetic microwave radiation (EMR) may prove to be such a competitive heating method, given its well-documented features and benefits [75,76]. Research to date indicates that MW can boost biogas production and quality. This was demonstrated, for example, by treating dairy effluent in a multisection horizontal flow reactor (HFAR) equipped with microwave and ultrasonic generators [77]. A conventionally heated reactor loaded with 2.0 kgCOD/dm3·d produced 42.9 ± 1.1 dm3 biogas/day with 64.4 ± 1.0% CH4. Anaerobic digestion performance proved to be significantly better when the digester was heated using microwaves, with the MW variant yielding 46.1 ± 1.1 dm3 biogas/day with a CH4 fraction of 66.4 ± 1.0% [77]. Another study concluded that the heating method had no significant effect on the productivity of gas-producing anaerobic bacteria. The biogas output was approx. 450 cm3/gVS in both of the heating variants (conventional- and EMR-heated). However, the authors did note increased activity of methanogenic bacteria within the microwave-exposed zones, as evidenced by the CH4 fraction in the biogas of 69% (the value was almost 4% lower for the control system) [78]. This finding is corroborated by the present study, which found that MW heating boosted the CH4 fraction in the biogas under mesophilic conditions (35 °C) as long as the OLR was maintained within 1.0 kgCOD/dm3·d to 4.0 kgCOD/dm3·d. Conversely, at OLRs of 5.0 kgCOD/dm3·d and 6.0 kgCOD/dm3·d, the heating method had no significant effect on CH4 content of the biogas.
Similarly, Zielińska et al. [79] demonstrated a positive effect of microwaves on the efficiency of organic matter biodegradation in a hybrid anaerobic reactor. The MW-heated reactor showed increased biogas output 0.360 ± 0.006 m3/kgCODrem. and higher CH4 content of the biogas at 67.7 ± 1.9%. The reactors operated at OLR = 1.0 kgCOD/m 3∙d and 35 °C [79]. The temperature was also found to shape the counts and taxonomic evolution of the methanogenic Archaea in the anaerobic biomass. In addition, there was no need to maintain thermophilic conditions during digestion, since the application of MW ensured high abundance and diversity of methanogenic Archaea in the biomass, which in turn resulted in increased production of methane-rich biogas and stable reactor performance [79]. Another study, by Zieliński et al., aimed to determine how thermal stimulation via EMR impacts anaerobic digestion of five selected energy crop species. The highest biogas production was achieved for maize silage and Virginia mallow silage, i.e., at 680 ± 28 dm3/kgVS and 506 ± 16 dm3/kgVS, respectively. Exposure to MW boosted CH4 production from maize silage by 18%—from 361 ± 2 dm3/kgVS to 426 ± 14 dm3/kgVS. The differences in CH4 production were nonsignificant for the other energy crop variants [17]. The results of previous studies on the use of MW to heat bioreactors for the process of methane fermentation are presented in Table 6.
Researchers have posited that the nonthermal properties of MW contribute to an increased rate and efficiency of pollutant absorption and biogas production via metabolic processes [82,83]. This is supported by multiple molecular taxonomic assays of anaerobic microflora. Genetic studies have shown clear differences in the taxonomic structure of the anaerobic microbe community between conventionally heated and EMR-heated reactors [84,85].
In addition to stimulating taxonomic diversity, the thermal and nonthermal effects of EMR can also improve the efficiency and rate of enzymatic reactions responsible for biodegradation of organic matter into biogas [86]. Indeed, enzymatic activity is directly linked to the conditions of the biological community and the environment, one of which is the temperature of the medium—maintaining optimal temperatures for specific groups of bacteria can promote effective hydrolysis of complex organic compounds, as well as subsequent acidogenesis and methanogenesis [87]. The thermal conditions in anaerobic environments can be precisely controlled via EMR, lowering system inertia. MW heating enables energy to be directed to the EMR absorber (in this case, a mixture of anaerobic microcommunity and metabolized biomass) [88]. This reduces energy losses caused by energy absorption by the components and fittings of the digester during conventional heating [68]. It has also been proved that nonthermal effects of MW can affect the biochemical activity of microorganisms by modifying their nucleic acids and synthesis of the cellular protein [89]. Final performance varies depending on the frequency, power, and MW exposure time [90]. Banik et al. [91] showed that Methanosarcina barkeri DS-804 populations exposed to MW (13.5 GHz and 36.5 GHz) had higher population size and larger cell sizes. The maximum CH4 fraction in the biogas—76.5%—was achieved at 31.5 GHz. By comparison, the conventionally heated control systems produced only 52.3% of CH4 [91].
Braguglia et al. [24] have posited that EMR may prove the competitive alternative to conventional heating due to lower heat losses (from convection or conduction) and the breakdown of hydrogen bonds through the polarization of microparticle chains. However, the final decision should always take into account individual assessments and energy balance [92].

5. Conclusions

The present study has shown that MW reactor heating has a positive effect on H-LPSW anaerobic digestion performance. MW heating produced a significant benefit by increasing the CH4 fraction under mesophilic conditions (35 °C) as long as the OLR was maintained within 1.0 kgCOD/dm3·d to 4.0 kgCOD/dm3·d. Conversely, the heating method had no significant effect on CH4 content of the biogas at OLRs of 5.0 kgCOD/dm3·d and 6.0 kgCOD/dm3·d. MW did not prove to have a significant effect on the other performance indicators monitored concerning H-LPSW treatment and anaerobic digestion.
Under thermophilic conditions (55 °C), the conventionally heated and MW-heated reactors performed similarly. These similarities extended to pollutant removal, yields of biogas, and CH4 content.
On the other hand, the present study did show that the thermophilic process (55 °C) performed significantly better than the process at 35 °C. Nevertheless, the OLR was found to be the primary determinant of performance. High organic removal and biogas production rates were achieved for loadings of 1.0 gCOD/dm3·d to 4.0 gCOD/dm3·d, whereas the 5.0 gCOD/dm3·d and 6.0 gCOD/dm3·d OLR variants showed incremental decreases in performance.
Regarding the type of heating for the fermentation process, there was no significant effect on the evolution of the anaerobic bacterial community in bioreactors. Based on the polymerase chain reaction followed by denaturing gradient gel electrophoresis (PCR-DGGE) results of 16S rDNA analysis, diversity of bacterial communities was mostly determined by OLR.

Author Contributions

Conceptualization, M.Z. and M.D.; methodology, M.Z., M.D. and P.R.; validation, M.Z.; formal analysis, M.Z. and M.D.; investigation, M.Z.; resources, M.Z., M.D., P.R. and J.K.; data curation, M.Z.; writing—original draft preparation, M.D. and J.K.; writing—review and editing, M.Z., M.D., P.R. and J.K.; visualization, M.D. and J.K.; supervision, M.Z.; project administration, M.Z. and M.D.; funding acquisition, M.D. All authors have read and agreed to the published version of the manuscript.

Funding

The project and manuscript were supported financially by the Minister of Education and Science within the range of the program entitled “Regional Initiative of Excellence” for the years 2019–2023, project no. 010/RID/2018/19, amount of funding: 12,000,000 PLN, and the work WZ/WB-IIŚ/3/2022, funded by the Minister of Education and Science.

Institutional Review Board Statement

Not applicable.

Informed Consent Statement

Not applicable.

Data Availability Statement

Not applicable.

Conflicts of Interest

The authors declare no conflict of interest.

References

  1. Karwacka, M.; Ciurzyńska, A.; Lenart, A.; Janowicz, M. Sustainable Development in the Agri-Food Sector in Terms of the Carbon Footprint: A Review. Sustainability 2020, 12, 6463. [Google Scholar] [CrossRef]
  2. Eryuruk, K.; Tezcan Un, U.; Bakır Ogutveren, U. Electrochemical treatment of wastewaters from poultry slaughtering and processing by using iron electrodes. J. Clean. Prod. 2018, 172, 1089–1095. [Google Scholar] [CrossRef]
  3. Hilares, R.T.; Atoche-Garay, D.F.; Pagaza, D.A.P.; Ahmed, M.A.; Andrade, G.J.C.; Santos, J.C. Promising physicochemical technologies for poultry slaughterhouse wastewater treatment: A critical review. J. Environ. Chem. Eng. 2021, 9, 105174. [Google Scholar] [CrossRef]
  4. Ng, M.; Dalhatou, S.; Wilson, J.; Kamdem, B.P.; Temitope, M.B.; Paumo, H.K.; Djelal, H.; Assadi, A.A.; Nguyen-Tri, P.; Kane, A. Characterization of Slaughterhouse Wastewater and Development of Treatment Techniques: A Review. Processes 2022, 10, 1300. [Google Scholar] [CrossRef]
  5. Njoya, M.; Basitere, M.; Ntwampe, S.K.O. High Rate Anaerobic Treatment of Poultry Slaughterhouse Wastewater (PSW). New Horizons Wastewaters Manag. 2019, 38, 173–210. [Google Scholar]
  6. Kazimierowicz, J.; Dzienis, L.; Dębowski, M.; Zieliński, M. Optimisation of methane fermentation as a valorisation method for food waste products. Biomass Bioenergy 2021, 144, 105913. [Google Scholar] [CrossRef]
  7. Ghaleb, A.A.S.; Kutty, S.R.M.; Salih, G.H.A.; Jagaba, A.H.; Noor, A.; Kumar, V.; Almahbashi, N.M.Y.; Saeed, A.A.H.; Saleh Al-dhawi, B.N. Sugarcane Bagasse as a Co-Substrate with Oil-Refinery Biological Sludge for Biogas Production Using Batch Mesophilic Anaerobic Co-Digestion Technology: Effect of Carbon/Nitrogen Ratio. Water 2021, 13, 590. [Google Scholar] [CrossRef]
  8. Vinardell, S.; Astals, S.; Mata-Alvarez, J.; Dosta, J. Techno-economic analysis of combining forward osmosis-reverse osmosis and anaerobic membrane bioreactor technologies for municipal wastewater treatment and water production. Bioresour. Technol. 2020, 297, 122395. [Google Scholar] [CrossRef]
  9. Khitous, M.; Saber, M.; Tirichine, N.; Aiouaz, F. Investigation of slaughterhouse waste anaerobic digestion in a pilot-scale mesophilic reactor. Environ. Prog. Sustain. Energy 2022, 41, e13904. [Google Scholar] [CrossRef]
  10. Zhang, L.; Loh, K.C.; Sarvanantharajah, S.; Tong, Y.W.; Wang, C.H.; Dai, Y. Mesophilic and thermophilic anaerobic digestion of soybean curd residue for methane production: Characterizing bacterial and methanogen communities and their correlations with organic loading rate and operating temperature. Bioresour. Technol. 2019, 288, 121597. [Google Scholar] [CrossRef]
  11. Ingersoll, J.G. Thermophilic Co-Fermentation of Wood Wastes and High in Nitrogen Animal Manures into Bio-Methane with the Aid of Fungi and its Potential in the USA. Energies 2020, 13, 4257. [Google Scholar] [CrossRef]
  12. RATUSHNIAK, G.; BIKS, Y.; LYALYUK, O.; RATUSHNYAK, O.; LYALYUK, A. Modeling of Environmental-Energy Efficiency of the Biogas Installation with Heat Supplying of the Biomass Fermentation Process. Archit. Civ. Eng. Environ. 2020, 13, 115–124. [Google Scholar] [CrossRef]
  13. Maurer, C.; Müller, J. Drying Characteristics of Biogas Digestate in a Hybrid Waste-Heat/Solar Dryer. Energies 2019, 12, 1294. [Google Scholar] [CrossRef] [Green Version]
  14. Augustyn, G.; Mikulik, J.; Rumin, R.; Szyba, M. Energy Self-Sufficient Livestock Farm as the Example of Agricultural Hybrid Off-Grid System. Energies 2021, 14, 7041. [Google Scholar] [CrossRef]
  15. Hiloidhari, M.; Kumari, S. Biogas upgrading and life cycle assessment of different biogas upgrading technologies. In Emerging Technologies and Biological Systems for Biogas Upgrading; Academic Press: Cambridge, MA, USA, 2021; pp. 413–445. [Google Scholar] [CrossRef]
  16. Zhen, G.; Pan, Y.; Lu, X.; Li, Y.Y.; Zhang, Z.; Niu, C.; Kumar, G.; Kobayashi, T.; Zhao, Y.; Xu, K. Anaerobic membrane bioreactor towards biowaste biorefinery and chemical energy harvest: Recent progress, membrane fouling and future perspectives. Renew. Sustain. Energy Rev. 2019, 115, 109392. [Google Scholar] [CrossRef]
  17. Zieliński, M.; Dębowski, M.; Kazimierowicz, J. The Effect of Electromagnetic Microwave Radiation on Methane Fermentation of Selected Energy Crop Species. Processes 2021, 10, 45. [Google Scholar] [CrossRef]
  18. Zhang, R.; Liu, S.; Jin, H.; Luo, Y.; Zheng, Z.; Gao, F.; Zheng, Y. Noninvasive Electromagnetic Wave Sensing of Glucose. Sensors 2019, 19, 1151. [Google Scholar] [CrossRef] [Green Version]
  19. Li, H.; Zhao, Z.; Xiouras, C.; Stefanidis, G.D.; Li, X.; Gao, X. Fundamentals and applications of microwave heating to chemicals separation processes. Renew. Sustain. Energy Rev. 2019, 114, 109316. [Google Scholar] [CrossRef]
  20. Nigar, H.; Sturm, G.S.J.; Garcia-Baños, B.; Peñaranda-Foix, F.L.; Catalá-Civera, J.M.; Mallada, R.; Stankiewicz, A.; Santamaría, J. Numerical analysis of microwave heating cavity: Combining electromagnetic energy, heat transfer and fluid dynamics for a NaY zeolite fixed-bed. Appl. Therm. Eng. 2019, 155, 226–238. [Google Scholar] [CrossRef]
  21. Kazimierowicz, J.; Zieliński, M.; Dębowski, M. Influence of the Heating Method on the Efficiency of Biomethane Production from Expired Food Products. Fermentation 2021, 7, 12. [Google Scholar] [CrossRef]
  22. Sharifvaghefi, S.; Zheng, Y. Microwave vs conventional heating in hydrogen production via catalytic dry reforming of methane. Resour. Chem. Mater. 2022, 1, 290–307. [Google Scholar] [CrossRef]
  23. Yellezuome, D.; Zhu, X.; Wang, Z.; Liu, R. Mitigation of ammonia inhibition in anaerobic digestion of nitrogen-rich substrates for biogas production by ammonia stripping: A review. Renew. Sustain. Energy Rev. 2022, 157, 112043. [Google Scholar] [CrossRef]
  24. Braguglia, C.M.; Gallipoli, A.; Gianico, A.; Pagliaccia, P. Anaerobic bioconversion of food waste into energy: A critical review. Bioresour. Technol. 2018, 248, 37–56. [Google Scholar] [CrossRef] [PubMed]
  25. Volschan Junior, I.; de Almeida, R.; Cammarota, M.C. A review of sludge pretreatment methods and co-digestion to boost biogas production and energy self-sufficiency in wastewater treatment plants. J. Water Process Eng. 2021, 40, 101857. [Google Scholar] [CrossRef]
  26. Muyzer, G.; De Waal, E.C.; Uitterlinden, A.G. Profiling of complex microbial populations by denaturing gradient gel electrophoresis analysis of polymerase chain reaction-amplified genes coding for 16S rRNA. Appl. Environ. Microbiol. 1993, 59, 695–700. [Google Scholar] [CrossRef] [Green Version]
  27. Jaranowska, P.; Cydzik-Kwiatkowska, A.; Zielińska, M. Configuration of biological wastewater treatment line and influent composition as the main factors driving bacterial community structure of activated sludge. World J. Microbiol. Biotechnol. 2013, 29, 1145–1153. [Google Scholar] [CrossRef] [PubMed] [Green Version]
  28. Directive (European Union). Council Directive of 21 May 1991 concerning urban waste water treatment (91/271/EEC). J. Eur. Commun. 1991, 34, 40. [Google Scholar]
  29. U.S. Environmental Protection Agency. Federal Register Effluent Limitations Guidelines and New Source Performance Standards for the Meat and Poultry Products Point Source Category. Fed. Register. 2004, 69, 54475–54555. [Google Scholar]
  30. GB 8978-1996; Integrated Wastewater Disposal Standard. FAO: Rome, Italy, 1996.
  31. European Commission Integrated Pollution Prevention and Control Reference Document on Best Available Techniques in the Slaughterhouses and Animal By-products Industries; European Commission: Brussels, Belgium, 2005.
  32. Directive 2000/60/EC of the European Parliament and of the Council of 23 October 2000 Establishing a Framework for Community Action in the Field of Water Policy. Available online: https://eur-lex.europa.eu/legal-content/en/ALL/?uri=CELEX%3A32000L0060 (accessed on 3 January 2023).
  33. de Nardi, I.R.; Fuzi, T.P.; Del Nery, V. Performance evaluation and operating strategies of dissolved-air flotation system treating poultry slaughterhouse wastewater. Resour. Conserv. Recycl. 2008, 52, 533–544. [Google Scholar] [CrossRef]
  34. Avula, R.Y.; Nelson, H.M.; Singh, R.K. Recycling of poultry process wastewater by ultrafiltration. Innov. Food Sci. Emerg. Technol. 2009, 10, 1–8. [Google Scholar] [CrossRef]
  35. Malmali, M.; Askegaard, J.; Sardari, K.; Eswaranandam, S.; Sengupta, A.; Wickramasinghe, S.R. Evaluation of ultrafiltration membranes for treating poultry processing wastewater. J. Water Process Eng. 2018, 22, 218–226. [Google Scholar] [CrossRef]
  36. Paulista, L.O.; Presumido, P.H.; Theodoro, J.D.P.; Pinheiro, A.L.N. Efficiency analysis of the electrocoagulation and electroflotation treatment of poultry slaughterhouse wastewater using aluminum and graphite anodes. Environ. Sci. Pollut. Res. 2018, 25, 19790–19800. [Google Scholar] [CrossRef] [PubMed]
  37. Zarei, A.; Biglari, H.; Mobini, M.; Dargahi, A.; Ebrahimzadeh, G.; Narooie, M.R.; Mehrizi, E.A.; Yari, A.R.; Mohammadi, M.J.; Baneshi, M.M.; et al. Disinfecting Poultry Slaughterhouse Wastewater Using Copper Electrodes in the Electrocoagulation Process. Polish J. Environ. Stud. 2018, 27, 1907–1912. [Google Scholar] [CrossRef]
  38. Coskun, T.; Debik, E.; Kabuk, H.A.; Manav Demir, N.; Basturk, I.; Yildirim, B.; Temizel, D.; Kucuk, S. Treatment of poultry slaughterhouse wastewater using a membrane process, water reuse, and economic analysis. New Pub Balaban 2015, 57, 4944–4951. [Google Scholar] [CrossRef]
  39. Racar, M.; Dolar, D.; Špehar, A.; Košutić, K. Application of UF/NF/RO membranes for treatment and reuse of rendering plant wastewater. Process Saf. Environ. Prot. 2017, 105, 386–392. [Google Scholar] [CrossRef]
  40. Abdelhay, A.; Jum’h, I.; Abdulhay, E.; Al-Kazwini, A.; Alzubi, M. Anodic oxidation of slaughterhouse wastewater on boron-doped diamond: Process variables effect. Water Sci. Technol. 2017, 76, 3227–3235. [Google Scholar] [CrossRef]
  41. Ghazouani, M.; Akrout, H.; Jellali, S.; Bousselmi, L. Comparative study of electrochemical hybrid systems for the treatment of real wastewaters from agri-food activities. Sci. Total Environ. 2019, 647, 1651–1664. [Google Scholar] [CrossRef]
  42. Keskes, S.; Hmaied, F.; Gannoun, H.; Bouallagui, H.; Godon, J.J.; Hamdi, M. Performance of a submerged membrane bioreactor for the aerobic treatment of abattoir wastewater. Bioresour. Technol. 2012, 103, 28–34. [Google Scholar] [CrossRef]
  43. Rajab, A.R.; Salim, M.R.; Sohaili, J.; Anuar, A.N.; Salmiati; Lakkaboyana, S.K. Performance of integrated anaerobic/aerobic sequencing batch reactor treating poultry slaughterhouse wastewater. Chem. Eng. J. 2017, 313, 967–974. [Google Scholar] [CrossRef]
  44. Akizuki, S.; Cuevas-Rodríguez, G.; Toda, T. Microalgal-nitrifying bacterial consortium for energy-saving ammonia removal from anaerobic digestate of slaughterhouse wastewater. J. Water Process Eng. 2019, 31, 100753. [Google Scholar] [CrossRef]
  45. Terán Hilares, R.; Garcia Bustos, K.A.; Sanchez Vera, F.P.; Colina Andrade, G.J.; Pacheco Tanaka, D.A. Acid precipitation followed by microalgae (Chlorella vulgaris) cultivation as a new approach for poultry slaughterhouse wastewater treatment. Bioresour. Technol. 2021, 335, 125284. [Google Scholar] [CrossRef] [PubMed]
  46. Arutselvy, B.; Rajeswari, G.; Jacob, S. Sequential valorization strategies for dairy wastewater and water hyacinth to produce fuel and fertilizer. J. Food Process Eng. 2021, 44, e13585. [Google Scholar] [CrossRef]
  47. Philipp, M.; Jabri, K.M.; Wellmann, J.; Akrout, H.; Bousselmi, L.; Geißen, S.U. Slaughterhouse Wastewater Treatment: A Review on Recycling and Reuse Possibilities. Water 2021, 13, 3175. [Google Scholar] [CrossRef]
  48. Gannoun, H.; Bouallagui, H.; Okbi, A.; Sayadi, S.; Hamdi, M. Mesophilic and thermophilic anaerobic digestion of biologically pretreated abattoir wastewaters in an upflow anaerobic filter. J. Hazard. Mater. 2009, 170, 263–271. [Google Scholar] [CrossRef]
  49. Rajakumar, R.; Meenambal, T.; Banu, J.R.; Yeom, I.T. Treatment of poultry slaughterhouse wastewater in upflow anaerobic filter under low upflow velocity. Int. J. Environ. Sci. Technol. 2011 81 2010, 8, 149–158. [Google Scholar] [CrossRef] [Green Version]
  50. Musa, M.A.; Idrus, S. Physical and Biological Treatment Technologies of Slaughterhouse Wastewater: A Review. Sustainability 2021, 13, 4656. [Google Scholar] [CrossRef]
  51. Chávez, P.C.; Castillo, L.R.; Dendooven, L.; Escamilla-Silva, E.M. Poultry slaughter wastewater treatment with an up-flow anaerobic sludge blanket (UASB) reactor. Bioresour. Technol. 2005, 96, 1730–1736. [Google Scholar] [CrossRef]
  52. Musa, M.A.; Idrus, S. Effect of Hydraulic Retention Time on the Treatment of Real Cattle Slaughterhouse Wastewater and Biogas Production from HUASB Reactor. Water 2020, 12, 490. [Google Scholar] [CrossRef] [Green Version]
  53. Musa, M.A.; Idrus, S.; Hasfalina, C.M.; Daud, N.N.N. Effect of Organic Loading Rate on Anaerobic Digestion Performance of Mesophilic (UASB) Reactor Using Cattle Slaughterhouse Wastewater as Substrate. Int. J. Environ. Res. Public Heal. 2018, 15, 2220. [Google Scholar] [CrossRef] [Green Version]
  54. Loganath, R.; Mazumder, D. Performance study on organic carbon, total nitrogen, suspended solids removal and biogas production in hybrid UASB reactor treating real slaughterhouse wastewater. J. Environ. Chem. Eng. 2018, 6, 3474–3484. [Google Scholar] [CrossRef]
  55. Chollom, M.N.; Rathilal, S.; Swalaha, F.M.; Bakare, B.F.; Tetteh, E.K. Comparison of response surface methods for the optimization of an upflow anaerobic sludge blanket for the treatment of slaughterhouse wastewater. Environ. Eng. Res. 2020, 25, 114–122. [Google Scholar] [CrossRef]
  56. Dutta, A.; Davies, C.; Ikumi, D.S. Performance of upflow anaerobic sludge blanket (UASB) reactor and other anaerobic reactor configurations for wastewater treatment: A comparative review and critical updates. J. Water Supply Res. Technol. 2018, 67, 858–884. [Google Scholar] [CrossRef]
  57. Crone, B.C.; Garland, J.L.; Sorial, G.A.; Vane, L.M. Significance of dissolved methane in effluents of anaerobically treated low strength wastewater and potential for recovery as an energy product: A review. Water Res. 2016, 104, 520–531. [Google Scholar] [CrossRef] [PubMed]
  58. Mainardis, M.; Buttazzoni, M.; Goi, D. Up-Flow Anaerobic Sludge Blanket (UASB) Technology for Energy Recovery: A Review on State-of-the-Art and Recent Technological Advances. Bioengineering 2020, 7, 43. [Google Scholar] [CrossRef] [PubMed]
  59. Ellacuriaga, M.; García-Cascallana, J.; Gómez, X. Biogas Production from Organic Wastes: Integrating Concepts of Circular Economy. Fuels 2021, 2, 144–167. [Google Scholar] [CrossRef]
  60. Procházka, J.; Dolejš, P.; MácA, J.; Dohányos, M. Stability and inhibition of anaerobic processes caused by insufficiency or excess of ammonia nitrogen. Appl. Microbiol. Biotechnol. 2012, 93, 439–447. [Google Scholar] [CrossRef]
  61. Angelidaki, I.; Ahring, B.K. Thermophilic anaerobic digestion of livestock waste: The effect of ammonia. Appl. Microbiol. Biotechnol. 1993, 38, 560–564. [Google Scholar] [CrossRef]
  62. Kayhanian, M. Ammonia Inhibition in High-Solids Biogasification: An Overview and Practical Solutions. Environ. Technol. 2010, 20, 355–365. [Google Scholar] [CrossRef]
  63. Ozturk, B. Evaluation of Biogas Production Yields of Different Waste Materials. Earth Sci. Res. 2013, 2, 165–174. [Google Scholar] [CrossRef] [Green Version]
  64. Nazifa, T.H.; Cata Saady, N.M.; Bazan, C.; Zendehboudi, S.; Aftab, A.; Albayati, T.M. Anaerobic Digestion of Blood from Slaughtered Livestock: A Review. Energies 2021, 14, 5666. [Google Scholar] [CrossRef]
  65. Zieliński, M.; Zielińska, M.; Debowski, M. Application of microwave radiation to biofilm heating during wastewater treatment in trickling filters. Bioresour. Technol. 2013, 127, 223–230. [Google Scholar] [CrossRef] [PubMed]
  66. Zieliński, M.; Dębowski, M.; Kazimierowicz, J. Microwave Radiation Influence on Dairy Waste Anaerobic Digestion in a Multi-Section Hybrid Anaerobic Reactor (M-SHAR). Processes 2021, 9, 1772. [Google Scholar] [CrossRef]
  67. Feng, R.Z.; Zaidi, A.A.; Zhang, K.; Shi, Y. Optimisation of Microwave Pretreatment for Biogas Enhancement through Anaerobic Digestion of Microalgal Biomass. Period. Polytech. Chem. Eng. 2019, 63, 65–72. [Google Scholar] [CrossRef] [Green Version]
  68. Aguilar-Reynosa, A.; Romaní, A.; Ma. Rodríguez-Jasso, R.; Aguilar, C.N.; Garrote, G.; Ruiz, H.A. Microwave heating processing as alternative of pretreatment in second-generation biorefinery: An overview. Energy Convers. Manag. 2017, 136, 50–65. [Google Scholar] [CrossRef] [Green Version]
  69. Zieliński, M.; Dębowski, M.; Rusanowska, P. Influence of microwave heating on biogas production from Sida hermaphrodita silage. Bioresour. Technol. 2017, 245, 1290–1293. [Google Scholar] [CrossRef]
  70. Zaidi, A.A.; Feng, R.; Malik, A.; Khan, S.Z.; Shi, Y.; Bhutta, A.J.; Shah, A.H. Combining Microwave Pretreatment with Iron Oxide Nanoparticles Enhanced Biogas and Hydrogen Yield from Green Algae. Process. 2019, 7, 24. [Google Scholar] [CrossRef] [Green Version]
  71. Bozkurt, Y.C.; Apul, O.G. Critical review for microwave pretreatment of waste-activated sludge prior to anaerobic digestion. Curr. Opin. Environ. Sci. Heal. 2020, 14, 1–9. [Google Scholar] [CrossRef]
  72. Shahriari, H.; Warith, M.; Hamoda, M.; Kennedy, K.J. Anaerobic digestion of organic fraction of municipal solid waste combining two pretreatment modalities, high temperature microwave and hydrogen peroxide. Waste Manag. 2012, 32, 41–52. [Google Scholar] [CrossRef]
  73. Khan, M.U.; Lee, J.T.E.; Bashir, M.A.; Dissanayake, P.D.; Ok, Y.S.; Tong, Y.W.; Shariati, M.A.; Wu, S.; Ahring, B.K. Current status of biogas upgrading for direct biomethane use: A review. Renew. Sustain. Energy Rev. 2021, 149, 111343. [Google Scholar] [CrossRef]
  74. Zieliński, M.; Karczmarczyk, A.; Kisielewska, M.; Dębowski, M. Possibilities of Biogas Upgrading on a Bio-Waste Sorbent Derived from Anaerobic Sewage Sludge. Energies 2022, 15, 6461. [Google Scholar] [CrossRef]
  75. Hu, Y.; Jia, G. Non-thermal effect of microwave in supercritical water: A molecular dynamics simulation study. Phys. A Stat. Mech. its Appl. 2021, 564, 125275. [Google Scholar] [CrossRef]
  76. Komarov, V.V. A review of radio frequency and microwave sustainability-oriented technologies. Sustain. Mater. Technol. 2021, 28, e00234. [Google Scholar] [CrossRef]
  77. Debowski, M.; Zielinski, M.; Kisielewska, M.; Kazimierowicz, J. Evaluation of Anaerobic Digestion of Dairy Wastewater in an Innovative Multi-Section Horizontal Flow Reactor. Energies 2020, 13, 2392. [Google Scholar] [CrossRef]
  78. Zieliński, M.; Dębowski, M.; Szwarc, D.; Szwarc, K.; Rokicka, M. Impact Of Microwave Heating On The Efficiency Of Methane Fermentation Of Algae Biomass. Abbrev. Pol. J. Natur. Sc 2017, 32, 561–571. [Google Scholar]
  79. Zielińska, M.; Cydzik-Kwiatkowska, A.; Zieliński, M.; Debowski, M. Impact of temperature, microwave radiation and organic loading rate on methanogenic community and biogas production during fermentation of dairy wastewater. Bioresour. Technol. 2013, 129, 308–314. [Google Scholar] [CrossRef]
  80. Zieliński, M.; Dębowski, M.; Krzemieniewski, M.; Brudniak, A.; Kisielewska, M. Possibility of improving technological effectiveness of dairy wastewater treatment through application of active fillings and microwave rabiation. J. Water Chem. Technol. 2016, 38, 6. [Google Scholar] [CrossRef]
  81. Nowicka, A.; Zieliński, M.; Dębowski, M.; Dudek, M.; Rusanowska, P. Progress in the production of biogas from Virginia mallow after alkaline-heat pretreatment. Biomass Bioenergy 2019, 126, 174–180. [Google Scholar] [CrossRef]
  82. Bichot, A.; Lerosty, M.; Radoiu, M.; Méchin, V.; Bernet, N.; Delgenès, J.P.; García-Bernet, D. Decoupling thermal and non-thermal effects of the microwaves for lignocellulosic biomass pretreatment. Energy Convers. Manag. 2020, 203, 112220. [Google Scholar] [CrossRef]
  83. Guo, C.; Wang, Y.; Luan, D. Non-thermal effects of microwave processing on inactivation of Clostridium Sporogenes inoculated in salmon fillets. LWT 2020, 133, 109861. [Google Scholar] [CrossRef]
  84. Kostas, E.T.; Beneroso, D.; Robinson, J.P. The application of microwave heating in bioenergy: A review on the microwave pre-treatment and upgrading technologies for biomass. Renew. Sustain. Energy Rev. 2017, 77, 12–27. [Google Scholar] [CrossRef] [Green Version]
  85. Zhang, L.; Loh, K.C.; Zhang, J. Jointly reducing antibiotic resistance genes and improving methane yield in anaerobic digestion of chicken manure by feedstock microwave pretreatment and activated carbon supplementation. Chem. Eng. J. 2019, 372, 815–824. [Google Scholar] [CrossRef]
  86. Mwene-Mbeja, T.M.; Dufour, A.; Lecka, J.; Kaur, B.S.; Vaneeckhaute, C. Enzymatic reactions in the production of biomethane from organic waste. Enzyme Microb. Technol. 2020, 132, 109410. [Google Scholar] [CrossRef] [PubMed]
  87. Czatzkowska, M.; Harnisz, M.; Korzeniewska, E.; Koniuszewska, I. Inhibitors of the methane fermentation process with particular emphasis on the microbiological aspect: A review. Energy Sci. Eng. 2020, 8, 1880–1897. [Google Scholar] [CrossRef] [Green Version]
  88. Cantero, D.; Jara, R.; Navarrete, A.; Pelaz, L.; Queiroz, J.; Rodríguez-Rojo, S.; Cocero, M.J. Pretreatment Processes of Biomass for Biorefineries: Current Status and Prospects. Annu. Rev. Chem. Biomol. Eng. 2019, 10, 289–310. [Google Scholar] [CrossRef] [PubMed] [Green Version]
  89. Pakhomov, A.G.; Akyel, Y.; Pakhomova, O.N.; Stuck, B.E.; Murphy, M.R. Current state and implications of research on biological effects of millimeter waves: A review of the literature. Bioelectromagnetics 1998, 19, 393–413. [Google Scholar] [CrossRef]
  90. Banik, S.; Bandyopadhyay, S.; Ganguly, S. Bioeffects of microwave––A brief review. Bioresour. Technol. 2003, 87, 155–159. [Google Scholar] [CrossRef]
  91. Banik, S.; Bandyopadhyay, S.; Ganguly, S.; Dan, D. Effect of microwave irradiated Methanosarcina barkeri DSM-804 on biomethanation. Bioresour. Technol. 2006, 97, 819–823. [Google Scholar] [CrossRef]
  92. Deepanraj, B.; Sivasubramanian, V.; Jayaraj, S. Effect of substrate pretreatment on biogas production through anaerobic digestion of food waste. Int. J. Hydrog. Energy 2017, 42, 26522–26528. [Google Scholar] [CrossRef]
Figure 1. Design of experimental stations: (a) microwave heating system (MW); (b) convection heating system (C) (1—magnetron; 2—wave-guide; 3—agitator drive; 4—pressure measurement and biogas collection; 5—temperature sensor; 6—steel cabinet; 7—agitator; 8—model fermentation tanks; 9—fan; 10—convector).
Applsci 13 03553 g001
Figure 2. Changes in effluent COD (a) and COD removal rate (b) across experimental variants.
Applsci 13 03553 g002
Figure 3. Changes in effluent TOC (a) and TOC removal rate (b) across experimental variants.
Applsci 13 03553 g003
Figure 4. Changes in pH values (a) and concentration of volatile fatty acids (VFA) (b) in the digesters across experimental variants.
Applsci 13 03553 g004
Figure 5. Daily (a) and specific (b) biogas output across experimental variants.
Applsci 13 03553 g005
Figure 6. CH4 percentage content (a) and specific yields (b) across experimental variants.
Applsci 13 03553 g006
Figure 7. Phylogenic dendrogram based on the DGGE profiles.
Applsci 13 03553 g007
Figure 8. Denaturing gradient gel electrophoresis (DGGE) profile amplicons for 16S rDNA analysis.
Applsci 13 03553 g008
Table 1. Characteristics of H-LPW subjected to AD.
ParameterUnitMean
Total organic carbon (TOC)g/dm35.9 ± 1.9
Chemical oxygen demand (COD)gO2/dm315.6 ± 1.6
Volatile fatty acids (VFA)g/dm30.98 ± 0.31
Total nitrogen (TN)gTN/dm30.512 ± 0.042
Ammonia nitrogen (NNH4)gN-NH4/dm30.034 ± 0.008
Total phosphorus (TP)gTP/dm30.115 ± 0.012
pH-6.83 ± 0.06
Total solids (TS)g/dm31.04 ± 0.28
Volatile solids (VS)g/dm30.88 ± 0.02
Mineral solids (MS)g/dm30.12 ± 0.015
Proteing/dm34.92 ± 0.46
Lipidsg/dm33.92 ± 0.11
Carbohydratesg/dm30.016 ± 0.007
Table 2. Characteristics of anaerobic sludge used in the experiment.
ParameterUnitValue
TS%6.2 ± 1.3
VS% TS77.1 ± 2.1
MS% TS22.9 ± 1.9
TNmg/gTS69.7 ± 7.2
TPmg/gTS10.3 ± 1.4
TCmg/gTS869 ± 92
TOCmg/gTS671 ± 41
C:N-12.4 ± 0.7
pH-7.02 ± 0.11
protein% DM42.1 ± 4.3
lipids% DM15.2 ± 1.7
saccharides% DM3.1 ± 0.4
Table 3. OLR and HRT across experimental variants.
VariantTarget OLR
(gCOD/dm3·d)
COD
in the H-LPW
(gO2/dm3)
Volume of
H-LPW
(dm3/day)
Reactor
Volume (dm3)
HRT
(day)
11.015.6 ± 1.6≈0.264.0≈15.4
22.0≈0.52≈7.7
33.0≈0.78≈5.1
44.0≈1.04≈3.8
55.0≈1.30≈3.1
66.0≈1.56≈2.6
Table 4. COD and TOC removal efficiency and levels in the effluent (by variant).
S/VChemical Oxygen Demand (COD)S/VTotal Organic Carbon (TOC)
ParameterSeriesParameterSeries
SER1—35 °CSER2—55 °CSER1—35 °CSER2—55 °C
C1g/dm30.68 ± 0.080.37 ± 0.05C1g/dm30.1 ± 0.070.06 ± 0.01
% rem.95.7 ± 0.597.7 ± 0.3% rem.92.2 ± 1.298.2 ± 0.4
MW1g/dm30.38 ± 0.10.30 ± 0.07MW1g/dm30.22 ± 0.130.05 ± 0.02
% rem.97.8 ± 0.698.1 ± 0.4% rem.95.3 ± 4.198.1 ± 0.3
C2g/dm31.21 ± 0.090.66 ± 0.05C2g/dm30.3 ± 0.160.2 ± 0.06
% rem.92.4 ± 0.595.9 ± 0.3% rem.89.5 ± 2.793.2 ± 1
MW2g/dm30.8 ± 0.060.62 ± 0.03MW2g/dm30.25 ± 0.150.17 ± 0.04
% rem.95 ± 0.496.1 ± 0.2% rem.91.3 ± 1.194.4 ± 1.8
C3g/dm32.18 ± 1.061.44 ± 0.35C3g/dm30.5 ± 0.120.25 ± 0.03
% rem.87.3 ± 1.891 ± 2.2% rem.82.9 ± 4.191.5 ± 1.3
MW3g/dm31.99 ± 1.011.26 ± 0.27MW3g/dm30.45 ± 0.190.27 ± 0.05
% rem.88.1 ± 1.992.1 ± 1.7% rem.84.6 ± 3.590.8 ± 0.8
C4g/dm33.19 ± 2.192.02 ± 0.24C4g/dm30.68 ± 0.280.47 ± 0.03
% rem.81.1 ± 5.886.7 ± 1.1% rem.76.4 ± 3.683.7 ± 1.8
MW4g/dm32.82 ± 1.682.04 ± 0.29MW4g/dm30.64 ± 0.220.46 ± 0.06
% rem.87.6 ± 4.487.2 ± 1.8% rem.77.3 ± 5.184.2 ± 0.9
C5g/dm311.19 ± 0.759.63 ± 0.65C5g/dm32.43 ± 0.262.15 ± 0.01
% rem.32.1 ± 4.139.8 ± 4.1% rem.16 ± 1026.2 ± 10
MW5g/dm311 ± 1.499.35 ± 0.72MW5g/dm32.16 ± 0.271.98 ± 0.26
% rem.30.8 ± 6.741.6 ± 4.5% rem.27.3 ± 6.631.4 ± 4.4
C6g/dm314.22 ± 1.6612.98 ± 1.85C6g/dm32.59 ± 0.192.6 ± 0.25
% rem.10.6 ± 5.319.2 ± 5.8% rem.10.4 ± 4.710.7 ± 3.1
MW6g/dm314.01 ± 2.6612.35 ± 0.98MW6g/dm32.56 ± 0.122.49 ± 0.06
% rem.12.7 ± 3.522.8 ± 6.1% rem.11.8 ± 5.313.8 ± 6.5
Table 5. TN and TP removal efficiency and levels in the effluent (by variant).
S/VTotal Nitrogen (TN)S/VTotal Phosphorus (TP)
ParameterSeriesParameterSeries
SER1—35 °CSER2—55 °CSER1—35 °CSER2—55 °C
C1g/dm30.283 ± 0.0330.291 ± 0.029C1g/dm30.080 ± 0.0100.074 ± 0.005
% rem.44.7 ± 6.447.5 ± 5.7% rem.30.2 ± 8.335.8 ± 4.3
MW1g/dm30.263 ± 0.0290.273 ± 0.027MW1g/dm30.068 ± 0.0060.067 ± 0.007
% rem.48.5 ± 3.749.2 ± 5.2% rem.40.5 ± 4.041.6 ± 4.1
C2g/dm30.351 ± 0.0260.343 ± 0.016C2g/dm30.082 ± 0.0040.075 ± 0.005
% rem.31.5 ± 5.034.3 ± 3.2% rem.28.3 ± 3.634.5 ± 4.1
MW2g/dm30.349 ± 0.0240.322 ± 0.049MW2g/dm30.074 ± 0.0030.069 ± 0.003
% rem.31.7 ± 4.739.6 ± 9.5% rem.35.1 ± 3.239.7 ± 2.4
C3g/dm30.364 ± 0.0260.365 ± 0.017C3g/dm30.093 ± 0.0070.088 ± 0.004
% rem.28.8 ± 5.128.7 ± 3.3% rem.18.9 ± 4.022.9 ± 4.9
MW3g/dm30.347 ± 0.0330.339 ± 0.032MW3g/dm30.089 ± 0.0060.090 ± 0.003
% rem.32.2 ± 6.432.1 ± 6.3% rem.22.4 ± 3.321.7 ± 5.3
C4g/dm30.404 ± 0.0320.401 ± 0.030C4g/dm30.089 ± 0.0070.091 ± 0.004
% rem.21.1 ± 6.321.5 ± 4.2% rem.22.1 ± 3.420.3 ± 5.4
MW4g/dm30.389 ± 0.0220.386 ± 0.034MW4g/dm30.090 ± 0.0060.091 ± 0.005
% rem.24.0 ± 6.724.6 ± 5.9% rem.21.7 ± 4.720.7 ± 3.6
C5g/dm30.443 ± 0.0300.444 ± 0.042C5g/dm30.096 ± 0.0050.079 ± 0.004
% rem.13.5 ± 8.213.3 ± 9.1% rem.16.4 ± 5.631.3 ± 3.8
MW5g/dm30.426 ± 0.0470.419 ± 0.013MW5g/dm30.097 ± 0.0080.096 ± 0.003
% rem.15.9 ± 2.416.9 ± 4.5% rem.15.4 ± 4.016.0 ± 3.3
C6g/dm30.445 ± 0.0230.470 ± 0.032C6g/dm30.102 ± 0.0040.103 ± 0.004
% rem.11.3 ± 6.38.1 ± 5.4% rem.10.9 ± 5.210.5 ± 5.6
MW6g/dm30.436 ± 0.0210.437 ± 0.018MW6g/dm30.101 ± 0.0070.100 ± 0.005
% rem.14.7 ± 6.114.3 ± 5.6% rem.11.4 ± 5.812.6 ± 4.1
Table 6. Effects of using MW to heat bioreactors for methane fermentation.
SubstrateOptimal ConditionsEffectsRef.
Pretreatment ConditionsBatch Test Conditions
Expired food products: bread (12%), meat waste (35%), fish (9%), vegetables (10%), fruit (16%), and dairy products (18%)300 W, 2.45 GHz35 ± 1 °C, Time = 80 d, HRT = 40 d, OLR = 2.0 kgVS/dm3·dIncrease of 4.57% in biogas production *[21]
Dairy wastewater1600 W, 2.45 GHz35 °C, HRT = 24 h, OLR = 1.0 kgCOD/m3·dIncrease of 4.65% in biogas production *[79]
Dairy wastewater800 W, 2.45 GHz35 °C, HRT = 120 h Increase of 14.0 to 24.0% in biogas production *[80]
Dairy wastewater90 W, 20 kHz38 ± 1 °C, Time = 30 d, HRT = 24 h, OLR = 2.0 kgCOD/dm3·dIncrease of 7.5% in biogas production *[77]
Alga biomass600 W, 2.45 GHz35 ± 1 °C, HRT = 20 d, OLR = 2.0 kgVS/dm3·dIncrease of 2.88% in biogas production *[78]
Sida hermaphrodita silage1600 W, 2.45 GHzHRT = 33.3 d, Time = 45 dIncrease of 8% in biogas production *[69]
Virginia mallow1600 W, 2.45 GHz36 °C, HRT = 40 d, OLR = 5.0 g VS/dm3Increase of 8% in biogas production *[81]
Virginia mallow600 W, 2.45 GHz36 °C, HRT = 40 d, OLR = 5.0 g VS/dm3Increase of 18% in CH4 production *[17]
* Compared to control.
Disclaimer/Publisher’s Note: The statements, opinions and data contained in all publications are solely those of the individual author(s) and contributor(s) and not of MDPI and/or the editor(s). MDPI and/or the editor(s) disclaim responsibility for any injury to people or property resulting from any ideas, methods, instructions or products referred to in the content.

